Embed Size (px)
Citation preview
Regional Trends Report on Energy for Sustainable Development in Asia and the Pacific 2015
Cover photos credits:
Wind Farmby Jlao
Coal-fired electric plant, Henan Province, China by V.T. Polywoda https://flic.kr/p/pkGzar
Shanghai Hongqiao Solar Roof Installation © Jiri Rezac 2010https://flic.kr/p/h7DAeh
sunsetby Закатhttps://flic.kr/p/oMCCjd
Regional Trends Report on Energy for Sustainable
Development in Asia and the Pacific
2015 edition
i
United Nations Economic and Social Commission for Asia and the Pacific (ESCAP) is the
regional development arm of the United Nations and serves as the main economic and
social development centre for the United Nations in Asia and the Pacific. Its mandate is to
foster cooperation between its 53 members and nine associate members. ESCAP provides
the strategic link between global and country-level programmes and issues. It supports
governments of the region in consolidating regional positions and advocates regional
approaches to meeting the region’s unique socioeconomic challenges in a globalizing
world.
The ESCAP office is located in Bangkok, Thailand. Please visit our website at
http://www.unescap.org for further information.
The shaded areas of the map indicate ESCAP members and associate members.
The designations employed and the presentation of the material in this publication do not
imply the expression of any opinion on the part of the United Nations concerning the legal
status of any country, territory, city or area, or of its authorities, or concerning the
delimitation of its frontier or boundaries.
ii
Regional Trends Report on Energy for Sustainable Development in Asia
and the Pacific 2015
United Nations publication Copyright © United Nations 2015 All rights reserved Printed in Bangkok ST/ESCAP/2723
This publication has been published without formal editing.
This publication may be reproduced, in whole or in part, for educational or non-profit
purposes without special permission from the copyright holder, provided that the source is
acknowledged. The ESCAP Publications Office would appreciate receiving a copy of any
publication that uses this publication as a source.
No use may be made of this publication for resale or any other commercial purpose
whatsoever without prior permission. Applications for such permission, with a statement of
the purpose and extent of reproduction, should be addressed to the Secretary of the
Publications Board, United Nations, New York.
iii
Preface
Energy is a global priority — both as a foundation for sustainable development and a
fundamental requirement of the post-2015 development agenda. The Plan of Action on
Regional Cooperation for Enhanced Energy Security and the Sustainable Use of Energy in
Asia and the Pacific 2014-2018, adopted by Ministers at the first Asian and Pacific Energy
Forum (APEF) in 2013, underscores the importance of energy security at all levels, from
regional to household.
The Regional Trends Report on Energy for Sustainable Development in Asia and the Pacific
provides perspectives on a range of issues to advance implementation of the APEF
Ministerial Declaration and the Plan of Action. It identifies key challenges and presents
selected case studies, offering these as a basis for further regional energy cooperation
initiatives.
In the context of sustainable development, calls have been made to ensure both wider
accessibility to cost-efficient energy for all, and its diversification, with support for newer
technological solutions to promote cleaner and carbon-neutral alternatives. Our report
focuses on offering perspectives in these critical areas, with two main topics selected, in
consultation with member States at the annual policy dialogues: (a) integration of
renewable energy in the power system; and (b) high-efficiency, low-emission coal
technologies. Renewable energy sources are abundant, but need to be harnessed and
resolved through effective resolution of the technical challenges to fully unlocking this
potential. Despite the drop in the cost of these technologies, renewable energy remains an
only intermittent source, which makes it difficult to integrate into grid system. Some
countries have addressed this intermittency by integrating large renewable energy sources
into the power system at both the policy and technical levels. There is great potential for
further integration of renewable energy into power grids for regional connectivity, in
support of accelerated regional economic integration.
Given the abundance of coal in the region, and recent increases in the use of these
iv
resources, it is likely to remain a major source of energy for the foreseeable future.
However, its negative environmental impact is of major concern. There are technologies to
abate these impacts, but the promotion of such technologies has been hindered by high
up-front capital investment requirements. ESCAP’s research has compared the cost of
different coal-fired power plants and it is apparent that ultra-super critical coal
technologies are more cost-efficient in the long-run.
There is a need to improve the quality of regional growth to provide the foundations for
improved social welfare and environmental protection – this is the essence of the post-
2015 development agenda. A long-term perspective on establishing energy sector
sustainability is a key requirement, and the work that has been done on these two topics
provides support to this endeavour.
The Report has been developed on the basis of the outcomes of the Policy Dialogue on
Energy for Sustainable Development for Asia and the Pacific held in November 2015. Case
studies presented at the Dialogue are contained in the publication. Future editions will
contain additional case studies relevant to energy policymakers across the region.
I would like to take this opportunity to express our appreciation to those who have
contributed to the publication, in particular, the Government of the Russian Federation,
for supporting implementation of Commission resolution 70/9, Implementation of the
outcomes of the first Asian and the Pacific Energy Forum. This is one of the three pillars of
the APEF Implementation Support Mechanism, assisting our member States to implement
the Declaration and Plan of Action This work also makes an important contribution to
advancing the Decade of Sustainable Energy for All 2014–2024.
Shamshad Akhtar Under-Secretary-General of the United Nations and
Executive Secretary of ESCAP
v
Acknowledgements
The Regional Trends Report on Energy for Sustainable Development in Asia and the Pacific
(2014 Edition) is based, in part, on the outcomes of the 2014 Policy Dialogue on Energy for
Sustainable Development in Asia and the Pacific held last 26 to 28 November 2014 in Bangkok,
Thailand.
Participants of the 2014 Policy Dialogue include Tigran Melkonyan (Armenia), Selim Uddin
(Bangladesh), Karma Penjor Dorji (Bhutan), Jona Victor (Cambodia), Zhongying Wang (China),
Brajesh Kumar Srivastava (India), Masoud Gharanfoli (Islamic Republic of Iran), Ali Gholampour
(Islamic Republic of Iran), Rystay Tuleubayeva (Kazakhstan), Khamso Kouphokham (Lao
People’s Democratic Republic), Hussain Asif (Maldives), Bayarbat Sangajav (Mongolia), Sameer
Ratna Shakya (Nepal), Alexander Smirnov (Russian Federation), Evgeniy Nadezhdin (Russian
Federation), Vladimir Krasnogorsky (Russian Federation), Taras Pronin (Russian Federation),
Konstantin Kozlov (Russian Federation), Ilya Andreev (Russian Federation), Tile Leia
Tuimalealiifano (Samoa), Mohamed Rafeek Mohamed Ismail (Sri Lanka), Chidchanok
Choompalee (Thailand), Tatafu Moeaki (Tonga), Nadira Berdimuratova (Uzbekistan),
Christopher Simelum (Vanuatu), Kevin Lai (Vanuatu), Keiji Makino (Japan Coal Energy Center),
German Genadievich Trofimov (Almaty University of Power and Telecommunications), Mikhail
Saparov (G.M. Krzhizhanovsky Energy Institute), Viktor Badaker (United Nations Economic
Commission for Europe), Danilo Padilla (UNESCO), Beni Suryadi (ASEAN Centre for Energy),
Benjamin Heinrich Anton Mohr (Regional Environment Centre for Central Asia), Steivan Defilla
(Energy Charter Secretariat), Kingsley Leung (Energy Charter Secretariat), Solomone Fifita
(Secretariat of the Pacific Community), Shahzada Khalid Akhlaq Anjum (SAARC Energy Centre),
Amit Kumar (The Energy Resources Institute), Thierry Lefevre (Centre for Energy Environment
Resources Development), Francois Lefevre (Centre for Energy Environment Resources
Development), Antonio Della Pelle (Enerdata), Qi Guo (Inner Mongolia Power Co., Ltd), Sally
Bolton (Kopernik), Paul Janecek (ESCAP).
The following UNESCAP experts and consultants provided inputs and review for this report:
Joao Aleliu, Sungmin Patricia Kim, Sean Ratka, Kimberly Roseberry, Jun Tian. The following
interns also provided inputs for this report: Ji Hoon Her, Matthew Imhoff, Fei Li, Jungmin Oh.
vi
Abbreviations
ADB Asian Development Bank
ASEAN Association of Southeast Asian Nations
BNEF Bloomberg New Energy Finance
BoS Balance of systems
CCS Carbon capture and storage
CEER Council of European Energy Regulators
CFPP Coal-fired power plant
CHP Combined heating and power
CPS Current Policies Scenario
CSP Concentrated solar power
EIA Energy Information Administration, US Department of Energy
FBC Fluidized bed combustion
GHG Greenhouse gas
GW Gigawatt
GWh Gigawatt hours
HELE High-efficiency, low-emissions
IEA International Energy Agency
IGCC Integrated gasification combined cycle
KW Kilowatt
vii
KWh Kilowatt hours
LCOE Levelized cost of electricity
LHV Lower heating value
MDGs Millennium Development Goals
MPa Megapascal
MT Metric tonnes
Mtoe Million tonnes of oil equivalent
MW Megawatt
MWh Megawatt hours
NOx Nitrogen oxides
NPS New Policies Scenario
NREL National Renewable Energy Laboratory
OECD Organization for Economic Cooperation and Development
O&M Operations and maintenance
PC Pulverized combustion
PM Particulate matter
RE Renewable energy
SAARC South Asian Association for Regional Cooperation
SE4All Sustainable Energy for All
Solar PV Solar photovoltaic
viii
SOx Sulfur oxides
SDGs Sustainable Development Goals
tCO2e Tons of carbon dioxide equivalent
toe Tons of oil equivalent
TSO Transmission system operator
TWh Terawatt hour
UN The United Nations
UNDP United Nations Development Programme
VRE Variable renewable energy
ix
Table of Contents
Preface ............................................................................................................... iii
Acknowledgements.............................................................................................. v
Abbreviations ..................................................................................................... vi
Boxes ................................................................................................................. xii
Figures .............................................................................................................. xiii
Tables ................................................................................................................ xv
Annex ............................................................................................................... xvi
Chapter 1: Introduction ........................................................................................ 1
Chapter 2: Asia-Pacific Energy Scene .................................................................. 10
2.1 Key Messages .................................................................................................... 10
2.2 Socioeconomic Background and Energy Development Trends ............................. 12
2.2.1 Regional economy has grown fast but remains low compared with the world
average ......................................................................................................................... 14
2.2.2 Poverty persists despite considerable progress in poverty alleviation ............... 14
2.2.3 Universal energy access is fundamental for development ................................. 15
2.2.4 TPES echoes economic growth initially but decouples from human development
as development advances ............................................................................................ 18
2.2.5 Primary energy intensity improves while GDP grows ......................................... 21
2.2.6 The Asia-Pacific region increasingly relies on coal for energy supply ................. 24
2.2.7 Regional energy consumption grows but per capita level is low ........................ 26
2.2.8 Final energy consumption of VRE is increasing ................................................... 27
2.2.9 Sustainable energy requires further investment and expanded commitment ... 28
2.3 Environmental consequences resulted from fuel combustion.............................. 30
2.3.1 CO2 emissions from fuel combustion increases while carbon intensity declining
...................................................................................................................................... 31
2.3.2 Air pollution becomes a serious threat ............................................................... 33
x
2.4 Energy use in the power sector .......................................................................... 35
2.4.1 Electricity production accounts for 14.5 per cent of total energy production in
2012 .............................................................................................................................. 36
2.4.2 Coal dominates electricity production and VRE becomes increasingly important
...................................................................................................................................... 38
2.4.3 Electricity contributes increasingly to GDP growth ............................................. 41
2.5 Enhance energy security for sustainable development ........................................ 44
2.5.1 Fossil fuel reserves are limited and unevenly distributed ................................... 44
2.5.2 Energy self-sufficiency varies............................................................................... 47
2.5.3 Impact of fluctuating oil prices differentiated .................................................... 49
Chapter 3: Integration of Renewable Energy in Electricity Systems ..................... 50
3.1 Key Messages .................................................................................................... 50
3.2 Introduction ...................................................................................................... 53
3.2.1 Renewable energy ............................................................................................... 53
3.2.2 Variable renewable energy.................................................................................. 54
3.2.3 Outlook ................................................................................................................ 56
3.3 Why Variable Renewable Energy ........................................................................ 58
3.3.1 Economics — VRE has become cheaper .............................................................. 58
3.3.2 Externalities — Avoided health and environmental costs contribute to VRE
attractiveness ............................................................................................................... 58
3.3.3 Technical aspects - Innovations continue to accelerate VRE implementation ... 59
3.4 Economics ......................................................................................................... 61
3.4.1 LCOE calculations - A measure to compare costs between power generation
technologies ................................................................................................................. 61
3.5 Externalities ...................................................................................................... 64
3.6 Technical Aspects That Have Led to Increased Integration of Variable Renewable
Energy .................................................................................................................... 66
3.6.1 Larger balancing areas ......................................................................................... 66
3.6.2 Forecasting .......................................................................................................... 67
3.6.3 Falling price trends .............................................................................................. 70
xi
3.6.4 Distributed solar PV ............................................................................................. 72
3.7 Summary ........................................................................................................... 76
3.7.1 Lowering barriers to VRE integration .................................................................. 76
Chapter 4: Promotion of High-Efficiency, Low-Emissions Coal Technologies in
Electricity Generation ........................................................................................ 82
4.1 Key Messages .................................................................................................... 82
4.2 Introduction ...................................................................................................... 85
4.2.1 Coal-fired power generation ............................................................................... 85
4.2.2 High-efficiency, low-emissions coal-fired power generation .............................. 87
4.2.3 Global coal-fired power projections .................................................................... 89
4.3 Why High-Efficiency, Low-Emissions Coal ........................................................... 91
4.3.1 Economic considerations ..................................................................................... 91
4.3.2 Externalities associated with the use of coal for power generation ................... 92
4.3.3 Technical aspects of coal-fired power generation .............................................. 94
4.4 Economic Considerations ................................................................................... 97
4.5 Externalities Associated With the Use of Coal for Power Generation ................. 100
4.6 Technical Aspects of Coal-Fired Power Generation............................................ 104
4.6.1 CCS ..................................................................................................................... 106
4.7 Summary ......................................................................................................... 108
Chapter 5: Scope for Regional Cooperation ...................................................... 111
References ....................................................................................................... 117
Annex .............................................................................................................. 126
xii
Boxes
Box 3.1 Examples from the region: China, India .................................................................. 63
Box 3.2 Global example: Regional grid integration, Denmark ensures grid stability while
increasing VRE .............................................................................................................. 67
Box 3.3 Global example: Demand-side management, Texas increases VRE shares within an
isolated grid .................................................................................................................. 69
Box 3.4 Examples from the region: The Pacific .................................................................... 72
Box 3.5 Examples from the region: Tonga............................................................................ 74
Box 3.6 Examples from the region: China ............................................................................ 77
Box 3.7 Examples from the region: Inner Mongolia, China .................................................. 80
Box 4.1 Examples from the region: Russian Federation ....................................................... 96
Box 4.2 Examples from the region: China .......................................................................... 101
Box 4.3 Examples from the region: Japan .......................................................................... 102
Box 4.4 Policy examples from the region: China ................................................................ 109
Box 4.5 Policy examples from the region: India ................................................................. 110
xiii
Figures
Figure 2.1 People without access to electricity in Asia-Pacific countries, 2012 ................... 16
Figure 2.2 Population using solid fuels and gender inequality index for Asia-Pacific
countries ....................................................................................................................... 18
Figure 2.3 TPES per capita by ESCAP Subregion, 1990–2012 ............................................... 20
Figure 2.4 TPES per capita and HDI for Asia-Pacific countries, 2012 ................................... 21
Figure 2.5 Change of primary energy intensity and change of GDP per capita for Asia-
Pacific countries, 1990–2012........................................................................................ 23
Figure 2.6 Energy mix for TPES by ESCAP subregion, 1990 and 2012 .................................. 26
Figure 2.7 Solar/wind/other final consumption in ESCAP subregions, 1990–2012 ............. 28
Figure 2.8 Energy mix for CO2 emissions from fuel combustion, 1990 and 2012 ................ 32
Figure 2.9 PM10 levels in selected Asian Pacific cities .......................................................... 35
Figure 2.10 Share of electricity production in total energy production for Asia and the
Pacific ............................................................................................................................ 37
Figure 2.11 Per capita electricity production ...................................................................... 38
Figure 2.12 Energy mix for electricity production by subregion .......................................... 39
Figure 2.13 Change of GDP per capita and electricity production, 1990–2012 ................... 42
Figure 2.14 Electricity intensity by subregion, 1990–2012 .................................................. 43
Figure 2.15 Energy self-sufficiency for Asia-Pacific countries, 2012 .................................... 48
Figure 3.1 Electricity production, by resource in Asia and the Pacific in 1990, 2012 (TWh) 54
Figure 3.2 Global regional VRE electricity generation, 1990–2012 (GWh) .......................... 55
Figure 3.3 Future outlook of renewable energy and VRE in Asia-Pacific as a percentage of
xiv
electricity generation ................................................................................................... 57
Figure 3.4 Weighted average cost of electricity by region for utility-scale renewable
technologies, compared with fossil fuel power generation costs, 2013/2014 ............ 62
Figure 3.5 The LCOE of variable renewables and fossil fuels, including grid integration costs
(at 40 per cent variable renewable penetration) and external health and CO2 costs . 65
Figure 3.6 Solar PV and oil trends ........................................................................................ 71
Figure 4.1 Electricity production, by resource in Asia and the Pacific in 1990, 2012 (TWh) 86
Figure 4.2 The share of supercritical and USC capacity in selected member States ............ 88
Figure 4.3 Global electricity mix 2011, 2035 (New Policies Scenario) ................................. 89
Figure 4.4 LCOE of select power generation technologies, 2013 ......................................... 92
Figure 4.5 CO2 intensity factor and coal consumption by plant efficiency (lower heating
value [LHV] per cent) .................................................................................................... 93
Figure 4.6 CFPP LCOE by plant efficiency ............................................................................. 98
Figure 4.7 World primary energy supply and CO2 emissions: shares by fuel in 2011 ........ 100
Figure 4.8 Example of pathways for cleaner coal-fired power generation ........................ 106
Figure 4.9 Reducing CO2 emissions from PC coal-fired generation .................................... 107

xv
Tables
Table 2.1 Fossil fuel reserves for selected countries ............................................................ 45
Table 4.1 Steam conditions on subcritical, supercritical and USC boilers ............................ 87
Table 4.2 Combustion technologies and performance levels for new plants ...................... 94
Table 4.3 Total plant cost and LCOE by coal-fired generation type, with and without CCS 97
xvi
Annex
Annex Figure 1 Typical ranges and weighted averages for the total installed costs of
utility-scale renewable power ........................................................................ 126
Annex Table 1 Asia-Pacific electricity production from coal and total combined
fossil fuels in 2012 (GWh and per cent) ................................................................. 127
1
Chapter 1: Introduction
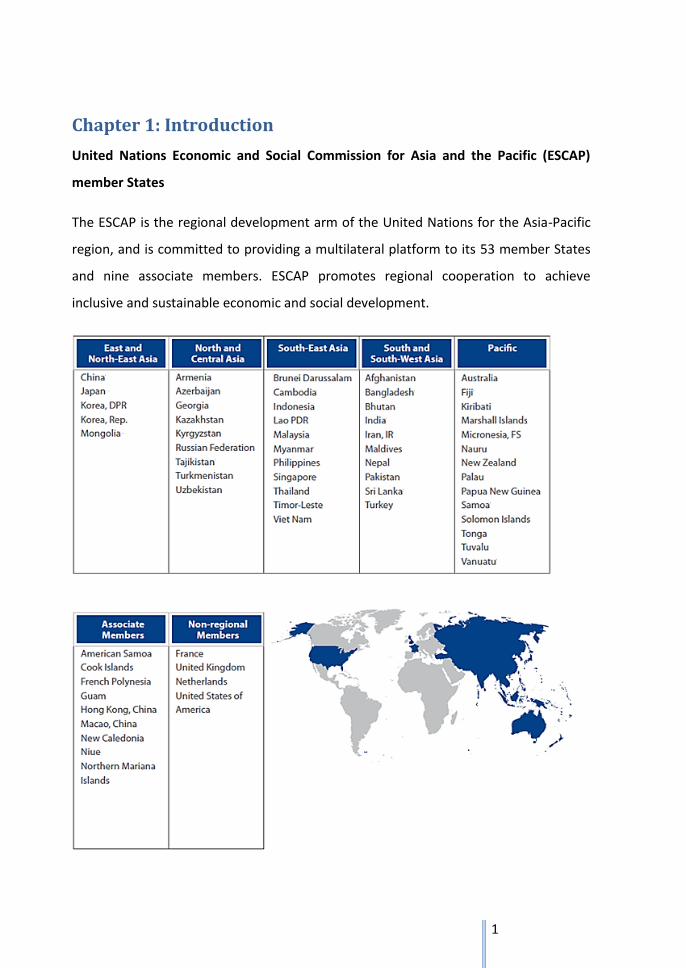
United Nations Economic and Social Commission for Asia and the Pacific (ESCAP)
member States
The ESCAP is the regional development arm of the United Nations for the Asia-Pacific
region, and is committed to providing a multilateral platform to its 53 member States
and nine associate members. ESCAP promotes regional cooperation to achieve
inclusive and sustainable economic and social development.
2
Asian and Pacific Energy Forum (APEF) 2013: The First APEF
In 2011, member States and associate members of ESCAP adopted Resolution 67/2
calling on the secretariat to organize the APEF in 2013. APEF is the first ministerial
conference convened by the United Nations that focuses on energy. Its purpose is to
promote regional cooperation for enhanced energy security and the sustainable use of
energy.
To fully capture perspectives within the vast and diverse Asia-Pacific region, and to
support consensus-building towards a regional framework for energy cooperation, a
step-by-step preparatory process took place in the months leading up to APEF 2013.
APEF 2013 took place in May 2013 in Vladivostok with the support of the host
government of the Russian Federation. Following the Senior Officials Segment and the
Business Forum, 34 delegations adopted the Ministerial Declaration and Plan of Action.
In 2014, the ESCAP Commission adopted Resolution 70/9, endorsing the outcomes of
APEF 2013, including the establishment of a review and assessment mechanism, and
setting in motion preparations for the second APEF in 2018 to be hosted by the
Kingdom of Tonga.
Ministerial Declaration and Plan of Action: Regional Framework for Energy
Cooperation
At the Forum, member States renewed their commitment to developing energy
policies within the context of sustainable development and, therefore, to formulating
cross-sectoral energy guidelines for ecological and inclusive growth.
The APEF adopted the Ministerial Declaration and the Plan of Action, which are aligned
to the goals of the Sustainable Energy for All (SE4ALL) initiative. The vision of the Plan
of Action is to ensure: (a) sustainable energy for all is a reality; (b) enhanced energy
security is present from regional to household levels; (c) an energy future of equity,
3
diversification and access to all is secured; and (d) the share of cleaner energies in the
overall energy mix is increased.
The plan of action identified the following 15 areas for action as well as areas of action
for subregions:
Establishment of a platform for facilitating continuous dialogue and
cooperation among ESCAP member States on enhanced energy security and
the sustainable use of energy
Work towards universal access to modern energy services
Advance the development and use of new and renewable sources of energy
Improve energy efficiency and conservation and observe sustainability in the
supply, distribution and consumption of energy
Diversify the energy mix and enhance energy security
Improve energy trade and investment opportunities to optimize the
development and utilization of current and emerging energy resources
Improve fiscal policy and financing mechanisms to incentivize and strengthen
markets for sustainable energy
Improve energy statistics and facilitate data and information sharing
Minimize the environmental impact of the energy sector
Promote more efficient and cleaner use of oil
Promote the efficient and clean use of coal
Promote expanded production, trade and use of natural gas as a low-emission
fuel
Promote the development of advanced energy technologies
Develop common infrastructure and harmonized energy policies with a view to
increasing regional economic integration
Promote capacity-building, education and knowledge-sharing in the field of
energy
4
APEF Implementation Support Mechanism: Onwards to APEF 2018
The outcome documents of APEF established the 2014-2018 regional agenda targeting
enhanced energy security and the sustainable use of energy. The ESCAP secretariat is
mandated by the aforementioned Commission Resolution 70/9, to support the
implementation of the Plan of Action, to periodically review the progress leading up to
the next APEF in 2018 and to collaborate regional cooperation. An APEF
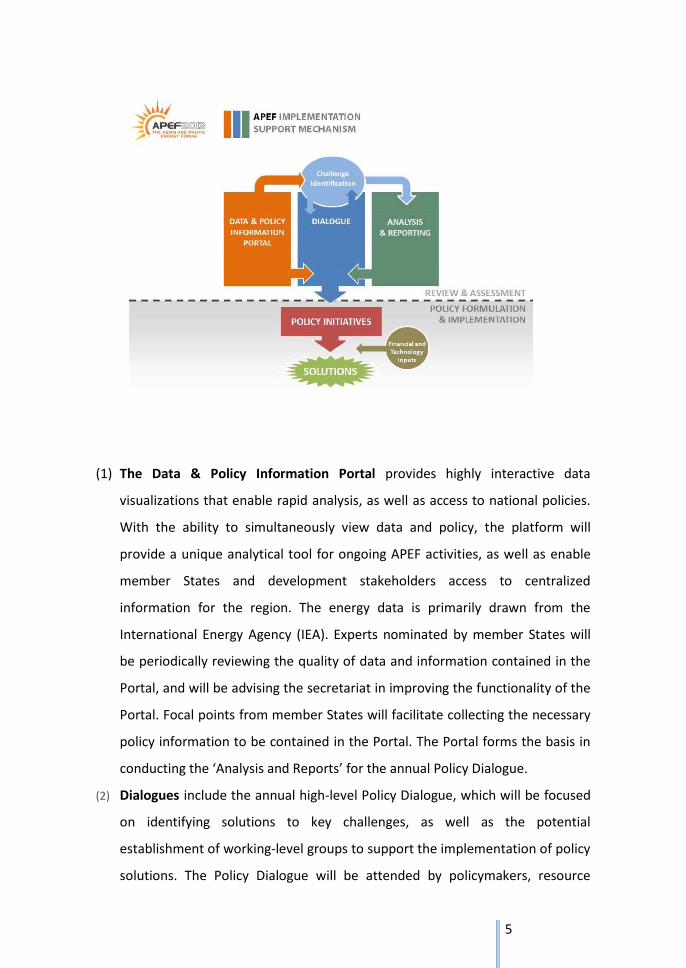
Implementation Support Mechanism is developed to meet this mandate. The
Mechanism is solution-driven, with expected outputs in the form of multilateral policy
initiatives and solutions that consist of three pillars: Data & Policy Information Portal,
Policy Dialogue, and Analysis & Reporting.
5
(1) The Data & Policy Information Portal provides highly interactive data
visualizations that enable rapid analysis, as well as access to national policies.
With the ability to simultaneously view data and policy, the platform will
provide a unique analytical tool for ongoing APEF activities, as well as enable
member States and development stakeholders access to centralized
information for the region. The energy data is primarily drawn from the
International Energy Agency (IEA). Experts nominated by member States will
be periodically reviewing the quality of data and information contained in the
Portal, and will be advising the secretariat in improving the functionality of the
Portal. Focal points from member States will facilitate collecting the necessary
policy information to be contained in the Portal. The Portal forms the basis in
conducting the ‘Analysis and Reports’ for the annual Policy Dialogue.
(2) Dialogues include the annual high-level Policy Dialogue, which will be focused
on identifying solutions to key challenges, as well as the potential
establishment of working-level groups to support the implementation of policy
solutions. The Policy Dialogue will be attended by policymakers, resource
6
persons and relevant stakeholders, including research institutions, private
sector and civil society organizations. The dialogue will be structured around
the draft regional trends report (annual) containing trends and analysis of a
few selected topics by the member States. The Portal and the regional trends
report will facilitate the deliberation during the Policy Dialogue to identify a
few concrete areas and solutions to address common challenges through
regional cooperation.
(3) Analysis & Reports, entitled ‘Regional Trends Report on Energy for Sustainable
Development in Asia and the Pacific’ will feed into the annual Policy Dialogue
and serve as the channel through which ESCAP provides analysis around key
challenges identified by member States. National focal points will identify
appropriate topics to be contained in the Regional Trends Report and enrich
the publication by contributing case studies. By providing analysis on key
energy issues, the APEF publications will support the identification of potential
policy solutions.
Regional-Global Linkages: Millennium Development Goals, Post-2015 Sustainable
Development Goals, and Sustainable Energy for All
Sustainable energy for all is the answer to some of the key challenges of our time —
poverty, inequality, economic growth and environmental risks.
Ban Ki-moon, Secretary-General of the United Nations
Ensuring sustainable energy for all is additionally challenging in Asia and the Pacific.
Despite economic success, the Asia-Pacific is home to the majority of the world’s
energy poor, with 621.5 million without access to electricity (ESCAP, 2014). Together
with the Asian Development Bank (ADB), the United Nations Development Programme
(UNDP), ESCAP leads the Asia-Pacific hub of the global network to facilitate and
coordinate the implementation of the Sustainable Energy for All (SE4ALL) Initiative at
the regional level. The hub supports countries in conducting rapid assessments,
7
building constructive dialogue on policy, and catalyzing investments and mobilizing
bilateral and global funds for clean energy development. ESCAP aims at energy security
and sustainable energy development by fostering subregional and regional
cooperation in energy access, energy efficiency and renewable energy development.
ESCAP initiated a regional framework of Asian Energy Highway, as well as the Pacific
Regional Data Repository for SE4All, and developed the Pro-Poor Public-Private
Partnerships model for widening access to energy services. In addition, APEF facilitates
regional promotion of sustainable energy policies, projects and good practices
developed at the subregional and country levels, and supports the recognition of
SE4ALL-related national actions by the governments in the region.
Report Structure and Aims
For the 2014 Policy Dialogue, two topics have been selected based on the discussion at
the 2013 Policy Dialogue (Bangkok, 2013) for the Regional Trends Report on Energy for
Sustainable Development in Asia and the Pacific: (a) integration of variable renewable
energy (VRE) into electricity systems; and (b) promotion of high-efficiency, low-
emissions (HELE) coal technologies in power generation. These two topics are relevant
to the following areas for action contained in the APEF Plan of Action adopted by the
Commission in its 70th session:
(a) Action Area C: Advance the development and use of new and renewable
sources of energy
(b) Action Area D: Improve energy efficiency and conservation and observe
sustainability in the supply, distribution and consumption of energy
(c) Action Area E. Diversify the energy mix and enhance energy security
(d) Action Area I: Minimize the environmental impact of the energy sector
(e) Action Area K: Promote the efficient and clean use of coal
8
This report compiles the latest information from authoritative sources, including case
studies submitted by member States, the APEF Data and Policy Information Portal, IEA,
International Renewable Energy Agency (IRENA), ADB, World Bank, United Nations and
BP, with the focus on the Asia and the Pacific region. Through discussions on regional
energy trends, it is expected that the main findings, conclusions and recommendations
of this report will contribute to strengthening regional cooperation in the Asia and the
Pacific region and among the APEF community.
There will be five chapters in this report. In Chapter 2, the report attempts to capture
the energy production and consumption trends in the Asia-Pacific region. It links to
energy production and consumption to socioeconomic as well as environmental
dimensions of development, to better appreciate the importance of energy as a critical
input towards development in the region. In particular, it captures the increasing role
of coal as well as renewable energy.
Chapter 3 identifies challenges and solutions in integrating renewable energy into
electricity system with a focus on VRE (primarily solar and wind). With the rapid
decline in the cost of renewable energy technologies, opportunities for integrating
large-scale renewable energy projects have emerged as alternative options to
conventional sources of energy in producing electricity. The chapter attempts to
address some of the technical issues in coping with intermittency through case studies.
Recognizing that coal will remain as a major source of energy supply, in Chapter 4, it
promotes HELE technologies for coal-fired power plants (CFPPs). Despite the upfront
high capital cost required for such technologies, it analyzes the investment
requirements from the levelized cost of electricity (LCOE), an approach also taken in
Chapter 3 to demonstrate the cost-effectiveness of VRE technologies.
Chapter 5 is based on the outcomes of the discussions that took place during the Policy
Dialogue held in November 2014 in Bangkok, which deliberated on the two topics
9
covered under Chapters 3 and 4. It is an attempt to form the basis in developing
regional cooperation projects to advance the agenda towards the implementation of
the APEF Plan of Action.
The Portal, as well as this report, draws energy statistics primarily from the IEA
database. As energy data and statistics from the Pacific subregion contained in the IEA
database is limited to those from Australia and New Zealand, most of the Pacific
Islands States are not covered.
10
Chapter 2: Asia-Pacific Energy Scene
2.1 Key Messages
1. Despite the remarkable economic growth in the recent decades and meeting
the MDG target of halving the proportion of extreme poor between 1990 and
2015, the Asia and the Pacific region is still home to more than half of the
world’s 1.2 billion extreme poor who live on less than $1.251 a day.
2. Universal energy access remains challenging as 621.5 million people live
without electricity connection and 1.8 billion people rely on traditional fuels
for cooking and heating, which raised significant environmental concerns,
health problems and gender inequality.
3. Due to geographical, demographical, developmental and social differences,
national economy, energy use and environmental consequence vary
significantly that there is more than 100 times difference between the highest
and the lowest GDP per capita, total primary energy supply (TPES) per capita,
electricity production per capita and CO2 emissions per capita, which shows
the potential for improvement and regional collaboration.
4. From 1990 to 2012, overall growth patterns of energy supply, production and
consumption reflect the general economic trends at the national, subregional
and regional levels.
5. In the early stages of development in which are the vast majority of the Asia-
Pacific countries, Human Development Index (HDI) improvement is closely
correlated with TPES increase. The correlation diminishes as HDI gets higher,
indicating factors other than the amount of energy supply should be
considered for human development.
1References to dollars ($) are to United States dollars, unless otherwise stated.
11
6. Energy intensity, carbon intensity and electricity intensity for the Asia-Pacific
region have been decreasing due to efficiency improvement and economic
restructuring, but still higher than the world average.
7. Coal has been, and will remain, as the major fuel for energy supply, the
primary source for electricity production, and its combustion has been the
main cause of CO2 emissions in the Asia-Pacific region. Promoting high
efficiency low emission (HELE) coal power plants is one solution identified in
the 2014 Policy Dialogue to address the common challenges and towards
sustainable energy development in the region.
8. The share of variable renewable energy (VRE) in electricity production has
been growing and will continue to grow, which requires electric grids to evolve
to efficiently accommodate new VRE generation capacity.
9. Limited and unevenly distributed fossil fuel reserves, various energy self-
sufficiency rates, and differentiated impacts by bouncing international oil
prices all influence the region’s prospects for sustainable development but also
present opportunities for regional cooperation and national amelioration of
energy policies.
12
2.2 Socioeconomic Background and Energy Development Trends
Despite the high economic growth in the past two decades, the Asia and the Pacific
region is still economically behind. The share of regional economy in global economy
has increased from 24.9 per cent in 1990 to 31.0 per cent in 2012. Per capita GDP grew
from $2,324 (2005 constant price) in 1990, which is less than half of the global average
of $5,764, to $3,947 in 2012, about 51.3 per cent of the global average of $7,701. Due
to geographical, demographical, cultural, economic and structural differences, there is
a significant variation in national economies. GDP per capita ranges from $401.5 in
Afghanistan to $40,136 in Australia in 2012. Although there is progress regarding
poverty alleviation, 600 million people in this region live with less than $1.25 per day,
accounting for more than half of the world’s extreme poor.
The differences are reflected in the Asia-Pacific energy scene. Energy poverty remains
a prevalent issue in the Asia-Pacific region, which is critical for the Millennium
Development Goals (MDGs), the post-2015 Sustainable Development Goals, and the
Sustainable Energy for All (SE4All) initiatives. In 2012, 14.6 per cent of the regional
population, or 621.5 million people, do not have access to electricity and 1.9 billion
people still rely on traditional fuels for cooking and heating. Lack of modern energy
access not only deprive people from more productive activities and development
opportunities, deteriorate biological environment and biodiversity, but also cause
pollutions that may lead to health problems due to the inefficient and incomplete
combustion of traditional fuels, as well as force women and children to spend more
time on the drudgery of collecting fuels. Actual global investment for areas under
SE4ALL objectives was about $400 billion in 2010, more than double of which need to
be mobilized to realize the three objectives of SE4All before 2030 (SE4ALL, 2013). That
translates to at least approximately $600–800 billion additional investments every
year, which requires new and expanded engagement and commitments from
countries, international organizations, civil society and particularly from the private
sector.
13
Driven by economic growth, total primary energy supply (TPES) for the Asia-Pacific
region has been increasing, almost twofold in 2012, compared with its 1990 level. TPES
per capita varies greatly, ranging from the lowest of 715 koe in the South and South-
West Asia subregion to 5,352 koe in the Pacific subregion in 2012. A strong correlation
between TPES per capita and HDI is found for countries that are in the early stage of
development, but the improvement of HDI decouples from the growth of TPES per
capita as development advances. Thus to further improve HDI, it is necessary to take
into account other factors such as energy efficiency improvement, energy conservation
and social welfare development.
For every unit of GDP output, the Asia-Pacific region consumed 22.6 per cent more
energy than the world average in 2012. Within the region, primary energy intensity
varies from 45.68 koe per 1,000 dollars (2005 PPP) for Hong Kong to 541.93 koe per
$1,000 (2005 PPP) for Turkmenistan, due to various energy efficiency levels, energy
consumption patterns and economic structures. Between 1990 and 2012, except
Brunei Darussalam, Thailand, Malaysia, Kyrgyzstan and Tajikistan, all other ESCAP
countries improved GDP per capita level at the same time reduced energy intensity,
indicating that there is space for energy intensity improvement and potentials for
regional collaboration. In the region, fossil fuels dominate energy supply and
consumption. Coal is the most important fuel for this region: coal dependence
increased from 30.1 per cent in 1990 to 40.5 per cent in 2012, which makes coal a
focus area for energy policies.
As a response to regional economic growth, total final energy consumption for the
Asia-Pacific region grew at a faster pace than that of the world between 1990 and
2012. Despite that, per capita energy consumption in the region is more than 20 per
cent below the world average level in 2012. Final consumption of variable renewable
energies2 has been increasing, but there is still potential for further development.
2 Variable renewables are ‘sources that fluctuate during the course of any given day or season’, usually
refer to solar, wind, wave and tidal energy (http://www.iea.org/aboutus/faqs/renewableenergy/).
14
2.2.1 Regional economy has grown fast but remains low compared with the
world average
The Asia and the Pacific region is home to 60.2 per cent of the world’s population
while it only accounts for 31.0 per cent of the global economy in 2012. 3 The regional
economy has been growing rapidly, at 3.6 per cent annually between 1990 and 2012,
which is 0.9 per cent higher than that of the world average. Consequently, the share of
regional economy in global economy has increased by 6.1 per cent since 1990. GDP per
capita in the Asia-Pacific region increased by 69.8 per cent, compared with the global
average of 33.6 per cent growth. Due to geographical, demographical, developmental
and social differences, national economy, energy use and environmental consequence
vary significantly that there is more than 100 times difference between the highest and
the lowest GDP per capita. GDP per capita for the five Asia-Pacific subregions varies
significantly, ranging from $1,435 (2005 constant price) in South and South-West Asia
to $28,791 (2005 constant price) in the Pacific,4 in 2012.
2.2.2 Poverty persists despite considerable progress in poverty alleviation
One important target of the MDGs is to halve the proportion of extreme poor whose
income is less than $1.25 a day, between 1990 and 2015. The region has successfully
addressed this goal by reducing extreme poor from 52 per cent to 18 per cent of the
population between 1990 and 2011. In the meantime, the world decreased the level of
extreme poverty from 45 to 20 per cent. China led the global poverty reduction,
lowering the rate of extreme poverty from 60 per cent in 1990 to 12 per cent in 2010.
Still, about 13 per cent of the world’s 1.2 billion extreme poor reside in China (United
Nations, 2014).
The rate of extreme poverty in the South and South-West Asia fell from 52.4 per cent
in 1990 to 28.7 per cent in 2010, but poverty remains widespread in this subregion.
The United Nations (2014) reported that in 2010, one-third of the world’s 1.2 billion
3 Unless otherwise stated, data is retrieved from the APEF Portal (ESCAP, 2015b), based on IEA and ESCAP
statistics data. 4 IEA data has limited coverage for the Pacific subregion and it does not provide full coverage for Pacific
island countries, ‘Pacific’ in this chapter refers to Australia and New Zealand only.
15
extreme poor live in India and 5 per cent live in Bangladesh, accounting for 32.7 and
43.3 per cent of their national populations, respectively.
2.2.3 Universal energy access is fundamental for development
It is impossible to achieve the MDGs, as well as the proposed post-2015 sustainable
development agenda, without access to modern energy. However, energy access
remains challenging for the Asia-Pacific region.
As of 2012, 14.6 per cent of the regional population, or 621.5 million people, do not
have access to electricity, of which 434 million are from the South and South-West Asia
subregion, 134 million are from the South-East Asia subregion, and 21 million from the
East and North-East Asia subregion (calculated based on data, IEA, 2014a). Almost half
of the population without electricity access in the Asia-Pacific region lives in India,
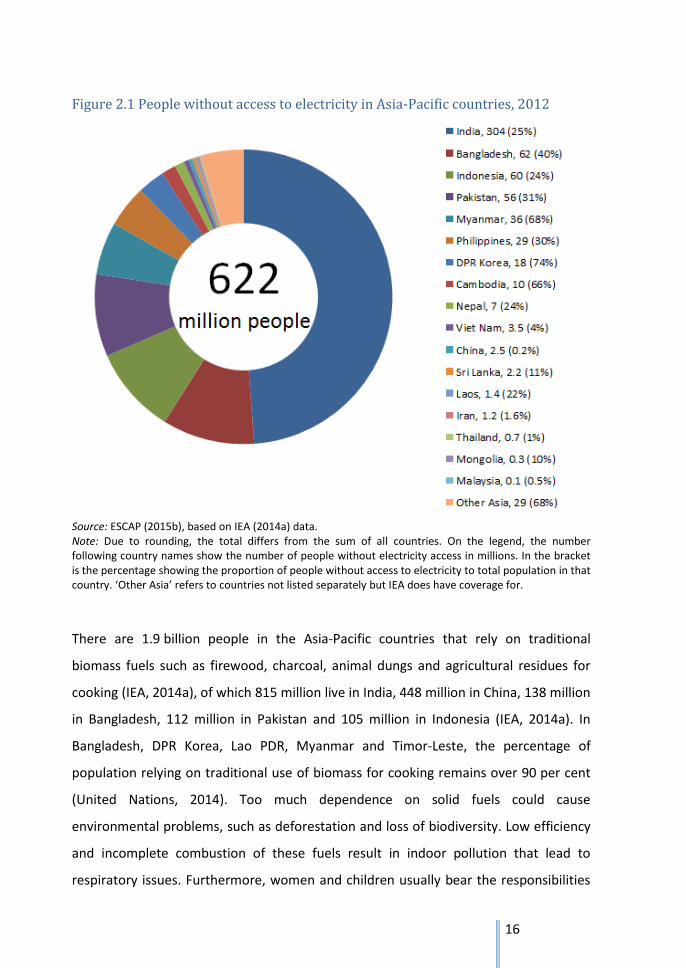
which accounts for 25 per cent of the nation’s population (Figure 2.1). Countries with
high proportions of population that do not have electricity access include Bangladesh
(62 million or 40 per cent of its population), Indonesia (60 million or 24 per cent of its
population), Pakistan (56 million or 31 per cent of its population), Myanmar
(36 million, or 68 per cent of its population), Philippines (29 million, or 30 per cent of
its population), DPR Korea (18 million, or 74 per cent of its population), Cambodia
(10 million, or 66 per cent of its population), Nepal (7 million, or 24 per cent of its
population), Sri Lanka (2.2 million, or 11 per cent of its population, Lao PDR (1.4 million
or 22 per cent of its population) and Mongolia (0.3 million, or 10 per cent of its
population). Compared with that in 2010, 7 million people in this region gained
electricity access, mainly from Bangladesh (25.6 million), Thailand (7.7 million),
Indonesia (3.3 million), Sri Lanka (2.6 million) and China (1 million). Between 2010 and
2012, population without electricity access increased in Philippines (13.1 million), India
(10.8 million) and Myanmar (10.1 million), and the percentage of population without
electricity access increased by 16.8 per cent in Myanmar, 13.0 per cent in Philippines
and 1.5 per cent in Viet Nam.
16
Figure 2.1 People without access to electricity in Asia-Pacific countries, 2012
Source: ESCAP (2015b), based on IEA (2014a) data. Note: Due to rounding, the total differs from the sum of all countries. On the legend, the number following country names show the number of people without electricity access in millions. In the bracket is the percentage showing the proportion of people without access to electricity to total population in that country. ‘Other Asia’ refers to countries not listed separately but IEA does have coverage for.
There are 1.9 billion people in the Asia-Pacific countries that rely on traditional
biomass fuels such as firewood, charcoal, animal dungs and agricultural residues for
cooking (IEA, 2014a), of which 815 million live in India, 448 million in China, 138 million
in Bangladesh, 112 million in Pakistan and 105 million in Indonesia (IEA, 2014a). In
Bangladesh, DPR Korea, Lao PDR, Myanmar and Timor-Leste, the percentage of
population relying on traditional use of biomass for cooking remains over 90 per cent
(United Nations, 2014). Too much dependence on solid fuels could cause
environmental problems, such as deforestation and loss of biodiversity. Low efficiency
and incomplete combustion of these fuels result in indoor pollution that lead to
respiratory issues. Furthermore, women and children usually bear the responsibilities
17
of collecting household fuelwoods and staying close to the cooking facilities for longer
periods, and therefore with more possibilities to get sick from such. Promotion of clean
energy for cooking provides a practical solution to these issues. It will also significantly
reduce the drudgery of women and children and improve their welfare.
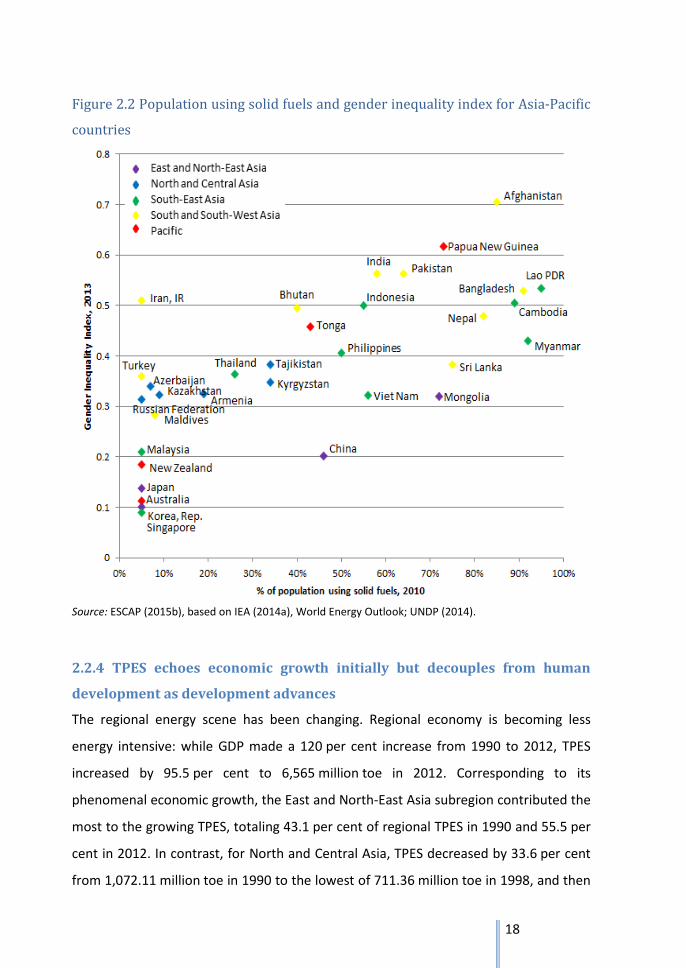
There is a strong correlation between the percentage of population using solid fuels
and gender inequality index (Figure 2.2). The proportion of households relying
primarily on non-solid fuels for cooking is adopted as an indicator for measuring
energy access in the SE4All global tracking framework, for which solid fuels are
‘defined to include both traditional biomass (wood, charcoal, agricultural and forest
residues, dung and so on), processed biomass (such as pellets and briquettes) and
other solid fuels (such as coal and lignite)’ (SE4ALL, 2013). Gender inequality index is ‘a
composite measure reflecting inequality in achievement between women and men in
three dimensions: reproductive health; empowerment; and the labor market’ (UNDP,
2014). Figure 2.2 shows that for countries with lower percentage of population using
solid fuels, there is less gender inequality; and for countries with higher percentage of
population using solid fuels, there is more gender inequality.
18
Figure 2.2 Population using solid fuels and gender inequality index for Asia-Pacific
countries
Source: ESCAP (2015b), based on IEA (2014a), World Energy Outlook; UNDP (2014).
2.2.4 TPES echoes economic growth initially but decouples from human
development as development advances
The regional energy scene has been changing. Regional economy is becoming less
energy intensive: while GDP made a 120 per cent increase from 1990 to 2012, TPES
increased by 95.5 per cent to 6,565 million toe in 2012. Corresponding to its
phenomenal economic growth, the East and North-East Asia subregion contributed the
most to the growing TPES, totaling 43.1 per cent of regional TPES in 1990 and 55.5 per
cent in 2012. In contrast, for North and Central Asia, TPES decreased by 33.6 per cent
from 1,072.11 million toe in 1990 to the lowest of 711.36 million toe in 1998, and then
19
increasing to 932.07 million toe in 2012. This more or less corresponds to the GDP
growth pattern in the subregion, where GDP decreased by 42.3 per cent between 1990
and 1998, and then doubling by 2012. The decrease of GDP and TPES is because of the
dissolution of the former Soviet Union and its effects on the economies, and the
increase corresponds to economic recovery and structural changes of this subregion.
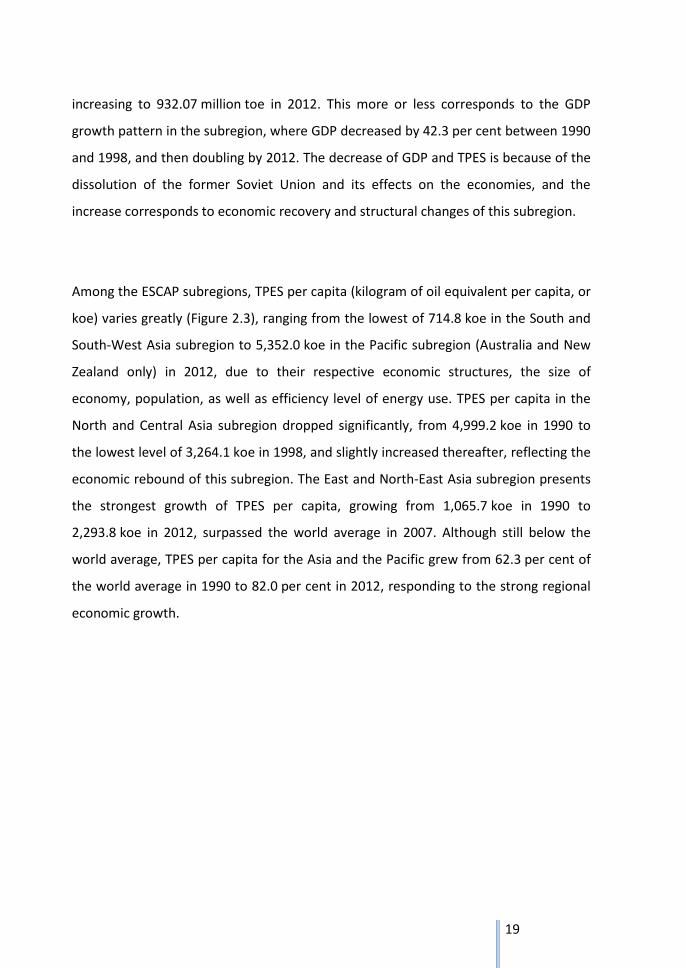
Among the ESCAP subregions, TPES per capita (kilogram of oil equivalent per capita, or
koe) varies greatly (Figure 2.3), ranging from the lowest of 714.8 koe in the South and
South-West Asia subregion to 5,352.0 koe in the Pacific subregion (Australia and New
Zealand only) in 2012, due to their respective economic structures, the size of
economy, population, as well as efficiency level of energy use. TPES per capita in the
North and Central Asia subregion dropped significantly, from 4,999.2 koe in 1990 to
the lowest level of 3,264.1 koe in 1998, and slightly increased thereafter, reflecting the
economic rebound of this subregion. The East and North-East Asia subregion presents
the strongest growth of TPES per capita, growing from 1,065.7 koe in 1990 to
2,293.8 koe in 2012, surpassed the world average in 2007. Although still below the
world average, TPES per capita for the Asia and the Pacific grew from 62.3 per cent of
the world average in 1990 to 82.0 per cent in 2012, responding to the strong regional
economic growth.
20
Figure 2.3 TPES per capita by ESCAP Subregion, 1990–2012
Source: ESCAP (2015b), based on ESCAP statistical data.
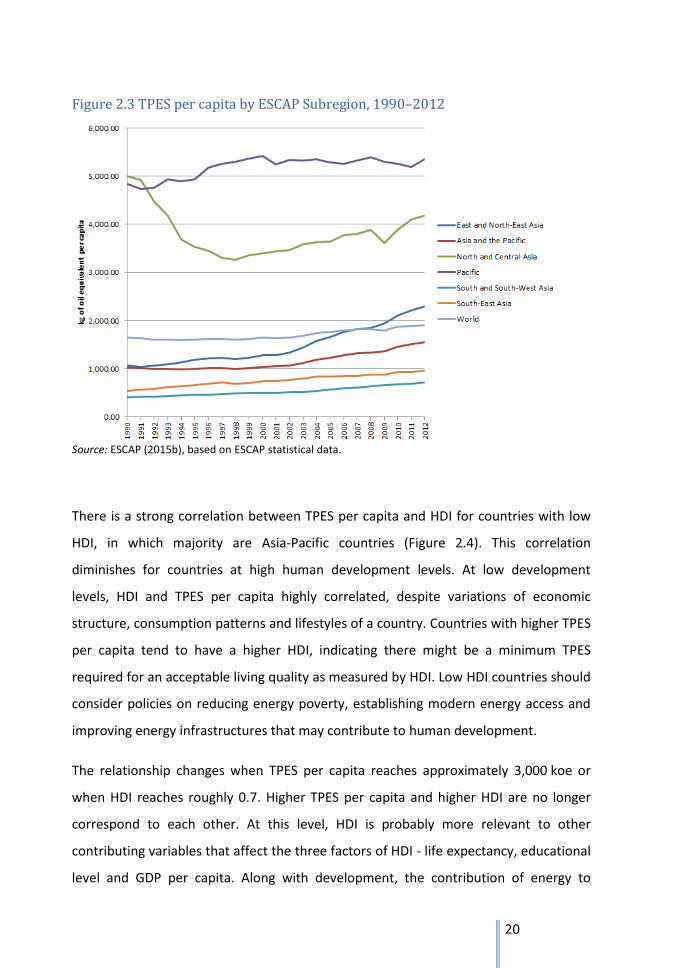
There is a strong correlation between TPES per capita and HDI for countries with low
HDI, in which majority are Asia-Pacific countries (Figure 2.4). This correlation
diminishes for countries at high human development levels. At low development
levels, HDI and TPES per capita highly correlated, despite variations of economic
structure, consumption patterns and lifestyles of a country. Countries with higher TPES
per capita tend to have a higher HDI, indicating there might be a minimum TPES
required for an acceptable living quality as measured by HDI. Low HDI countries should
consider policies on reducing energy poverty, establishing modern energy access and
improving energy infrastructures that may contribute to human development.
The relationship changes when TPES per capita reaches approximately 3,000 koe or
when HDI reaches roughly 0.7. Higher TPES per capita and higher HDI are no longer
correspond to each other. At this level, HDI is probably more relevant to other
contributing variables that affect the three factors of HDI - life expectancy, educational
level and GDP per capita. Along with development, the contribution of energy to
21
higher HDI in a country decreases. To maintain human development progress, other
factors such as energy mix restructure, energy efficiency improvement, energy
conservation and social welfare development are important to consider for improving
HDI.
Figure 2.4 TPES per capita and HDI for Asia-Pacific countries, 2012
Source: ESCAP (2015b), based on ESCAP statistical data and UNDP (2014).
2.2.5 Primary energy intensity improves while GDP grows
The Asia-Pacific region has a higher energy intensity level than that of the world,
although both are declining. Compared with the global average, for every unit of GDP
output, the region consumed 28.0 per cent more energy in 1990 and 22.6 per cent
more in 2012. The North and Central Asia subregion has the highest primary energy
intensity, almost triple the world average in 1990 and still more than double of the
22
world average in 2012, so there is a huge potential on promoting efficient use of
energy in this subregion. At the country level, there is a huge variation in terms of
primary energy intensity in the form of koe per $1000 (2005 PPP), which ranges from
45.68 for Hong Kong, 88.54 for Singapore, 102.95 for Sri Lanka, and 112.83 for Japan to
523.92 for Uzbekistan and 541.93 for Turkmenistan in 2012. The difference may be
explained by the variations in size of economy, economic structure, energy efficiency
level, energy supply patterns and lifestyles. Nevertheless, it presents the challenge and
potential for regional collaboration on reducing energy intensity.
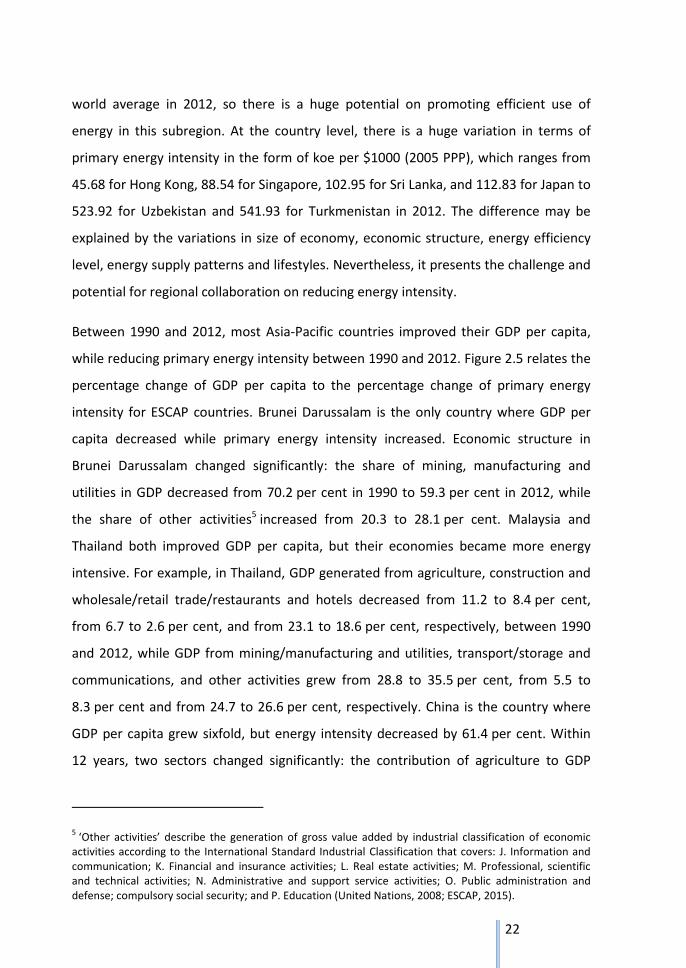
Between 1990 and 2012, most Asia-Pacific countries improved their GDP per capita,
while reducing primary energy intensity between 1990 and 2012. Figure 2.5 relates the
percentage change of GDP per capita to the percentage change of primary energy
intensity for ESCAP countries. Brunei Darussalam is the only country where GDP per
capita decreased while primary energy intensity increased. Economic structure in
Brunei Darussalam changed significantly: the share of mining, manufacturing and
utilities in GDP decreased from 70.2 per cent in 1990 to 59.3 per cent in 2012, while
the share of other activities5 increased from 20.3 to 28.1 per cent. Malaysia and
Thailand both improved GDP per capita, but their economies became more energy
intensive. For example, in Thailand, GDP generated from agriculture, construction and
wholesale/retail trade/restaurants and hotels decreased from 11.2 to 8.4 per cent,
from 6.7 to 2.6 per cent, and from 23.1 to 18.6 per cent, respectively, between 1990
and 2012, while GDP from mining/manufacturing and utilities, transport/storage and
communications, and other activities grew from 28.8 to 35.5 per cent, from 5.5 to
8.3 per cent and from 24.7 to 26.6 per cent, respectively. China is the country where
GDP per capita grew sixfold, but energy intensity decreased by 61.4 per cent. Within
12 years, two sectors changed significantly: the contribution of agriculture to GDP
5 ‘Other activities’ describe the generation of gross value added by industrial classification of economic
activities according to the International Standard Industrial Classification that covers: J. Information and communication; K. Financial and insurance activities; L. Real estate activities; M. Professional, scientific and technical activities; N. Administrative and support service activities; O. Public administration and defense; compulsory social security; and P. Education (United Nations, 2008; ESCAP, 2015).
23
decreased from 28.4 to 8.2 per cent, and the contribution from mining/manufacturing
and utilities increased from 28.1 to 42.7 per cent.
Figure 2.5 Change of primary energy intensity and change of GDP per capita for
Asia-Pacific countries, 1990–2012
Source: ESCAP (2015b), based on ESCAP statistical data.
24
2.2.6 The Asia-Pacific region increasingly relies on coal for energy supply
Coal has become the most important fuel for the Asia-Pacific region (Figure 2.6). Coal
as a primary source for energy supply increased from 1,077 Mtoe in 1990 to
2,886 Mtoe in 2012. During the same time period, the share of coal in TPES for the
Asia-Pacific grew from 30.1 to 40.5 per cent, while that of the global average increased
from 23.5 to 26.7 per cent. The increased use of coal is mainly driven by demand from
the East and North-East Asia, the South-East Asia, and the South and South-West Asia
subregions, where the share of coal in TPES increased from 46 per cent in 1990 to
58.7 per cent in 2012, 4 to 13.2 per cent, and 24.3 to 28.1 per cent, respectively. In the
North and Central Asia and the Pacific subregions, the share of coal in TPES slightly
decreased, but it still contributed 15 per cent of TPES in the North and Central Asia
subregion, and more than 30 per cent of TPES in the Pacific subregion. It is estimated
that coal will continue to dominate the primary energy demand of Asia and the Pacific,
accounting for 42.1 per cent in 2030 (APEC & ADB, 2013).
Globally, oil has a decreased share in the TPES, from 41.5 to 36.9 per cent between
1990 and 2012. For the Asia-Pacific region, total supply of oil increased from
1,238 Mtoe in 1990 to 2,121 Mtoe in 2012. However, the share of oil in TPES for Asia
and the Pacific, in line with the global trends, decreased from 34.6 to 29.8 per cent. Oil
is dominating primary energy in the South-East Asia subregion, although its proportion
in TPES decreased from 53.6 per cent in 1990 to 45.5 per cent in 2012. In the North
and Central Asia, the South and South-West Asia, and the Pacific subregions, oil also
accounts for more than one-third of TPES. In the East and North-East Asia subregion,
despite the decline in the share of oil, it accounts for 22.9 per cent of the primary
energy supply, which is still the second largest primary energy source in this subregion.
In the region, natural gas as a primary source for energy supply increased from
601 Mtoe in 1990 to 1,178 Mtoe in 2012. The share of natural gas remains stable for
Asia and the Pacific, but its share increased by 2 per cent in the global energy mix to
19.6 per cent in 2012. In the North and Central Asia subregion, where 56 per cent of
the Asia-Pacific’s natural gas reserves are located, natural gas accounted for 37.2 per
25
cent of TPES in 1990 and 41.2 per cent in 2012. Compared with the 1990 level, the
share of natural gas in TPES in 2012 doubled for the South-East Asia and the South and
South-West Asia subregions, reaching 18.7 and 18.5 per cent, respectively. In the East
and North-East Asia and the Pacific subregions, the share of natural gas in TPES
increased by 3.3 and 5 per cent to 7.4 and 22.8 per cent in 2012, respectively.
Supply of nuclear energy grew from 99 Mtoe in 1990 to 126 Mtoe in 2012. The share
of nuclear in TPES in Asia and the Pacific declined from 2.8 to 1.8 per cent, while the
global share declined from 5.4 to 4.4 per cent in 2012. No nuclear power is deployed in
South-East Asia and the Pacific subregions.
Between 1990 and 2012, primary energy supply from renewables increased from 505
to 672 Mtoe, but the share of renewables in TPES in the Asia-Pacific region decreased
from 14.1 to 9.5 per cent. The decrease are mainly from the East and North-East Asia
subregion where the share of renewables in TPES declined from 14.5 to 7 per cent, the
South-East Asia subregion that declined from 32.0 to 21.3 per cent, and the South and
South-West Asia subregion that declined from 34.8 to 17.7 per cent, indicating that the
growth of renewables for primary energy supply was outpaced by other energy
sources.
Overall, fossil fuels (coal, oil and natural gas) dominate energy supply for the Asia-
Pacific region, sharing increased 81.5 per cent of TPES in 1990 and 86.9 per cent in
2012. For the North and Central Asia and the Pacific subregions, dependence on fossil
fuels even goes beyond 90 per cent. In the other three subregions, the proportion of
fossil fuels in TPES has grown more than 10 per cent from 1990 to 2012.
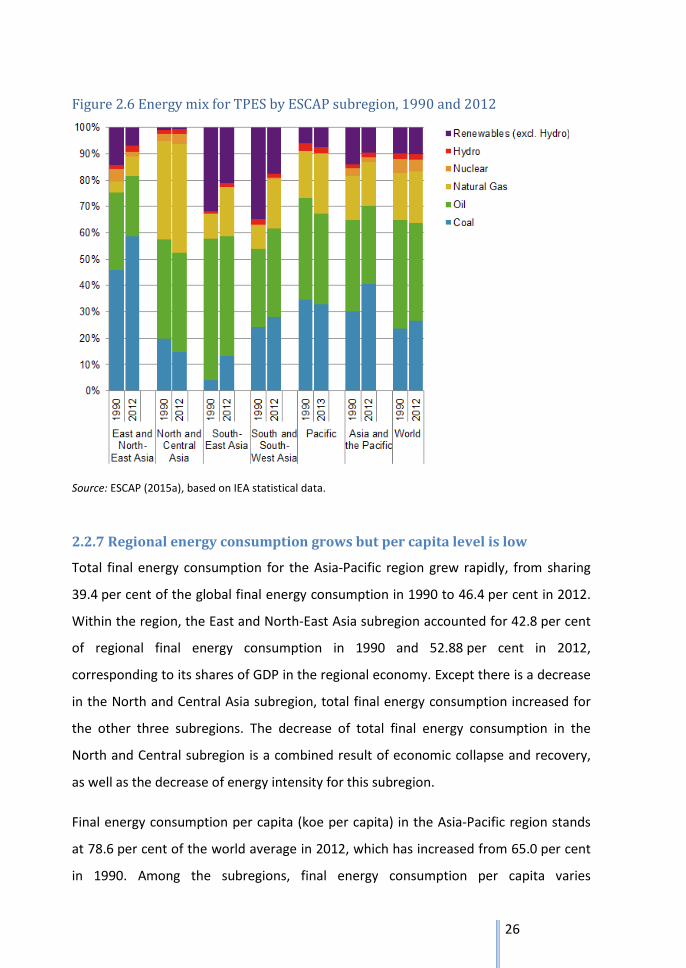
26
Figure 2.6 Energy mix for TPES by ESCAP subregion, 1990 and 2012
Source: ESCAP (2015a), based on IEA statistical data.
2.2.7 Regional energy consumption grows but per capita level is low
Total final energy consumption for the Asia-Pacific region grew rapidly, from sharing
39.4 per cent of the global final energy consumption in 1990 to 46.4 per cent in 2012.
Within the region, the East and North-East Asia subregion accounted for 42.8 per cent
of regional final energy consumption in 1990 and 52.88 per cent in 2012,
corresponding to its shares of GDP in the regional economy. Except there is a decrease
in the North and Central Asia subregion, total final energy consumption increased for
the other three subregions. The decrease of total final energy consumption in the
North and Central subregion is a combined result of economic collapse and recovery,
as well as the decrease of energy intensity for this subregion.
Final energy consumption per capita (koe per capita) in the Asia-Pacific region stands
at 78.6 per cent of the world average in 2012, which has increased from 65.0 per cent
in 1990. Among the subregions, final energy consumption per capita varies
27
significantly, ranging from the lowest of 496 koe in the South and South-West Asia
subregion to 3,353 koe in the Pacific subregion, due to different geographical and
socioeconomic factors. Final energy consumption per capita in the North and Central
Asia subregion dropped significantly, from 3,618 koe in 1990, to the lowest of
2,197 koe in 1998 and slightly increased thereafter with a fall in 2009 again, reflecting
its subregional economic growth pattern. The East and North-East Asia subregion
demonstrated the strongest growth in total final energy consumption per capita,
growing from 782 koe in 1990 to 1,386 koe in 2012, and surpassed the world average
in 2009, also matching the subregional economic growth trends. An increased
consumption per capita is also observed for the South-East Asia and South and South-
West Asia subregions. At the country level, there is an even wider variation in terms of
final consumption per capita, ranging from 160.8 koe for Bangladesh and 4,591.3 koe
for Brunei Darussalam in 2012. Countries with low energy consumption per capita level
include Philippines (248.6 koe), Tajikistan (255.9 koe), Myanmar (274.0 koe), Cambodia
(318.2 koe) and Nepal (363.7 koe).
2.2.8 Final energy consumption of VRE is increasing
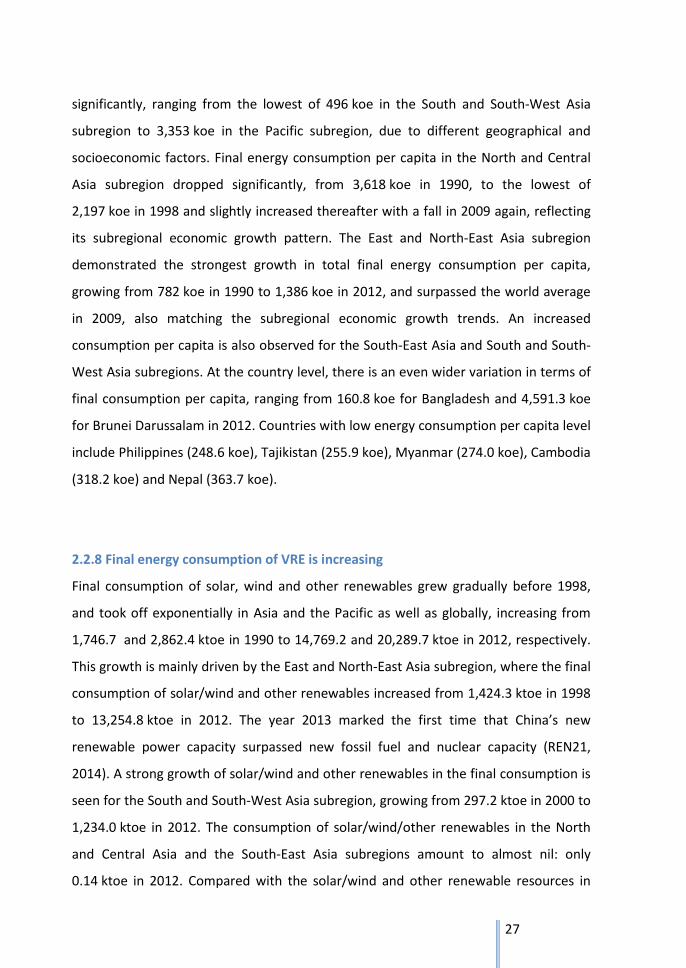
Final consumption of solar, wind and other renewables grew gradually before 1998,
and took off exponentially in Asia and the Pacific as well as globally, increasing from
1,746.7 and 2,862.4 ktoe in 1990 to 14,769.2 and 20,289.7 ktoe in 2012, respectively.
This growth is mainly driven by the East and North-East Asia subregion, where the final
consumption of solar/wind and other renewables increased from 1,424.3 ktoe in 1998
to 13,254.8 ktoe in 2012. The year 2013 marked the first time that China’s new
renewable power capacity surpassed new fossil fuel and nuclear capacity (REN21,
2014). A strong growth of solar/wind and other renewables in the final consumption is
seen for the South and South-West Asia subregion, growing from 297.2 ktoe in 2000 to
1,234.0 ktoe in 2012. The consumption of solar/wind/other renewables in the North
and Central Asia and the South-East Asia subregions amount to almost nil: only
0.14 ktoe in 2012. Compared with the solar/wind and other renewable resources in
28
this region, there is a huge potential for the development of these resources and
deployment of technologies.
Figure 2.7 Solar/wind/other final consumption in ESCAP subregions, 1990–2012
Source: ESCAP, based on IEA statistical data.
2.2.9 Sustainable energy requires further investment and expanded
commitment
In 2013, more than $1,600 billion has been invested to meet the world’s energy
demand and a further $130 billion to improve energy efficiency, of which more than
$1,100 billion was invested on extraction and transport of fossil fuels, oil refining and
the construction of fossil fuel-fired power plants (IEA, 2014b). Annual investment on
renewable energy increased from $60 billion in 2000 to approaching $300 billion in
2011, then falling back to $250 billion in 2014 (IEA, 2014b). IEA predicted that up to
2035, annual investment on meeting energy demand would rise to $2,000 billion, and
29
on energy efficiency, would increase to $550 billion. IEA (2014b) further estimates that
investment on energy supply will include $23 trillion on fossil fuel extraction, transport
and oil refining, $10 trillion on power generation include $6 trillion for renewables and
$1 trillion for nuclear, and the remaining $7 trillion goes to transmission and
distribution.
In 2013, global new investment in renewables6 was $214.4 billion, which was 14 per
cent lower than that of 2012 and 23 per cent lower than the 2011 level, of which China
accounted for $56.3 billion of new investment (including R&D) in renewable energy,
down 6 per cent from 2012 (REN21, 2014). Despite the overall decline, China’s
investment in additional renewable power capacity surpassed fossil fuel capacity
additions in 2013 for the first time. A notable growth of renewable energy investment
is seen in Japan, which increased 80 per cent from 2012 to $28.6 billion, excluding
R&D. Most of the investment, or $23 billion, goes to small-scale distributed
renewables, which may be driven by the sought of investors to capitalize on the
generous feed-in tariff that was introduced in 2012 (REN21, 2014). Investment in India
was $12.5 billion, under half of the peak record, due to a slowdown in asset finance,
but investment on small-scale project increased to $0.4 billion (REN21, 2014). Other
than that, renewable energy investment cumulated to over $3 billion in Thailand, Hong
Kong and the Philippines (REN21, 2014).
It is estimated that by 2030, 5 TW of net new power capacity will be added worldwide
with a $7.7 trillion investment, of which 2.7 TW will be added in the Asia-Pacific region,
which equates to a massive $3.6 trillion investment (BNEF, 2014). In the region, fossil
fuel power generation such as coal and natural gas will continue to grow despite
concerns over pollution and climate change, but the biggest growth will be in
renewables, mostly wind and solar that will amount 1.7 TW added capacity and require
$2.5 trillion investment (BNEF, 2014). Power demand in China will double between by
2030, which translated to a net 1.4 TW new capacity and requires capital investment of
6 Estimate does not include investment in renewable heating and cooling technologies, and hydropower
projects > 50 MW.
30
around $2 trillion, of which 72 per cent will go to renewables such as wind, solar and
hydropower (BNEF, 2014). Power demand in China will double between by 2030,
which translated to a net 1.4 TW new capacity and requires capital investment of
around $2 trillion, of which 72 per cent will go to renewables such as wind, solar and
hydropower (BNEF, 2014). Japan’s electricity demand in 2021 will regain its 2010 level
and then growing annually at 1 per cent, with efficiency gains partially offset economic
growth. By 2030, $203 billion is expected to be invested in new power capacity, of
which $116 billion going to rooftop solar and $72 billion to other renewable
technologies (BNEF, 2014). India’s power generation will quadruple, from 236 GW in
2013 to 887 GW in 2030, and of this growth 169 GW will be from utility-scale solar,
98 GW from onshore wind, 95 GW from hydropower, 155 GW from coal and 55 GW
from gas. India’s total investment to 2030 will be $754 billion, with $477 billion of that
in renewables (BNEF, 2014).
Actual global investment for areas under SE4ALL objectives was about $400 billion in
2010, an additional annual investments of at least approximately $600–800 billion are
needed to realize the three objectives of SE4All before 2030 (SE4ALL, 2013). The bulk
of those investments will be on renewable energy and energy efficiency objectives,
including $45 billion for electricity expansion, $4.4 billion on modern cooking, $394
billion in energy efficiency and $174 billion on renewable energy. This would require
new and expanded engagement and commitments from countries, international
organizations, civil society and particularly from the private sector.
2.3 Environmental consequences resulted from fuel combustion
Two major environmental concerns resulting from fuel combustion are global CO2
emissions and local air pollutions. While contributing 31.0 per cent of the global
economy and 49.1 per cent of global TPES in 2012, the Asia-Pacific region shared
53.2 per cent of global CO2 emissions, reflecting higher carbon intensity of this region,
which could be alleviated by improving energy efficiency, restructuring the economy
and optimizing energy mix. Indoor air pollution due to traditional use of solid fuels for
31
cooking and heating, as well as ambient air pollution resulted from fossil fuels
combustion have caused significant number of deaths worldwide, and in the region.
These environmental concerns could be addressed by enhancing modern energy
access, adopting clean technologies for fossil fuels and promoting development for
clean energy sources such as VREs.
2.3.1 CO2 emissions from fuel combustion increases while carbon intensity
declining
Total CO2 emissions from fuel combustion have been steadily increasing. Global CO2
emission grew from 21,552.5 million tons in 1990 to 32,649 million tons in 2012, of
which the Asia-Pacific region shared 38.3 and 53.2 per cent, respectively. The East and
North-East subregion is the major driving force for the increased emissions, emitting
3,690.5 million tCO2e in 1990 and 10,247.9 million tCO2e in 2012, of which China
accounted 61 and 81 per cent, respectively.
The composition of energy mix for CO2 emissions does not vary much for subregions in
1990 and 2012 (Figure 2.8). Coal combustion is the major cause of CO2 emissions and
its contribution to emission increased from 49.3 per cent of CO2 emissions in 1990 and
60.6 per cent in 2012 for the region, while it increased from 39.7 and 43.9 per cent
worldwide, respectively. Coal plays an important role in subregional CO2 emissions as
well. In 2012, it accounted for 74.6 per cent of the CO2 emissions in the East and
North-East Asia subregion, 27.5 per cent in the North and Central Asia subregion,
30.1 per cent for the South-East Asia subregion, 50.7 per cent for the South and South-
West Asia subregion and 46.5 per cent for the Pacific subregion.
Oil combustion is another important source for CO2 emissions, sharing 33.3 per cent in
1990 and 23.3 per cent in 2012 for Asia and the Pacific, while sharing 42.0 and 35.3 per
cent, respectively for the world. Its contribution to CO2 emissions declined from
29.9 per cent in 1990 to 18.6 per cent in 2012 in the East and North-East Asia
subregion, from 29.2 to 20.3 per cent for the North and Central Asia subregion, from
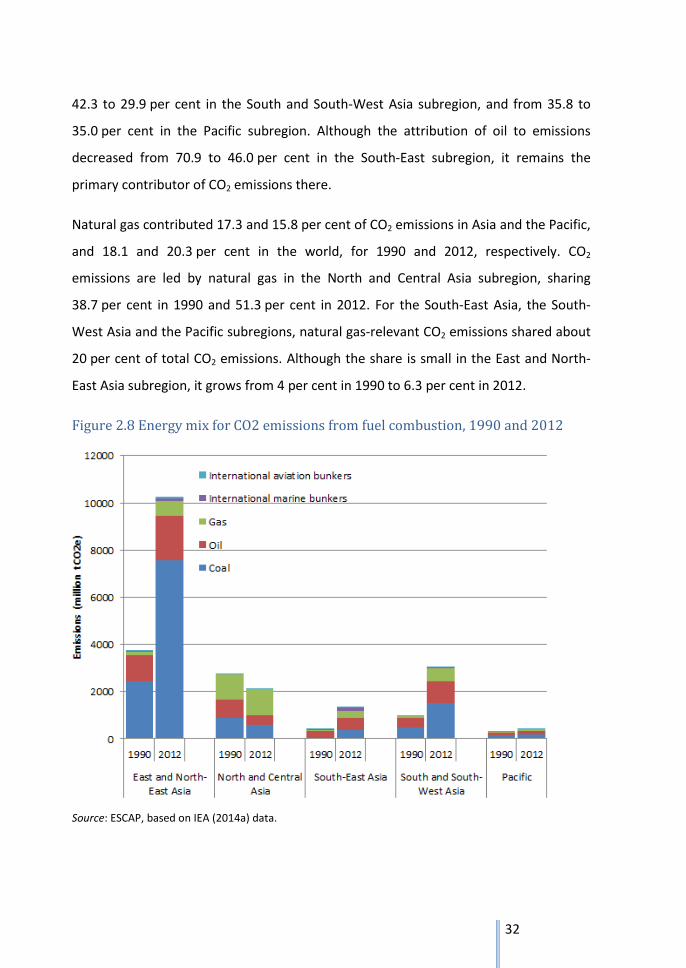
32
42.3 to 29.9 per cent in the South and South-West Asia subregion, and from 35.8 to
35.0 per cent in the Pacific subregion. Although the attribution of oil to emissions
decreased from 70.9 to 46.0 per cent in the South-East subregion, it remains the
primary contributor of CO2 emissions there.
Natural gas contributed 17.3 and 15.8 per cent of CO2 emissions in Asia and the Pacific,
and 18.1 and 20.3 per cent in the world, for 1990 and 2012, respectively. CO2
emissions are led by natural gas in the North and Central Asia subregion, sharing
38.7 per cent in 1990 and 51.3 per cent in 2012. For the South-East Asia, the South-
West Asia and the Pacific subregions, natural gas-relevant CO2 emissions shared about
20 per cent of total CO2 emissions. Although the share is small in the East and North-
East Asia subregion, it grows from 4 per cent in 1990 to 6.3 per cent in 2012.
Figure 2.8 Energy mix for CO2 emissions from fuel combustion, 1990 and 2012
Source: ESCAP, based on IEA (2014a) data.
33
CO2 emissions per capita from fuel combustion for Asia and the Pacific is still below the
world average level, but the per capita emission increased its ratio compared with the
global average from 62.5 per cent in 1990 to 87.3 per cent in 2011. CO2 emissions per
capita vary among subregions, ranging from 1.6 metric tonnes (MT) of CO2 per capita
for the South and South-West Asia subregion to 15.7 MT for the Pacific subregion in
2011. For the North and Central Asia subregion, it dropped significantly from 12.7 MT
of CO2 per capita in 1990, to the lowest of 7.9 MT in 1997, and slightly increases
thereafter with a fall in 2009 again. The East and North-East Asia subregion exhibited
the strongest growth in per capita CO2 emissions from fuel combustion, growing from
2.7 to 6.2 MT, and surpassing the world average in 2003. A pattern with increased
emissions is also identified for the South-East Asia and the South and South-West Asia
subregions.
Although carbon intensity is declining at the Asia and the Pacific and the global levels,
the region has higher carbon intensity than that of the world. For every $1 of GDP
output, 28.7 per cent more emissions were emitted in 1990 and 33.1 per cent more in
2011 in the region. As a result of the restructuring of the economics following the
break-up of the former Soviet Union, the North and Central Asia subregion had the
highest carbon intensity, almost triple the world average in 1990. It has improved over
the past two decades but it is still more than double of the world average in 2011.
2.3.2 Air pollution becomes a serious threat
In the Asia-Pacific region, household use of traditional energy, such as crop residues
and firewood, for cooking and heating, produces high levels of indoor air pollution
such as fine particles (PM10 and PM2.5)7 and carbon monoxide, and poses a serious
health threat, especially to women and children who stay closer to cooking and
heating facilities and for longer periods. Every year, indoor air pollution from solid fuel
7 PM10 refers to fine suspended particulates less than 10 microns in diameter that originate from a variety
of mobile and stationary sources such as mobile vehicles, cooking facilities, factories and power plants (USEPA, 2012). PM10 are capable of penetrating deep into the respiratory tract and causing significant health damage (World Bank, 2015).
34
use accounts for a very substantial burden of disease and more than 4.3 million
premature deaths around the globe (WHO, 2014a). The majority of household without
electricity access are also homes that rely on solid fuels for cooking and live in extreme
poor conditions. They often have to face multiple threats including unsafe water and
sanitation, infectious diseases, inadequate access to health services, weak
infrastructures, and lack of educational and employment opportunities. Providing
modern energy access to these households will bring substantial benefits for
eliminating these inequalities.
Most of the fine particulate matters (PMs) that have the greatest effect on human
health come from fuel combustion for transport, power plants, industry and
households (WHO, 2015a). The concentration of PM10 is determined by a country’s
technology and pollution controls (World Bank, 2015). In the Asia-Pacific region, cities
in developing countries tend to have more serious ambient air pollution issues than
their counterparts (Figure 2.9). WHO (2015b) estimated that in 2012, 3.7 million
deaths were attributable to ambient air pollution globally, of which 88 per cent occur
in low- and middle -income countries (WHO, 2015b). The Asia and the Pacific region
bear the most of the burden with 2.6 million deaths that accounts for 69.8 per cent of
the world total (WHO, 2015b). Essential control of ambient air pollution requires
development of cleaner energy and technologies, as well as restructures the energy
mix for national economy.
35
Figure 2.9 PM10 levels in selected Asian Pacific cities
*Data ranges from 2008 to 2013 This chart indicates annual mean concentration of particulate matter of less than 10 microns of diameter (PM10) [µg/m3] in cities. These particles are able to penetrate deeply into the respiratory tract and therefore constitute health risks, by increasing mortality from respiratory infections and diseases, lung cancer and selected cardiovascular diseases. Source: ESCAP, based on WHO (2014b) data.
2.4 Energy use in the power sector
Electricity as one energy form for production and final consumption has become
increasingly important. Share of electricity production in total energy production
increased from 9.0 per cent in 1990 to 14.5 per cent in 2012. Coal has been and will
continue to be the dominating fuel for electricity generation, contributing 60.0 per
cent to regional electricity generation in 2012, followed by natural gas (19.2 per cent)
and hydropower (14.5 per cent). Promoting HELE coal technologies becomes a
challenge as well as an opportunity for improving energy efficiency and cleaning the
power sector. There is an increasing role for VERs in electricity production, growing
36
more than double between 1990 and 2012. Huge potential exists for integrating VREs
into the power generation sector.
2.4.1 Electricity production accounts for 14.5 per cent of total energy
production in 2012
Total electricity production has been increasing, for Asia and the Pacific and the world,
and both grew more than double by 2012 compared with the 1990 levels. Asia and the
Pacific region had a share of 31.6 per cent of the global electricity production in 1990
and 47.3 per cent in 2012. Within the region, the East and North-East Asia subregion
has been the major electricity producer, contributing 43.4 per cent in 1990 and
61.6 per cent in 2012 to the regional electricity production. A slight decline is identified
for the North and Central Asia subregion, decreasing from 1,322 TWh in 1990 to
1,305 TWh in 2012. Total electricity production for the South and South-West Asia and
the South-East Asia subregions increased from 459 and 154 TWh to 1,782 and
756 TWh, respectively.
Share of electricity production in the total energy production increased from 9.0 per
cent in 1990 to 14.5 per cent in 2012 (Figure 2.10). Overall, coal has been and will
continue to be the dominating fuel for electricity generation, contributing 60.0 per
cent to regional electricity generation in 2012, followed by natural gas (19.2 per cent)
and hydropower (14.5 per cent). With the pressures on environmental protection,
global climate change, as well as sustainable use of energy, promoting HELE coal
technologies in power generation has become a pressing issue. The share of oil and
nuclear in total electricity production is decreasing (from 11.6 to 4.1 per cent, and
from 11.2 to 4.5 per cent) between 1990 and 2012. The share of VREs in electricity
generation grew from zero to 1.5 per cent in 2012. Although the amount is still small,
there are huge potentials to integrate VREs into the power generation sector.
37
Figure 2.10 Share of electricity production in total energy production for Asia and
the Pacific
Source: ESCAP (2015b), based on IEA statistical data.
Electricity production per capita for Asia and the Pacific is only at 51.1 per cent of the
world average in 1990 and 78.6 per cent in 2012 (Figure 2.11). Electricity production
per capita varies greatly among the subregions, ranging from the lowest of 9,907-
kilowatt hour (kWh) per capita for the South and South-West Asia subregion to the
highest of 7,766 kWh per capita for the Pacific subregion in 2012. For the North and
Central Asia subregion, it dropped significantly from 6,162 kWh per capita in 1990, to
its lowest of 4,544 kWh per capita in 1998, and slightly increased thereafter with a fall
in 2009 again. The East and North-East Asia subregion presents the strongest growth in
electricity production per capita, growing from 1,198 kWh per capita in 1990 to
4,171 kWh per capita in 2012, and surpassed the world average in 2006. An increasing
pattern is also identified for the South-East Asia and the South and South-West Asia
subregions.
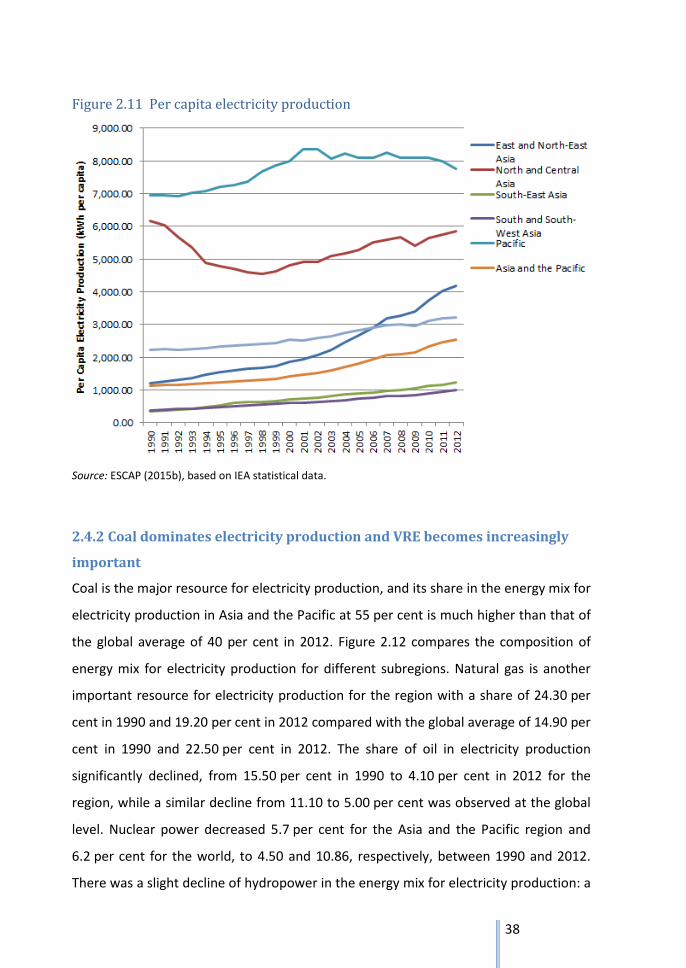
38
Figure 2.11 Per capita electricity production
Source: ESCAP (2015b), based on IEA statistical data.
2.4.2 Coal dominates electricity production and VRE becomes increasingly
important
Coal is the major resource for electricity production, and its share in the energy mix for
electricity production in Asia and the Pacific at 55 per cent is much higher than that of
the global average of 40 per cent in 2012. Figure 2.12 compares the composition of
energy mix for electricity production for different subregions. Natural gas is another
important resource for electricity production for the region with a share of 24.30 per
cent in 1990 and 19.20 per cent in 2012 compared with the global average of 14.90 per
cent in 1990 and 22.50 per cent in 2012. The share of oil in electricity production
significantly declined, from 15.50 per cent in 1990 to 4.10 per cent in 2012 for the
region, while a similar decline from 11.10 to 5.00 per cent was observed at the global
level. Nuclear power decreased 5.7 per cent for the Asia and the Pacific region and
6.2 per cent for the world, to 4.50 and 10.86, respectively, between 1990 and 2012.
There was a slight decline of hydropower in the energy mix for electricity production: a
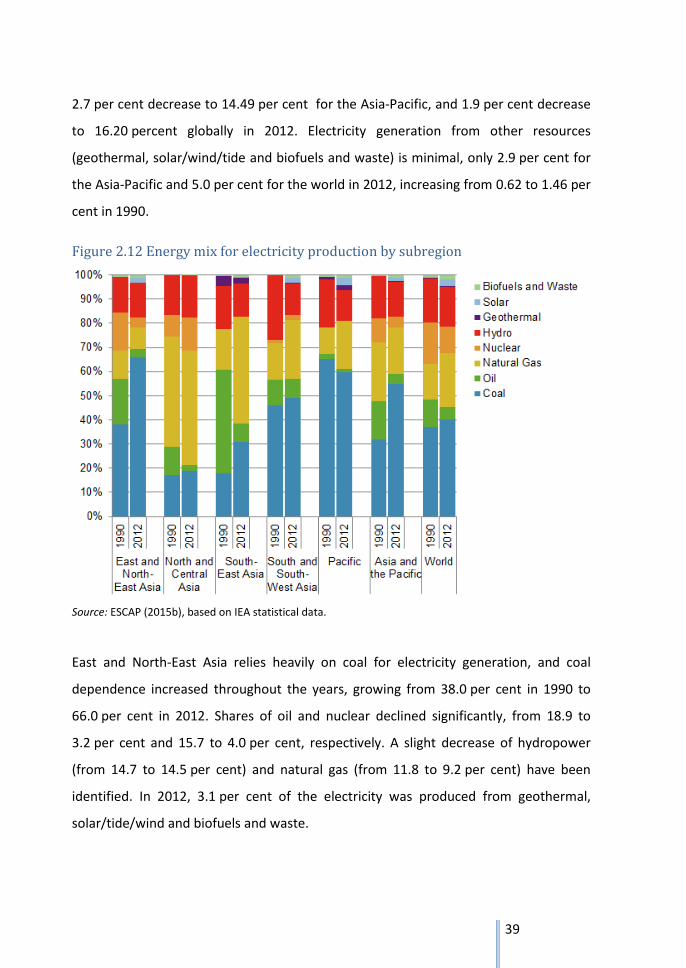
39
2.7 per cent decrease to 14.49 per cent for the Asia-Pacific, and 1.9 per cent decrease
to 16.20 percent globally in 2012. Electricity generation from other resources
(geothermal, solar/wind/tide and biofuels and waste) is minimal, only 2.9 per cent for
the Asia-Pacific and 5.0 per cent for the world in 2012, increasing from 0.62 to 1.46 per
cent in 1990.
Figure 2.12 Energy mix for electricity production by subregion
Source: ESCAP (2015b), based on IEA statistical data.
East and North-East Asia relies heavily on coal for electricity generation, and coal
dependence increased throughout the years, growing from 38.0 per cent in 1990 to
66.0 per cent in 2012. Shares of oil and nuclear declined significantly, from 18.9 to
3.2 per cent and 15.7 to 4.0 per cent, respectively. A slight decrease of hydropower
(from 14.7 to 14.5 per cent) and natural gas (from 11.8 to 9.2 per cent) have been
identified. In 2012, 3.1 per cent of the electricity was produced from geothermal,
solar/tide/wind and biofuels and waste.
40
Natural gas dominates electricity generation in North and Central Asia, sharing
45.5 per cent in 1990 and 47.7 per cent in 2012. Coal and hydropower are two other
important fuels for electricity production, accounting for 17.0 and 16.5 per cent in
1990, and 19.0 and 17.4 per cent in 2012. There is a 9.7 per cent decrease for oil and
4.8 per cent increase for nuclear power. In 2012, VRE contributed only 0.2 per cent of
total electricity production in this subregion.
Energy mix for electricity production changed significantly for South-East Asia. In 1990,
oil is the major fuel for power generation, sharing 42.7 per cent, with the remaining
evenly distributed among coal, natural gas and hydropower expect 4.7 per cent from
variable renewable energies, such as solar, wind and tide energy. In 2012, natural gas
became the number one contributor, contributing 44.2 per cent of electricity
production, followed by coal of 31.0 per cent. Hydropower shared 13.6 per cent, and
oil shared merely 7.4 per cent. In 2012, 3.60 per cent of the electricity production
came from renewable energies.
For South and South-West Asia, coal is the major contributor to electricity production,
accounting for 46.0 per cent in 1990 and 49.0 per cent in 2012. Natural gas increased
its share from 15.3 per cent to 24.5 per cent while hydropower decreased from 26.7 to
13.1 per cent and oil decreased slightly from 10.3 to 7.9 per cent. In 2012, renewable
energies contributed to 3.40 per cent of total electricity production.
For the Pacific region, coal makes the majority of electricity production, sharing
65.0 per cent in 1990 and 60.0 per cent in 2012. While natural gas increased from 10.8
to 20.0 per cent, hydropower decreased from 20.0 to 12.6 per cent. In 2012,
renewable energy contributed to 6.40 per cent of total electricity production in this
subregion.
Total electricity production from renewables has been increasing drastically, in the
Asia-Pacific region and worldwide, and grew more than double in 2012 in the region
and worldwide, compared with the 1990 levels. The Asia-Pacific region shared
28.92 per cent of total global renewable electricity production in 1990 and 37.40 per
41
cent in 2012. Within the region, East and North-East Asia has been the major
renewable electricity producer, contributing 37.48 per cent in 1990 and 59.32 per cent
in 2012 to the total renewable electricity production for the Asia-Pacific region. A slight
increase has been identified for North and Central Asia, increasing from 217,972 GWh
in 1990 to 228,216 GWh in 2012.
2.4.3 Electricity contributes increasingly to GDP growth
Figure 2.13 relates the change of GDP per capita and electricity production per capita.
It is apparently that there is almost a linear relationship between the changes. As
electricity production per capita increases, so does the GDP per capita. However, for
countries such as Viet Nam, there is a greater increase of electricity production than of
GDP, meaning that the economy is mainly dependent on electricity input. For countries
such as China and Myanmar, GDP grows faster than electricity production, indicating
that electricity is used more efficiently in these countries due to efficiency
improvement and economic structural change.
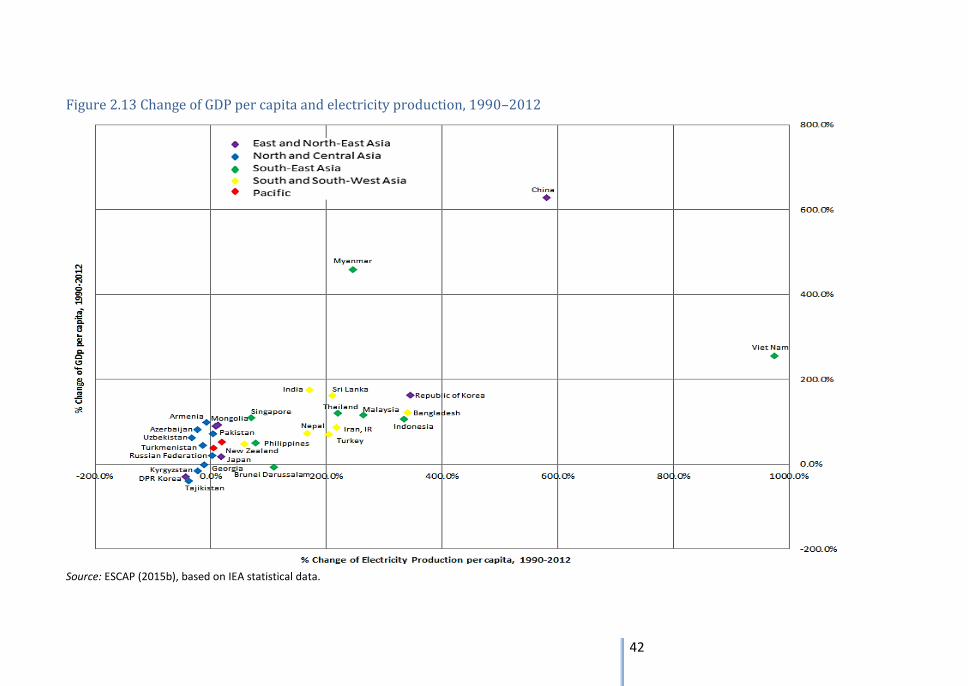
42
Figure 2.13 Change of GDP per capita and electricity production, 1990–2012
Source: ESCAP (2015b), based on IEA statistical data.
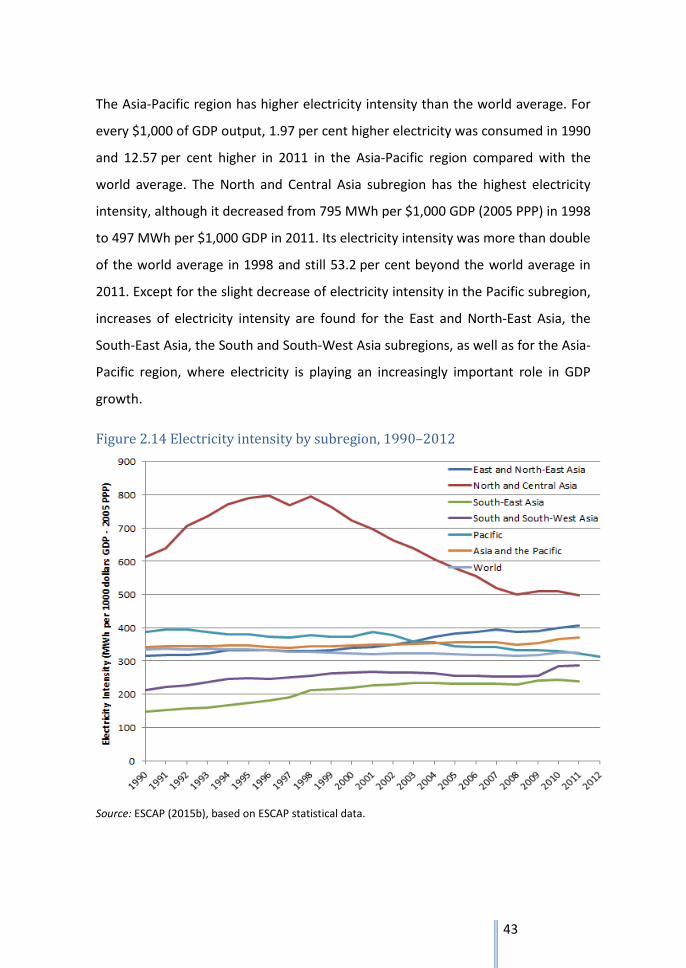
43
The Asia-Pacific region has higher electricity intensity than the world average. For
every $1,000 of GDP output, 1.97 per cent higher electricity was consumed in 1990
and 12.57 per cent higher in 2011 in the Asia-Pacific region compared with the
world average. The North and Central Asia subregion has the highest electricity
intensity, although it decreased from 795 MWh per $1,000 GDP (2005 PPP) in 1998
to 497 MWh per $1,000 GDP in 2011. Its electricity intensity was more than double
of the world average in 1998 and still 53.2 per cent beyond the world average in
2011. Except for the slight decrease of electricity intensity in the Pacific subregion,
increases of electricity intensity are found for the East and North-East Asia, the
South-East Asia, the South and South-West Asia subregions, as well as for the Asia-
Pacific region, where electricity is playing an increasingly important role in GDP
growth.
Figure 2.14 Electricity intensity by subregion, 1990–2012
Source: ESCAP (2015b), based on ESCAP statistical data.
44
2.5 Enhance energy security for sustainable development
Energy security is an important prerequisite for development (ESCAP, 2013).
Although its definition varies across countries, generally it refers to long-term,
sufficient and affordable energy supply that meets with the demand. Limited years
of reserve to production ratio for fossil fuels in the region, various energy self-
sufficiency levels, plus differentiated influence of the fluctuating international oil
prices are all significant factors that call for regional collaborations on energy
access, trade, connectivity, technology development and transfer, as well as fiscal
strategies to enhance energy security for sustainable development in the Asia-
Pacific region.
2.5.1 Fossil fuel reserves are limited and unevenly distributed
Fossil fuels have been the major energy resource for the Asia-Pacific region. Table
2.1 presents the reserves of fossil fuels at the national, regional and global levels.
As can be seen, oil reserve in the Asia-Pacific region is only 19.3 per cent of the
world’s total, which at current production rates will last 34 years. Natural gas
reverses are 106,357 billion cubic metres, accounting for 55.8 per cent of the
world’s total, which will last 76 years at current production rates. The Asia-Pacific
region shares 55.4 per cent of the global coal reserves, and will last 89 years at
current production rates.
Among the Asia-Pacific countries, reserves of oil, natural gas and coal are unevenly
distributed. Countries with the most abundant fossil fuel reserves may not be
countries with highest consumptions, implying the potential for regional
cooperation on energy production and energy trade.
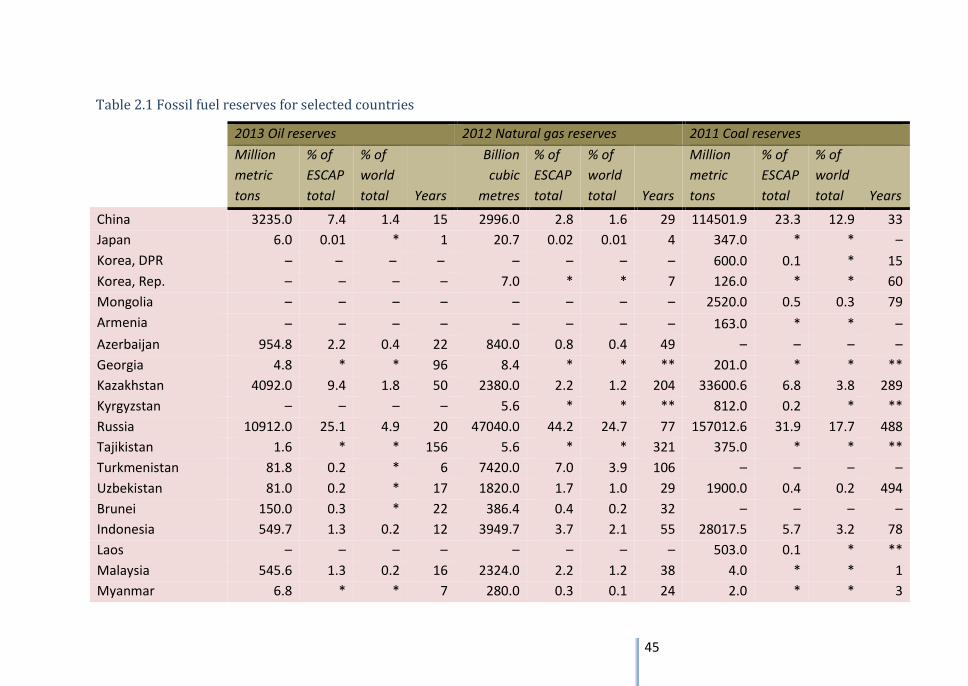
45
Table 2.1 Fossil fuel reserves for selected countries
2013 Oil reserves 2012 Natural gas reserves 2011 Coal reserves
Million
metric
tons
% of
ESCAP
total
% of
world
total Years
Billion
cubic
metres
% of
ESCAP
total
% of
world
total Years
Million
metric
tons
% of
ESCAP
total
% of
world
total Years
China 3235.0 7.4 1.4 15 2996.0 2.8 1.6 29 114501.9 23.3 12.9 33
Japan 6.0 0.01 * 1 20.7 0.02 0.01 4 347.0 * * –
Korea, DPR – – – – – – – – 600.0 0.1 * 15
Korea, Rep. – – – – 7.0 * * 7 126.0 * * 60
Mongolia – – – – – – – – 2520.0 0.5 0.3 79
Armenia – – – – – – – – 163.0 * * –
Azerbaijan 954.8 2.2 0.4 22 840.0 0.8 0.4 49 – – – –
Georgia 4.8 * * 96 8.4 * * ** 201.0 * * **
Kazakhstan 4092.0 9.4 1.8 50 2380.0 2.2 1.2 204 33600.6 6.8 3.8 289
Kyrgyzstan – – – – 5.6 * * ** 812.0 0.2 * **
Russia 10912.0 25.1 4.9 20 47040.0 44.2 24.7 77 157012.6 31.9 17.7 488
Tajikistan 1.6 * * 156 5.6 * * 321 375.0 * * **
Turkmenistan 81.8 0.2 * 6 7420.0 7.0 3.9 106 – – – –
Uzbekistan 81.0 0.2 * 17 1820.0 1.7 1.0 29 1900.0 0.4 0.2 494
Brunei 150.0 0.3 * 22 386.4 0.4 0.2 32 – – – –
Indonesia 549.7 1.3 0.2 12 3949.7 3.7 2.1 55 28017.5 5.7 3.2 78
Laos – – – – – – – – 503.0 0.1 * **
Malaysia 545.6 1.3 0.2 16 2324.0 2.2 1.2 38 4.0 * * 1
Myanmar 6.8 * * 7 280.0 0.3 0.1 24 2.0 * * 3
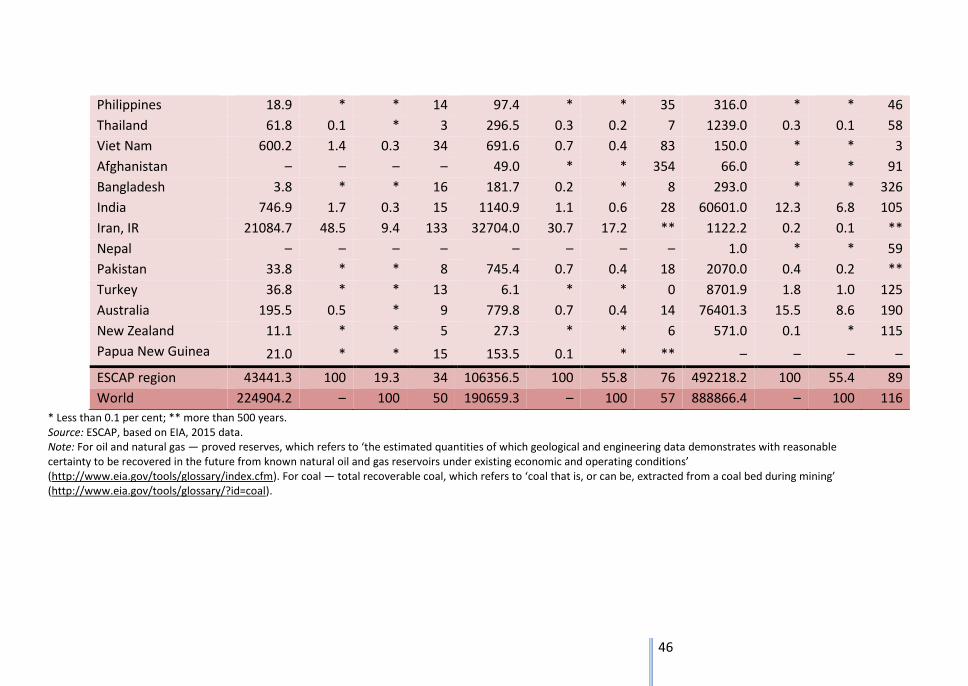
46
Philippines 18.9 * * 14 97.4 * * 35 316.0 * * 46
Thailand 61.8 0.1 * 3 296.5 0.3 0.2 7 1239.0 0.3 0.1 58
Viet Nam 600.2 1.4 0.3 34 691.6 0.7 0.4 83 150.0 * * 3
Afghanistan – – – – 49.0 * * 354 66.0 * * 91
Bangladesh 3.8 * * 16 181.7 0.2 * 8 293.0 * * 326
India 746.9 1.7 0.3 15 1140.9 1.1 0.6 28 60601.0 12.3 6.8 105
Iran, IR 21084.7 48.5 9.4 133 32704.0 30.7 17.2 ** 1122.2 0.2 0.1 **
Nepal – – – – – – – – 1.0 * * 59
Pakistan 33.8 * * 8 745.4 0.7 0.4 18 2070.0 0.4 0.2 **
Turkey 36.8 * * 13 6.1 * * 0 8701.9 1.8 1.0 125
Australia 195.5 0.5 * 9 779.8 0.7 0.4 14 76401.3 15.5 8.6 190
New Zealand 11.1 * * 5 27.3 * * 6 571.0 0.1 * 115
Papua New Guinea 21.0 * * 15 153.5 0.1 * ** – – – –
ESCAP region 43441.3 100 19.3 34 106356.5 100 55.8 76 492218.2 100 55.4 89
World 224904.2 – 100 50 190659.3 – 100 57 888866.4 – 100 116
* Less than 0.1 per cent; ** more than 500 years. Source: ESCAP, based on EIA, 2015 data. Note: For oil and natural gas — proved reserves, which refers to ‘the estimated quantities of which geological and engineering data demonstrates with reasonable certainty to be recovered in the future from known natural oil and gas reservoirs under existing economic and operating conditions’ (http://www.eia.gov/tools/glossary/index.cfm). For coal — total recoverable coal, which refers to ‘coal that is, or can be, extracted from a coal bed during mining’ (http://www.eia.gov/tools/glossary/?id=coal).
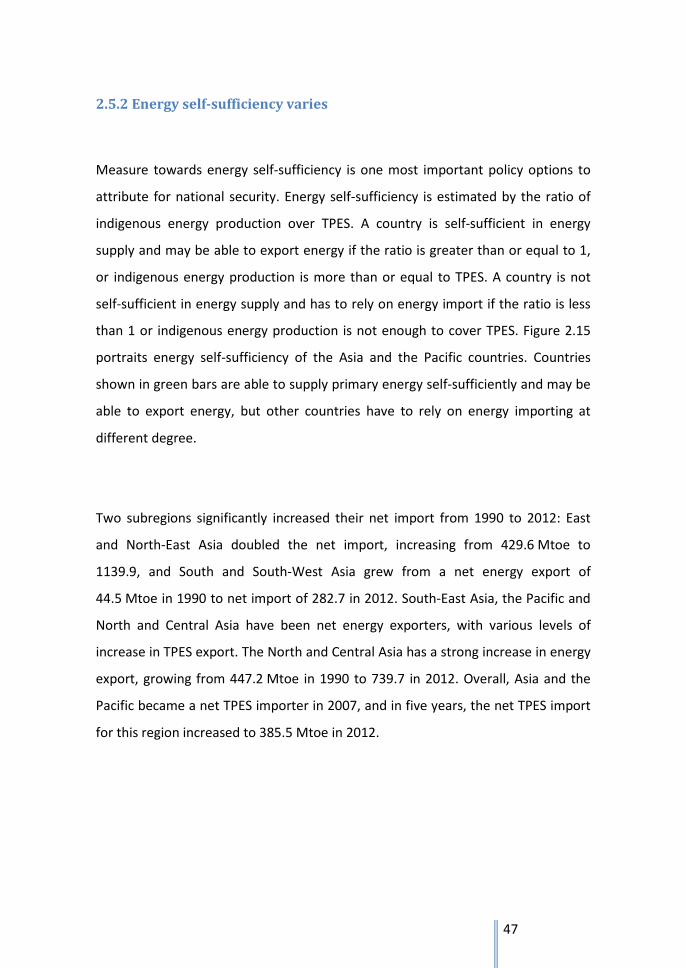
47
2.5.2 Energy self-sufficiency varies
Measure towards energy self-sufficiency is one most important policy options to
attribute for national security. Energy self-sufficiency is estimated by the ratio of
indigenous energy production over TPES. A country is self-sufficient in energy
supply and may be able to export energy if the ratio is greater than or equal to 1,
or indigenous energy production is more than or equal to TPES. A country is not
self-sufficient in energy supply and has to rely on energy import if the ratio is less
than 1 or indigenous energy production is not enough to cover TPES. Figure 2.15
portraits energy self-sufficiency of the Asia and the Pacific countries. Countries
shown in green bars are able to supply primary energy self-sufficiently and may be
able to export energy, but other countries have to rely on energy importing at
different degree.
Two subregions significantly increased their net import from 1990 to 2012: East
and North-East Asia doubled the net import, increasing from 429.6 Mtoe to
1139.9, and South and South-West Asia grew from a net energy export of
44.5 Mtoe in 1990 to net import of 282.7 in 2012. South-East Asia, the Pacific and
North and Central Asia have been net energy exporters, with various levels of
increase in TPES export. The North and Central Asia has a strong increase in energy
export, growing from 447.2 Mtoe in 1990 to 739.7 in 2012. Overall, Asia and the
Pacific became a net TPES importer in 2007, and in five years, the net TPES import
for this region increased to 385.5 Mtoe in 2012.
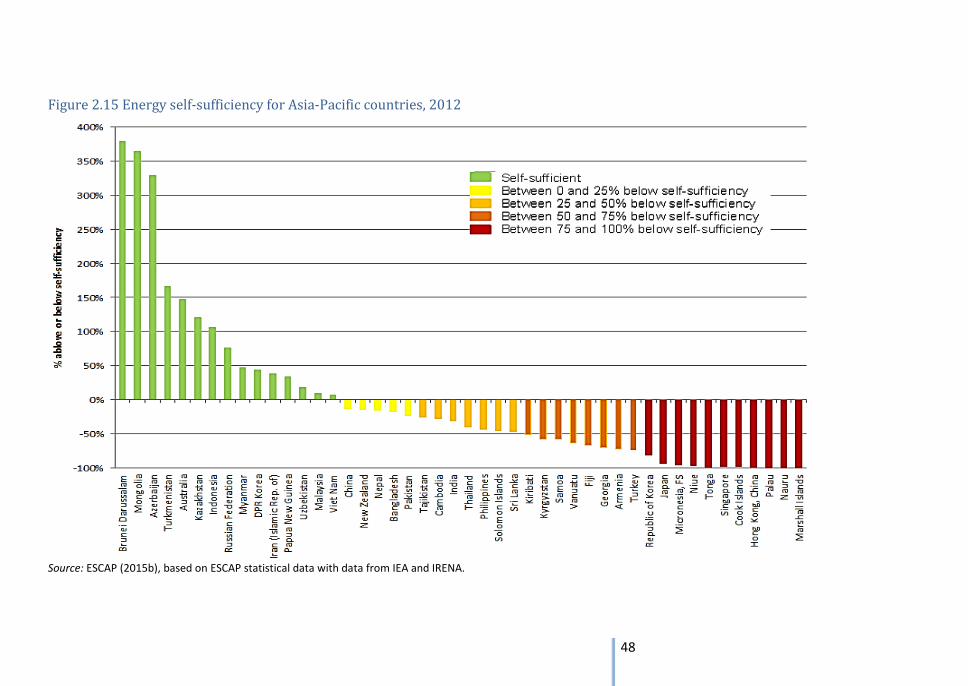
48
Figure 2.15 Energy self-sufficiency for Asia-Pacific countries, 2012
Source: ESCAP (2015b), based on ESCAP statistical data with data from IEA and IRENA.
49
2.5.3 Impact of fluctuating oil prices differentiated
Due to the extraordinary economic growth in recent decades, energy demand for
Asia and the Pacific region has driven up significantly, and it is expected to grow
continuously in the foreseeable future. Fossil fuels have been and will continue to
be the major energy sources in the region, accounting for more than 60 per cent of
the total final energy consumption (ESCAP, 2014). The soaring energy demand,
plus unevenly distributed fossil fuel reserves in this region, makes many
developing countries depend on imported fossil fuels, and therefore expose
themselves to the energy prices volatility in the international market.
By early 2015, international oil prices dramatically declined 47per cent and then
rebounded a bit since February (EIA, 2015). Because of combined consequences
from slowing growth in major economies and steadily declining oil intensity and
expected weak growth in 2015, relatively low oil prices may persist. The overall
impact of falling oil prices will depend on the nature of oil-dependence (oil-
importing or oil-exporting) of economies. ADB estimated that net oil importers in
the region could see an additional 0.5 per cent growth in 2015 GDP if oil prices
remain low (ADB, 2014). The low oil prices also lowered inflation rates and present
opportunities for importers such as Indonesia and India to reform their programs
on fuel subsidy (ADB, 2014). It also provided a good opportunity for high-subsidy
countries to adjust policies on fossil fuels. For oil-exporting countries, such as the
Russian Federation and other Central Asia countries, growth would be negatively
impacted depending on the role of the energy sector in the national economy.
The fluctuating oil prices has significant macroeconomic, financial and policy
implications. It will support activity and reduce inflationary, external and fiscal
pressures in oil-importing countries, but affect oil-exporting countries adversely by
weakening fiscal and external positions and reducing economic activity (World
Bank, 2015). It also provides a significant opportunity to reform energy taxes and
fuel subsidies, as well as reinvigorate reforms to diversify oil-reliant economies.
50
Chapter 3: Integration of Renewable Energy in Electricity Systems
3.1 Key Messages
1. The power generation sector continues to evolve, specifically with regard to
effectively integrating increased shares of renewable energy and variable
renewable energy (VRE) within the electricity mix.
A. Renewable energy shares of electricity production in Asia and the
Pacific increased from 666 TWh in 1990 to 1,869 TWh in 2012,
representing 17 per cent of the 2012 electricity mix within the
region (ESCAP, 2015).
B. VRE shares of electricity production in Asia and the Pacific
increased from less than 38 GWh in 1990 to nearly 164,000 GWh
(164 TWh) in 2012, representing 1.5 per cent of the 2012
electricity mix within the region (ESCAP, 2015).
C. Globally, shares of VRE sources within the electricity mix have
risen from 0.04 per cent of electricity production in 1990 to 2.8 per
cent in 2012 (ESCAP, 2015).
2. The cost-competitiveness of VRE for power generation has reached historic
levels, approaching parity with fossil fuel generation.
A. Solar photovoltaic (solar PV) module prices in 2014 were 75 per
cent lower than their levels at the end of 2009 while wind turbine
prices decreased by nearly a third over the same period (IRENA,
2015).
B. From a purely economic standpoint, the levelized cost of electricity
(LCOE)8 of utility-scale solar PV has been cut in half from 2000 to
2014 (IRENA, 2015).
8 LCOE is a summary measure of the overall competiveness of different generating technologies. Key
inputs to calculating LCOE include capital costs, fuel costs, fixed and variable O&M costs, financing costs, and an assumed utilization rate for each plant type. It should be noted that LCOE does not take into account differences in value of electricity produced from different sources and technologies. For example, electricity derived from renewable sources is valued the same as electricity from coal.
51
C. With all externalities considered, including health and
environmental costs associated with fossil fuel combustion,
renewables become even more attractive.
3. According to the International Energy Agency (IEA), CO2 emissions from the
generation of energy during combustion accounts for approximately 60 per
cent of global emissions (IEA, 2013a). To combat the rise of global emissions,
energy generation from renewable energy, including VRE sources, forms a
strong alternative option.
A. VRE produces far less air pollution than traditional generation. In
fact, the energy payback period for a solar PV panel ranges from as
little as one to four years while wind turbines produce more (clean)
energy than was used in their manufacturing in less than a single
year.
B. As mentioned, when negative externalities are considered, the
case for increased generation from renewable sources from an
economic and social welfare standpoint becomes even stronger.
4. The barriers to capturing and integrating VRE resources are getting lower.
A. If the energy available from solar and wind could be captured at
large scale, annual energy needs could be met within days, or even
hours. However, technology for capturing and storing energy,
stability of distribution systems, capital costs and even physical
space have presented challenges to VRE uptake within the world’s
energy systems. But today, technology is advancing at
unprecedented speeds and costs, particularly for solar PV, and
prices are dropping more rapidly than predicted just a few years
ago.
Externalities such as environmental or social impacts are excluded from the calculation unless otherwise stated.
52
B. Current trends and future outlooks clearly point to continued
expansion of VRE globally and within the Asia-Pacific region;
however, the evolution of the electricity mix will require grids to
advance into smarter and more flexible energy systems that can
efficiently accommodate new intermittent VRE generation
capacity. A number of barriers stand in the way, but these barriers
are lowering.
5. Accelerating VRE integration requires a multifaceted approach, including
development of strong policy frameworks, long-term planning perspectives
in power plant and transmission infrastructure investments, advancement of
grid operations and increased engagement with civil society and the private
sector. Fluctuating oil prices may not heavily impact VRE installation figures
in the near-term as oil accounts for only 4.10 per cent of electricity
production in Asia and the Pacific (ESCAP, 2015). Many policymakers have
made commitments towards achieving established goals of renewable
energy capacity that are less likely to be influenced by short-term
fluctuations in fossil fuel prices.
53
3.2 Introduction
3.2.1 Renewable energy
There are strong and impressive indications of the Asia-Pacific region’s large and
ever-rising interest in renewable energy as a fundamental component of a secure
and sustainable electricity mix. Renewable9 energy encompasses many different
sources of energy derived from natural processes, which are replenished at a
faster rate than they are consumed.10 Examples include energy from biomass,
flowing water (i.e. rivers and the ocean), heat from the Earth’s interior, sunlight
and wind. Whether in the power, building, industry or transport sectors,
renewable energy can be used for electricity generation, heating/cooling and fuel
for mobility. In such ways, renewable energy exists as a viable alternative and
compliment to fossil fuels.
The power generation sector continues to evolve, with increasing support policies
propelling increased renewable energy deployment, which in turn leads to
technological improvements as well as continual cost reductions. Despite this
virtuous cycle, renewable energy deployment and integration is not increasing
rapidly enough to meet the world’s ambitious goals for a truly sustainable power
system (IRENA, 2015).
As of 2012, renewable energy accounted for approximately 17 per cent of
electricity production in the Asia-Pacific region, down slightly from 18 per cent in
1990 (see Figure 3.1). In absolute terms, renewable energy production increased
from 666 TWh in 1990 to 1,869 TWh in 2012. Over this period, however,
generation from VRE sources increased from 38 GWh of electricity production in
1990 to nearly 164,000 GWh (164 TWh) in 2012, accounting for 1.5 per cent of
total electricity production within the region as of 2012. Total electricity
9 The term renewable does not necessarily mean these forms of energy are sustainable, clean or
carbon-neutral over the entire lifecycle, especially in the case of bioenergy and of hydropower. 10
Definition combining those from IRENA, IEA and SE4All.
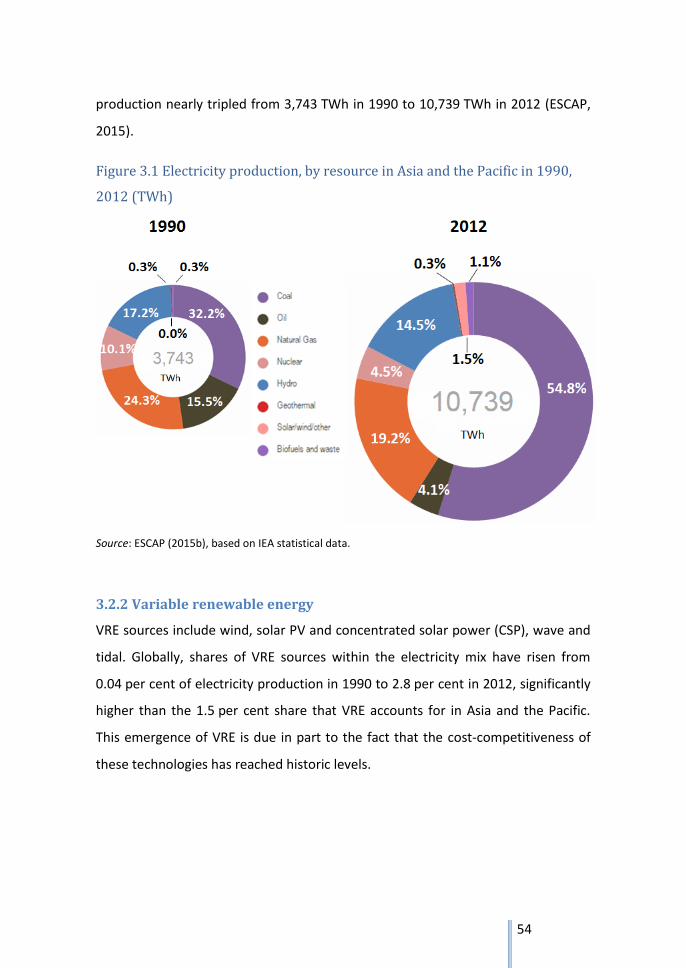
54
production nearly tripled from 3,743 TWh in 1990 to 10,739 TWh in 2012 (ESCAP,
2015).
Figure 3.1 Electricity production, by resource in Asia and the Pacific in 1990,
2012 (TWh)
Source: ESCAP (2015b), based on IEA statistical data.
3.2.2 Variable renewable energy
VRE sources include wind, solar PV and concentrated solar power (CSP), wave and
tidal. Globally, shares of VRE sources within the electricity mix have risen from
0.04 per cent of electricity production in 1990 to 2.8 per cent in 2012, significantly
higher than the 1.5 per cent share that VRE accounts for in Asia and the Pacific.
This emergence of VRE is due in part to the fact that the cost-competitiveness of
these technologies has reached historic levels.
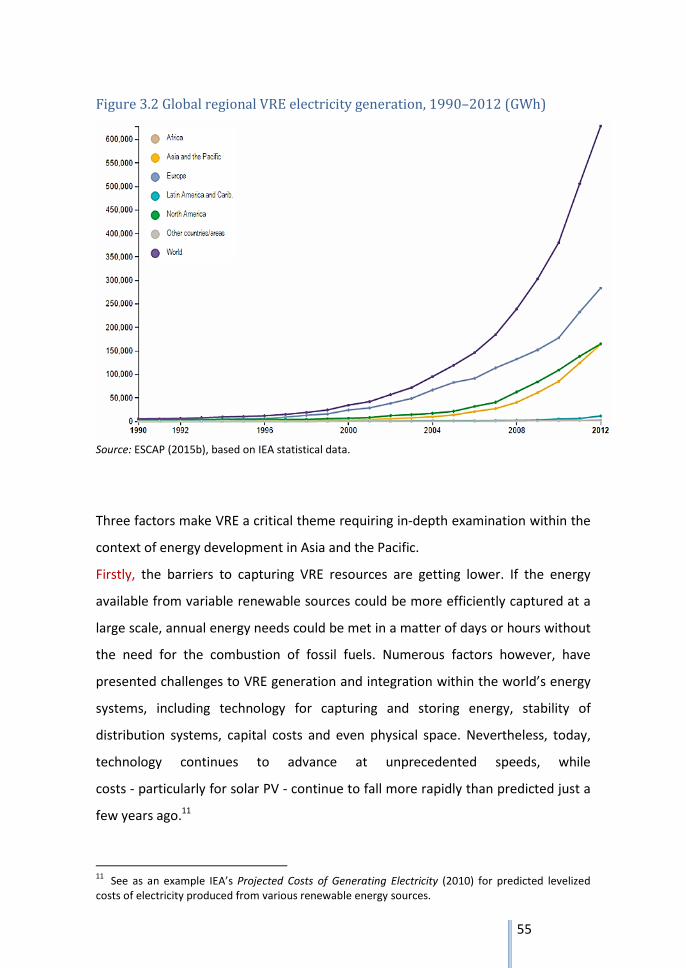
55
Figure 3.2 Global regional VRE electricity generation, 1990–2012 (GWh)
Source: ESCAP (2015b), based on IEA statistical data.
Three factors make VRE a critical theme requiring in-depth examination within the
context of energy development in Asia and the Pacific.
Firstly, the barriers to capturing VRE resources are getting lower. If the energy
available from variable renewable sources could be more efficiently captured at a
large scale, annual energy needs could be met in a matter of days or hours without
the need for the combustion of fossil fuels. Numerous factors however, have
presented challenges to VRE generation and integration within the world’s energy
systems, including technology for capturing and storing energy, stability of
distribution systems, capital costs and even physical space. Nevertheless, today,
technology continues to advance at unprecedented speeds, while
costs - particularly for solar PV - continue to fall more rapidly than predicted just a
few years ago.11
11
See as an example IEA’s Projected Costs of Generating Electricity (2010) for predicted levelized costs of electricity produced from various renewable energy sources.
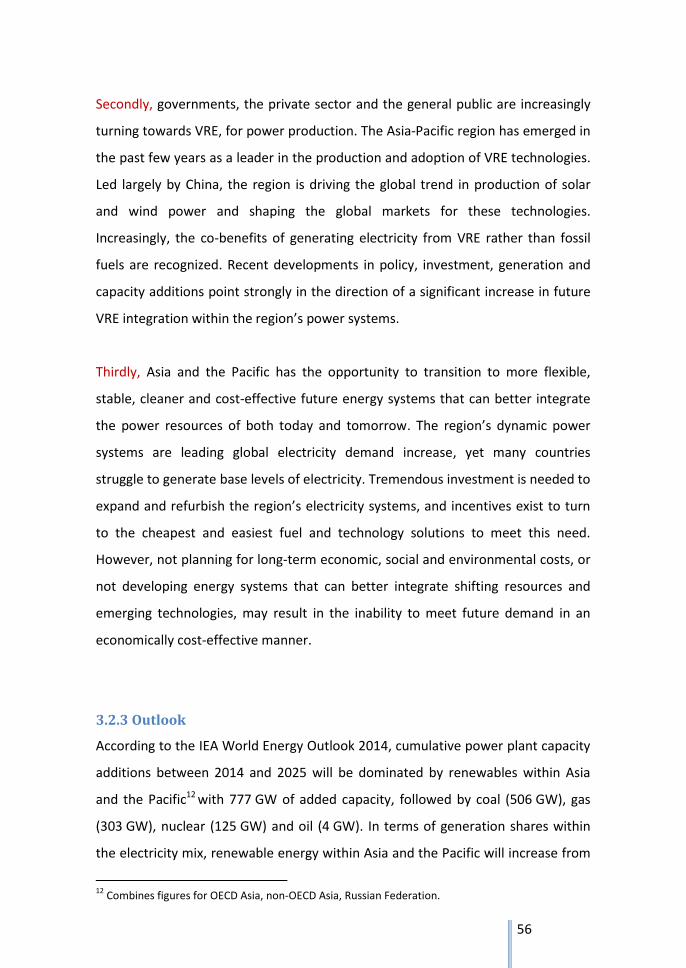
56
Secondly, governments, the private sector and the general public are increasingly
turning towards VRE, for power production. The Asia-Pacific region has emerged in
the past few years as a leader in the production and adoption of VRE technologies.
Led largely by China, the region is driving the global trend in production of solar
and wind power and shaping the global markets for these technologies.
Increasingly, the co-benefits of generating electricity from VRE rather than fossil
fuels are recognized. Recent developments in policy, investment, generation and
capacity additions point strongly in the direction of a significant increase in future
VRE integration within the region’s power systems.
Thirdly, Asia and the Pacific has the opportunity to transition to more flexible,
stable, cleaner and cost-effective future energy systems that can better integrate
the power resources of both today and tomorrow. The region’s dynamic power
systems are leading global electricity demand increase, yet many countries
struggle to generate base levels of electricity. Tremendous investment is needed to
expand and refurbish the region’s electricity systems, and incentives exist to turn
to the cheapest and easiest fuel and technology solutions to meet this need.
However, not planning for long-term economic, social and environmental costs, or
not developing energy systems that can better integrate shifting resources and
emerging technologies, may result in the inability to meet future demand in an
economically cost-effective manner.
3.2.3 Outlook
According to the IEA World Energy Outlook 2014, cumulative power plant capacity
additions between 2014 and 2025 will be dominated by renewables within Asia
and the Pacific12 with 777 GW of added capacity, followed by coal (506 GW), gas
(303 GW), nuclear (125 GW) and oil (4 GW). In terms of generation shares within
the electricity mix, renewable energy within Asia and the Pacific will increase from
12
Combines figures for OECD Asia, non-OECD Asia, Russian Federation.
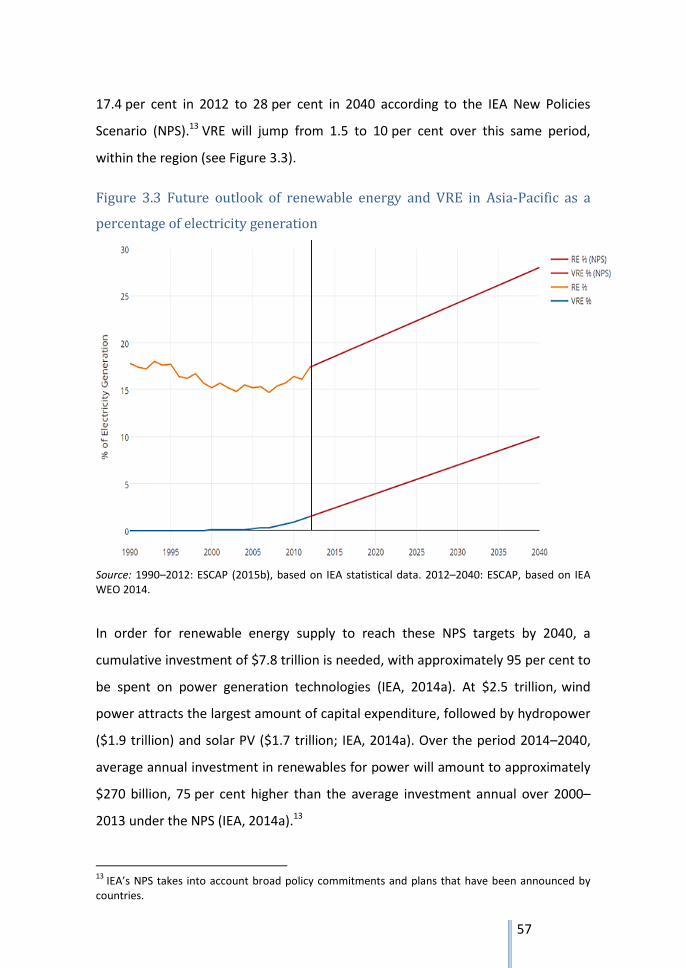
57
17.4 per cent in 2012 to 28 per cent in 2040 according to the IEA New Policies
Scenario (NPS).13 VRE will jump from 1.5 to 10 per cent over this same period,
within the region (see Figure 3.3).
Figure 3.3 Future outlook of renewable energy and VRE in Asia-Pacific as a
percentage of electricity generation
Source: 1990–2012: ESCAP (2015b), based on IEA statistical data. 2012–2040: ESCAP, based on IEA WEO 2014.
In order for renewable energy supply to reach these NPS targets by 2040, a
cumulative investment of $7.8 trillion is needed, with approximately 95 per cent to
be spent on power generation technologies (IEA, 2014a). At $2.5 trillion, wind
power attracts the largest amount of capital expenditure, followed by hydropower
($1.9 trillion) and solar PV ($1.7 trillion; IEA, 2014a). Over the period 2014–2040,
average annual investment in renewables for power will amount to approximately
$270 billion, 75 per cent higher than the average investment annual over 2000–
2013 under the NPS (IEA, 2014a).13
13
IEA’s NPS takes into account broad policy commitments and plans that have been announced by countries.
58
3.3 Why Variable Renewable Energy
3.3.1 Economics — VRE has become cheaper
On a purely economic basis, VRE is becoming competitive with conventional fossil
fuel generation with further decreases in price coming from reduced balance of
system (BoS)14 costs. The LCOE of utility-scale solar PV has been cut in half from
2000 to 2014 (IRENA, 2015). LCOE is one measure of overall competitiveness used
to compare electricity generation costs across various sources, and will be used in
the economics section of this chapter to illustrate the cost-competitiveness of VRE.
Key inputs to calculating LCOE include capital costs, fuel costs, fixed and variable
operations and maintenance (O&M) costs, financing costs and an assumed
utilization rate for each plant type. These various factors, when considered,
illustrate the cost-competitiveness of VRE, even without considering externalities
such as health and environmental costs associated with the burning of fossil fuels
for power generation.
3.3.2 Externalities — Avoided health and environmental costs contribute
to VRE attractiveness
According to the IEA (2013a), CO2 emissions from the generation of energy during
combustion accounts for approximately 60 per cent of global emissions. In this
regard, two topics addressed at the APEF Policy Dialogue 2014 include the
promotion of HELE coal-fired power generation and VRE power generation as part
of a flexible and secure power grid that will allow for more efficient and
sustainable power generation.
VRE produces far less air pollution than traditional generation. In fact, the energy
payback period for a solar PV panel ranges from as little as one to four years while
wind turbines produce more (clean) energy than was used in their manufacturing
in less than a single year. When these externalities are considered, the case for
14
The BOS encompasses all components of a PV system other than the PV panels. This includes wiring, switches, amounting system, one or many solar inverters, a battery bank and battery charger. For ground-mount systems, land is sometimes included as part of the BOS as well.
59
increased generation from renewable sources from an economic and social
welfare standpoint becomes even stronger.
3.3.3 Technical aspects - Innovations continue to accelerate VRE
implementation
VRE boasts quicker deployment than large hydropower projects as they can take
years or even decades to commission. By comparison, wind projects can be sited
and erected in as little as two to three years. Utility-scale PV solar projects can be
constructed in as less as 6 months, and distributed PV systems can be added to
rooftops in a day or less. Solar and wind resources are also more readily available
on a wider geographic scale and may have less environmental impacts than
hydropower projects. In short, these VRE technologies are poised to make an
immediate impact on energy supply and access in the developing world
(Climatescope, 2014).
More advanced forecasting technology has made maintaining grid stability more
feasible. Load forecasting techniques are very mature, typically with a mean
absolute error of 1 to 2 per cent a day ahead. However, while load forecasting is
usually highly accurate, there remains a residual amount of unpredictable
fluctuation in real-time demand. Where load is particularly sensitive to weather
conditions due to electricity demand for electric heating and air conditioning, load
uncertainty can also be considerable. The quality of forecasts has seen important
improvements over recent years (IEA, 2014d).
Distributed solar PV can provide electricity to those who lack access to the grid
(where grid extension remains unfeasible). However, these distributed systems
require upfront capital investments that act as a barrier to widespread adoption.
Storage solutions are also cost-prohibitive, but diesel or liquefied natural gas could
be used during periods of low or absent solar irradiance. Distributed solar PV
systems may be a more cost-effective solution than diesel generation for many,
especially when considering LCOE.
60
VRE component costs have fallen as efficiency has increased. Solar PV module
prices in 2014 were 75 per cent lower than their levels at the end of 2009, while
the total installed costs of utility-scale PV systems have fallen by between 29 and
65 per cent between 2010 and 2014 depending on the region (IRENA, 2015).
Renewable power generation technologies are now competing head-to-head with
fossil fuel-fired electricity generation options and falling generation costs will be
discussed further in the following Economics section.
61
3.4 Economics
3.4.1 LCOE calculations - A measure to compare costs between power
generation technologies
The LCOE15 of solar PV has been cut in half between 2010 and 2014 (IRENA, 2015),
so that solar PV is increasingly competitive at the utility scale. Installed costs for
onshore wind power, solar PV and concentrating solar power (CSP) have continued
to fall, while their performance has improved. Biomass for power, geothermal and
hydropower have provided low-cost electricity – where untapped economic
resources exist – for many years. The most cost-effective utility-scale solar PV
projects are currently capable of delivering electricity for just $0.08 per kilowatt-
hour (kWh) without financial support, compared with a range of $0.045 to
$0.14/kWh for fossil fuel power. Onshore wind is now one of the most competitive
sources of electricity available. Technology improvements, occurring at the same
time as installed costs have continued to decline, mean that the LCOE of onshore
wind is now within the same cost range, or even lower, than for fossil fuels. The
best wind projects around the world are consistently delivering electricity for
$0.05/kWh without financial support (IRENA, 2015).
Regional weighted average costs of electricity from biomass for power, geothermal,
hydropower and onshore wind are all now in the range, or even span a lower
range, than estimated fossil fuel-fired electricity generation costs. Because of
striking LCOE reductions, solar PV costs also increasingly fall within that range.
15
In this report, all LCOE results are calculated using a fixed assumption of a cost of capital of 7.5 per cent real in OECD countries and China, and 10 per cent in the rest of the world unless explicitly mentioned.
62
Figure 3.4 Weighted average cost of electricity by region for utility-scale
renewable technologies, compared with fossil fuel power generation costs,
2013/2014
Source: IRENA (2015), renewable power generation costs in 2014.
As seen in Figure 3.4, renewable energy generation costs have fallen, becoming
competitive with conventional thermal generation even without considering the
negative externalities associated with fossil-fuel combustion. Within Asia,
weighted average costs of generating on- and off-shore wind have become
especially competitive, with solar PV continuing to improve as solar cell efficiencies
increase and equipment and BoS costs decline. In the following section
externalities will be considered, including the higher integration costs associated
with VRE, and how avoided health and environmental costs may offset these costs.
It should be noted that when considering which sources of electricity generation to
pursue, countries must take into account their unique situations and resources,
63
including solar insolation, wind availability, regulatory framework, composition
and flexibility of their grid, and geographic balancing areas. There is no one size fits
all approach to effective VRE integration; however, when integrating higher shares
of VRE, grid systems as a whole must be examined and VRE should be seen as one
piece of a dynamic and flexible grid puzzle.
Box 3.1 Examples from the region: China, India
Besides falling LCOEs, represented in $/kWh as an average of lifetime generation
costs, renewable energy average installed costs ($/kW) are also decreasing. These
installed costs ($/kW) are typically lower in China and India than in the rest of the
world. In China and India, average installed costs for biomass for power,
hydropower and onshore wind average between $1,240 and $1,390/kW, according
to IRENA. Remarkably, given that module costs alone averaged $2,646/kW in the
fourth quarter of 2009, average installed costs for large-scale solar PV have fallen
dramatically in China and India, to around $1,670/kW in 2013 and 2014 (see Annex
Figure 3.7).
Source: IRENA (2015).
64
3.5 Externalities
According to the IEA (2013a), CO2 emissions from the generation of energy during
combustion accounts for approximately 60 per cent of global emissions. To combat
the rise of global emissions, energy generation from renewable, as well as VRE
sources, including wind and solar, form a strong alternative option.
According to the National Renewable Energy Laboratory (NREL), a national
laboratory of the United States Department of Energy, the energy payback period
for solar panels ranges from one to four years. Over a projected 28-year lifetime of
clean energy production, a rooftop system with a two-year energy payback and
meeting half of a household’s electricity use (total household use averaged at
830 kWh per month for United States households) would avoid conventional
generation emissions of more than half a ton of sulfur dioxide (SOx), one-third a
ton of nitrogen oxides (NOx) and 100 tons of CO2 (NREL, 2004).16
As seen in Figure 3.5, when factoring in externalities including health and CO2 costs
associated with the burning of fossil fuels, as well as integration costs of VRE (at
40 per cent penetration), VRE remains cost competitive with generation from
traditional fossil fuels.
This may be especially noteworthy in Asia and the Pacific as the region’s dynamic
grids are continuously integrating increased electricity generation, from 3,743 TWh
in 1990 to 10,739 TWh in 2012, as noted in the Introduction. In order to mitigate
future costs associated with health and environmental issues stemming from fossil
fuel combustion, cleaner sources of energy – such as solar and wind – should be
implemented to meet this increased electricity demand. As of 2012, only
approximately 1.5 per cent of the region’s electricity was generated by variable
renewable sources, while coal alone accounted for 54.8 per cent, illustrating the
vast room for improvement. At 40 per cent penetration of VRE, the increased costs
16
Conversion factor: 1 ton = 0.907 MT
65
associated with integrating intermittent generation sources can be overcome and
must be considered in tandem with the costs of environmental externalities from
the burning of fossil fuels.
Figure 3.5 The LCOE of variable renewables and fossil fuels, including grid
integration costs (at 40 per cent variable renewable penetration) and external
health and CO2 costs
Source: IRENA (2015).
66
3.6 Technical Aspects That Have Led to Increased Integration
of Variable Renewable Energy
3.6.1 Larger balancing areas
Firstly, by covering a large geographic area, variations from different VRE plants
cancel out and the overall generation profile is smoother. Ideally the footprint will
not be exposed to the same weather system at any point in time. Secondly,
forecasting techniques are more accurate if a larger number of power plants are
forecasted and they are not concentrated in one location. This means that the
system will need relatively fewer reserves to guarantee the same level of reliability.
However, these benefits will only materialize if the system is operated in the
appropriate way. Whatever the source of electricity, whatever resources exist to
balance supply and demand, the sub-area of the power market over which balance
is maintained in real time (the balancing area) is central to the challenge.
Balancing areas are defined to a large extent by the historical development of the
grid (often originally unconnected parts), and by the distinct utilities and
institutions that drove that development and have subsequently endured.
Protocols will exist to govern the flow of electricity across these boundaries, and
long-term collaboration may exist, but not necessarily ones that allow for
interchanges of electricity inside the balancing timeframe. Coupled with
congestion in (weaker) border areas, this will hinder shared balancing activities.
Cooperation between balancing areas can significantly reduce the operational
costs of power systems. The benefits of larger balancing areas tend to be more
pronounced when VRE is part of the generation portfolio (IRENA, 2015).
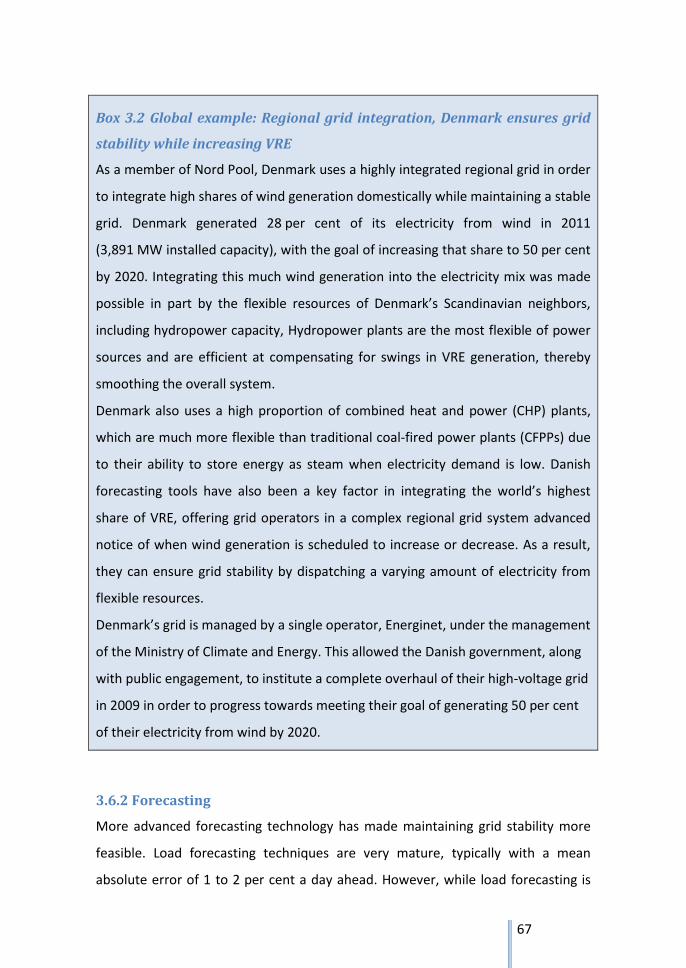
67
Box 3.2 Global example: Regional grid integration, Denmark ensures grid
stability while increasing VRE
As a member of Nord Pool, Denmark uses a highly integrated regional grid in order
to integrate high shares of wind generation domestically while maintaining a stable
grid. Denmark generated 28 per cent of its electricity from wind in 2011
(3,891 MW installed capacity), with the goal of increasing that share to 50 per cent
by 2020. Integrating this much wind generation into the electricity mix was made
possible in part by the flexible resources of Denmark’s Scandinavian neighbors,
including hydropower capacity, Hydropower plants are the most flexible of power
sources and are efficient at compensating for swings in VRE generation, thereby
smoothing the overall system.
Denmark also uses a high proportion of combined heat and power (CHP) plants,
which are much more flexible than traditional coal-fired power plants (CFPPs) due
to their ability to store energy as steam when electricity demand is low. Danish
forecasting tools have also been a key factor in integrating the world’s highest
share of VRE, offering grid operators in a complex regional grid system advanced
notice of when wind generation is scheduled to increase or decrease. As a result,
they can ensure grid stability by dispatching a varying amount of electricity from
flexible resources.
Denmark’s grid is managed by a single operator, Energinet, under the management
of the Ministry of Climate and Energy. This allowed the Danish government, along
with public engagement, to institute a complete overhaul of their high-voltage grid
in 2009 in order to progress towards meeting their goal of generating 50 per cent
of their electricity from wind by 2020.
3.6.2 Forecasting
More advanced forecasting technology has made maintaining grid stability more
feasible. Load forecasting techniques are very mature, typically with a mean
absolute error of 1 to 2 per cent a day ahead. However, while load forecasting is
68
usually highly accurate, there remains a residual amount of unpredictable
fluctuation in real-time demand. Where load is particularly sensitive to weather
conditions due to electricity demand for electric heating and air conditioning, load
uncertainty can also be considerable. The quality of forecasts has seen important
improvements over recent years. For example, the mean absolute forecast error in
Spain has been significantly reduced during the past five years, as a consequence
of methodological improvements, but also of increased observability of VRE. Short-
term forecasts (i.e. looking ahead one to three hours) show only half the forecast
error that was observed four years ago. Day-ahead forecast errors have been
reduced by one-third. Hour-ahead forecasts are approximately three times as
accurate as day-ahead forecasts. This has important implications for integration
strategies. Moving operational decisions closer to real-time makes planning
decisions much more accurate. Solar PV power forecasts are less mature than
wind power forecasts. Given clear skies, solar PV power output can be predicted
with very high accuracy, because the output is determined by the position of the
sun, which is easy to calculate. However, snow coverage and fog can lead to rare
but high forecast errors. Increasing VRE deployment tends to lead to increased
reserve requirements, because the risk of forecast errors increases. However, the
exact definition of reserves, the way they are calculated, how they are procured
and what technologies are allowed to provide them, all have an influence on the
overall significance of VRE’s effects on reserve requirements. Avoiding allocation of
unnecessary reserve is cost-effective and can be an important factor for successful
integration of VRE at higher penetration levels. If reserve requirements are based
on hourly forecast errors, increases in reserve requirements are significantly
smaller than if based on four-hour forecast errors (IEA, 2014d).
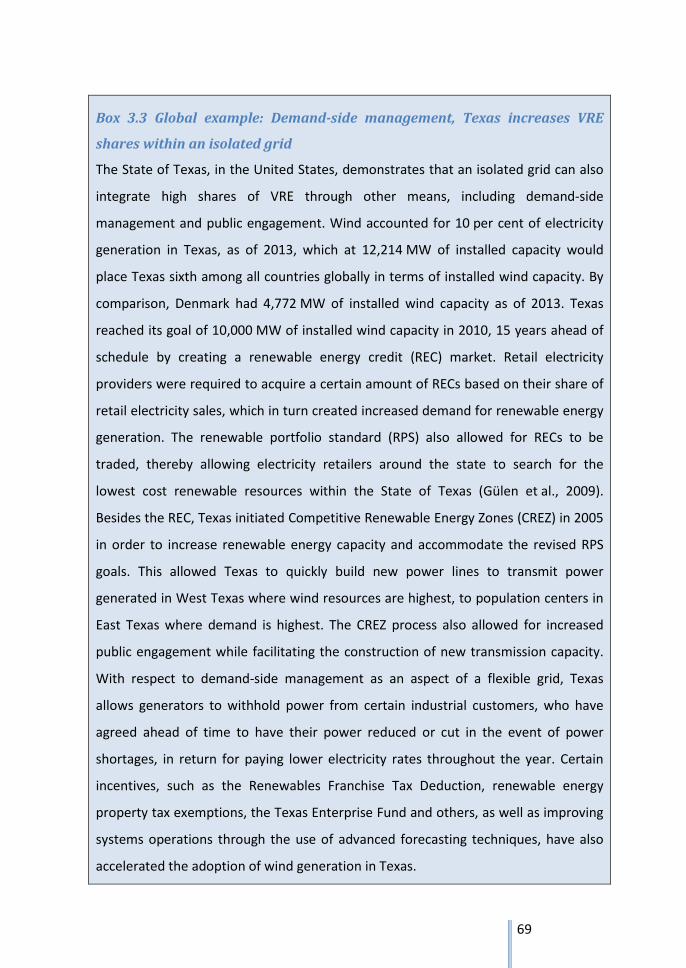
69
Box 3.3 Global example: Demand-side management, Texas increases VRE
shares within an isolated grid
The State of Texas, in the United States, demonstrates that an isolated grid can also
integrate high shares of VRE through other means, including demand-side
management and public engagement. Wind accounted for 10 per cent of electricity
generation in Texas, as of 2013, which at 12,214 MW of installed capacity would
place Texas sixth among all countries globally in terms of installed wind capacity. By
comparison, Denmark had 4,772 MW of installed wind capacity as of 2013. Texas
reached its goal of 10,000 MW of installed wind capacity in 2010, 15 years ahead of
schedule by creating a renewable energy credit (REC) market. Retail electricity
providers were required to acquire a certain amount of RECs based on their share of
retail electricity sales, which in turn created increased demand for renewable energy
generation. The renewable portfolio standard (RPS) also allowed for RECs to be
traded, thereby allowing electricity retailers around the state to search for the
lowest cost renewable resources within the State of Texas (Gülen et al., 2009).
Besides the REC, Texas initiated Competitive Renewable Energy Zones (CREZ) in 2005
in order to increase renewable energy capacity and accommodate the revised RPS
goals. This allowed Texas to quickly build new power lines to transmit power
generated in West Texas where wind resources are highest, to population centers in
East Texas where demand is highest. The CREZ process also allowed for increased
public engagement while facilitating the construction of new transmission capacity.
With respect to demand-side management as an aspect of a flexible grid, Texas
allows generators to withhold power from certain industrial customers, who have
agreed ahead of time to have their power reduced or cut in the event of power
shortages, in return for paying lower electricity rates throughout the year. Certain
incentives, such as the Renewables Franchise Tax Deduction, renewable energy
property tax exemptions, the Texas Enterprise Fund and others, as well as improving
systems operations through the use of advanced forecasting techniques, have also
accelerated the adoption of wind generation in Texas.
70
3.6.3 Falling price trends
The energy sector is currently undergoing a transformation that represents the
beginning of the transition to the renewables-dominated, truly sustainable power
sector required to avoid the most serious effects of climate change. The
transformation of the energy sector is most evident in the power sector, where
renewables are now estimated to have added around half or more of global new
capacity required every year from 2010 to 2014. Annual renewable energy
capacity additions have risen sixfold between 2001 and 2013, to reach around
120 GW annually, with over 100 GW added every year between 2011 and 2013
(IRENA, 2015).
Solar PV has become much more cost-competitive with other generation
technologies in the past few years. Solar PV module prices in 2014 were 75 per
cent lower than their levels at the end of 2009, while wind turbine costs have
fallen by a third over the same period. The total installed costs of utility-scale PV
systems have fallen by between 29 per cent and 65 per cent between 2010 and
2014 depending on the region. As module prices have fallen, cumulative
installations have risen from less than 1 GW in 2000 to over approximately 180 GW
by the end of 2014 (IRENA, 2015).17 Despite the declines in equipment costs in
recent years, solar PV and wind remain the technologies with the largest remaining
cost reduction potential (IRENA, 2015). In order to witness these reductions, non-
equipment factors such as balance-of-system, O&M, and finance costs must be
continuously reduced as implementation becomes more widespread.
17
Installation figures for end of 2014 are approximate
71
Figure 3.6 Solar PV and oil trends
Source: ESCAP, based on EIA (Brent oil spot average), IRENA (2015), Renewable Power Generation Costs in 2014 data.
Solar PV module prices have stabilized in recent years as production has become
more mature and the costs of raw materials, including polysilicon, have stabilized.
The cost per barrel of oil shows little correlation with solar PV generation capacity,
which has climbed steadily over the past decade. As mentioned in Chapter 2, oil
accounts for only 4.10 per cent of electricity production in Asia and the Pacific.
While oil prices remain difficult to predict based on a number of variables, the cost
of generating electricity from variable renewable sources is unlikely to rise as BoS
costs continue to fall while module and turbine efficiencies show potential to
increase. As VRE generation lacks an input fuel besides sunlight and wind, it can be
used to smooth future generation cost variability caused by the fluctuating fuel
costs of oil and coal.
72
Box 3.4 Examples from the region: The Pacific
Renewable energy is not a new concept in the Pacific with the first Fiji hydropower
project constructed in 1979, coinciding with steep increases in fossil fuel prices.
One relevant aspect to note is that investment in solar power generation generally
has weak correlation with fluctuating fuel prices, meaning the recent decreases in
price may not have a large impact on the region in terms of VRE implementation.
Renewable energy and the affordability of energy services are often part of key
messages in election campaigns within the Pacific region and will continue to be a
focus despite low oil prices.
The Pacific region is committed to supporting global efforts to reduce greenhouse
gas (GHG) emissions and cannot afford to be at the frontline of countries that are
most vulnerable to the impacts of climate change, while at the same time doing
nothing to substantially increase its use of feasible renewable energy and energy-
efficiency technologies. Pacific Island governments could raise revenue during
times of falling fuel prices, by not passing on the full decrease, and use the revenue
generated to invest in renewable energy and energy efficiency, and thereby
address climate change challenges. Incremental moves are currently being made
within the energy sector and these current oil price fluctuations are not likely to
change the perception of policy makers.
2014 Policy Dialogue on Energy for Sustainable Development in Asia and the Pacific, 26–28 November 2014, Bangkok, Thailand. Mr. Solomone Fifita, Deputy Director, Secretariat of the Pacific Community, Suva. (Summary Record)
3.6.4 Distributed solar PV
Cleaner energy as a distributed source of power is often the obvious choice over
extending traditional hub-and-spoke transmission networks or local diesel
generators (Climatescope, 2014). Renewable power generation technologies are
now the economic solution for isolated off-grid and small-scale electricity systems,
such as on islands that are reliant on diesel-fired generation.
73
The volatility of oil prices and the high costs of small-scale diesel-fired electricity
generation are further exacerbated in remote locations, where poor, or even non-
existent, infrastructure can mean that transport costs increase the cost of diesel by
10 to 100 per cent compared with prices in major cities. For islands or other
markets facing comparable energy challenges, the recent decline in the LCOE of
renewable power generation technologies represents a historic development.
For many of the over 1.3 billion people worldwide who currently lack electricity
access, renewable energy can provide their first introduction to modern energy
services, largely through decentralized off-grid and mini-grid solutions. Moreover,
this crucial transformation can be justified on purely economic grounds, without
considering externalities such as air pollution and climate change (IRENA, 2015).
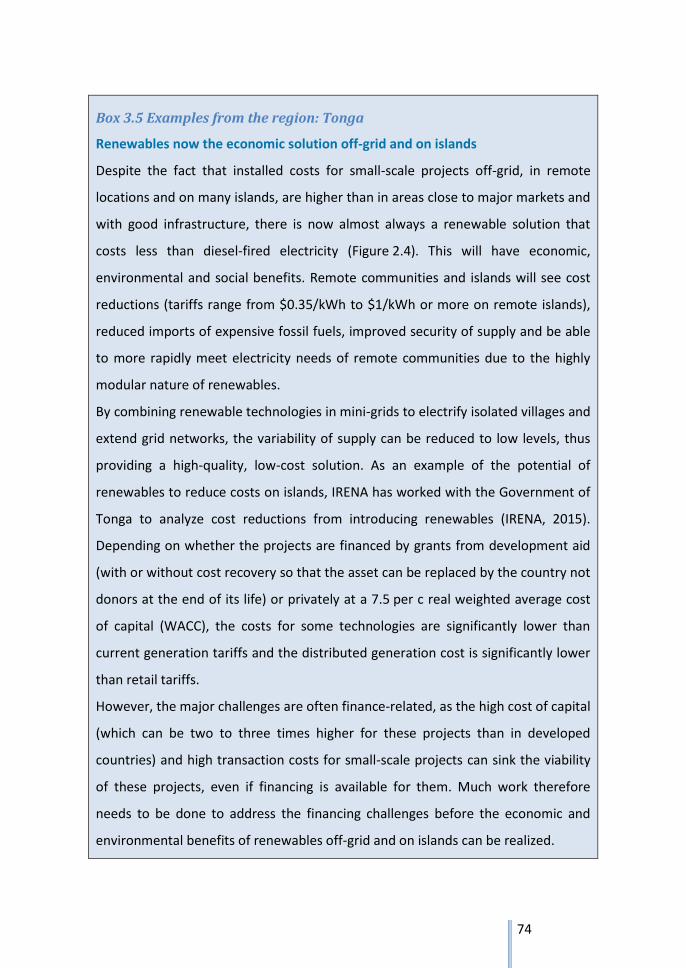
74
Box 3.5 Examples from the region: Tonga
Renewables now the economic solution off-grid and on islands
Despite the fact that installed costs for small-scale projects off-grid, in remote
locations and on many islands, are higher than in areas close to major markets and
with good infrastructure, there is now almost always a renewable solution that
costs less than diesel-fired electricity (Figure 2.4). This will have economic,
environmental and social benefits. Remote communities and islands will see cost
reductions (tariffs range from $0.35/kWh to $1/kWh or more on remote islands),
reduced imports of expensive fossil fuels, improved security of supply and be able
to more rapidly meet electricity needs of remote communities due to the highly
modular nature of renewables.
By combining renewable technologies in mini-grids to electrify isolated villages and
extend grid networks, the variability of supply can be reduced to low levels, thus
providing a high-quality, low-cost solution. As an example of the potential of
renewables to reduce costs on islands, IRENA has worked with the Government of
Tonga to analyze cost reductions from introducing renewables (IRENA, 2015).
Depending on whether the projects are financed by grants from development aid
(with or without cost recovery so that the asset can be replaced by the country not
donors at the end of its life) or privately at a 7.5 per c real weighted average cost
of capital (WACC), the costs for some technologies are significantly lower than
current generation tariffs and the distributed generation cost is significantly lower
than retail tariffs.
However, the major challenges are often finance-related, as the high cost of capital
(which can be two to three times higher for these projects than in developed
countries) and high transaction costs for small-scale projects can sink the viability
of these projects, even if financing is available for them. Much work therefore
needs to be done to address the financing challenges before the economic and
environmental benefits of renewables off-grid and on islands can be realized.
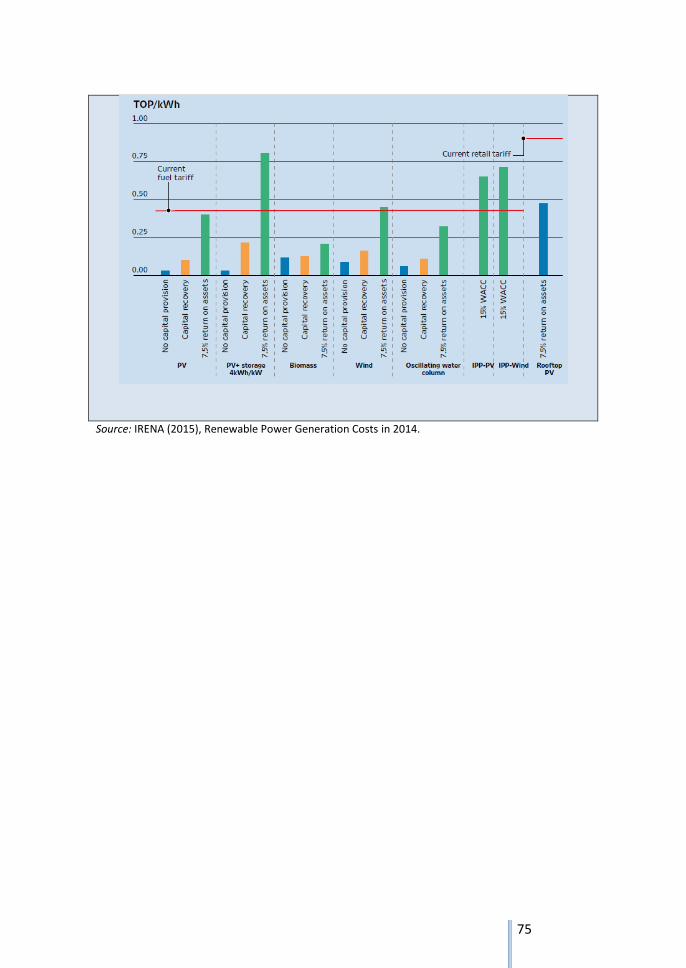
75
Source: IRENA (2015), Renewable Power Generation Costs in 2014.

76
3.7 Summary
3.7.1 Lowering barriers to VRE integration
When analyzing current trends and future outlooks, the continued expansion of
VRE globally and within the Asia-Pacific region remains highly likely. This continued
expansion of VRE integration within an evolving power sector will require,
however, that grids advance into smarter and more flexible energy systems that
can efficiently accommodate new VRE generation capacity. A number of barriers
remain that may continue to inhibit increased VRE implementation, yet these
barriers continue to lower.
VRE electricity generation is considered expensive. However, with the continuing
trend of falling technology prices, investment costs are rapidly decreasing for solar
PV and wind power. When considering the LCOE,18 which represents the per-kWh
cost (in real dollars) of building and operating a power-generating plant over an
assumed financial life and duty cycle, utility-scale solar and wind are already
competing with fossil fuels. Prices are expected to continue to fall in the coming
decades (IEA, 2014b), and therefore investment cost considerations can be
expected to be eliminated as a significant obstacle.
Grid instability is another commonly cited barrier to VRE integration. However,
recent experience in Germany and Denmark suggest that high levels of grid
stability with increased shares of VRE are possible. In 2010 and 2011, these
countries, behind only Luxembourg, boasted the lowest rates of system
disruption19 – 15.91 and 14.75 minutes per year, respectively – while integrating
some of the highest shares of VRE electricity generation in the EU at 12 and 20 per
cent (CEER, 2014). Enabling this are a number of other factors, including advanced
weather (wind and sun) forecasting, generation spread over a large geographical
18
One measure used to compare electricity generation costs across various sources. 19
Ranked according to the System Average Interruption Duration Index (SAIDI), which includes the sum of all customer interruption durations per total number of customers served.
77
area, large system balancing areas achieved through the use of international
power markets and the use of advanced transmission system operators.
As more advanced grid technologies are adopted through Asia and the Pacific, and
as power grids become more integrated, the ability to maintain stable grids while
upping the share of VRE will increase. Still, cost-effective integration of VRE will
require long-term planning and a system-wide transformation. Typically, four
specific flexibility considerations are needed when integrating VRE, including
flexible power plants, electricity storage, grid infrastructure and demand-side
management. Each country may possess diverse challenges when integrating
increased shares of VRE, and there is no ‘one-size-fits-all’ approach, but rather a
slate of options to achieve meaningful energy transformation. Simply adding VRE
generation into an inflexible grid without addressing the impacts on the system as
a whole may substantially increase electricity prices while reducing grid stability.
Box 3.6 Examples from the region: China
Increasing grid stability can be addressed in various ways. In China, emerging
innovation in energy storage solutions including pairing electric vehicles with smart
grid operations and new energy development may be one option in the future.
This comprehensive approach enables storage of VRE power, while reducing GHG
emissions and improving local air quality. There are nearly six million vehicles in
Beijing with 10 million expected by 2030. If 50 per cent of these vehicles are
electric, the five million vehicles would theoretically help stabilize Beijing’s grid
even with high rates of VRE integration. Two-way charging of electric vehicles in
solar-powered homes (vehicle-to-home) could be just the first step towards a
dynamic vehicle-to-grid power system.
Source: 2014 Policy Dialogue on Energy for Sustainable Development in Asia and the Pacific, 26–28 November 2014, Bangkok, Thailand. Mr. Zhongying Wang, Deputy Director General, Energy Research Institute of WDRC, Beijing (Summary Record). Additional sources referenced by speaker: Beijing Statistical Information, 2015.
78
Accelerating VRE Integration
Accelerating VRE integration requires a multifaceted approach, including
development of strong policy frameworks, long-term planning perspectives in
power plant and transmission infrastructure investments, advancement of grid
operations and increased engagement with civil society and the private sector.
Strong, Consistent and Balanced Policy Frameworks
Although capital costs for VRE technology are falling along with the need for high-
cost subsidies, lacking, complicated or even conflicting policies create
unpredictable and unattractive investment environments, and can lead to
unintended and potentially unfavorable outcomes for VRE integration. The
national policy framework provides the underpinnings for successful integration,
and its level of comprehensiveness, alignment with national context and pairing
with concrete measures to promote VRE will largely determine the ability to
advance the use of VRE within power systems.
Asia and the Pacific as a region is clearly moving forward on the development of
VRE, and ESCAP member States continue to adopt a variety of policies to promote
renewable energy grid integration. Incentives to encourage investment have been
introduced in several countries, such as tax deductions, feed-in-tariffs, funding
mechanisms and publicly sponsored research and development. Steps towards
removal of non-economic barriers are also evident, including coordinated and
expedited permitting and grid connection procedures. Clearly, lessons in VRE
integration can already be shared. However, experience in the region also points
to the significant need for the further development of comprehensive policy
frameworks and enabling environments that can support ambitious targets being
set. Furthermore, investment in the expansion and reinforcement of transmission
infrastructure and advanced grid operations is required to connect generation
79
sources, which may be located in areas with little population, to demand centres
that may be located across vast geographical distances or across international
borders. At the same time, disincentivizing polluting and carbon-intensive power
generation could boost VRE development while reducing a number of social,
economic and environmental costs.
Grid Flexibility for Stability and Cost Control
When integrating a diverse set of resources and significant shares of VRE, grid
flexibility is fundamental for maintaining system stability, enabling increased
market competition and controlling electricity prices. Achieving high levels of
flexibility requires a combination of strategies and policies. Comprehensive system
planning is needed along with optimization of power system features. The use of
integrated power markets supports system flexibility and can provide a large
geographic balancing area. Keys to this include the removal of cross-border tariffs,
as well as congestion management through the use of a system operator, which
acts as the interface between energy producers and consumers, operating and
expanding the power transmission grids or balancing frequency and voltage to
allow electricity to flow more freely and efficient (Cochran et al., 2012). For
isolated markets, the use of demand resources, such as demand response used
during net load events (i.e. when power is reduced to industrial customers per pre-
arranged agreements – see Texas case study, Box 3.3), can enable grid balancing
while integrating VRE. For all systems, the integration of advanced forecasting
systems reduces the impact of renewable energy variability to improve system
reliability.
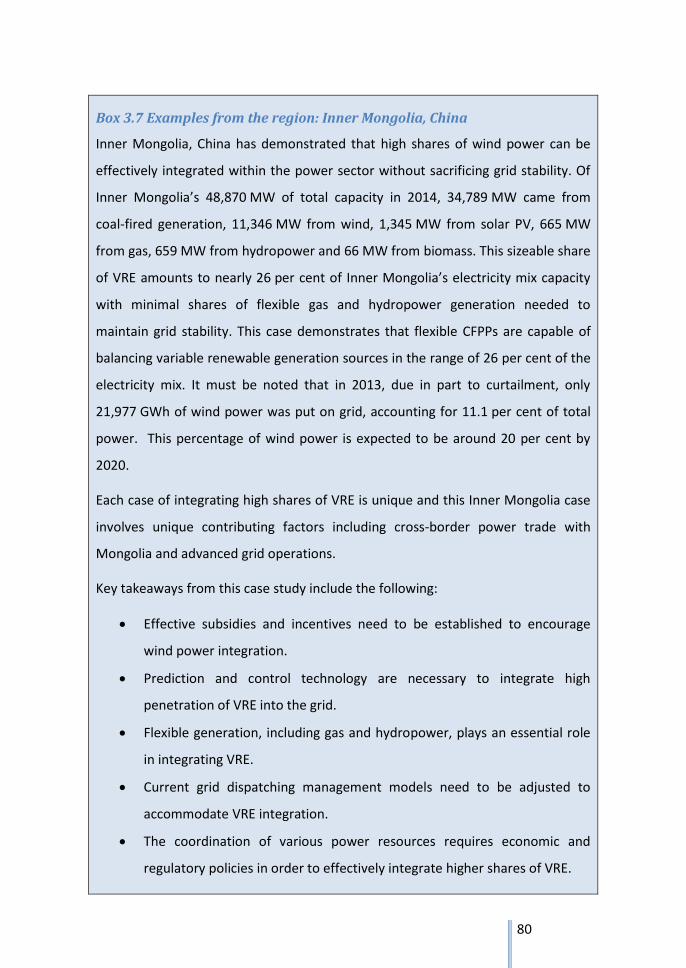
80
Box 3.7 Examples from the region: Inner Mongolia, China
Inner Mongolia, China has demonstrated that high shares of wind power can be
effectively integrated within the power sector without sacrificing grid stability. Of
Inner Mongolia’s 48,870 MW of total capacity in 2014, 34,789 MW came from
coal-fired generation, 11,346 MW from wind, 1,345 MW from solar PV, 665 MW
from gas, 659 MW from hydropower and 66 MW from biomass. This sizeable share
of VRE amounts to nearly 26 per cent of Inner Mongolia’s electricity mix capacity
with minimal shares of flexible gas and hydropower generation needed to
maintain grid stability. This case demonstrates that flexible CFPPs are capable of
balancing variable renewable generation sources in the range of 26 per cent of the
electricity mix. It must be noted that in 2013, due in part to curtailment, only
21,977 GWh of wind power was put on grid, accounting for 11.1 per cent of total
power. This percentage of wind power is expected to be around 20 per cent by
2020.
Each case of integrating high shares of VRE is unique and this Inner Mongolia case
involves unique contributing factors including cross-border power trade with
Mongolia and advanced grid operations.
Key takeaways from this case study include the following:
Effective subsidies and incentives need to be established to encourage
wind power integration.
Prediction and control technology are necessary to integrate high
penetration of VRE into the grid.
Flexible generation, including gas and hydropower, plays an essential role
in integrating VRE.
Current grid dispatching management models need to be adjusted to
accommodate VRE integration.
The coordination of various power resources requires economic and
regulatory policies in order to effectively integrate higher shares of VRE.
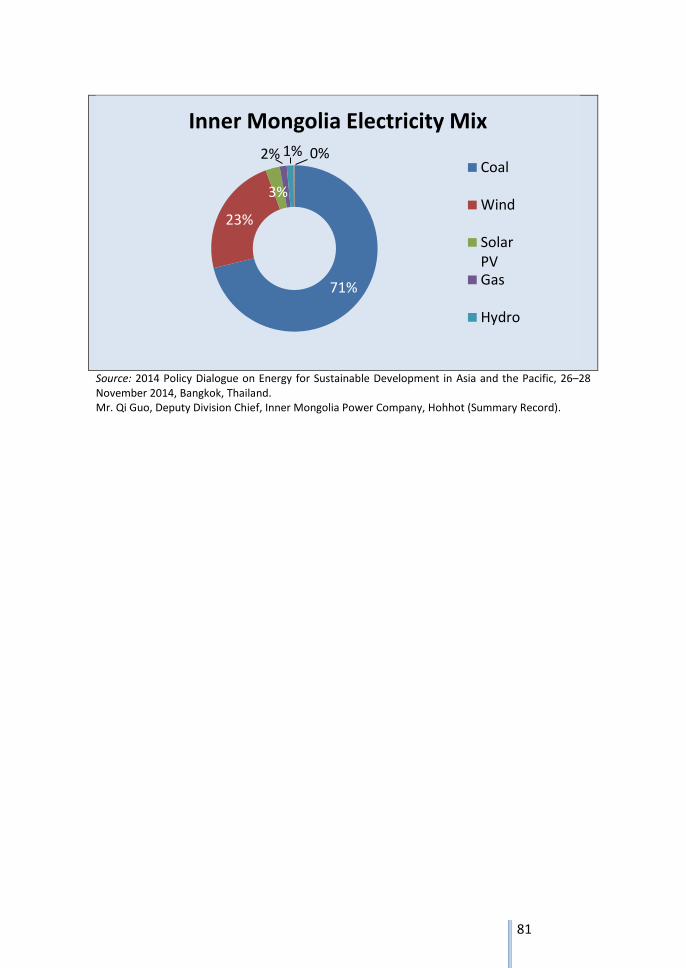
81
Source: 2014 Policy Dialogue on Energy for Sustainable Development in Asia and the Pacific, 26–28 November 2014, Bangkok, Thailand. Mr. Qi Guo, Deputy Division Chief, Inner Mongolia Power Company, Hohhot (Summary Record).
71%
23%
3%
2% 1% 0%
Inner Mongolia Electricity Mix
Coal
Wind
SolarPVGas
Hydro
82
Chapter 4: Promotion of High-Efficiency, Low-Emissions
Coal Technologies in Electricity Generation
4.1 Key Messages
1. Coal-fired power plant (CFPP) efficiency increases will play an important role in
improving local air quality as well as curbing CO2 emissions regionally and globally
due to the robust role coal-fired generation plays in the electricity mix.
A. The most important and cost-effective ways to improve productivity,
decrease hazardous emissions and reduce resource use is to raise
efficiency – getting more energy per unit of input.
B. Clear policy structure is needed to allow the power sector to make long-
term decisions and investments with respect to advanced generation
technologies in order to increase efficiency and reduce emissions.
C. The global average CFPP efficiency was 33 per cent, as of 2011, well below
the 45 per cent efficiency achievable with commercially viable technology
for ultra-supercritical (USC) generation.
2. Economic considerations, when choosing the type of coal-fired generation,
should include lifetime costs of generation rather than simply considering upfront
capital costs. One common metric used is levelized cost of electricity (LCOE), which
represents the per-kilowatt hour (kWh) cost of building and operating a power
plant spread over an assumed financial life and duty cycle (typically 40 years for
CFPPs).
A. In general, upfront capital costs are lower for less efficient subcritical
CFPPs than for higher-efficiency supercritical, USC or advanced ultra-
supercritical (A-USC) CFPPs.
B. Variable operations and maintenance (O&M) costs are also generally lower
for subcritical plants than for supercritical, USC, or A-USC CFPPs due to the
lower pressures and temperatures required for combustion.
83
C. LCOEs, however, are generally lower for supercritical, USC and A-USC
CFPPs when compared with subcritical CFPPs because they require less
fuel in order to generate the same amount of electricity. Thus, if a long-
term view is taken, high-efficiency, low emission (HELE) generation is more
cost-effective over the lifetime of a CFPP than less-efficient subcritical
generation, due to lower fuel requirements (see Table 4.3).
3. Adverse externalities of coal-fired generation should be considered when
deciding which type of generation technology to employ. The costs associated with
negative externalities are not included in LCOE calculations; meaning HELE
generation would be even more attractive if they were considered.
A. Globally, coal-fired power generation is a leading source of sulfur dioxide
(SOx), nitrous oxides (NOx), particulate matter (PM) and mercury, along
with other toxic pollutant emissions.
B. According to the International Energy Agency (IEA), in 2011, electricity and
heat generation accounted for 42 per cent of global CO2 emissions, of
which 72 per cent was derived from one source – CFPPs (IEA, 2013a).
C. The share of coal in Asia-Pacific’s energy mix has drastically increased over
the past decade, accounting for approximate 55% of electricity generation
as of 2012 (see Table 4.1) (ESCAP, 2015).
D. Per kWh, coal has nearly 20 per cent more greenhouse gas (GHG)
emissions than oil, more than twice as much GHG emissions as gas, and
almost 22 times more GHG emissions than solar photovoltaic (PV).
E. Consumption of energy is directly tied to water consumption, with 15 per
cent of the world’s total water withdrawals used for energy production in
2010. Within the energy sector, thermal power plants (burning fossil fuels
and nuclear) are the most intensive users of water.
84
4. To allow for the integration of increasing shares of variable renewable energy
(VRE), coal assets must increase operating flexibility by improving performance in
the following areas:
A. Increased generation turndown capabilities when loads are low (e.g. due
to a spike in VRE generation).
B. Faster generation startups with less damage to plant equipment when
loads are high (e.g. due to a decrease in VRE generation).
C. Faster load changes to allow for flexible load-following due to the variable
output of VRE.
D. Reserve shutdown at minimal cost. Cold, and to a lesser extent warm,
starts can significantly add to coal-fired generation costs, including variable
O&M costs, when compared with consistent generation.
85
4.2 Introduction
4.2.1 Coal-fired power generation
Coal-fired electricity generation will remain a substantial part of the Asia-Pacific, as
well as global, energy mix for decades to come. Coal remains the most abundant
fossil fuel on earth, with proven global reserves of nearly 1 trillion metric tonnes
(MT) (IEA, 2013b). At current consumption rates, this would allow for another 150
years of generation. Reserves of coal are much greater than those of natural gas
and oil in terms of energy content as well. Recoverable reserves of coal are present
in over 75 countries and the mining and combustion has remained relatively
inexpensive, which has led to coal accounting for an important component of the
global energy mix for many decades (IEA, 2013b).
As of 2012, coal-fired generation accounted for approximately 55 per cent of
electricity production in the Asia-Pacific region, up from 32 per cent in 1990. More
than 92 per cent of this electricity is generated using hard coal – mostly other
bituminous, some anthracite and a small portion of coking coal. In absolute terms,
coal-fired generation increased from 1,207 TWh in 1990 to 5,888 TWh in 2012, a
compound annual growth rate (CAGR) of 7.47 per cent. Over this period, however,
generation from VRE sources increased from 38 GWh of electricity production in
1990 to nearly 164,000 GWh (164 TWh) in 2012, a CAGR of 46.3 per cent. Total
electricity production from all sources nearly tripled from 3,743 TWh in 1990 to
10,739 TWh in 2012.
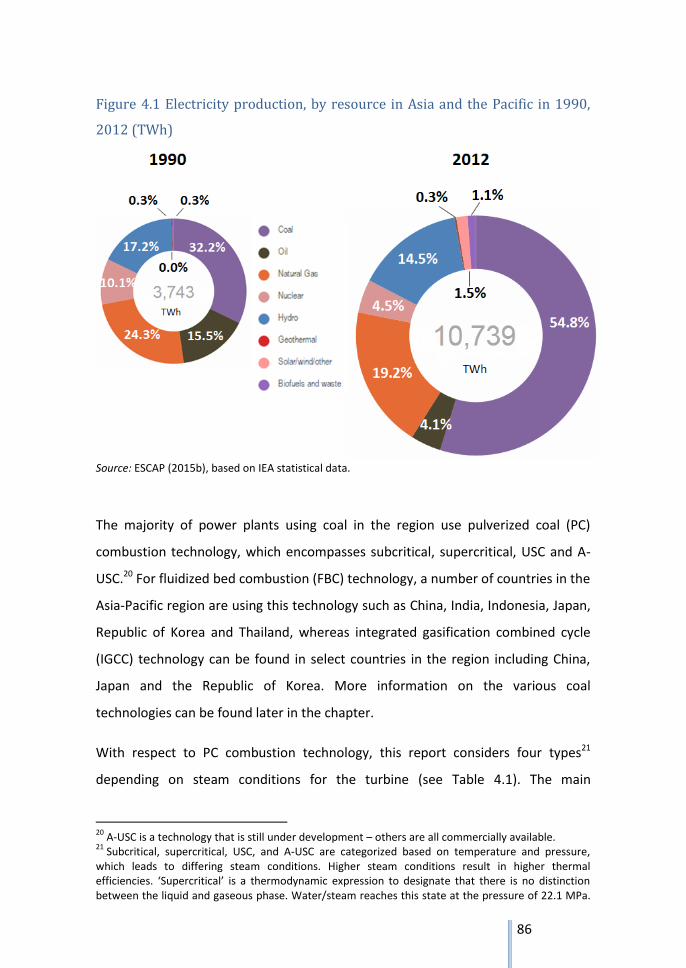
86
Figure 4.1 Electricity production, by resource in Asia and the Pacific in 1990,
2012 (TWh)
Source: ESCAP (2015b), based on IEA statistical data.
The majority of power plants using coal in the region use pulverized coal (PC)
combustion technology, which encompasses subcritical, supercritical, USC and A-
USC.20 For fluidized bed combustion (FBC) technology, a number of countries in the
Asia-Pacific region are using this technology such as China, India, Indonesia, Japan,
Republic of Korea and Thailand, whereas integrated gasification combined cycle
(IGCC) technology can be found in select countries in the region including China,
Japan and the Republic of Korea. More information on the various coal
technologies can be found later in the chapter.
With respect to PC combustion technology, this report considers four types21
depending on steam conditions for the turbine (see Table 4.1). The main
20
A-USC is a technology that is still under development – others are all commercially available. 21
Subcritical, supercritical, USC, and A-USC are categorized based on temperature and pressure, which leads to differing steam conditions. Higher steam conditions result in higher thermal efficiencies. ‘Supercritical’ is a thermodynamic expression to designate that there is no distinction between the liquid and gaseous phase. Water/steam reaches this state at the pressure of 22.1 MPa.
87
parameters to consider when profiling the global fleet of CFPPs are size
(nameplate power generation capacity in MW), age (based on when the power
plant was built) and performance level (combustion technology differentiated by
temperature). The typical maximum efficiency can significantly vary depending on
site-specific factors such as weather conditions, extent of maintenance and kind of
operating regimes.
Table 4.1 Steam conditions on subcritical, supercritical and USC boilers
Steam Conditions Subcritical Supercritical USC A-USC
Pressure (MPa) 12.4–16.5 24–25 24–30 30–35
Temperature (°C) 538 540–595 595–620 700–760
Source: IEA (2011, 2013a, 2014).
4.2.2 High-efficiency, low-emissions coal-fired power generation
Average global coal-fired plant efficiency rests at around 33 per cent, as of 2012
(IEA, 2013b). In order to increase these efficiencies, a transition towards more
efficient HELE coal-fired generation should take place. HELE coal-fired generation
includes supercritical, USC and A-USC PC technologies, typically in the range of up
to 42 per cent for supercritical, 45 per cent for USC and up to 50 per cent for A-USC
(IEA, 2013b). Other HELE technologies include circulating FBC and IGCC although
the costs of these technologies tend to be higher than PC technologies for various
reasons, and as such will not be analyzed in detail in this chapter. The aim of
deploying HELE technologies is twofold: to increase conversion efficiencies and to
reduce CO2 emissions. Both supercritical and USC technologies are available now,
with even higher efficiencies possible when A-USC becomes more readily available.
Poorer quality or low-grade coals (such as lignite) are candidates for more efficient
generation, notably by employing pre-combustion drying. Global shares of
supercritical and USC coal-fired generation rest at approximately 28 per cent, as of
Above this pressure level, the cycle medium is a single-phase fluid with homogenous properties and, as a result, there is no need to separate water from steam as in the boiler of a subcritical cycle.
88
2012. With coal-fired generation comprising 55 per cent of electricity production in
Asia and the Pacific, as of 2012, addressing more efficient coal-fired generation is a
necessity. Figure 4.2 shows the share of supercritical and USC capacity in selected
member States. Most noticeable is the gain in efficiency witnessed in China, to be
discussed further in a regional case study.
Figure 4.2 The share of supercritical and USC capacity in selected member
States
Source: ESCAP, based on Platts World Electric Power Plants (WEPP) Database (2011), accessed from (IEA, 2013b). Note: For India, achieving 25 per cent supercritical and USC by 2014 is an ambition, with perhaps up to 10 per cent likely to be achieved in practice.
89
4.2.3 Global coal-fired power projections
Figure 4.3 Global electricity mix 2011, 2035 (New Policies Scenario)
Source: ESCAP, based on IEA (2013), World Energy Outlook 2013, OECD/IEA, Paris, France (p. 175).
Growth in global coal demand will see a CAGR of 1.05 per cent from 2011 through
2035 under the IEA Current Policies Scenario (CPS) and a CAGR of 0.46 per cent
under the IEA New Policies Scenario (NPS), which assumes the cautious
implementation of announced policy measures (IEA, 2013c). This is much lower
than the past 25 years, which saw a 2.5 per cent average annual growth rate
globally. Coal demand expands from around 5,390 Mtoe in 2011 to 7,764 Mtoe
under the CPS and 6,326 Mtoe under the NPS, by 2035. Regarding the NPS, two-
thirds of this growth occurs in the period from 2011 to 2020, with demand growing
by only 0.4 per cent per year from 2020 to 2035.
Growth in global coal demand for electricity will continue to rise under the NPS,
going from 9,140 TWh of generation in 2011 to 12,312 TWh of generation in 2035,
a CAGR of 1.2 per cent. This growth rate is less than what was seen between 1990
and 2011, where electricity generation from coal saw a CAGR of 3.35 per cent.
Over the same period, OECD will see a drop in coal-fired electricity generation
from 3,618 to 2,775 TWh while non-OECD will increase from 5,522 TWh of coal-
fired generation in 2011 to 9,537 TWh in 2035 under the NPS (IEA, 2013c).
41%
22%
5%
12%
16% 4%
2011
33%
22% 1% 12%
16%
16%
2035 (NPS)
Coal
Gas
Oil
Nuclear
90
The power sector accounts for nearly three-quarters of the increase in global coal
demand over the period 2011–2035, even though coal’s share of global electricity
generation sees a decline of eight percentage points, from 41 to 33 per cent, as
many countries continue to diversify their power mixes (Figure 4.7). Despite the
drop in share to 33 per cent, coal remains the leading source of electricity
generation in 2035. Coal production today is dominated by non-OECD countries,
whose share of output will continue to rise over the next 24 years (IEA, 2013c).
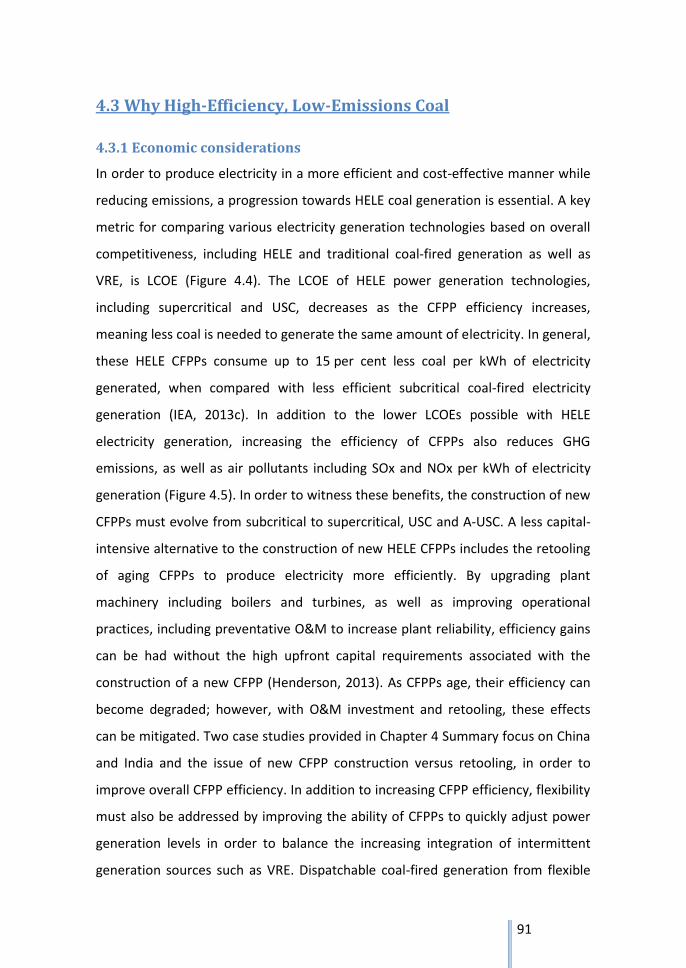
91
4.3 Why High-Efficiency, Low-Emissions Coal
4.3.1 Economic considerations
In order to produce electricity in a more efficient and cost-effective manner while
reducing emissions, a progression towards HELE coal generation is essential. A key
metric for comparing various electricity generation technologies based on overall
competitiveness, including HELE and traditional coal-fired generation as well as
VRE, is LCOE (Figure 4.4). The LCOE of HELE power generation technologies,
including supercritical and USC, decreases as the CFPP efficiency increases,
meaning less coal is needed to generate the same amount of electricity. In general,
these HELE CFPPs consume up to 15 per cent less coal per kWh of electricity
generated, when compared with less efficient subcritical coal-fired electricity
generation (IEA, 2013c). In addition to the lower LCOEs possible with HELE
electricity generation, increasing the efficiency of CFPPs also reduces GHG
emissions, as well as air pollutants including SOx and NOx per kWh of electricity
generation (Figure 4.5). In order to witness these benefits, the construction of new
CFPPs must evolve from subcritical to supercritical, USC and A-USC. A less capital-
intensive alternative to the construction of new HELE CFPPs includes the retooling
of aging CFPPs to produce electricity more efficiently. By upgrading plant
machinery including boilers and turbines, as well as improving operational
practices, including preventative O&M to increase plant reliability, efficiency gains
can be had without the high upfront capital requirements associated with the
construction of a new CFPP (Henderson, 2013). As CFPPs age, their efficiency can
become degraded; however, with O&M investment and retooling, these effects
can be mitigated. Two case studies provided in Chapter 4 Summary focus on China
and India and the issue of new CFPP construction versus retooling, in order to
improve overall CFPP efficiency. In addition to increasing CFPP efficiency, flexibility
must also be addressed by improving the ability of CFPPs to quickly adjust power
generation levels in order to balance the increasing integration of intermittent
generation sources such as VRE. Dispatchable coal-fired generation from flexible
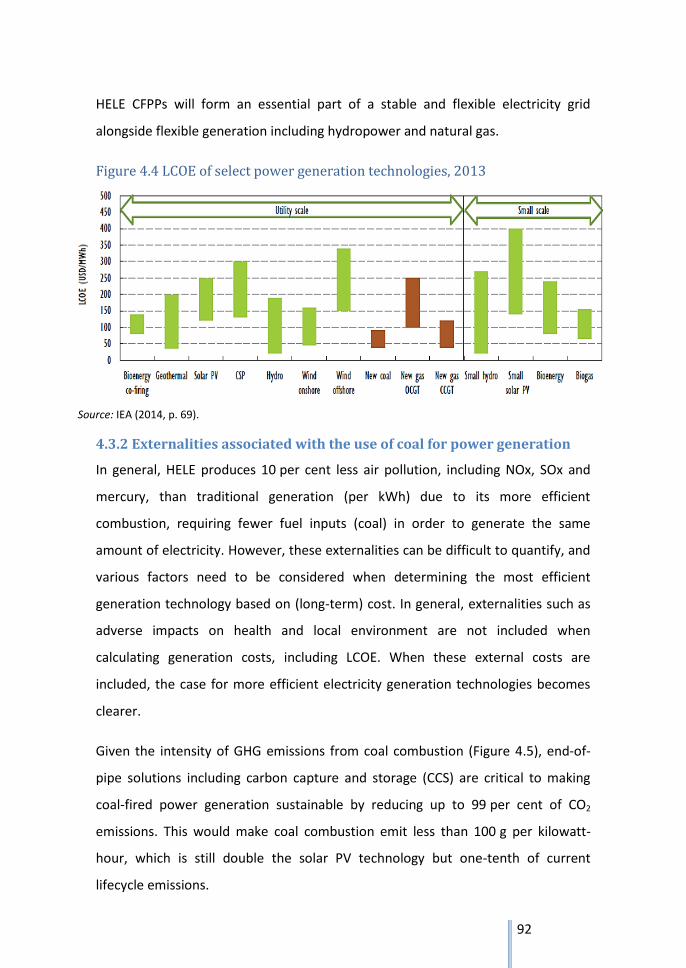
92
HELE CFPPs will form an essential part of a stable and flexible electricity grid
alongside flexible generation including hydropower and natural gas.
Figure 4.4 LCOE of select power generation technologies, 2013
Source: IEA (2014, p. 69).
4.3.2 Externalities associated with the use of coal for power generation
In general, HELE produces 10 per cent less air pollution, including NOx, SOx and
mercury, than traditional generation (per kWh) due to its more efficient
combustion, requiring fewer fuel inputs (coal) in order to generate the same
amount of electricity. However, these externalities can be difficult to quantify, and
various factors need to be considered when determining the most efficient
generation technology based on (long-term) cost. In general, externalities such as
adverse impacts on health and local environment are not included when
calculating generation costs, including LCOE. When these external costs are
included, the case for more efficient electricity generation technologies becomes
clearer.
Given the intensity of GHG emissions from coal combustion (Figure 4.5), end-of-
pipe solutions including carbon capture and storage (CCS) are critical to making
coal-fired power generation sustainable by reducing up to 99 per cent of CO2
emissions. This would make coal combustion emit less than 100 g per kilowatt-
hour, which is still double the solar PV technology but one-tenth of current
lifecycle emissions.
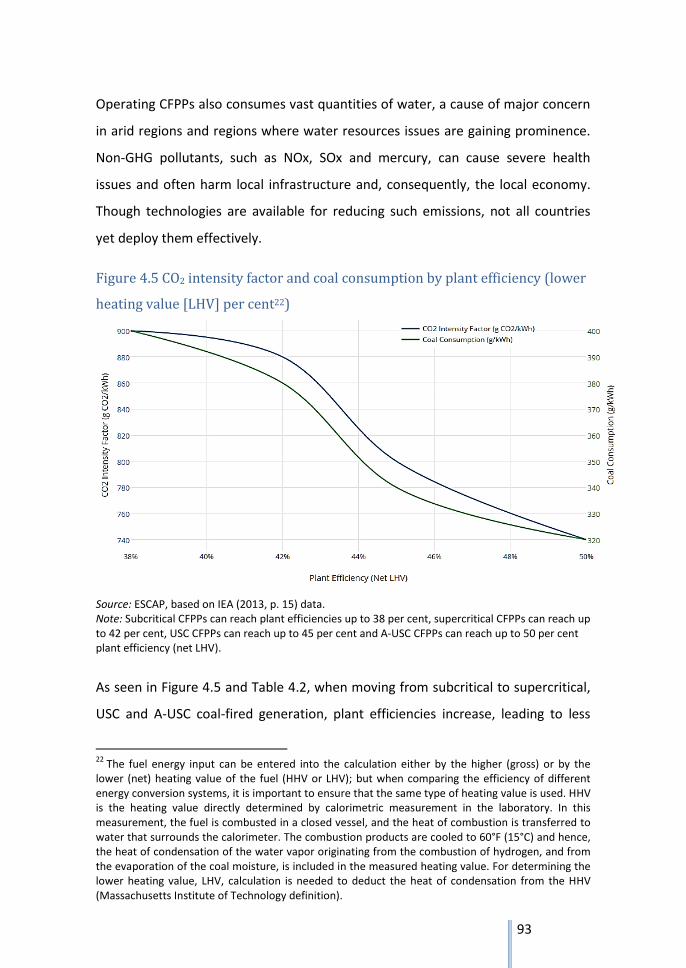
93
Operating CFPPs also consumes vast quantities of water, a cause of major concern
in arid regions and regions where water resources issues are gaining prominence.
Non-GHG pollutants, such as NOx, SOx and mercury, can cause severe health
issues and often harm local infrastructure and, consequently, the local economy.
Though technologies are available for reducing such emissions, not all countries
yet deploy them effectively.
Figure 4.5 CO2 intensity factor and coal consumption by plant efficiency (lower
heating value [LHV] per cent22)
Source: ESCAP, based on IEA (2013, p. 15) data. Note: Subcritical CFPPs can reach plant efficiencies up to 38 per cent, supercritical CFPPs can reach up to 42 per cent, USC CFPPs can reach up to 45 per cent and A-USC CFPPs can reach up to 50 per cent plant efficiency (net LHV).
As seen in Figure 4.5 and Table 4.2, when moving from subcritical to supercritical,
USC and A-USC coal-fired generation, plant efficiencies increase, leading to less
22
The fuel energy input can be entered into the calculation either by the higher (gross) or by the lower (net) heating value of the fuel (HHV or LHV); but when comparing the efficiency of different energy conversion systems, it is important to ensure that the same type of heating value is used. HHV is the heating value directly determined by calorimetric measurement in the laboratory. In this measurement, the fuel is combusted in a closed vessel, and the heat of combustion is transferred to water that surrounds the calorimeter. The combustion products are cooled to 60°F (15°C) and hence, the heat of condensation of the water vapor originating from the combustion of hydrogen, and from the evaporation of the coal moisture, is included in the measured heating value. For determining the lower heating value, LHV, calculation is needed to deduct the heat of condensation from the HHV (Massachusetts Institute of Technology definition).
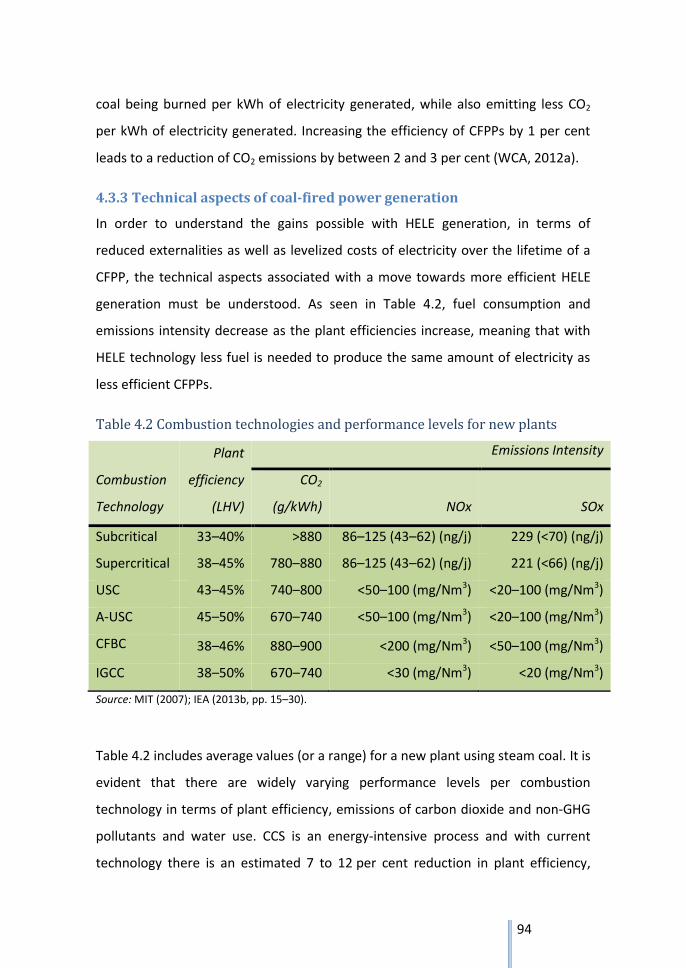
94
coal being burned per kWh of electricity generated, while also emitting less CO2
per kWh of electricity generated. Increasing the efficiency of CFPPs by 1 per cent
leads to a reduction of CO2 emissions by between 2 and 3 per cent (WCA, 2012a).
4.3.3 Technical aspects of coal-fired power generation
In order to understand the gains possible with HELE generation, in terms of
reduced externalities as well as levelized costs of electricity over the lifetime of a
CFPP, the technical aspects associated with a move towards more efficient HELE
generation must be understood. As seen in Table 4.2, fuel consumption and
emissions intensity decrease as the plant efficiencies increase, meaning that with
HELE technology less fuel is needed to produce the same amount of electricity as
less efficient CFPPs.
Table 4.2 Combustion technologies and performance levels for new plants
Combustion
Technology
Plant
efficiency
(LHV)
Emissions Intensity
CO2
(g/kWh) NOx SOx
Subcritical 33–40% >880 86–125 (43–62) (ng/j) 229 (<70) (ng/j)
Supercritical 38–45% 780–880 86–125 (43–62) (ng/j) 221 (<66) (ng/j)
USC 43–45% 740–800 <50–100 (mg/Nm3) <20–100 (mg/Nm3)
A-USC 45–50% 670–740 <50–100 (mg/Nm3) <20–100 (mg/Nm3)
CFBC 38–46% 880–900 <200 (mg/Nm3) <50–100 (mg/Nm3)
IGCC 38–50% 670–740 <30 (mg/Nm3) <20 (mg/Nm3)
Source: MIT (2007); IEA (2013b, pp. 15–30).
Table 4.2 includes average values (or a range) for a new plant using steam coal. It is
evident that there are widely varying performance levels per combustion
technology in terms of plant efficiency, emissions of carbon dioxide and non-GHG
pollutants and water use. CCS is an energy-intensive process and with current
technology there is an estimated 7 to 12 per cent reduction in plant efficiency,
95
which is precisely the reason why high-efficiency power plants need to be built if
CCS is to be widely applied.
Globally, most CFPPs use PC combustion technology. The majority of the installed
global fleet is subcritical and the rate of expansion in new subcritical units
outpaces that of supercritical and USC units, especially in the Asia-Pacific region
where most of this growth is happening. For example, according to 2011 data from
the Platts WEPP database,23 India only had 1 per cent of their coal power plants
using supercritical or USC units (even in plants built within the previous decade,
the rate was 2 per cent) despite having a third of the fleet with generation capacity
above 300 MW which means economies of scale for advanced technologies. In
China, 34 per cent of the plants younger than 10 years have supercritical or USC
steam conditions, but across the entire installed fleet 25 per cent has this higher
level of efficiency. The situation is similar in the United States, the second-largest
consumer of coal for power generation (in absolute amounts), where 36 per cent
of young plants (less than 10 years) have advanced technology and 27 per cent of
total operating plants do.
As discussed in Chapter 3, balancing increased shares of intermittent generation
sources will become an ever more present issue, as shares of wind and solar PV
implementation continue to rise within electricity mixes. To balance these
increasing shares, flexible baseload generation from hydropower, gas and HELE
coal will play an important role in smoothing variations in power generation and
balancing loads. In terms of HELE coal-fired generation, ramping in order to
smooth intermittent variable renewable sources is more feasible than with less
efficient conventional coal generation, as HELE CFPPs can more readily accept the
losses in efficiency associated with quickly increasing and decreasing power
generation. This should be taken into account as CFPPs can last at least 40 years
with regular maintenance, and locking into old, inefficient and inflexible
technology is not ideal.
23
Accessed from IEA (2012).
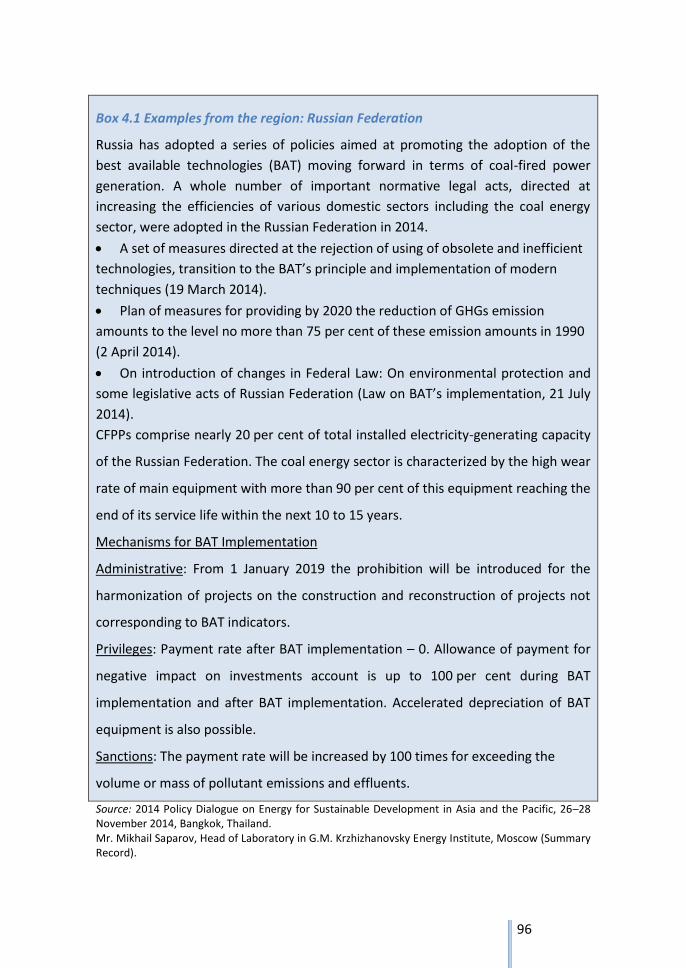
96
Box 4.1 Examples from the region: Russian Federation
Russia has adopted a series of policies aimed at promoting the adoption of the
best available technologies (BAT) moving forward in terms of coal-fired power
generation. A whole number of important normative legal acts, directed at
increasing the efficiencies of various domestic sectors including the coal energy
sector, were adopted in the Russian Federation in 2014.
A set of measures directed at the rejection of using of obsolete and inefficient
technologies, transition to the BAT’s principle and implementation of modern
techniques (19 March 2014).
Plan of measures for providing by 2020 the reduction of GHGs emission
amounts to the level no more than 75 per cent of these emission amounts in 1990
(2 April 2014).
On introduction of changes in Federal Law: On environmental protection and
some legislative acts of Russian Federation (Law on BAT’s implementation, 21 July
2014).
CFPPs comprise nearly 20 per cent of total installed electricity-generating capacity
of the Russian Federation. The coal energy sector is characterized by the high wear
rate of main equipment with more than 90 per cent of this equipment reaching the
end of its service life within the next 10 to 15 years.
Mechanisms for BAT Implementation
Administrative: From 1 January 2019 the prohibition will be introduced for the
harmonization of projects on the construction and reconstruction of projects not
corresponding to BAT indicators.
Privileges: Payment rate after BAT implementation – 0. Allowance of payment for
negative impact on investments account is up to 100 per cent during BAT
implementation and after BAT implementation. Accelerated depreciation of BAT
equipment is also possible.
Sanctions: The payment rate will be increased by 100 times for exceeding the
volume or mass of pollutant emissions and effluents.
Source: 2014 Policy Dialogue on Energy for Sustainable Development in Asia and the Pacific, 26–28 November 2014, Bangkok, Thailand. Mr. Mikhail Saparov, Head of Laboratory in G.M. Krzhizhanovsky Energy Institute, Moscow (Summary Record).
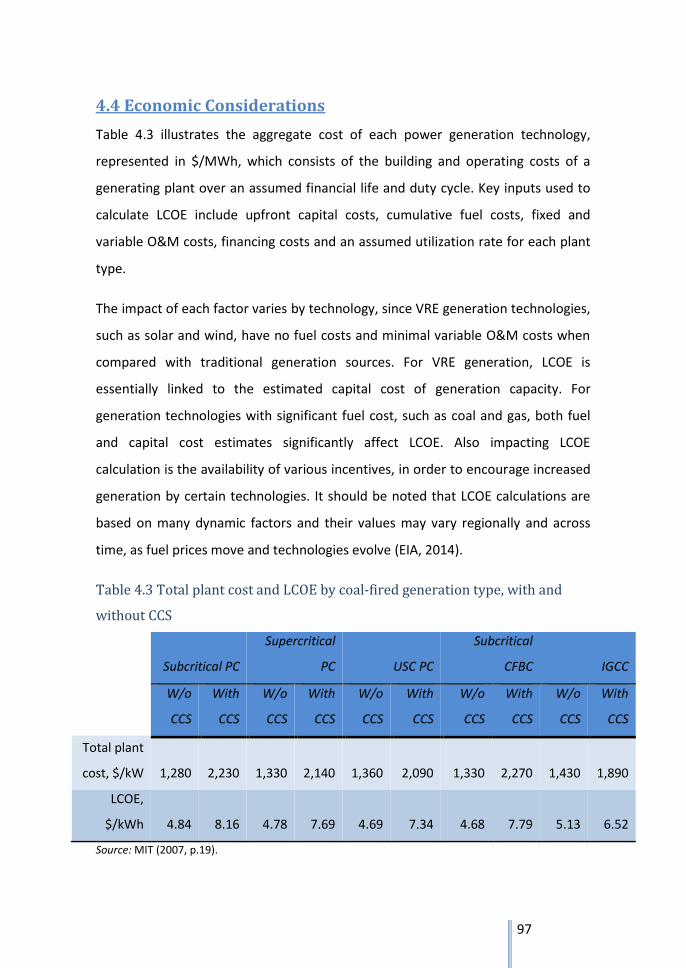
97
4.4 Economic Considerations
Table 4.3 illustrates the aggregate cost of each power generation technology,
represented in $/MWh, which consists of the building and operating costs of a
generating plant over an assumed financial life and duty cycle. Key inputs used to
calculate LCOE include upfront capital costs, cumulative fuel costs, fixed and
variable O&M costs, financing costs and an assumed utilization rate for each plant
type.
The impact of each factor varies by technology, since VRE generation technologies,
such as solar and wind, have no fuel costs and minimal variable O&M costs when
compared with traditional generation sources. For VRE generation, LCOE is
essentially linked to the estimated capital cost of generation capacity. For
generation technologies with significant fuel cost, such as coal and gas, both fuel
and capital cost estimates significantly affect LCOE. Also impacting LCOE
calculation is the availability of various incentives, in order to encourage increased
generation by certain technologies. It should be noted that LCOE calculations are
based on many dynamic factors and their values may vary regionally and across
time, as fuel prices move and technologies evolve (EIA, 2014).
Table 4.3 Total plant cost and LCOE by coal-fired generation type, with and
without CCS
Subcritical PC
Supercritical
PC USC PC
Subcritical
CFBC IGCC
W/o
CCS
With
CCS
W/o
CCS
With
CCS
W/o
CCS
With
CCS
W/o
CCS
With
CCS
W/o
CCS
With
CCS
Total plant
cost, $/kW 1,280 2,230 1,330 2,140 1,360 2,090 1,330 2,270 1,430 1,890
LCOE,
$/kWh 4.84 8.16 4.78 7.69 4.69 7.34 4.68 7.79 5.13 6.52
Source: MIT (2007, p.19).
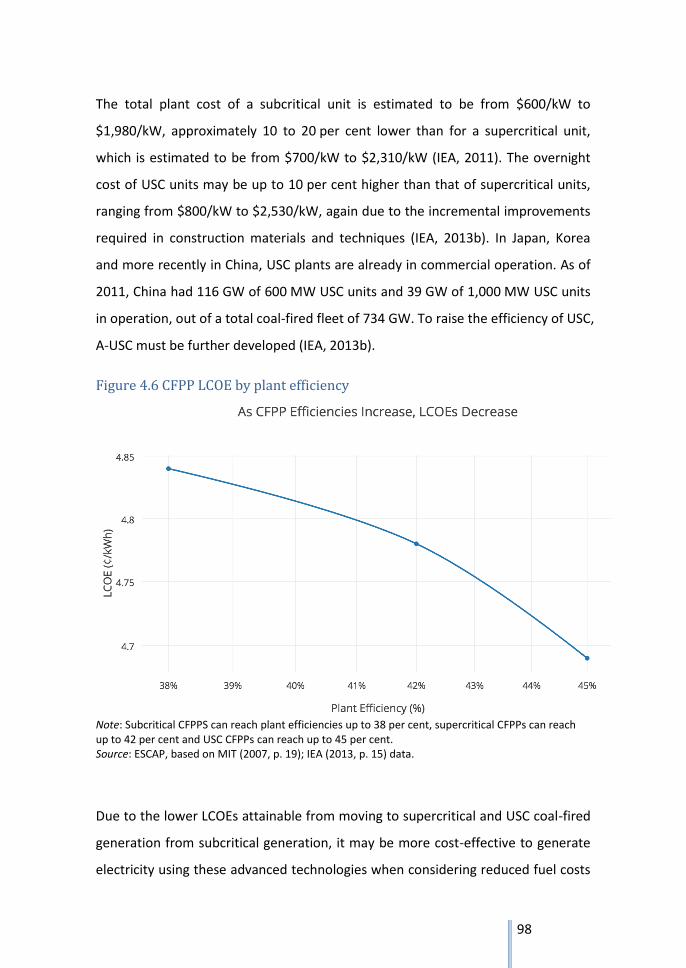
98
The total plant cost of a subcritical unit is estimated to be from $600/kW to
$1,980/kW, approximately 10 to 20 per cent lower than for a supercritical unit,
which is estimated to be from $700/kW to $2,310/kW (IEA, 2011). The overnight
cost of USC units may be up to 10 per cent higher than that of supercritical units,
ranging from $800/kW to $2,530/kW, again due to the incremental improvements
required in construction materials and techniques (IEA, 2013b). In Japan, Korea
and more recently in China, USC plants are already in commercial operation. As of
2011, China had 116 GW of 600 MW USC units and 39 GW of 1,000 MW USC units
in operation, out of a total coal-fired fleet of 734 GW. To raise the efficiency of USC,
A-USC must be further developed (IEA, 2013b).
Figure 4.6 CFPP LCOE by plant efficiency
Note: Subcritical CFPPS can reach plant efficiencies up to 38 per cent, supercritical CFPPs can reach up to 42 per cent and USC CFPPs can reach up to 45 per cent. Source: ESCAP, based on MIT (2007, p. 19); IEA (2013, p. 15) data.
Due to the lower LCOEs attainable from moving to supercritical and USC coal-fired
generation from subcritical generation, it may be more cost-effective to generate
electricity using these advanced technologies when considering reduced fuel costs
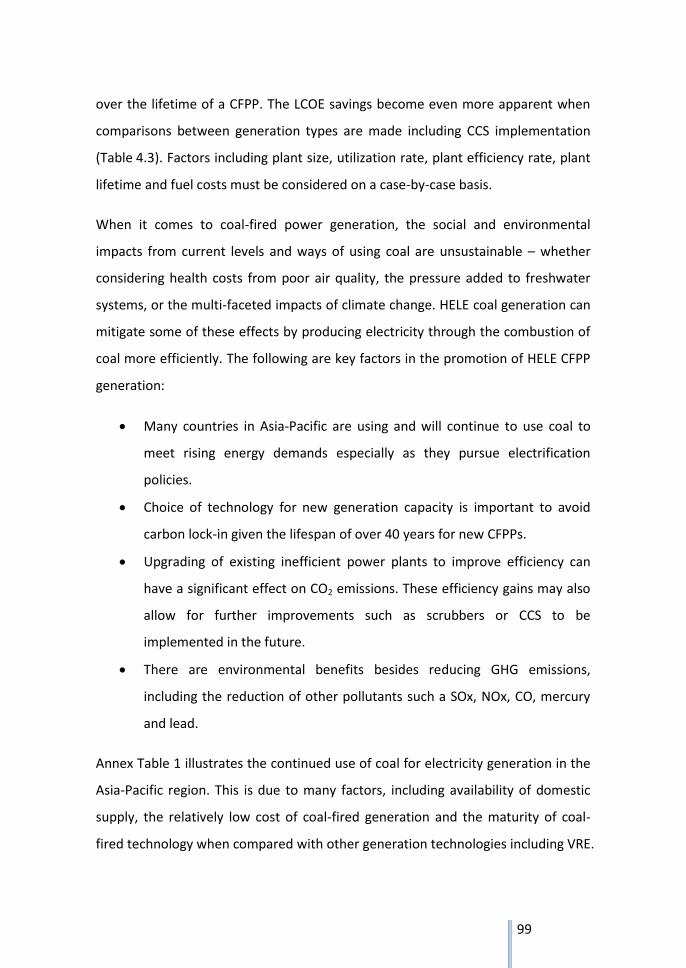
99
over the lifetime of a CFPP. The LCOE savings become even more apparent when
comparisons between generation types are made including CCS implementation
(Table 4.3). Factors including plant size, utilization rate, plant efficiency rate, plant
lifetime and fuel costs must be considered on a case-by-case basis.
When it comes to coal-fired power generation, the social and environmental
impacts from current levels and ways of using coal are unsustainable – whether
considering health costs from poor air quality, the pressure added to freshwater
systems, or the multi-faceted impacts of climate change. HELE coal generation can
mitigate some of these effects by producing electricity through the combustion of
coal more efficiently. The following are key factors in the promotion of HELE CFPP
generation:
Many countries in Asia-Pacific are using and will continue to use coal to
meet rising energy demands especially as they pursue electrification
policies.
Choice of technology for new generation capacity is important to avoid
carbon lock-in given the lifespan of over 40 years for new CFPPs.
Upgrading of existing inefficient power plants to improve efficiency can
have a significant effect on CO2 emissions. These efficiency gains may also
allow for further improvements such as scrubbers or CCS to be
implemented in the future.
There are environmental benefits besides reducing GHG emissions,
including the reduction of other pollutants such a SOx, NOx, CO, mercury
and lead.
Annex Table 1 illustrates the continued use of coal for electricity generation in the
Asia-Pacific region. This is due to many factors, including availability of domestic
supply, the relatively low cost of coal-fired generation and the maturity of coal-
fired technology when compared with other generation technologies including VRE.
100
4.5 Externalities Associated With the Use of Coal for Power
Generation
As seen in Figure 4.7, among fuels, coal has the largest share of CO2 emissions,
accounting for 44 per cent of the total although in terms of TPES, coal made up
only 29 per cent as of 2011, while oil accounted for 32 per cent of TPES. This is due
to the higher carbon content of coal per unit of energy. Up until 2001, oil was the
fuel emitting the largest share of CO2 emissions. This changed over the last
10 years as the electricity mix has changed and coal has drastically increased –
most notably in the Asia-Pacific region.
Figure 4.7 World primary energy supply and CO2 emissions: shares by fuel in
2011
*Other includes nuclear, hydropower, geothermal, solar, tide, wind, biofuels and waste. Source: ESCAP, based on IEA (2013), CO2 Emissions from Fuel Combustion 2013, OECD/IEA, Paris, France (p. 9).
In order to fulfill the role of coal in a lower-carbon future, raising the efficiency of
CFPPs and reducing GHG emissions will be essential. The deployment of HELE
technologies can have substantial impacts on the reduction of non-GHG emissions
as well, which is particularly important for air quality and health reasons on a local
and regional level (IEA, 2013b). A long-term view is essential for following a path
towards HELE CFPP generation due to the higher upfront capital costs required
101
when compared with the construction of less-efficient subcritical CFPPs. As
discussed, these higher upfront capital costs can be recouped over the lifetime of a
plant through lower LCOEs associated with HELE coal-fired generation.
The relationship between HELE technologies and CCS cannot be ignored when
discussing pathways for cleaner coal-fired generation. While the integration of
HELE technologies may substantially reduce emissions, the addition of CCS is
required in order to reduce CO2 emissions at a rate high enough to address climate
change. While technically viable, CCS implementation carries with it cost and
energy consumption challenges for CFPPs, leading to lower plant efficiencies.
Because of these challenges, balancing CSS and HELE technologies in fully
integrated plants is essential (see Technical Aspects section) (IEA, 2013b).
Box 4.2 Examples from the region: China
China is shutting down the last of its major CFPPs in Beijing to improve air quality,
reducing annual coal consumption by 13 million MT by 2017 from 2012 levels.
The shuttered coal-fired facilities will be replaced by four gas-fired stations with
capacity to supply 2.6 times more electricity than the coal plants (Bloomberg,
2015).
Smog caused by coal consumption killed an estimated 670,000 people in China in
2012.
Tiny particulate pollutants, especially those smaller than 2.5 µg (known as PM2.5),
were linked to 670,000 premature deaths from four diseases - strokes, lung
cancer, coronary heart disease and chronic obstructive pulmonary disease - in
China in 2012.
Damage to the environment and health added up to 260 yuan (HK$330) for each
tonne produced and used in 2012.
In 2012, some 157 million people in China lived in areas where the annual PM2.5
concentration was higher than 100 mcg/m3 - 10 times higher than the WHO health
guidelines.
Source: Bjureby et al. (2008); Bloomberg (2015).
102
Box 4.3 Examples from the region: Japan
In Japan, the life-cycle costs of CFPPs are generally considered when
determining the financial viability of a new project, as opposed to simply
considering the upfront capital requirements. With proper maintenance a
plant may last for 40 years and the total cost during this lifetime, including the
cost of capital, fuel, O&M and others should be considered.
In many cases, high availability of financing can overcome higher capital
requirements associated with HELE technology, which has been found to be a
main barrier, along with advanced O&M requirements. By addressing these
issues and taking a long-term view with regard to the economics of coal-fired
generation, Japan has become a leader in HELE coal-fired generation.
Isogo Unit 2 - one of the world’s most efficient CFPPs
J-Power’s ISOGO Unit 2 CFPP in Yokohama is one of the world’s cleanest and
most efficient when compared with other CFPPs, reaching 45 per cent (LHV)
gross plant efficiency with minimal levels of air pollutants.
Construction on the 600 MW Unit 2 began in 2005 and entered commercial
service in 2009 as part of a two-unit 1,200 MW plant.
ISOGO Unit 2 employs a complex air quality control system, called the ReACT
multi-pollutant control system, where flue gas passes through activated
carbon. This technology reduces pollutants including NOx, SOx and mercury,
making it comparable with natural gas-fired combined cycle plants in terms of
emissions intensity.
Unit 2 regularly operates at a SOx emissions rate of under 10 ppm,
representing a 99 per cent decrease in emissions from the previous 1960s-era
600 MW plant on the same site. NOx levels are also below 10 ppm,
representing a 92 per cent reduction. Soot and dust emissions at ISOGO Unit 2
were reduced to less than 5 mg/Nm3, representing a removal efficiency of over
99.9 per cent.
103
The ReACT multi-pollutant control system used by ISOGO Unit 2 also uses 1 per
cent of the water required by conventional wet flue-gas desulfurization
systems.
High efficiency requires high steam pressures and temperatures. The main
steam pressure at ISOGO Unit 2 is USC at 25 MPa (3,626 psi) with a main steam
temperature of 600°C (1,112°F).
Source: 2014 Policy Dialogue on Energy for Sustainable Development for Asia and the Pacific, 26–28 November 2014, Bangkok. Mr. Keiji Makino, Senior Fellow, Japan Coal Energy Center, Tokyo. Additional information on Isogo Unit 2 from: NEDO (2006); Hammond USA (2015).
104
4.6 Technical Aspects of Coal-Fired Power Generation
CFPP efficiency refers to how much energy is required as an input to generate a set
amount of electricity. The more inputs that are required, in the form of fuel (coal),
to generate a set amount of electricity, the lower the plant’s efficiency. Currently
subcritical CFPPs generate electricity at an efficiency rate in the range of 30 to
38 per cent (LHV) while USC plants can reach efficiencies of 45 per cent (see Table
4.2; IEA, 2013b). Generally, utilities produce electricity at the most economic price
while meeting minimum environmental standards where generation is taking place
(IEA, 2014c). The decision to increase plant efficiency is essentially economic, and
depends largely on the cost of fuel inputs. There exists a trade-off between the
cost of capital and operating costs, since higher efficiency CFPPs are more capital
intensive with respect to construction and O&M; however, they provide fuel
savings that can offset these higher costs, illustrated through lower LCOEs,
depending on the cost of fuel ($/MT), capacity factor (MW), utilization rate (per
cent) and lifetime of the plant (years). In addition to higher capital requirements,
higher-efficiency supercritical and USC CFPPs are much more technologically
advanced and require more advanced materials for plant construction, as well as
skilled engineers capable of maintaining the plant throughout its operating life.
The technical capabilities to construct and maintain a high-efficiency USC plant are
not as prevalent as those required for a subcritical CFPP. HELE CFPPs are also
typically over 500MW in size since the economic benefits seen from more efficient
coal-fired electricity generation are magnified by higher capacity factors.
Traditionally, CFPPs were designed for inflexible baseload operation, leading to an
evolution in plant size and steam conditions without focusing on flexible operation
since intermittent resources that require balancing, such as wind and solar, have
only recently begun to account for substantial generation capacity. CFPPs are
relatively inflexible in terms of load changes, turndown capabilities, quick startups
and reserve shutdown at minimal cost. To accommodate the growing use of
105
intermittent resources, such as VRE, conventional generation units, including
CFPPs, will need to become more flexible to handle more dynamic operation in
order to ensure grid stability. Many challenges exist with respect to increasing
flexibility of CFPPs, however, the decrease in plant efficiency as well as the
increased generation costs due to frequent ramping are two main barriers. The
relatively low cost of coal and the general lack of mandatory requirements for
increasing CFPP efficiencies mean that currently there is a lack of incentive to
change from business-as-usual practices to more efficient practices that reduce
emissions.
When considering plant efficiency, the option of CHP (also called cogeneration)
cannot be overlooked. A detailed account is beyond the scope of this chapter but
the further application of CHP systems in the Asia-Pacific region warrants attention.
Turning waste (or lost) heat into a resource is not only highly efficient but also
economical from a cost standpoint. In fact, CHP systems can reach plant
efficiencies of 60 to 85 per cent - far higher than any of the coal combustion
technologies alone.
The main barrier to using CHP may be securing a steady source of demand for the
heat produced. Some of the countries in the northern regions can connect to
district heating systems. Where this is not possible, for example, in India and the
Association of Southeast Asian Nations (ASEAN) countries, a suitable match would
be locating CHP plants next to industry locations where steam is in demand.
Interestingly, the case study of Denmark in Chapter 3 cites the use of CHP systems
as one of the Denmark can balance high shares of wind integration while also
raising the average efficiencies of their CFPPs.
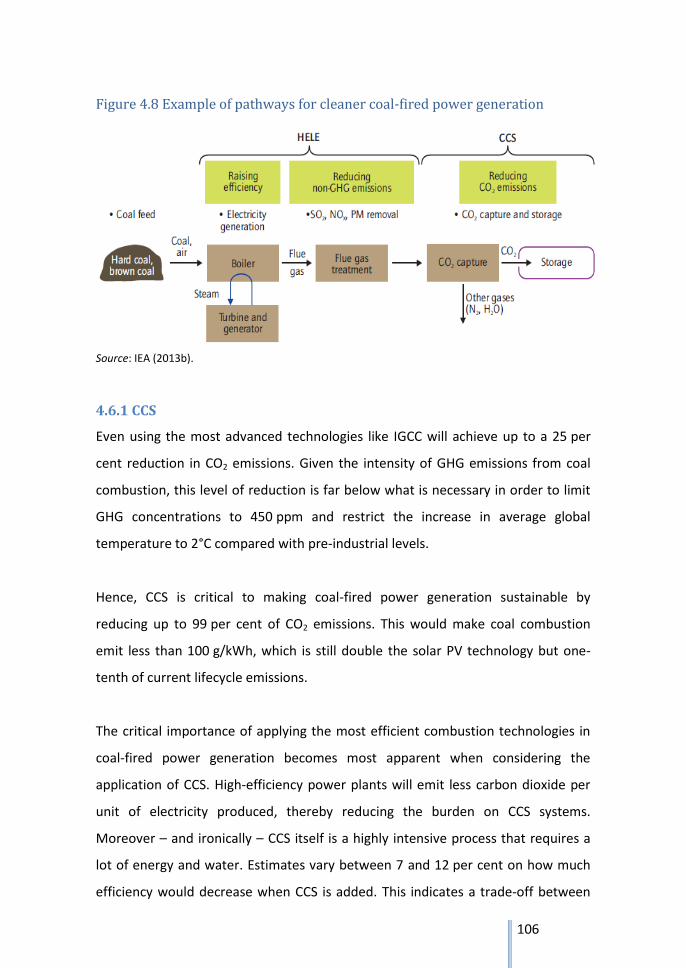
106
Figure 4.8 Example of pathways for cleaner coal-fired power generation
Source: IEA (2013b).
4.6.1 CCS
Even using the most advanced technologies like IGCC will achieve up to a 25 per
cent reduction in CO2 emissions. Given the intensity of GHG emissions from coal
combustion, this level of reduction is far below what is necessary in order to limit
GHG concentrations to 450 ppm and restrict the increase in average global
temperature to 2°C compared with pre-industrial levels.
Hence, CCS is critical to making coal-fired power generation sustainable by
reducing up to 99 per cent of CO2 emissions. This would make coal combustion
emit less than 100 g/kWh, which is still double the solar PV technology but one-
tenth of current lifecycle emissions.
The critical importance of applying the most efficient combustion technologies in
coal-fired power generation becomes most apparent when considering the
application of CCS. High-efficiency power plants will emit less carbon dioxide per
unit of electricity produced, thereby reducing the burden on CCS systems.
Moreover – and ironically – CCS itself is a highly intensive process that requires a
lot of energy and water. Estimates vary between 7 and 12 per cent on how much
efficiency would decrease when CCS is added. This indicates a trade-off between
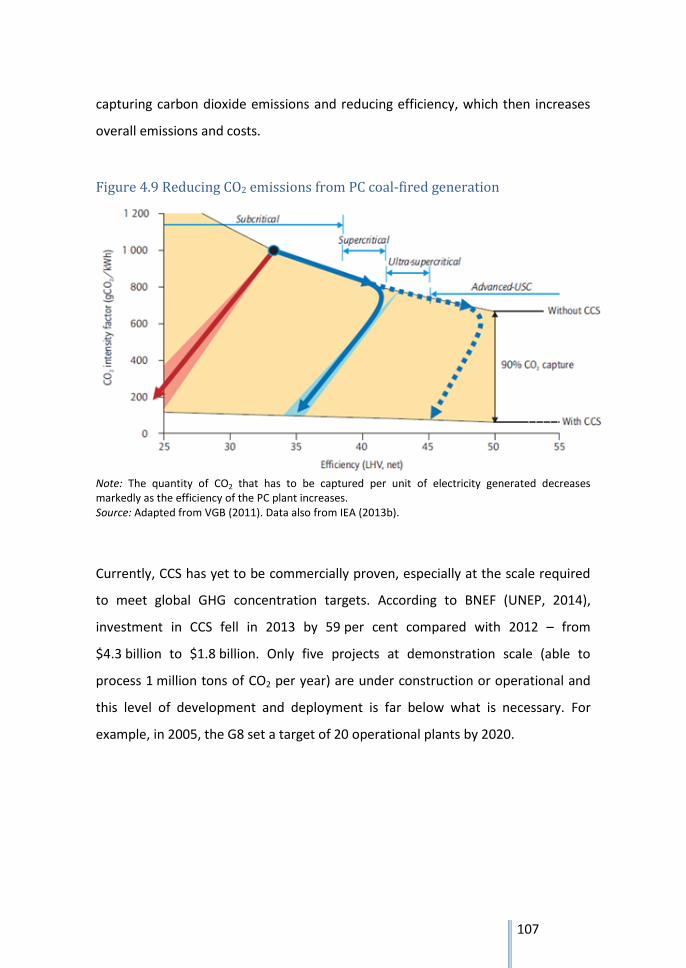
107
capturing carbon dioxide emissions and reducing efficiency, which then increases
overall emissions and costs.
Figure 4.9 Reducing CO2 emissions from PC coal-fired generation
Note: The quantity of CO2 that has to be captured per unit of electricity generated decreases markedly as the efficiency of the PC plant increases. Source: Adapted from VGB (2011). Data also from IEA (2013b).
Currently, CCS has yet to be commercially proven, especially at the scale required
to meet global GHG concentration targets. According to BNEF (UNEP, 2014),
investment in CCS fell in 2013 by 59 per cent compared with 2012 – from
$4.3 billion to $1.8 billion. Only five projects at demonstration scale (able to
process 1 million tons of CO2 per year) are under construction or operational and
this level of development and deployment is far below what is necessary. For
example, in 2005, the G8 set a target of 20 operational plants by 2020.
108
4.7 Summary
When performing a cost–benefit analysis in order to determine which coal-fired
generation technology to implement, there are many factors to consider that vary
by location. There is no one-size-fits-all approach and variables including cost of
capital and fuel (coal) costs will vary, thereby altering the economic attractiveness
of each individual CFPP. More efficient HELE power generations generally requires
higher upfront capital investments, due in part to the higher pressure and
temperature requirements during combustion, while lowering lifetime fuel costs.
Plant size (MW) and utilization rates, however, will affect LCOE rates, and should
be taken into account when deciding which type of generation technology to
pursue. In general, the larger the plant size (MW) and the higher the utilization
rate make for lower LCOEs and can more quickly make up for the higher upfront
capital costs associated with HELE generation by producing more kWh of electricity
with less fuel input costs. Essentially, the more electricity generated, the greater
the economic benefits provided by HELE generation.
Taking a balanced view of the economics, the higher upfront costs of supercritical,
or USC CFPPs, can be justified by the benefits in long-term cost reductions derived
from the higher efficiency levels. Without considering the avoided costs associated
with externalities such as local air pollution that lead to health issues, as well as
GHG emissions that may lead to climate change, HELE coal-fired power generation
makes sense from a purely economic perspective when taking a long-term view of
the associated costs. If the cost of emitting carbon and other pollutants were to
become a factor, HELE coal-fired generation would become even more
economically sound. As was illustrated in Table 4.3, when including CCS
implementation in LCOE calculations, HELE generation widens its competitive
advantage against inefficient subcritical generation.
The following are two case studies from Asia and the Pacific (Boxes 4.4 and 4.5),
which demonstrate policies being put into practice in order to promote the use of
more efficient coal-fired electricity generation.
109
Box 4.4 Policy examples from the region: China
11th Five-Year Plan (2006–2010) mandated closure of small, inefficient
coal-fired power generation units.
12th Five-Year Plan (2011–2015) caps coal production at 3.9 billion MT by
2015; from 2006, all plants of 600 MW or higher must be supercritical or
USC technology.
Stringent emission controls for SOx, NOx and particulates are mandated on
new units from 2012.
o SOx = 50 mg/Nm3
o NOx = 100 mg/Nm3
o PM = 20 mg/Nm3
New standards, including limits on mercury emissions, are applicable from
2014 for existing plants.
From 2006, 10 and 70 GW of small, inefficient coal-fired power generation
were shut down; in 2011, 8 GW were closed.
17 per cent reduction (compared with 2010) in carbon intensity targeted
by 2015 (across all power generation)
Source: Zhu and Zhao (2008); CEC (2011); Minchener (2010); WCA (2012b); Yue (2012); Yuhong and Yongxu (2012).
110
Box 4.5 Policy examples from the region: India
12th Five-Year Plan (2012–2017) states that 50 to 60 per cent of additional
new coal-fired capacity should be supercritical.
In the 13th Five-Year Plan (2017–2022), all new coal plants should be at
least supercritical; with energy audits at CFPPs to monitor and improve energy
efficiency.
The government expects 15 per cent of power to come from supercritical
by 2018.
A policy plan for all post-2017 units to be supercritical, with progression to
higher steam parameters in the future.
An R&D program is under way to raise steam temperatures to 700°C and
beyond.
IGCC is being pursued using both indigenous and international technology
suppliers.
A system to monitor and control emissions from thermal power stations is
in place.
The 12th and future Five-Year Plans will feature large increases in
construction of supercritical and USC capacity.
Source: Government of India Central Electricity Authority (2009, 2013); India Ministry of Coal (2015); Coal India Limited (2015).
111
Chapter 5: Scope for Regional Cooperation
The Policy Dialogue on Energy for Sustainable Development in Asia and the Pacific
was held in November 2014 in Bangkok, which deliberated on two focused areas:
(a) integrating variable renewable energy into the power sector, and (b) promoting
high-efficiency, low-emission (HELE) coal power plants. The deliberation was based
on the draft chapters of the Regional Trends Report of this edition. A panel
discussion and open discussion took place under each of the topic.
The following is the summary outcomes of the panel discussions as well as the
discussion that followed the panel discussion in identifying potential scope for
regional cooperation in addressing the two topics dealt in the present Regional
Trends Report.
Integrating variable renewable energy (VRE) into the power sector
The Asia-Pacific region is rapidly increasing the production and percentage share of
VRE in the regional electricity mix. In 2012, the regional share reached 1.5 per cent,
up from just 0.1 per cent in 2000. In the last few years, the Asia-Pacific region has
emerged as a driving force in the global technology development and has shown
an upward trend in VRE grid integration. Three of five ESCAP subregions have
demonstrated a steep increasing trend in variable renewable energy generation
and the trend is expected to continue as technology prices drop, and member
States adopt ambitious targets and increasingly robust supporting policy
frameworks. However, a number of challenges and barriers remain to be
overcome in order to accelerate VRE integration within the power sector. The
following areas identified by the participants that attended the Policy Dialogue
should be noted and addressed in developing future programmes at the regional
level:
Grid instability is still considered a significant barrier to integrating higher
rates of VRE. On smaller networks, experience in the region has shown high levels
of VRE integration have led to grid instability issues.
112
Many countries are developing and have unmet and ever-increasing
energy demands. Therefore, a need exists to balance and harmonize short- and
long-term goals for meeting both energy and sustainable development
requirements. This requires strategic and coordinated short- and longer-term
planning.
The use of different technologies and resources creates compatibility and
stability challenges, requiring a comprehensive approach to balancing these
resources.
The Pacific Island States are spearheading the region in setting targets to
rely 100 per cent of its electricity generation from renewable energy, including the
revised Tonga Energy Roadmap. The region largely lacks the same advance
technology capability exhibited by developed nations that have achieved higher
percentage shares of VRE.
Although cases exist in the region where wind-generated electricity is
exhibiting price competitiveness with conventional sources, the unit price of
electricity generated by renewables is generally high. Keeping electricity prices low
is a primary concern for developing countries that need to meet their growth
needs. Improved grid infrastructure and management can mitigate price increases,
but subsidies are needed to promote renewable energy to allow achievement of
scale. Incorporation of externalities into the calculations of energy costs between
resources types can help level the playing fields between fossil fuels and
renewables.
Integration of grid systems and normalizing transmission standards and
grid codes can facilitate integration and enable expansion of energy markets within
subregions and the Asia-Pacific region as a whole.
Cross-border transfer of generation goes hand-in-hand with realization of
economies of scale, especially for member States with lower demand, or where
wind and solar resources exist along border regions. This integration can increase
economics of scale relating to power generation, thereby lowering prices and
113
raising generation efficiencies. Unifying transmission and distribution technologies
can increase domestic and regional energy security and reliability.
Improvement of existing grid networks can reduce losses and help meet
energy demand. These factors, combined with better load balancing, larger
balancing areas including cross-border transmission, can enable higher levels of
VRE integration.
Although countries have different situations, the basics of a solid
regulatory and technical framework are the same. Harmonization of electricity
system standards and grid codes is currently being research by the Association of
Southeast Asian Nations and South Asian Association for Regional Cooperation,
and interest has been demonstrated by the Pacific. This issue offers a potential
focus area for regional cooperation.
Advancement in technology adoption is needed within the region.
Automated operations management, advanced forecasting, effective transmission
system operators can raise the level of VRE grid integration. Further exploration
into solar and wind and solar compatibility and balancing potential is required. At
the same time, with the increase of VRE, the need exists to incorporate storage
solutions such as hydropower pumping.
Knowledge sharing and technology transfer is required to advance VRE
integration. Fostering more South–South cooperation to arrive at best practices
and solutions that can better be applied to the Asia-Pacific context can promote
VRE penetration into energy systems.
Inner Mongolia, China demonstrated a successful case of high level of wind
power integration with approximately 25 per cent wind and 70 per cent coal within
the power mix. Contributing factors include advanced grid operations and cross-
border trade with Mongolia.
China is also exhibiting emerging innovation in energy storage solutions by
paring electric vehicles with smart grid operations and new energy development.
This comprehensive approach enables storage of VRE power, while eliminating
greenhouse gas emissions and improving local air quality.
114
Promoting HELE Coal-Fired Power Plants (CFPPs)
Coal will remain the major source of electricity generation in the Asia-Pacific region
for decades to come due to the continued energy demand growth. The region has
relied on coal to accomplish much of the economic growth, which has enabled
infrastructure development, leading to poverty reduction. Policy makers are aware
of the need to shift towards more efficient coal-fired power plants to minimize
social and environmental impacts. However, the region has not widely adopted
HELE CFPP technologies for cleaner energy.
Although high upfront capital costs of HELE technology represent a large
barrier, the per unit electricity generation cost of HELE technologies are lower
compared with subcritical CFPPs when operations, management and fuel costs are
taken into consideration over a 330-year period. Levelized cost of electricity (LCOE),
incorporating the long-term perspective on costs, is a useful tool for comparing
across various generation technologies, but cannot be the sole metric used when
analyzing power plant cost due to various factors such as fluctuating coal prices
and utilization rates.
A ‘cold war’ exists between coal and renewable energy, which places
interest at odds. Instead, these interest need to be aligned. VRE requires a stable
baseload in order to balance power systems due to various factors such as
fluctuating coal prices and utilization rates.
Climate change is a global issue, which could be better tackled better as a
region, not country by country. The barriers to broader HELE adoption need to be
lowered so that climate change can be addressed on a regional level. The
technology, with both its local and global benefits should not be possessed solely
by those with higher technical and financial capacities. The responsibility to
address the causes of climate change and financial capacities. The responsibility to
address the causes of climate change is the responsibility of all member States and
broader cooperation is required.
115
With vast numbers of subcritical CFPPs currently in operation, it may take
decades to phase out these inefficient plants. The economics covering the entire
value chain, including employment, need to be taken into account before power
plants are shut down in favour of new generation technology.
Long-term sustainable development goals need to be reconciled with
short-term electrification needs in order to avoid locking into technologies for the
next 40 years that will create an abundance of emissions, creating environmental
impacts at local and global levels. Best practices from the region and globally need
to be replicated and improved upon to increase options for member States.
Regional cooperation and knowledge sharing can help reduce some of the
technological gaps between member States with respect to HELE coal-fired
generation. In particular, sharing of policies, regulations, and targets could
facilitate further development of HELE. Funding initiatives to encourage HELE
generation may be also be established.
In Japan, all of the coal-fired power stations are equipped with air
pollution control equipment. Their emissions are controlled by strict regulations.
Power station operators comply with the regulations strictly and sincerely during
the operation. As a result, Japan gains cleaner air ‘Blue Sky’ without air pollution
from the combustion of coal. Japan has coal-fired plants, such as ultra-supercritical,
and promotes utilization of HELE coal-fired power generation technology in
addressing climate change.
The Russian Federation is overhauling its power generation sector and is
looking at integrating best practices not only from within the Russian Federation,
but also from around the world, in an effort to invest in the most cost-effective
and efficient technologies. Working with the private sector and paying for licenses
in order to acquire the most efficient generation technologies is also an option, in
addition to technology transfer and knowledge sharing from member States,
including China and India. Power producers within the Russian Federation are
asking the government to provide cost–benefit analyses as well as risk calculations
associated with these higher efficiency generation technologies in order to

116
determine the cost effectiveness. This illustrates a willingness to move toward
more efficient generation technologies.
117
References
ADB (Asian Development Bank). 2014. Asian Development Outlook 2014
Supplement: Stable Growth Outlook for Developing Asia. Available at:
http://www.adb.org/sites/default/files/publication/42754/ado-supplement-july-
2014.pdf (accessed 14 May 2015).
APEC (Asia-Pacific Economic Cooperation) and ADB (Asian Development Bank).
2013. Energy Outlook for Asia and the Pacific. Available at:
http://adb.org/sites/default/files/pub/2013/energy-outlook.pdf (accessed 14 May
2015).
Beijing Statistical Information. 2015. Urban Transport Statistics. Available at:
http://www.bjstats.gov.cn/bjsq/csjs/ (accessed 14 May 2015).
Bjureby, E., Britten, M. and Cheng, I. 2008. The True Cost of Coal. NRDC, Tsingshua
University, Peking University. Available at:
http://www.greenpeace.org/international/Global/international/planet-
2/report/2008/11/cost-of-coal.pdf (accessed 14 May 2015).
Bloomberg. 2015. Beijing to Shut All Major Coal Power Plants to Cut Pollution.
Published 24 March 2015. Available at:
http://www.bloomberg.com/news/articles/2015-03-24/beijing-to-close-all-major-
coal-power-plants-to-curb-pollution (accessed 14 May 2015).
BNEF (Bloomberg New Energy Finance). 2014. 2030 Market Outlook. Available at:
http://about.bnef.com/events/2030-market-outlook-munich/ (accessed 14 May
2015).
118
CEC. 2011. The Preliminary Statistics of National Electric Power Industry in 2010.
Available at: http://www.cec.org.cn/tongjixinxibu/tongji/niandushuju/2011-02-23/
44236.html (accessed 14 May 2015).
CEER (Council of European Energy Regulators). 2014. Benchmarking Report 5.1 on
the Continuity of Electricity Supply Data – update. Revised version: 11 February
2014. Brussels, Belgium. Available at:
http://www.ceer.eu/portal/page/portal/EER_HOME/EER_PUBLICATIONS/CEER_PA
PERS/Electricity/Tab3/C13-EQS-57-03_BR5.1_19-Dec-2013_updated-Feb-2014.pdf
(accessed 14 May 2015).
Climatescope. 2014. Climatescope 2014 Report by Bloomberg New Energy Finance,
Multilateral Investment Fund Part of the Inter-American Development Bank, UK
Department for International Development, Power Africa. Available at:
http://global-climatescope.org/en/download/reports/countries/climatescope-
2014-ke-en.pdf (accessed 14 May 2015).
Coal India Limited. 2015. Coal India Limited: About Us. Available at:
https://www.coalindia.in/en-us/company/aboutus.aspx (accessed 14 May 2015).
Cochran, J., Bird, L., Heeter, J. and Arent, D.J. 2012. Integrating Variable Renewable
Energy in Electric Power Markets: Best Practices From International Experience,
Summary for Policymakers. National Renewable Energy Laboratory, United States
Department of Energy. Available from
http://www.nrel.gov/docs/fy12osti/53730.pdf (accessed 14 May 2015).
EIA (Energy Information Administration). 2014. Annual Energy Outlook 2014.
Washington, DC, Energy Information Agency, United States Department of Energy.
119
EIA. 2015. International Energy Statistics. Available at:
http://www.eia.gov/forecasts/aeo/ (accessed 14 May 2015).
ESCAP. 2013. The Asian and Pacific Energy Forum. Available at:
http://www.unescap.org/events/asian-and-pacific-energy-forum (accessed 14 May
2015).
ESCAP. 2014. Statistical Yearbook for Asia and the Pacific 2014. Available at:
http://www.unescap.org/sites/default/files/ESCAP-SYB2014.pdf (accessed 14 May
2015).
ESCAP. 2015a. ESCAP Online Statistical Database. Available at:
http://www.unescap.org/stat/data/statdb/DataExplorer.aspx (accessed 14 May
2015).
ESCAP. 2015b. UNESCAP Asia-Pacific Energy Forum Portal. Available at:
http://www.asiapacificenergy.org (accessed 18 May 2015).
Government of India Central Electricity Authority. 2009. National Perspective Plan
for Renovation, Modernisation and Life Extension of Thermal Power Stations (Up To
2016-17), New Delhi, India. Available at: http://www.cea.nic.in/welcome1.html
(accessed 14 May 2015).
Government of India Central Electricity Authority. 2013. Developing Markets for
Implementation of R&M Schemes in Thermal Power Stations in India, New Delhi,
India. Available at: http://www.cea.nic.in/welcome1.html (accessed 14 May 2015).
Gülen, G., Foss, M., Makaryan, R. and Volkov, D. 2009. RPS in Texas – Lessons
Learned and the Way Forward. Houston, TX, University of Texas.
120
Hammond USA. 2015. ReACT coal technology overview for J-COAL. Available at:
http://www.hamonusa.com/hamonresearchcottrell/products/react (accessed 14
May 2015).
Henderson, C. 2013. Upgrading and Efficiency Improvement in Coal-Fired Power
Plants. London, UK, IEA Clean Coal Centre.
IEA (International Energy Agency). 2010. Projected Costs of Generating Electricity,
2010 edition. Available at:
https://www.iea.org/publications/freepublications/publication/projected_costs.pd
f (accessed 18 may 2015).
IEA, 2011. IEA energy for all: Financing access for the poor. Special early excerpt of
the World Energy Outlook 2011. Available at:
http://www.worldenergyoutlook.org/media/weowebsite/energydevelopment/we
o2011_energy_for_all.pdf (accessed 14 May 2015).
IEA. 2012. IEA CCS Retrofit – Analysis of Globally Installed Coal-Fired Power Plant
Fleet. Available at:
https://www.iea.org/publications/freepublications/publication/CCS_Retrofit.pdf
(accessed 18 May 2015).
IEA. 2013a. CO2 Emissions from Fuel Combustion 2013, OECD/IEA, Paris, France.
Available at:
http://www.iea.org/publications/freepublications/publication/co2emissionsfromf
uelcombustionhighlights2013.pdf (accessed 14 May 2015).
121
IEA. 2013b. Technology Roadmap: High-Efficiency, Low-Emissions Coal-Fired Power
Generation, 2013 edition, OECD/IEA, Paris, France. Available at:
http://www.iea.org/publications/freepublications/publication/TechnologyRoadma
pHighEfficiencyLowEmissionsCoalFiredPowerGeneration_Updated.pdf (accessed
14 May 2015).
IEA. 2013c. World Energy Outlook 2013. OECD/IEA, Paris, France. Available at:
http://www.worldenergyoutlook.org/pressmedia/recentpresentations/LondonNov
ember12.pdf (accessed 14 May 2015).
IEA. 2014a. World Energy Outlook 2014. OECD/IEA, Paris, France. Available at;
https://www.iea.org/Textbase/npsum/WEO2014SUM.pdf (accessed 14 May 2015).
IEA, 2014b. World Energy Investment Outlook 2014. Available at:
https://www.iea.org/publications/freepublications/publication/WEIO2014.pdf
(accessed 14 May 2015).
IEA. 2014c. Emissions Reduction through Upgrade of Coal-Fired Power Plants:
Learning from Chinese Experience 2014, OECD/IEA, Paris, France. Available at:
https://www.iea.org/publications/freepublications/publication/PartnerCountrySer
iesEmissionsReductionthroughUpgradeofCoalFiredPowerPlants.pdf (accessed 14
May 2015).
IEA. 2014d. The power of transformation – Wind, sun and the economics of flexible
power systems. OECD/IEA, Paris, France. Available at: http://www.oecd-
berlin.de/reviews/The_Power_of_Transformation_Intro.php?id=76743461249516
15 (accessed 14 May 2015).
IRENA (International Renewable Energy Agency). 2015. Renewable Power
Generation Costs in 2014. Available at:
122
http://www.irena.org/DocumentDownloads/Publications/IRENA_RE_Power_Costs
_2014_report.pdf (accessed 14 May 2015).
Minchener, A. 2010. Developments in China’s coal-fired power sector. London, UK,
IEA Clean Coal Center.
Ministry of Coal, India. 2015. Policies and Guidelines. Available at:
http://www.coal.nic.in/content/policies-and-guidelines (accessed 14 May 2015).
MIT (Massachusetts Institute of Technology). 2007. The Future of Coal: An Interdisciplinary
MIT Study. Boston, MA, MIT.
NEDO (New Energy and Industrial Technology Development Organization). 2006.
Japan Coal Energy Center. Clean Coal Technologies in Japan Technological
Innovation in the Coal Industry. Available at:
http://www.nedo.go.jp/content/100079772.pdf (accessed 14 May 2015).
NREL (National Renewable Energy Laboratory). 2004. Energy Efficiency and
Renewable Energy, PV FAQs. Washington DC, US Department of Energy.
REN21. 2014. Renewables 2014 Global Status Report. Available at:
http://www.ren21.net/portals/0/documents/resources/gsr/2014/gsr2014_full%20
report_low%20res.pdf (accessed 14 May 2015).
SE4ALL (Sustainable Energy For All). 2013. The 2013 Global Tracking Framework
Report. Available at: https://openknowledge.worldbank.org/handle/10986/16537
(accessed 14 May 2015).
The United Nations. 2008. International Standard Industrial Classification of All
Economic Activities. ST/ESA/STAT/SER.M/4/Rev.4. Available at:
123
http://unstats.un.org/unsd/publication/seriesM/seriesm_4rev4e.pdf (accessed 14
May 2015).
The United Nations. 2014. The Millennium Development Goals Report 2014: 9.
Available at:
http://www.un.org/millenniumgoals/2014%20MDG%20report/MDG%202014%20
English%20web.pdf (accessed 14 May 2015).
UNDP. 2014. Human Development Reports Data. Available at:
hdr.undp.org/en/data (accessed 18 May 2015).
UNEP (United Nations Environment Programme). 2014. UNEP BNEF Global Trends
in Renewable Energy Investment 2014. Available at: http://fs-unep-
centre.org/system/files/globaltrendsreport2014.pdf (accessed 14 May 2015).
USEPA (United States Environmental Protection Agency). 2012. Particulate Matter
(PM-10). Available at: http://www.epa.gov/airtrends/aqtrnd95/pm10.html
(accessed 18 May 2015).
VGB (VGB PowerTech e.V.). 2011. Electricity Generation 2011/2012, Facts and
Figures, Essen, Germany. Available at:
http://www.vgb.org/en/data_powergeneration.html (accessed 24 May 2015).
WHO (World Health Organisation). 2014a. WHO Indoor Air Quality Guidelines:
Household fuel combustion. Available at;
http://www.who.int/indoorair/guidelines/hhfc/HHFC_guidelines.pdf (accessed 14
May 2015).
124
WHO. 2014b. Ambient (Outdoor) Air pollution in Cities Database 2014. Available at:
http://www.who.int/quantifying_ehimpacts/national/countryprofile/AAP_PM_dat
abase_May2014.xls (accessed 14 May 2015).
WHO. 2015a. Global Health Observatory (GHO) data. Available at:
http://www.who.int/gho/phe/outdoor_air_pollution/en/ (accessed 14 May 2015).
WHO. 2015b. Ambient (outdoor) air pollution in cities database 2014. Available at:
http://www.who.int/phe/health_topics/outdoorair/databases/cities/en/ (accessed
14 May 2015).
World Bank. 2015.
http://data.worldbank.org/indicator/EN.ATM.PM10.MC.M3/countries/US--
XS?display=graph (accessed 14 May 2015).
WCA (World Coal Association). 2012a. Coal Matters: Coal and Electricity
Generation. London, UK, WCA.
WCA. 2012b. World Coal Association, Improving Efficiency. WCA, London, UK.
Available at: http://www.worldcoal.org/coal-the-environment/coal-use-the-
environment/improving-efficiencies/ (accessed 14 May 2015).
Yue, L. 2012. Dynamics of clean coal-fired power generation development in China.
Energy Policy 51: 138–142.
Yuhong, H. and Yongxu, H. 2012. Prospects for cleaner and more efficient coal
production and utilization technologies in North-East Asia: China country study.
Bangkok, ESCAP.
125
Zhu, B. and Zhao, Y. 2008. Development of ultra-supercritical power generation
technology in China. Huadian Technology 30(2):1–5.
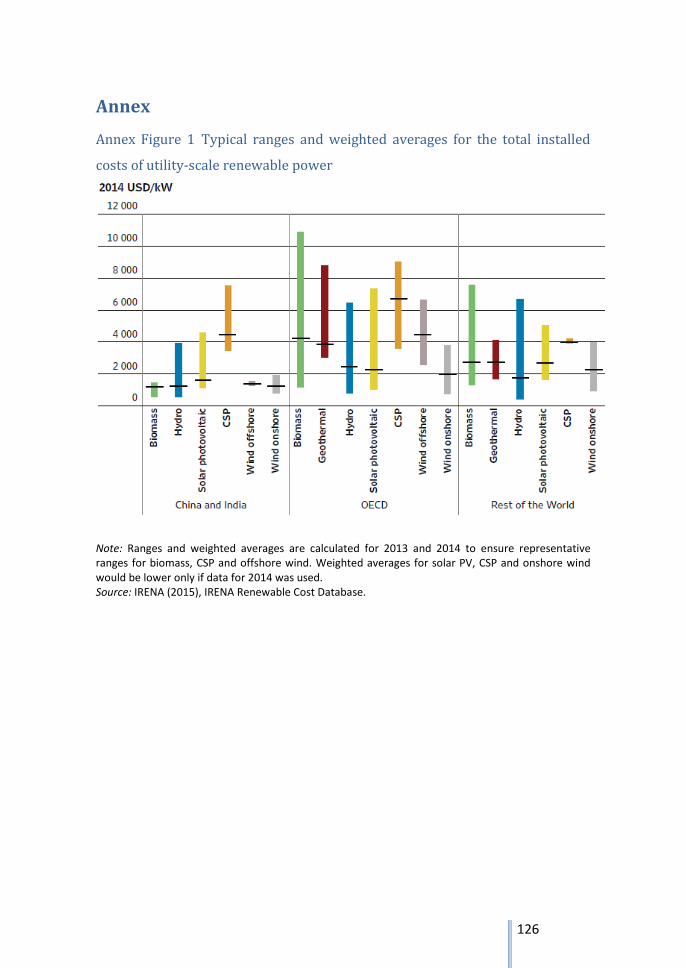
126
Annex
Annex Figure 1 Typical ranges and weighted averages for the total installed
costs of utility-scale renewable power
Note: Ranges and weighted averages are calculated for 2013 and 2014 to ensure representative ranges for biomass, CSP and offshore wind. Weighted averages for solar PV, CSP and onshore wind would be lower only if data for 2014 was used. Source: IRENA (2015), IRENA Renewable Cost Database.
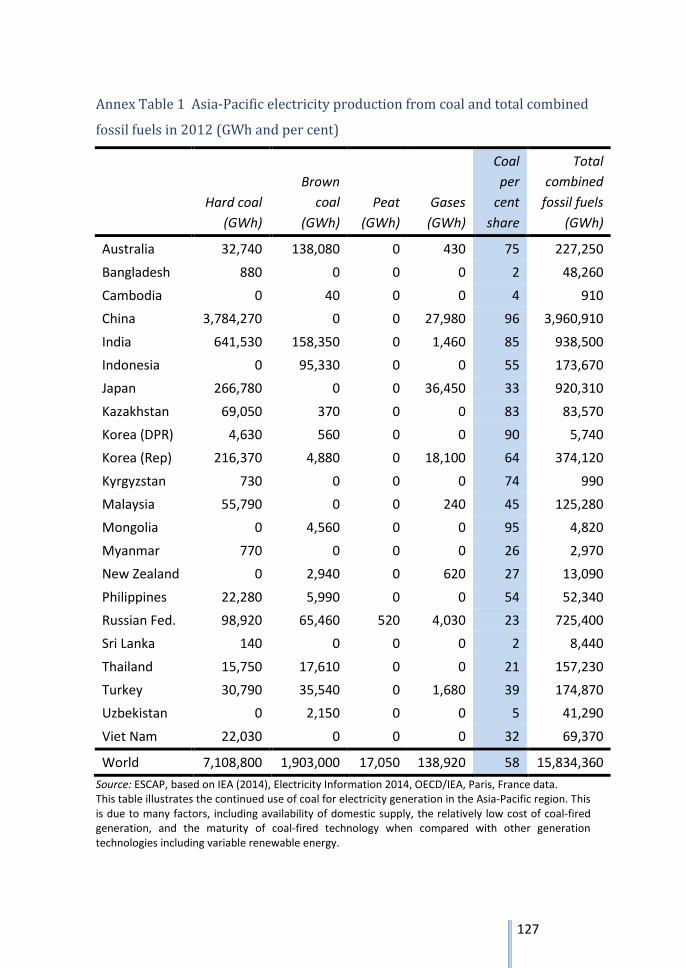
127
Annex Table 1 Asia-Pacific electricity production from coal and total combined
fossil fuels in 2012 (GWh and per cent)
Hard coal
(GWh)
Brown
coal
(GWh)
Peat
(GWh)
Gases
(GWh)
Coal
per
cent
share
Total
combined
fossil fuels
(GWh)
Australia 32,740 138,080 0 430 75 227,250
Bangladesh 880 0 0 0 2 48,260
Cambodia 0 40 0 0 4 910
China 3,784,270 0 0 27,980 96 3,960,910
India 641,530 158,350 0 1,460 85 938,500
Indonesia 0 95,330 0 0 55 173,670
Japan 266,780 0 0 36,450 33 920,310
Kazakhstan 69,050 370 0 0 83 83,570
Korea (DPR) 4,630 560 0 0 90 5,740
Korea (Rep) 216,370 4,880 0 18,100 64 374,120
Kyrgyzstan 730 0 0 0 74 990
Malaysia 55,790 0 0 240 45 125,280
Mongolia 0 4,560 0 0 95 4,820
Myanmar 770 0 0 0 26 2,970
New Zealand 0 2,940 0 620 27 13,090
Philippines 22,280 5,990 0 0 54 52,340
Russian Fed. 98,920 65,460 520 4,030 23 725,400
Sri Lanka 140 0 0 0 2 8,440
Thailand 15,750 17,610 0 0 21 157,230
Turkey 30,790 35,540 0 1,680 39 174,870
Uzbekistan 0 2,150 0 0 5 41,290
Viet Nam 22,030 0 0 0 32 69,370
World 7,108,800 1,903,000 17,050 138,920 58 15,834,360
Source: ESCAP, based on IEA (2014), Electricity Information 2014, OECD/IEA, Paris, France data. This table illustrates the continued use of coal for electricity generation in the Asia-Pacific region. This is due to many factors, including availability of domestic supply, the relatively low cost of coal-fired generation, and the maturity of coal-fired technology when compared with other generation technologies including variable renewable energy.

United Nations Economic and Social Commission for Asia and the PacificUnited Nations BuildingRajadamnern Nok AvenueBangkok, Thailand 10200
www.unescap.org