Embed Size (px)
DESCRIPTION
Registered Nurses and Primary Care Physicians:. How will Minnesota’s talent pool fare in the next 10 years?. Contents. Introduction About This Study Executive Summary Registered Nurses (RNs): Projected Surplus Forecast of current workforce (existing supply) - PowerPoint PPT Presentation
Citation preview

Place picture here
Registered Nurses and
Primary Care Physicians:
How will Minnesota’s talent pool fare in
the next 10 years?
July 2014
Contents
Introduction About This Study Executive Summary Registered Nurses (RNs): Projected Surplus
• Forecast of current workforce (existing supply)• Forecast of new graduates (future supply)• Forecast of demand
Primary Care Physicians (PCPs): Projected Shortfall• Forecast of current workforce (existing supply)• Forecast of new graduates (future supply)• Forecast of demand
Appendix• Assumptions and methods• Data sources• Definitions
2
Introduction
3
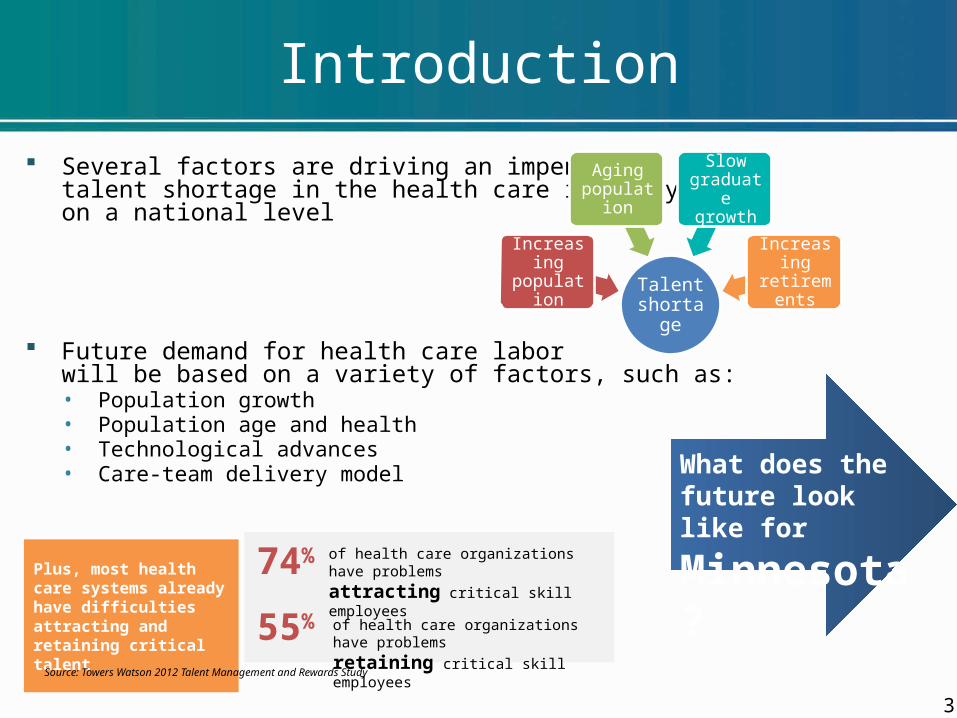
Plus, most health care systems already have difficulties attracting and retaining critical talent
of health care organizations have problems
attracting critical skill employees74%
55% of health care organizations have problems
retaining critical skill employees
Source: Towers Watson 2012 Talent Management and Rewards Study
Several factors are driving an impending talent shortage in the health care industry on a national level
Future demand for health care labor will be based on a variety of factors, such as:• Population growth• Population age and health• Technological advances• Care-team delivery model
Talent shortage
Increasing population
Aging population
Slow graduate growth
Increasing retirements
What does the future look like for
Minnesota?
About This Study
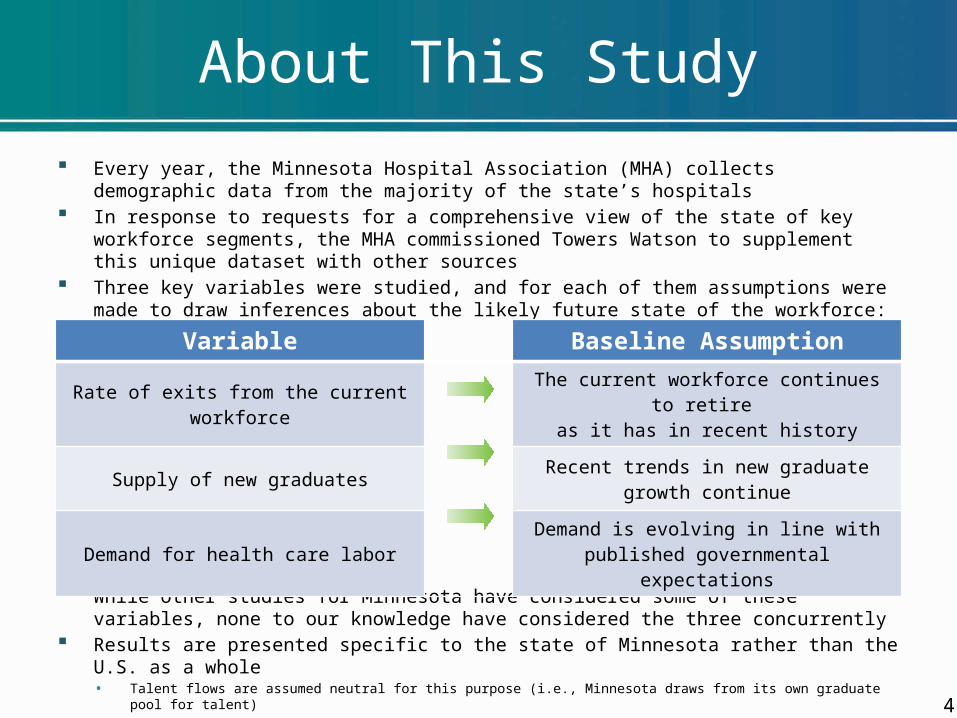
Every year, the Minnesota Hospital Association (MHA) collects demographic data from the majority of the state’s hospitals
In response to requests for a comprehensive view of the state of key workforce segments, the MHA commissioned Towers Watson to supplement this unique dataset with other sources
Three key variables were studied, and for each of them assumptions were made to draw inferences about the likely future state of the workforce:
While other studies for Minnesota have considered some of these variables, none to our knowledge have considered the three concurrently
Results are presented specific to the state of Minnesota rather than the U.S. as a whole• Talent flows are assumed neutral for this purpose (i.e., Minnesota draws from its own graduate pool for talent)
Detailed methodology definitions and assumptions can be found in the appendix
4
Variable Baseline Assumption
Rate of exits from the current workforce The current workforce continues to retire as it has in recent history
Supply of new graduates Recent trends in new graduate growth continue
Demand for health care labor Demand is evolving in line with published governmental expectations
RN Supply:
Likely Sufficient for the next 10 years
PCP Supply:
Likely Insufficient for the next 10 years
Executive Summary
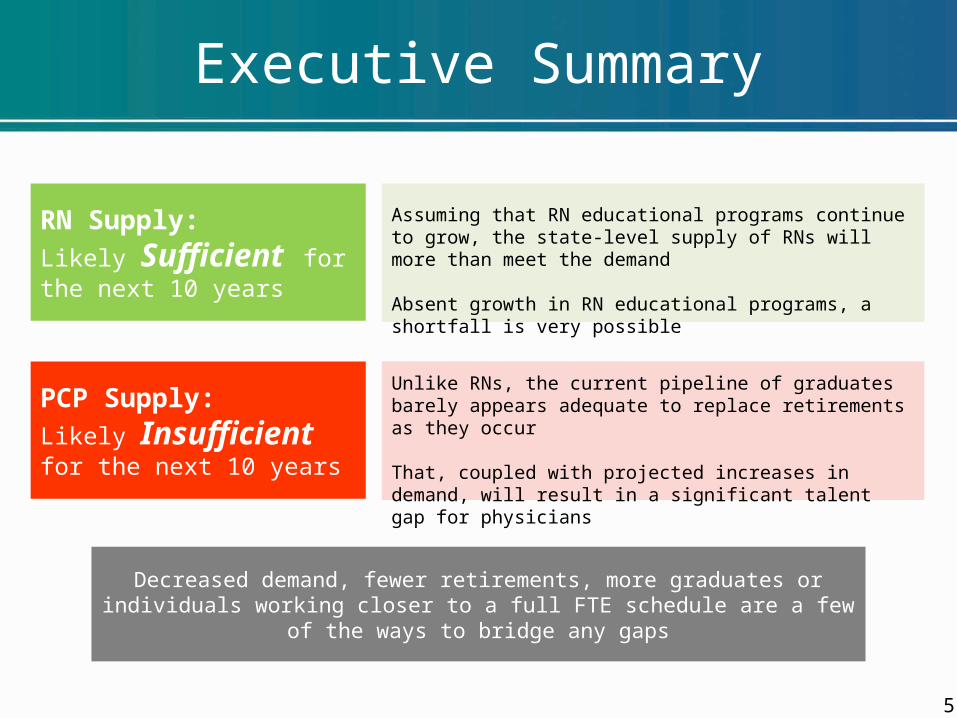
Assuming that RN educational programs continue to grow, the state-level supply of RNs will more than meet the demand
Absent growth in RN educational programs, a shortfall is very possible
Unlike RNs, the current pipeline of graduates barely appears adequate to replace retirements as they occur
That, coupled with projected increases in demand, will result in a significant talent gap for physicians
Decreased demand, fewer retirements, more graduates or individuals working closer to a full FTE schedule are a few of the ways to bridge any gaps
5
RN Existing Supply
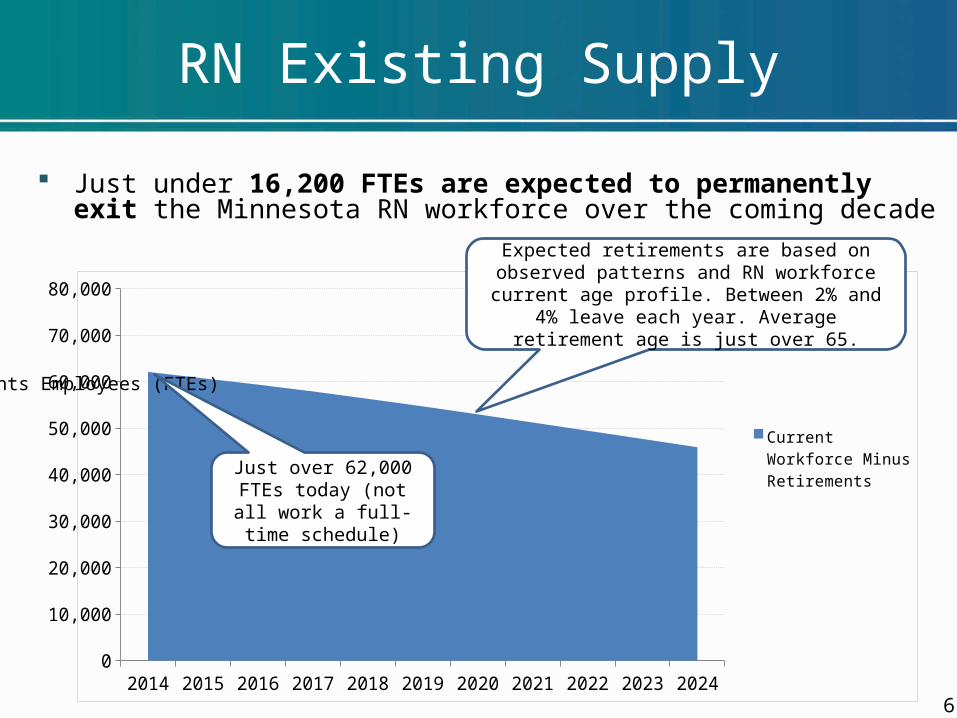
Just under 16,200 FTEs are expected to permanently exit the Minnesota RN workforce over the coming decade
62014 2015 2016 2017 2018 2019 2020 2021 2022 2023 2024
0
10,000
20,000
30,000
40,000
50,000
60,000
70,000
80,000
Current Workforce Minus Retirements
Ful
l-Tim
e E
qui
vale
nts
Em
plo
yee
s (F
TE
s)
Just over 62,000 FTEs today (not all work a full-time schedule)
Expected retirements are based on observed patterns and RN workforce current age profile. Between 2% and 4% leave each year. Average
retirement age is just over 65.
RN Future Supply
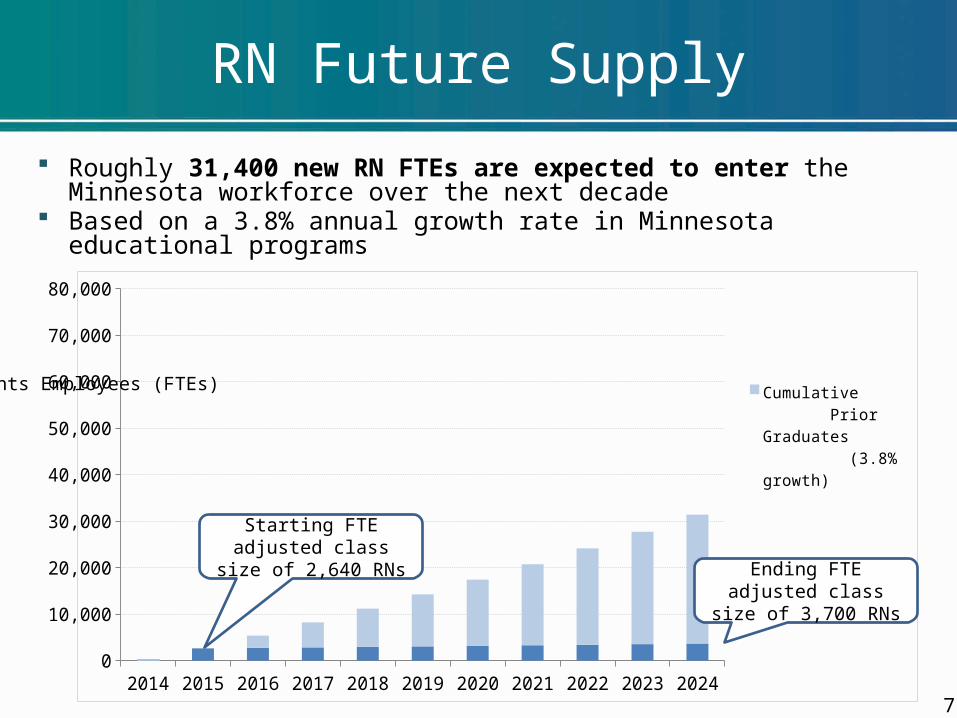
Roughly 31,400 new RN FTEs are expected to enter the Minnesota workforce over the next decade
Based on a 3.8% annual growth rate in Minnesota educational programs
72014 2015 2016 2017 2018 2019 2020 2021 2022 2023 2024
0
10,000
20,000
30,000
40,000
50,000
60,000
70,000
80,000
Cumulative Prior Graduates (3.8% growth)
Current Year Grad-uates (3.8% Growth)
Ful
l-Tim
e E
qui
vale
nts
Em
plo
yee
s (F
TE
s)
Starting FTE adjusted class size of 2,640 RNs
Ending FTE adjusted class size of 3,700 RNs
RN Projected Surplus
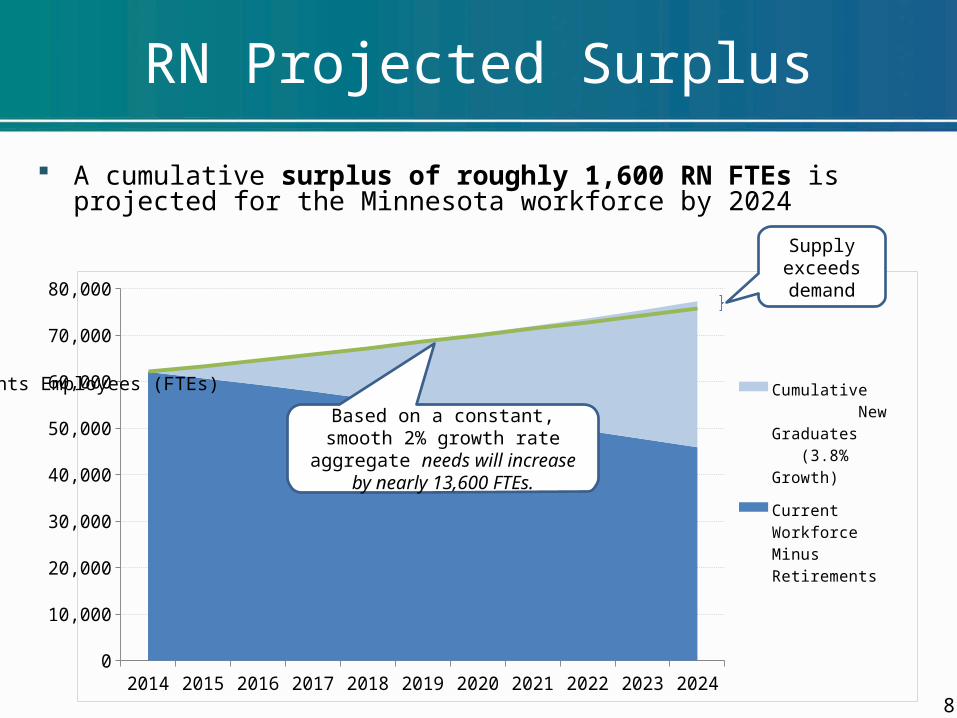
A cumulative surplus of roughly 1,600 RN FTEs is projected for the Minnesota workforce by 2024
82014 2015 2016 2017 2018 2019 2020 2021 2022 2023 2024
0
10,000
20,000
30,000
40,000
50,000
60,000
70,000
80,000
Cumulative New Graduates (3.8% Growth)
Current Workforce Minus Retirements
Projected Demand (2% Growth)
Ful
l-Tim
e E
qui
vale
nts
Em
plo
yee
s (F
TE
s)
Supply exceeds demand
Based on a constant, smooth 2% growth rate aggregate needs will increase by nearly 13,600 FTEs.
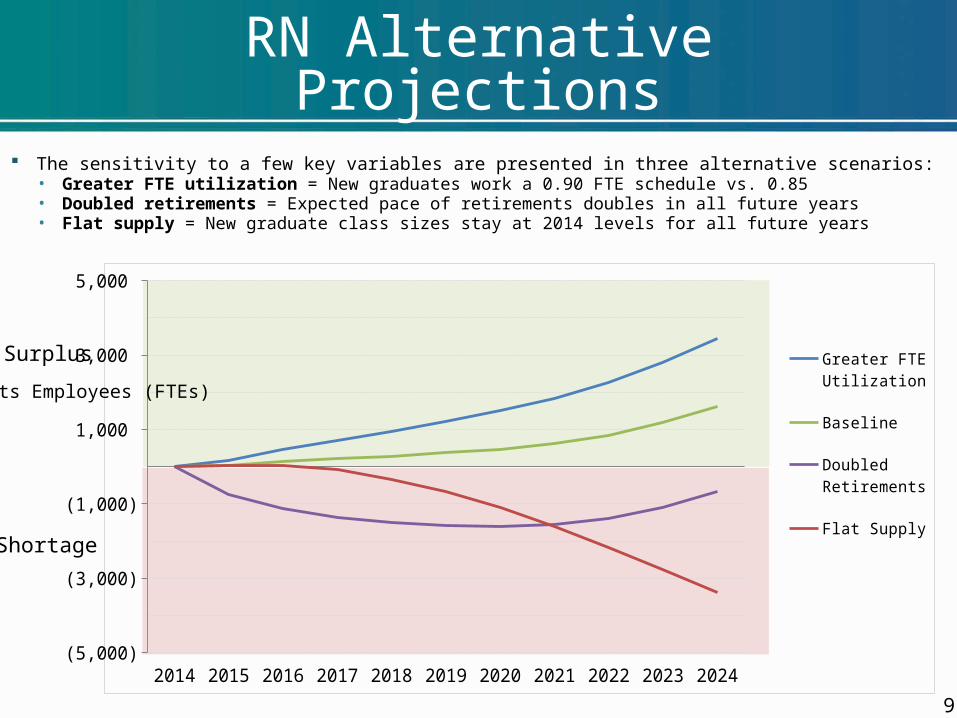
2014 2015 2016 2017 2018 2019 2020 2021 2022 2023 2024(5,000)
(3,000)
(1,000)
1,000
3,000
5,000
Greater FTE Uti-lization
Baseline
Doubled Re-tirements
Flat Supply
RN Alternative Projections
The sensitivity to a few key variables are presented in three alternative scenarios:• Greater FTE utilization = New graduates work a 0.90 FTE schedule vs. 0.85• Doubled retirements = Expected pace of retirements doubles in all future years• Flat supply = New graduate class sizes stay at 2014 levels for all future years
9
Sur
plus
Sho
rtag
eF
ull-T
ime
Eq
uiva
lent
s E
mpl
oye
es
(FT
Es)
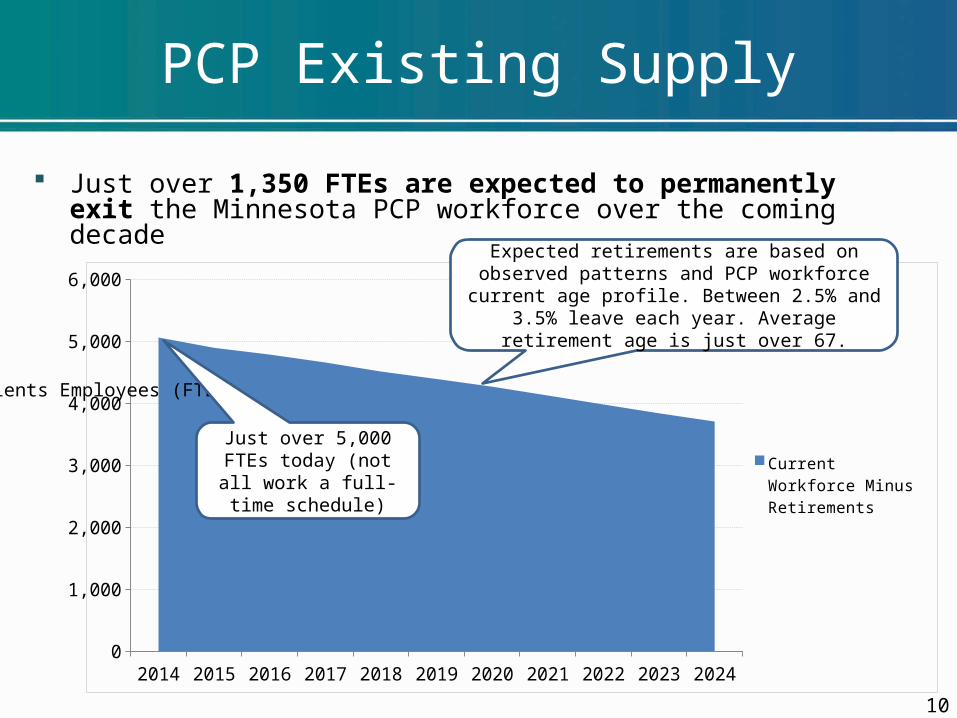
Just over 1,350 FTEs are expected to permanently exit the Minnesota PCP workforce over the coming decade
PCP Existing Supply
10
2014 2015 2016 2017 2018 2019 2020 2021 2022 2023 20240
1,000
2,000
3,000
4,000
5,000
6,000
Current Workforce Minus Retirements
Ful
l-Tim
e E
qui
vale
nts
Em
plo
yee
s (F
TE
s)
Just over 5,000 FTEs today (not all work a full-time schedule)
Expected retirements are based on observed patterns and PCP workforce current age profile.
Between 2.5% and 3.5% leave each year. Average retirement age is just over 67.

Just over 1,300 FTEs are expected to enter the Minnesota workforce over the next decade
Based on no annual growth in Minnesota educational programs
PCP Future Supply
2014 2015 2016 2017 2018 2019 2020 2021 2022 2023 20240
1,000
2,000
3,000
4,000
5,000
6,000
Cumulative Prior Graduates (No Growth)
Current Year Graduates (No Growth)
Ful
l-Tim
e E
qui
vale
nts
Em
plo
yee
s (F
TE
s)
FTE adjusted class size of 133 held constant
11
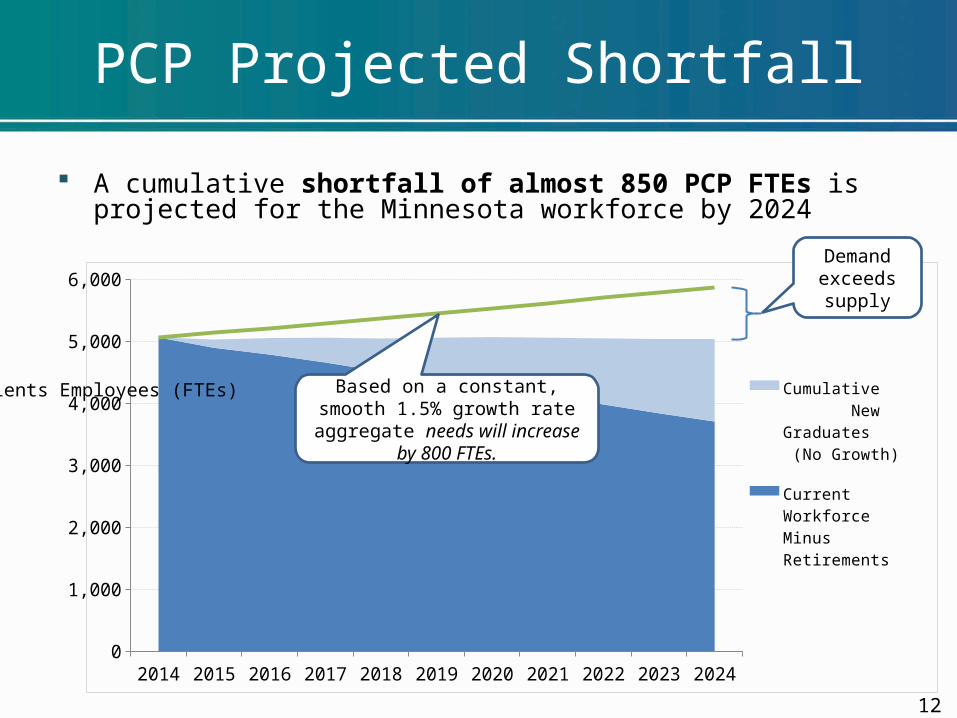
A cumulative shortfall of almost 850 PCP FTEs is projected for the Minnesota workforce by 2024
PCP Projected Shortfall
2014 2015 2016 2017 2018 2019 2020 2021 2022 2023 20240
1,000
2,000
3,000
4,000
5,000
6,000
Cumulative New Graduates (No Growth)
Current Workforce Minus Retirements
Projected Demand (1.5% Growth)
Ful
l-Tim
e E
qui
vale
nts
Em
plo
yee
s (F
TE
s)
Based on a constant, smooth 1.5% growth rate aggregate
needs will increase by 800 FTEs.
Demand exceeds supply
12
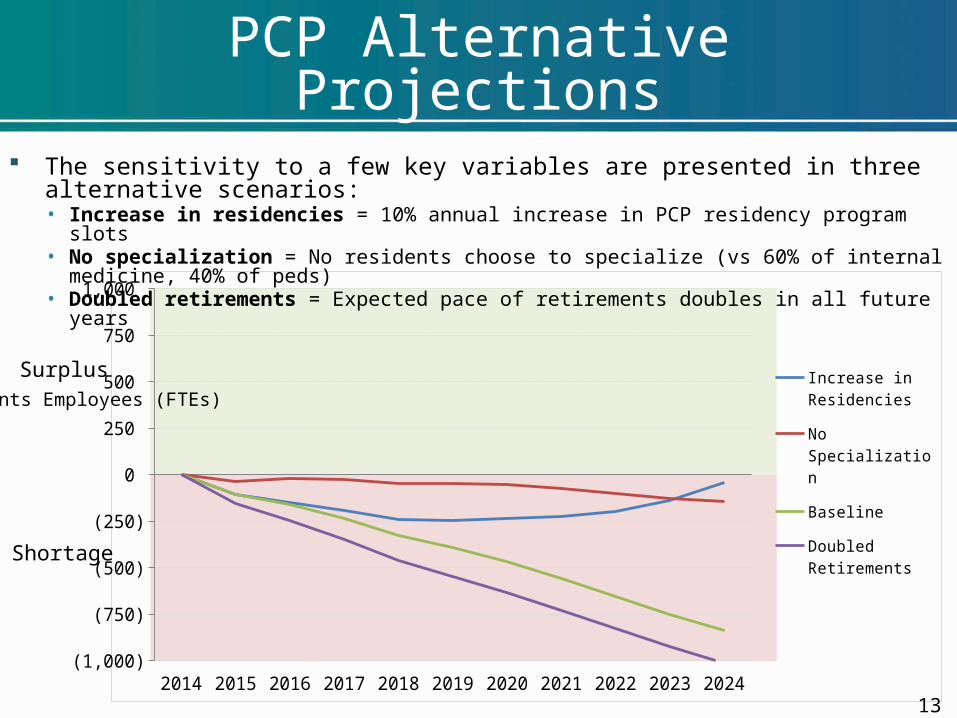
2014 2015 2016 2017 2018 2019 2020 2021 2022 2023 2024(1,000)
(750)
(500)
(250)
0
250
500
750
1,000
Increase in Res-idencies
No Specialization
Baseline
Doubled Re-tirements
PCP Alternative Projections
The sensitivity to a few key variables are presented in three alternative scenarios:• Increase in residencies = 10% annual increase in PCP residency program slots• No specialization = No residents choose to specialize (vs 60% of internal medicine, 40% of peds)• Doubled retirements = Expected pace of retirements doubles in all future years
13
Sur
plus
Sho
rtag
e
Ful
l-Tim
e E
qui
vale
nts
Em
plo
yee
s (F
TE
s)
Summary Findings
Careful long-term planning and decisive short-term action will be critical to the continued success of Minnesota’s health care delivery system
Absent fundamental changes to the number of graduates, model of care delivery or other decrease in projected demand, there will indeed be a shortfall of PCPs
Without strong continued growth in the output of RN educational programs or other transformational change, there is likely to be a shortfall in this workforce segment as well
Minnesota health care organizations will need to take action to ensure they have access to the talent needed to successfully deliver quality care
14
Appendix
Key Methods and Assumptions RN Methods and Assumptions
• Current workforce supply• New graduates• Labor demand/needs• Historical trending data of age distributions and retirement
PCP Methods and Assumptions• Current workforce supply• New graduates• Labor demand/needs• Historical trending data of age distributions and retirement
Data Sources Definitions
15
Key Methods and Assumptions
In addition to the data sources and assumptions explicitly pointed out in the body of this report, the following additional assumptions are implied in all analysis presented:
There will be no shortage in qualified adults available to enter RN and PCP educational programs
The state of the Minnesota health care workforce is assumed to be in equilibrium as a starting point (i.e., there are no systemic unfilled vacancies nor substantial unemployment)• Recent MDH data indicates that generally only 3% – 6% of licensed RNs seeking employment are unemployed
Exits from the workforce other than for death, long-term disability or retirement are assumed to reenter the workforce (i.e., turnover is assumed to be a transfer from one organization to another)
The flow of talent between Minnesota and other states is neutral on a net basis (i.e., for every termination of employment for state emigration a new Minnesota state immigrant is assumed)• AAMC data on residency retention shows Minnesota similar to the national average• RN retention data from the Minnesota Board of Nursing shows retention of new graduates in the high-80 to low-90
percent ranges depending on degree type (lower retention for higher degrees)• In the long-term this condition may be difficult to hold if the rest of the U.S. either develops a surplus or shortage at
different rates than Minnesota
The MHA workforce planning tool is used for projecting forward the current starting workforce
No change in FTE preferences of employees/employers (0.85 for RN, 0.90 for PCP)
Demand increases are illustrated in a constant, smooth pattern; actual increases will be variable
16
RN Current Workforce Supply
The Minnesota Department of Health (MDH) tracks active licensure information, and also surveys RNs regarding their practices• The most recent reporting shows 75,301 individuals licensed and located in Minnesota• However 3% of these individuals are retired, on long-term leave or are students• Thus 73,042 individuals are working in some capacity or seeking employment• On average these individuals work a 0.85 FTE schedule• Yielding 62,086 FTEs of current workforce supply
The MHA workforce tool’s dataset covers almost all hospitals and some clinics and other facilities (but not other nontraditional roles like call centers)• A total of 28,011 FTEs are covered by this dataset (38,134 individuals)• The age distribution is similar to that reported by the MDH, so the MHA dataset was
scaled up to the aggregate current FTE supply (62,086) for projection purposes• Those identified as working in APRN roles (APRN, CRNA, nurse practitioner, etc.) are
included in the projection as these individuals are sourced from the same pool of graduates as those practicing in traditional nursing roles
• It is recognized that APRNs do not have the same scope of responsibilities, but nonetheless they are a source of demand for RN employment and so are critical to accurately capturing the aggregate long-term balance for the nursing profession
Exits from the population due to permanent disability, death and retirement are modeled using assumptions derived from the MHA workforce tool dataset (see page 20 for details of this assumption set)
17
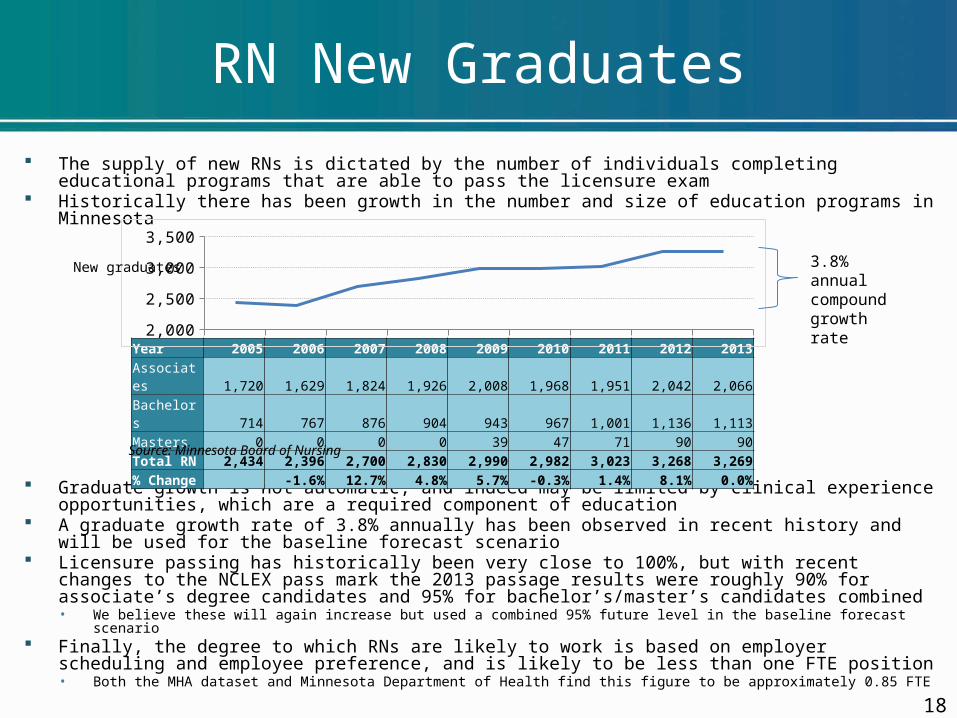
RN New Graduates
The supply of new RNs is dictated by the number of individuals completing educational programs that are able to pass the licensure exam
Historically there has been growth in the number and size of education programs in Minnesota
Graduate growth is not automatic, and indeed may be limited by clinical experience opportunities, which are a required component of education
A graduate growth rate of 3.8% annually has been observed in recent history and will be used for the baseline forecast scenario
Licensure passing has historically been very close to 100%, but with recent changes to the NCLEX pass mark the 2013 passage results were roughly 90% for associate’s degree candidates and 95% for bachelor’s/master’s candidates combined• We believe these will again increase but used a combined 95% future level in the baseline forecast scenario
Finally, the degree to which RNs are likely to work is based on employer scheduling and employee preference, and is likely to be less than one FTE position• Both the MHA dataset and Minnesota Department of Health find this figure to be approximately 0.85 FTE
18
Year 2005 2006 2007 2008 2009 2010 2011 2012 2013Associates 1,720 1,629 1,824 1,926 2,008 1,968 1,951 2,042 2,066Bachelors 714 767 876 904 943 967 1,001 1,136 1,113Masters 0 0 0 0 39 47 71 90 90Total RN 2,434 2,396 2,700 2,830 2,990 2,982 3,023 3,268 3,269% Change -1.6% 12.7% 4.8% 5.7% -0.3% 1.4% 8.1% 0.0%
Source: Minnesota Board of Nursing
2,000
2,500
3,000
3,500
3.8% annual compound growth rate
New
gra
duat
es
RN Labor Demand/Needs
The U.S. Bureau of Labor Statistics (BLS), and its state-level counterpart, the Minnesota Department of Employment and Economic Development (DEED), provide employment outlooks for industries and specific jobs based on expectations about population growth, demographics and other macroeconomic variables
The 2010 – 2020 projections from DEED are summarized below• 2010 estimated employment of 57,259 positions, 2020 of 69,867 positions• Implied annual compound growth of 2.0%
The 2012 – 2022 U.S. projections from BLS are summarized below• 2012 estimated employment of 2,862,900 positions, 2022 of 3,437,300 positions• Implied annual compound growth of 1.8%
BLS and DEED projections do not provide an annual progression, so a smooth, compound growth rate is used in the forecast illustrations
Baseline forecast scenario uses a 2% annual compound growth rate
19
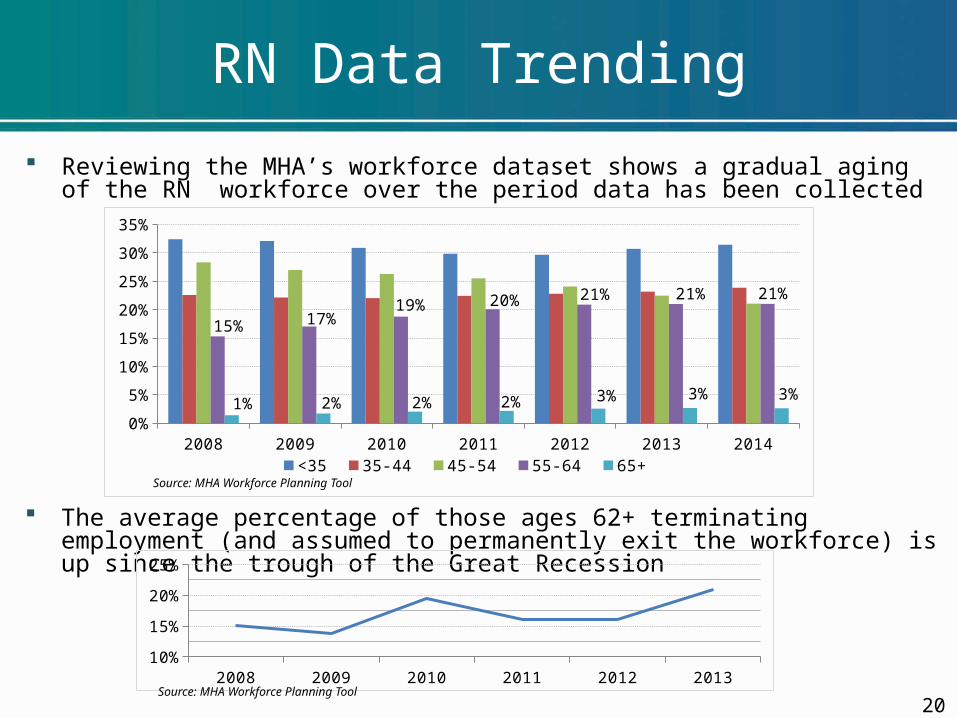
RN Data Trending
Reviewing the MHA’s workforce dataset shows a gradual aging of the RN workforce over the period data has been collected
2008 2009 2010 2011 2012 2013 20140%
5%
10%
15%
20%
25%
30%
35%
15% 17%19% 20% 21% 21% 21%
1% 2% 2% 2% 3% 3% 3%
<35 35-44 45-54 55-64 65+
The average percentage of those ages 62+ terminating employment (and assumed to permanently exit the workforce) is up since the trough of the Great Recession
Source: MHA Workforce Planning Tool
2008 2009 2010 2011 2012 201310%
15%
20%
25%
Source: MHA Workforce Planning Tool
20
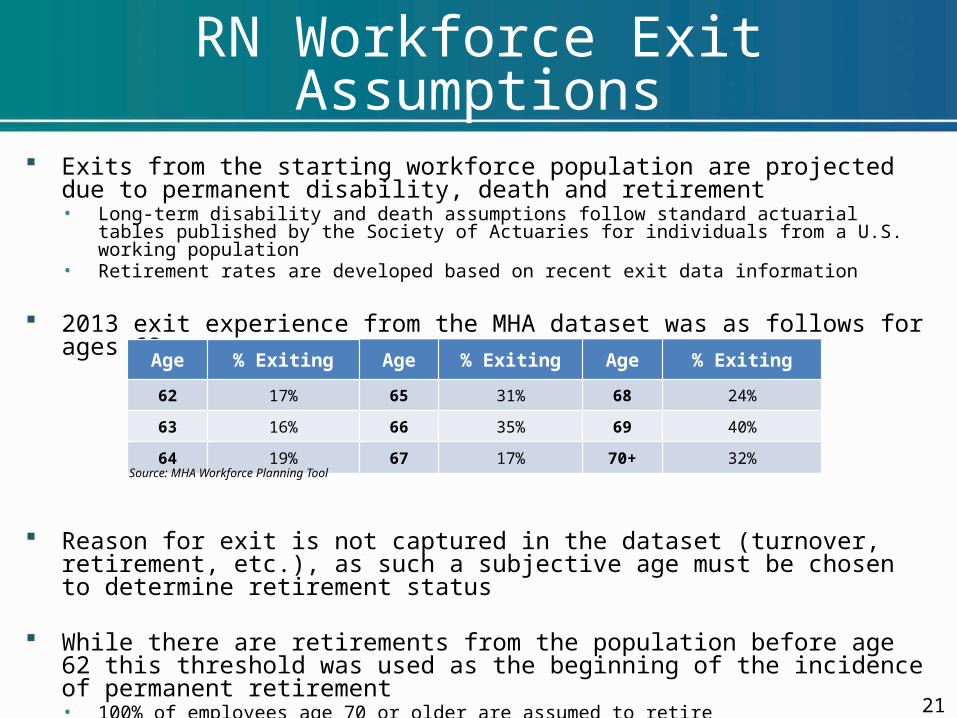
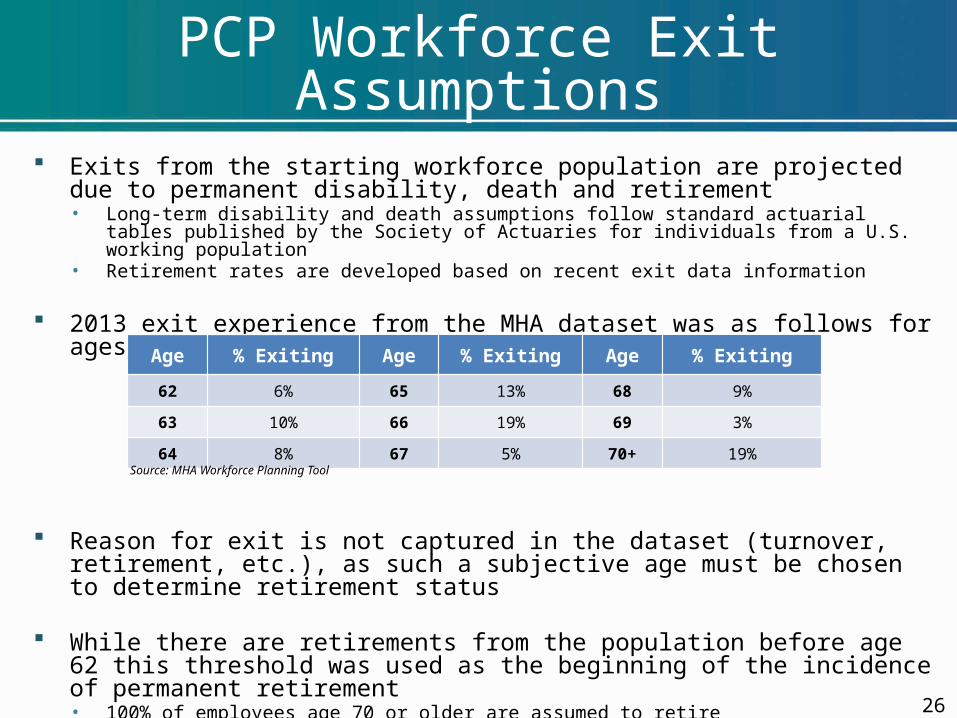
RN Workforce Exit Assumptions
Exits from the starting workforce population are projected due to permanent disability, death and retirement• Long-term disability and death assumptions follow standard actuarial tables published by the
Society of Actuaries for individuals from a U.S. working population• Retirement rates are developed based on recent exit data information
2013 exit experience from the MHA dataset was as follows for ages 62+
Reason for exit is not captured in the dataset (turnover, retirement, etc.), as such a subjective age must be chosen to determine retirement status
While there are retirements from the population before age 62 this threshold was used as the beginning of the incidence of permanent retirement• 100% of employees age 70 or older are assumed to retire• Assumption set creates an average weighted retirement age of 65.2
21
Age % Exiting Age % Exiting Age % Exiting
62 17% 65 31% 68 24%
63 16% 66 35% 69 40%
64 19% 67 17% 70+ 32%
Source: MHA Workforce Planning Tool
PCP Current Workforce Supply
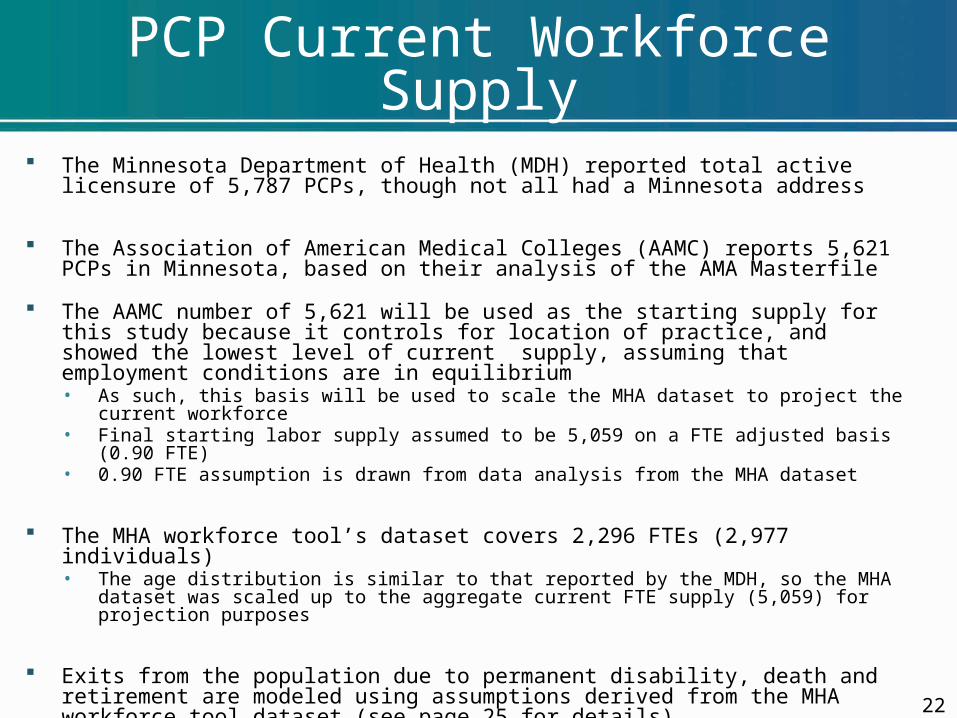
The Minnesota Department of Health (MDH) reported total active licensure of 5,787 PCPs, though not all had a Minnesota address
The Association of American Medical Colleges (AAMC) reports 5,621 PCPs in Minnesota, based on their analysis of the AMA Masterfile
The AAMC number of 5,621 will be used as the starting supply for this study because it controls for location of practice, and showed the lowest level of current supply, assuming that employment conditions are in equilibrium • As such, this basis will be used to scale the MHA dataset to project the current workforce• Final starting labor supply assumed to be 5,059 on a FTE adjusted basis (0.90 FTE)• 0.90 FTE assumption is drawn from data analysis from the MHA dataset
The MHA workforce tool’s dataset covers 2,296 FTEs (2,977 individuals)• The age distribution is similar to that reported by the MDH, so the MHA dataset was scaled up to
the aggregate current FTE supply (5,059) for projection purposes
Exits from the population due to permanent disability, death and retirement are modeled using assumptions derived from the MHA workforce tool dataset (see page 25 for details)
22
PCP New Graduates
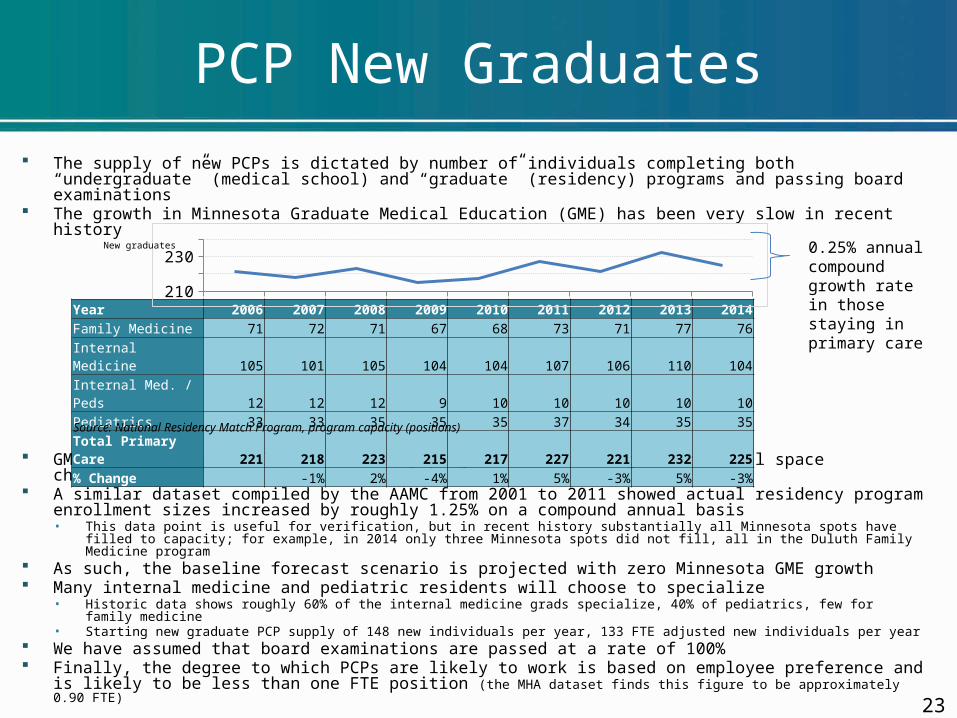
The supply of new PCPs is dictated by number of individuals completing both “undergraduate” (medical school) and “graduate” (residency) programs and passing board examinations
The growth in Minnesota Graduate Medical Education (GME) has been very slow in recent history
GME growth is difficult, as residency programs face funding and clinical space challenges A similar dataset compiled by the AAMC from 2001 to 2011 showed actual residency program enrollment
sizes increased by roughly 1.25% on a compound annual basis• This data point is useful for verification, but in recent history substantially all Minnesota spots have filled to capacity; for
example, in 2014 only three Minnesota spots did not fill, all in the Duluth Family Medicine program As such, the baseline forecast scenario is projected with zero Minnesota GME growth Many internal medicine and pediatric residents will choose to specialize
• Historic data shows roughly 60% of the internal medicine grads specialize, 40% of pediatrics, few for family medicine• Starting new graduate PCP supply of 148 new individuals per year, 133 FTE adjusted new individuals per year
We have assumed that board examinations are passed at a rate of 100% Finally, the degree to which PCPs are likely to work is based on employee preference and is likely to be
less than one FTE position (the MHA dataset finds this figure to be approximately 0.90 FTE)
Year 2006 2007 2008 2009 2010 2011 2012 2013 2014Family Medicine 71 72 71 67 68 73 71 77 76Internal Medicine 105 101 105 104 104 107 106 110 104Internal Med. / Peds 12 12 12 9 10 10 10 10 10Pediatrics 33 33 35 35 35 37 34 35 35Total Primary Care 221 218 223 215 217 227 221 232 225% Change -1% 2% -4% 1% 5% -3% 5% -3%Source: National Residency Match Program, program capacity (positions)
210220230240 0.25% annual
compound growth rate in those staying in primary care
New
gra
duat
es
23
PCP Labor Demand/Needs
The U.S. Bureau of Labor Statistics (BLS), and its state-level counterpart, the Minnesota Department of Employment and Economic Development (DEED), provide employment outlook information for industries and specific jobs based on expectations about population growth, demographics and other macroeconomic variables• Family and general practitioners, pediatricians — general, and internists — general,
job categorizations are combined to produce aggregate PCP demand
The 2010 – 2020 Minnesota projections from DEED are summarized below• 2010 estimated employment of 5,395 positions, 2020 of 6,866 positions• Implied annual compound growth of 2.4%
The 2012 – 2022 U.S. projections from BLS are summarized below• 2012 estimated employment of 210,000 positions, 2022 of 240,800 positions• Implied annual compound growth of 1.4%
BLS and DEED projections do not provide an annual progression, so a smooth, compound growth rate is used in the forecast illustrations
Baseline forecast scenario uses a 1.5% annual compound growth rate
24
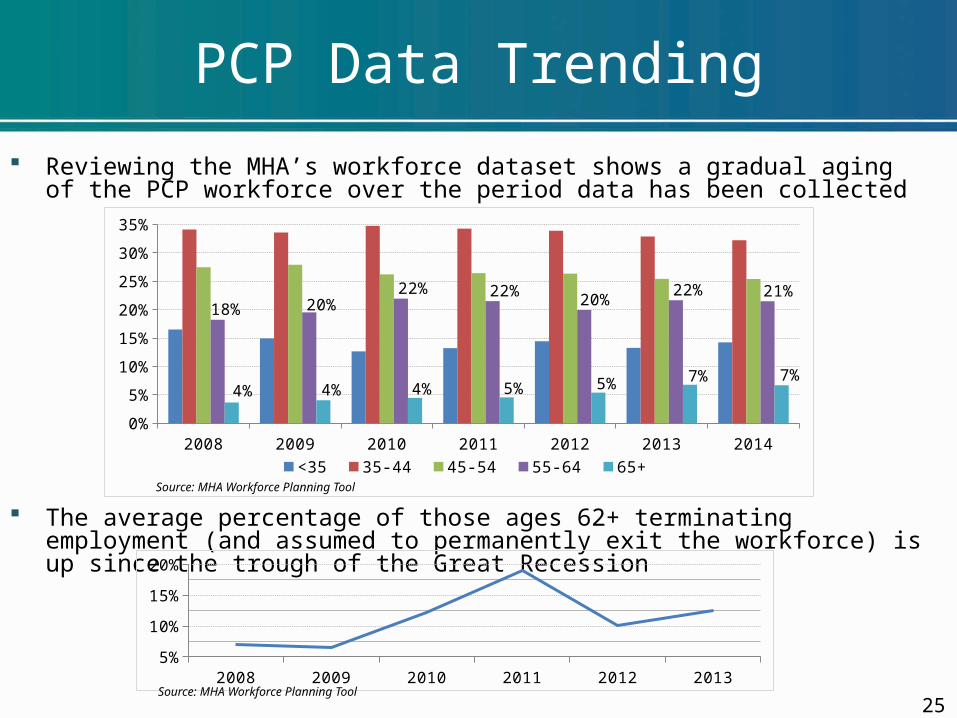
PCP Data Trending
Reviewing the MHA’s workforce dataset shows a gradual aging of the PCP workforce over the period data has been collected
The average percentage of those ages 62+ terminating employment (and assumed to permanently exit the workforce) is up since the trough of the Great Recession
2008 2009 2010 2011 2012 20135%
10%
15%
20%
Source: MHA Workforce Planning Tool
2008 2009 2010 2011 2012 2013 20140%
5%
10%
15%
20%
25%
30%
35%
18% 20%22% 22%
20%22% 21%
4% 4% 4% 5% 5% 7% 7%
<35 35-44 45-54 55-64 65+Source: MHA Workforce Planning Tool
25
PCP Workforce Exit Assumptions
Exits from the starting workforce population are projected due to permanent disability, death and retirement• Long-term disability and death assumptions follow standard actuarial tables published by the
Society of Actuaries for individuals from a U.S. working population• Retirement rates are developed based on recent exit data information
2013 exit experience from the MHA dataset was as follows for ages 62+
Reason for exit is not captured in the dataset (turnover, retirement, etc.), as such a subjective age must be chosen to determine retirement status
While there are retirements from the population before age 62 this threshold was used as the beginning of the incidence of permanent retirement• 100% of employees age 70 or older are assumed to retire• Assumption set creates an average weighted retirement age of 67.2
Age % Exiting Age % Exiting Age % Exiting
62 6% 65 13% 68 9%
63 10% 66 19% 69 3%
64 8% 67 5% 70+ 19%
Source: MHA Workforce Planning Tool
26
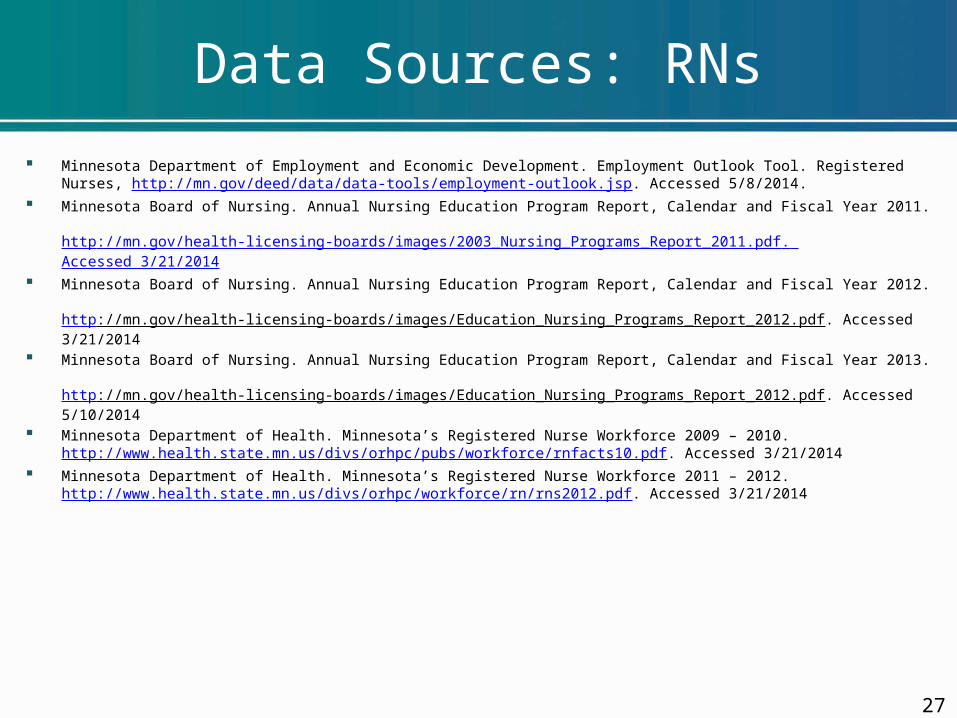
Data Sources: RNs
Minnesota Department of Employment and Economic Development. Employment Outlook Tool. Registered Nurses, http://mn.gov/deed/data/data-tools/employment-outlook.jsp. Accessed 5/8/2014.
Minnesota Board of Nursing. Annual Nursing Education Program Report, Calendar and Fiscal Year 2011. http://mn.gov/health-licensing-boards/images/2003_Nursing_Programs_Report_2011.pdf. Accessed 3/21/2014
Minnesota Board of Nursing. Annual Nursing Education Program Report, Calendar and Fiscal Year 2012. http://mn.gov/health-licensing-boards/images/Education_Nursing_Programs_Report_2012.pdf. Accessed 3/21/2014
Minnesota Board of Nursing. Annual Nursing Education Program Report, Calendar and Fiscal Year 2013. http://mn.gov/health-licensing-boards/images/Education_Nursing_Programs_Report_2012.pdf. Accessed 5/10/2014
Minnesota Department of Health. Minnesota’s Registered Nurse Workforce 2009 – 2010. http://www.health.state.mn.us/divs/orhpc/pubs/workforce/rnfacts10.pdf. Accessed 3/21/2014
Minnesota Department of Health. Minnesota’s Registered Nurse Workforce 2011 – 2012. http://www.health.state.mn.us/divs/orhpc/workforce/rn/rns2012.pdf. Accessed 3/21/2014
27
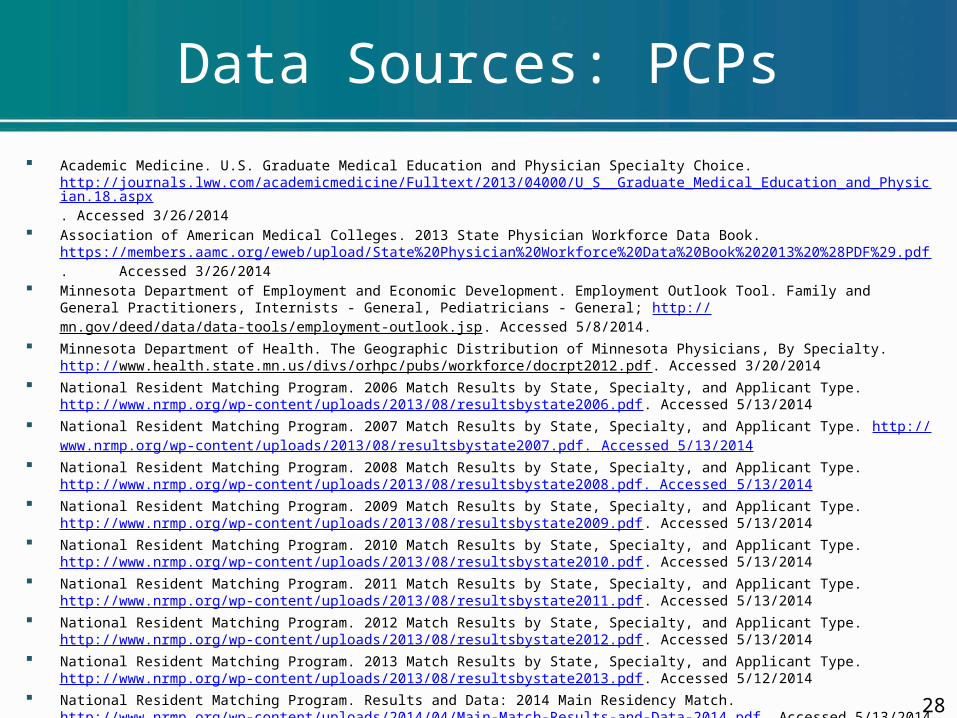
Data Sources: PCPs
Academic Medicine. U.S. Graduate Medical Education and Physician Specialty Choice. http://journals.lww.com/academicmedicine/Fulltext/2013/04000/U_S__Graduate_Medical_Education_and_Physician.18.aspx. Accessed 3/26/2014
Association of American Medical Colleges. 2013 State Physician Workforce Data Book. https://members.aamc.org/eweb/upload/State%20Physician%20Workforce%20Data%20Book%202013%20%28PDF%29.pdf. Accessed 3/26/2014
Minnesota Department of Employment and Economic Development. Employment Outlook Tool. Family and General Practitioners, Internists - General, Pediatricians - General; http://mn.gov/deed/data/data-tools/employment-outlook.jsp. Accessed 5/8/2014.
Minnesota Department of Health. The Geographic Distribution of Minnesota Physicians, By Specialty. http://www.health.state.mn.us/divs/orhpc/pubs/workforce/docrpt2012.pdf. Accessed 3/20/2014
National Resident Matching Program. 2006 Match Results by State, Specialty, and Applicant Type. http://www.nrmp.org/wp-content/uploads/2013/08/resultsbystate2006.pdf. Accessed 5/13/2014
National Resident Matching Program. 2007 Match Results by State, Specialty, and Applicant Type. http://www.nrmp.org/wp-content/uploads/2013/08/resultsbystate2007.pdf. Accessed 5/13/2014
National Resident Matching Program. 2008 Match Results by State, Specialty, and Applicant Type. http://www.nrmp.org/wp-content/uploads/2013/08/resultsbystate2008.pdf. Accessed 5/13/2014
National Resident Matching Program. 2009 Match Results by State, Specialty, and Applicant Type. http://www.nrmp.org/wp-content/uploads/2013/08/resultsbystate2009.pdf. Accessed 5/13/2014
National Resident Matching Program. 2010 Match Results by State, Specialty, and Applicant Type. http://www.nrmp.org/wp-content/uploads/2013/08/resultsbystate2010.pdf. Accessed 5/13/2014
National Resident Matching Program. 2011 Match Results by State, Specialty, and Applicant Type. http://www.nrmp.org/wp-content/uploads/2013/08/resultsbystate2011.pdf. Accessed 5/13/2014
National Resident Matching Program. 2012 Match Results by State, Specialty, and Applicant Type. http://www.nrmp.org/wp-content/uploads/2013/08/resultsbystate2012.pdf. Accessed 5/13/2014
National Resident Matching Program. 2013 Match Results by State, Specialty, and Applicant Type. http://www.nrmp.org/wp-content/uploads/2013/08/resultsbystate2013.pdf. Accessed 5/12/2014
National Resident Matching Program. Results and Data: 2014 Main Residency Match. http://www.nrmp.org/wp-content/uploads/2014/04/Main-Match-Results-and-Data-2014.pdf. Accessed 5/13/2014
28
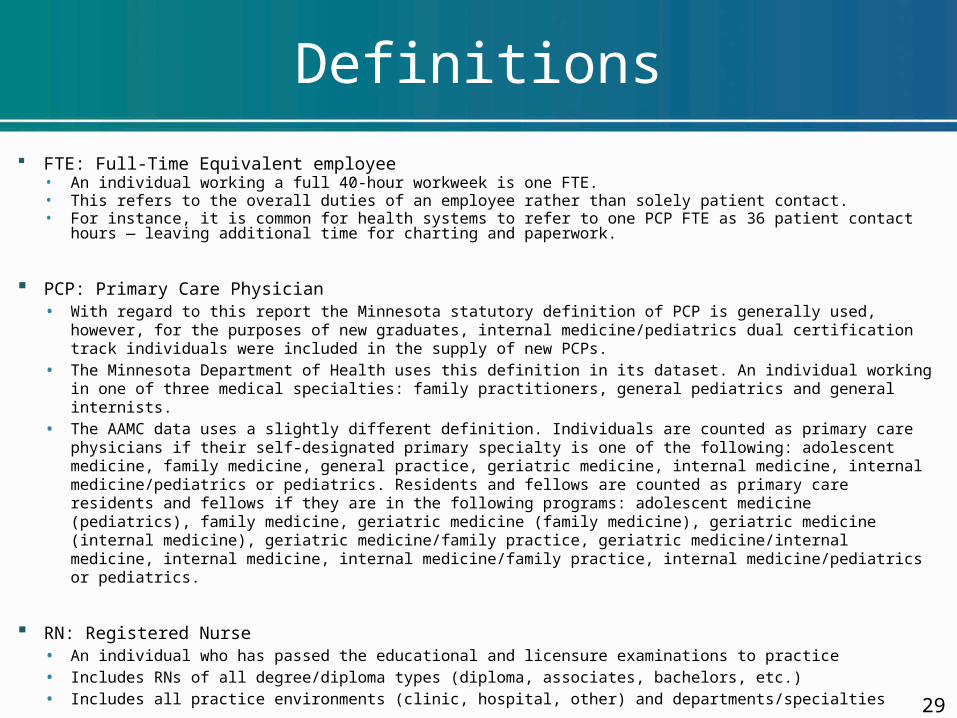
Definitions
FTE: Full-Time Equivalent employee • An individual working a full 40-hour workweek is one FTE.• This refers to the overall duties of an employee rather than solely patient contact.• For instance, it is common for health systems to refer to one PCP FTE as 36 patient contact hours —
leaving additional time for charting and paperwork.
PCP: Primary Care Physician• With regard to this report the Minnesota statutory definition of PCP is generally used, however, for the
purposes of new graduates, internal medicine/pediatrics dual certification track individuals were included in the supply of new PCPs.
• The Minnesota Department of Health uses this definition in its dataset. An individual working in one of three medical specialties: family practitioners, general pediatrics and general internists.
• The AAMC data uses a slightly different definition. Individuals are counted as primary care physicians if their self-designated primary specialty is one of the following: adolescent medicine, family medicine, general practice, geriatric medicine, internal medicine, internal medicine/pediatrics or pediatrics. Residents and fellows are counted as primary care residents and fellows if they are in the following programs: adolescent medicine (pediatrics), family medicine, geriatric medicine (family medicine), geriatric medicine (internal medicine), geriatric medicine/family practice, geriatric medicine/internal medicine, internal medicine, internal medicine/family practice, internal medicine/pediatrics or pediatrics.
RN: Registered Nurse• An individual who has passed the educational and licensure examinations to practice
• Includes RNs of all degree/diploma types (diploma, associates, bachelors, etc.)
• Includes all practice environments (clinic, hospital, other) and departments/specialties 29