Embed Size (px)
Citation preview
1
Relative reproductive success of hatchery
and wild Steelhead in the Hood River
Final report on work conducted under
BPA Intergovernmental Contract 9245, Project # 1988-053-12
and
ODFW Interagency agreement No. 001-2007s
OSU technical contact and principal investigator
Dr. Michael Blouin, Associate Professor
Dept. Zoology, Oregon State University
Corvallis, OR 97331
Tel: 541-737-2362
Fax: 541-737-0501
Date: 5/1/03
2
OVERVIEW
Motivation for the project
There is a considerable interest in using hatcheries to speed the recovery of wild
populations. The Bonneville Power Administration (BPA), under the authority of the
Northwest Power Planning Act, is currently funding several hatchery programs in the
Columbia Basin as off-site mitigation for impacts to salmon and steelhead caused by the
Columbia River federal hydropower system. One such project is located on the Hood
River, an Oregon tributary of the Columbia. These hatchery programs cost the region
millions of dollars. However, whether such programs actually improve the status of wild
fish remains untested. The goal of this project was to evaluate the effectiveness of the
Hood River hatchery program as required by the Northwest Power Planning Council Fish
and Wildlife Program, by the Oregon Plan for Coastal Salmonids, by NMFS ESA Section
4(d) rulings, and by the Oregon Department of Fish and Wildlife (ODFW) Wild Fish
Management Policy (OAR 635-07-525 through 529) and the ODFW Hatchery Fish Gene
Resource Management Policy (OAR 635-07-540 through 541).
This work was funded by the Bonneville Power Administration through BPA
Intergovernmental Contract 9245 (Project # 1988-053-12), and through ODFW
Interagency agreement No. 001-2007s.
Brief summary of project and results
The Hood River supports two populations of steelhead, a summer run and a winter run.
They spawn only above the Powerdale Dam, which is a complete barrier to all salmonids.
Since 1991 every adult passed above the dam has been measured, cataloged and sampled
for scales. Therefore, we have a DNA sample from every adult steelhead that went over
the dam to potentially spawn in the Hood River from 1991 to the present. Similar
numbers of hatchery and wild fish have been passed above the dam during the last
decade. During the 1990’s “old” domesticated hatchery stocks of each run (multiple
generations in the hatchery, out-of-basin origin; hereafter Hold) were phased out, and
conservation hatchery programs were started for the purpose of supplementing the two
wild populations (hereafter “new” hatchery stocks, Hnew). These samples gave us the
3
unprecedented ability to estimate, via microsatellite-based pedigree analysis, the relative
total reproductive success (adult-to-adult production) of hatchery (Hold or Hnew)and wild
(W) fish for two populations, over multiple brood years. Our analyses of samples from
fish that bred in the early to mid 1990’s show that fish of “old” hatchery stocks have
much lower total fitness than wild fish (17% to 54% of wild fitness), but that “new”
stocks have fitness that is similar to that of wild fish (ranging from 85% to 108% of wild
fitness, depending on parental gender and run year). Therefore, our results show that the
decision to phase out the old, out-of-basin stocks and replace them with new,
conservation hatchery stocks was well founded. We also conclude that the Hnew fish are
leaving behind substantial numbers of wild-born offspring. The similar fitnesses of Hnew
and W fish suggests that wild-born offspring of Hnew fish are unlikely to have negative
genetic effects on the population when they in turn spawn in the wild. We will test this
hypothesis once enough F2 offspring have returned. Another interesting result is that we
were unable to match a large fraction of the unclipped, returning fish with parents from
their brood year. Furthermore, we were missing more fathers than mothers. Because we
sampled almost every possible anadromous parent, these results suggest that non-
anadromous trout or precocious parr may be obtaining a substantial number of matings.
Substantial reproduction by precocious parr could be one unintended consequence of the
hatchery program.
Personnel and project Coordination:
The genetics pedigree work was carried out at Oregon State University by Drs. M. Blouin
and W. Ardren (formerly a postdoc in Dr. Blouin’s laboratory, now at the USFWS
Abernathy Fish Genetics lab). This project was coordinated with the Hood River
steelhead hatchery and research project, funded by Bonneville Power Administration and
administered and implemented by the Oregon Department of Fish and Wildlife (Rod
French and Erik Olsen, supervisor and database manager). The project was also
coordinated with Dr. Thomas E. Morse, Bonneville Power Administration (BPA), Fish
and Wildlife Division, and with Kathryn Kostow, ODFW.
4
INTRODUCTION
Using hatcheries to enhance wild populations
Hatchery supplementation is the use of captive propagation to increase the size of an
endangered wild population (also known as supportive breeding or as a conservation
hatchery program; Ryman et al., 1995). The concept is to take part of a small wild
population into captivity, protect their offspring through the high-mortality early life
stages, and then allow them to spawn naturally when they return as adults. The return of
their offspring should increase the size of the wild population. Whether such
supplementation programs actually work (increase the size of wild populations) is not
clear (Waples 1999). While we may observe that a wild population’s size increases or
decreases after hatchery adults were allowed to spawn in the same stream, we have not
been able to determine which fish among the spawners actually produced returning
adults. It is possible that the hatchery fish are making little contribution to the next
generation, or even worse, are dragging down the fitness of the wild population for
genetic or ecological reasons (Waples 1991; 1999; Fleming and Petersson, 2001; Lynch
and O’Hely, 2001). On the other hand, the hatchery fish may indeed be leaving behind
offspring that return to breed successfully and contribute to the next generation. Until
now we have had no way of determining which of these scenarios is true.
Background on the Hood River basin and stocks
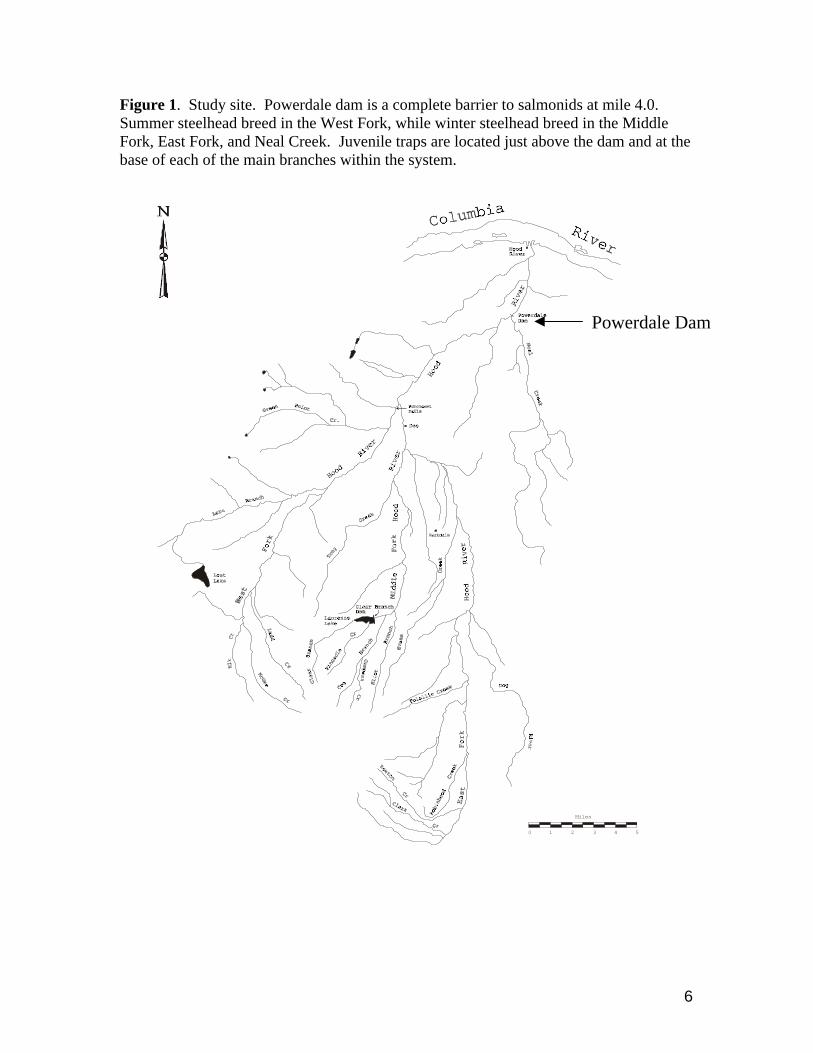
The Hood River supports wild runs of winter and summer steelhead. Breeding areas for
winter and summer fish are segregated, with summer fish breeding in the West Fork of
the Hood River and winter fish breeding in the remaining tributaries (Fig. 1). The
Powerdale Dam at mile 4.0 on the river is a complete barrier to migrating salmon.
Facilities include an adult trap and sorter built by BPA. The trap is used for all
broodstock collection, for monitoring hatchery and wild adults, and for controlling entry
of hatchery fish into natural production areas (a photo of the dam and of the inside of the
fish handling facility can be seen at
http://oregonstate.edu/~blouinm/Hood%20RiverProject_files/slide0001.htm). This
facility provides the unique opportunity to handle the entire population of returning adults
every year. Since 1991 every adult passed over the dam has been catalogued, measured
5
and sampled for scales. Traps for sampling juveniles have been in place in the main stem
and at the outlets of all the main tributaries since the mid 1990s. The dam is scheduled to
be removed in 2010, although the actual date has not yet been determined. The dam is
being kept in place until that time in order to facilitate several ongoing research projects
in the basin, including this one.
Winter run
Winter run hatchery stock 13 (a domesticated, out-of-basin, multi-generation hatchery
stock from Big Creek) was previously stocked in the basin but was phased out in 1991. It
was replaced by conservation hatchery stock 50, which uses wild Hood River broodstock
each generation and was implemented for the purposes of supplementing the wild winter
population. The first generation of stock 50 adults began returning in appreciable
numbers in 1995 (Fig. 2). Since then the number of Hnew fish passed above the dam has
been limited to no more than the number of wild fish passed (Table 1). This protocol
created an ideal opportunity to evaluate the relative reproductive success of each type of
fish spawning in the wild.
Summer run
Summer run hatchery stock 24 (a domesticated, out-of-basin, multigeneration hatchery
stock from Skamania) was phased out in 1998 and replaced by summer conservation
hatchery stock 50 in 1998. The protocols for this summer-run supplementation program
are the same as for the winter run program. Skamania stock 24 are still planted below the
dam to provide a sports fishery, but none are allowed above the dam.
Here we use the abbreviation Hold to refer to “old” hatchery stocks 24 and 13, and Hnew to
refer to the “new” conservation hatchery winter stock 50 and summer stock 50. Run
years begin in the fall and breeding occurs in the spring and summer of the following
year. Thus, for example, parents of run year 1991-1992 produce offspring whose brood
year (date of birth) is 1992. For simplicity’s sake we will, for example, refer to 91 as
both the parental run year and offspring birth year.
6
Figure 1. Study site. Powerdale dam is a complete barrier to salmonids at mile 4.0. Summer steelhead breed in the West Fork, while winter steelhead breed in the Middle Fork, East Fork, and Neal Creek. Juvenile traps are located just above the dam and at the base of each of the main branches within the system.
0 1 2 3 4 5
Miles
Powerdale Dam
7
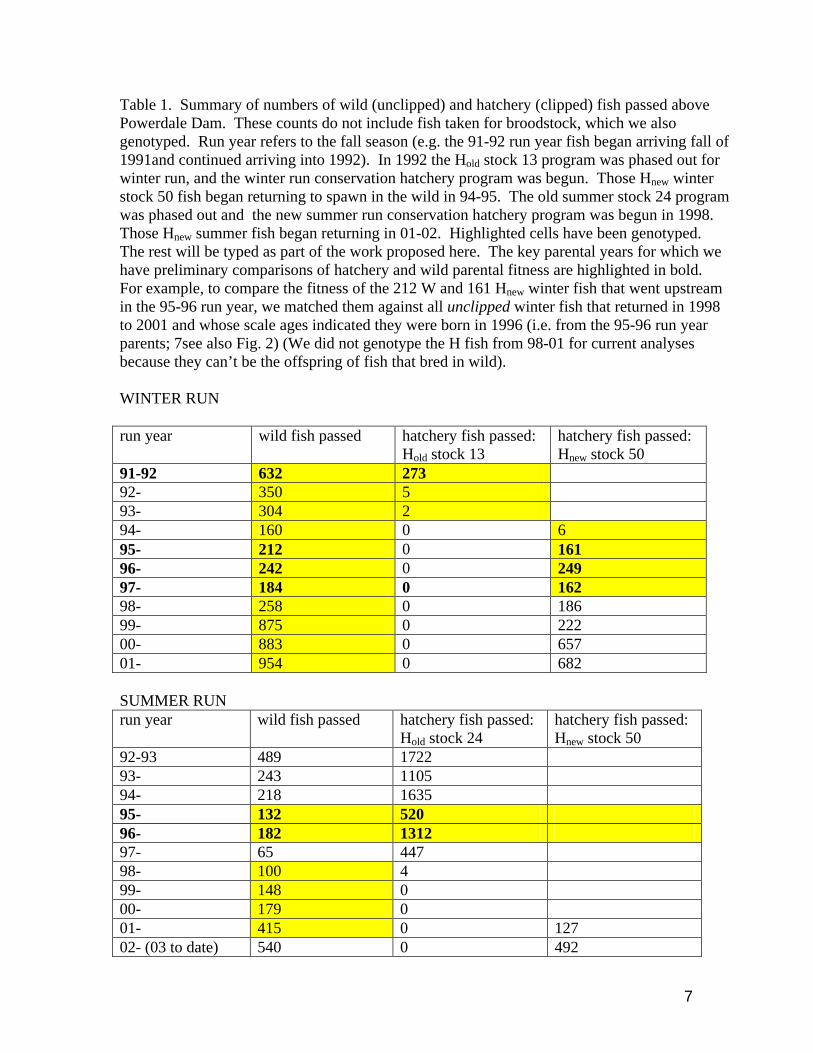
Table 1. Summary of numbers of wild (unclipped) and hatchery (clipped) fish passed above Powerdale Dam. These counts do not include fish taken for broodstock, which we also genotyped. Run year refers to the fall season (e.g. the 91-92 run year fish began arriving fall of 1991and continued arriving into 1992). In 1992 the Hold stock 13 program was phased out for winter run, and the winter run conservation hatchery program was begun. Those Hnew winter stock 50 fish began returning to spawn in the wild in 94-95. The old summer stock 24 program was phased out and the new summer run conservation hatchery program was begun in 1998. Those Hnew summer fish began returning in 01-02. Highlighted cells have been genotyped. The rest will be typed as part of the work proposed here. The key parental years for which we have preliminary comparisons of hatchery and wild parental fitness are highlighted in bold. For example, to compare the fitness of the 212 W and 161 Hnew winter fish that went upstream in the 95-96 run year, we matched them against all unclipped winter fish that returned in 1998 to 2001 and whose scale ages indicated they were born in 1996 (i.e. from the 95-96 run year parents; 7see also Fig. 2) (We did not genotype the H fish from 98-01 for current analyses because they can’t be the offspring of fish that bred in wild). WINTER RUN run year wild fish passed hatchery fish passed:
Hold stock 13 hatchery fish passed: Hnew stock 50
91-92 632 273 92- 350 5 93- 304 2 94- 160 0 6 95- 212 0 161 96- 242 0 249 97- 184 0 162 98- 258 0 186 99- 875 0 222 00- 883 0 657 01- 954 0 682 SUMMER RUN run year wild fish passed hatchery fish passed:
Hold stock 24 hatchery fish passed: Hnew stock 50
92-93 489 1722 93- 243 1105 94- 218 1635 95- 132 520 96- 182 1312 97- 65 447 98- 100 4 99- 148 0 00- 179 0 01- 415 0 127 02- (03 to date) 540 0 492
8
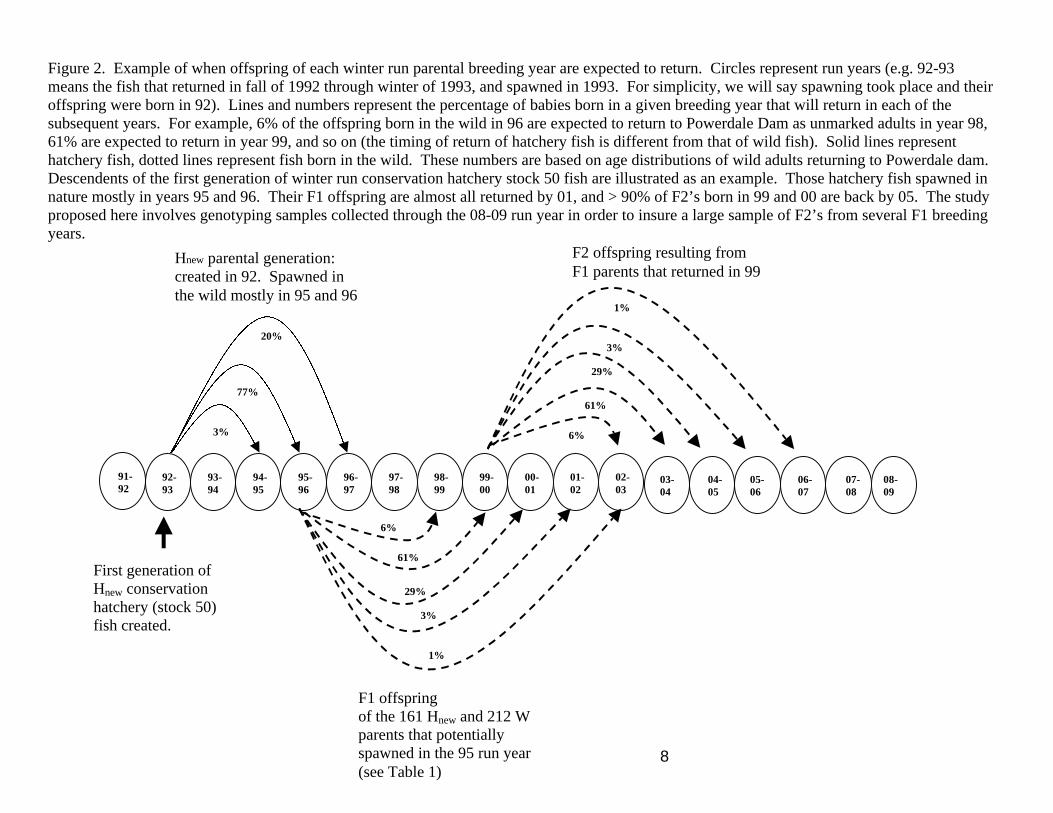
Figure 2. Example of when offspring of each winter run parental breeding year are expected to return. Circles represent run years (e.g. 92-93 means the fish that returned in fall of 1992 through winter of 1993, and spawned in 1993. For simplicity, we will say spawning took place and their offspring were born in 92). Lines and numbers represent the percentage of babies born in a given breeding year that will return in each of the subsequent years. For example, 6% of the offspring born in the wild in 96 are expected to return to Powerdale Dam as unmarked adults in year 98, 61% are expected to return in year 99, and so on (the timing of return of hatchery fish is different from that of wild fish). Solid lines represent hatchery fish, dotted lines represent fish born in the wild. These numbers are based on age distributions of wild adults returning to Powerdale dam. Descendents of the first generation of winter run conservation hatchery stock 50 fish are illustrated as an example. Those hatchery fish spawned in nature mostly in years 95 and 96. Their F1 offspring are almost all returned by 01, and > 90% of F2’s born in 99 and 00 are back by 05. The study proposed here involves genotyping samples collected through the 08-09 run year in order to insure a large sample of F2’s from several F1 breeding years.
91-92
92-93
97-98
96-97
95-96
94-95
93-94
00-01
99-00
98-99
02-03
01-02
29%
3%
1%
6%
61%
3%
77%
20%
29%
3%
1%
6%
61%
First generation of Hnew conservation hatchery (stock 50) fish created.
Hnew parental generation: created in 92. Spawned in the wild mostly in 95 and 96
F1 offspring of the 161 Hnew and 212 W parents that potentially spawned in the 95 run year (see Table 1)
08-09
07-08
06-07
05-06
03-04
04-05
F2 offspring resulting from F1 parents that returned in 99
9
Specific questions asked
Adult offspring returning to the dam in the late 1990’s and early 2000’s were matched
back their parents that were sampled in previous years (Fig. 2, Table 1; dates of birth
from scale aging). From these data we asked the following questions.
(1) What is the mean and year-to-year variance in relative reproductive success (adult to
adult production) of conservation hatchery-origin (Hnew) and wild-origin (W) fish that
spawned naturally in the Hood River?
The relative rate of adult-to-adult production by Hnew and W fish is the key
unknown parameter needed for predicting the demographic effects of hatchery
supplementation on wild populations. Here we measured the parameter (Hnew:W
fitness) for each of three years of winter fish (run years 95, 96, and 97; Table 1).
(2) Are “new” hatchery stocks closer in fitness to wild fish than “old” hatchery stocks?
Theory and substantial circumstantial evidence suggest that “old” hatchery stocks
will have substantially lower total fitness than “new” hatchery stocks in the wild
(Lynch and O’Hely, 2001; Fleming and Petersson, 2001). However, there has
never been a direct test of this hypothesis, nor are there any empirical data on how
much better the “new” stocks should perform. Here we compared the Hnew:W
relative fitnesses with that of Hold :W. For winter run we have one run year of Hold
vs. W (91), and for summer run we have data on two years (95 and 96) (Table 1).
Methods
(1) Sampling:
All handling of fish, phenotypic data collection, and sampling of scales and fin snips was
done at the Powerdale Dam by ODFW staff. All fish approaching the dam were shunted
into a trap and lifted into a building built specifically for the purpose of handling these
fish. After being measured and sampled, each fish was either recycled downstream (e.g.
extra hatchery fish), taken as broodstock or put above the dam to continue on to the
spawning grounds. Sampling and database management protocols have been in place
since project inception. Thus, we have an extensive database on the size, run timing, age
10
and freshwater residency (from scales), gender, fin clip and disposition (i.e. taken for
broodstock, recycled, etc…) of every fish for which we also have pedigree data. We
successfully genotyped between 97% and 99% of the steelhead collected for broodstock
or passed over the dam each year. Therefore, we have an almost complete sample of all
potential anadromous spawners from each run year.
(2) Molecular Methods:
We used a standard chelex protocol to extract DNA from fin snips or scales. Note that
we obtain high quality DNA template from the scale samples, even those from the early
1990’s. All extractions are done in 96-well plates.
From an initial set of 27 microsatellite loci that are known to work well in steelhead, we
chose a set of eight loci based on the criteria that they amplify well, can be scored
unambiguously in two sets of four multiplexed loci, and lack high-frequency null alleles.
These eight loci provide a total power to reject a false parent-offspring pair via simple
exclusion of > 0.9999. Furthermore, our ground truthing experiments (see below)
demonstrate a very low empirical rate of false parentage inclusion, and high power to
exclude all but the true parents.
Template plates are pooled into 384-well plates for PCR, and those are pooled into four-
locus, 384-well plates for multiplex scoring on an ABI 3100 16-channel capillary
electrophoresis system. We use a Hydra-96 liquid handling robot (Robins Scientific) for
all pipetting procedures involving plates (i.e. for all procedures following the initial
handling of the scale or fin snip). Adding this device to our lab has cut sample handling
errors down to virtually zero.
11
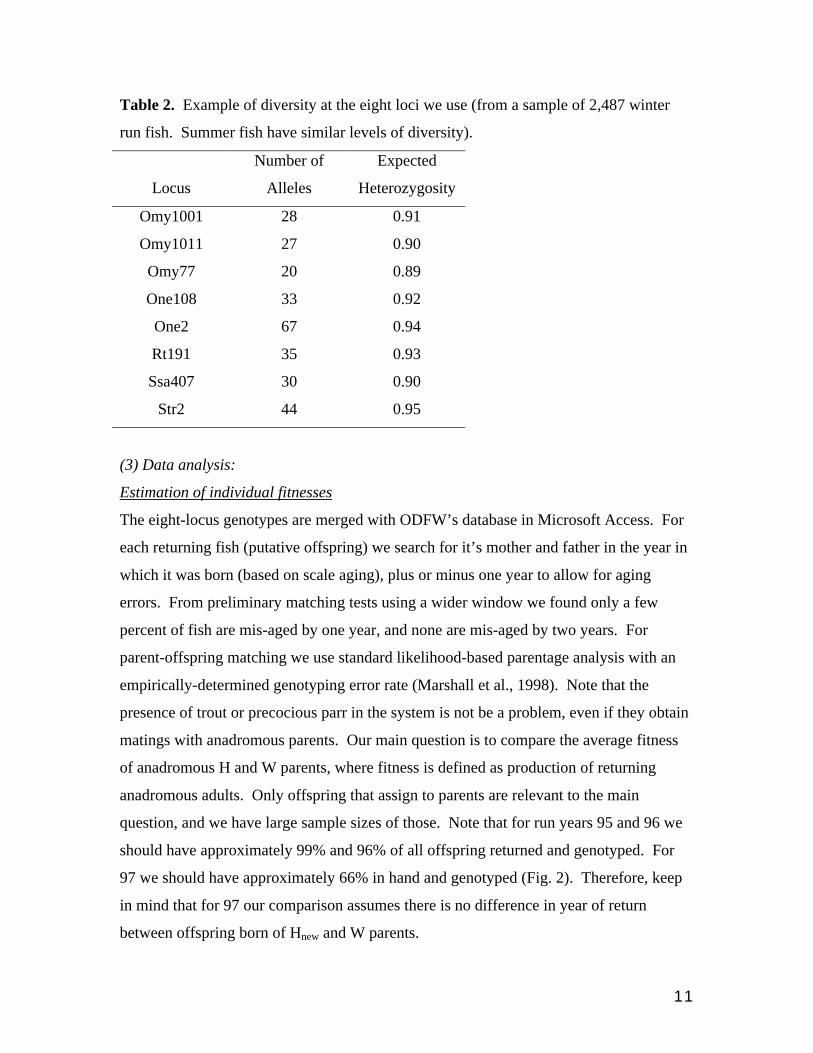
Table 2. Example of diversity at the eight loci we use (from a sample of 2,487 winter
run fish. Summer fish have similar levels of diversity).
Locus
Number of
Alleles
Expected
Heterozygosity
Omy1001 28 0.91
Omy1011 27 0.90
Omy77 20 0.89
One108 33 0.92
One2 67 0.94
Rt191 35 0.93
Ssa407 30 0.90
Str2 44 0.95
(3) Data analysis:
Estimation of individual fitnesses
The eight-locus genotypes are merged with ODFW’s database in Microsoft Access. For
each returning fish (putative offspring) we search for it’s mother and father in the year in
which it was born (based on scale aging), plus or minus one year to allow for aging
errors. From preliminary matching tests using a wider window we found only a few
percent of fish are mis-aged by one year, and none are mis-aged by two years. For
parent-offspring matching we use standard likelihood-based parentage analysis with an
empirically-determined genotyping error rate (Marshall et al., 1998). Note that the
presence of trout or precocious parr in the system is not be a problem, even if they obtain
matings with anadromous parents. Our main question is to compare the average fitness
of anadromous H and W parents, where fitness is defined as production of returning
anadromous adults. Only offspring that assign to parents are relevant to the main
question, and we have large sample sizes of those. Note that for run years 95 and 96 we
should have approximately 99% and 96% of all offspring returned and genotyped. For
97 we should have approximately 66% in hand and genotyped (Fig. 2). Therefore, keep
in mind that for 97 our comparison assumes there is no difference in year of return
between offspring born of Hnew and W parents.
12
Parameters vs. parameter estimates
For each run year we are interested in making inference about the fitness of the
anadromous hatchery and wild fish that went above the dam. Because we sample all the
fish at the dam each year, the fitness values we obtain for each type of parent (H or W) in
a given run year are the parameters for that year, not estimates of the parameter. In other
words, the parents that return each run year are the population of inference, not a sample
from some larger population of hatchery and wild fish to which we wish to make
inference for that year (the fitness of an individual fish may be measured with error
owing to mis-assignment of offspring, but that is an issue of precision of measurement).
On the other hand, the fitness estimates obtained for a given year can be considered to be
a sample from some larger universe of run years. Because the ultimate goal here is to
estimate H:W relative fitness for use in modeling conservation hatchery programs in
general, the key values of interest are the mean and variance of H:W fitness among run
years. So our main focus here is in measuring H:W fitness in as many run years as
possible. In this report we provide data on Hnew vs. W for three run years.
(4) Ground truthing:
All fish taken for broodstock are also genotyped. Therefore, as a form of ground truthing
we ran fin-clipped returning adults from four brood years through the parentage analyses.
For these analyses the fish taken for broodstock were included in the pool of wild
potential parents. Ninety-six percent of the clipped returning fish were unambiguously
matched back to a single mother-father pair in their expected brood year, and in every
case our hatchery records show that that male-female pair was indeed crossed in the
hatchery. The remaining unassigned, clipped offspring mismatch all potential parents at
multiple loci and so are probably stray hatchery fish from out of the basin. Clipped and
unclipped fish were treated identically during all stages of data collection. Therefore, we
should have the same power to find the parents of unclipped returnees if their parents are
in the parent pool.
13
Results
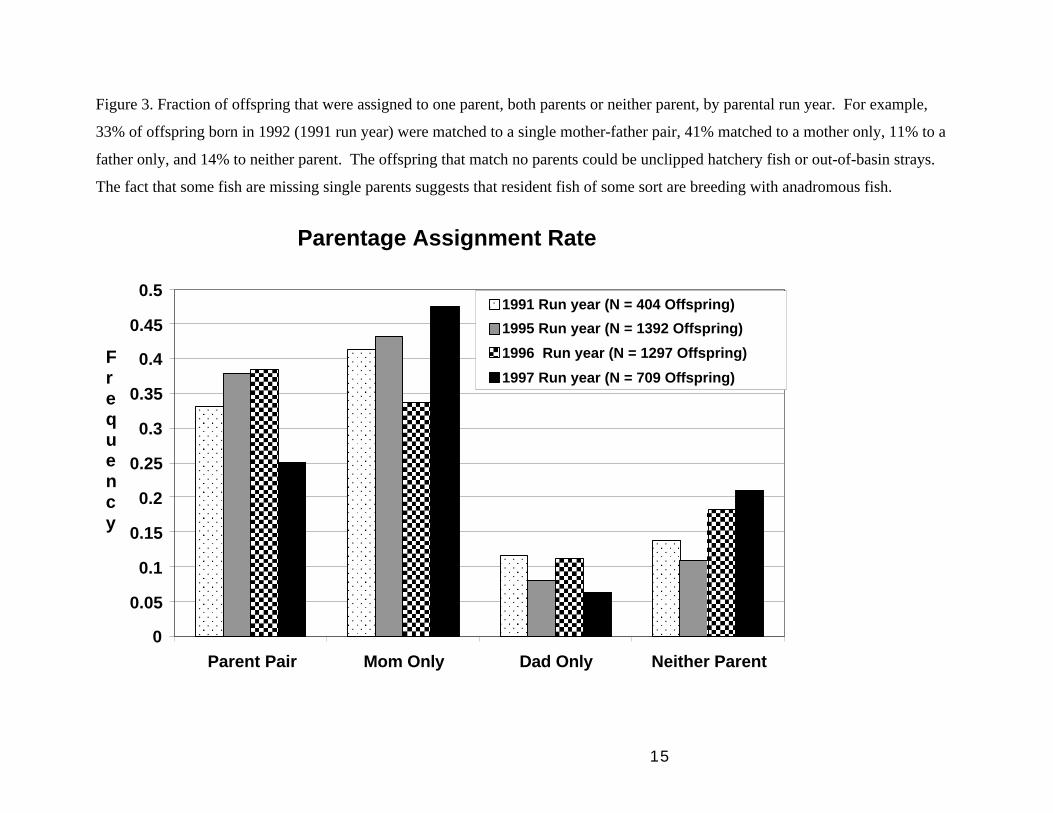
(1). Fraction of putative offspring that were assigned
We were able to unambiguously assign a mother-father pair to fewer than 40% of the
putative offspring, a single parent to around 50% of them, and no parents to around 10-
20%, depending on run year (Figure 3). From our ground-truthing experiments we know
that the unassigned offspring are not all the result of experimental error. Because we
sampled essentially all anadromous parents, these results suggest that missing parents
may be non-anadromous, resident trout or precocious parr. Offspring for which neither
parent could be found might also be wild strays or unclipped hatchery fish. Note,
however, that for purposes of comparing the relative reproductive success of anadromous
hatchery and wild fish, only those offspring that match to anadromous parents are
relevant to this study. Again, the relevant measure of fitness here is number of returning
anadromous adults produced per spawner. The sources of missing parents are a separate
issue that we will address in the future.
(2). Analyses for individual fish of each sex:
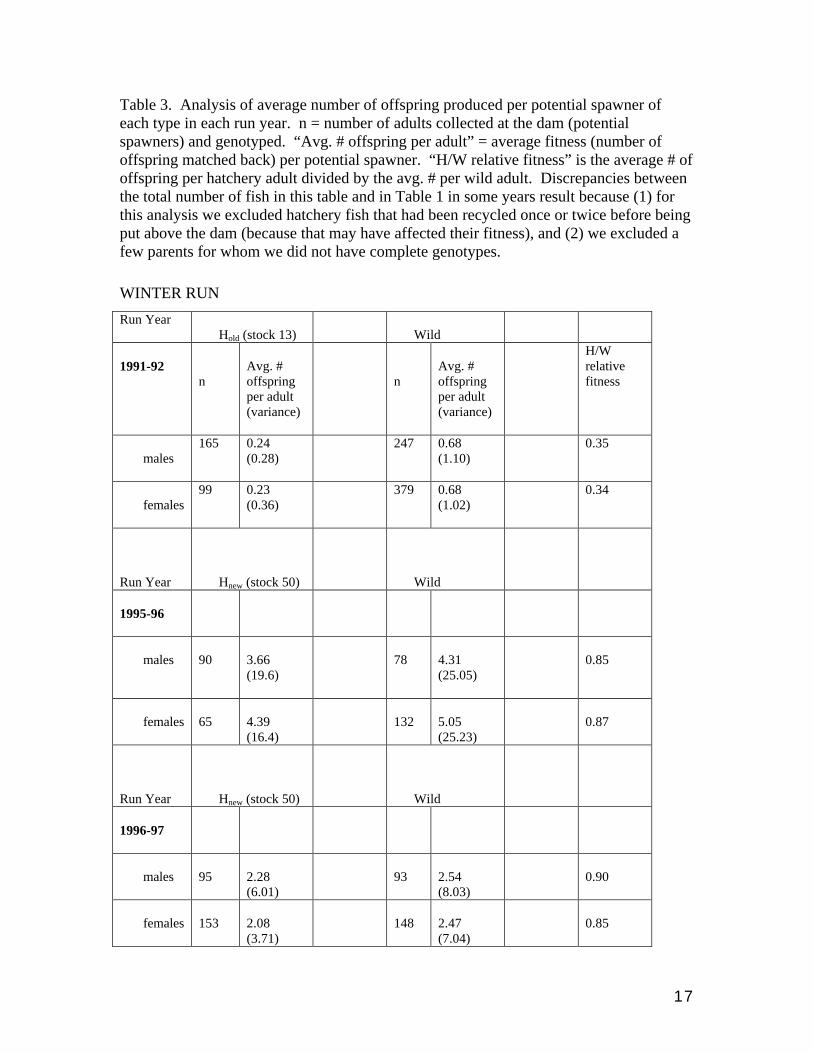
Winter run: Hold vs. W and Hnew vs. W
The 91 year gives a comparison of Hold vs. W, and the 95, 96 and 97 years give
comparisons of Hnew vs. W. In 91 the Hold had 35% the fitness of wild fish (Fig. 4;Table
3). In 95 the Hnew had 85% the fitness of wild fish, in 96 they had 85-90%, and in 97 they
had 90-108% the fitness of wild fish (Table 3). These results are consistent with the
opinion that “new” hatchery stocks perform much better than “old” hatchery stocks.
They also show that the relative performance of Hnew fish might vary substantially from
year to year. The caveat for the 97 run year is that although we have plenty of offspring
back from that run year, they represent only 66% of those expected to have been
produced by the 97 parents fish (see Fig. 2). Therefore, we are assuming that wild-born
offspring of Hnew parents do not return earlier than offspring of wild parents. Else the
relative success of the Hnew parents has been overestimated. We will verify the result
when we genotype the 02-03 returnees.
14
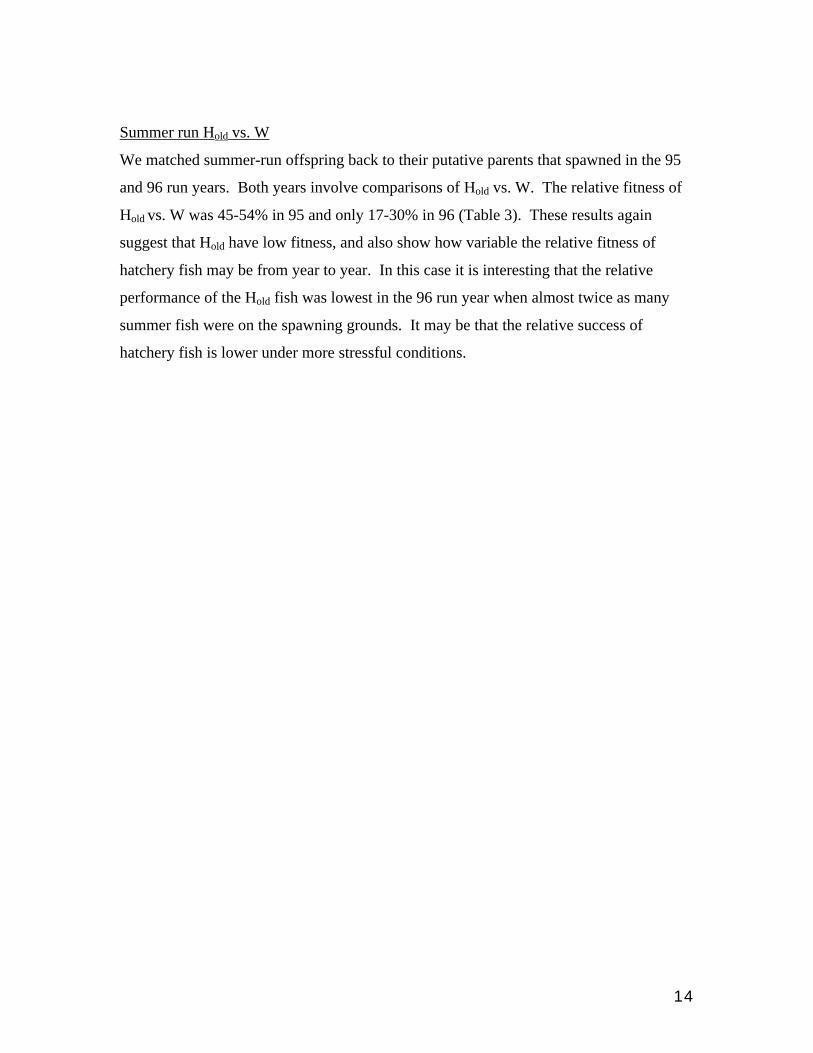
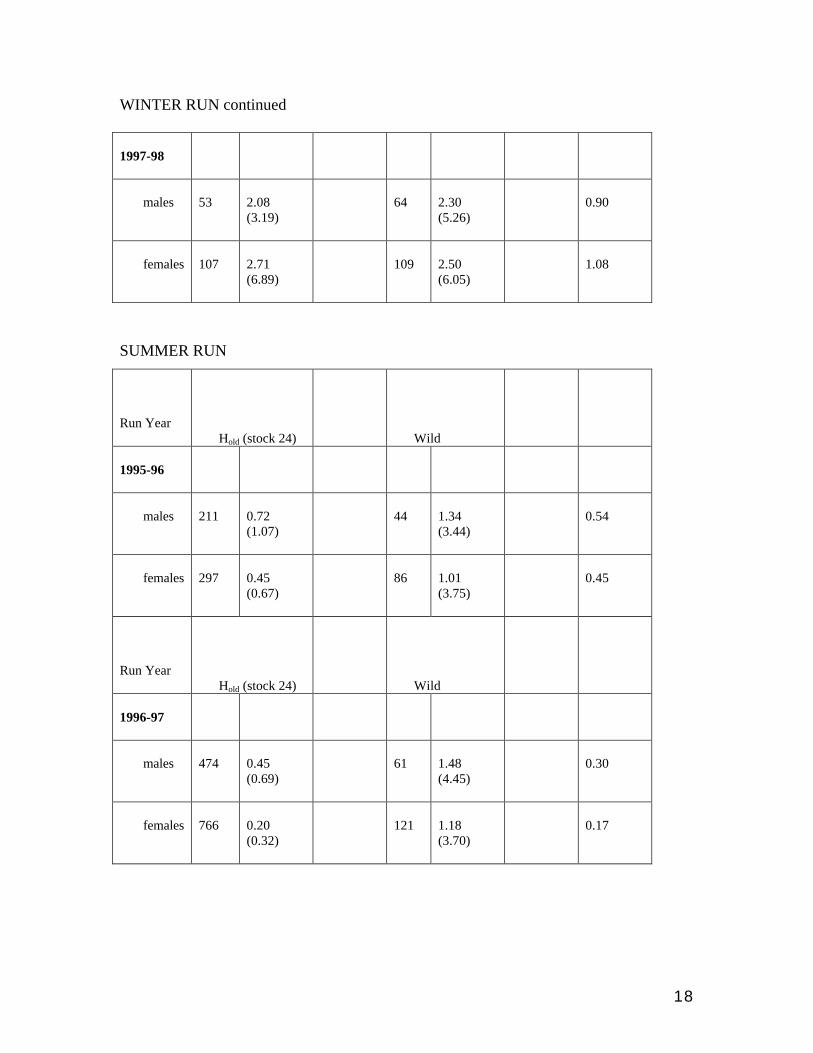
Summer run Hold vs. W
We matched summer-run offspring back to their putative parents that spawned in the 95
and 96 run years. Both years involve comparisons of Hold vs. W. The relative fitness of
Hold vs. W was 45-54% in 95 and only 17-30% in 96 (Table 3). These results again
suggest that Hold have low fitness, and also show how variable the relative fitness of
hatchery fish may be from year to year. In this case it is interesting that the relative
performance of the Hold fish was lowest in the 96 run year when almost twice as many
summer fish were on the spawning grounds. It may be that the relative success of
hatchery fish is lower under more stressful conditions.
15
Figure 3. Fraction of offspring that were assigned to one parent, both parents or neither parent, by parental run year. For example,
33% of offspring born in 1992 (1991 run year) were matched to a single mother-father pair, 41% matched to a mother only, 11% to a
father only, and 14% to neither parent. The offspring that match no parents could be unclipped hatchery fish or out-of-basin strays.
The fact that some fish are missing single parents suggests that resident fish of some sort are breeding with anadromous fish.
Parentage Assignment Rate
0
0.05
0.1
0.15
0.2
0.25
0.3
0.35
0.4
0.45
0.5
Parent Pair Mom Only Dad Only Neither Parent
Frequency
1991 Run year (N = 404 Offspring)
1995 Run year (N = 1392 Offspring)
1996 Run year (N = 1297 Offspring)
1997 Run year (N = 709 Offspring)
16
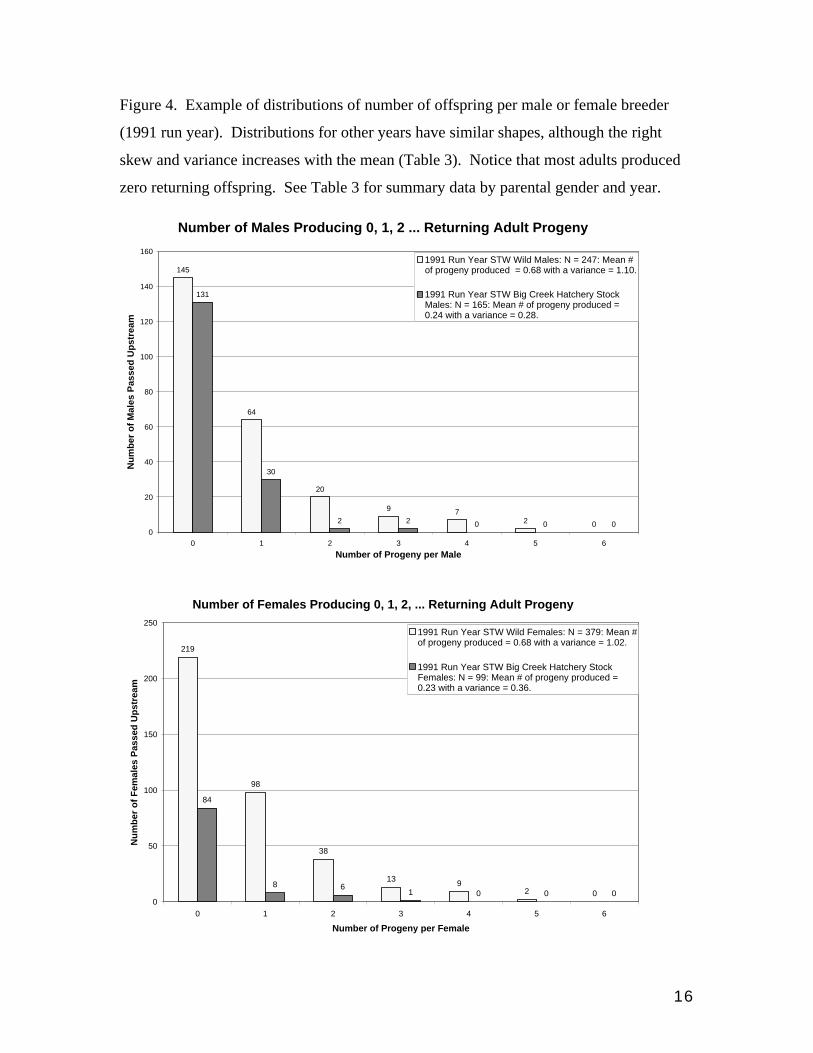
Figure 4. Example of distributions of number of offspring per male or female breeder
(1991 run year). Distributions for other years have similar shapes, although the right
skew and variance increases with the mean (Table 3). Notice that most adults produced
zero returning offspring. See Table 3 for summary data by parental gender and year.
Number of Males Producing 0, 1, 2 ... Returning Adult Progeny
145
64
20
9 72 0
131
30
2 2 0 0 00
20
40
60
80
100
120
140
160
0 1 2 3 4 5 6
Number of Progeny per Male
Nu
mb
er o
f M
ales
Pas
sed
Up
stre
am
1991 Run Year STW Wild Males: N = 247: Mean #of progeny produced = 0.68 with a variance = 1.10.
1991 Run Year STW Big Creek Hatchery StockMales: N = 165: Mean # of progeny produced =0.24 with a variance = 0.28.
Number of Females Producing 0, 1, 2, ... Returning Adult Progeny
219
98
38
13 92 0
84
8 61 0 0 0
0
50
100
150
200
250
0 1 2 3 4 5 6
Number of Progeny per Female
Nu
mb
er o
f F
emal
es P
asse
d U
pst
ream
1991 Run Year STW Wild Females: N = 379: Mean #of progeny produced = 0.68 with a variance = 1.02.
1991 Run Year STW Big Creek Hatchery StockFemales: N = 99: Mean # of progeny produced =0.23 with a variance = 0.36.
17
Table 3. Analysis of average number of offspring produced per potential spawner of each type in each run year. n = number of adults collected at the dam (potential spawners) and genotyped. “Avg. # offspring per adult” = average fitness (number of offspring matched back) per potential spawner. “H/W relative fitness” is the average # of offspring per hatchery adult divided by the avg. # per wild adult. Discrepancies between the total number of fish in this table and in Table 1 in some years result because (1) for this analysis we excluded hatchery fish that had been recycled once or twice before being put above the dam (because that may have affected their fitness), and (2) we excluded a few parents for whom we did not have complete genotypes.
WINTER RUN
Run Year Hold (stock 13)
Wild
1991-92
n
Avg. # offspring per adult (variance)
n
Avg. # offspring per adult (variance)
H/W relative fitness
males
165 0.24 (0.28)
247 0.68 (1.10)
0.35
females
99 0.23 (0.36)
379 0.68 (1.02)
0.34
Run Year
Hnew (stock 50)
Wild
1995-96
males
90
3.66 (19.6)
78
4.31 (25.05)
0.85
females
65
4.39 (16.4)
132
5.05 (25.23)
0.87
Run Year
Hnew (stock 50)
Wild
1996-97
males
95
2.28 (6.01)
93
2.54 (8.03)
0.90
females
153
2.08 (3.71)
148
2.47 (7.04)
0.85
18
WINTER RUN continued 1997-98
males
53
2.08 (3.19)
64
2.30 (5.26)
0.90
females
107
2.71 (6.89)
109
2.50 (6.05)
1.08
SUMMER RUN
Run Year
Hold (stock 24)
Wild
1995-96
males
211
0.72 (1.07)
44
1.34 (3.44)
0.54
females
297
0.45 (0.67)
86
1.01 (3.75)
0.45
Run Year
Hold (stock 24)
Wild
1996-97
males
474
0.45 (0.69)
61
1.48 (4.45)
0.30
females
766
0.20 (0.32)
121
1.18 (3.70)
0.17
19
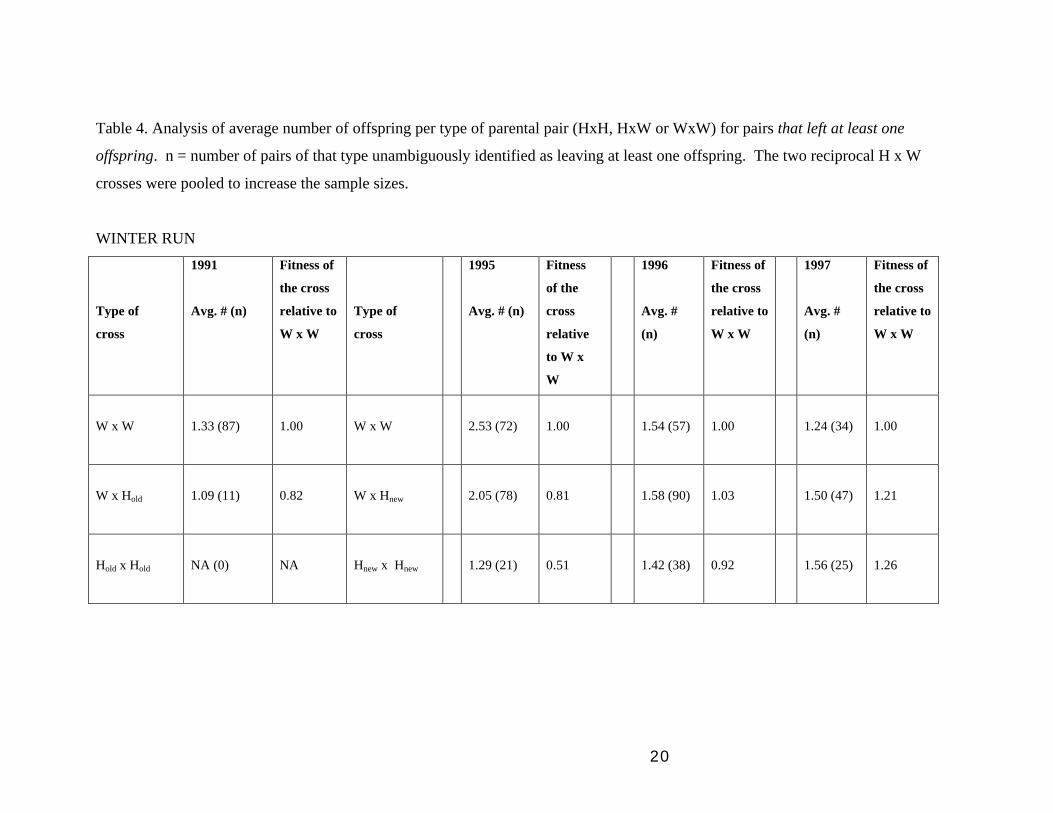
(3) Analyses of parental pairs (performance of HxH, HxW and WxW crosses):
We could estimate the proportions of each type of observed cross expected if H
and W fish mate randomly, and then compare those proportions to the observed
proportions of parental pairs we actually detected of each type. But because we
cannot count pairs that left no surviving offspring, there is no way to disentangle
non-random mating from differences in parental fecundity or offspring survival
(you would need to observe matings to do that). If we restrict our analysis to
pairs that left at least one surviving offspring, then we can calculate the relative
fitness of each type of cross for that truncated dataset. Any difference here is
necessarily owing to offspring survival or parental fecundity because we have
restricted the inference to those fish that, by definition, mated. This analysis
probably underestimates the fitness differences among the three types of pairs
because we have no zero-offspring class. Nevertheless, even for this restricted
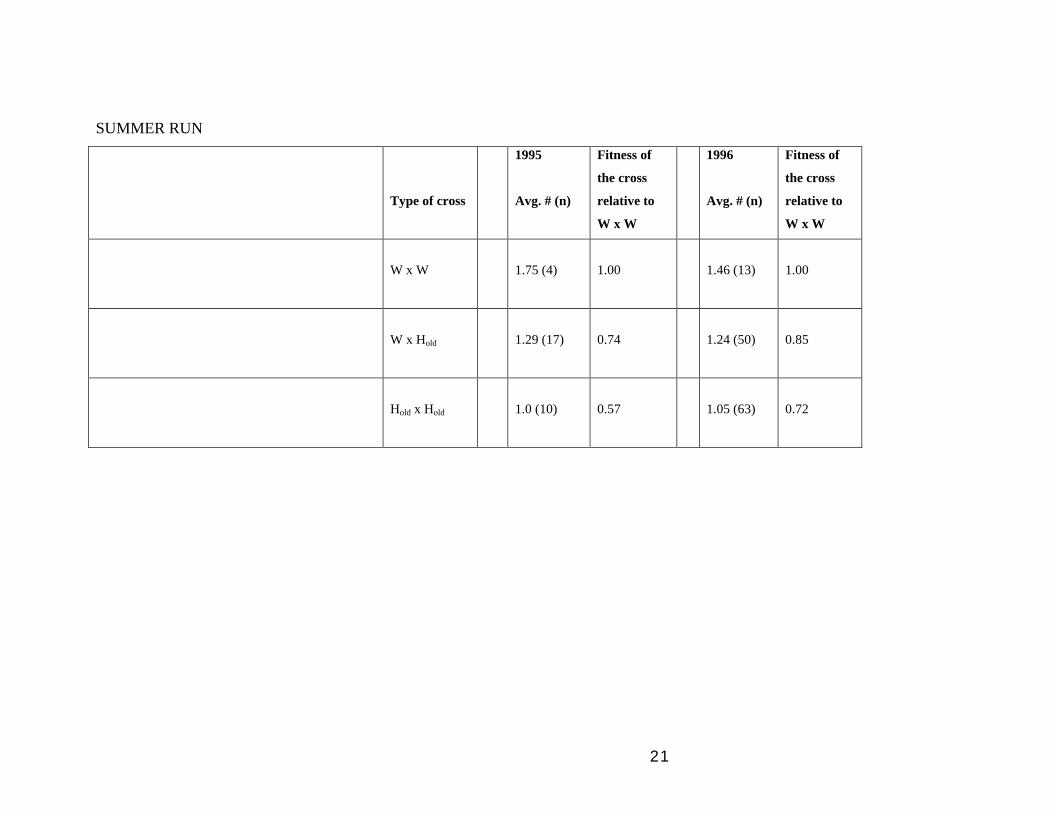
dataset our results show that Hold x Hold crosses always did worse that Hold x W,
which in turn were worse than WxW crosses (see Table 4, WINTER RUN 91 and
SUMMER RUN 95-96). This result indicates that breeding by Hold fish in the
wild may indeed be dragging down the fitness of wild fish. In contrast, Hnew x
Hnew and Hnew x W crosses did quite well, equalling or exceeding W x W fitness
in some years, although the differences are quite variable from year to year (see
Table 4, WINTER RUN 95-97) Of more importance, however, these results
show that all three types of crosses (Hnew x Hnew, Hnew x W, and W x W) occur in
the wild and produce substantial numbers of surviving F1 offspring.
20
Table 4. Analysis of average number of offspring per type of parental pair (HxH, HxW or WxW) for pairs that left at least one
offspring. n = number of pairs of that type unambiguously identified as leaving at least one offspring. The two reciprocal H x W
crosses were pooled to increase the sample sizes.
WINTER RUN
Type of
cross
1991
Avg. # (n)
Fitness of
the cross
relative to
W x W
Type of
cross
1995
Avg. # (n)
Fitness
of the
cross
relative
to W x
W
1996
Avg. #
(n)
Fitness of
the cross
relative to
W x W
1997
Avg. #
(n)
Fitness of
the cross
relative to
W x W
W x W
1.33 (87)
1.00
W x W
2.53 (72)
1.00
1.54 (57)
1.00
1.24 (34)
1.00
W x Hold
1.09 (11)
0.82
W x Hnew
2.05 (78)
0.81
1.58 (90)
1.03
1.50 (47)
1.21
Hold x Hold
NA (0)
NA
Hnew x Hnew
1.29 (21)
0.51
1.42 (38)
0.92
1.56 (25)
1.26
21
SUMMER RUN
Type of cross
1995
Avg. # (n)
Fitness of
the cross
relative to
W x W
1996
Avg. # (n)
Fitness of
the cross
relative to
W x W
W x W
1.75 (4)
1.00
1.46 (13)
1.00
W x Hold
1.29 (17)
0.74
1.24 (50)
0.85
Hold x Hold
1.0 (10)
0.57
1.05 (63)
0.72
22
CONCLUSIONS
1. Fish from old hatchery stock consistently have very low fitness (usually less than 50%
that of wild fish) when breeding in the wild. The fact that Hold x W crosses consistently
produce fewer offspring than W x W crosses (Table 4) suggests that having Hold breeders
in a system might lower the fitness of the wild population. Whether the surviving wild-
born offspring of such crosses re-establish “wild” levels of fitness after one full
generation of selection in nature remains to be tested.
2. Fish from new, conservation hatchery stock have fitness that is about equal to that of
wild fish (less than wild in two years, greater than in the third year). The same pattern is
apparent whether one examines the relative fitness of individual parents or that of pairs
that left at least one offspring. The similar fitnesses Hnew x W and W x W pairs, suggests
that having Hnew fish in the system is probably not obviously dragging down the fitness of
the wild population for genetic reasons (as might have been expected under some models;
e.g. Lynch and O’Hely, 2001). Thus, the conservation hatchery program appears to have
added a demographic boost to the population without having obvious negative genetic
consequences - at least in regards the effects of domestication selection and mutation
accumulation that should occur in the hatchery. We have not yet conducted a formal
analysis of the effect of the hatchery program on the effective size of the wild population
(e.g. Ryman et al., 1995), but the high levels of microsatellite diversity we still observe in
both runs suggest that reduced effective size is not a problem.
3. The surprisingly large number of missing parents, and the fact that most missing
parents are fathers (Fig. 3), suggests that precocious parr or resident trout are obtaining
matings that produce anadromous offspring. Alternate explanations for offspring that
lack both parents include a large number of unclipped hatchery fish or wild strays
entering the system.

23
Future Work
We hope to continue genotyping fish through the rest of this decade. Additional
questions we plan to address include:
(1) Do F1 progeny (born in the wild) of Hnew x W, Hnew x Hnew and W x W winter run
parents differ in their production of F2 progeny?
We know from our current analyses that all three types of matings occur on the spawning
ground, and that all three types of mating produce offspring that return to spawn as
adults. F2 offspring of those winter F1s that spawned in the late 1990s are now returning
(see Fig. 2). If we continue sampling through the end of the decade we will have a large
number of returned F2s from multiple brood years with which to test the relative fitness
of different types of F1s (Fig. 2). Given the apparently high fitness of Hnew hatchery fish,
our expectation is that the three types of wild-born F2’s will have similar fitnesses.
(2) Selection to maintain the difference between summer and winter runs:
What is the rate of hybridization between the runs? What are the phenotypes (run time,
size, freshwater residency) and actual fitnesses of any hybrids?
(3) Selection on measurable phenotypic traits:
We can use standard selection gradient analysis (Lande and Arnold, 1983) to analyze
fitness as a function of body size, run time, age and freshwater residency (known from
scales), after controlling for hatchery/wild genetic background.
(4) Quantitative genetic parameter estimation:
From our pedigrees we can estimate the heritabilities of, and genetic correlations among
any measurable phenotypic traits. We can also estimate the average breeding value for
each trait in individuals of HxH and WxW genetic background, in order to test whether
genetic changes in the hatchery, and subsequent mating with wild fish, could be changing
phenotypic distributions in the wild population (Ford, 2001).
24
(5) Parental contributions of resident, non-anadromous fish
We sample all potential breeding adults passed over the dam, and we know from our
ground truthing experiments the expected rate of mismatching owing to experimental
error. Therefore, unassigned offspring are either wild strays from out of the basin, or
were parented by resident fish (non-anadromous O. mykiss, or precocious parr). We will
use likelihood methods (Rannala and Mountain, 1997) to attempt to determine the most
likely source of missing parents (of offspring that only match to a single known parent),
and whether fish lacking both parents are most likely to be Hood River wild, Hood River
hatchery (unclipped) or immigrants from adjacent steelhead populations. Because we
sample all anadromous parents, the Hood River is an ideal system in which to ask
questions about the rate of parentage from resident fish and about the sources of those
fish.
(6) Effective size estimation
From the pedigrees we can obtain direct estimates of the effective size (Ne) of each
population over time. These data will be used to estimate the impact of hatchery
programs on the effective size of the wild population and to provide basic parameter
estimates such as the variance in family sizes (number of returning adults) for hatchery
broodstock, for H fish in the wild, and for W fish in the wild. These are important
parameters that are unknown for most populations and can be very useful for estimating
Ne and the effects of supplementation in other steelhead populations (e.g. sensu Ryman et
al., 1995). We can also use our system to evaluate the accuracy of indirect methods for
estimating effective size (e.g. Waples, 2002; Anderson et al., 2000). If the indirect
methods give very different values from the pedigree-based estimates, then we can ask
what assumptions of the indirect methods cause the difference. Note that because of our
ability to sample all potential anadromous parents, we can take into account the
contributions of non-anadromous, resident fish in our calculations.
25
References Cited Anderson, E.C et al. 2000. Monte Carlo evaluation of the likelihood for Ne from temporally-spaced samples. Genetics 156: 2109-2118. Fleming, I.A. and E. Petersson. 2001. The ability of released hatchery salmonids to breed and contribute to the natural productivity of wild populations. Nordic Journal of Freshwater Research 75:71-98. Ford, M.J. 2001. Selection in captivity during supportive breeding may reduce fitness in the wild. Conservation Biology 16:815-825. Lande, R. and S.J. Arnold. 1983. The measurement of selection on correlated characters. Evolution 36:1210-1226. Lynch, M and M. O’Hely. 2001. Supplementation and the genetic fitness of natural populations. Conservation Genetics 2:363-378 Marshall et al. 1998. Statistical confidence for likelihood-based paternity inference in natural populations. Molecular Ecology 7:639-655. Rannala, B. and J. L. Mountain. 1997. Detecting immigration by using multilocus genotypes. Proc. Natl. Acad. Sci. USA 94: 9197-9221 Ryman, N.et al. 1995. Supportive breeding and variance effective population size. Conservation Biology. 9: 1619-1628. Waples, R. 2002. Effective size of fluctuating salmon populations. Genetics 161:783-791.