Embed Size (px)
Citation preview

This page intentionally left blank
Reliability CenteredMaintenance (RCM)
Implementation Made Simple
Neil Bloom
McGraw-Hill, Inc.New York Chicago San Francisco Lisbon London
Madrid Mexico City Milan New Delhi San JuanSeoul Singapore Sydney Toronto

Copyright © 2006 by the McGraw-Hill Companies. All rights reserved. Manufactured in the UnitedStates of America. Except as permitted under the United States Copyright Act of 1976, no part of thispublication may be reproduced or distributed in any form or by any means, or stored in a database or retrieval system, without the prior written permission of the publisher.
0-07-158918-X
The material in this eBook also appears in the print version of this title: 0-07-146069-1.
All trademarks are trademarks of their respective owners. Rather than put a trademark symbol afterevery occurrence of a trademarked name, we use names in an editorial fashion only, and to the benefit of the trademark owner, with no intention of infringement of the trademark. Where such designations appear in this book, they have been printed with initial caps.
McGraw-Hill eBooks are available at special quantity discounts to use as premiums and sales promotions, or for use in corporate training programs. For more information, please contact GeorgeHoare, Special Sales, at [email protected] or (212) 904-4069.
TERMS OF USE
This is a copyrighted work and The McGraw-Hill Companies, Inc. (“McGraw-Hill”) and its licensorsreserve all rights in and to the work. Use of this work is subject to these terms. Except as permittedunder the Copyright Act of 1976 and the right to store and retrieve one copy of the work, you may notdecompile, disassemble, reverse engineer, reproduce, modify, create derivative works based upon,transmit, distribute, disseminate, sell, publish or sublicense the work or any part of it without McGraw-Hill’s prior consent. You may use the work for your own noncommercial and personal use;any other use of the work is strictly prohibited. Your right to use the work may be terminated if youfail to comply with these terms.
THE WORK IS PROVIDED “AS IS.” McGRAW-HILL AND ITS LICENSORS MAKE NO GUARANTEES OR WARRANTIES AS TO THE ACCURACY, ADEQUACY OR COMPLETE-NESS OF OR RESULTS TO BE OBTAINED FROM USING THE WORK, INCLUDING ANYINFORMATION THAT CAN BE ACCESSED THROUGH THE WORK VIA HYPERLINK OROTHERWISE, AND EXPRESSLY DISCLAIM ANY WARRANTY, EXPRESS OR IMPLIED,INCLUDING BUT NOT LIMITED TO IMPLIED WARRANTIES OF MERCHANTABILITY ORFITNESS FOR A PARTICULAR PURPOSE. McGraw-Hill and its licensors do not warrant or guar-antee that the functions contained in the work will meet your requirements or that its operation will beuninterrupted or error free. Neither McGraw-Hill nor its licensors shall be liable to you or anyone elsefor any inaccuracy, error or omission, regardless of cause, in the work or for any damages resultingtherefrom. McGraw-Hill has no responsibility for the content of any information accessed through thework. Under no circumstances shall McGraw-Hill and/or its licensors be liable for any indirect, inci-dental, special, punitive, consequential or similar damages that result from the use of or inability touse the work, even if any of them has been advised of the possibility of such damages. This limitationof liability shall apply to any claim or cause whatsoever whether such claim or cause arises in contract,tort or otherwise.
DOI: 10.1036/0071460691

We hope you enjoy thisMcGraw-Hill eBook! If
you’d like more information about this book,its author, or related books and websites,please click here.
Professional
Want to learn more?

To my wife, friend, partner, and soul mate,Bernadette, who is indeed a saint

This page intentionally left blank
vii
Contents
Preface xiii
Acknowledgments xix
Chapter 1 Introduction to RCM 11.1 Uncovering the Fuzziness and Mystique of RCM 4
1.2 The Background of RCM 9
1.3 A No-Nonsense Approach to RCM 11
1.4 RCM as a Major Factor in the Bottom Line 12
Chapter 2 Why RCM Has Historically Been So Difficult to Implement 152.1 Consultants 15
2.2 A White Elephant 16
2.3 Reasons for Failure 182.3.1 Loss of In-House Control 182.3.2 An Incorrect Mix of Personnel Performing the Analysis 192.3.3 Unnecessary and Costly Administrative Burdens 202.3.4 Fundamental RCM Concepts Not Understood 212.3.5 Confusion Determining System Functions 212.3.6 Confusion Concerning System Boundaries and Interfaces 212.3.7 Divergent Expectations 232.3.8 Confusion Regarding Convention 242.3.9 Misunderstanding “Hidden” Failures and Redundancy 242.3.10 Misunderstanding Run-to-Failure 252.3.11 Inappropriate Component Classifications 252.3.12 Instruments Were Not Included as Part of the RCM Analysis 26
Chapter 3 Fundamental RCM Concepts Explained,Some for the Very First Time:The Next Plateau 27
3.1 The Three Phases of an RCM-Based Preventive Maintenance Program 30
3.2 The Three Cornerstones of RCM 32
3.3 Hidden Failures, Redundancy, and Critical Components 34
3.4 Testing Hidden Systems 45
For more information about this title, click here
3.5 The Missing Link: Potentially Critical Components 46
3.6 Commitment Components 50
3.7 Economic Components 51
3.8 The “Canon Law” of Run-to-Failure Components 52
3.9 The Integration of Preventive and Corrective Maintenance and the Distinction Between Potentially Critical and Run-to-Failure Components 573.9.1 An RTF CM versus a Critical CM: Which Takes Priority
for Getting Worked First? 59
3.10 The Anatomy of a Disaster 61
3.11 A Deeper Look at Critical Components, Potentially Critical Components, and Hidden Failures—How They All Fit Together 65
3.12 Finding the Anomalies 68
3.13 Failures Found During Operator Rounds 70
3.14 Redundant, Standby, and Backup Functions 70
3.15 Typical Examples of Component Classifications 73
3.16 Component Classification Hierarchy 73
3.17 The Defensive Strategies of a PM Program 75
3.18 Eliminating the Requirement for Identifying Boundaries and Interfaces 75
3.19 Functions and Functional Failures Are Identified at the Component Level, Not the System and Subsystem Level 77
3.20 The Quest for the Consequence of Failure 79
3.21 The COFA versus the FMEA 81
3.22 How Do You Know When Your Plant Is Reliable? 83
3.23 Chapter Summary 85
Chapter 4 RCM Implementation: Preparation and Tools 894.1 Preparation 90
4.2 The Sequential Elements Needed for the Analysis 914.2.1 A Simple but Comprehensive Alphanumeric
Equipment I.D. Database 914.2.2 Informational Resources 934.2.3 Establishing Convention 944.2.4 Specialized Workstations and Software 944.2.5 The COFA Excel Spreadsheet versus the FMEA 954.2.6 The PM Task Worksheet 1004.2.7 The Economic Evaluation Worksheet 102
4.3 Chapter Summary 105
Chapter 5 RCM Made Simple: Implementation Process 1075.1 Define Your Asset Reliability Strategy 109
5.2 Understanding the RCM COFA Logic Tree, the Potentially Critical Guideline, and the Economically Significant Guideline 112
5.3 Completing the COFA Worksheet in Conjunction with the COFA Logic Tree, the Potentially Critical Guideline,and the Economically Significant Guideline 1205.3.1 Describe the Component Functions 121
viii Contents
Contents ix
5.3.2 Describe the Functional Failures 1235.3.3 Describe the Dominant Component Failure Modes
for Each Functional Failure 1245.3.4 Is the Occurrence of the Failure Mode Evident? 1245.3.5 Describe the System Effect for Each Failure Mode 1265.3.6 Describe the Consequence of Failure Based
on the Asset Reliability Criteria You Selected 1295.3.7 Define the Component Classification 129
5.4 RCM Serves as a Translation of the Design Objectives 131
5.5 Companion Equipment 133
5.6 The SAE Standard: Document JA1011 134
5.7 A Real-Life Analysis: Averting a Potentially Devastating Plant Consequence 135
5.8 Why Streamlined RCM Methods Are Not Recommended 1415.8.1 Total Productive Maintenance (TPM) 1425.8.2 Reliability-Based Maintenance (RBM) 1425.8.3 Probabilistic Safety Analysis (PSA)
Based Maintenance 1425.8.4 80/20 Rule 142
5.9 Chapter Summary 143
5.10 RCM Made “Difficult” 1475.10.1 Determine System Boundaries 1485.10.2 Determine Subsystem Boundaries 1485.10.3 Determine Interfaces 1495.10.4 Determine Functions 1495.10.5 Determine the Functional Failures 1505.10.6 Determine Which Equipment Is Responsible
for the Functional Failures 150
Chapter 6 The PM Task Selection Process 1536.1 Understanding Preventive Maintenance Task Terminology 154
6.2 Condition-Directed,Time-Directed, and Failure-Finding Tasks 154
6.3 The PM Task Worksheet 157
6.4 The PM Task Selection Logic Tree 158
6.5 Why a Condition-Directed Task Is Preferred 161
6.6 Determining the PM Task Frequency and Interval 1626.6.1 The Optimum Time to Establish a Reliability Program 165
6.7 Is a Design Change Recommended? 166
6.8 Completing a Typical PM Task Worksheet 167
6.9 Institute Technical Restraints 168
6.10 A Sampling Strategy 169
6.11 Common Mode Failures 171
6.12 Different Predictive Maintenance (PdM) Techniques 1726.12.1 Vibration Monitoring and Analysis 1726.12.2 Acoustic Monitoring 1736.12.3 Thermography or Infrared Monitoring 1736.12.4 Oil Sampling and Analysis 1736.12.5 X-ray or Radiography Inspection 1736.12.6 Magnetic Particle Inspection 174
6.12.7 Eddy Current Testing 1746.12.8 Ultrasonic Testing 1746.12.9 Liquid Penetrant 1746.12.10 Motor Current Signature Analysis (MCSA) 1746.12.11 Boroscope Inspections 1746.12.12 Diagnostics for Motor-Operated Valves 1756.12.13 Diagnostics for Air-Operated Valves 175
6.13 Chapter Summary 175
Chapter 7 RCM for Instruments 1817.1 Instrument Categories 182
7.2 Instrument Design Tolerance Criteria 183
7.3 The Instrument Logic Tree 1857.3.1 Block 1: Is the Instrument a Functional Instrument? 1857.3.2 Block 2: Instrument Is Analyzed in the COFA Worksheet
and the PM Task Selection Worksheet. 1857.3.3 Block 3: Can the Instrument Reading Result
in an Operator Having to Initiate Some Kind of Action? 1857.3.4 Block 4: A PM Is Required. Calibration Criteria
and Periodicity Guidance Are as Follows. 1867.3.5 Block 5: Were the Last Three Successive Calibrations
Within Vendor Tolerance Criteria? 1867.3.6 Block 6: Periodicity Extension Is Allowed. 1877.3.7 Block 7: Reduce Periodicity or Implement a Design Change. 1877.3.8 Block 8: Is the Instrument Redundant? 1877.3.9 Block 9: Is an Indication Comparison Applicable? 1877.3.10 Block 10: Is the Consequence of Excessive Drift
(to the Point of Instrument Failure) Acceptable? 1887.3.11 Block 11: A Calibration PM Is Optional. 1897.3.12 Block 12: A PM Is Required. Calibration Criteria
and Periodicity Guidance Are as Follows. 1897.3.13 Block 13: Were the Last Two Successive Calibrations
Within a +/−2.5 Percent Accuracy Tolerance? 1897.3.14 Block 14: Periodicity Extension Is Allowed. 1897.3.15 Block 15: Were the Last Two Successive Calibrations
Within a +/−5.0 Percent Accuracy Tolerance? 1897.3.16 Block 16: Periodicity Extension Is Not Allowed. 1907.3.17 Block 17: Reduce Periodicity or Implement a Design Change. 190
7.4 Chapter Summary 190
Chapter 8 The RCM Living Program 1938.1 A Model for an RCM Living Program 194
8.1.1 The Craft Feedback Evaluation Element 1968.1.2 The Corrective Maintenance (CM) Evaluation Element 2038.1.3 The “Other Inputs” Element 205
8.1.3.1 Root-Cause Evaluations 2068.1.3.2 Vendor Bulletins 2068.1.3.3 Regulatory Bulletins 2078.1.3.4 Industry Failure Data 2078.1.3.5 Engineering Evaluations 208
x Contents
8.1.3.6 Plant Design Changes 2088.1.3.7 New Commitments 208
8.1.4 Monitoring and Trending 2098.1.5 The RCM Analysis Element 2098.1.6 Equipment Database 2108.1.7 The PM Audit 210
8.2 Chapter Summary 212
Chapter 9 An RCM Monitoring and Trending Strategy 2179.1 What Is Reliability and How Do You Measure It? 218
9.2 Monitoring Reliability Is Like Monitoring the Human Body 220
9.3 Caution: Avoid Analysis Paralysis Performance Monitoring 220
9.4 The Aggregate Metrics 2229.4.1 Unplanned Plant or Facility Trips 2239.4.2 Capacity Factor 2249.4.3 Unplanned Operator Actions 2249.4.4 Unplanned Power Reductions 2259.4.5 Production Delays 2259.4.6 Enforcement Actions 2269.4.7 Litigation Occurrences 2269.4.8 Citations and Violations 2279.4.9 Root-Cause Evaluations 2279.4.10 Injuries 2289.4.11 Rate of Written CMs 2289.4.12 Overdue CM Backlog 2299.4.13 Overdue PM Backlog 229
9.5 Weighting Factors 230
9.6 Performance Calculations 231
9.7 Performance Graph 235
9.8 Performance Graph by System 237
9.9 A Final Caution 239
9.10 Benchmarking 239
9.11 More About Expected Performance Rates 241
9.12 Avoid Reliability Complacency 241
9.13 How to Maintain Your Reliability Performance 242
9.14 Chapter Summary 246
Chapter 10 RCM Implementation Made Simple—Epilogue 24910.1 RCM as a Plant Culture 249
10.2 A Step-by-Step Review of the Process 25110.2.1 Select an RCM Point of Contact 25110.2.2 Review the Reasons for RCM Program Failures 25510.2.3 Understand the Concepts 25510.2.4 Define Your Asset Reliability Criteria 25510.2.5 Establish Your Alphanumeric Equipment Database 25610.2.6 Analyze Each Component Function in the COFA Logic Tree 25610.2.7 Analyze Each Component Function in the
Potentially Critical Guideline 257
Contents xi

10.2.8 Analyze Each Component Function in the Economically Significant Guideline 257
10.2.9 Enter All Data in the COFA Worksheet 25810.2.10 Classify Each Component 25810.2.11 Analyze All Classified Components Except Run-to-Failure
Components in the PM Task Selection Logic Tree 25810.2.12 Document All Tasks and Periodicities on the PM
Task Worksheet 25810.2.13 Analyze Instruments in the Instrument Logic Tree 25910.2.14 Develop Your RCM Living Program 25910.2.15 Establish Monitoring and Trending Program Metrics 26010.2.16 Establish Your Expected Performance Rate 26010.2.17 Establish Your Actual Performance Rate 26110.2.18 Establish Your Trend Graphs 26110.2.19 Maintain Continued Vigilance Over Your Program 261
10.3 Taking Command of Your Own Ship 262
Glossary 265
Bibliography 285
Index 287
xii Contents
xiii
Preface
Reliability centered maintenance, or RCM, as it is called, was dif-ficult. RCM was an albatross. It was cumbersome, expensive,and almost impossible to implement. Note my use of the pasttense here! Implementing an RCM program has for the mostpart been shrouded in confusion, and its image has taken on anaura of perceived complexity. I plan to change that.
I am writing this book because I find that most other books onthis subject are very difficult to understand and even more diffi-cult to use as a tool for implementation. RCM is a very powerfulreliability tool, but as long as it remains non-user-friendly, itsfull potential is limited. It is my belief that classical RCM hasbeen made much more complicated than it needs to be. I explainclassical RCM (not streamlined RCM) in simple terms and intro-duce some new concepts that have never before been identified.You will learn how to readily implement an affordable premierreliability program for your plant or facility, on your own, with-out the need for any outside expertise and without the need forspecial training of any kind. I truly believe that this book has thepotential to set a new standard for preventive maintenance andreliability via the classical RCM process.
You are probably asking yourself . . . “Who is this author, andhow can he explain how to implement classical RCM in a simple,straightforward manner, easily understandable to nontechnicalas well as technical personnel the world over?”
I have been responsible for developing and managing what isperhaps, even today, one of the most comprehensive classicalRCM programs ever implemented. The program analyzed everysystem, covering more than 125,000 individual components, at
Copyright © 2006 by the McGraw-Hill Companies. Click here for terms of use.
one of the country’s largest nuclear generating facilities. Some ofthe ideas and concepts that I developed in 1991 are now specifi-cally documented in the latest SAE Standard for RCM publishedin September 1999.
My Background
I received my bachelor of science degree in mechanical engineer-ing from the University of Miami, where I also minored in eco-nomics. I have been a guest speaker on RCM at some of the mostprestigious national and international conferences. Theseinclude those of the Electric Power Research Institute (EPRI),American Society of Mechanical Engineers (ASME), EdisonElectric Institute (EEI), Argonne National Laboratory (ANL),which is operated by the University of Chicago for the Depart-ment of Energy (DOE), the American Nuclear Society (ANS),and the International Atomic Energy Agency (IAEA) in Vienna,Austria. The Canadian Atomic Energy Control Board (AECB)requested that I personally meet with some of its members todiscuss the RCM program that I had developed.
My engineering and maintenance career of almost 40 yearshas been devoted to the commercial aviation and commercialnuclear power industries. Both of these require the highest stan-dards of safety and reliability, as evidenced by their highly strin-gent regulation by the federal government via the FederalAviation Administration (FAA) and the Nuclear RegulatoryCommission (NRC). I have been fortunate to have workedclosely with both of these entities.
In 1967, I began working as a systems engineer at one of thenation’s largest airlines, which had more than 30,000 employeesand a fleet of several hundred aircraft. I progressed to superinten-dent of intermediate aircraft maintenance and then became theadministrative assistant to the vice president of maintenance.
My experience included Maintenance Steering Group (MSG-2and MSG-3) reliability studies in which MSG logic was the fore-runner to RCM. Working closely with aircraft manufacturersand their suppliers to enhance safety and reliability objectives, Iwas instrumental in establishing aircraft maintenance strate-gies, initiating aircraft design changes, and interfacing with the
xiv Preface
FAA as a liaison. I developed aircraft preventive maintenanceprograms—from the Douglas DC-8/DC-9 and Boeing B707/B727to the Airbus A300, Lockheed L1011, and the Boeing B757—andwas also a member of the Maintenance Review Board (MRB) forthe Lockheed L1011. Commercial aviation is where RCM wasfirst introduced. It made its way to the nuclear power industry inthe mid-1980s.
Beginning in 1983, I worked for one of the nation’s largest elec-tric utilities at its nuclear generating facility. I was involvedwith NRC regulatory issues; maintenance engineering activi-ties; maintenance procedures, policies, and practices; and, from1991 until my retirement in 2004, I was the program managerresponsible for RCM and preventive maintenance programs.
Commercial aviation and nuclear power, paramount in thehierarchy of safety and reliability relative to most other indus-tries, have afforded me the special practical experience andexpertise to know what can and cannot be done with classicalRCM. I know what works and what doesn’t work, what the pit-falls are, and how to circumvent the roadblocks. I know whatchanges can be made to maintain the same, or even more,robustness of the process while minimizing the administrativeburdens. I know what information is absolutely necessary toimplement a successful program, and how to do this with ease. Ialso know what parts of the process are not necessary and do notneed to be included.
Everything I explain in this book is in total accord with theoriginal airline MSG and RCM methodology and the latest SAEStandard governing RCM (designated as JA1011), which I dis-cuss in great detail in Chapters 3 and 5. In fact, some of the veryspecific ideas in the RCM program I developed in 1991 are nowincluded in the new JA1011 SAE RCM Standard titled Evalua-tion Criteria for RCM Processes.
My wife and I live in Monarch Beach, California. You may con-tact me via e-mail at [email protected].
Some Additional Insight from the Author
I would like to mention the work of a colleague of mine, JohnMoubray, who recently passed away. I first met John when he
Preface xv
came to visit me in California in early 1991 after becomingaware of my work on RCM in the nuclear industry. He was anoutstanding advocate of RCM, and his efforts helped to bring itthe visibility it justly deserves. Like John, I, too, am an advocateof classical RCM versus the shortcut versions, but I believe clas-sical RCM can be achieved with a much more simplifiedapproach.
Finally, it was from comments I received after having given apresentation at the Southern California Plant Engineering andFacilities Maintenance Conference that reinvigorated my rea-sons for writing this book. Many people from relatively smalland midsize industries and facilities came up to me afterwardand told me they wanted to implement a classical RCM programbut that their companies did not have hundreds of thousands ofdollars to spend on the program—and certainly not millions ofdollars, like the nuclear industry does. They wanted the samerigorous analysis, but they did not believe they had the knowl-edge or the financial resources to implement it. They wanted abook that could guide them through the RCM process withouthaving to spend large sums of money for consulting expertiseand without having to rely on hundreds of engineering and othertechnical personnel who were not available to them.
Since my retirement in 2004, I have devoted my full efforts towriting this book, which has been almost 14 years in the making.My goal is to enable and empower you to implement a premierclassical RCM program at your facility without having to spendan inordinate amount of time and money and without the needfor expensive outside consulting services, specialized training,or other support. I have embraced straightforward, easy-to-understand logic, have used an objective rather than a subjec-tive decision-making process, and have given great importanceto maintaining the conceptual clarity of the process to highlightits simplicity. These are all designed specifically to enhance the understanding, implementability, and cost-effectiveness ofRCM. When you have finished reading this book you will be ableto establish an affordable and robust premier reliability pro-gram that will make your facility safer, more reliable, and morecost efficient.
xvi Preface

This could be the RCM breakthrough that you have been look-ing for, and I hope that you will find each of the following chap-ters to be a revelation. It is my belief that industry, universally,has the potential for attaining even greater levels of safety andreliability if the RCM process becomes more user-friendly, as itwas intended to be by its pioneers, Stanley Nowlan and HowardHeap.
Preface xvii

This page intentionally left blank
xix
Acknowledgments
I would like to acknowledge all of my peers, subordinates, andsuperiors in the airline industry who gave me the opportunity tolearn the valuable importance of safety and reliability. I wouldespecially like to thank Eldon Johnson, of Pan American WorldAirways, and Sam Miller, Jack Steffen, and Fred Lind, formervice president of maintenance at Eastern Airlines.
Primarily, I would like to acknowledge the work of StanleyNowlan and Howard Heap of United Airlines, the true pioneersof RCM, whose treatise on airline RCM principles is still the pri-mary basis for this preventive maintenance program methodol-ogy.
I am indebted to many people in the nuclear industry for hav-ing the wisdom and the vision to allow me to foster the develop-ment of classical RCM from its airline origins. I would especiallylike to thank Hans Merten, Steve McMahan, and vice presidentsJoe Wambold and Russ Kreiger of Southern California Edison.
I would also like to thank the Electric Power Research Insti-tute (EPRI) and the Institute of Nuclear Power Operators(INPO), from whom I gained great insight into the culture ofsafety and reliability. I would specifically like to mention JohnGaertner of EPRI for his invaluable friendship through theyears.
A special acknowledgment goes to Bob Baldwin of Mainte-nance Technology magazine and to the Society of Maintenanceand Reliability Professionals (SMRP) for their unrelentingefforts to bring reliability out of the dark ages and into a leading-edge role for furthering an industrial safety and reliability cul-ture and as a means for enhancing corporate profitability.
Copyright © 2006 by the McGraw-Hill Companies. Click here for terms of use.

Finally, I want to acknowledge many unknown individuals.These were the attendees at various conferences in which I wasa guest speaker on RCM. Many of these individuals repre-sented rather small facilities compared to nuclear power plantsor fleets of commercial aircraft. They inquired how they couldlearn to develop and implement a premier RCM program with-out having the deep pockets to do it with. That was, perhaps,the final inspiration I needed to begin this journey.
Finally, I want to express my total appreciation to KenMcCombs, my editor at McGraw-Hill, and most of all to my wifeBernadette, who so patiently provided the inspiration and theenvironment for this book to come to fruition.
xx Acknowledgments
1
Chapter
1Introduction to RCM
Reliability centered maintenance (RCM) is not new. AirlineMaintenance Steering Group (MSG) logic, the predecessor toRCM, has existed since the early 1960s. Stanley Nowlan andHoward Heap of United Airlines introduced formal RCM to thecommercial aviation industry in 1978. Airline preventive main-tenance and reliability is primarily based on their work, andthey are considered to be the “grandfathers” of RCM. Theirvision is as relevant today as it was when they published thefirst (and most authoritative) rendition of Reliability CenteredMaintenance in 1978.
RCM is nothing more than a logical way of identifying whatequipment in your facility is required to be maintained on a pre-ventive maintenance basis rather than a let-it-fail-then-fix-itbasis, commonly referred to as run-to-failure (RTF). Many of youhave heard the phrases “don’t fix it until it breaks” or “don’tbreak it by trying to fix it.” There is a grain of truth to theseaxioms, but they depict a very shallow approach if you are striv-ing to achieve reliability and safety levels for your facility thatare the best they can be.
Many plants and facilities have tried the hit-and-missapproach, or the old “how-we-used-to-do-it” approach, or therun-on-luck approach to maintenance. These methods will getyou only so far until your luck runs out, and the potential fordisaster looms right around the corner. In the absence of a
Copyright © 2006 by the McGraw-Hill Companies. Click here for terms of use.
structured RCM approach, reliability will rest solely on thebasis of seat-of-the-pants experience, with a strategy consistingof a best-guess decision process. That approach falls far short ofmodern-day expectations.
Disasters can be caused by acts of nature, human error, orequipment failures. Disasters caused by acts of nature such ashurricanes, earthquakes, tsunamis, tornados, or landslides donot lend themselves to being tamed by human intervention; forthe most part, they are unavoidable. There may be warning sys-tems, such as tsunami warning buoys in the Pacific Rim, or con-struction standards that help to prevent structures frombuckling during an earthquake, but the event itself is unavoid-able. On the other hand, human error (pilot error, judgmenterror, operator error, etc.) offers a range of latitude in circum-venting the potential for disaster. Some of the tools that mightbe used, for example, include better training, more specific pro-cedural guidance relative to performing a given task, a saferwork environment, and more rigid standards and codes—allactions that can be taken to avoid human error to some degree.
What about disasters that happen in factories, plants, or otherfacilities that usually have their origin in the failure of equip-ment? These types of failures probably offer the greatest latitudeof all for circumventing their potential to cause a disaster.Nothing is ever 100 percent reliable, whether it is an aircraft, aspace shuttle, or a nuclear power plant. However, disasterscaused by equipment failure have the capability to be harnessedto the degree that allows for the closest proximity to that 100percent reliability threshold. That cannot be said for natural dis-asters or for human-induced ones.
We have a lot of control over the way we maintain our facilitiesand equipment to prevent failures. A reliability centered main-tenance approach to preventive maintenance is probably thebest path you can take to get as close as possible to that 100 per-cent reliability threshold. An RCM analysis also considers thefact that maintenance budgets are not unlimited, and thus somerational basis exists for deciding what to do and where to expendthe most effort.
Today, almost everyone in a manufacturing, power generation,production, and other technological environments is familiar with
2 Chapter One
the terminology of RCM. However, one’s perceived degree of famil-iarity may be quite deceiving. RCM is very simple in concept butalso very sophisticatedly subtle in its application. As with manyprocesses, having only a very limited understanding of the RCMprocess may, in fact, prove to be more problematic than beneficial.The false comfort level of naively believing that a superficialimplementation of the process will be a panacea for plant andequipment problems, and then depending on that process to pro-duce significant reliability results, is unrealistic.
The understanding of RCM that many of us have comes fromreading books and articles on the subject or from consultants’sales presentations. Oftentimes this information is limited andincludes terminology such as boundaries, functions, interfaces,functional failures, and so on. More specifically, the terminologyshould include: establishing system boundaries, subsystemboundaries, in-system in-interfaces, in-system out-interfaces, out-system in-interfaces, out-system out-interfaces, system functions,subsystem functions, failures of those subsystem functions, conse-quences of those functional failures, and so on. The very mentionof these phrases have probably caused an immediate quizzicallook on your face, and rightly so. These are some of the very rea-sons why RCM has been so difficult to implement. Chapters 2and 3 explain why much of this entire cumbersome process is noteven needed.
A more meaningful understanding of reliability can quicklybecome apparent thorough reflection on some of the concepts Iintroduce in this book. I developed these concepts because of thedifficulty I witnessed time and again by midlevel and senior-level management types trying to understanding the RCM pro-cess. It is not rocket science, but it is sophisticated and subtle.
Recognizing hidden failure modes, understanding when asingle-failure analysis is not acceptable, and knowing when runto failure is acceptable are the real cornerstones of RCM. Addi-tionally, the understated, but powerfully important, distinctionbetween true redundancy and redundant components fulfilling astandby or backup function is a key to reliability success.
Although Stanley Nowlan and Howard Heap gave greatimportance to the principle of “hidden” failures, unfortunately,hidden failures are not widely understood and are often over-
Introduction to RCM 3
looked. Almost everyone has heard the terminology hidden fail-ure. What I have found, however, is that very few people under-stand the difference between a redundant system, a backupsystem, and a standby system and how hidden failures affectthem. It is not well understood that different subtleties, whichmay appear to be identical operating conditions, can cause verydifferent outcomes that result in a component being classified aseither immediately critical or run-to-failure.
Many utilities and other industries have implemented variousforms of an RCM program only to find that they continued tohave fundamental reliability issues that were not addressed bytheir analysis. The primary reason is the lack of a grassrootsphilosophical understanding of the principles governing theanalysis.
1.1 Uncovering the Fuzziness and Mystique of RCM
In my presentations at various maintenance and engineeringconferences around the country, I have found that there is acertain “fuzziness,” or mystique, associated with implementingan RCM program. Much of this fuzziness seems to arise whenattempting to analyze redundant equipment, identify hiddenfailures, invoke a run-to-failure strategy, determine when asingle-failure analysis is acceptable, and decide when (if notwhy) a multiple-failure analysis is required. I clearly delineatethe differences between these terms and at what point each oneis applicable. In Chapter 3, I explain my concept of potentiallycritical components, my “canon law” for run-to-failure, and howto differentiate when a single-failure analysis can be used ver-sus a multiple-failure analysis. You will also be introduced tothe consequence-of-failure analysis (COFA). You will find theseconcepts to be extremely powerful tools; however, they nonethe-less are quite simple and straightforward.
These concepts have been made easy to understand, since theyform the very fabric for successfully implementing an RCM pro-gram. These are concepts I have created that directly descendfrom, yet go beyond, the work of Stanley Nowlan and HowardHeap. These concepts have not been clearly espoused prior to my
4 Chapter One
writing this book, which is why it is titled Reliability Centered:Maintenance Implementation Made Simple.
In the past several years numerous versions of the RCM pro-cess have evolved. They have been called streamlined, abbrevi-ated, shortcut, truncated, and so on. It is this author’s belief thatthere is only one real RCM process, and that is the classicalRCM process. Other, truncated, versions evolved only because ofthe difficulty and expense in attempting to implement the clas-sical version. It is also my belief that these other versions willnot afford you a comprehensive reliability program, becausemany important functions and potential failure consequenceswill be missed. In fact, serious mishaps may even occur as aresult. I discuss, in detail, the shortcomings of streamlined ver-sions of the process in Chapter 5. Throughout this book, when-ever I refer to RCM, it is the classical version I am referring tounless otherwise noted.
Being familiar with the shortcut approach and the classicalapproach, I compare it to the following analogy. . . . Suppose aperson smoked two packs of cigarettes per day. Cutting down toone pack per day would provide a better outcome. However, ifthat person cut down to zero packs per day, that would offer aneven more optimum outcome. Now, if cutting down to zero packsper day required virtually the same effort as cutting down to onepack per day, or possibly even less effort, which would you thinkis best? While streamlined RCM is better than not having anybasis for your preventive maintenance program, it is still tanta-mount to a pick-and-choose potpourri philosophy, and stream-lined versions will not uncover those innocuous challenges thatpotentially jeopardize your plant or facility. An abbreviatedRCM process cannot provide for that optimum outcome, like thezero-pack-per-day smoker has optimally improved his results.The approach to classical RCM that you will be learning pro-vides a greater opportunity to achieve that optimum outcomeand, surprising as it may seem, will not take any more time orexpense; in all likelihood, it will take even less effort than theshortcuts.
Remember, it is not the obvious that creates the greatestpotential for disaster . . . it is the nonobvious! Streamlined RCMwill not robustly ascertain the nonobvious consequences of fail-
Introduction to RCM 5
ure. Only classical RCM offers the opportunity to find those rel-atively unknown, and what may appear to be noncritical, com-ponents, that can, in fact, have some of the most significantconsequences as a result of their failure. You will see how classi-cal RCM can be achieved in virtually the same amount of time,or less, than streamlined versions. This is discussed in detail inChapters 3, 4, and 5.
Some RCM books and other RCM guides may lead you tobelieve that what appear to be “less-important” systems andcomponents like service water, for example, are automaticallyrun to failure without any further analysis required, such asmight be the case with those espousing a streamlined RCMapproach. Nothing can lead you further away from achievingreliability than to go off in that direction. As a case in point, formany years nuclear components were considered to be eithersafety-related or non-safety-related and were identified by theirquality class, which ranged from Q-class 1 to Q-class 4 depend-ing on whether they were part of the safety-related nuclearsteam supply system (NSSS) or the non-safety-related balance-of-plant (BOP) system.
Having come from an airline background prior to my nuclearexperience, I knew that every component needed to be treatedequally, with the analysis laser-focused on the question “what isthe consequence of failure?” regardless of any preconceived pedi-gree of the relative importance of a given system or component.The RCM program I developed in the early 1990s did not use thegeneric safety-related versus non-safety-related litmus test, butinstead zeroed in on the consequence of failure regardless of anyother pedigree placed on the component. This was a majordeparture from the existing nuclear thought process at thattime. Then, in the late 1990s, to its credit, the Nuclear Regula-tory Commission (NRC) established subsequent guidelines thatrequired non-safety-related components to be analyzed for theirconsequence of failure. Even today, many reliability engineersand other professionals still do not comprehend the rather sim-ple axiom that all components are assumed to be important untilproven otherwise via a comprehensive analysis.
To further illustrate my point, the service water system at aplant may, at first glance, easily lead one to believe it supplied
6 Chapter One
service water only to the lavatories and water fountains and istherefore unimportant and probably a run-to-failure system.The primary source of service water is usually the local waterdistrict. However, when looking at a certain service waterschematic in detail, it was identified that there was a singlecheck whose function was not only to ensure the continued sup-ply of service water to the lavatories and water fountains, butalso to provide the path for seal water flow to the bearings of alleight condenser circulating water pumps in the event of a citywater-line break. There are four circulating water pumps perunit, meaning that the failure of one innocuous component inthe rather nondescript service water system, under the right (or,more appropriately, wrong) conditions, could possibly result in adual-unit shutdown. Employing streamlined techniques andmaking the wrong assumptions would have missed this criticalfunction entirely. The specific component within the servicewater system was therefore critical and not run to failure.
It is important that no system be automatically discountedfrom the analysis. While I am not saying that, in some instances,in-house experience may appear to justify discounting a system,it should be done only after an analysis has been performed tomake sure something has not been overlooked. Every component(switch, pump, valve, motor, etc.) has to be looked at. Each com-ponent was included in the design of your facility for a reason.Otherwise, why is it there? Remember, as I discuss in Chapter 3:It is not the obvious that everyone knows about, but rather it isthe nonobvious failure that poses the most disastrous threat toyour facility. If you don’t analyze each component individually,you will miss the opportunity to identify those nonobvious fail-ure modes.
Some RCM practitioners have even espoused an 80/20 rule, orsome facsimile, that looks at only 20 percent of a plant andignores the other 80 percent. In doing this, you most likely willnot achieve the reliability goals you are looking for. Thoseinnocuous components whose functions may be thought to beunimportant may in fact have unanalyzed hidden failure conse-quences that will remain in a “sleeper cell” mode just waiting tomanifest themselves and wreak havoc on your facility. In Chap-ter 3 you see how these sleeper cell failure modes really work
Introduction to RCM 7
and how easy it is for them to bring a calamity to your doorstep,like the Trojan horse in Greek mythology.
I have even seen where the 80/20 rule was predicated on thenumber of corrective maintenance (CM) events. Because of theinaccuracies of arbitrarily counting the number of correctivemaintenance orders without regard to the relative importance ofthose CMs, this would be a totally misleading criteria. A verycritical component may have very few CMs, whereas a much lesscritical component may have many CMs. Again, not a very goodway to identify an RCM population of important components.
A leading newspaper recently headlined a rather unpleasant,but poignant, example of how commencing an RCM analysiswithout understanding the concepts that you will be learningabout in this book can indeed result in a disastrous outcome. Anapparently flawed RCM attempt at a major theme park of aworld-renowned corporation resulted in unwanted interna-tional attention and publicity because of mechanical equipmentproblems with one of its ride attractions that ultimatelyresulted in a fatality. The concepts of run-to-failure, redun-dancy, and potentially critical components were apparently notwell understood.
RCM has three phases to it. Oftentimes these are combined,but that only creates another source of confusion. The firstphase, which is the most important, is to identify the equipmentthat requires preventive maintenance. The next phase is to spec-ify the different types of preventive maintenance activities andtasks, including predictive maintenance (PdM) techniques thatneed to be performed on the identified equipment. The thirdphase is ensuring that the preventive maintenance tasks thatwere specified are properly executed in a timely manner. Theseseparate and discrete phases are discussed in Chapter 3.
Let’s start with the definition of reliability centered mainte-nance (RCM):
A set of tasks generated on the basis of a systematic evaluationthat are used to develop or optimize a maintenance program. RCMincorporates decision logic to ascertain the safety and operationalconsequences of failures and identifies the mechanisms responsi-ble for those failures.
8 Chapter One
This may seem like a lot of words to describe a simple, straight-forward, logical process. How and why did this logical processcome into being?
1.2 The Background of RCM
In the early years of commercial jet aviation, the aircraft manu-facturers and the individual airlines believed that if an aircraftwas overhauled at a given time interval and completely tornapart, virtually system by system, component by component,once it was released from the hangar it would perform totallyreliably until the next major overhaul, notwithstanding the req-uisite intermediate maintenance activities required. Most of theequipment was completely overhauled whether it needed it ornot. What the aircraft manufacturers and their customers (i.e.,the airlines) found out was that expected levels of reliability werestill elusive. Therefore, they believed that if they performed thisoverhaul more often, surely the reliability levels they were seek-ing would be achieved. Consequently, the overhaul periodicitywas decreased. Note that I used the word periodicity, not fre-quency. I do this in order to be technically correct. The periodicityincludes the frequency plus the interval. For example, an A2 peri-odicity includes the annual frequency “A” plus the interval of “2,”meaning the task is performed every two years. Using the fre-quency alone can be misleading. For example, extending the fre-quency from weekly to monthly means you perform the task lessoften, thereby increasing the periodicity. Conversely, reducing thefrequency from monthly to weekly means you perform the taskmore often, thereby decreasing the periodicity.
Once again, an entire aircraft and virtually all of its compo-nents were completely torn apart at a lesser periodicity (moreoften), and again it remained in the hangar for weeks earning norevenue. Once released from the hangar, expected levels of reli-ability were still not achieved and in fact were even less thanexpected. This anomaly created the environment that set up thepriority for, and led to the work of, Nowlan and Heap. Theybegan to understand that preserving critical equipment func-tions rather than randomly and arbitrarily tearing an entire air-
Introduction to RCM 9
craft apart was the key to reliability. They also found out thatindiscriminately overhauling equipment actually had a reversenegative effect on reliability, because the probability of failure ofthe newly replaced equipment increased due to premature fail-ures and infant mortality.
Another interesting phenomenon they found was that similarcomponents did not wear out over time in any sort of identicalmanner. In fact, Nowlan and Heap showed that only approxi-mately 11 percent of all components exhibited a wear-out ratethat lent itself to replacement at a given periodicity. That meantthat almost 90 percent of all other components failed randomly.Scheduled overhauls were therefore counterproductive for thispopulation. This is discussed in detail in Chapter 6.
It was also recognized that a maintenance program cannotcorrect deficiencies in the inherent safety and reliability levels ofthe equipment. It can only prevent deterioration of those inher-ent levels. If the inherent reliability levels are found to be unsat-isfactory, a design modification may be necessary to obtain anyfurther improvement.
I would also like to note that the RCM process must remaina “living” one. It is never static. New failure modes may becomeevident, and additional information relative to equipment per-formance may present itself at any time. Oftentimes, scheduledperiodicities of certain PM tasks may need to be adjusted. Peri-odicities may need to be increased or decreased. Newly identi-fied tasks may need to be added, while others may need to bedeleted based on new or different operating conditions or plantmodifications. In Chapter 8, I show you how to establish a veryeffective but simple “living program.” It will include a craftfeedback loop that I have found to be an extremely importantpart of the living process because it helps to maintain the via-bility of the program. I also show you how to establish a “mon-itoring and trending program” that incorporates an aggregateof parameters and criteria to monitor the effectiveness of yourRCM program. This program is thoroughly discussed in Chap-ter 9.
While RCM had its origin in commercial aviation, rememberthat it is a universal reliability process that is just as applicablefor a shoe factory as it is for a nuclear power plant or a commer-
10 Chapter One
cial jet aircraft. An effective RCM process will allow your preven-tive maintenance program to evolve from a level based primarilyon vendor recommendations, random selection, or arbitraryassignment to one based on more prudent fundamentals such asa component functional analysis and the identification of anysubsequent safety or operational consequences to your facility asa result of the component functional failure. This will providegreater confidence that your preventive maintenance programconsists of only those tasks that are specifically required for thesafe, reliable, and efficient operation of the plant and that anyunnecessary work has been eliminated.
Scheduling unnecessary PM activities may actually result in adiminution of overall plant reliability by virtue of the burdens itplaces on both operations and maintenance personnel. Theseadditional burdens, which include hanging and removing equip-ment tags, providing clearances, tracking PMs, monitoring workactivities, and so on, all contribute to the unnecessary depletionof available resources.
1.3 A No-Nonsense Approach to RCM
This is a no-nonsense book in the sense that I do not dwell on thelaws of physics and thermodynamics, the metallurgical proper-ties of materials, probabilistic studies, Poisson distributions, thetheoretical reasons for having a preventive maintenance pro-gram, or the in-depth history of society and its relationship withpreventive maintenance. I also intentionally avoid any otheresoteric information that, in my opinion, does not directly fosterthe simplified understating of RCM.
Rather, this book is intended for those people responsible forensuring the reliability of their plant or facility who want toreadily use this information to develop a premier reliability pro-gram based on the principles of RCM. It is intended to be a how-to book for those who want to implement an affordable programwithout the need for outside consultants and without theimplicit requirement of having to obtain an engineering degreeto understand and speak the language. The only peripheral ref-erence to commerce that I mention is how reliability directlyaffects the corporate bottom line.
Introduction to RCM 11
1.4 RCM as a Major Factor in The Bottom Line
Today’s corporate world employs some of the most sophisticatedstrategies ever assembled for achieving business success, andone of those strategies is relatively new to industries outside ofcommercial aviation and nuclear power. I call this process anasset reliability strategy. I explain this in detail in Chapter 5.
Asset management is one of many corporate buzzwords usedtoday. Some previous buzzwords were synergy, synergistic opti-mization, cost containment, strategic assets, strategic planning,and so on. These buzzwords and any such future buzzwords haveone thing in common: They all depend on preserving corporateassets. More than ever, the bottom line of a corporation is depen-dent on the reliability of its output. By that I mean reliabilitylevels that minimize any unplanned production delays, main-tain generation capacity, ensure personnel and plant safety, andprevent any unwanted regulatory or environmental issues frombringing unwanted publicity and/or litigation. In essence, assetmanagement, or whatever it may be called in the future, relieson an RCM approach as the core for identifying equipment func-tions that must be preserved to protect the corporate assets andensure the uninterrupted and continuous corporate revenueincome stream.
No longer is the maintenance organization relegated tosecond-team status behind sales, marketing, and finance. Thereis definitely a culture shift taking place within the universalindustrial complex that is elevating the importance of the main-tenance organization as part of the corporate flagship team.After all, where would these industrial corporations be withouta first-class preventive maintenance program to ensure the reli-able operation of the facility? When I talk about a plant or facil-ity, I am talking about any type of plant or facility, whether it isa private or a public entity. It could be a power-generating facil-ity, the electrical power transmission and distribution network,a shoe factory, a chip maker, a computer manufacturer, a coppermining facility, an oil refinery, an offshore oil platform, a dailynewspaper, a paper mill, an automotive assembly line, a missileor armament production facility, the space shuttle, the aerospace
12 Chapter One
industry, a military defense manufacturing plant, a hospital, acruise ship, a chemical plant—in other words, any entity thatmanufactures a product or produces an output where it is unac-ceptable to incur unplanned interruptions of the operation or,worse yet, an unwanted disaster.
I am writing this book to be used universally: It is applicablefor any type of industry, any size industry (large or small), andfor any number of reliability-type employees. One extreme, ofcourse is a nuclear power plant with several hundred engineer-ing, maintenance, and operations personnel responsible for reli-ability. The other extreme is a small manufacturing facility withonly a handful of personnel responsible for reliability. The RCMconcepts and implementation process that I will lead youthrough are the same.
I also intend for this book to be a source of information forengineering and business management students who should atleast have a working knowledge of real life plant and equipmentreliability principles to go along with the theory they learn, sincebottom-line corporate profits are directly affected by how reli-ably a facility is maintained.
I explain why RCM has had such a sordid history of being sodifficult to implement. Heretofore, the knowledge required forimplementing a program was kind of esoteric, and manybelieved that it required the expertise of consultants. I intend toremove that shroud of complexity so that anyone with just aver-age technical intelligence can implement a premier RCM pro-gram and be able to understand all of the fundamentals of theprocess.
I have designed this book to be a completely comprehensiveand self-contained guide to RCM, not only from the analysispoint of view, but also by identifying the pitfalls to avoid, byintroducing new concepts that make RCM simple, by discussingthe uncomplicated tools you will need to commence the analysis,by explaining the step-by-step RCM implementation logic pro-cess with actual real-life examples and the step-by-step expla-nation of the preventive maintenance (PM) task strategies, byexplaining how to establish an RCM living program, by explain-ing how to monitor and trend the performance of your RCM pro-gram, and by knowing when you have achieved the optimum
Introduction to RCM 13
balance point of your RCM efforts. All of this information issequenced as follows:
■ Chapter 2 explains the pitfalls of RCM and how to avoid them.■ Chapter 3 identifies the concepts of RCM and how to apply
them.■ Chapter 4 identifies the tools needed to commence the analy-
sis.■ Chapter 5 explains the step-by-step RCM analysis logic pro-
cess, including each question of SAE Document JA1011.■ Chapter 6 explains the step-by-step PM task selection process.■ Chapter 7 explains how to implement RCM for instruments.■ Chapter 8 explains how to establish an RCM “living program.”■ Chapter 9 explains how to establish a monitoring and trend-
ing program to monitor the effectiveness of your plant perfor-mance.
■ Chapter 10 discusses RCM as a plant culture.
We begin by trying to understand why RCM has been so diffi-cult to implement.
14 Chapter One
15
Chapter
2Why RCM Has Historically Been
So Difficult to Implement
It has been estimated that more than 60 percent of all RCM pro-grams initiated have failed to be successfully implemented.Many of the other 40 percent that were completed were per-formed quite superficially, making their true value onlymarginal. Why has it been so difficult? Why has its success beenso elusive? There is a reason. In fact, there are many reasons.You will learn what the pitfalls to success are, why they happen,where they happen, and how to avoid them. It is my goal to takethe mystery out of the process so that it can be readily under-standable and easily implemented. In my opinion, RCM hasbecome overly complicated in its transfer from the airline indus-try. It is also my belief that the successful implementation of theprocess is inversely proportional to the complexity it hasacquired.
2.1 Consultants
RCM has become, and still is to a large degree, a cottage indus-try for consultants. It is unfortunate, but true, that within theworld of consultants, oftentimes they will either know less thanyou do, or if they do know more, their methods may employ anelixir of obfuscation to allow them sole possession of under-standing the process, and hence a continued income stream.
Copyright © 2006 by the McGraw-Hill Companies. Click here for terms of use.
Things are not usually that complicated, and RCM is a primeexample. While I am not discounting the need for consultants,they should primarily be brought in as a temporary augmenta-tion of your staff to assist in establishing a program under yourdirection. I cannot overemphasize the importance of maintain-ing in-house control, responsibility, and ownership of the pro-cess. To further this thinking, most RCM “consultants” I havemet have never personally implemented a comprehensive classi-cal RCM program. I have seen so many instances where some-one had read something about RCM and became versed in thecatchwords and catchphrases and instantly became a self-anointed consultant.
2.2 A White Elephant
When RCM came on the scene in industries other than commer-cial aviation, it did not take long for the white elephant stigmato be placed on it. This was particularly distressful because thereliability enhancements that should have been so easily attain-able were instead held in abeyance because the process could notbe implemented effectively. Many consultants, being unfamiliarwith the airline model, did not fully understand how to imple-ment an RCM analysis, and the cost of a full-blown effort at anuclear plant, for example, reached into the millions of dollars,most often with very few tangible results to show for it. Someutilities went through this iteration several times. It was toutedas a cost-saving preventive maintenance (PM) reduction effortin order to ingratiate the consultants with upper management.If they came in with the message that they could make a plantmore reliable but it would result in added costs and increasedpersonnel, what kind of reception do you think they wouldreceive?
I want to state very clearly that RCM is not a PM reductionprogram. It is a reliability program. The results of an RCM anal-ysis are what they are. There is no bias to either delete work oradd work. If your facility is one that is laden with an inordinatenumber of PM tasks, many of which are believed to be unneces-sary, RCM will indeed identify those unnecessary PMs and theywill become candidates for deletion. On the other hand, if the PM
16 Chapter Two
program at your facility is a Spartan one, the process will prob-ably add PMs to your program, but they will be PMs that weren’tbeing done that should have been done. My experience hasshown that although it is definitely beneficial to delete unneces-sary work, the true benefits of an RCM program are not mea-sured by the work that can be deleted. Instead, it is moreaccurately measured by some of the tasks added to the preven-tive maintenance program that were not being done prior to theanalysis but should have been.
If your facility first established its PM program based on per-forming every task specified in each vendor manual, you willundoubtedly have too many PMs and you will be afforded theopportunity to delete a rather large number of the unnecessaryones. Many facilities base their PM program on the experience ofsome of their older employees. While this is commendable, it isnot, however, in itself a valid basis on which to stake the reli-ability of your plant.
Nowlan and Heap wrote the original RCM treatise in aircraftterminology using examples found in commercial aviation. Theaircraft language, as well as the process itself, resulted in signif-icant confusion by those trying to transfer it to other industries,and they left out some of the most important aspects along theway. With extensive practical experience in airline and nuclearreliability and maintenance, I show you how to circumvent themountains of misunderstanding and confusion that have regret-tably found their way into current RCM adaptations.
RCM is almost always described as a process of identifyingcritical components whose failure would result in an unwantedconsequence to one’s facility. What if the component failure doesnot cause an immediate unwanted consequence? Is that auto-matically a noncritical component? Emphatically no! If there isbuilt-in system redundancy, will that automatically allow a com-ponent to be run to failure? Again, emphatically no! Are run-to-failure components unimportant? Once again, emphatically no!In virtually all of the books on RCM there have been a myriad of“dots” surrounding these aspects. The dots were all there, butthey were quite difficult and confusing to connect. I will showyou how to connect those dots and build a bridge to a verystraightforward process.
Why RCM Has Historically Been So Difficult to Implement 17
One of the keys to this is my concept of potentially critical com-ponents. I created this concept to solve the missing link of RCM.I write a lot about this vital concept and several other conceptsin the next chapters because they are extremely importantbuilding blocks leading to the understanding of what RCM is allabout. This will help guide you in forging a path at your facilitytoward a clear and concise understanding of RCM in simpleterms. It is also of immeasurable importance in facilitatingimplementation of the process.
First, let’s look at what causes most RCM programs to ulti-mately result in failure. By examining these issues you will beafforded the opportunity to avoid them.
2.3 Reasons for Failure
Some of the more significant reasons for this lack of success inthe past include the following, which are not listed in any spe-cific order.
2.3.1 Loss of in-house control
One of the biggest pitfalls is to farm out the complete analysis toan outside party. While it is acceptable to use outside help forstaff augmentation, it is highly recommended to have any out-side support work under your direction. You may be think-ing . . . “How can they work under my direction if I don’t knowenough about RCM?” That line of thinking will change as youcontinue through this book. You will acquire the expertise tobring your own program to fruition. I have seen so many pro-grams fail because an outside team was brought in to do thecomplete analysis with minimal input from those who reallyknow what is going on in their facility: you and your own people.Just think what happens when subsequent technical questionsarise or the database put together by the outside party needs tobe changed and the outside party is no longer on-site. Evenworse to contemplate is having them come back on-site to makechanges at a hefty cost for doing so.
I cannot overemphasize the importance of maintaining in-house control over your own RCM program. I explain how classi-cal RCM can be made so simple that, other than possible staff
18 Chapter Two
augmentation working under your direction, you will be able toset up the program, establish the criteria and parameters, main-tain authority for the analysis, and make all the requisite deci-sions for successfully implementing the process at your facility.
2.3.2 An incorrect mix of personnelperforming the analysis
I have seen numerous RCM programs result in failure becausethey did not incorporate the correct mix of knowledge and com-munity buy-in from all applicable in-house parties. If you don’thave the consensus buy-in by your maintenance, engineering,and operations personnel, your program will most likely resultin failure. If you are fortunate enough to progress toward com-pleting a program but did not get a consensus buy-in up front,what do you think will happen when the first challenge arisesquestioning the validity for performing or not performing a spe-cific PM task? More than likely, a sense of suspicion will be castover the entire effort by those stakeholders who were notinvolved, and confidence in the program will diminish.
What if the RCM analysis was performed only by the in-houseengineers, and maintenance and operations people were not giventhe opportunity to supply their input and wisdom? The left-outparties (with their bruised egos) will probably not embrace theeffort, especially if there is a difference of opinion with respect toa decision that was made regarding the consequence of a failure.Remember, plant knowledge is not a monopoly within any oneorganization. It takes the cumulative knowledge from all associ-ated parties to effect a premier RCM analysis.The RCM effort willinvariably lose credibility if any one group does not understand oragree with the basis for specifying a specific preventive mainte-nance task, or should they ever question after the program hasbeen completed, “Why are we doing this PM task?”
To start out right, I recommend that representatives from the different stakeholder organizations, most commonly engi-neering, maintenance, and operations, all participate from thebeginning. This is true whether you have a large or a small orga-nization. I also highly recommend using craft personnel as tem-porary members of the RCM team because they can be veryinsightful, not only for their hands-on knowledge, but also
Why RCM Has Historically Been So Difficult to Implement 19
because they will be the ultimate emissaries of the PM programonce it is completed. A very important consideration is havingthe craft understand why they are performing a given task. Ifyour craft personnel understand the bases for which you haveestablished your preventive maintenance program, you will findthat they become willing participants and allies instead ofadversaries.
2.3.3 Unnecessary and costlyadministrative burdens
I have seen RCM efforts bogged down for months (while the costclock is running on fast speed) just deciding which boundary touse or how to prioritize the importance of which system to startwith. There have actually been formal probabilistic studies cost-ing many thousands of dollars for the sole purpose of determin-ing which system to analyze first! Just think how that wouldappeal to your management personnel responsible for payingthe bills. As I discuss later, for an average-size facility, the entireRCM process from conception through implementation for allsystem components should not exceed a few weeks or a fewmonths, at most.
There is no end to the administrative burdens that can be gen-erated. This can include RCM steering groups, focus groups,establishing humongous committees, setting up entirely unnec-essary specialized facilitator training programs, and on and on.From many years of experience, I believe that what you reallywant to know is . . . “How can I establish a premier RCM pro-gram without the need for outside “expert” intervention andwithout all of the unnecessary administrative minutiae?” It ismy belief that you have the wherewithal to figure out what com-mittees and steering groups you may need for your organization.Your organization may not want to create an RCM “empire,”laden with unnecessary resources.
In later chapters I discuss in detail how to avoid creatingadministrative nightmares out of the RCM process. I articulatethe bigger picture so that, once versed on these principles, youcan readily provide the administrative details to the degree thatyou and your individual organization deem appropriate.
20 Chapter Two
2.3.4 Fundamental RCM concepts not understood
Commencing an RCM analysis without understanding the fun-damental concepts can indeed result in failure of the program,but even worse, it can result in a flawed program with a disas-trous outcome, even a fatality.
There are numerous real-life examples of disastrous conse-quences of failure that could easily have been avoided by under-standing the concepts I set forth in this book that were neverbefore considered in RCM programs. These concepts are dis-cussed in detail in Chapters 3, 4, and 5.
2.3.5 Confusion determining system functions
Many books and publications are almost exclusively devoted todetails about selecting systems and identifying system func-tions. The customary approach to RCM has been to identify thefunctions of various subsystems within a larger system. This isone of the first steps in RCM, and unfortunately it is also wherethe first impact of confusion manifests itself. You might askyourself, “How do I define all of the system functions? Where doI find these functions? How do I know if I missed a function?What if I did miss a function?” These are all valid questions to becontemplated, and Chapters 3, 4, and 5 explain how to navigateabove these problems.
The only reason for identifying system functions and func-tional failures is the quest to identify the consequence of failureas a result of a component failure. In Chapter 3, I introduce arevolutionary new concept regarding the consequence of failurethat simplifies the entire RCM process.
2.3.6 Confusion concerning systemboundaries and interfaces
Current RCM practices call for defining boundaries and inter-faces for each system and subsystem separately. Where does one system end and the other begin? This requires that youdefine system boundaries, subsystem boundaries, in-system in-
Why RCM Has Historically Been So Difficult to Implement 21
interfaces, in-system out-interfaces, out-system in-interfaces,out-system out-interfaces, system functions, subsystem func-tions, failures of those functions, consequences of those func-tional failures, and on and on. Tell me that this isn’t confusing!Yet that is the rigor one must go through to implement thearchaic approach to RCM. Since system boundaries are com-pletely arbitrary and totally subjective, I have seen this part ofthe process become a source of much internal bickering andwasted time. Many attempted programs never get beyond thispoint. Yet this entire part of the process can be eliminated. Youwill see how to simplify this hurdle and develop a premier RCMprogram with the same robustness that Nowlan and Heap envi-sioned in 1978.
What most people do not know is that Nowlan and Heap startedwith system and subsystem boundaries and functions because, incommercial aviation, they were already there. Few people inindustries other than commercial aviation are familiar with AirTransport Association (ATA) codes. Each aircraft, regardless of itsmanufacturer or type, uses the same coding system. For example,a Boeing 747, a Douglas MD-11, or an Airbus A300 all use thesame ATA designations for their aircrafts’ air-conditioning sys-tems (ATA 21) or pneumatic systems (ATA 36) or landing gearsystems (ATA 32). Nowlan and Heap did not have to develop thesesystem boundaries.
In fact, Nowlan and Heap started at the system level only asa matter of convenience. It was not a requirement. It was thecomponent functional failure and its manifestation at the air-craft (or plant) level that was really important to them. Whathas transpired since then is the interpretation by modern-dayRCM practitioners espousing as a requirement the identifica-tion of system boundaries, subsystem boundaries, interfaces,and so on.
This has evolved, and continues to evolve, only as the continu-ation of a misunderstood interpretation. Establishing functionsat the system and subsystem level is not a required part of theRCM process! In fact, it may even diminish the accuracy of theanalysis, which may be a revelation to most people. I discuss thisfurther in Chapter 3.
22 Chapter Two
2.3.7 Divergent expectations
There may be an inevitable clash of expectations by your seniormanagement and middle management. As I mentioned earlier,RCM is not a PM reduction program. Rather, it is a reliability pro-gram. Suppose your senior management has been the recipient ofa slick sales presentation extolling the merits of implementing anRCM program and how the results of that program will result inan overall workload reduction. Their first expectation is likely tobe determining how many people can be jettisoned. How do youthink a less-than-altruistic midlevel maintenance manager ormaintenance supervisor would respond to that message? He orshe may want to throw a blanket over the RCM program to avoidthe possibility of letting people go. It is not a matter of lettingpeople go; it is more an opportunity to reallocate resources sothey can be used more efficiently, perhaps through the reductionof any work backlog or overtime needs. I do not subscribe to lay-ing people off as the result of implementing a successful RCMprogram.
On the other hand, what if an RCM analysis identifies thatmore maintenance work and more resources will be needed? Aless-than-altruistic vice president may want to stifle the effortbecause of the costs involved. Remember, the results are whatthey are. If more PMs are needed, it will make the plant more reli-able and this will save much more in the long run than a short-term vision of cost savings. In many cases, senior managementmay depend on the continuation of a lucky streak in that nothingcatastrophic has happened yet, so why worry about it? Believe me,when something catastrophic does happen, as it inevitably will, asthe result of an unanalyzed failure mode, the associated costs willbe magnitudes greater than having had implemented a few criti-cal PMs that could have prevented the catastrophe.
As you can see, if the RCM effort identifies that too muchunnecessary work is being done, you run the risk that middlemanagers may want to scuttle it for fear of losing their people. Ifthe RCM effort identifies that not enough work is being doneand critical PMs need to be added, you run the risk that seniormanagement will want to scuttle it for fear of increasing costs. If
Why RCM Has Historically Been So Difficult to Implement 23
this mind-set exists in your facility, it should be openly discussedso that neither of these polarizations enters the decision processfor attaining a premier RCM program.
2.3.8 Confusion regarding convention
Another reason program implementation attempts have sputteredis because of simple confusion: How do you define a failed valve?Does the valve fail in the open position, or does it fail to close?Which system does a heat exchanger belong to? Is it the systemsupplying the shell-side cooling medium, or is it the system receiv-ing the benefit of the heat exchanger via the tube side? How do youhandle manual valves? Are they governed by a preventive mainte-nance (PM) strategy or by a corrective maintenance (CM) strat-egy? To what level does RCM analyze components in an electronicbox? Can the functions of identical component types used in differ-ent applications be grouped together? (Absolutely not.) Theseissues are all explained in this book.
It should also be noted that most RCM publications, includingthis book, do not normally include structures. The RCM processis primarily for active functional components unless a review ofCM history specifically identifies the existence of a problem witha normally passive component or a structural item. Similarly,manual valves, which are considered passive components, arenot normally analyzed except when they are functionally opera-tional in a system, are controlled by operator actions duringplant evolutions, or have experienced problems resulting in ahistory of corrective maintenance. In fact, any CM history iden-tifying specific problems with any passive component or struc-tural item is justification for including it within the preventivemaintenance program.
2.3.9 Misunderstanding “hidden”failures and redundancy
These are the most important, yet least understood, concepts.How do you handle “hidden” failures and redundancy? EveryRCM book or publication talks about hidden failures, but how doyou find them, and what distinguishes them from a run-to-
24 Chapter Two
failure component? The challenge is, how do you analyze anentire system that is hidden, such as an emergency safety sys-tem? How do you handle hidden failures in hidden systems? Inredundant systems? In backup systems? In standby systems?Understanding these differences is a major key to achieving asuccessful reliability program.
These concepts are all explained in detail in this book. In fact,these concepts are so misunderstood that a recent document onRCM stated that “multiple failures and redundancy are noteven considered,” and any redundant components were allowedto run to failure with no mention whatsoever of whether thatredundancy considered the absence-of-failure indication. That’sdangerous.
2.3.10 Misunderstanding run-to-failure
This is also a key concept, and very few people understand it. Iexplain my “canon law” for run-to-failure in great detail in thefollowing chapters. Wrongly invoking a run-to-failure strategycan have disastrous effects. Most books on RCM state that if acomponent fails and nothing happens, it is a noncritical, run-to-failure component. This is not only wrong, it is actually dan-gerous and will inevitably lead to a most unwanted outcome!Likewise, many RCM books state that if there are redundantcomponents they can be classified as run-to-failure components.(Again, dangerously wrong!) Remember, there may not be a pre-ventive maintenance strategy for run-to-failure components, butthere is most certainly a corrective maintenance strategy forthem. I explain all of this in Chapter 3.
2.3.11 Inappropriate componentclassifications
Most RCM programs pigeonhole components into either a criti-cal or a noncritical basket. This is another example of whatcauses a program to flounder. Those categories are too broad. Forexample, if a failure can result in an immediate effect to thefacility, it is usually classified as a critical component. Likewise,if a failure does not result in an immediate effect, but it could,
Why RCM Has Historically Been So Difficult to Implement 25
this is also classified as a critical component. Try explaining thatto your senior management.
It is also totally imprudent to include a critical componentwhose failure can result in the immediate shutdown of yourplant in the same basket, with the same relative importance, asa purely economic component that will result in only a relativelysmall dollar cost when it fails. I explain the differences betweencritical components, potentially critical components, economi-cally justified components, commitment components, and non-critical run-to-failure components.
2.3.12 Instruments were not includedas part of the RCM analysis
I devote an entire chapter on how to analyze instruments. Thisis very seldom discussed in any RCM publication.
I am fortunate that my background and experience affords methe opportunity to be intimately familiar with the shortcomingsand pitfalls of inappropriately embracing an RCM effort. Thereasons identified in this chapter are just a few of them. You willlearn how to circumvent these barriers so that when you havefinished this book, if you possess just a modicum of intelligence(which I know you do), technical or otherwise, you will be able toimplement a successful RCM program at your plant or facility.Neither an engineering degree nor any special training isrequired for understanding this novel approach to RCM.
Let’s look at some of the important concepts that I have men-tioned.
26 Chapter Two
27
Chapter
3Fundamental RCM ConceptsExplained, Some for the Very First Time:The Next Plateau
In this chapter, I introduce to you the fundamental concepts ofClassical RCM Implementation Made Simple. Once you havemastered these (and I assure you that you will) the subsequentanalysis and implementation of an RCM program will becomenonproblematic and will fit into your perspective of reliabilitylike a glove.
These RCM concepts, some of which have never before beenexplained or written about, form the very core of reliability.These are the principles that, once understood, will remove thefuzziness and unveil the mystique that has shrouded RCM. InChapter 5, you learn how these concepts and principles are usedin the RCM implementation and decision logic part of the analy-sis. Since they form the very core of RCM, understanding themis of paramount importance.
This chapter introduces the totally new concept of a “poten-tially critical” component that addresses hidden failures. It alsointroduces another new principle that I call the “canon law” forrun-to-failure, which addresses run-to-failure components andcorrective maintenance. Another new principle is introduced fordelineating what determines a strictly “economic” consequenceof failure. You will understand how important these concepts are
Copyright © 2006 by the McGraw-Hill Companies. Click here for terms of use.
when you see how they can prevent major catastrophes. Afteryou begin to understand these fundamentals, you will see howrelatively simple they are and how they can avert a catastrophesuch as the one discussed later in this chapter. The consequenceof failure analysis (COFA) is also introduced.
It has been my experience that even though the RCM processis a straightforward one, there are many opportunities to easilystray off course and become confused during the process. If youhave previously attempted to implement an RCM program onyour own, you will understand my point. In baseball parlance,you can wander off from the batter’s box and end up in the out-field before you can bat an eye. I have seen many attemptswhere the individuals responsible for putting an RCM programtogether are left wandering around in the outfield, unable to getback to home plate. A lot of different pathways need to bebrought together in a cohesive manner. If you do not take thelogical approach to RCM, which I explain in detail, you may endup expending a great amount of tangential energy without anylinear vector to it. Going around in circles has not been anuncommon RCM experience. I have learned that a very regi-mented but logical mind-set is needed, and, as with any lan-guage, the respective alphabet must be mastered first.
The alphabet of RCM lies in understanding the principles andconcepts, and that is why I go into elaborate detail to familiarizeyou with these principles: Once you commence the analysis, theenergy you expend will all be linear and none of it will be tan-gential.
Entities smaller than a nuclear power plant, which includesmost entities, cannot afford the unnecessary administrative bur-dens associated with the current versions of RCM. But the indi-viduals responsible for reliability at these small and midsizefacilities still want a robust analysis for their plant. This can beachieved very easily. For the simplified approach to classicalRCM, you do not need to set up system boundaries, establishinterfaces, and identify functions at the system and subsystemlevel, which are all elements of the process that are associatedwith other renditions of RCM programs. That may seem like arevelation, and indeed it is. It should be well understood that the
28 Chapter Three
absence of these burdens does not diminish the robustness of theanalysis and, as I explain later in this chapter, leaving out thatunnecessary work will actually enhance the accuracy and com-pleteness of your RCM program.
Nowlan and Heap’s work in 1978 included operational conse-quences as an economic consideration. Safety was a very specificconcern and was seldom invoked unless there was a design flawor other major design concern. Other than aircraft safety issues,all other operational concerns, including such issues as delayedor canceled flights, were boiled down only to economics.
The RCM program I developed in 1991 addressed operationalconsiderations as being more than just an economic conse-quence. I made the distinction that operational consequenceswere either critical or potentially critical. After all, everythingeventually boils down to an economic consideration—even a dis-aster. However, if you should experience a failure that causes amajor environmental impact or some other major unwanted fail-ure consequence, it will be more than merely an economic one forwhich the penalty is paying a fine. It could result in groundingyour fleet of aircraft or having to shut down your plant. It couldbe the end of your business. A failure consequence can causesuch unwanted publicity that calling it an economic issue andframing it as such would do injustice to your facility and wouldbe an inappropriate classification.
To its credit, in 1999 the Society of Automotive Engineers(SAE) also realized this important distinction regarding eco-nomic consequences: The differentiation between strictly eco-nomic failures and operational-type failures is now a part of theSAE JA1011 RCM Standard.
Also in 1991, I was very specific in the RCM program I devel-oped, segregating hidden failures from evident failures, and I gointo great detail, as you will see, on how to identify and managehidden failures. Again, to its credit, in 1999 the SAE also real-ized the importance of hidden failures and has specificallyincluded the explicit distinction between hidden and evidentfailures in its JA1011 RCM Standard. I discuss more about theSAE Standard in Chapter 5. In the next section, we look at thethree phases of an RCM program.
Fundamental RCM Concepts Explained 29
3.1 The Three Phases of an RCM-BasedPreventive Maintenance Program
Phase 1 consists of identifying equipment that is important toplant safety, generation (or production), and asset protection.
Phase 2 consists of specifying the requisite PM tasks for theequipment identified in phase 1. These tasks must be bothapplicable and effective.
Phase 3 consists of properly executing the tasks specified inphase 2.
Phase 1 is the genesis of the process. It is where you identifythe equipment that must have a preventive maintenance strat-egy to prevent failure and remain reliable in order to preservecritical equipment functions and minimize any challenges toyour plant or facility as a consequence of their failure. This is theequipment population that requires preventive maintenance.This is the equipment population that is deemed important forpreserving the “asset reliability” criteria that you establish(which is discussed in Chapter 5).
Once this population is identified, then you can specify, inphase 2, the type of preventive maintenance that should be pre-scribed. The selection of possible tasks is very large, and newerpredictive maintenance (PdM) techniques offer additional cost-effectiveness for accomplishing these tasks. Remember, too, it isnot just the tasks that the maintenance department performs; itis the integration of all of the tasks performed by all departmentsthat make up the PM program. The different types of preventivemaintenance tasks and how to integrate them is discussed inChapter 6.
Once you have identified your target population and pre-scribed the types of preventive maintenance activities that mustbe performed to maintain their reliability, in phase 3 it is imper-ative that your work control or work management organizationschedules this work at the periodicities specified. What do youthink the outcome of your efforts will be, even with a stellarRCM program, if there are deficiencies in scheduling the work,
30 Chapter Three
possibly resulting in PM tasks continuously being late or, worseyet, not being accomplished at all?
While phases 1 and 2 are totally under the RCM umbrella, theyare also totally dependent on phase 3, which is non-RCM-relatedand resides under the auspices of your work control and schedul-ing organization. A breakdown here is like a broken leg on athree-legged stool. While it is not imperative that your work con-trol and scheduling groups participate in the RCM process along-side of engineering, operations, and maintenance, they shouldnot be kept in the dark about the program philosophy, and theyshould know how it will relate to their scheduling efforts.
I have seen many breakdowns in executing an RCM programbecause of the difficulties encountered within the work manage-ment organization. Depending on your industry and the type ofyour facility, getting the scheduled work executed properlyinvolves mastering the same sets of problems, although some ofthe specifics may be slightly different. If your organization is notequipped to deal with the smooth planning, scheduling, and per-formance of the prescribed work, you may find difficulties inachieving your reliability goals. From personal experience, thisis a potential source of weakness that can pose major problemsto an otherwise excellent reliability program.
As I mentioned in Chapter 2, RCM is not a PM reduction pro-gram. It is a reliability program, and you may end up reducingwork or adding work. Reducing scheduled work will offer you theopportunity to reallocate your resources accordingly. However,should the analysis identify that you have not been doing asmuch preventive maintenance as is required for your plant,additional personnel resources may be needed.
The RCM program I developed and implemented eliminatedseveral thousand unnecessary PM activities, but several hun-dred new PMs were added to the maintenance program. Theadded ones were the most important outcome of the analysis.Some typical examples of the added PMs included: identifyingprotective devices that were not being maintained; identifyingrather innocuous components, thought to be unimportant andnoncritical, whose failures would have very significant unwantedplant consequences; identifying potential plant shutdown compo-
Fundamental RCM Concepts Explained 31
nents that had previously escaped inclusion in the PM program;and identifying an entire system that was being maintained butwas found to be unneeded and that was subsequently eliminated.Innumerable hidden failures of important components, repre-senting serious potential plant vulnerabilities, were identifiedand preventive maintenance tasks implemented accordingly.These were just a few of a myriad of very important reliabilityissues that were found during the analysis.
Another rather interesting outcome of the analysis was theidentification of dozens of check valves showing that if theyfailed while open there would be no consequence of that failureeven with additional failures. This revealed that the checkvalves were not even needed in the plant and that they could bereplaced by a spool piece. If they failed while closed, however,there would be an unwanted consequence, so having them in theplant was not only needless, it actually created an unnecessarypotential failure mode. Streamlined versions of RCM would nothave identified this anomaly.
Let’s look at the concepts and principles of RCM in greaterdetail. I reiterate the techniques for identifying components thatmust have a preventive maintenance strategy in several differ-ent ways. I have designed this chapter as a set of building blocks,beginning with the foundation and sequentially buildingupward. Let’s begin at the foundation, which will help youunderstand a little more about RCM and how simple it really is.There are three cornerstones to an RCM program.
3.2 The Three Cornerstones of RCM
1. Know when a single-failure analysis is acceptable and when itis not acceptable.
2. Know how to identify hidden failures.
3. Know when a multiple-failure analysis is required.
These three cornerstones are the bedrock for understanding RCMand I introduce them in only their most simple terms at this time.They are discussed in greater detail throughout this chapter.
32 Chapter Three
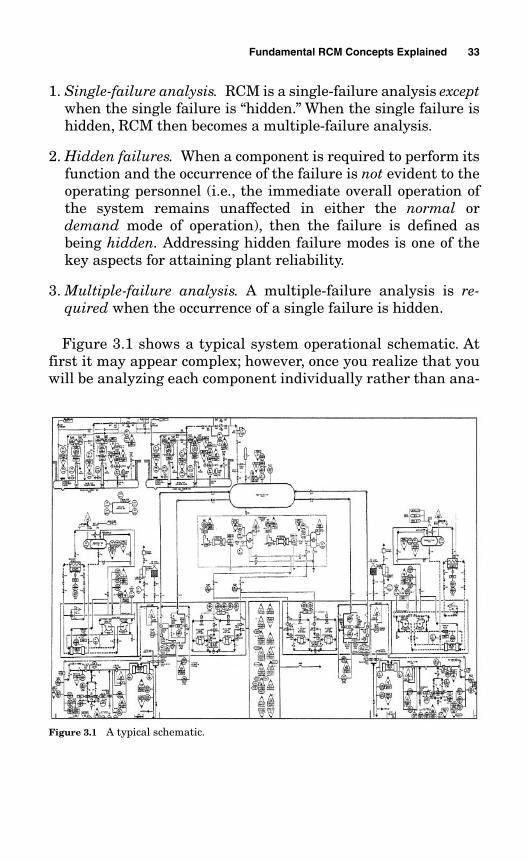
1. Single-failure analysis. RCM is a single-failure analysis exceptwhen the single failure is “hidden.” When the single failure ishidden, RCM then becomes a multiple-failure analysis.
2. Hidden failures. When a component is required to perform itsfunction and the occurrence of the failure is not evident to theoperating personnel (i.e., the immediate overall operation ofthe system remains unaffected in either the normal ordemand mode of operation), then the failure is defined asbeing hidden. Addressing hidden failure modes is one of thekey aspects for attaining plant reliability.
3. Multiple-failure analysis. A multiple-failure analysis is re-quired when the occurrence of a single failure is hidden.
Figure 3.1 shows a typical system operational schematic. Atfirst it may appear complex; however, once you realize that youwill be analyzing each component individually rather than ana-
Fundamental RCM Concepts Explained 33
Figure 3.1 A typical schematic.
lyzing the entire system all at once, the intimidation factor iscompletely dissipated. The illustrations and examples I usethroughout this book are simplified excerpts from real-life sys-tem schematics and piping and instrumentation drawings(P&IDs). The reason for this is to show how simple it really iswhen you stay at the component level when analyzing func-tions. No matter how complicated the plant or system schematicmay be, you ultimately simplify it by reducing it to its individ-ual components.
A question often arises about grouping similar-type compo-nents together. It is not an accepted practice to group functionsof similar types of equipment together because the same type ofequipment will have very different functions depending onwhere and how it is incorporated into the plant design. Forexample, motor type XYZ in one application may have a very dif-ferent function from the same type of XYZ motor in anotherapplication in the plant. However, it is very effective to grouptasks together for the same type of equipment. The periodicitiesof those tasks, though, may be very different, again dependingon their individual applications in the plant. For example, largemotors of a certain horsepower may have similar PM tasks spec-ified, such as thermography, Megger testing, and motor currentsignature analysis, but the periodicities may be differentdepending on their cumulative operating times, environment, orother distinct installation or design differences. I discuss moreabout PM tasks and periodicities in Chapter 6.
3.3 Hidden Failures, Redundancy,and Critical Components
Most RCM books go into a lengthy explanation of the peripheraladministrative aspects of the process, such as establishing sys-tem boundaries and interfaces, which you have learned are noteven necessary to the analysis. They give only a perfunctory orshort-shrift discussion to the very essence of the RCM process,which is the understanding of hidden failures, the difference oftrue redundancy, analyzing a backup or standby function, deter-mining when run-to-failure analysis can be invoked, and when amultiple-failure analysis is required. Since these concepts are so
34 Chapter Three
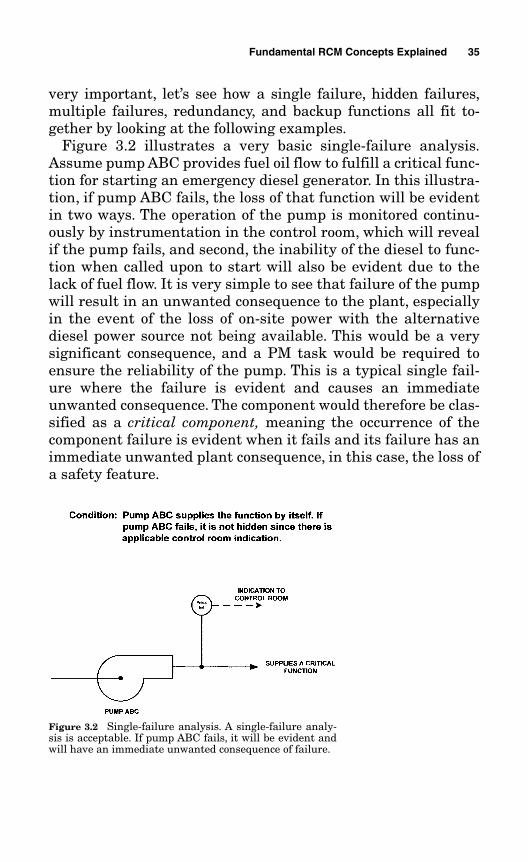
very important, let’s see how a single failure, hidden failures,multiple failures, redundancy, and backup functions all fit to-gether by looking at the following examples.
Figure 3.2 illustrates a very basic single-failure analysis.Assume pump ABC provides fuel oil flow to fulfill a critical func-tion for starting an emergency diesel generator. In this illustra-tion, if pump ABC fails, the loss of that function will be evidentin two ways. The operation of the pump is monitored continu-ously by instrumentation in the control room, which will revealif the pump fails, and second, the inability of the diesel to func-tion when called upon to start will also be evident due to thelack of fuel flow. It is very simple to see that failure of the pumpwill result in an unwanted consequence to the plant, especiallyin the event of the loss of on-site power with the alternativediesel power source not being available. This would be a verysignificant consequence, and a PM task would be required toensure the reliability of the pump. This is a typical single fail-ure where the failure is evident and causes an immediateunwanted consequence. The component would therefore be clas-sified as a critical component, meaning the occurrence of thecomponent failure is evident when it fails and its failure has animmediate unwanted plant consequence, in this case, the loss ofa safety feature.
Fundamental RCM Concepts Explained 35
Figure 3.2 Single-failure analysis. A single-failure analy-sis is acceptable. If pump ABC fails, it will be evident andwill have an immediate unwanted consequence of failure.
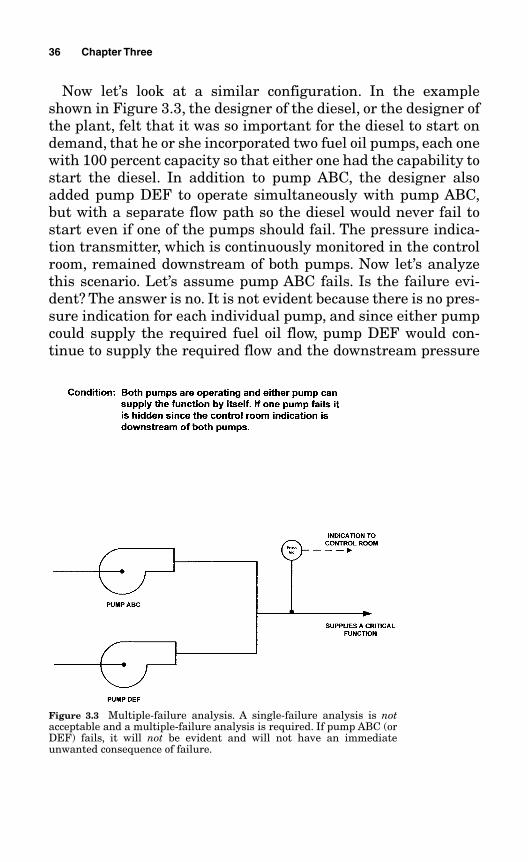
Now let’s look at a similar configuration. In the exampleshown in Figure 3.3, the designer of the diesel, or the designer ofthe plant, felt that it was so important for the diesel to start ondemand, that he or she incorporated two fuel oil pumps, each onewith 100 percent capacity so that either one had the capability tostart the diesel. In addition to pump ABC, the designer alsoadded pump DEF to operate simultaneously with pump ABC,but with a separate flow path so the diesel would never fail tostart even if one of the pumps should fail. The pressure indica-tion transmitter, which is continuously monitored in the controlroom, remained downstream of both pumps. Now let’s analyzethis scenario. Let’s assume pump ABC fails. Is the failure evi-dent? The answer is no. It is not evident because there is no pres-sure indication for each individual pump, and since either pumpcould supply the required fuel oil flow, pump DEF would con-tinue to supply the required flow and the downstream pressure
36 Chapter Three
Figure 3.3 Multiple-failure analysis. A single-failure analysis is notacceptable and a multiple-failure analysis is required. If pump ABC (orDEF) fails, it will not be evident and will not have an immediateunwanted consequence of failure.
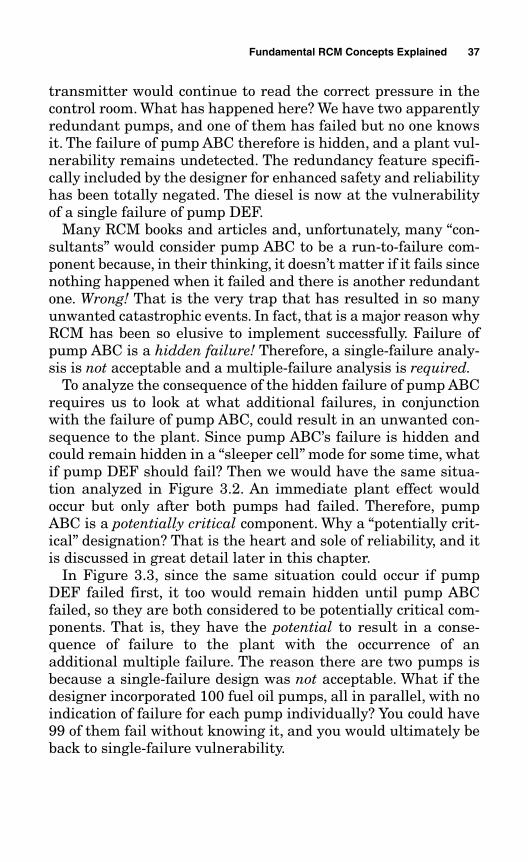
transmitter would continue to read the correct pressure in thecontrol room. What has happened here? We have two apparentlyredundant pumps, and one of them has failed but no one knowsit. The failure of pump ABC therefore is hidden, and a plant vul-nerability remains undetected. The redundancy feature specifi-cally included by the designer for enhanced safety and reliabilityhas been totally negated. The diesel is now at the vulnerabilityof a single failure of pump DEF.
Many RCM books and articles and, unfortunately, many “con-sultants” would consider pump ABC to be a run-to-failure com-ponent because, in their thinking, it doesn’t matter if it fails sincenothing happened when it failed and there is another redundantone. Wrong! That is the very trap that has resulted in so manyunwanted catastrophic events. In fact, that is a major reason whyRCM has been so elusive to implement successfully. Failure ofpump ABC is a hidden failure! Therefore, a single-failure analy-sis is not acceptable and a multiple-failure analysis is required.
To analyze the consequence of the hidden failure of pump ABCrequires us to look at what additional failures, in conjunctionwith the failure of pump ABC, could result in an unwanted con-sequence to the plant. Since pump ABC’s failure is hidden andcould remain hidden in a “sleeper cell” mode for some time, whatif pump DEF should fail? Then we would have the same situa-tion analyzed in Figure 3.2. An immediate plant effect wouldoccur but only after both pumps had failed. Therefore, pumpABC is a potentially critical component. Why a “potentially crit-ical” designation? That is the heart and sole of reliability, and itis discussed in great detail later in this chapter.
In Figure 3.3, since the same situation could occur if pumpDEF failed first, it too would remain hidden until pump ABCfailed, so they are both considered to be potentially critical com-ponents. That is, they have the potential to result in a conse-quence of failure to the plant with the occurrence of anadditional multiple failure. The reason there are two pumps isbecause a single-failure design was not acceptable. What if thedesigner incorporated 100 fuel oil pumps, all in parallel, with noindication of failure for each pump individually? You could have99 of them fail without knowing it, and you would ultimately beback to single-failure vulnerability.
Fundamental RCM Concepts Explained 37
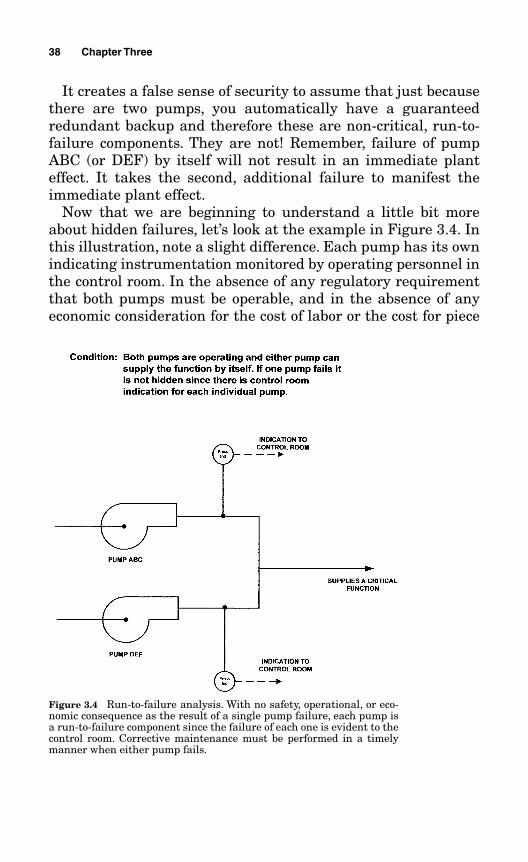
It creates a false sense of security to assume that just becausethere are two pumps, you automatically have a guaranteedredundant backup and therefore these are non-critical, run-to-failure components. They are not! Remember, failure of pumpABC (or DEF) by itself will not result in an immediate planteffect. It takes the second, additional failure to manifest theimmediate plant effect.
Now that we are beginning to understand a little bit moreabout hidden failures, let’s look at the example in Figure 3.4. Inthis illustration, note a slight difference. Each pump has its ownindicating instrumentation monitored by operating personnel inthe control room. In the absence of any regulatory requirementthat both pumps must be operable, and in the absence of anyeconomic consideration for the cost of labor or the cost for piece
38 Chapter Three
Figure 3.4 Run-to-failure analysis. With no safety, operational, or eco-nomic consequence as the result of a single pump failure, each pump isa run-to-failure component since the failure of each one is evident to thecontrol room. Corrective maintenance must be performed in a timelymanner when either pump fails.
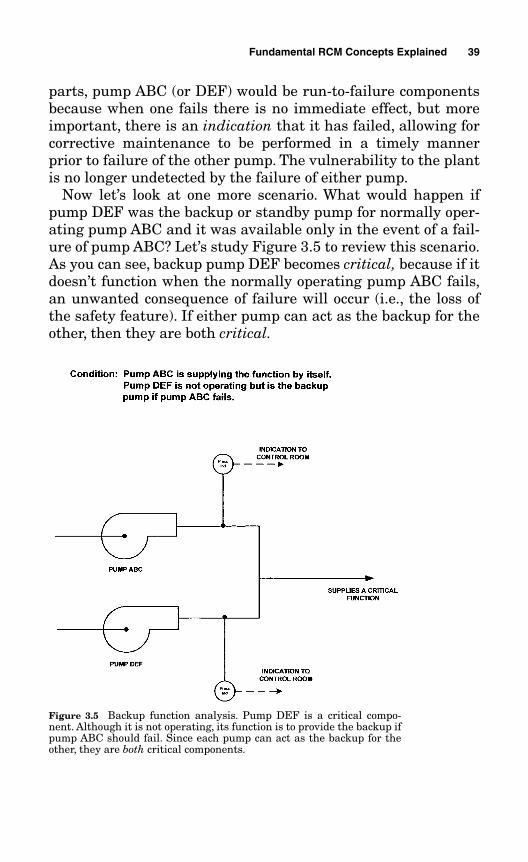
parts, pump ABC (or DEF) would be run-to-failure componentsbecause when one fails there is no immediate effect, but moreimportant, there is an indication that it has failed, allowing forcorrective maintenance to be performed in a timely mannerprior to failure of the other pump. The vulnerability to the plantis no longer undetected by the failure of either pump.
Now let’s look at one more scenario. What would happen ifpump DEF was the backup or standby pump for normally oper-ating pump ABC and it was available only in the event of a fail-ure of pump ABC? Let’s study Figure 3.5 to review this scenario.As you can see, backup pump DEF becomes critical, because if itdoesn’t function when the normally operating pump ABC fails,an unwanted consequence of failure will occur (i.e., the loss ofthe safety feature). If either pump can act as the backup for theother, then they are both critical.
Fundamental RCM Concepts Explained 39
Figure 3.5 Backup function analysis. Pump DEF is a critical compo-nent. Although it is not operating, its function is to provide the backup ifpump ABC should fail. Since each pump can act as the backup for theother, they are both critical components.
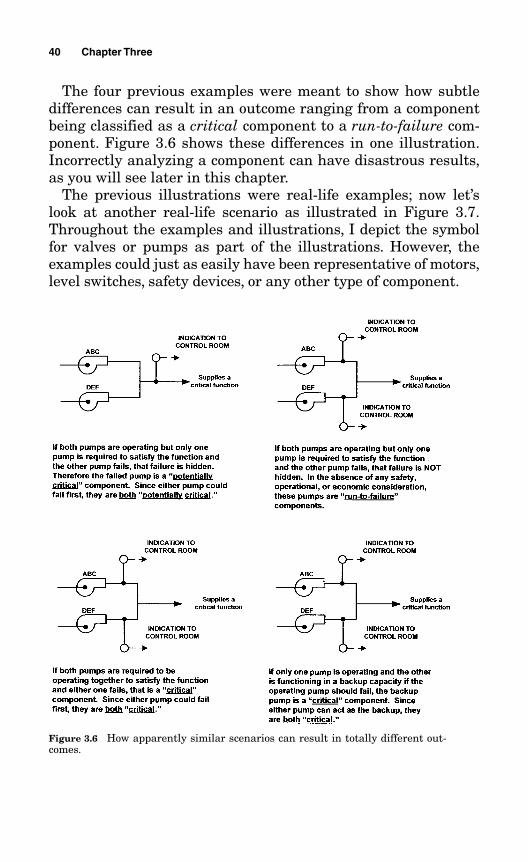
The four previous examples were meant to show how subtledifferences can result in an outcome ranging from a componentbeing classified as a critical component to a run-to-failure com-ponent. Figure 3.6 shows these differences in one illustration.Incorrectly analyzing a component can have disastrous results,as you will see later in this chapter.
The previous illustrations were real-life examples; now let’slook at another real-life scenario as illustrated in Figure 3.7.Throughout the examples and illustrations, I depict the symbolfor valves or pumps as part of the illustrations. However, theexamples could just as easily have been representative of motors,level switches, safety devices, or any other type of component.
40 Chapter Three
Figure 3.6 How apparently similar scenarios can result in totally different out-comes.
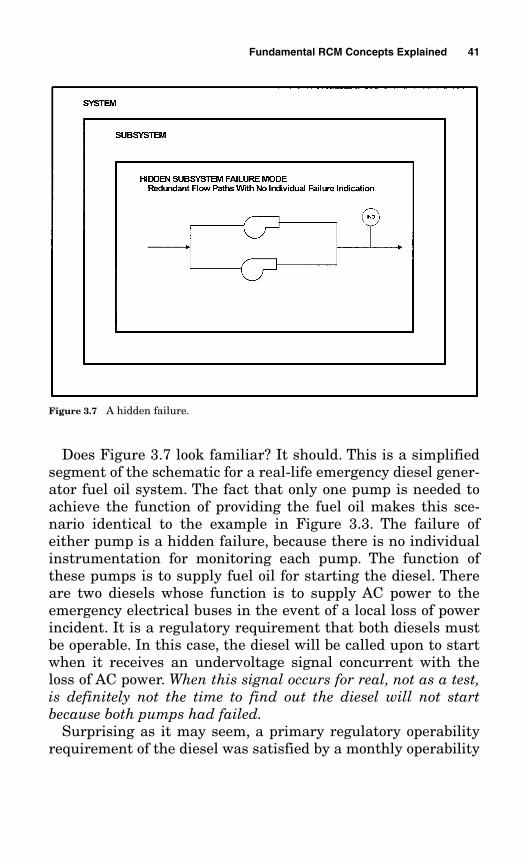
Does Figure 3.7 look familiar? It should. This is a simplifiedsegment of the schematic for a real-life emergency diesel gener-ator fuel oil system. The fact that only one pump is needed toachieve the function of providing the fuel oil makes this sce-nario identical to the example in Figure 3.3. The failure ofeither pump is a hidden failure, because there is no individualinstrumentation for monitoring each pump. The function ofthese pumps is to supply fuel oil for starting the diesel. Thereare two diesels whose function is to supply AC power to theemergency electrical buses in the event of a local loss of powerincident. It is a regulatory requirement that both diesels mustbe operable. In this case, the diesel will be called upon to startwhen it receives an undervoltage signal concurrent with theloss of AC power. When this signal occurs for real, not as a test,is definitely not the time to find out the diesel will not startbecause both pumps had failed.
Surprising as it may seem, a primary regulatory operabilityrequirement of the diesel was satisfied by a monthly operability
Fundamental RCM Concepts Explained 41
Figure 3.7 A hidden failure.
test of the entire unit. As you have now seen and learned, that isnot a sufficient test.
Hidden failures are often (but not always) failures of one ormore components in a parallel design with no indication of fail-ure for each individual component. In this real-life illustration,note that the only pressure indication transmitter is down-stream of both pumps. One of the two components could fail, butsince each one by itself can satisfy 100 percent of the functionand supply the required fuel supply at design pressure, onlywhen the second one fails (i.e., multiple failure) will the totalfunctional failure of the diesel become evident; hence the failureof the first component is potentially critical. Since either pumpcan fail first, both are potentially critical.
To summarize this scenario . . . if one pump failed for what-ever reason, the other pump would provide the function and stillindicate the acceptable pressure in the control room. Themonthly start test of the diesel would be performed each month,and it would continue to be successful. However, it is only a mat-ter of time before the second pump will fail, and then the func-tion of supplying fuel oil will be lost, allowing one of theemergency diesel units to succumb to a functional failure. SinceMurphy’s Law will ultimately prevail if you allow it enoughtime, what do you suppose would happen if that emergencydiesel were called upon to function in a real-life situation duringthe interval between the monthly testing schedule . . . and itfailed to start? What if the same scenario occurred to both emer-gency diesels? It could be catastrophic! It is exactly failures suchas this that cause the most severe, unwanted consequences to afacility. Addressing potentially critical failure modes is thereforea key aspect for successfully achieving plant reliability.
How could this have been avoided? Very simply. At the compo-nent functional level you would have identified that the singlefailure of one pump was hidden. Then you would have knownthat a multiple-failure analysis was necessary, and you wouldhave identified that if an additional failure of the other pumpshould occur, you would be faced with a total loss of diesel-starting capability. Therefore, a PM task would be required toaddress these potentially critical components to prevent theirfailure.
42 Chapter Three
You would also have seen that even though there were tworedundant pumps, that, in itself, did not qualify these compo-nents to be noncritical, run-to-failure components devoid of anypreventive maintenance strategy. A failure-finding task at thecomponent level (not at the system or subsystem level) would berequired, at a minimum.
Most people would automatically jump to the conclusion thatsome kind of a design change was necessary to avoid this poten-tial problem. Not true. In fact, the overwhelming majority ofthese scenarios can be very easily resolved with an additionalPM activity added to your preventive maintenance program. Theneed for a design change is the exception rather than the rule.The fix for the vulnerability concern in Figure 3.7 was not anexpensive modification. It was as simple as adding a sign-offstep to an existing operations procedure requiring the operatorto “listen” for both pumps to be running to verify their simulta-neous operation. Chapter 6 discusses in great detail the logic fordefining PM tasks and determining when a design change maybe required.
Remember, this was just a typical real-life scenario. The samefundamental issues are applicable to an enormous number ofsimilar situations in your facility. In this instance, the RCManalysis identified that pumps ABC and DEF were both poten-tially critical because either one could fail and not be evident,and therefore both required a preventive maintenance strategyto ensure the reliability of the diesel. Can you imagine if thesecomponents were identified as run-to-failure (RTF) components?As noncritical? One of them could have been in its failed sleepercell mode for a long time just waiting for the other one to fail, inwhich case a very unwanted consequence would occur to theplant (i.e., no AC power to some of the emergency buses duringan emergency). As I mentioned, that is not the time to find outthat neither pump will function to provide the starting capa-bility for the diesel. The design objective of having two pumpsfor redundancy would have been totally negated. The worst-nightmare scenario would happen if this same common-modehidden failure occurred to both emergency diesels.
Let’s look at another typical scenario illustrating hidden fail-ure modes. In Figure 3.8, two pumps are running simultane-
Fundamental RCM Concepts Explained 43
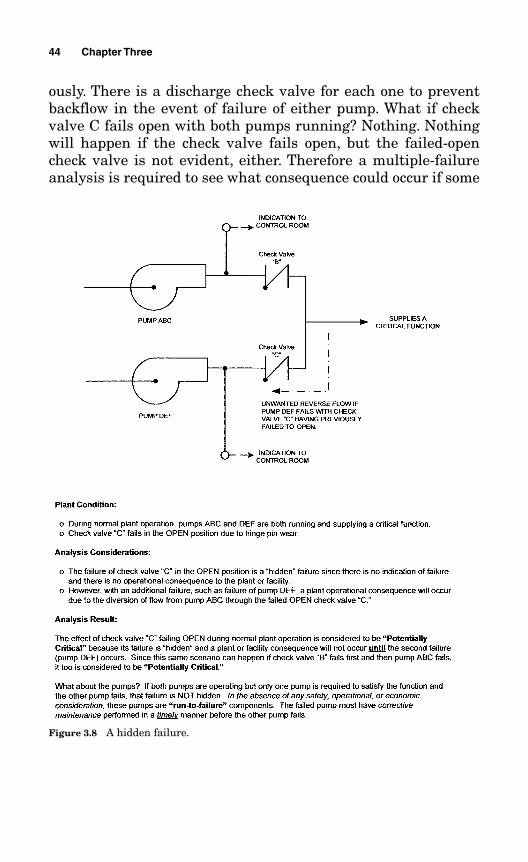
ously. There is a discharge check valve for each one to preventbackflow in the event of failure of either pump. What if checkvalve C fails open with both pumps running? Nothing. Nothingwill happen if the check valve fails open, but the failed-opencheck valve is not evident, either. Therefore a multiple-failureanalysis is required to see what consequence could occur if some
44 Chapter Three
Figure 3.8 A hidden failure.
other component should fail while check valve C remains in theundetected failed open position.
What happens if pump DEF should now fail? With checkvalve C being unable to close, a reverse-flow condition frompump ABC would occur, diverting the design flow away fromthe critical function it was supplying. Therefore, check valve Cis potentially critical, and since either check valve can fail first,both discharge check valves are classified as being potentiallycritical. What about the pumps themselves? In the absence ofany safety, operational, or economic concern, and assumingthat either pump can supply the necessary flow by itself, bothpumps are considered RTF because there is an indication offailure for each one and there is no consequence as a result ofthe failure of either one. As you will learn later in this chapter,corrective maintenance on the failed pump must take place in atimely manner.
3.4 Testing Hidden Systems
In the example in Figure 3.7, you actually have a hidden failurewithin a hidden subsystem within a hidden system. The entiresystem is the diesel, which is a hidden standby system. The sub-system is the fuel oil start system, which is a hidden subsystemof the diesel, and the hidden failure mode within the subsystemis the fuel oil pump. As you can see, when analyzing functions atthe component level, it clearly illuminates this potentially criti-cal consequence. If you started by identifying functions at thesystem level, the consequence of failure of the fuel oil pumpswould not be as readily visible, and, in fact, unless you havesome RCM analysis experience, you may even miss it completely.
Some of you may be thinking, “The entire diesel is a hiddenfunction, so how can I analyze it?” To make the analysis mean-ingful, any normally nonoperational system, such as fire protec-tion, emergency or auxiliary power, emergency feedwater, automaticshutdown features, or any other emergency standby systems thatdo not normally operate, must be analyzed in its demand mode ofoperation just as though that demand mode were its normaloperating mode.
Fundamental RCM Concepts Explained 45
Equally important is to realize that even a PM task that per-forms a broad overall test of the entire hidden system, whichentails pushing a start button and watching an output lightcome on, would still not be sufficient to identify the precedingpotentially critical scenario. In this uncomplicated, althoughreal-life example, an individual PM task to test each pump indi-vidually and verify its operability would be required.
Even today (but hopefully not for long), it is an accepted prac-tice to test an entire hidden system once per month or once perquarter and validate it as being 100 percent reliable and readyfor operation in the event of an emergency demand. This iscalled a failure-finding task, and we discuss more about the dif-ferent types of preventive maintenance tasks in Chapter 6. Afailure-finding task is a valid type of preventive maintenancestrategy, but it should not be a substitute for internally analyz-ing the entire hidden system. Even though the hidden systemmay be tested once per month, once per quarter, or whatever theinterval, that test alone will not reveal the potentially criticalsleeper cell modes of failure at the component level.
3.5 The Missing Link: PotentiallyCritical Components
I have already introduced you to the term potentially critical.This was to acquaint you with the importance of this concept. Icreated the concept of potentially critical components becausethere has never before been an understandable componentclassification for these hidden failures. It was a void in the pro-cess and a source of much confusion. Indeed, it was a missinglink of RCM. The “dots” may have been there, and hidden fail-ures may have been obliquely noted, but the customary RCMclassifications included only “critical” and “noncritical” compo-nent designations. Hidden failures fell through the cracks andwere not specifically identified since they don’t fall into eitherthe critical or the noncritical category. To be a critical com-ponent, the failure must be evident and have an immediateplant effect. With a hidden failure, that is not the case. There-fore, since the failure of pump ABC (or DEF) in Figure 3.7 didnot have an immediate effect, it would most likely have been
46 Chapter Three
classified as noncritical and run to failure, which is definitelyincorrect.
Much of the fuzziness of RCM has come about by trying to jus-tify that a component whose failure has no effect on the plantstill needs to have a preventive maintenance strategy. If a hid-den failure was included in the critical classification, it then hadto be explained that a critical component has an immediateeffect, but a critical component may also not have an immediateeffect if the failure is hidden. This was so confusing that theusual strategy invoked (incorrectly, I might add) was a run-to-failure strategy and the component was classified as noncritical.This was, and still is, one of the major stumbling blocks withRCM, and that is precisely why I have given hidden failures,which could potentially result in an unwanted plant effect, theirown designation. The potentially critical designation providesthe conceptual clarity that was missing.
This aspect is virtually totally misunderstood by even some ofthe most astute engineering types in the industry, even thosewithin the nuclear industry (not that nuclear types have anymonopoly on brainpower). That is why the concept of potentiallycritical components is so important. In my opinion . . . findinghidden failures and addressing them accordingly, especially inyour nonnormally operated hidden safety systems, will afford thegreatest opportunity to avoid a catastrophic event. Later in thischapter, in the “Anatomy of a Disaster,” you will see just howsimple it is to overlook this aspect without understanding theconcept of potentially critical components.
A potentially critical component is one whose immediate fail-ure is not evident and is not immediately critical but has thepotential to become critical, either with a duration of time, inand of itself, or with an additional failure or initiating event, atwhich time the consequence of the failure may unfortunatelybecome quite evident (and critical). The potential to become crit-ical can occur not just with an additional component failure, butalso with an additional initiating event, or even with an addi-tional routine plant evolution (turning on another system, turn-ing on a switch, shutting off a pump, etc.).
Oftentimes a potentially critical component may not rear itsugly head until some other initiating event occurs, such as a fire,
Fundamental RCM Concepts Explained 47
a steam-line break, a pipe rupture, or a loss of power. I have evenseen where a hidden failure was lying in wait, unknown toeveryone, until a new operating evolution occurred, such asswitching to a rarely used alternate pump or testing a newlymodified plant design. Those are not the times to find out, first-hand, that you have had existing plant vulnerabilities that wereunknown. This has happened in the nuclear industry and it canhappen anywhere in any industry.
Potentially critical components can be thought of as sleepercells, lying in wait and ready to bring havoc upon your plant orfacility. They are failed components that are not evident, and noone knows they have failed. They are components that will nolonger function, but you don’t and won’t know about their loss offunction and potential consequence of failure until an additionalfailure, initiating event, or evolution occurs, causing the sleepercell to manifest itself. That is a vulnerability that must beavoided!
The concept of a potentially critical component is totally dif-ferent from, and should not be confused with, the potential fail-ure of a given component. The potential failure of a componentrefers to an impending precursor, or cause, of a component fail-ure, such as monitoring a bearing for vibration when it has beenmaking noises or monitoring a motor for excessive temperatureswhen it appeared to be running hot, for example. A potentiallycritical component refers to the potential consequence of failureto the plant, after the hidden failure of the component hasalready, albeit unknowingly, occurred.
Note the similarities between critical and potentially criticalcomponents. The only difference is that critical failures manifestthemselves immediately, whereas the failure of potentially criti-cal components is hidden and will not manifest itself until a sec-ond multiple failure or initiating event occurs or a certain timeduration occurs. The majority (approximately 98 percent) ofpotentially critical components will fail because of (1) the effectsof multiple failures or initiating events versus (2) the effects oftime duration (approximately 2 percent). The reason I includethe aspect of time duration is for the analysis to be absolutelycomplete, thorough, and accurate, so that nothing escapes theanalysis or is inadvertently omitted.
48 Chapter Three
1. Potentially critical components as a result of multiple fail-ures or initiating events. When two (or more) components(valves, pumps, motors, etc.) operate to supply a function thateach can fulfill individually, and there is no indication of failurefor each component individually, then a failure of one of the com-ponents will be hidden (there will be no indication the componenthas failed) and the failure will not result in an immediate planteffect. However, if a second component should fail or if some otherinitiating event or plant evolution takes place that would other-wise rely on the failed component, then a plant-affecting conse-quence would occur. Hence, the component is considered to bepotentially critical. Another typical example is the pump dis-charge check valve shown in Figure 3.8. If two pumps are nor-mally operating at the same time, a failure of the discharge checkvalve in the open position will be hidden. Only when the associ-ated pump fails will the unwanted reverse-flow path through thefailed open check valve become evident.
2. Potentially critical components as a result of Time. Here’s atypical example of being potentially critical due to time. If onepanel of a multipaneled circulating water traveling screen that fil-ters out seaweed and other ocean debris were to fail or becomedamaged, there would be no indication that the panel had failed,nor would there be an immediate effect. However, over a durationof time, the failure of one of the screens’ panels, in and of itself, caneventually cause clogging of the heat exchangers by failing to filterdebris, which will ultimately result in a plant effect. Note that thetraveling screen never fails completely or immediately and thatyou do not need to have a second additional failure for this conse-quence to occur.Here’s another example of classifying a componentas being potentially critical because of time duration: Suppose alarge tank had a small pinhole leak that went undetected. Thiswould not be evident immediately, nor would it require a second(multiple) failure to manifest itself.However, over a given durationof time, in and of itself, a plant consequence may occur given thatthe inventory of the tank represents an important function. Theseare vulnerabilities that you will not know about until they havealready resulted in a plant consequence, which is not the time tofind out about them. When that happens, it is then too late to takepreventive actions.
Fundamental RCM Concepts Explained 49
You might wonder how prevalent hidden failures are. They areextremely prevalent. Just a few typical but very importantexamples include main turbine overspeed components, criticalcheck valves, emergency diesel generators, safety shutdowncomponents, protective devices, fire protection systems, emer-gency pumps, and critical motors. They are found everywhere,and it is the belief of this author that correctly identifying poten-tially critical components affords perhaps the greatest degree ofreliability protection you can provide to your plant or facility. Toreiterate a phrase from Chapter 1, it is not the obvious thatcauses the most unwanted problems, it is the nonobvious!
How important is this concept? Very. There are numerousexamples in industry whereby a designer intentionally built inmultiple redundancy to ensure reliable system operation. Unfor-tunately, if the redundancy has no way of manifesting itselfwhen it fails, the plant is vulnerable to an unwanted conse-quence, which can occur with an additional single failure.
Now let’s review what we have discussed thus far. A criticalcomponent is one whose failure must be avoided, either by a pre-ventive maintenance strategy or through redesign. The occur-rence of the single failure is immediately evident, either by itsindication of failure or by the unwanted consequence it willcause as a result of its failure. Depending on the asset reliabilitycriteria that you establish (which is discussed in Chapter 5),even a failure that does not have an immediate physical conse-quence when it fails could have an immediate unwanted regula-tory, legal, or customer-related consequence when it fails, so it isstill considered to be immediately critical.
A potentially critical component is one whose immediate fail-ure is not evident in any manner, but with additional failures orinitiating events or over time it could become critical, so it, too,must be avoided, either by a preventive maintenance strategy orthrough redesign. That leaves us with commitment, economic,and run-to-failure components.
3.6 Commitment Components
I include commitment components as part of the preventivemaintenance strategy to ensure that nothing is overlooked in
50 Chapter Three
Fundamental RCM Concepts Explained 51
the analysis. Oftentimes your facility may have certain regula-tory, environmental, Occupational, Safety, and Health Admin-istration (OSHA), or insurance commitments that must bemaintained, thereby requiring a preventive maintenance strat-egy to preclude a component from failing and causing a commit-ment to be missed or possibly an infraction of the commitment.Some typical examples of commitments governing certain com-ponents are as follows: insurance commitments required formajor pieces of equipment, state code commitments required forpressure vessels, Environmental Protection Agency (EPA) com-mitments related to an environmental impact or a fluid orgaseous release, OSHA commitments required for personnelsafety, and federal regulatory agency commitments such as FAAor NRC information notices and bulletins.
Identifying commitment components has an additional posi-tive side to it in that it affords you an opportunity to challengethe validity of having that commitment imposed on your plant.Usually, a commitment component is also associated with thecomponent being classified as either critical or potentially criti-cal because of its importance. However, on occasion, you mayfind a certain component governed by some type of commitmentwhereby the component was analyzed to be a run-to-failure com-ponent. This has occurred within the nuclear industry, so it isnot unlikely that it can happen in your industry.
To take this even one step further, there have been entire sys-tems composed of dozens of components that were required to bemaintained by preventive maintenance because of commitmentswhereby the RCM analysis identified the entire system to berun-to-failure. As a result, an entire system was able to bedeleted from regulatory required space. I am not suggesting thatyou automatically delete a commitment if the analysis leads youin that direction until you have formally justified it and receivedapproval to delete the commitment from the appropriate agencyrequiring it in the first place.
3.7 Economic Components
An economic component is one that I refer to as having an eco-nomic consequence only. Failures of economic components have
no effect on plant safety or operability. Economic failures willresult only in labor and/or parts replacements costs.
Note: If a failure occurs to a component with an economic con-sequence but the failure also results in an effect on plant safety,operation, or production, it would be more than merely an eco-nomic consideration. It would be captured as either a critical orpotentially critical consequence of failure, and the componentclassification would default to that most limiting classification.For example, the failure of a major piece of equipment is obvi-ously an economic concern, but even more important, failure ofthat equipment will most likely also result in an unwanted con-sequence such as a plant shutdown, a safety condition, or someother operational concern.
The reason I created this distinct economic classification isbecause of the prioritization of its relative importance as well asthe prioritization for performing work. As I mentioned previously,most RCM programs have either a critical or a noncritical compo-nent designation. Therefore, the failure of a small $100 pump,which one might consider an economic concern, would be throwninto the same critical component basket with a component whosefailure could shut down your facility. That not only doesn’t makesense, it actually dilutes the importance of critical components.
Another reason I maintain an economic consideration as a sep-arate and distinct classification is because it will invariably hap-pen that at certain times your planned workload may not allowfor all of the PM tasks to be accomplished when they are sched-uled, and some of them may need to be deferred. Of course, thisshould be the exception and not the rule. However, when thisoccurs, some sort of priority needs to be placed on the tasks toidentify which ones can be deferred. Obviously an economic taskassociated with an economic component that has no safety oroperational consequence of failure would be deferred before acritical task associated with a critical component.
3.8 The “Canon Law”: Run-to-FailureComponents
The concept of run-to-failure (RTF) is widely misunderstood, per-haps even more misunderstood than hidden failures. I call RTF
52 Chapter Three
the misunderstood orphan of reliability. It is a given fact that mostpeople, engineers included, will provide the automatic responsethat if a component fails and nothing happens, it is a run-to-failurecomponent. As you now know, that is totally wrong. Another veryprevalent, but totally incorrect, assumption is that having redun-dant components or redundant systems automatically means thecomponent or system is run-to-failure. Again, totally wrong!
The run-to-failure definitions that exist today do not ade-quately address the true meaning of RTF, whether they arefound in an RCM publication, a regulatory publication, or in fact,any publication. The standard definition for a run-to-failurecomponent usually reads something like this: “The component isallowed to fail without the requirement for any type of preven-tive maintenance,” or “Run-to-failure is a policy that permits afailure to occur without any attempt to prevent it.” These defini-tions are far too shallow to prevent the mismanagement of thisvery important concept. The time has come for a very preciseand prescriptive definition for identifying when a componentcan be classified as run-to-failure. I have termed this the “canonlaw” for run-to-failure, and I define it as follows:
A run-to-failure component is designated as such solely because itis understood to have no safety, operational, commitment, or eco-nomic consequence as the result of a single failure. Also, the occur-rence of the failure must be evident to operations personnel.
As a result, there is no proactive preventive maintenance strat-egy to prevent failure. However, once failed, an RTF-designatedcomponent does have a proactive corrective maintenance strategycommensurate with all other components based on the plant con-ditions at that time.
My canon law is very specific. Traditionally, run-to-failure inits most basic definition means that “PMs are not required priorto failure.” There is no mention that corrective maintenance is“required in a timely manner after failure.” However, that is onlypart of the RTF story. There are several qualifiers before a com-ponent can be classified as run-to-failure.
Run-to-failure components are understood to have no safety,operational, commitment, or economic consequences as theresult of a single failure. Also the occurrence of failure must beevident to operations personnel.
Fundamental RCM Concepts Explained 53
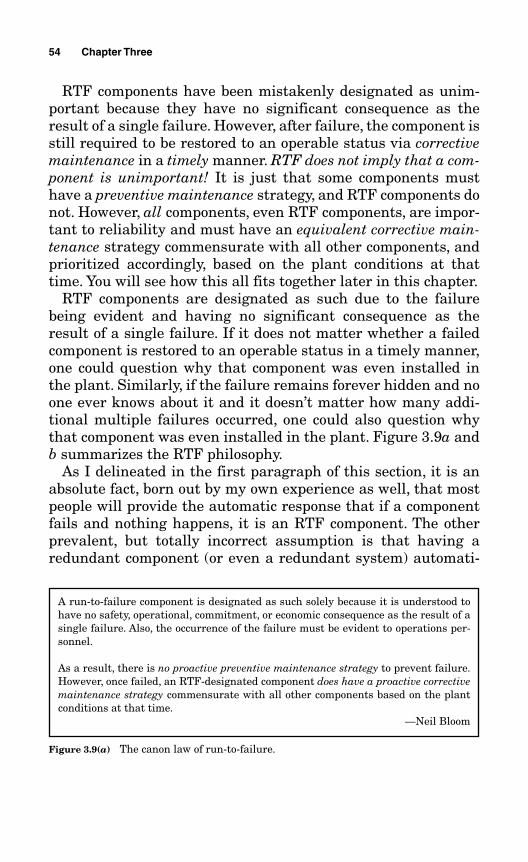
RTF components have been mistakenly designated as unim-portant because they have no significant consequence as theresult of a single failure. However, after failure, the component isstill required to be restored to an operable status via correctivemaintenance in a timely manner. RTF does not imply that a com-ponent is unimportant! It is just that some components musthave a preventive maintenance strategy, and RTF components donot. However, all components, even RTF components, are impor-tant to reliability and must have an equivalent corrective main-tenance strategy commensurate with all other components, andprioritized accordingly, based on the plant conditions at thattime. You will see how this all fits together later in this chapter.
RTF components are designated as such due to the failurebeing evident and having no significant consequence as theresult of a single failure. If it does not matter whether a failedcomponent is restored to an operable status in a timely manner,one could question why that component was even installed inthe plant. Similarly, if the failure remains forever hidden and noone ever knows about it and it doesn’t matter how many addi-tional multiple failures occurred, one could also question whythat component was even installed in the plant. Figure 3.9a andb summarizes the RTF philosophy.
As I delineated in the first paragraph of this section, it is anabsolute fact, born out by my own experience as well, that mostpeople will provide the automatic response that if a componentfails and nothing happens, it is an RTF component. The otherprevalent, but totally incorrect assumption is that having aredundant component (or even a redundant system) automati-
54 Chapter Three
A run-to-failure component is designated as such solely because it is understood tohave no safety, operational, commitment, or economic consequence as the result of asingle failure. Also, the occurrence of the failure must be evident to operations per-sonnel.
As a result, there is no proactive preventive maintenance strategy to prevent failure.However, once failed, an RTF-designated component does have a proactive correctivemaintenance strategy commensurate with all other components based on the plantconditions at that time.
—Neil Bloom
Figure 3.9(a) The canon law of run-to-failure.
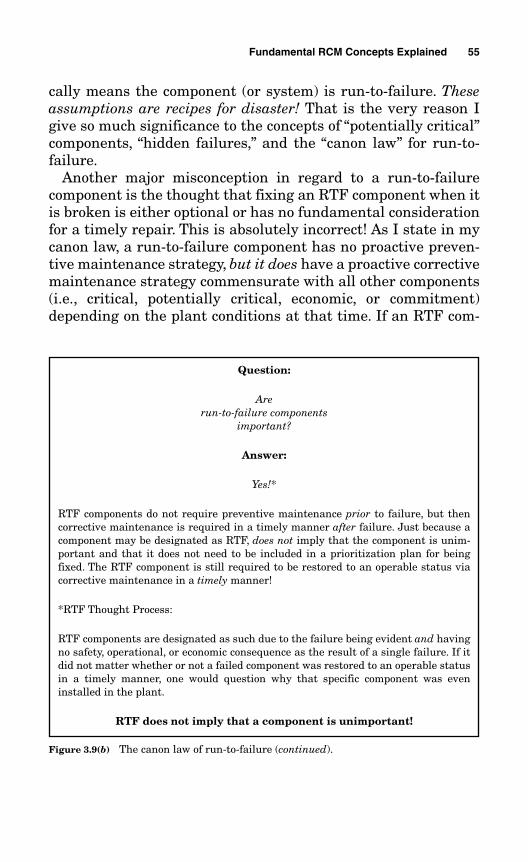
cally means the component (or system) is run-to-failure. Theseassumptions are recipes for disaster! That is the very reason Igive so much significance to the concepts of “potentially critical”components, “hidden failures,” and the “canon law” for run-to-failure.
Another major misconception in regard to a run-to-failurecomponent is the thought that fixing an RTF component when itis broken is either optional or has no fundamental considerationfor a timely repair. This is absolutely incorrect! As I state in mycanon law, a run-to-failure component has no proactive preven-tive maintenance strategy, but it does have a proactive correctivemaintenance strategy commensurate with all other components(i.e., critical, potentially critical, economic, or commitment)depending on the plant conditions at that time. If an RTF com-
Fundamental RCM Concepts Explained 55
Question:
Arerun-to-failure components
important?
Answer:
Yes!*
RTF components do not require preventive maintenance prior to failure, but thencorrective maintenance is required in a timely manner after failure. Just because acomponent may be designated as RTF, does not imply that the component is unim-portant and that it does not need to be included in a prioritization plan for beingfixed. The RTF component is still required to be restored to an operable status viacorrective maintenance in a timely manner!
*RTF Thought Process:
RTF components are designated as such due to the failure being evident and havingno safety, operational, or economic consequence as the result of a single failure. If itdid not matter whether or not a failed component was restored to an operable statusin a timely manner, one would question why that specific component was eveninstalled in the plant.
RTF does not imply that a component is unimportant!
Figure 3.9(b) The canon law of run-to-failure (continued).
ponent is indeed of low relative significance, its place on the cor-rective maintenance hierarchy will reflect that.
Unfortunately, RTF has become the orphan in the picture ofreliability. Time and again, engineers and senior managementembrace the belief that RTF components are like secondhandjunk cars, not worthy of worrying about either before or afterthey fail. That is totally misguided thinking. That line of reason-ing is tantamount to having a flat tire, putting on the spare, andthrowing the flat, with the nail embedded, back into the trunkand never worrying about it again. I have even seen some facili-ties prepare formal documents specifically stating that RTFcomponents are not important to reliability.
One reason for this misguided logic is that preventive mainte-nance historically, and RCM specifically, has keyed in on onlycritical components to the detriment of all others. Another possi-ble explanation is the run-to-failure terminology itself. It hassomewhat of an ominous impression. I can remember severaloccasions when I had to use the choice of words that a specificcomponent was “governed by corrective maintenance” just toavoid using the RTF terminology, because the receivers of theinformation in the conversation were not sufficiently astute toaccept an RTF component as being anything other than totallyirrelevant. Hopefully, one day, industry on a universal level willcome to realize that RTF components are quite important. Thatis why I go into significant detail in this chapter explaining thedifferent concepts and the different component classificationsand why all of them are important.
Another very important principle to keep in mind is that youcannot assume that two components will fail simultaneously atexactly the same time. If you made this assumption, everythingwould be critical. The RCM analysis assumes that only one com-ponent fails at any given time. Don’t confuse this with a hiddenfailure that occurs prior to a second multiple failure, becausethose failures did not occur at the same exact time. The FAA andthe NRC also recognize that you must assume only one failureoccurs at any given time. For critical equipment, these agencieshave very specific allowable time envelopes, of a few hours to afew days, to repair a failed component or take other compen-satory measures to avoid the risk of an additional failure; other-
56 Chapter Three
wise, an aircraft is not allowed to fly and a nuclear plant must bedownpowered or placed completely into a cold shutdown condi-tion if corrective measures cannot be taken in time. Theserequirements are regulatory requirements referred to as theMinimum Equipment List (MEL) in airline terminology, and theTechnical Specifications (Tech Specs) in the nuclear powerindustry.
I introduced the concept of RTF in early 1991 at the nuclearfacility where I was working. At that time, the very phrase ofrun-to-failure was anathema within the nuclear industry.Nuclear power was very far behind the airlines in understand-ing equipment reliability. It was not until many years later thatgovernmental publications governing nuclear power firstacknowledged the acceptability of the run-to-failure concept.Even today, many plants are struggling to get a firm handle onidentifying exactly what equipment is important to reliabilityand how to define that population with respect to a preventivemaintenance strategy. That statement segues into the followingsection.
3.9 The Integration of Preventive andCorrective Maintenance and theDistinction Between Potentially Criticaland Run-to-Failure Components
A total proactive maintenance plan integrates corrective main-tenance as well as preventive maintenance into its strategy. Atfirst, this statement may seem startling, but once you thinkabout it, it becomes quite clear. Let me explain. The ultimateobjective of preventive maintenance is to prevent a consequenceof failure at the plant level. Preventive maintenance tasks arespecified to prevent component failures that have either animmediate unwanted consequence of failure or the potential foran unwanted consequence of failure at the plant level.
Other times, we have seen where it is acceptable to allow acomponent to run to failure. As we have learned, run-to-failurecomponents, by definition, have no immediate effect on the plantwhen they fail and that therefore preventive maintenance is notrequired. However, as stated in our “canon law,” the failure must
Fundamental RCM Concepts Explained 57
be evident. It just means that it is more prudent not to performpreventive maintenance and not to expend unnecessary re-sources to prevent their failure. However, we have also learnedthat once a run-to-failure component has failed, it must be cor-rected in a timely manner via corrective maintenance. Correc-tive action must be taken in a timely manner to eliminate orreduce the vulnerability of a plant consequence should anothercomponent fail while the RTF component is in its failed state.
My canon law further states that RTF components are stillimportant for the operation of the facility. You don’t need to havea proactive preventive maintenance strategy to prevent theirfailure but you are required to have a proactive corrective main-tenance strategy to fix them once they have failed. If you do notimpose a proactive corrective maintenance strategy, you run thereal risk of an unwanted consequence at the plant level with anadditional failure. Remember, the only difference between apotentially critical component and a run-to-failure component isthat the potentially critical component failure is hidden. If itsfailure were not hidden, it would in all likelihood be a run-to-failure component. Putting it into perspective, both potentiallycritical components and run-to-failure components pose a vul-nerability to the plant should additional failures occur. The dif-ference is one failure is hidden and the other is not.
Preventive maintenance is a strategy to prevent componentfailures before they occur. Corrective maintenance is a strategy tofix components once they have already failed. These two entitiesare performed integrally to prevent a failure consequence at theplant level (or whatever other parameter you may select based onthe criteria you establish as part of your asset reliability strategy).After a component has failed, whether it was governed by a pre-ventive maintenance strategy or an RTF strategy, it is prioritizedfor corrective maintenance with an equivalent relative importancebased on the plant conditions at that time. This requires a deci-sion process, usually by operations and engineering, that consid-ers all pertinent factors (e.g., what other equipment is out ofservice) in attempting to prevent any possibility of a failure con-sequence at the plant level. Now it should become much easier toenvision how preventive and corrective maintenance coexist toachieve the desired reliability outcome. Refer to Figure 3.10.
58 Chapter Three
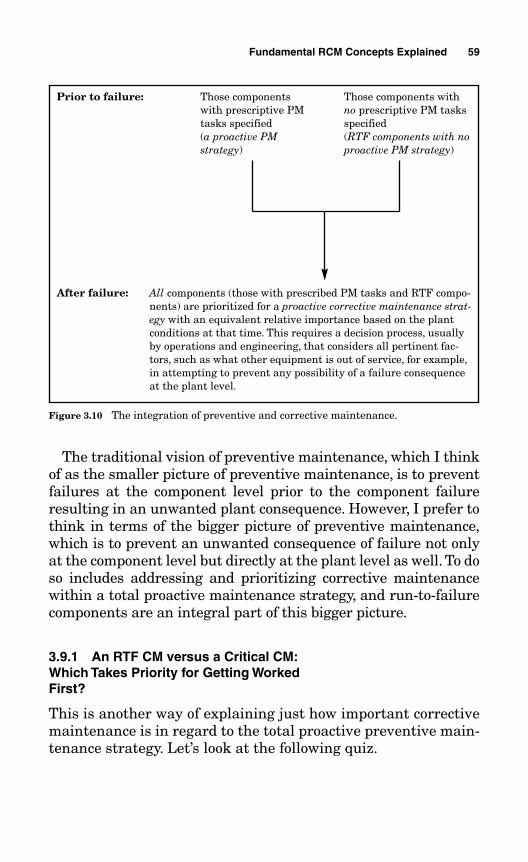
The traditional vision of preventive maintenance, which I thinkof as the smaller picture of preventive maintenance, is to preventfailures at the component level prior to the component failureresulting in an unwanted plant consequence. However, I prefer tothink in terms of the bigger picture of preventive maintenance,which is to prevent an unwanted consequence of failure not onlyat the component level but directly at the plant level as well. To doso includes addressing and prioritizing corrective maintenancewithin a total proactive maintenance strategy, and run-to-failurecomponents are an integral part of this bigger picture.
3.9.1 An RTF CM versus a Critical CM:Which Takes Priority for Getting WorkedFirst?
This is another way of explaining just how important correctivemaintenance is in regard to the total proactive preventive main-tenance strategy. Let’s look at the following quiz.
Fundamental RCM Concepts Explained 59
Figure 3.10 The integration of preventive and corrective maintenance.
Prior to failure: Those components with prescriptive PMtasks specified (a proactive PM strategy)
Those components withno prescriptive PM tasksspecified(RTF components with noproactive PM strategy)
After failure: All components (those with prescribed PM tasks and RTF compo-nents) are prioritized for a proactive corrective maintenance strat-egy with an equivalent relative importance based on the plantconditions at that time. This requires a decision process, usuallyby operations and engineering, that considers all pertinent fac-tors, such as what other equipment is out of service, for example,in attempting to prevent any possibility of a failure consequenceat the plant level.
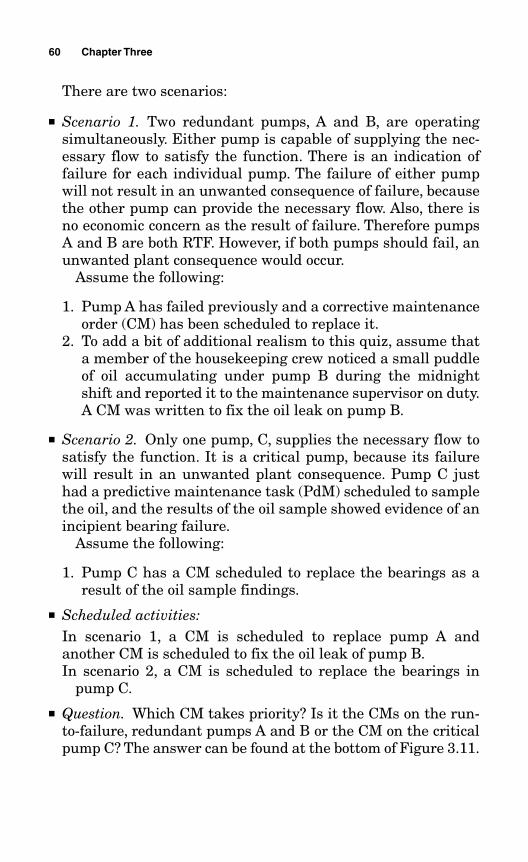
There are two scenarios:
■ Scenario 1. Two redundant pumps, A and B, are operatingsimultaneously. Either pump is capable of supplying the nec-essary flow to satisfy the function. There is an indication offailure for each individual pump. The failure of either pumpwill not result in an unwanted consequence of failure, becausethe other pump can provide the necessary flow. Also, there isno economic concern as the result of failure. Therefore pumpsA and B are both RTF. However, if both pumps should fail, anunwanted plant consequence would occur.
Assume the following:
1. Pump A has failed previously and a corrective maintenanceorder (CM) has been scheduled to replace it.
2. To add a bit of additional realism to this quiz, assume thata member of the housekeeping crew noticed a small puddleof oil accumulating under pump B during the midnightshift and reported it to the maintenance supervisor on duty.A CM was written to fix the oil leak on pump B.
■ Scenario 2. Only one pump, C, supplies the necessary flow tosatisfy the function. It is a critical pump, because its failurewill result in an unwanted plant consequence. Pump C justhad a predictive maintenance task (PdM) scheduled to samplethe oil, and the results of the oil sample showed evidence of anincipient bearing failure.
Assume the following:
1. Pump C has a CM scheduled to replace the bearings as aresult of the oil sample findings.
■ Scheduled activities:In scenario 1, a CM is scheduled to replace pump A andanother CM is scheduled to fix the oil leak of pump B.In scenario 2, a CM is scheduled to replace the bearings in
pump C.
■ Question. Which CM takes priority? Is it the CMs on the run-to-failure, redundant pumps A and B or the CM on the criticalpump C? The answer can be found at the bottom of Figure 3.11.
60 Chapter Three
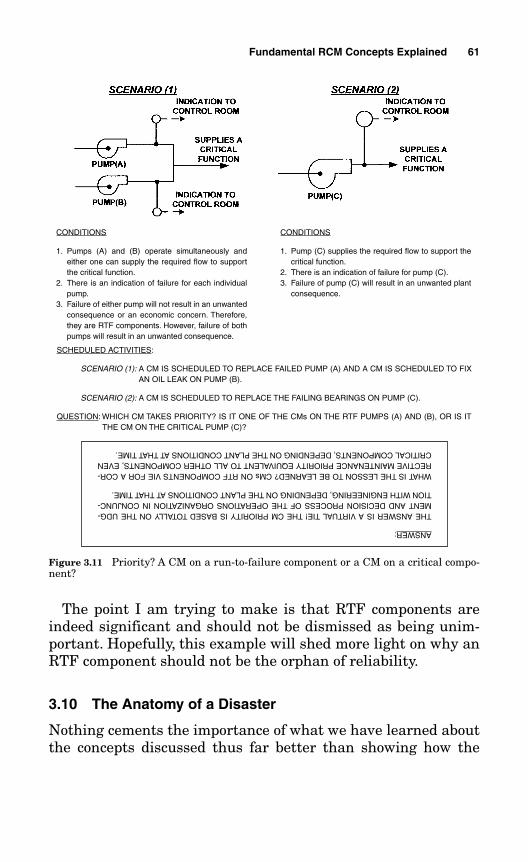
The point I am trying to make is that RTF components areindeed significant and should not be dismissed as being unim-portant. Hopefully, this example will shed more light on why anRTF component should not be the orphan of reliability.
3.10 The Anatomy of a Disaster
Nothing cements the importance of what we have learned aboutthe concepts discussed thus far better than showing how the
Fundamental RCM Concepts Explained 61
Figure 3.11 Priority? A CM on a run-to-failure component or a CM on a critical compo-nent?
CONDITIONS
1. Pumps (A) and (B) operate simultaneously andeither one can supply the required flow to supportthe critical function.
2. There is an indication of failure for each individualpump.
3. Failure of either pump will not result in an unwantedconsequence or an economic concern. Therefore,they are RTF components. However, failure of bothpumps will result in an unwanted consequence.
CONDITIONS
1. Pump (C) supplies the required flow to support thecritical function.
2. There is an indication of failure for pump (C).3. Failure of pump (C) will result in an unwanted plant
consequence.
SCHEDULED ACTIVITIES:
SCENARIO (1): A CM IS SCHEDULED TO REPLACE FAILED PUMP (A) AND A CM IS SCHEDULED TO FIXAN OIL LEAK ON PUMP (B).
SCENARIO (2): A CM IS SCHEDULED TO REPLACE THE FAILING BEARINGS ON PUMP (C).
QUESTION: WHICH CM TAKES PRIORITY? IS IT ONE OF THE CMs ON THE RTF PUMPS (A) AND (B), OR IS ITTHE CM ON THE CRITICAL PUMP (C)?
ANSWER:
THE ANSWER IS A VIRTUAL TIE! THE CM PRIORITY IS BASED TOTALLY ON THE UDG-MENT AND DECISION PROCESS OF THE OPERATIONS ORGANIZATION IN CONJUNC-TION WITH ENGINEERING, DEPENDING ON THE PLANT CONDITIONS AT THAT TIME.
WHAT IS THE LESSON TO BE LEARNED? CMsON RTF COMPONENTS VIE FOR A COR-RECTIVE MAINTENANCE PRIORITY EQUIVALENT TO ALL OTHER COMPONENTS, EVENCRITICAL COMPONENTS, DEPENDING ON THE PLANT CONDITIONS AT THAT TIME.
lack of that knowledge can lead to a disaster—in this case, areal-life disaster.
At a major power-generating station, perhaps the single mostimportant system is the steam-driven main turbine and all of itsintegral components. After all, the turbine is the driver that ulti-mately generates the electrical output. It is also a rather largeunit. In fact, the main turbine is so critical to the operation of thefacility that there are a myriad of redundant safety devices toensure its reliability in case of unforeseen events. In the main tur-bine design at a specific power plant, there were three separateprotective overspeed devices to ensure that triple redundancy wasavailable to shut the turbine down in the event of an uncontrolledturbine overspeed. A main turbine capable of generating over1100 megawatts of electrical energy, operating in a runaway,uncontrolled, overspeed situation, should never happen.
The overspeed safety devices were designed such that when anoverspeed condition is sensed, the devices activate, sending asignal to the respective steam supply valves to either modulateor reduce steam flow, or completely shut off the steam supplythat drives the turbine. Guess what happened? The turbinewent into an uncontrolled overspeed. It caused a great deal ofdamage, and only by luck was a fatality avoided. How did thishappen? How could this happen? There was triple redundancy toprevent this occurrence.
Refer to Figure 3.12. It is similar to Figures 3.3 and 3.7, whichwe analyzed previously in this chapter. Even though there werethree separate overspeed devices, they were all in parallel, withno indication of failure for any one individually. Without theproper individual testing of each overspeed device, and withoutplant personnel understanding of the concept of potentially crit-ical components, the overspeed system did not really have tripleredundancy as everyone had thought. In fact, the protectivedevices had unknowingly migrated to single-failure vulnerabil-ity. As a result, the turbine went into an uncontrolled overspeedand blew apart, with the turbine blades penetrating the armor-like casing. As can be imagined, the postmortem investigationwas not pretty. The hordes of engineering, regulatory, and QAinvestigators could not conceive of how what they thought to bea triple-redundant system could fail. In fact, from what you have
62 Chapter Three
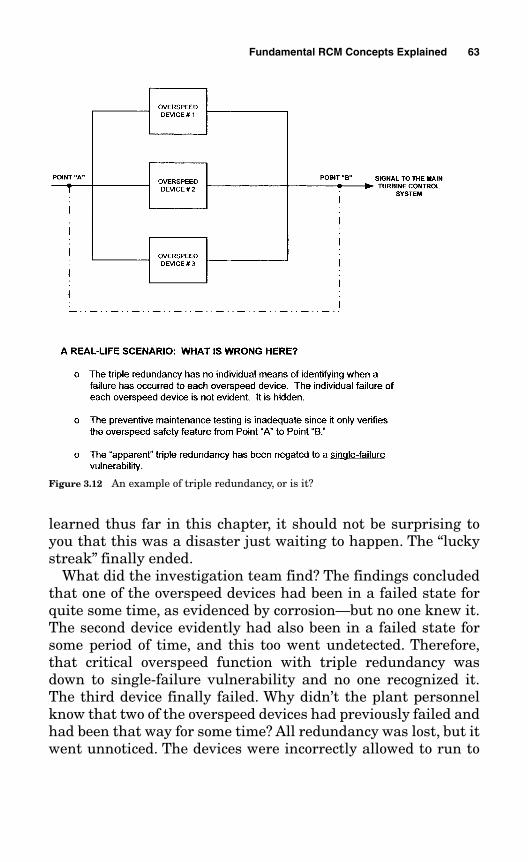
learned thus far in this chapter, it should not be surprising toyou that this was a disaster just waiting to happen. The “luckystreak” finally ended.
What did the investigation team find? The findings concludedthat one of the overspeed devices had been in a failed state forquite some time, as evidenced by corrosion—but no one knew it.The second device evidently had also been in a failed state forsome period of time, and this too went undetected. Therefore,that critical overspeed function with triple redundancy wasdown to single-failure vulnerability and no one recognized it.The third device finally failed. Why didn’t the plant personnelknow that two of the overspeed devices had previously failed andhad been that way for some time? All redundancy was lost, but itwent unnoticed. The devices were incorrectly allowed to run to
Fundamental RCM Concepts Explained 63
Figure 3.12 An example of triple redundancy, or is it?
failure. As you now know, in order to be an RTF component thefailure must be evident, and obviously there was no individualindication of failure for any of the devices in this case. They werehidden failures, which were not understood by the plant staff.The other missed opportunity was how they tested the system.Apparently, it was tested from point A to point B, and no devicewas tested individually. These were potentially critical compo-nents because of their hidden failures, and they were just wait-ing in their sleeper cell mode to create a disaster. What were thedamages? They ran into the hundreds of millions of dollars, andthe plant was nonoperational for almost one full year, to saynothing of the lost generating capacity and the commensurateloss of several hundred million dollars in revenue. It was indeedfortunate that there were no fatalities.
How could this have been prevented? Very easily. If you hadanalyzed each component in the plant and been armed with theRCM concepts you have learned in this book, you would haverecognized this vulnerability. It could have been avoided eitherwith a design change to provide failure indication for each deviceor, more prudently and more cost effectively, with the simpleaddition of a few PMs to test the overspeed devices individuallyinstead of cumulatively from point A to point B. A very simpletask with a miniscule cost of a few hundred dollars could haveavoided this entire calamity that cost about half a billion dol-lars! That is why I emphasize the importance of the concept ofpotentially critical components and how identifying hidden fail-ures that are mostly innocuous and not obvious offers the great-est potential for preventing a similar disaster at your facility.
This real-life occurrence illustrates how powerful the conceptof being a potentially critical element—in other words, the miss-ing link of RCM—really is. These components were not consid-ered critical because there was no effect with a single failure. Infact, there was triple redundancy, which lulled all of the reliabil-ity experts into the misguided logic mode that I mentioned ear-lier. Therefore, at least two of the three devices were wronglyclassified as the equivalent of run-to-failure, and I am not certainthat a PM task even existed to cumulatively test these overspeeddevices because of the false comfort of believing there was tripleredundancy. If they did not even perform a cumulative test, all
64 Chapter Three
three devices would have been relegated to an incorrect RTF sta-tus. Even if they did test the overspeed devices cumulatively, thethird overspeed device failure obviously occurred during aninterval in the cumulative test schedule, so it, too, went unno-ticed for that period of time.
Because plant personnel lacked an understanding of the miss-ing link and of how to handle hidden failures, the failed over-speed devices totally slipped beneath the radar, and even worse,they were apparently invisible to it. Shortcuts in the RCM pro-cess would have had a very slim chance, if any chance at all, toidentify this vulnerability.
Now that you have some idea of how important hidden failuresare and how important it is to identify them accurately, I believeyou are ready for the long version. The following section presentsthis information about hidden failures, some of which is a reiter-ation of the preceding discussion. I am doing this by design, so atsome point that little light will go off in your head (if it hasn’talready) and you will say, “Now I understand the message theauthor has been trying to convey to me about what RCM andreliability are all about.” Don’t feel bad if it takes a few readingsfor this to sink in. Although these concepts are not esoteric, theyare sophisticated and subtle. The following information greatlyexpands on the work of Nowlan and Heap and takes RCM to awhole new level.
3.11 A Deeper Look at CriticalComponents, Potentially CriticalComponents, and Hidden Failures—How They All Fit Together
We have briefly discussed the differences between critical andpotentially critical components, how to identify them, and howhidden failures affect them. Now let’s look a little more deeplyinto how all this fits together.
I intend to take RCM beyond the traditional methods of estab-lishing a preventive maintenance program. I do not believe youcan totally rely on a cumulative test for verification of a systemor even sections of a system’s functionality. Even though theoperational test of that entire system may be cumulatively sat-
Fundamental RCM Concepts Explained 65
isfactory, oftentimes undetected failure modes are present thatare not immediately evident. These hidden failure modes havethe potential to manifest themselves in a plant effect as a resultof either time or multiple-failure consequences. These hiddenfailure modes occur quite frequently and specifically within hid-den standby systems or portions of those standby systems.
The reason for identifying any failure mode is to ensure thatappropriate PMs are specified if the failure mode(s) could resultin a plant consequence, regardless of whether the occurrence ofthe failure is evident.
1. If the failure mode is evident, then a preventive maintenancetask can be specified to defend the facility against failure ofthat component if the failure results in an adverse conse-quence. These components are identified as critical compo-nents. It is important to note that the occurrence of the failuremode could become evident either through continuously mon-itored instrumentation or by the occurrence of the adverseeffect itself. This means that if, for example, a valve fails in theclosed position and there is associated position indication andan alarm in your control room, that is an indication of failure.When the valve fails closed, an unwanted event can alsosimultaneously occur, which is likewise an indication of fail-ure—albeit one that we surely want to avoid.
2. If the occurrence of the failure mode is not evident, then a pre-ventive maintenance task can still be specified to defend thefacility against failure of that component if its hidden failureeffect has the potential to result in an adverse consequence.This is why I refer to these components as potentially criticalcomponents.
Simply stated, a component has a hidden failure mode wheneither of the following exists:
1. The component’s function is normally active or “in use” whenthe system is in service, but there is no indication to controlroom operating personnel when the function is lost or ceases toperform.
2. The component’s function is normally inactive or “not in use”when the system is in service and there is no indication to the
66 Chapter Three

control room operating personnel that the function will not beavailable when needed.
Whether the component failure mode is identified as critical orpotentially critical is subordinate to the main goal of ensuringthat, in either case, an applicable and effective PM task is speci-fied to prevent the failure. Remember, too, that an individualcomponent may have several different failure modes that resultin different classifications. One failure mode may cause the com-ponent to be critical; another may cause the component to bepotentially critical or even economic. Another failure mode of thesame component may even be classified as run-to-failure. This istypical. However, the final classification of the componentdefaults to the most limiting classification; that is, the compo-nent would be classified as critical.
To appropriately analyze the hidden failure modes occurringwithin hidden standby systems, the hidden system must be ana-lyzed in its “demand” mode, since it is not normally operating.Each component in the hidden system must be analyzed asthough it has been called upon to function. When you identify acomponent failure mode that is not evident even upon demand,that is what I call a true hidden failure. Many major incidents(such as that of the triple-redundant, normally hidden turbineoverspeed system) occur because this circumstance is hardlyever realized and certainly seldom analyzed. Now that you havethis knowledge, you can use it to develop your RCM-based pre-ventive maintenance program, and your facility will be safer andmore reliable than it was before.
In summary, if a failure is evident and if the failure couldresult in an immediate plant effect, the knowledge of its evidentconsequence allows you to specify a preventive maintenancetask to minimize the exposure to the plant-level effect. Likewise,if a failure is not evident and does not result in an immediateplant effect, the knowledge of its potential plant-effecting conse-quence also allows you to specify a preventive maintenance taskto minimize the exposure to a plant-level effect.
Oftentimes it depends on how the function is written as towhether it is a critical or potentially critical component. However,that does not really matter. Remember, you want to ensure that aconsequence of failure does not go undetected, and whether or not
Fundamental RCM Concepts Explained 67
it is critical or potentially critical, you must still identify a preven-tive maintenance strategy to prevent failure. For instance, a func-tion can be written in several different ways, so if you wrote thefunctional failure of the component as “Inlet valve XYZ fails toprovide isolation to the main header,” it might be a potentiallycritical failure mode because the failure could be hidden. However,if the functional failure were written as “Given a loss of on-sitepower, inlet valve XYZ fails to provide isolation to the mainheader,” the failure would be immediate, or critical, since you alsoincluded the additional initiating event of the loss of on-site power.
As I mentioned previously, it does not matter how the functionis written as long as inlet valve XYZ is identified for a PM strat-egy to prevent its failure. Whether it is critical or potentiallycritical, it has been identified for applicability to phase 2, whichis the identification of a PM task. The important thing is that thecomponent does not escape detection as important and that ithas a preventive maintenance task associated with it. As wehave also learned, corrective maintenance is an integral part ofthe bigger picture of preventive maintenance.
Now you have an understanding of how the canon law andpotentially critical components ensure that no important com-ponent gets through the process undetected and that an impor-tant component is not inadvertently classified as run-to-failure.Let’s see how these concepts work when there appears to be ananomaly.
3.12 Finding the Anomalies
The canon law states that the failure must be a single failure; itmust be evident; and it must be fixed in a timely manner to qual-ify for an RTF classification. However, if the component is so fardown on the hierarchy of relative importance, although the com-ponent failure might be evident, there still may not be any plantconsequence even if there were a myriad of additional failures inconjunction with the original failure. When the logic delineates amultiple-failure scenario that nevertheless does not have anyunwanted consequence of failure, you should always ask, “Whyis the component even installed in the plant?” Another possibleanomaly exists if those components are installed in your facility
68 Chapter Three
strictly for convenience or if they obviously have very insignifi-cant value. It is not uncommon to find that even though suchcomponents have failures that are not evident, there neverthe-less may not be any plant consequence even if there were a myr-iad of additional failures in conjunction with the original failure.
For example, in a manufacturing facility, the water supply tothe lavatories may indeed have hidden multiple failures andstill be classified as RTF. However, what about the servicewater system supplying lavatory service water on a B747 for a12-hour flight to Australia with over 300 people on board? Thelavatory water supply would most definitely not be classified asRTF on a B747.
The inherent benefit of the concepts of potentially critical com-ponents and the canon law is that they make these anomalycomponents stand out and be noticed so that nothing of impor-tance escapes the RCM logic. These concepts provide a path forexception, but only after that exception has been carefully ana-lyzed. Any anomaly components can then be evaluated forwhether they should continue to be maintained or whether theyshould be considered for removal from the plant entirely; how-ever, that decision is yours.
An amusing experience exemplifies the need for understand-ing all this. A senior management person once asked me why acertain room heater was classified as a critical component andnot an RTF component since nothing happened when it failedand it didn’t matter when it was fixed. The individual asked methis question in the month of August when it happened to berather warm and a room heater was definitely not needed. Iexplained that while his logic prevailed in the summer months,it did not prevail in the winter months, when there was a regu-latory requirement to maintain the temperature of the room,which contained critical equipment, above a minimum of 65°F.As the canon law also states, “Corrective maintenance is com-mensurate with all other components depending on the plantconditions at that given time.” So in the summertime, correctivemaintenance of the heater might not be a top priority, but in thewinter months it would be. As simplistic as this may seem, thisis oftentimes the level of understanding of RCM even amongsenior management.
Fundamental RCM Concepts Explained 69
3.13 Failures Found During Operator Rounds
Another factor in the equation regarding whether or not theoccurrence of the failure is evident pertains to the “formal” oper-ator rounds performed at your facility.
There are many instances where the component failure statusis not evident to your control room personnel via continuouslymonitored instrumentation but will become evident during anoperator round. Operator rounds are an integral part of a pre-ventive maintenance program and are considered a preventivemaintenance “inspection” type of task.
As long as the operator round is contained in a formalized pro-cedural process and takes place at discrete time intervals, creditmay be taken for calling that failure evident. Every facility is notlike a commercial jet aircraft, where virtually everything is mon-itored in the cockpit, or a nuclear power plant, where virtuallyeverything is monitored in the control room—except of course,hidden failures such as the one that caused the turbine disaster.
3.14 Redundant, Standby,and Backup Functions
There is much confusion about redundant, backup, and standbyequipment. Is failure of the redundancy evident? In manyinstances, it will not be evident. For example, in most instancesredundancy exists in the form of a backup or standby function.The differences between redundant, standby, and backup func-tions are widely misunderstood and are a source of confusioneven within the nuclear industry. Figure 3.13 represents themost typical examples of these functions. Also refer to Figure3.14, Scenario 4 (scenarios 1 through 3 will be discussed later).
A major source of misunderstanding arises when there are twopumps, for example, and the function of one of the pumps is thatit be used in a standby or backup mode for the other. Thus, onlyone is operating at a given time, and the other is functioning asa standby or backup should the first one fail; either pump canact as the backup for the other.
70 Chapter Three
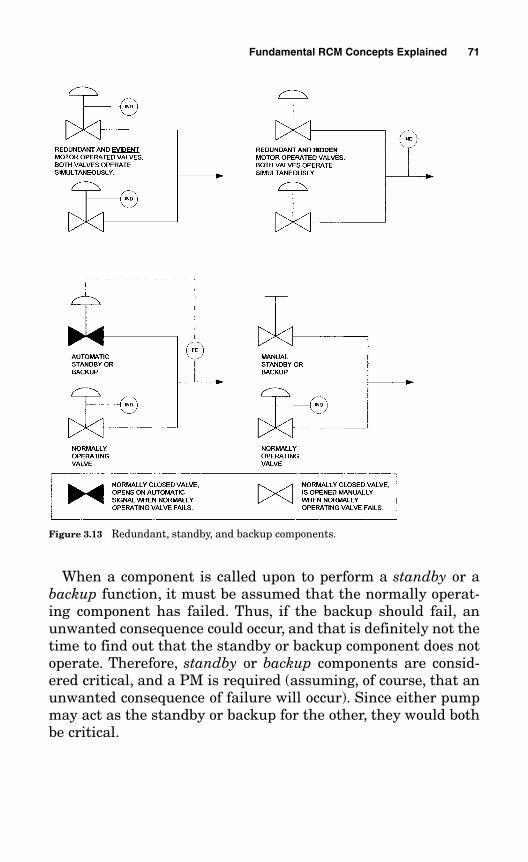
When a component is called upon to perform a standby or abackup function, it must be assumed that the normally operat-ing component has failed. Thus, if the backup should fail, anunwanted consequence could occur, and that is definitely not thetime to find out that the standby or backup component does notoperate. Therefore, standby or backup components are consid-ered critical, and a PM is required (assuming, of course, that anunwanted consequence of failure will occur). Since either pumpmay act as the standby or backup for the other, they would bothbe critical.
Fundamental RCM Concepts Explained 71
Figure 3.13 Redundant, standby, and backup components.
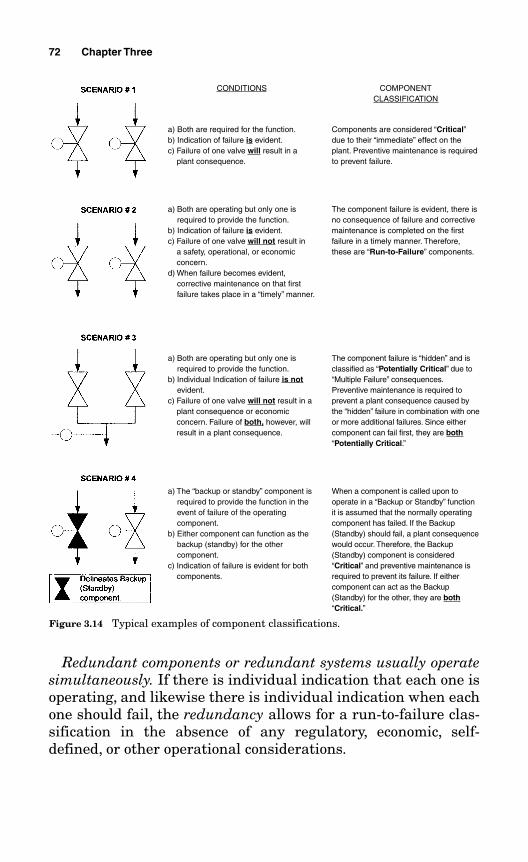
Redundant components or redundant systems usually operatesimultaneously. If there is individual indication that each one isoperating, and likewise there is individual indication when eachone should fail, the redundancy allows for a run-to-failure clas-sification in the absence of any regulatory, economic, self-defined, or other operational considerations.
72 Chapter Three
Figure 3.14 Typical examples of component classifications.
CONDITIONS
a) Both are required for the function.b) Indication of failure is evident.c) Failure of one valve will result in a
plant consequence.
a) Both are operating but only one isrequired to provide the function.
b) Indication of failure is evident.c) Failure of one valve will not result in
a safety, operational, or economic concern.
d) When failure becomes evident, corrective maintenance on that firstfailure takes place in a “timely” manner.
a) Both are operating but only one isrequired to provide the function.
b) Individual Indication of failure is notevident.
c) Failure of one valve will not result in aplant consequence or economic concern. Failure of both, however, willresult in a plant consequence.
a) The “backup or standby” component isrequired to provide the function in theevent of failure of the operating component.
b) Either component can function as thebackup (standby) for the other component.
c) Indication of failure is evident for bothcomponents.
COMPONENTCLASSIFICATION
Components are considered “Critical”due to their “immediate” effect on theplant. Preventive maintenance is requiredto prevent failure.
The component failure is evident, there isno consequence of failure and correctivemaintenance is completed on the first failure in a timely manner. Therefore,these are “Run-to-Failure” components.
The component failure is “hidden” and isclassified as “Potentially Critical” due to“Multiple Failure” consequences.Preventive maintenance is required to prevent a plant consequence caused bythe “hidden” failure in combination with oneor more additional failures. Since eithercomponent can fail first, they are both“Potentially Critical.”
When a component is called upon to operate in a “Backup or Standby” functionit is assumed that the normally operatingcomponent has failed. If the Backup(Standby) should fail, a plant consequencewould occur. Therefore, the Backup(Standby) component is considered “Critical” and preventive maintenance isrequired to prevent its failure. If either component can act as the Backup(Standby) for the other, they are both“Critical.”
Automatic backup or automatic standby components do notoperate simultaneously and will normally start on an automaticinput signal—for example, a signal caused by a high or low pres-sure, a high or low temperature, a loss of flow, or a high or lowliquid level signal. Manual backup or manual standby compo-nents also do not operate simultaneously and will start orbecome operationally functional only by means of a manualinput rather than an automatic one. In either case, if anunwanted plant consequence should occur as a result of failureof the backup or standby component, that component would beconsidered critical. The majority of people, including manyexperts, still believe that just because there appears to be redun-dancy, this automatically qualifies the components as RTF.Totally wrong!
3.15 Typical Examples of ComponentClassifications
Figure 3.14 coalesces the typical examples of critical, potentiallycritical, and run-to-failure components so that the subtletiesbecome apparent. As noted in Figure 3.14, there is a vast differ-ence between a component operating in a backup function andone that is not. In scenario 2, of Figure 3.14, the component is arun-to-failure component, while the component in scenario 4 iscritical.
3.16 Component ClassificationHierarchy
The classification hierarchy is shown in Figure 3.15. As men-tioned previously, different component failure modes for thesame component may have different classifications dependingon the consequence of their failure. Differences will default tothe most limiting classification for that component. Remember,too, that a single component will oftentimes have numerous dif-ferent types of PM activities associated with it, but each PMactivity maintains its own classification of importance as towhether it is critical, potentially critical, commitment, or eco-nomic. There are no PMs for RTF components.
Fundamental RCM Concepts Explained 73
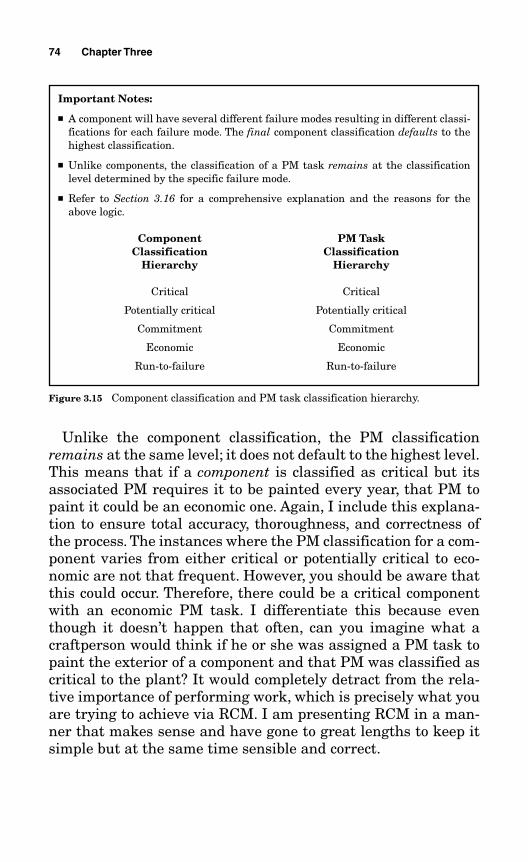
Unlike the component classification, the PM classificationremains at the same level; it does not default to the highest level.This means that if a component is classified as critical but itsassociated PM requires it to be painted every year, that PM topaint it could be an economic one. Again, I include this explana-tion to ensure total accuracy, thoroughness, and correctness ofthe process. The instances where the PM classification for a com-ponent varies from either critical or potentially critical to eco-nomic are not that frequent. However, you should be aware thatthis could occur. Therefore, there could be a critical componentwith an economic PM task. I differentiate this because eventhough it doesn’t happen that often, can you imagine what acraftperson would think if he or she was assigned a PM task topaint the exterior of a component and that PM was classified ascritical to the plant? It would completely detract from the rela-tive importance of performing work, which is precisely what youare trying to achieve via RCM. I am presenting RCM in a man-ner that makes sense and have gone to great lengths to keep itsimple but at the same time sensible and correct.
74 Chapter Three
Important Notes:
■ A component will have several different failure modes resulting in different classi-fications for each failure mode. The final component classification defaults to thehighest classification.
■ Unlike components, the classification of a PM task remains at the classificationlevel determined by the specific failure mode.
■ Refer to Section 3.16 for a comprehensive explanation and the reasons for theabove logic.
Component PM Task Classification Classification
Hierarchy Hierarchy
Critical Critical
Potentially critical Potentially critical
Commitment Commitment
Economic Economic
Run-to-failure Run-to-failure
Figure 3.15 Component classification and PM task classification hierarchy.
3.17 The Defensive Strategies of a PM Program
I like to compare a preventive maintenance program with thedefensive strategy of a football team. When you think about it,they are quite similar. The defensive objective in football is toprevent the opponent from doing something negative or damag-ing to your team. The objective of a PM program is also to pre-vent the opponent, in this case the equipment, from doingsomething negative or damaging to your facility. In football, thedefensive line acts as the first line of defense, then the lineback-ers, and then the defensive safeties. In my approach to RCM, thecritical components are the first line of defense, then the poten-tially critical components, then the commitment and economiccomponents.
The first line of defense for protecting your plant againstunplanned equipment failures consists of identifying criticalcomponents. When these components are called upon to func-tion, a single failure immediately results in a detrimental plantconsequence.
The second line of defense for protecting your plant is to iden-tify potentially critical components. When these components arecalled upon to function, their failure is hidden and does notresult in an immediate plant consequence. However, either overtime or in combination with one or more additional failures orinitiating events, a detrimental plant consequence will occur.
The third line of defense to protect your plant is to identifycommitment and economic components. When these componentsare called upon to function, their failure is not critical or poten-tially critical, but they result in either a missed commitment oran economic concern.
3.18 Eliminating the Requirement forIdentifying Boundaries and Interfaces
In Chapter 2 and at the beginning of this chapter, I made astartling statement: that RCM does not require the identifica-tion of system boundaries and interfaces. This is an extension ofthe philosophy of the pioneers of RCM, Nowlan and Heap. Not
Fundamental RCM Concepts Explained 75
requiring the identification of system boundaries and interfacesis a primary aspect of RCM Implementation Made Simple. RCMwas intended to be a structured decision process to identifythose items whose failure is significant at the component level. Itis the functions and failure possibilities at the component levelthat are important for preventing plant-level consequences.
There are several ways to commence an RCM analysis. Theonly method currently espoused in any publication about classi-cal RCM is to identify functions at the system level and then atthe subsystem level. That is not an incorrect method; however, itis a very unwieldy and cumbersome method because you areforced to identify system boundaries and interfaces. That is per-haps the most time-consuming and complicated aspect of theentire RCM process. It also leaves you vulnerable to missingsome very important component functions.
To identify system boundaries, you must compartmentalizeevery system and every subsystem and then identify the inter-face beginning and end points, where the adjoining systems andsubsystems reside. This must be clearly marked and identifiedon the plant schematics. You must know where one system endsand the other begins or you may have countless components fallthrough the cracks and not get analyzed. This does not meanjust identifying the boundaries and interfaces at the systemlevel; it also involves identifying the boundaries and interfacesat the subsystem level within that overall system.
There are literally hundreds of arbitrary interface points thatmust be identified for each system. This means that thousandsof individual arbitrary components must be specifically identi-fied and documented as interface points. Then there are theinterfaces of power supplies, fluid transfer, signal inputs, and soon. This is quite a daunting task, even for experienced RCM ana-lysts. But that is still not the end of the process of identifyingboundaries and interfaces. Often a valve becomes one of theinterface points, in which case you need to decide whether thatvalve controls the flow from the adjacent system into the systembeing analyzed. If it does, it is documented as an out-system in-interface and the valve belongs to the adjacent system. If thevalve controls the flow from the system being analyzed into theadjacent system, it is documented as an in-system out-interfaceand it would belong to the system being analyzed. Also, keep in
76 Chapter Three
mind that a specific component can reside in only one subsystemof the larger system. By the time you have identified all of theboundaries and interfaces, you could be well on your way towardcompleting the entire RCM analysis at a midsize facility.
As Chapter 2 mentioned, identifying boundaries and inter-faces is one of the primary reasons for the failure of an RCM pro-gram to be implemented. Perhaps it might be preferable to gothrough these machinations for a nuclear plant or commercialaircraft, but they are still not necessary because they are all cap-tured anyway when identifying functions at the componentlevel. All of the interface points will ultimately be included aspart of the process anyway when you identify functions at thecomponent level, so you do not have to specifically research thou-sands of component I.D.s just to identify beginning and endpoints. Every component must be analyzed no matter how big orsmall it may be. Additionally, every function of each componentmust be analyzed. This is a straightforward process and is rela-tively easy; it does not have to be accomplished in any sequenceas you would need to do if you started by identifying functions atthe system level. Eventually you will have completed the analy-sis for all components, and, after all, it is the component failureeffect that we are seeking.
The majority of facilities will almost certainly have a rela-tively smaller population of equipment to analyze than a nuclearplant or a commercial jet aircraft. A single average-size nuclearplant system will probably have more components to analyzethan an entire average-size facility in another industry. There-fore, it is much easier to define functions directly at the equip-ment level and eliminate all of the unnecessary burdens ofidentifying boundaries and interfaces. The time and expensesaved will be substantial.
3.19 Functions and Functional FailuresAre Identified at the Component Level,Not the System and Subsystem Level
The whole reason for identifying functions at the system levelwas to be able to collectively identify numerous individual com-ponents that could cause the functional failure of the system.There is a benefit to doing it that way, albeit a rather flimsy one.
Fundamental RCM Concepts Explained 77
Even when identifying functions at the system level, the inten-tion is still to get down to the component level to determine thosecomponent failure modes that have an adverse effect on thesafety and reliability of your plant. If all of the effort is to get usto the component level anyway, why not start there to beginwith? And that is precisely what RCM Implementation MadeSimple does.
It has been my experience that the difficulty and time involvedin identifying boundaries and interfaces are not worth the effortand do not buy you any more accuracy. In fact, unless you are areal RCM expert and have previously implemented a large-scaleRCM program, identifying functions at the system level mayeven result in less accuracy in the analysis. What do I mean bythat? Even for some of the most experienced analysts, it is verydifficult to identify every system and subsystem function. Fre-quently, stray components are left out and not accounted for byany of the identified system and subsystem functions. That couldbe a dangerous omission.
Another negative consideration in this process is that many ofthe different functions of a system/subsystem identify the sameequipment as having an impact. This repetition is eliminated byidentifying functions at the equipment level. The functions foreach component are analyzed only once, thus there is no repetition.
Even though identifying functions at the equipment level obvi-ously involves identifying more functions than if they were iden-tified at the system level, the time saved and the level ofaccuracy achieved are well worth it. No component is left out ofthe analysis—there are no stray components. Performing theanalysis is also much more straightforward and easy to under-stand. The analysis results are likewise easier to implement,and any subsequent additions to the program are simpler tomake. I will show you how to use this simple approach to RCMin Chapter 5. Some may prefer to identify functions at the sys-tem and subsystem level, thereby identifying boundaries andinterfaces; I will also explain in Chapter 5 how to develop anRCM program using this more difficult approach.
Every system, no matter how complex, can be broken downinto its simplest elements, which exist at the component or theequipment level. The terms component and equipment, as used
78 Chapter Three
in this book, are synonymous. The component level is that levelwhere a separate equipment identification number (equipmentI.D.) is specified. It is the level for determining the function of avalve, motor, pump, switch, heat exchanger, circuit breaker, andso on. This level does not include the subassembly piece partssuch as the bearings, armature, stator, shaft, and crank arm.Subassemblies become important when identifying the causes ofcomponent failure, and they are included as part of the processwhen we get to the PM Worksheet in Chapter 6. So for deter-mining functions, we remain at the equipment level.
Another very important consideration when identifying func-tions at the equipment level is new or modified equipment or dif-ferent operating schemes whereby changes to the analysiswould be required. Making these changes at the equipment levelis so much easier than having to go into the functions at the sys-tem and then the subsystem level to introduce them.
Identifying functions at the equipment level also serves as anexcellent training program for those involved in the analysis toacquire detailed knowledge about how the plant operates. Youmight be surprised at how much you can learn from this experi-ence that you did not know before. Remember, too, that RCM isa living program, and it is much easier to make living programchanges and adjustments at the equipment level.
Identifying functions directly at the equipment level could be arevolutionary element in classical RCM. The time savings areenormous, the analysis is much simpler, changes and additionsare easier to make, the process itself is much easier to understand,and above all else, the analysis is more thorough and accurate.
3.20 The Quest for the Consequence of Failure
The consequence of failure is what the whole RCM process is allabout. Everything you do in RCM and every part of the analysisare driven to obtain only one answer: what is the consequence offailure? Once this is determined, you need to figure out how toprevent the unwanted failure consequence via a prescriptivepreventive maintenance program that includes a vast selectionof PM tasks from which to choose.
Fundamental RCM Concepts Explained 79
How do you get there? The chronological sequence is as fol-lows:
1. Start by identifying all of the functions of the equipment.
2. Identify the functional failures or the different ways the func-tion can fail to be provided. (While I do not necessarily sub-scribe to this step in the process, it is not that difficult toidentify the functional failures, since they are the exact oppo-site of the function. I have included this step primarily to sat-isfy SAE Standard JA1011. This is explained in Chapter 4.)
3. Identify the different failure modes or the different ways theequipment can fail, which will result in the failure of the func-tions identified previously.
4. Identify the effects of the failure modes. This could be at thelocal level, the subsystem level, the system level, or the plantlevel. From experience, I have found that any real value inidentifying the effect of failure is at the plant level. However,as an intermediate informational acknowledgment, the effectsat the system level are also identified.
5. Identify what the consequences to your plant or facility will beas a result of the failure effects. These consequences are basedon what you deem important and appropriate based on theasset reliability criteria that you establish. (This is discussedin Chapter 5.)
All of these steps are part of phase 1, as delineated in Section3.1.
Phase 1: Consists of identifying equipment that is importantto plant safety, generation (or production), and asset protec-tion.
This brings us to Phase 2, which is the specification of the dif-ferent types of PM tasks.
Phase 2: Consists of specifying the requisite PM tasks for theequipment identified in phase 1. These tasks must be bothapplicable and effective.
80 Chapter Three
This phase also includes a very prescriptive method for iden-tifying default actions if an applicable and effective preventivetask cannot be found. Chapter 6 looks at developing the PMtask strategies in detail.
All of the preceding steps align with the seven steps specifiedin SAE Standard JA1011 for determining what constitutes anRCM program. This is further delineated in Chapter 5.
The third phase is the execution of the tasks.
Phase 3: Consists of properly executing the tasks specified inphase 2.
It is important to note that the question “What is the conse-quence of failure?” is totally independent of the pedigree of thecomponent. By this, I mean the consequence of failure is inde-pendent of whether or not the component is safety-related ornon-safety-related, or whether it has a lower-quality class ratingthan other components, or whether it is located in an area ofapparently less importance in your facility, or whether it seldomresults in corrective maintenance compared to other compo-nents, or whether it has a lower probability of failure (if you arestatistically inclined), and so on. The question for each failuremode of each component is “What is the consequence to the facil-ity if it should fail?”
As for probabilities of failure, those statistics may be used fordetermining the periodicity of a specified task, but they are nota factor in determining whether to include a PM task as long asthe failure mode is a credible one. Credible failure modes areexplained in Chapters 4 and 5, and the aspect of the analysisprocess for specifying PM task periodicities is discussed inChapter 6.
3.21 The COFA Versus the FMEA
The commonly used term for the analysis format of the RCMprocess is FMEA, which stands for failure modes and effectsanalysis. Some programs even call it FMECA, or failure modes,effects, and criticality analysis. Use of these analysis formats is
Fundamental RCM Concepts Explained 81
not incorrect; they are both valid. However, I have found that theidentical information can be collected, but with much more con-ceptual clarity, by employing the COFA, which stands for theconsequence of failure analysis. I developed the COFA to includeall of the same attributes as the FMEA as well as additionalattributes, so that it is all-encompassing—and it does this at thecomponent level. It is the component level that is the final desti-nation for arriving at the consequence of failure. After all, boththe FMEA and the FMECA drive you to identify the conse-quence of failure for each component failure mode, so why not bemore specific, accurate, and clear by using a more precise formatand calling it what it really is?
I have integrated all of the RCM logic for the identification ofcritical, potentially critical, commitment, and economic compo-nents within the COFA framework. Furthermore, I haveincluded the deterministic logic for whether the occurrence ofthe failure is evident or not. The COFA also includes the decisionprocess for determining the consequence of failure based on theasset reliability criteria specified. The COFA thus constitutes asimplified and self-contained, all-inclusive RCM logic analysis,which is much more straightforward and comprehensive thanthe FMEA. This is truly RCM Implementation Made Simple.Chapter 5 guides you through each step of the COFA Logic Treeand the COFA Worksheet, with examples of an actual analysis.
Another feature of the COFA is that it maintains the distinctseparation of the process for defining critical, potentially criti-cal, commitment, and economic components from the process ofspecifying their associated applicable and effective PM tasks.Why? For clarity and simplicity. I have found that trying to fig-ure out what types of PMs to specify at the same time you aretrying to define the criticality of a component only adds an ele-ment of confusion to the process. It also detracts from the mind-set and momentum of phase 1, which is to define the equipmentfirst, before you embark on specifying the tasks for that popula-tion of equipment.
There is another valid reason for doing it this way. As I men-tioned in Section 3.2, you must identify the functions of eachcomponent individually. You cannot group similar equipmenttypes together to identify their functions; however, you can
82 Chapter Three
group similar equipment types together to specify the differentkinds of PM tasks. In fact, this is the preferred way to completethat part of the process. Why? For example, there may be (andprobably will be) many similar types of motors, pumps, switches,motor-operated valves, and air-operated valves, which mayemploy the same type of preventive or predictive maintenanceapplications. Therefore, it is much more prudent and efficient tospecify the PM tasks by equipment type.
You may even wish to group similar equipment types togetherthat were classified as economic components. This might affordyou the opportunity to specify a different, less stringent, set ofpreventive and predictive applications than you would specifyfor the critical and potentially critical components of that type.This is another reason that I distinctly specified the identifica-tion of the different component classifications; in addition to thebenefit of prioritizing work and optimizing available resources,this can also be used to establish the degree to which you decideto specify prescriptive PM tasks for your strictly economic com-ponents.
Remember, the periodicities of the preventive and predictivetasks are still determined on an individual component basis,using several decision factors—the component’s environment,failure history, process flow, temperatures, and so on. Chapter 6discusses the various factors for determining the correct period-icity for a PM task.
3.22 How Do You Know When Your Plant Is Reliable?
How do you know when your plant is reliable? If you have notperformed an RCM analysis, and you are satisfied with yourpresent reliability achievements, perhaps you have been run-ning on luck. Or perhaps your plant is relatively new and hasnot yet been subject to wear-out concerns. The first of these twopossibilities is not acceptable. The second offers only short-termcomfort, which allows you to exist in an illusory state of compla-cency that is only temporary at best.
I should also warn you about another common situation: astate of illusion where unplanned failure events occur and each
Fundamental RCM Concepts Explained 83
event is neatly packaged as an “isolated” incident. After severaldozen “isolated” incidents, one begins to believe that somethingmore sinister is occurring in regard to the reliability of yourfacility. If you participate in some type of periodic inspection pro-gram required by a regulatory body such as the National Aero-nautics and Space Administration (NASA), Federal DrugAdministration (FDA), OSHA, EPA, NRC, or FAA, you should beaware that these agencies are becoming more alert to the pack-aging of “isolated” incidents as a camouflage to conceal unac-ceptable reliability performance.
Quite often (and unfortunately so), reliability becomes the “fla-vor of the day.” When some major unwanted event happens,there is a rush to bolster the reliability of that specific piece ofequipment with a myriad of preventive maintenance tasks, newdesigns, and everything in between. This obviously appeasessenior management, allows for the inevitable follow-on root-cause failure report to document corrective actions, and proba-bly does some good for the equipment in question, but crisismanagement is no way to run an airline, a nuclear plant, a mis-sile program, a cruise ship, a manufacturing plant, an oil refin-ery, a paper mill, or any type of facility.
As we will learn in later chapters, there are no guarantees thata preventive maintenance program alone—even a premier RCMprogram—will prevent each and every failure, any more than allof the safety features built into an automobile will guaranteeagainst sustaining an injury in the event of a collision. But thereare guarantees that some automobiles offer a greater degree ofprotection against injury than others, and this logic also holdstrue for a premier RCM program. Such a program provides for afar greater degree of reliability and protection against cata-strophic occurrences than if it were nonexistent.
Once you have performed a comprehensive RCM analysisand there is a very clear absence of any serious consequences offailure at your plant, and your workload is primarily utilizedfor planned maintenance activities rather than unplannedevents, that is somewhat of an indicator of a healthy reliabilityprogram.
Chapter 9 shows you how to establish a monitoring and trend-ing performance indicator to quantitatively measure your reli-ability performance.
84 Chapter Three
3.23 Chapter Summary
We have covered a lot of ground in this chapter. Even if you havesome RCM expertise, certain concepts discussed here will betotally new to you. If you are an RCM novice, all of these con-cepts will be new to you. So let’s summarize what we have justlearned about these important RCM concepts and principles.
■ There are three phases to an RCM program. The first phase isto define the equipment population that will be part of yourpreventive maintenance program. The next phase is to specifythe PM tasks for the identified population. The third phase isto execute the specified tasks.
■ RCM is a single-failure analysis except when the single failureis hidden. It then becomes a multiple-failure analysis.
■ When a component is required to perform its function and theoccurrence of the failure is not evident to the operating per-sonnel—that is, the immediate overall operation of the systemremains unaffected in either the normal or the demand modeof operation—then the failure is defined as being hidden.
■ A multiple-failure analysis is required when the occurrence ofa single failure is hidden. Addressing hidden failure modes isone of the key aspects for achieving plant reliability.
■ Critical components are immediately evident when they fail,and the unwanted consequence of this failure is immediate.
■ Potentially critical components are not immediately evidentwhen they fail, and they entail no immediate consequence offailure. They are hidden failures and become critical either bymultiple failures, by the duration of time, or by other initiat-ing events.
■ Potentially critical components are the missing link in RCM.They are a key to reliability success.
■ Analyzing potentially critical components probably offers thegreatest degree of protection against a major disaster at yourplant.
■ Preventive maintenance testing should be performed at thecomponent level and not solely at the system or subsystemlevel.
Fundamental RCM Concepts Explained 85
■ The overwhelming majority of scenarios involving the discov-ery of potential plant vulnerabilities can be very easilyresolved with a supplemental PM activity added to the pre-ventive maintenance program. The need for a design change isthe exception rather than the rule.
■ Components associated with standby safety systems such asemergency backup power, fire protection, emergency cooling,and other such systems that are not normally used must beanalyzed in their operating or demand mode; that is, the anal-ysis can only be performed assuming the applicable standbysafety system has been called upon to function.
■ Commitment components are associated with commitmentrequirements and are also usually classified as either criticalor potentially critical.
■ Economic components have no safety or operational conse-quences as a result of failure. Their failure results only in thecost of labor and/or materials for their restoration or replace-ment.
■ Run-to-failure components or systems must follow the canonlaw as defined in Section 3.8 and the RTF philosophy as shownin Figure 3.9b. Run-to-failure is a vastly misunderstood concept.
■ Corrective maintenance is an integral part of the bigger pic-ture of a preventive maintenance program.
■ Anomalies involving any of the RCM concepts offer the oppor-tunity for the component to stand out and be noticed for fur-ther review and an evaluation of whether the component iseven needed in the plant.
■ There are differences between redundant, standby, andbackup components.
■ The typical examples of component classifications in Figure3.14 show how subtle differences in the design of a system andwhether or not failure indication is individually evident canresult in very different classifications.
■ The defensive strategies of a preventive maintenance programare similar to the defensive strategies of a football team. Theaim is to protect your asset against an unwanted consequence.
86 Chapter Three
■ Establishing and identifying boundaries and interfaces arenot a required part of the classical RCM process.
■ The component (or equipment) level is where we analyze forfunctions. The piece parts of the equipment are part of the pro-cess when we analyze for the causes of failure (which are dis-cussed in Chapter 6). The component level is where a separateequipment identification number (equipment I.D.) is specified.
■ The COFA is a much more simplified, accurate, and compre-hensive method for identifying equipment functions and theirconsequence of failure than the FMEA or FMECA format.
■ Functions for similar components cannot be grouped together.PM tasks for similar components can be grouped together.
Some additional governing rules for an RCM analysis includethe following:
1. Any component failure that can result in a personnel safetyissue is always deemed critical.
2. The RCM analysis is applicable to active (nonpassive) compo-nents unless equipment failure histories or other justificationsindicate that they should be included. Passive (nonactive) com-ponents include such things as structural components or metalplates, flow orifices, and floor grating. Piping wall thicknesswear is covered by programs such as flow accelerated corrosion(FAC) analyses. Maintenance of structural members is coveredby separate structural inspection programs.
3. Manual valves are not normally included in the analysisunless there is a history of the valve needing periodic preven-tive maintenance or if the manual valve functions as a backupor standby component for a critical or potentially critical com-ponent.
4. RCM applicability for instruments is discussed in Chapter 7.
Now let’s look at some of the tools you need to commence theanalysis.
Fundamental RCM Concepts Explained 87

This page intentionally left blank
89
Chapter
4RCM Implementation:Preparation and Tools
In this chapter, you will learn about the tools and the prepara-tion needed to commence your analysis. The tools include sim-plified spreadsheets that I have designed to expressly maintainthe simple flow of logic for the analysis. The analysis itself andall of the detailed explanations for the analysis logic are dis-cussed in Chapters 5 and 6.
Not unlike carpenters who need to have all of their tools beforethey begin construction on a project, you will need some RCMtools, too. Also like carpenters, you can use very simple tools orvery complex and expensive ones. This chapter introduces you toall of them, but the choice is yours as to what tools you decide toemploy. Remember, the simple ones usually get the job done justas well as the expensive ones. However, you will find that thelarger and more complex your facility, and the more individualequipment I.D.s you have, the more sophistication you willrequire from your tools.
For example, an Excel spreadsheet and a 3-by-5 index card fil-ing system may not be appropriate for a nuclear plant, but theymight be quite suitable for a small to midsize manufacturing facil-ity. The sophistication of the tools used for storing and retrievingdata also depends solely on your needs and the complexity andsize of your facility. If your plant is governed by a regulatoryagency, you may have to justify your maintenance program
Copyright © 2006 by the McGraw-Hill Companies. Click here for terms of use.
actions to the applicable regulators, showing how you arrived atyour decisions; thus, you will probably need a more elaboratecomputerized maintenance management system (CMMS) andsupport from your information technology (IT) organization. Theinternal requirements for the management of data at your plantwill be determined by your own knowledge and experience,which will ultimately establish the level of sophistication youwill need. The various options are discussed later in this chapter.
4.1 Preparation
To prepare for the implementation process detailed in Chapters5 and 6, I recommend that you assign an RCM single point ofcontact (SPOC) or an RCM champion or coordinator to gatheryour RCM representatives together from maintenance, opera-tions, and engineering. Craft representatives should also bemembers of the team. These representatives can rotate fromwithin the different departments, depending on the specificknowledge requirements at the time. All members will need toknow what your goal is and how you plan to achieve it. Theimplementation process described in Chapters 5 and 6 shouldbe well understood by the department representatives. YourRCM coordinator does not need any special facilitator trainingor RCM expertise. He or she should, however, be capable ofunderstanding RCM Implementation Made Simple and be anenthusiastic leader of others. The RCM coordinator should alsounderstand the COFA logic and be able to explain it to the otherteam members.
I created the COFA as a pivotal fundamental aspect of RCMImplementation Made Simple. I did this so that dozens of com-ponents can be analyzed in a very short time. If the team repre-sentatives were to meet once per day for two to three hours eachday, or even better, if the team could go off-site for one week at atime to analyze hundreds and perhaps thousands of componentseach week, you would find that you could complete the COFA ina relatively short time, ranging from a few weeks to a fewmonths, obviously depending on the size of your facility and thenumber of components you have. Most RCM programs are mea-sured by the number of years it takes to complete the program.
90 Chapter Four
A time element for completing an RCM analysis that is mea-sured in years is not only inappropriate, it is unacceptable.
Once the member representatives have been selected and themission statement has been thoroughly discussed, there are somefundamental elements that are an absolute requirement.
4.2 The Sequential Elements Needed for the Analysis
Whether you have a small facility, a midsized facility, or a majorcomplex facility, the following represents a logical approach forcommencing your analysis. It consists of the following sequentialelements:
1. A simple but comprehensive alphanumeric equipment data-base must be established.
2. All pertinent informational resources must be available.
3. A descriptive convention for specifying functions and func-tional failures must be specified.
4. An Excel COFA spreadsheet (or more sophisticated RCM soft-ware if you prefer) must be available. An example of the COFAExcel Worksheet is shown in Figure 4.2 and is discussed laterin this chapter.
5. An Excel PM task spreadsheet (or more sophisticated RCMsoftware if you prefer) must be available. An example of thePM Task Worksheet is shown in Figure 4.3 and is discussedlater in this chapter.
6. An Excel Economic Evaluation Worksheet must be available.An example is shown in Figure 4.4 and is discussed later inthis chapter.
Let’s look at each one of these in detail.
4.2.1 A simple but comprehensivealphanumeric equipment I.D. database
This should already be available, and if it isn’t, it needs to be.You have to start with this database. All the equipment in your
RCM Implementation: Preparation and Tools 91
plant should be included in your plant design drawings, pipingand instrumentation drawings (P&IDs), facility schematics, elec-trical drawings, system operating manuals, training manuals,and so on. As we learned in Chapters 2 and 3, system boundariesand interfaces are not necessary for the analysis; nevertheless,your equipment is usually contained in some kind of a systemformat. If you have the capability and if you prefer to sort yourequipment I.D.s by a system tag number, that sort capabilitywill be helpful if you should want to view your performance on asystem basis. In Chapter 9, we develop a monitoring and trend-ing program to accomplish that; however, keep in mind that it isthe component level where any questions arise relative to theanalysis.
Therefore, some type of labeling by system is useful to have,but if your facility is not designed that way and it is too much ofan effort to create a simple system compilation of equipmentI.D.s, don’t spend the time and effort to create one. The analysisdoes not require it because system boundaries and interfaces arenot needed. Only a comprehensive alphanumeric equipment I.D.database is needed.
My experience has shown that whenever a question arises inregard to the RCM analysis, it is always at the component level.The question universally asked is “What is the classification ofcomponent XYZ?” Or “Why was component XYZ classified as crit-ical, potentially critical, commitment, economic, or RTF?” Thereare no classifications at the system level, and any data retrievalrequirements of the analysis relative to failure modes and con-sequences of failure are always by equipment I.D. That is one ofthe primary reasons I developed the COFA.
An interesting inquiry that often arises concerns an electronicblack box, such as a controller or a power supply, that has a myr-iad of internal electronic parts including microchips, diodes,resistors, and all kinds of circuit boards. Although there are verygood testing procedures for an electronic black box as a compo-nent itself, there is still the possibility that an electronic piecepart will fail without any prewarning. However, it is not practi-cal to perform an individual RCM analysis on the thousands ofinternal electronic piece parts of a black box. Nonetheless, if youhave a failure history for a specific piece part, such as a spe-
92 Chapter Four
cific electrolytic capacitor within a black box, you should includereplacement of that capacitor via a time-related PM. The samelogic applies to other piece parts or passive components. If theyhave a history of their failure consequences, this is always justi-fication for including them in your maintenance program.
At this point in the compilation of your equipment database,remember that it is important that no equipment I.D. be over-looked, regardless of what you may initially think about its crit-icality.The COFA analysis will determine that. It is quite commonthat the COFA will reveal a component to be significantly moreimportant than you assumed it to be, and that component couldeasily have been overlooked. Another reminder is that RCM isnot a pick-and-choose option. Each component and each functionof the component must be analyzed. Beginning your analysis bydissecting your existing PM program and then trying to justifywhat you are already doing is not classical RCM. In fact, it is notany form of RCM.
The equipment database should include components only at theequipment level, where a specific I.D. number has been assigned,such as valve, motor, pump, or compressor. Piece parts are not apart of this alphanumeric equipment I.D. database. Piece partsare, of course, important and need to be included in a masterequipment list, but they are not at the level where the equip-ment functions are identified and therefore are not a part of theequipment I.D. database. Piece parts are discussed in Chapter 6.
4.2.2 Informational resources
Depending on the level of research you require, you may wish topull together the following resources: applicable maintenance,operations, and engineering procedures, training manuals,study guides, design basis documents, vendor manuals, technicalbulletins, plant equipment drawings and schematics, electricalschematics, P&IDs, and so on. The informational resources shouldcontain the requisite information for ascertaining the functionsof the equipment and the ability to determine what the conse-quences of failure would be at the system and plant level shouldthe equipment fail to function. In addition to your various designdrawings, plant schematics, and other resources, the expertise
RCM Implementation: Preparation and Tools 93
and knowledge of your maintenance, operations, and engineer-ing personnel will provide an additional valuable input to thiselement.
Many industries share equipment reliability data with eachother. If your industry shares failure data about similar types ofequipment, that is a very good source for obtaining information.This informational resource would include failure modes andfailure causes for similar equipment that you have in your facil-ity but which may not yet have experienced those failure modes.
4.2.3 Establishing convention
The COFA requires that you define the different failure modesfor the functional failures. To simplify the phraseology of thefailure modes I recommend that you establish your own con-vention. By that I mean if a valve fails to open, it could also bewritten as “valve fails closed.” It doesn’t matter what conven-tion you use, but you should select one and stick with it to avoidconfusion.
For example, if you choose “valve fails open” this phrase isunderstood to cover three conditions: (1) the valve fails open, (2)the valve fails to remain closed, and (3) the valve fails to close. Asyou can see, sticking with the same convention makes your anal-ysis more clear and simplified. Most of the conventions in gen-eral use appear in the Glossary at the end of this book under“Conventions.”
4.2.4 Specialized workstations and software
If you have a significantly large population of equipment to man-age such as an automobile assembly line, a major petrochemicalplant, an oil refinery, a paper mill, or a large aerospace or com-puter manufacturing facility, there are specialized workstationsand CMMS systems commercially available to help manage thedata. There are also computer-based RCM tools that will storeyour data and monitor the performance of your equipment. Allequipment I.D.s can be loaded into these software programs,and they will schedule the work, personnel-load the required PM
94 Chapter Four
tasks, monitor equipment performance criteria, track key per-formance indicators (KPIs), and identify when certain equip-ment needs to be addressed as a result of warning or alert limitsthat monitor preestablished equipment parameters.
Many facilities already have various databases for ready accessand retrievability of all facets of their data. For these facilitiesthis is a vital administrative requirement that ensures real-timeinformation is readily accessible and retrievable from all requi-site databases to be used for scheduling, monitoring, trending, doc-umenting, or analyzing reliability data. There are several softwareprograms that are commercially available to help manage thiswork. For smaller and midsized facilities, an Excel spreadsheet isan excellent tool and will work just fine.
Oftentimes, the management of a facility with internal pro-gramming resources available will opt to develop their own RCMsoftware that is customized for their specific needs. This is a veryefficient way to establish an RCM database because any changesin format can be accomplished internally with in-house person-nel, and reliance on outside consultants is not needed. The deci-sion to develop your own software or purchase software off theshelf is strictly a matter of cost and how much autonomy and con-trol you wish to have over your own program.
4.2.5 The COFA spreadsheet versus the FMEA
The COFA can be completed either in its simplest format, whichis an Excel spreadsheet, or if you prefer, you can embed it in amore formal software program. The logic remains the same. TheCOFA Worksheet will be one of the tools you will use when wecommence the analysis implementation. The actual implemen-tation process and how to complete the COFA using examplesare thoroughly explained in Chapter 5.
If you study the differences between Figures 4.1 and 4.2 care-fully, you will begin to understand why I created the COFA andyou will see how simpler and more accurate it is than the cus-tomarily used FMEA. Looking at the FMEA in Figure 4.1, youwill see that you have to start with a system and then definefunctions for each individual subsystem. The systems and sub-
RCM Implementation: Preparation and Tools 95
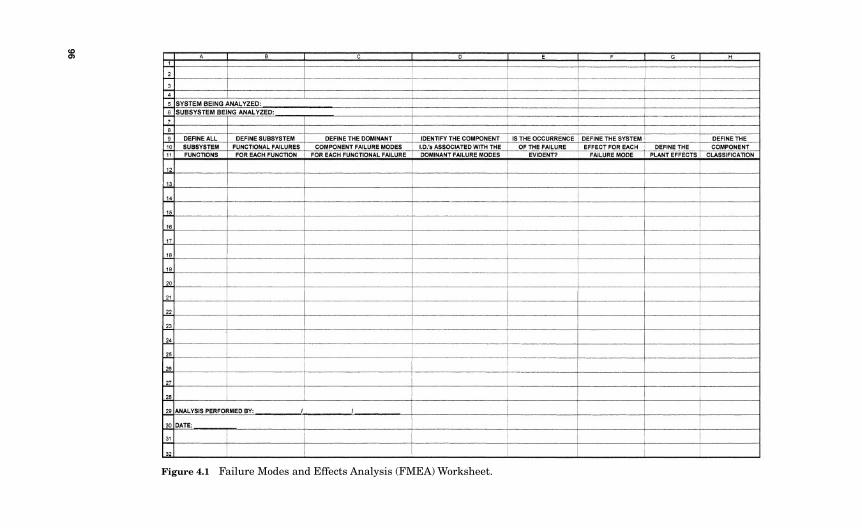
Figure 4.1 Failure Modes and Effects Analysis (FMEA) Worksheet.
96
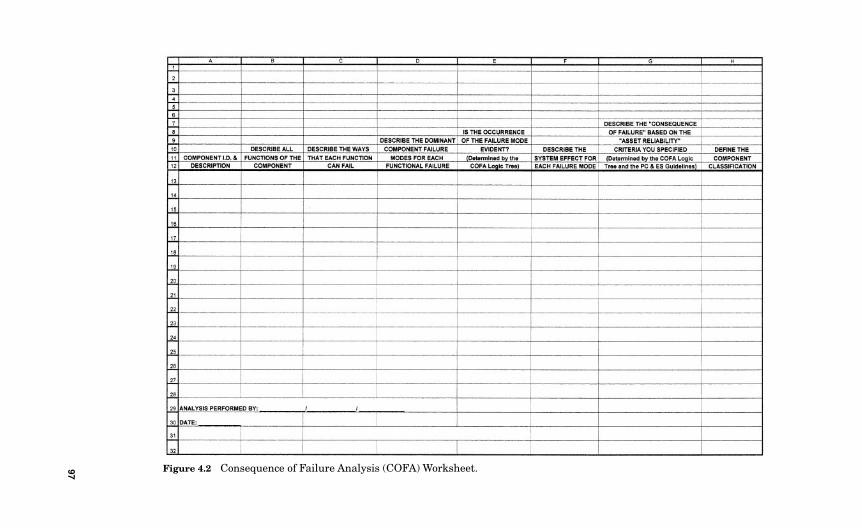
Figure 4.2 Consequence of Failure Analysis (COFA) Worksheet.97
systems must be compartmentalized, and you are required toestablish the cumbersome process of identifying boundaries andhundreds of interface points for each system.
In column A of the FMEA, all of the subsystem functions foreach system must be defined. This is not a straightforward pro-cess because there is no practical handle on capturing all of thefunctions by system and subsystem. It entails a lot of research,and there is no assurance that you have captured all of them.Operating manuals, training guides, safety analysis reports,design documents, and the like are just some of the resourcesyou will need. In column B, you will need to identify the func-tional failures of the subsystems.
In column C of the FMEA, you need to define the dominantcomponent failure modes for the functional failures. Then in col-umn D of the FMEA, you must identify the applicable equipmentI.D.s associated with those dominant component failure modesdefined in column C. Again, there are no practical checks and bal-ances for identifying all of the components that might result inthe previously specified functional failures. As I mentioned inChapter 3, after completing the FMEA, it is not uncommon—even for seasoned RCM analysts—to end up with stray or left-over components that were not accounted for when identifyingfunctions by system.
It is also inevitable that the same component I.D.s will be repet-itively identified for different system/subsystem functions. Untilnow, the FMEA (or FMECA) format was the only option to use fora classical RCM program. That is why I created the COFA. TheCOFA format has all of the elements of the FMEA, but it includesadditional attributes that make it all-encompassing, so that it ismuch easier to use and understand and thus provides for a muchmore accurate analysis.
Let’s look at the COFA in Figure 4.2. System and subsystemboundaries and interfaces are not required because the analysisis performed at the component level. Note that the componentsare identified in the COFA in column A right at the start. Thefunctions and functional failures are then defined at the compo-nent level for each component. Unlike the FMEA, with the COFAyou do not need to figure out and research which components are
98 Chapter Four
responsible for the failures of the function at the system andsubsystem levels because you already identified them at thebeginning.
It is not a difficult task to identify the functions of a given com-ponent. When you already know what the component is, it ismuch easier to identify what the functions of that componentare, rather than starting at a more abstract level of definingfunctions at the system and subsystem level and then figuringout how to back-fit the analysis by identifying what componentmeets that functional failure criterion.
As previously noted, any questions regarding the analysis arealways at the component level anyway, which is another reasonI developed the COFA. Even though there will be more individ-ual component functions than system functions, the simplicity,clarity, and accuracy gained and the benefit of eliminating therequirement for establishing boundaries and interfaces areworth it.
As I mentioned in Chapter 3, I contend that specifying thefunctional failures is of questionable value because the func-tional failures really become the exact opposite of the functions.For instance, if the function is to “supply water to the injectionheader,” then the functional failure is written as “fails to providewater to the injection header.” Since the functional failurebecomes the exact opposite of the function, it does not add anysignificant value. After defining the function, it is not that diffi-cult to go directly to column C of the COFA and define the “dom-inant failure modes for those functions.” Nonetheless, I haveincluded defining the functional failures for two reasons. It doesadd a very marginal value of clarity to the process, and SAE hasincluded it in their standard. However, including verbiage forthe functional failures does not add a great amount of signifi-cance to the analysis.
Similarly, defining the failure effects at the system level foreach failure mode is not really a significant value-added part ofthe process because it is the consequence of failure at the plantlevel that is important. I have nevertheless included systemeffects as an informational element because I have found thatthis knowledge makes the identification of the plant effects a lit-
RCM Implementation: Preparation and Tools 99
tle bit more clear. Some RCM programs even specify the effectsat the local level, which is of miniscule value.
In the COFA, I have explicitly identified, in column G, that theconsequence of failure is based on the asset reliability criteriathat you establish. Asset reliability consequences include theplant-level consequences and any other consequences you deemimportant such as an incident resulting in unfavorable publicity,or a legal concern, or an environmental concern. Selecting yourasset reliability criteria is discussed in Chapter 5.
Chapter 5 also explains the logic that prevails in order to com-plete each column of the COFA Worksheet. Remember, there isnothing incorrect about using the FMEA, and if you prefer theFMEA format, that is an acceptable way to perform your analy-sis. The choice is yours.
4.2.6 The PM task worksheet
As we learned in Chapter 3, phase 2 of an RCM program is wherewe specify the preventive maintenance tasks for the equipmentwe identified in phase 1, since those were the components requir-ing a preventive maintenance strategy. Run-to-failure compo-nents do not have PMs. That takes us to the PM Task Worksheet(PMTW). Refer to Figure 4.3 for the format of an Excel PM TaskWorksheet. At this time, it is shown only to introduce you to itsformat since it will be one of the tools you will be using when wecommence the analysis implementation. The actual PM selectionprocess and how to complete the PM Task Worksheet usingexamples are thoroughly explained in Chapter 6.
The PM Task Worksheet is where we enter the data for allcomponents that were classified as being either critical, poten-tially critical, commitment, or economic. These components musthave a preventive maintenance strategy with “applicable andeffective” PM tasks specified. The only exception is for failuremodes that are not credible. However, noncredible failure modesare extremely rare because virtually any type of failure canoccur. Even if a failure mode has not occurred previously, that isnot a valid justification for calling it noncredible. I would grantthat a meteor strike would qualify as being noncredible and per-
100 Chapter Four
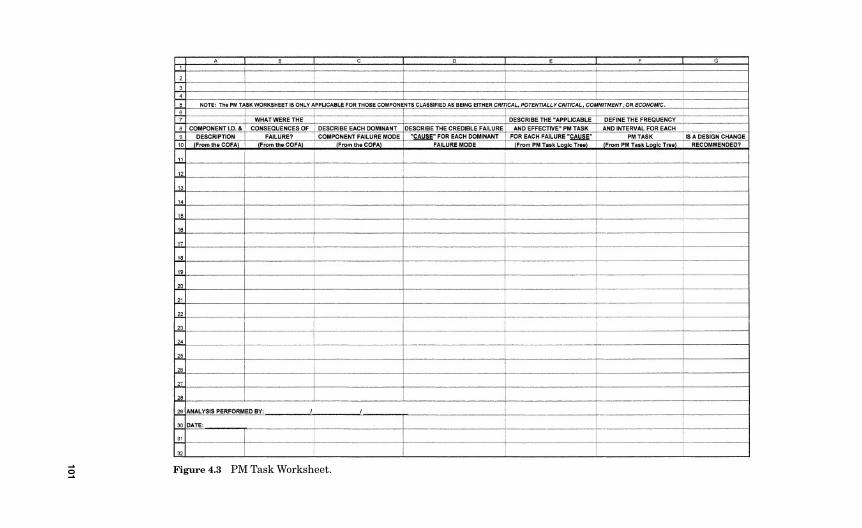
Figure 4.3 PM Task Worksheet.
101
haps other, similar types of postulated events. Anything lesswould most likely be considered credible.
Each failure mode has one or more PM tasks to address it.Therefore, a single component will often have a host of differenttypes of PM activities associated with it. The PM Worksheet iswhere we introduce the piece parts, or the subassemblies, of thecomponents that are the credible causes for failure. Causes offailure could include bearing failures, heat exchanger tube fail-ures, motor winding failures, check valve hinge pin failures,pump seal failures, impeller shaft failures, and so on. Chapter 6defines the different types of PM tasks and explains in detaileach column of the PM Task Worksheet.
If you have a rather large and complex facility, you may wishto use some of the previously mentioned commercially availableRCM software to store this information. For smaller and mid-size facilities that prefer to keep their costs at a minimum, theExcel PM Task Worksheet contains all of the required data andattributes—although they may not be as sophisticated as thoseembedded in a chic software package, they are equally as robust.
4.2.7 The economic evaluationworksheet
As we now have learned, economic components have no safetyor operational consequences resulting from their failure. Theyresult only in a monetary cost of labor and/or materials. Thequestion often arises “What dollar-value threshold should beused as a break-even point for whether or not to perform a PM?”This is a subjective decision, and I have included some guidancefor your decision process. Basically, it boils down to the economiccost of failure versus the cost for performing a PM to prevent itsfailure. Oftentimes the cost of a PM is far greater than letting aneconomic component fail. Remember, the difference between aneconomic component and a run-to-failure component is the costinvolved. There are no other safety or operational concerns.
To allow for a break-even equivalency, everything should becalculated on an annualized basis. In a simple typical situation,for example, if the PM task needs to be accomplished two times
102 Chapter Four
per year to prevent the component from failing, and administra-tive costs average $500 each time the PM is accomplished, thiswould equal $1000 per year. Assume the component failed on anaverage of once per year, and it cost $1000 for repairs or replace-ment. That would result in a total annual cost of $1000 for therepairs or replacement plus $500 in CM administrative costs(assuming the CM admin costs are equivalent to the PM admincosts), for a total cost of $1500. Therefore, it would cost $1000 peryear to maintain it, but it would cost $1500 per year to let it runto failure. So a PM strategy would be appropriate in this case.
Obviously, this was a very simple example. Real-life instancesare much more complicated and must take into account manyother variables, such as: Will a downpower be required each timethe PM is performed? How long will the downpower last? Howmuch will the downpower cost for that length of time? Is the com-ponent easily accessible to work on? Will scaffolding be required?Does it require an outage for clearance to work on the component?Are there warehouse stocking issues? Other warehouse costs? Areparts readily available? If the component is RTF and it fails on theback shift, will there be sufficient personnel to effect repairs? Canrepairs wait till the next day? And so on . . .
Figure 4.4 is an Excel Economic Evaluation Worksheet to helpidentify a break-even point for your evaluation. Many times aplant wishes to choose an arbitrary dollar value, such as $500, sothat if the component replacement cost is less than $500, it is notconsidered for preventive maintenance (again, in the absence ofany safety or operability considerations). It is also common tocalculate the administrative cost of performing a routine PMtask. This cost would include the time needed for a scheduler toplan and schedule the task, the cost for processing the paper-work (which could be quite significant), the cost for operationssupport time, and so on. If these cumulative administrative costsare more than the cost of replacing the component, it may be pru-dent to consider the component as RTF (again, in the absence ofany safety or operational concerns).
Some tasks, such as routine lubrication and oil changeouts,are inherently justified and prudent to perform, and they do notneed any further economic evaluation.
RCM Implementation: Preparation and Tools 103
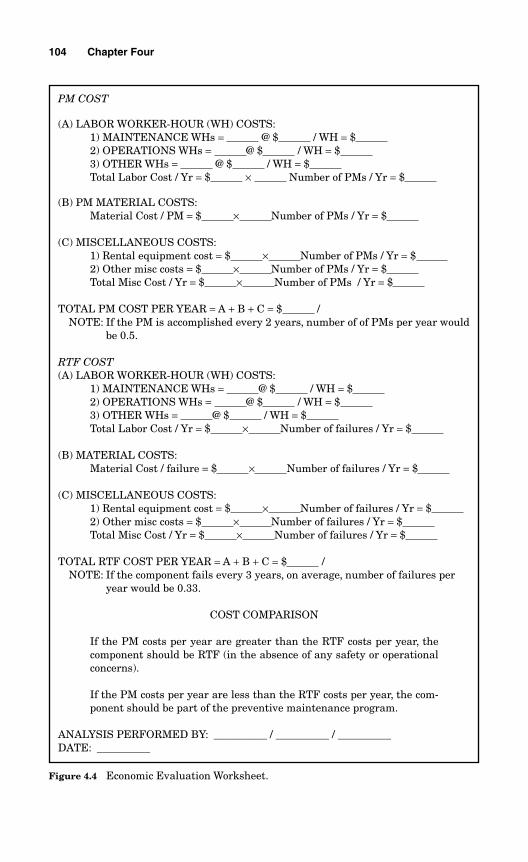
104 Chapter Four
PM COST
(A) LABOR WORKER-HOUR (WH) COSTS:1) MAINTENANCE WHs = @ $ / WH = $2) OPERATIONS WHs = @ $ / WH = $3) OTHER WHs = @ $ / WH = $Total Labor Cost / Yr = $ × Number of PMs / Yr = $
(B) PM MATERIAL COSTS:Material Cost / PM = $ × Number of PMs / Yr = $
(C) MISCELLANEOUS COSTS:1) Rental equipment cost = $ × Number of PMs / Yr = $2) Other misc costs = $ × Number of PMs / Yr = $Total Misc Cost / Yr = $ × Number of PMs / Yr = $
TOTAL PM COST PER YEAR = A + B + C = $ /NOTE: If the PM is accomplished every 2 years, number of of PMs per year would
be 0.5.
RTF COST(A) LABOR WORKER-HOUR (WH) COSTS:
1) MAINTENANCE WHs = @ $ / WH = $2) OPERATIONS WHs = @ $ / WH = $3) OTHER WHs = @ $ / WH = $Total Labor Cost / Yr = $ × Number of failures / Yr = $
(B) MATERIAL COSTS:Material Cost / failure = $ × Number of failures / Yr = $
(C) MISCELLANEOUS COSTS:1) Rental equipment cost = $ × Number of failures / Yr = $2) Other misc costs = $ × Number of failures / Yr = $Total Misc Cost / Yr = $ × Number of failures / Yr = $
TOTAL RTF COST PER YEAR = A + B + C = $ /NOTE: If the component fails every 3 years, on average, number of failures per
year would be 0.33.
COST COMPARISON
If the PM costs per year are greater than the RTF costs per year, thecomponent should be RTF (in the absence of any safety or operationalconcerns).
If the PM costs per year are less than the RTF costs per year, the com-ponent should be part of the preventive maintenance program.
ANALYSIS PERFORMED BY: __________ / __________ / __________DATE: __________
Figure 4.4 Economic Evaluation Worksheet.
4.3 Chapter Summary
■ Preparation for implementing your analysis includes selectingan RCM point of contact and selecting qualified representa-tives from operations, engineering, maintenance, and the var-ious crafts.
■ An alphanumeric database of all plant equipment is required.■ Informational resources to ascertain the functions of all plant
equipment and the consequences of their failure are required.■ A convention for describing failure modes needs to be estab-
lished.■ For the majority of facilities, an Excel spreadsheet is all that is
required, and it will become the tool of choice for completingthe RCM analysis.
■ The COFA Worksheet, the PM Task Worksheet, and the Eco-nomic Evaluation Worksheet are all displayed in an Excelformat.
■ More sophisticated workstations, CMMS systems, and soft-ware are commercially available for larger and more complexfacilities.
■ The development of software by an internal, in-house IT depart-ment is also an option.
This chapter touched very briefly on the kinds of spreadsheettools you need to proceed with the analysis and store the analy-sis data. Everything we learned about the concepts and princi-ples of RCM and the tools we need have brought us to this point.Now let’s look at actually commencing a classical RCM analysis.
RCM Implementation: Preparation and Tools 105

This page intentionally left blank
107
Chapter
5RCM Made Simple:
The Implementation Process
This chapter guides you through the RCM implementation pro-cess. What we have learned thus far has been the building blocksfor the implementation process, and as in previous chapters, Iwill build the implementation process in a sequence beginningwith the essential elements. These elements include the require-ment to identify your asset reliability criteria, which are theassets you want to preserve. Then you will need to identify thefailure modes you want to prevent in order to avoid anyunwanted consequences that can threaten the preservation ofthose assets. This is accomplished via the COFA, which identi-fies the population of equipment that must be included in a pre-ventive maintenance strategy. Specifying the different types ofPM tasks, establishing a PM task strategy, and completing thePM Task Worksheet are discussed in Chapter 6.
It has been my experience that the implementation process canbe made very painful or it can be made virtually painless and justas robust, if not more so, than the painful method. Most RCMbooks discuss establishing a network of facilitators, a stringentparliamentary process for conducting meetings, and adherence tospecial training rigidities. These regimented requirements arenot incorrect; they are just not needed. I have developed this pro-cess in such a way that the only regimentation necessary is toadhere to the descriptive interpretation explained here as you
Copyright © 2006 by the McGraw-Hill Companies. Click here for terms of use.
complete each step of the COFA Worksheet. The only basicrequirements for the analysis are a complete database of allplant equipment; a qualified RCM point of contact; qualified rep-resentatives from the operations, engineering, and maintenancedepartments; representatives from the various crafts; informa-tional resource data; and the cumulative knowledge and experi-ence of the representatives for identifying all of the differentfunctions of the equipment, the failure modes of the equipment,and the consequences of those failure modes.
I recommend that the representatives rotate from the differ-ent departments depending on the equipment and systemsbeing analyzed. For example, the individuals most familiar withthe electrical distribution system components are probably notthe most qualified to analyze the feedwater system components,and vice versa—the mechanical folks are probably not the bestindividuals to analyze the electrical distribution system compo-nents. However, the individual acting as the RCM single point ofcontact should remain permanent.
There are no special training needs for these individuals otherthan their knowledge, expertise, and willingness to worktogether. The logic I have created is self-explanatory. The teammembers can determine for themselves how to conduct a meet-ing, what to say, when to speak, and what information needs tobe documented. The representatives selected should be quitecapable of determining the method for deciding which systemcomponents are the first to be analyzed. Eventually every com-ponent will be analyzed, so the order in which they are analyzedis not of paramount importance. Some of the componentsthought to be the least important might actually be found to bethe most critical ones.
Taking an approach to RCM that is too sophomoric andparochial is counterproductive and unnecessarily costly, in myopinion. Too much emphasis on the mundane can result in awaning of interest in the whole RCM process. Approaching RCMin this way has contributed to what made the process so difficultin the past and why its implementation failure rate has been sohigh. RCM was not intended to be that difficult to implement,and it shouldn’t be. As I mentioned in Chapter 2, the decisionsrequired for successfully implementing an RCM program are
108 Chapter Five
best made by knowledgeable in-house individuals or by aug-mented help, working on an individually contracted basis, underin-house supervision.
The implementation starting point is to define your asset reli-ability criteria.
5.1 Define Your Asset Reliability Strategy
RCM is the driver for a corporate reliability strategy. As welearned in Chapter 1, your number one objective is preservingyour corporate assets via a premier RCM program that ensuresthe highest levels of safety and reliability for your facility. Anyprogression of corporate mishaps such as employees or membersof the general public incurring serious injuries, or havingenforcement inspection teams or an OSHA committee descendupon your facility, will generate enough unwanted corporate vis-ibility and uninvited public attention that the resulting negativeimpact would far outweigh the cost of implementing a prudentreliability program.
The first step in implementing your RCM program is to defineprecisely and accurately what asset reliability criteria yoursenior management wishes to preserve. Defining your asset reli-ability criteria basically involves identifying all the unwantedconsequences of failure that can occur in your facility and thatmust be prevented.
To define these criteria, you should take into account the fol-lowing concerns: ensuring personnel and plant safety; prevent-ing, or at the very least minimizing, the exposure to anyunplanned production delays; unplanned facility shutdowns,power reductions, and production interruptions; the loss of gen-eration or production capacity; preventing regulatory or envi-ronmental issues from attracting unwelcome publicity orlitigation; and so on. Defining these criteria is your first order ofbusiness and it is strongly advised that you submit a formalinternal memorandum for signatures from all applicable indi-viduals in authority for agreement on what you choose.
It is perfectly acceptable to place qualifying conditions on thecriteria you select—for example, a production or assembly-line
RCM Made Simple:The Implementation Process 109
interruption with a duration of no more than 15 minutes, or 30minutes, or 1 hour, or a power reduction of no more than 1 per-cent, 5 percent, or 10 percent. Other things to consider are:
■ Can the plant manage the failure?■ Can compensatory measures be taken immediately and are
they acceptable?■ Will there be enough time to mitigate any unwanted conse-
quences?
Any qualifying conditions you choose should also have thebuy-in of senior management. Once established, they willbecome the bedrock of your reliability program. For example, amanufacturing or production facility might incorporate thesecriteria: no personnel or safety concerns, no plant trips, nopower reductions greater than 5 percent, no regulatory issuesresulting in enforcement or unwanted oversight, and no controlroom actions or interruptions that cannot be mitigated within10 minutes. Figure 5.1 lists some of the many possible criteriato consider.
While generic catchphrases such as “resource optimization”and “plant optimization” are worthy, they are not sufficientlyspecific. You need to be very specific about what you mean bysuch terms. The typical asset reliability criteria listed in Figure5.1 are very specific, reflecting your need to be as specific in yourcriteria in order to achieve reliability success.
In Figure 5.1, you will note that it is mandatory to include thefirst two criteria, which are personnel, public, and plant safetycriteria. The others are all operability criteria. Of course, youmay add to this list or omit some of the suggested criteria(except for the first two safety criteria). But once you and yoursenior management have decided upon and defined exactly whatcriteria you will use, that becomes the focus of your RCM analy-sis. Economic criteria are separate from safety and operabilitycriteria and are discussed in conjunction with Figure 5.2b.
Component functions, functional failures, and the conse-quences of those failures that can result in triggering one or moreof your selected asset reliability criteria will result in a compo-nent classification of either critical or potentially critical. As
110 Chapter Five
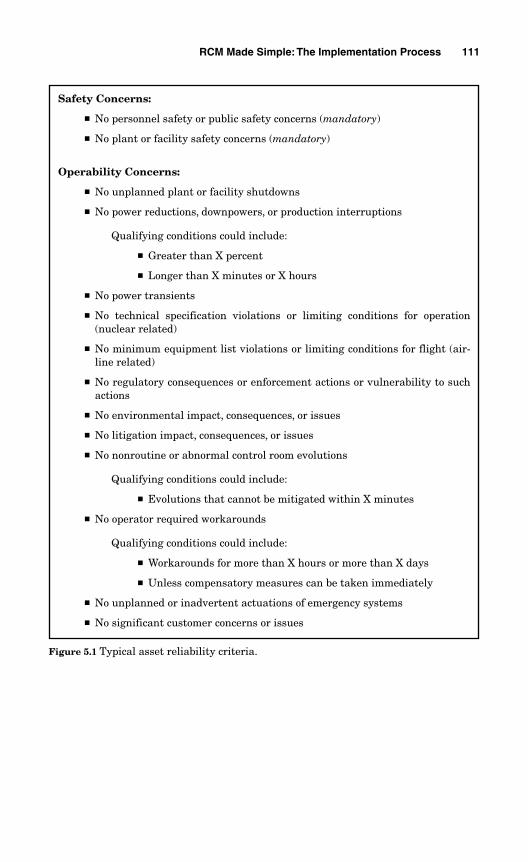
RCM Made Simple:The Implementation Process 111
Safety Concerns:
■ No personnel safety or public safety concerns (mandatory)
■ No plant or facility safety concerns (mandatory)
Operability Concerns:
■ No unplanned plant or facility shutdowns
■ No power reductions, downpowers, or production interruptions
Qualifying conditions could include:
■ Greater than X percent
■ Longer than X minutes or X hours
■ No power transients
■ No technical specification violations or limiting conditions for operation(nuclear related)
■ No minimum equipment list violations or limiting conditions for flight (air-line related)
■ No regulatory consequences or enforcement actions or vulnerability to suchactions
■ No environmental impact, consequences, or issues
■ No litigation impact, consequences, or issues
■ No nonroutine or abnormal control room evolutions
Qualifying conditions could include:
■ Evolutions that cannot be mitigated within X minutes
■ No operator required workarounds
Qualifying conditions could include:
■ Workarounds for more than X hours or more than X days
■ Unless compensatory measures can be taken immediately
■ No unplanned or inadvertent actuations of emergency systems
■ No significant customer concerns or issues
Figure 5.1 Typical asset reliability criteria.
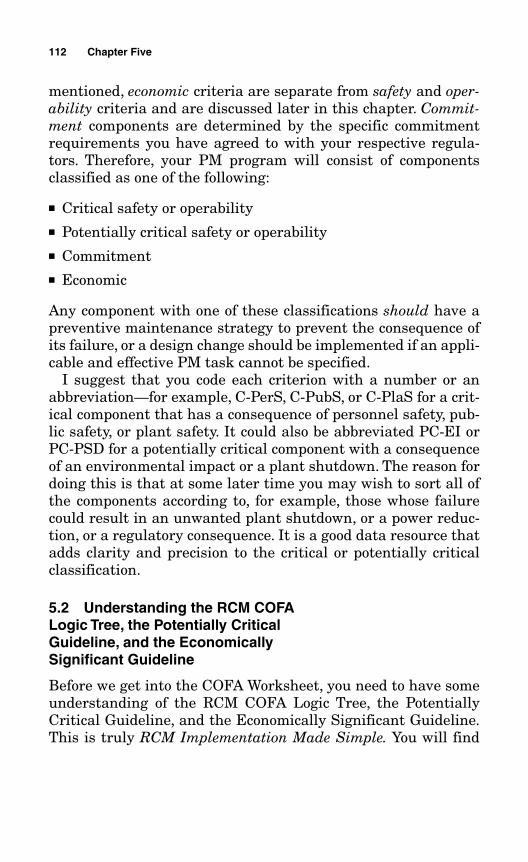
mentioned, economic criteria are separate from safety and oper-ability criteria and are discussed later in this chapter. Commit-ment components are determined by the specific commitmentrequirements you have agreed to with your respective regula-tors. Therefore, your PM program will consist of componentsclassified as one of the following:
■ Critical safety or operability■ Potentially critical safety or operability■ Commitment■ Economic
Any component with one of these classifications should have apreventive maintenance strategy to prevent the consequence ofits failure, or a design change should be implemented if an appli-cable and effective PM task cannot be specified.
I suggest that you code each criterion with a number or anabbreviation—for example, C-PerS, C-PubS, or C-PlaS for a crit-ical component that has a consequence of personnel safety, pub-lic safety, or plant safety. It could also be abbreviated PC-EI orPC-PSD for a potentially critical component with a consequenceof an environmental impact or a plant shutdown. The reason fordoing this is that at some later time you may wish to sort all ofthe components according to, for example, those whose failurecould result in an unwanted plant shutdown, or a power reduc-tion, or a regulatory consequence. It is a good data resource thatadds clarity and precision to the critical or potentially criticalclassification.
5.2 Understanding the RCM COFALogic Tree, the Potentially CriticalGuideline, and the EconomicallySignificant Guideline
Before we get into the COFA Worksheet, you need to have someunderstanding of the RCM COFA Logic Tree, the PotentiallyCritical Guideline, and the Economically Significant Guideline.This is truly RCM Implementation Made Simple. You will find
112 Chapter Five
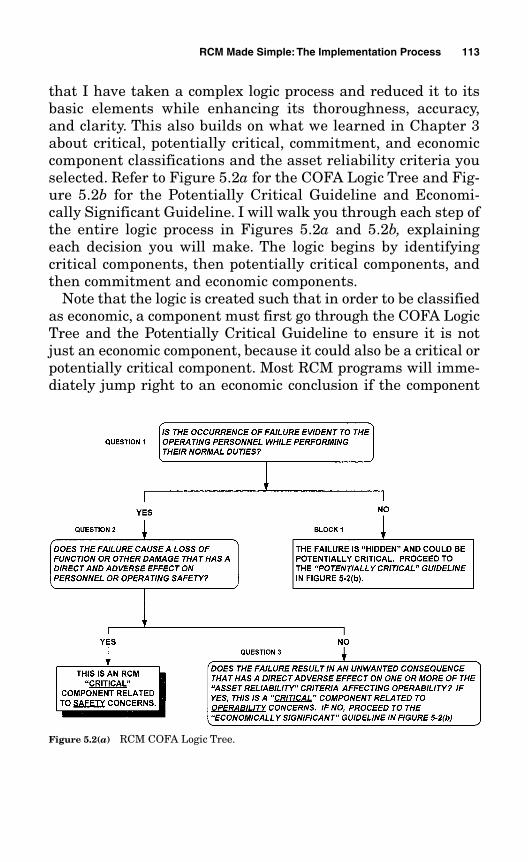
that I have taken a complex logic process and reduced it to itsbasic elements while enhancing its thoroughness, accuracy,and clarity. This also builds on what we learned in Chapter 3about critical, potentially critical, commitment, and economiccomponent classifications and the asset reliability criteria youselected. Refer to Figure 5.2a for the COFA Logic Tree and Fig-ure 5.2b for the Potentially Critical Guideline and Economi-cally Significant Guideline. I will walk you through each step ofthe entire logic process in Figures 5.2a and 5.2b, explainingeach decision you will make. The logic begins by identifyingcritical components, then potentially critical components, andthen commitment and economic components.
Note that the logic is created such that in order to be classifiedas economic, a component must first go through the COFA LogicTree and the Potentially Critical Guideline to ensure it is notjust an economic component, because it could also be a critical orpotentially critical component. Most RCM programs will imme-diately jump right to an economic conclusion if the component
RCM Made Simple:The Implementation Process 113
Figure 5.2(a) RCM COFA Logic Tree.
has a high number of corrective maintenance orders or a highcost of restoration, for example. That is not acceptable because itis not necessarily correct. In many cases, the component will alsobe either critical or potentially critical, which is much moreimportant than economic. As we learned in Chapter 3, the com-ponent classification always defaults to the highest level. Thispossibility would otherwise go undetected. Immediately jumpingto an economic conclusion would never expose the component asalso being critical or potentially critical.
To put all of this into perspective, much of the difficulty andconfusion with existing traditional renditions of RCM, especiallyfor the RCM novice, arises with the disjointed decision logic pro-
114 Chapter Five
Potentially Critical Guideline
Can the component failure, in combination with an additional failure orinitiating event, or over time, result in an unwanted consequence that hasa direct adverse effect on one or more of the asset reliability criteria?
If yes, this is a potentially critical component. It could be “potentially critical” forsafety or for operability concerns depending on its consequence of failure.
If no, is the component associated with a commitment? If it is, this is a commitmentcomponent. If it is not associated with a commitment, proceed to the EconomicallySignificant Guideline below.
Economically Significant Guideline
■ Will the component failure result in a high cost of restoration?
■ Will the component failure result in a high cost of related corrective mainte-nance (CM) activity?
■ Will the component failure result in significant downtime?
■ Will the component failure result in a long lead time for replacement parts?Are the parts obsolete or in short supply?
If yes to any of the above, and a PM is further justified by the Economic EvaluationWorksheet (Figure 4.4), this is an economic component.
If no to all of the above, this is a run-to-failure (RTF) component.
Figure 5.2(b)
cess. Any real cohesiveness was missing from the logic process.What I have done is to simplify the entire logic process by devel-oping the concept of potentially critical components and veryspecifically and very clearly integrating all of the decision logicinto one all-inclusive, self-contained process. I have designed theCOFA Worksheet so that it embraces the following simplicity:
■ The entire analysis process begins at the component level.■ Up front, you have already established your asset reliability cri-
teria, which constitute your standard for determining safetyand operability concerns.
■ The COFA Logic Tree then identifies critical componentsthrough the RCM decision process if it affects any of the assetreliability criteria you established.
■ In case the component is not deemed critical by the COFALogic Tree, the Potentially Critical Guideline was embedded inthe decision logic process to determine whether a hidden fail-ure could affect your asset reliability criteria, which wouldmake the component potentially critical.
■ If the Potentially Critical Guideline decision logic did not findthe component to be potentially critical or have a commitmentassociated with it, the Economically Significant Guideline wasembedded in the decision logic to determine whether the com-ponent failure could result in an economic concern.
Thus, the entire RCM decision logic has been integrated intoone very simple process. The COFA Worksheet that we discussedin Chapter 4 refers you to the logic required to determine theultimate consequence of failure. Since all of the decision logic hasbeen sequentially integrated within the RCM COFA Logic Tree,the Potentially Critical Guideline, and the Economically Signifi-cant Guideline, it is only prudent to review them before we beginto complete the COFA Worksheet.
The following is the descriptive logic for each question in theRCM COFA Logic Tree.
Question 1: Is the occurrence of failure evident to the operat-ing personnel while performing their normal duties?”
RCM Made Simple:The Implementation Process 115
There is a reason that this is the very first question asked: it isto distinguish between evident failures and hidden failures, andthat is where the RCM logic begins. This question must beanswered for each failure mode. A component usually has severalfailure modes. The failure modes are those that are dominant, ormost likely to occur. They do not include implausible or unrealis-tic failure modes. Failure modes are the types of failure or theways in which a component can fail. Failure modes could be, forexample, “valve fails closed,” “valve fails open,” “switch fails toactuate,” “switch actuates prematurely,” “pump fails to start,” andso on. Nonplausible failure modes are similar to noncredible fail-ure causes, which we discussed in Chapter 4. They are theextreme rarity. (Note: The failure mode does not include the rea-son or the cause for the component failure at this point in theanalysis. The credible failure causes are analyzed during the PMtask evaluation phase, which is covered in detail in Chapter 6.)
The failure of the component could be made evident by a con-trol room alarm, an indicator light, a valve position indicator, orany other control room announcement that monitors the opera-tion of that specific component. This provides an indication thatthe component has failed and an urgent situation has arisen. Forexample, if the failure of a particular pump occurs, then theplant must reduce power immediately. Of course, the failurecould also become evident via the unwanted event that occurssimultaneously with the failure—in other words, there is notime to take immediate action because the consequence hasalready occurred. For example, as soon as a conveyor failureoccurs, the assembly line shuts down. Any failure mode that isnot evident is considered hidden.
As I mentioned in Chapter 3, every facility is not like the con-trol room of a nuclear power plant or the cockpit of a jet aircraft,where almost all equipment and systems are continuously mon-itored. If your facility does not continuously monitor the major-ity of your equipment in a control room, it is acceptable toinclude the failure as “being evident” if monitoring of the equip-ment is accomplished during routinely performed operatorrounds. Practically all facilities have an individual(s) who con-tinuously monitors plant equipment and other parametersthroughout a 24-hour period. To receive credit for an event being
116 Chapter Five
evident, the operator rounds cannot involve some loosely inter-preted set of verbal instructions that can arbitrarily change atwill. The operator rounds must be formalized and defined withinspecific applicable operating procedures. We will examine bothyes and no answers to Question 1, starting with a yes answer,which brings us to the next question.
Question 2: Does the failure cause a loss of function or otherdamage that has a direct and adverse effect on personnel oroperating safety?
This question also must be asked for each failure mode. This isthe most serious of all consequences. A yes answer to Question 2means the single failure can result in a direct adverse effect onpersonnel or plant safety. A single failure of the component canimmediately result in the possibility that an employee or a mem-ber of the public could be seriously injured or that the failurecould lead to a fatality or a serious safety concern for the plant.An example is the failure of the O-ring seal on the Challengerspace shuttle. A yes answer could also mean that there is thepossibility of a very serious plant safety concern such that thecomponent failure might result in a fire or explosion in the plant(which would also be a personnel safety issue). This would be acritical component related to safety concerns. (Note: It is under-stood that all consequences of failure, whether at the systemlevel or the plant level, imply that there is no existing preventivemaintenance strategy for preventing the failure. For example, ifyou have an existing PM that performs a task, having that PMmust not be considered in the analysis to determine the conse-quence of failure. The existing PM task may indeed be applicableand effective, but it does not negate your requirement to definethe criticality of the component by assuming the component willfail without crediting any existing preventive maintenanceactivities.)
A no answer to Question 2 brings us to Question 3.
Question 3: Does the failure result in an unwanted conse-quence that has a direct adverse effect on one or more of theasset reliability criteria affecting operability?
RCM Made Simple:The Implementation Process 117
A yes answer to Question 3 determines this to be a criticalcomponent related to operability concerns. We know the failurewas evident, and it was not determined to be a safety concernbecause we answered no to Question 2, and all of the remainingasset reliability criteria (except for the first two) are operabilityconcerns. If it is not an operability concern, it could still be aneconomic concern.
A no answer to Question 3 directs us to proceed to the Eco-nomically Significant Guideline in Figure 5.2b. A yes answer toany of the economic questions determines the component to beclassified as economic. A no answer to the Economically Signifi-cant Guideline determines the component to be run-to-failure.
Now let’s look at a no answer to Question 1. That brings us toBlock 1.
Block 1: The failure is hidden and could be potentially critical.Proceed to the Potentially Critical Guideline.
We then proceed to the Potentially Critical Guideline in Figure5.2b to determine whether the component failure, in combina-tion with an additional failure or initiating event, or over time,can result in an unwanted consequence that has a direct adverseeffect on one or more of the asset reliability criteria, includingthe first two safety criteria.
A yes answer in the Potentially Critical Guideline determinesthe component to be potentially critical. An example of a poten-tially critical safety concern is similar to the triple-redundant(but hidden) turbine overspeed vulnerability we examined inChapter 3, whereby the plant could sustain significant damage,but even worse, someone could be killed.
Note the distinction between Question 2 and the PotentiallyCritical Guideline in regard to safety. A yes answer to Question 2determines that there is a direct adverse safety consequencethat occurs immediately. A yes answer to the Potentially CriticalGuideline affecting either of the first two asset reliability safetycriteria also determines that there is a safety consequence, but itis not direct and immediate because it is hidden. Therefore, themost critical consequences of all will be those resulting in a yesanswer to Question 2.
118 Chapter Five
Components whose failure results in a yes answer to Question2 or a yes answer in the Potentially Critical Guideline for eitherof the first two asset reliability criteria should be looked at for apossible design change in addition to any preventive mainte-nance strategies that may be implemented.
A failure resulting in a consequence to any of the other assetreliability criteria (except the first two safety criteria) would rep-resent a potentially critical component related to an operabilityconcern. A typical example is the hidden failure of a particularmotor that could result in an unplanned interruption of produc-tion with the additional failure of a second component.
A no answer in the Potentially Critical Guideline asks whetherthe component has a commitment associated with it. If it has anassociated commitment, it is classified as a commitment compo-nent. If it does not have an associated commitment, we proceed tothe Economically Significant Guideline to determine whether thecomponent should be classified as economic or run-to-failure.
Figure 5.3 illustrates what I call the RCM filter. This is a sim-plified way of looking at the logic we have just learned about,showing how it ensures that nothing gets through the funnelwithout being filtered for its importance.
As you can see, the logic I have created provides for all compo-nents to initially pass through the first filter, which is the COFALogic Tree. All critical components are determined by this firstfilter. Those components making it through the first filter thenpass through the second filter, which is the Potentially CriticalGuideline. All potentially critical components are determined bythis second filter. Those components making it through the firsttwo filters then must pass through the commitment filter, whichis included within the Potentially Critical Guideline. Those com-ponents making it through the first three filters then passthrough the fourth filter, which is the Economically SignificantGuideline. All purely economic components are determined bythis fourth filter.
All of the components that were filtered constitute the techni-cal basis for the preventive maintenance program. If a compo-nent makes it through the funnel without being caught in any ofthe filters, it is a run-to-failure component. This is truly RCMImplementation Made Simple.
RCM Made Simple:The Implementation Process 119
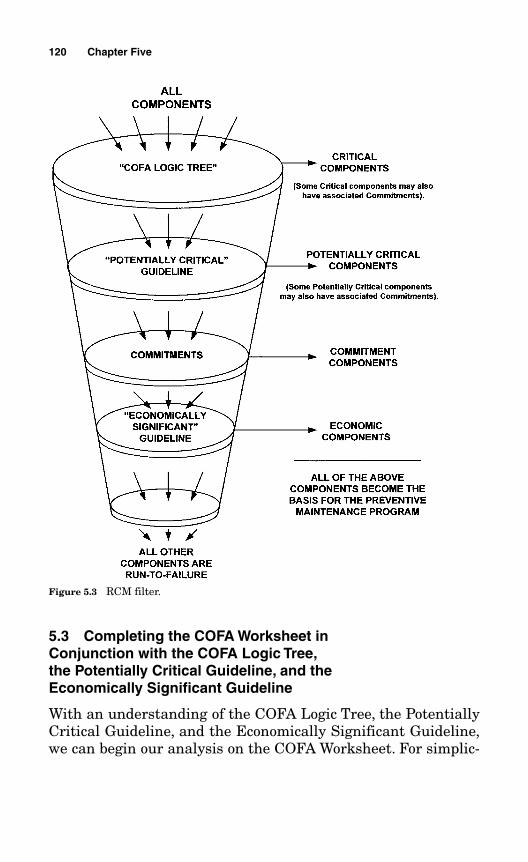
5.3 Completing the COFA Worksheet inConjunction with the COFA Logic Tree,the Potentially Critical Guideline, and theEconomically Significant Guideline
With an understanding of the COFA Logic Tree, the PotentiallyCritical Guideline, and the Economically Significant Guideline,we can begin our analysis on the COFA Worksheet. For simplic-
120 Chapter Five
Figure 5.3 RCM filter.
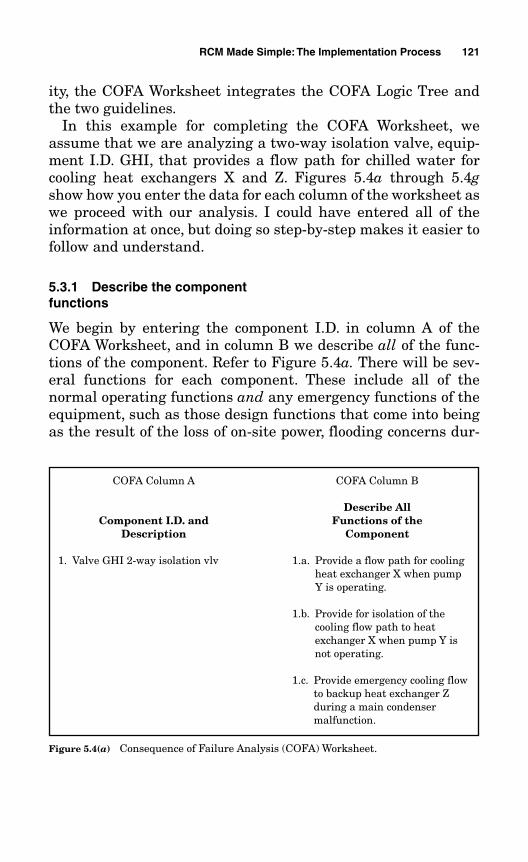
ity, the COFA Worksheet integrates the COFA Logic Tree andthe two guidelines.
In this example for completing the COFA Worksheet, weassume that we are analyzing a two-way isolation valve, equip-ment I.D. GHI, that provides a flow path for chilled water forcooling heat exchangers X and Z. Figures 5.4a through 5.4gshow how you enter the data for each column of the worksheet aswe proceed with our analysis. I could have entered all of theinformation at once, but doing so step-by-step makes it easier tofollow and understand.
5.3.1 Describe the componentfunctions
We begin by entering the component I.D. in column A of theCOFA Worksheet, and in column B we describe all of the func-tions of the component. Refer to Figure 5.4a. There will be sev-eral functions for each component. These include all of thenormal operating functions and any emergency functions of theequipment, such as those design functions that come into beingas the result of the loss of on-site power, flooding concerns dur-
RCM Made Simple:The Implementation Process 121
COFA Column A COFA Column B
Describe All Component I.D. and Functions of the
Description Component
1. Valve GHI 2-way isolation vlv 1.a. Provide a flow path for coolingheat exchanger X when pumpY is operating.
1.b. Provide for isolation of thecooling flow path to heatexchanger X when pump Y isnot operating.
1.c. Provide emergency cooling flowto backup heat exchanger Zduring a main condensermalfunction.
Figure 5.4(a) Consequence of Failure Analysis (COFA) Worksheet.
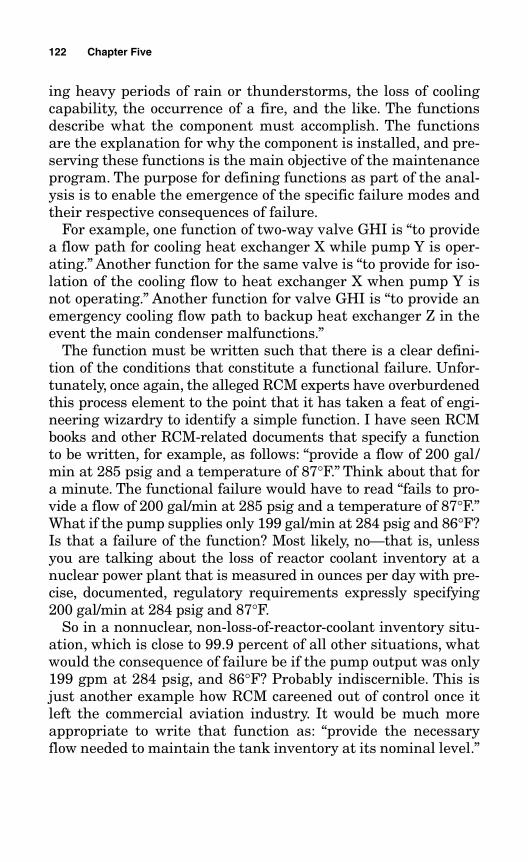
ing heavy periods of rain or thunderstorms, the loss of coolingcapability, the occurrence of a fire, and the like. The functionsdescribe what the component must accomplish. The functionsare the explanation for why the component is installed, and pre-serving these functions is the main objective of the maintenanceprogram. The purpose for defining functions as part of the anal-ysis is to enable the emergence of the specific failure modes andtheir respective consequences of failure.
For example, one function of two-way valve GHI is “to providea flow path for cooling heat exchanger X while pump Y is oper-ating.” Another function for the same valve is “to provide for iso-lation of the cooling flow to heat exchanger X when pump Y isnot operating.” Another function for valve GHI is “to provide anemergency cooling flow path to backup heat exchanger Z in theevent the main condenser malfunctions.”
The function must be written such that there is a clear defini-tion of the conditions that constitute a functional failure. Unfor-tunately, once again, the alleged RCM experts have overburdenedthis process element to the point that it has taken a feat of engi-neering wizardry to identify a simple function. I have seen RCMbooks and other RCM-related documents that specify a functionto be written, for example, as follows: “provide a flow of 200 gal/min at 285 psig and a temperature of 87°F.” Think about that fora minute. The functional failure would have to read “fails to pro-vide a flow of 200 gal/min at 285 psig and a temperature of 87°F.”What if the pump supplies only 199 gal/min at 284 psig and 86°F?Is that a failure of the function? Most likely, no—that is, unlessyou are talking about the loss of reactor coolant inventory at anuclear power plant that is measured in ounces per day with pre-cise, documented, regulatory requirements expressly specifying200 gal/min at 284 psig and 87°F.
So in a nonnuclear, non-loss-of-reactor-coolant inventory situ-ation, which is close to 99.9 percent of all other situations, whatwould the consequence of failure be if the pump output was only199 gpm at 284 psig, and 86°F? Probably indiscernible. This isjust another example how RCM careened out of control once itleft the commercial aviation industry. It would be much moreappropriate to write that function as: “provide the necessaryflow needed to maintain the tank inventory at its nominal level.”
122 Chapter Five
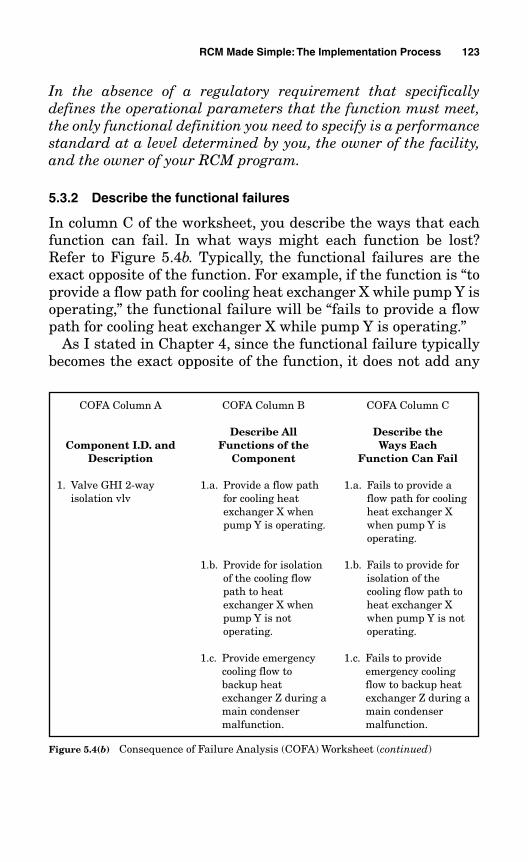
In the absence of a regulatory requirement that specificallydefines the operational parameters that the function must meet,the only functional definition you need to specify is a performancestandard at a level determined by you, the owner of the facility,and the owner of your RCM program.
5.3.2 Describe the functional failures
In column C of the worksheet, you describe the ways that eachfunction can fail. In what ways might each function be lost?Refer to Figure 5.4b. Typically, the functional failures are theexact opposite of the function. For example, if the function is “toprovide a flow path for cooling heat exchanger X while pump Y isoperating,” the functional failure will be “fails to provide a flowpath for cooling heat exchanger X while pump Y is operating.”
As I stated in Chapter 4, since the functional failure typicallybecomes the exact opposite of the function, it does not add any
RCM Made Simple:The Implementation Process 123
COFA Column A COFA Column B COFA Column C
Describe All Describe the Component I.D. and Functions of the Ways Each
Description Component Function Can Fail
Figure 5.4(b) Consequence of Failure Analysis (COFA) Worksheet (continued)
1. Valve GHI 2-wayisolation vlv
1.a. Provide a flow pathfor cooling heatexchanger X whenpump Y is operating.
1.b. Provide for isolationof the cooling flowpath to heatexchanger X whenpump Y is notoperating.
1.c. Provide emergencycooling flow tobackup heatexchanger Z during amain condensermalfunction.
1.a. Fails to provide aflow path for coolingheat exchanger Xwhen pump Y isoperating.
1.b. Fails to provide forisolation of thecooling flow path toheat exchanger Xwhen pump Y is notoperating.
1.c. Fails to provideemergency coolingflow to backup heatexchanger Z during amain condensermalfunction.
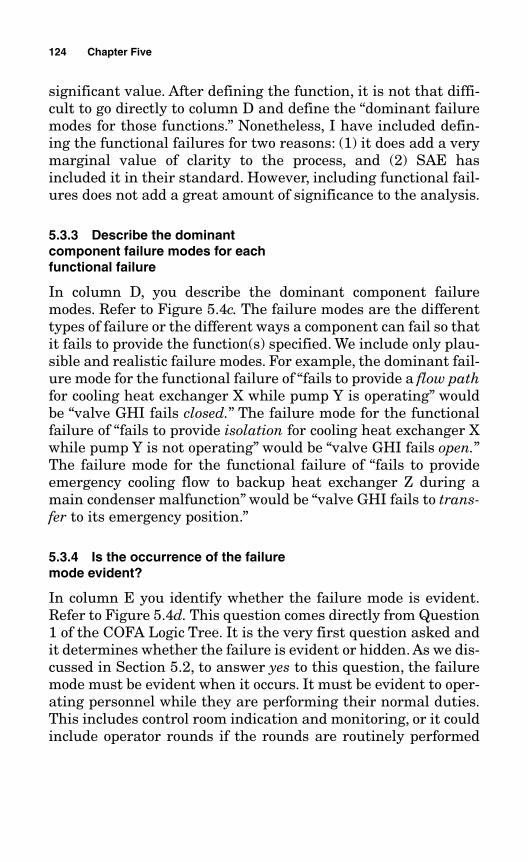
significant value. After defining the function, it is not that diffi-cult to go directly to column D and define the “dominant failuremodes for those functions.” Nonetheless, I have included defin-ing the functional failures for two reasons: (1) it does add a verymarginal value of clarity to the process, and (2) SAE hasincluded it in their standard. However, including functional fail-ures does not add a great amount of significance to the analysis.
5.3.3 Describe the dominantcomponent failure modes for eachfunctional failure
In column D, you describe the dominant component failuremodes. Refer to Figure 5.4c. The failure modes are the differenttypes of failure or the different ways a component can fail so thatit fails to provide the function(s) specified. We include only plau-sible and realistic failure modes. For example, the dominant fail-ure mode for the functional failure of “fails to provide a flow pathfor cooling heat exchanger X while pump Y is operating” wouldbe “valve GHI fails closed.” The failure mode for the functionalfailure of “fails to provide isolation for cooling heat exchanger Xwhile pump Y is not operating” would be “valve GHI fails open.”The failure mode for the functional failure of “fails to provideemergency cooling flow to backup heat exchanger Z during amain condenser malfunction” would be “valve GHI fails to trans-fer to its emergency position.”
5.3.4 Is the occurrence of the failuremode evident?
In column E you identify whether the failure mode is evident.Refer to Figure 5.4d. This question comes directly from Question1 of the COFA Logic Tree. It is the very first question asked andit determines whether the failure is evident or hidden. As we dis-cussed in Section 5.2, to answer yes to this question, the failuremode must be evident when it occurs. It must be evident to oper-ating personnel while they are performing their normal duties.This includes control room indication and monitoring, or it couldinclude operator rounds if the rounds are routinely performed
124 Chapter Five
125
Figure 5.4(c) Consequence of Failure Analysis (COFA) Worksheet (continued).
COFA Column A COFA Column B COFA Column C COFA Column D
Describe the DominantDescribe All Describe the Component Failure
Component I.D. and Functions of the Ways Each Modes for Each Description Component Function Can Fail Functional Failure
1. Valve GHI 2-way isolationvlv
1.a. Provide a flow path forcooling heat exchanger Xwhen pump Y is operating.
1.b. Provide for isolation of thecooling flow path to heatexchanger X when pump Yis not operating.
1.c. Provide emergency coolingflow to backup heatexchanger Z during a maincondenser malfunction.
1.a. Fails to provide a flowpath for cooling heatexchanger X when pump Yis operating.
1.b. Fails to provide for isola-tion of the cooling flowpath to heat exchanger Xwhen pump Y is not oper-ating.
1.c. Fails to provide emergencycooling flow to backup heatexchanger Z during a maincondenser malfunction.
1.a. Valve fails closed.
1.b. Valve fails open.
1.c. Valve fails to transfer tothe emergency position.
and formally proceduralized. During the operation of your facil-ity, sometimes the valve might be in the open position and othertimes it might be closed, depending on the operating parame-ters, but as long as the different valve positions are part of theroutine monitoring and operating evolutions, the valve’s failurewill be evident. If any failure mode is not evident to the operat-ing personnel, it is a hidden failure mode.
5.3.5 Describe the system effect foreach failure mode
What are the failure effects at the system level? In column F weidentify the system effects. Refer to Figure 5.4e. This is really anintermediate point of information because our ultimate goal is toidentify the consequence of failure at the plant or facility level.System-level effects are included, nevertheless, as an informa-tional element because they make the identification of the planteffects a little bit more clear. Oftentimes the failure does notresult in any significant system effect, but there may be a regu-latory requirement for its continuous operability and the failuremay indeed result in a critical effect at the plant level.
Also keep in mind that all hidden failures have no system effect.By definition, “when a component is required to perform its func-tion and the occurrence of the failure is not evident to the operat-ing personnel, i.e., . . . the immediate overall operation of thesystem remains unaffected in either the normal or the demandmode of operation, then the failure is defined as being hidden.”One system effect that might be described even though the failureis hidden is the “loss of redundancy,” and the hidden failure result-ing in the loss of redundancy would most likely become poten-tially critical as a consequence of failure at the plant level.
Remember, too, that if a system is not normally operating, as itwould not be in a safety system or a safety function, it is ana-lyzed as though it is in its operating mode. Therefore, failuremode 1.c. is not hidden because it would be quite obvious if valveGHI failed to move to the emergency position when called uponto function.
System effect 1.a. delineates that “heat exchanger X will notprovide cooling for pump Y, causing the pump to overheat.” The
126 Chapter Five
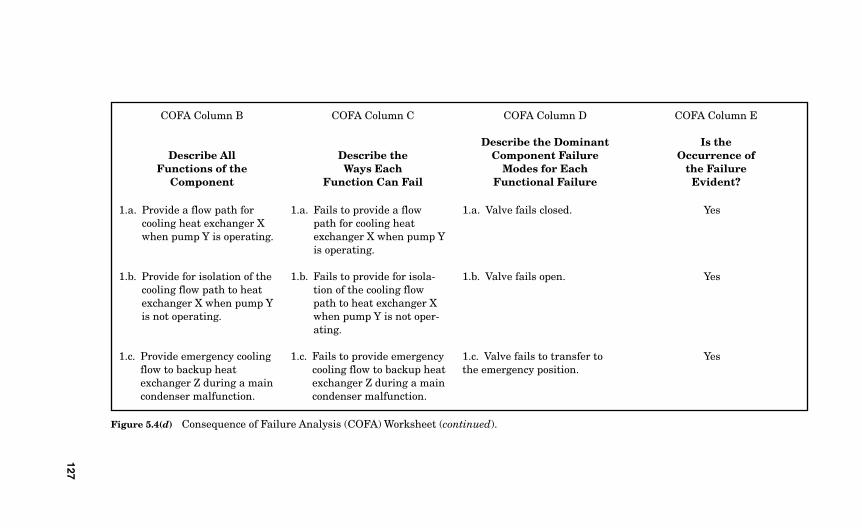
127
Figure 5.4(d) Consequence of Failure Analysis (COFA) Worksheet (continued).
COFA Column B COFA Column C COFA Column D COFA Column E
Describe the Dominant Is theDescribe All Describe the Component Failure Occurrence of
Functions of the Ways Each Modes for Each the FailureComponent Function Can Fail Functional Failure Evident?
1.a. Provide a flow path forcooling heat exchanger Xwhen pump Y is operating.
1.b. Provide for isolation of thecooling flow path to heatexchanger X when pump Yis not operating.
1.c. Provide emergency coolingflow to backup heatexchanger Z during a maincondenser malfunction.
1.a. Fails to provide a flowpath for cooling heatexchanger X when pump Yis operating.
1.b. Fails to provide for isola-tion of the cooling flowpath to heat exchanger Xwhen pump Y is not oper-ating.
1.c. Fails to provide emergencycooling flow to backup heatexchanger Z during a maincondenser malfunction.
1.a. Valve fails closed.
1.b. Valve fails open.
1.c. Valve fails to transfer tothe emergency position.
Yes
Yes
Yes
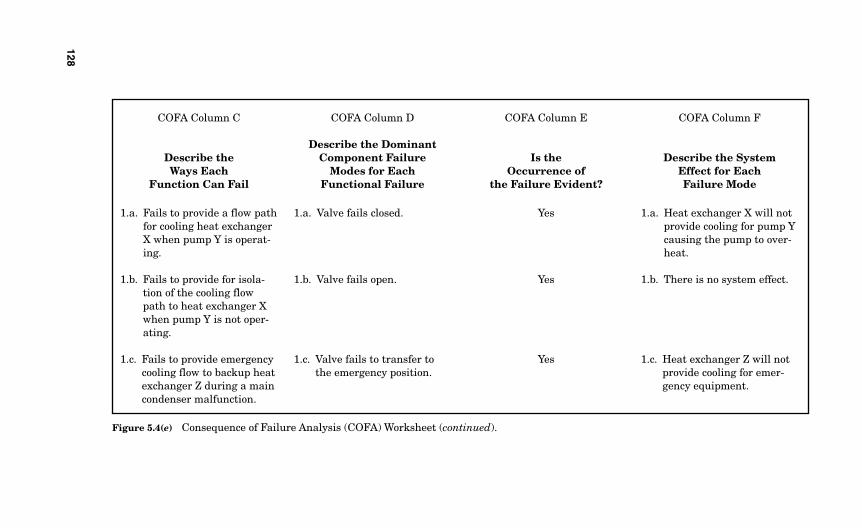
128
Figure 5.4(e) Consequence of Failure Analysis (COFA) Worksheet (continued).
1.a. Fails to provide a flow pathfor cooling heat exchangerX when pump Y is operat-ing.
1.b. Fails to provide for isola-tion of the cooling flowpath to heat exchanger Xwhen pump Y is not oper-ating.
1.c. Fails to provide emergencycooling flow to backup heatexchanger Z during a maincondenser malfunction.
1.a. Valve fails closed.
1.b. Valve fails open.
1.c. Valve fails to transfer tothe emergency position.
Yes
Yes
Yes
1.a. Heat exchanger X will notprovide cooling for pump Ycausing the pump to over-heat.
1.b. There is no system effect.
1.c. Heat exchanger Z will notprovide cooling for emer-gency equipment.
COFA Column C
Describe the Ways Each
Function Can Fail
COFA Column D
Describe the DominantComponent Failure
Modes for Each Functional Failure
COFA Column E
Is the Occurrence of
the Failure Evident?
COFA Column F
Describe the System Effect for Each Failure Mode
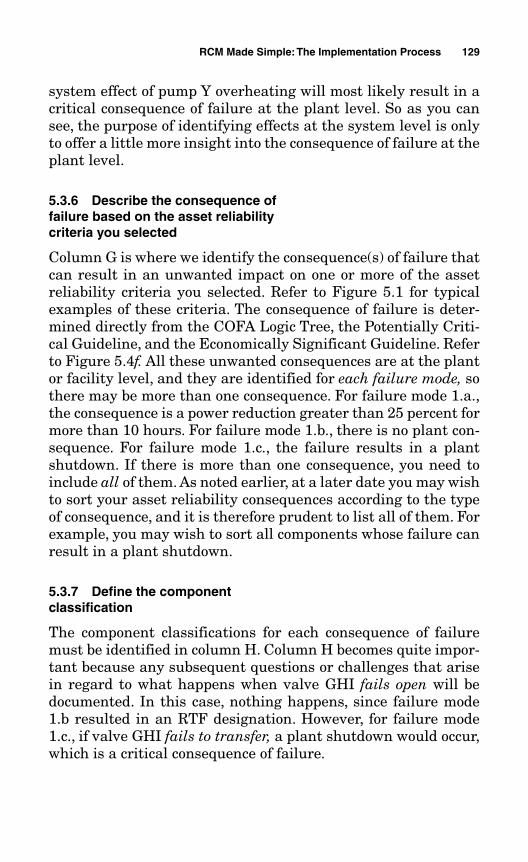
system effect of pump Y overheating will most likely result in acritical consequence of failure at the plant level. So as you cansee, the purpose of identifying effects at the system level is onlyto offer a little more insight into the consequence of failure at theplant level.
5.3.6 Describe the consequence offailure based on the asset reliabilitycriteria you selected
Column G is where we identify the consequence(s) of failure thatcan result in an unwanted impact on one or more of the assetreliability criteria you selected. Refer to Figure 5.1 for typicalexamples of these criteria. The consequence of failure is deter-mined directly from the COFA Logic Tree, the Potentially Criti-cal Guideline, and the Economically Significant Guideline. Referto Figure 5.4f. All these unwanted consequences are at the plantor facility level, and they are identified for each failure mode, sothere may be more than one consequence. For failure mode 1.a.,the consequence is a power reduction greater than 25 percent formore than 10 hours. For failure mode 1.b., there is no plant con-sequence. For failure mode 1.c., the failure results in a plantshutdown. If there is more than one consequence, you need toinclude all of them. As noted earlier, at a later date you may wishto sort your asset reliability consequences according to the typeof consequence, and it is therefore prudent to list all of them. Forexample, you may wish to sort all components whose failure canresult in a plant shutdown.
5.3.7 Define the componentclassification
The component classifications for each consequence of failuremust be identified in column H. Column H becomes quite impor-tant because any subsequent questions or challenges that arisein regard to what happens when valve GHI fails open will bedocumented. In this case, nothing happens, since failure mode1.b resulted in an RTF designation. However, for failure mode1.c., if valve GHI fails to transfer, a plant shutdown would occur,which is a critical consequence of failure.
RCM Made Simple:The Implementation Process 129
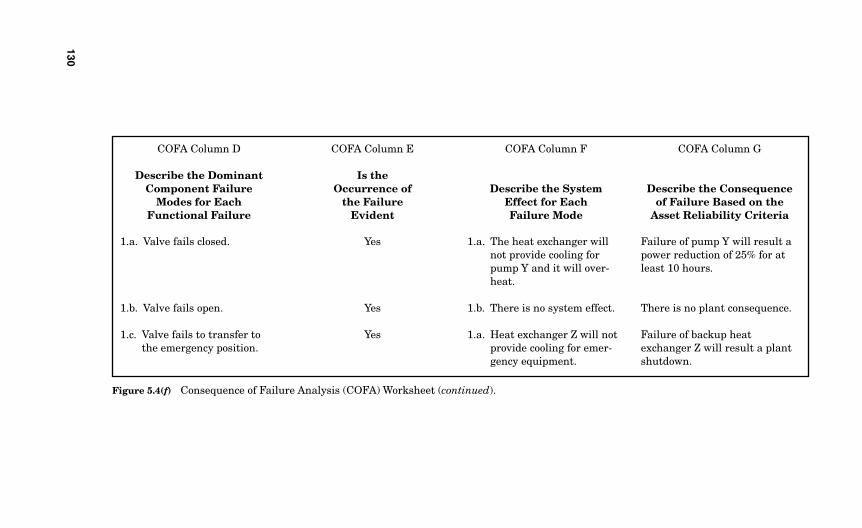
130
Figure 5.4(f) Consequence of Failure Analysis (COFA) Worksheet (continued).
1.a. Valve fails closed.
1.b. Valve fails open.
1.c. Valve fails to transfer tothe emergency position.
Yes
Yes
Yes
1.a. The heat exchanger willnot provide cooling forpump Y and it will over-heat.
1.b. There is no system effect.
1.a. Heat exchanger Z will notprovide cooling for emer-gency equipment.
Failure of pump Y will result apower reduction of 25% for atleast 10 hours.
There is no plant consequence.
Failure of backup heatexchanger Z will result a plantshutdown.
COFA Column D
Describe the DominantComponent Failure
Modes for Each Functional Failure
COFA Column E
Is the Occurrence of
the Failure Evident
COFA Column F
Describe the System Effect for Each Failure Mode
COFA Column G
Describe the Consequenceof Failure Based on the
Asset Reliability Criteria
Once again, you will have several different classifications forthe same component, ranging from critical to run-to-failure. Thefinal component classification always defaults to the highestlevel—that is, critical, potentially critical, commitment, or eco-nomic. Refer to Figure 5.4g. In this example, component GHI isclassified as critical for two reasons: a power reduction and aplant shutdown. Even though a plant shutdown is more seriousthan a power reduction, I would include both consequences andclassify valve GHI as critical due to a plant shutdown or a powerreduction greater than 25 percent.
This completes the first part of the RCM journey and illus-trates what RCM is all about: identifying the population ofequipment whose failures can result in a negative impact on anyof the asset reliability criteria you select. Your entire PM pro-gram will be focused on selecting applicable and effective PMtasks to prevent, eliminate, or mitigate failures of this popula-tion of equipment. It took a while to get to this point, and every-thing in the analysis thus far has been to drive us to identifythese components so that their failures can be subjected to a pre-ventive maintenance strategy.
This is phase 1 of the three phases of an RCM program, whichyou learned about in Chapter 3. Phase 2 includes the process ofspecifying the applicable and effective PM tasks for this popula-tion of equipment. I discuss the PM task strategies in Chapter 6.
5.4 RCM Serves as a Translation of the Design Objectives
RCM can be viewed, in a pure vision, as a translation of thedesign functions of a component into the operating objectives ofthe facility via a reliability program. Each component has a spe-cific design function that must reliably meet the larger purpose,which is the operating objective of the plant. Each individualcomponent must function properly within its respective systemto ensure that the plant meets its ultimate design objective. Thepreventive maintenance program is the means by which thisobjective is achieved.
RCM Made Simple:The Implementation Process 131
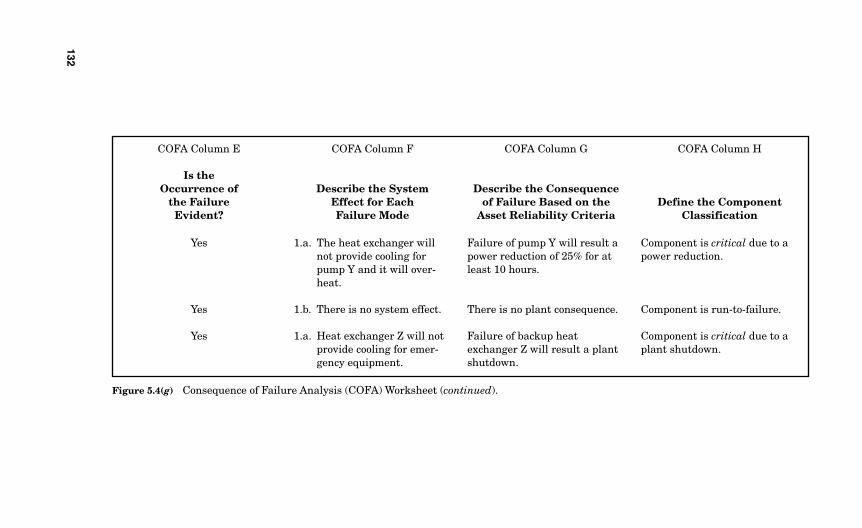
Figure 5.4(g) Consequence of Failure Analysis (COFA) Worksheet (continued).
Yes
Yes
Yes
1.a. The heat exchanger willnot provide cooling forpump Y and it will over-heat.
1.b. There is no system effect.
1.a. Heat exchanger Z will notprovide cooling for emer-gency equipment.
Failure of pump Y will result apower reduction of 25% for atleast 10 hours.
There is no plant consequence.
Failure of backup heatexchanger Z will result a plantshutdown.
Component is critical due to apower reduction.
Component is run-to-failure.
Component is critical due to aplant shutdown.
COFA Column E
Is the Occurrence of
the Failure Evident?
COFA Column F
Describe the System Effect for Each Failure Mode
COFA Column G
Describe the Consequenceof Failure Based on the
Asset Reliability Criteria
COFA Column H
Define the ComponentClassification
132
5.5 Companion Equipment
An important check and balance for the RCM logic is to ensurethat any companion equipment is also carefully analyzed. Iregard companion equipment as those components associatedwith a critical or potentially critical component. Companionequipment could include an inlet or discharge check valve, acomponent providing an input signal, or a component that sup-ports one of the functions of the critical or potentially criticalcomponent. It could even be a component as innocuous as asteam trap that supports moisture drainage for the critical orpotentially critical component.
These companion equipment components should already havebeen independently analyzed themselves as either critical orpotentially critical. However, when viewed as companion equip-ment, it is more likely that they will not inadvertently be over-looked. Since all components are analyzed regardless, it is a goodcheck to be sure that those components associated with a criticalor potentially critical component are also analyzed appropriately.
A typical example of a real-life situation again illustrates theimportance of companion equipment. In a specific feedwater sys-tem, one of the feedwater pumps is driven by a steam turbine.The turbine and all associated components were identified ascritical in the analysis. In a typical steam supply, there may beseveral hundred individual steam traps for controlled removal ofaccumulated moisture. Associated with the feedwater turbine, itwas identified that failure of two of the rather innocuous steamtraps could allow water to accumulate to the point of intrusioninto the inlet to the feedwater turbine.
If this should occur, a slug of water will instantaneously slowthe turbine down until it passes through, hopefully withoutdamaging the impeller blades. However, slowing the turbine,even momentarily, engages the very sensitive turbine speed con-trol function, causing the turbine to speed up to maintain itsrequired RPM. Once the water slug no longer exists, the turbinenow is in an overspeed condition, and when sensed by the speedcontrol, it causes the turbine to shut down, also shutting downthat supply of feedwater flow. Thus, these two steam traps con-stitute companion equipment. Not only were they classified as
RCM Made Simple:The Implementation Process 133
134 Chapter Five
critical, but a design change was implemented to prevent thesame situation from occurring in the future.
5.6 The SAE Standard: DocumentJA1011
The Society of Automotive Engineers (SAE) developed a stan-dard that entitles a process to be called an RCM process. Themain reason for this was that the RCM terminology was beingapplied to a multitude of PM program enhancements that hadno technical basis or logic and were not systematically devel-oped. They were a conglomeration of PM betterment efforts, orPM review efforts, or PM program updates, which were improp-erly described under the guise of RCM. The SAE wanted toensure the isolation of these other, rather arbitrary, efforts fromthe more defined and thorough approach of specifically applyingRCM logic. As a result, they issued a fundamental standard thathad to be met in order to call the maintenance program processan RCM process.
The SAE Standard for RCM as delineated in the organiza-tion’s Document JA1011 includes the following seven basicquestions:
Question 1. What are the functions of the asset?
Question 2. What are the functional failures?
Question 3. What are the failure modes?
Question 4. What are the failure effects?
Question 5. What are the failure consequences?
Question 6. What are the PM tasks?
Question 7.What must be done if a PM task cannot be specified?
Every step in the COFA logic of RCM Implementation MadeSimple is in concert with, and is in many aspects more advancedthan, the SAE Standard for RCM. Five of the seven steps in theSAE Standard are covered by the COFA. The remaining twosteps in the SAE Standard include specifying preventive mainte-nance tasks and identifying the default actions if an applicable
and effective task cannot be identified. These two steps are cov-ered in Chapter 6. The SAE Standard also mentions two “remain-ing issues,” as they are referred to in that standard. These tworemaining issues pertain to determining task intervals andestablishing a continuous review of the RCM process. The taskintervals are covered in Chapter 6, and the continuous RCMreview process is covered in Chapter 8.
5.7 A Real-Life Analysis: Averting a Potentially Devastating Plant Consequence
Figure 5.5 is a typical schematic for a service water system. Ser-vice water by itself would most likely be a discarded systemaccording to most RCM programs and RCM “consultants.” The80/20 truncated RCM rule, whereby 80 percent of the plant isomitted from consideration and only 20 percent is analyzed, andthe other streamlined versions of RCM would probably neverlook at the components in this system. How wrong that wouldbe. Any RCM program that would not consider analyzing thissystem would miss a major plant consequence. A very significantfinding in a real-life RCM analysis was identified in this system,and that is precisely the reason I am using this real-life examplethat we will analyze together. I briefly reviewed this scenario inChapter 1, but now let’s take a closer look at it with a deeperunderstanding of what we have learned since Chapter 1 andapply our RCM analysis skills.
The service water system receives its normal service watersupply from the local city water district. The system also has twoservice water pumps that can supply service water from analternate storage tank if the city water supply should undergorepairs and be unavailable as a water source. The majority ofcomponents in this system operate to supply service water tolavatories, drinking fountains, and other relatively unimportantand noncritical functions, except for one very critical function.
The entire service water flow path extends to several addi-tional drawings, so for clarity I have redrawn and simplifiedthis flow path, which is shown in Figure 5.6. Let’s commenceour analysis with a rather innocuous check valve located in the
RCM Made Simple:The Implementation Process 135
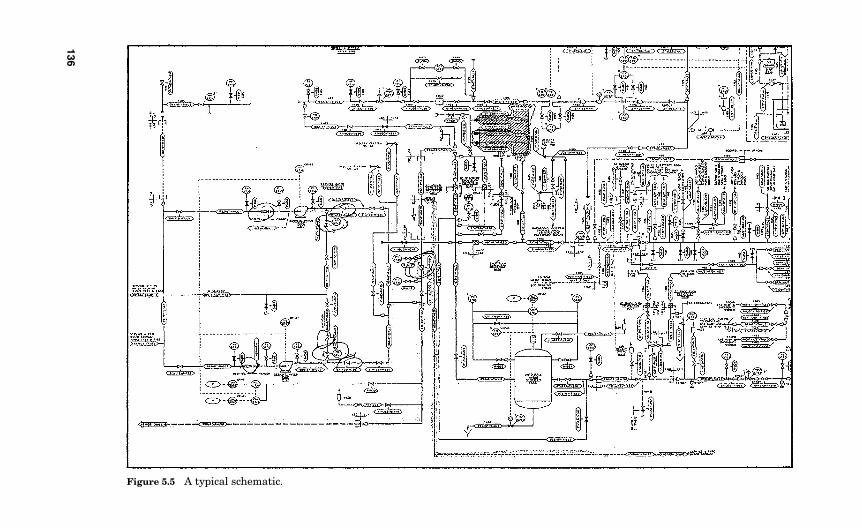
136
Figure 5.5 A typical schematic.
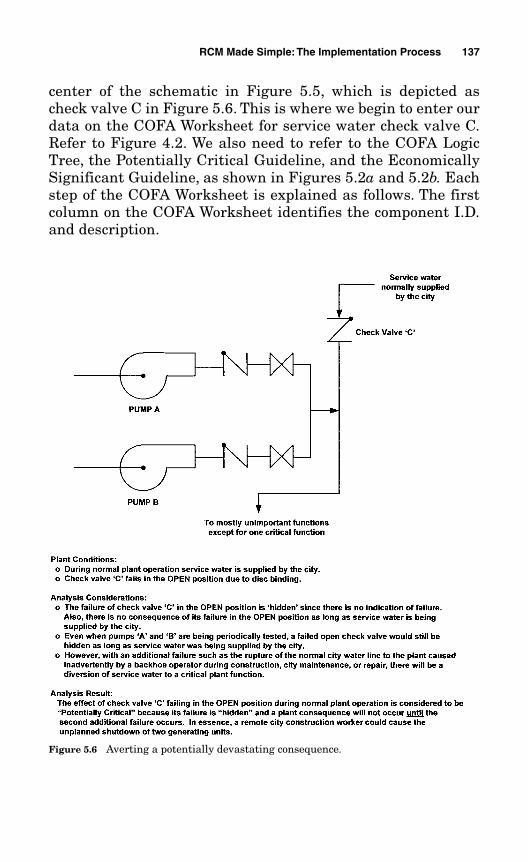
center of the schematic in Figure 5.5, which is depicted ascheck valve C in Figure 5.6. This is where we begin to enter ourdata on the COFA Worksheet for service water check valve C.Refer to Figure 4.2. We also need to refer to the COFA LogicTree, the Potentially Critical Guideline, and the EconomicallySignificant Guideline, as shown in Figures 5.2a and 5.2b. Eachstep of the COFA Worksheet is explained as follows. The firstcolumn on the COFA Worksheet identifies the component I.D.and description.
RCM Made Simple:The Implementation Process 137
Figure 5.6 Averting a potentially devastating consequence.
Component I.D. and description.Valve I.D.: CService Water SystemCheck Valve
In column B of the COFA we describe all functions of the com-ponent.
Describe all functions of the component.1. Provide a flow path from the city water supply to the ser-
vice water system to provide service water to the lavatoriesand drinking fountains and to the bearings of the circulat-ing water pumps.
2. Provide isolation from the service water system when thecity water supply is unavailable.
In column C of the COFA we describe the ways that each func-tion can fail.
Describe the ways that each function can fail.1. Fails to provide a flow path from the city water supply to
the service water system to provide service water to thelavatories and drinking fountains and to the bearings of allcirculating water pumps.
2. Fails to provide isolation from the service water systemwhen the city water supply is unavailable and the servicewater pumps are in operation.
In column D of the COFA we describe the dominant failuremodes for each functional failure.
Describe the dominant component failure modes for each func-tional failure.1. Check valve fails closed.2. Check valve fails open.
In column E we determine whether the occurrence of the failureis evident. Refer to the COFA Logic Tree in Figure 5.2a.
138 Chapter Five
Is the occurrence of the failure mode evident?1. The occurrence of the check valve failing closed will be evi-
dent by low flow instrumentation in the control room.2. The check valve failing open will not be evident. It will be
hidden because as long as the city water supply is provid-ing the flow of water, the check valve failing in the openposition will not be evident. There is no indication of failureand there is no system operating consequence if the valvefails open. Even when pumps A and B are periodically run,the failed open check valve would still not be evident aslong as service water pressure was available from the citywater supply.
In column F we describe the system effect for each failure mode.
Describe the system effect for each failure mode.1. If the check valve fails closed, it will be evident and the ser-
vice water pumps will be available to supply the servicewater; therefore, there is no system effect.
2. If the check valve fails open, it is hidden but there is no sys-tem effect as long as service water continues to be suppliedby the city water system.
In column G we describe the consequence of failure based on theasset criteria specified. Refer to the COFA logic and PotentiallyCritical Guideline in Figures 5.2a and 5.2b.
Describe the consequence of failure based on the asset reliabil-ity criteria specified (refer to the COFA Logic Tree).1. Per the COFA Logic Tree, there is no safety, operability, or
economic consequence of failure. Therefore, based on fail-ure mode 1, this is a run-to-failure component.
2. The failure is hidden and per the COFA Logic Tree, we aredirected to the Potentially Critical Guideline, which asks,“Can the component failure, in combination with an addi-tional failure or initiating event, result in an unwantedconsequence that has a direct adverse effect on one or moreof the asset reliability criteria?”
RCM Made Simple:The Implementation Process 139
Let’s find out the answer to this question. With check valveC failed in the open position, we determined that therewould be no system effect because the service water wouldalways be supplied by either the city or the service waterpumps via the alternate service water tank.
However, what would happen if there was an additionalfailure, such as a rupture of the city waterline? This couldeasily happen if a worker on a construction crew or a cityemployee working for the municipality itself were operat-ing a backhoe and inadvertently ruptured the city watersupply line to the plant. Looking at the simplified schematicin Figure 5.6, the two service water pumps would start, butthere would be a diversion of service water flow from thepumps through the failed open check valve. This in turnwould result in the loss of bearing seal water to all of thecirculating water pumps of both units. Therefore, the con-sequence of that additional second failure in combinationwith the failed open check valve would be a dual unit shut-down! The answer to the question in the Potentially CriticalGuideline is emphatically yes! The answer to the question incolumn G is a dual unit shutdown of two generating unitssimultaneously!
This true scenario shows how a rather innocuous compo-nent, whose failure was hidden, making it even moreinnocuous, has the potential to cause a serious conse-quence. This also illustrates how the same component canhave one failure mode that would be classified as run-to-failure, but its other failure mode is potentially critical.
In column H we define the component classification.
Describe the component classification.
The component is classified as potentially critical due to apossible simultaneous dual unit shutdown.
Obviously, this was a disaster waiting to happen. As long as anincompetent backhoe operator never ruptured the city waterlinewhile check valve C was failed open, this devastating eventwould not happen and no one would ever recognize this vulnera-
140 Chapter Five
bility. But just imagine if the city waterline was inadvertentlyruptured while check valve C was failed open in its sleeper cellmode. As I mentioned several times in previous chapters, it isnot the obvious that causes the greatest disasters; it is thenonobvious! And it is usually only a matter of time before Mur-phy’s Law takes effect.
If this calamity had occurred, it would have attracted theinterest and inquisitiveness of the CEO, the maintenance super-visor, and everyone under him or her, who would have to explainthe occurrence. A root-cause evaluation, probably no less than 6 inches thick, entailing hundreds of labor-hours to prepare,would appear most expeditiously.
This true-life example also highlights the importance of theconcept of potentially critical components. Most RCM programswould not have identified this vulnerability. Finding this vulner-ability and establishing a preventive maintenance strategy orpossibly implementing a design change before the consequenceoccurs is what RCM Implementation Made Simple is all about!
5.8 Why Streamlined RCM Methods Are Not Recommended
The case of the service water check valve analyzed here is just atypical example. If you are going to expend effort to enhanceyour preventive maintenance program, why settle for only amarginal improvement when basically the same effort couldreap a maximum enhancement? Preventing a dual unit shut-down, in itself, would be reason enough not to pursue stream-lined versions that would have virtually no chance of findingthat vulnerability. There are many more of these situations justwaiting to happen. Some of the common adaptations of stream-lined RCM are Total Productive Maintenance (TPM), Reliability-Based Maintenance (RBM), Probabilistic Safety Analysis (PSA)Based Maintenance, and the 80/20 Rule. These are acceptable ifyou want to accept major risks and do not want to ferret out thetrue vulnerabilities of your facility. Let’s briefly look at the gen-eral characteristics of each one; the shortcomings will becomeobvious.
RCM Made Simple:The Implementation Process 141
5.8.1 Total productive maintenance (TPM)
This streamlined version includes ownership teams comprisingrepresentatives from operations, maintenance, and engineering.These teams determine what equipment gets worked on andwhen it gets scheduled. Comprehensive adherence to any formalanalysis logic is missing. This is a form of best-guess mainte-nance. Granted, some team members may have significant expe-rience with some of the equipment, but that is as thorough andaccurate as it gets.
5.8.2 Reliability-based maintenance (RBM)
This version starts with an assessment of the current PM pro-gram, and some maintenance visualization is made of what thePM program should look like in the future. Then RCM isemployed on a hit-or-miss basis on the components that werepart of the visualization.
5.8.3 Probabilistic safety analysis(PSA) based maintenance
This adaptation employs probabilistic methods usually associ-ated with a specific safety significance. Typical operability con-sequences and personnel safety issues are not normally includedin the PSA model. That is the extent of the rigor. As an example,PSA is used primarily to determine the probability of a coremelting down, which is an extremely important safety consider-ation in a nuclear environment. But the robustness of PSA to theremaining components and systems not directly associated witha core meltdown is absent.
5.8.4 80/20 rule
This rule is definitely high risk. Vying for this option of stream-lining your program is not even RCM in its most remote sense.This is where 80 percent of the plant is ignored and only 20 per-cent of the plant is analyzed because the proponents of this ver-
142 Chapter Five
sion believe only 20 percent of the plant is important enough tobe evaluated. I liken this to buying car insurance that insuresyou only while you are driving 65 mph on a freeway or while youare driving in heavy traffic, when an accident is most likely tooccur. You would not be insured driving on country roads, or driv-ing slowly through your neighborhood to and from work, or driv-ing on any nonbusy roads because it is assumed you would nothave an accident under these conditions. You would assume therisk of having no insurance coverage during these times. Doesthat sound comforting?
Many people think that as long as they use the proper RCMlogic somewhere in their analysis, they can streamline even theclassical version of RCM, whether that classical approachstarted at the system level or at the component level. That is notRCM, rather, it is a pick-and-choose approach involving only thesystems or components they want to analyze.
I believe that the streamlined versions of RCM only reinforcewhat is already known. Every facility has its “known” problemsystems and problem components for which failures can resultin undesirable plant consequences. The identification of thisequipment population does not require much insight. Experi-ence has already seen to that.
It is also my personal belief that in addition to being attunedto the known problem systems and problem components, plantreliability and safety are directly related to the vulnerabilitiesthat have NOT yet been identified because the failure conse-quences surrounding those vulnerabilities have not yet occurred.Streamlined versions of the RCM process will most likely resultin those plant vulnerabilities remaining unidentified until . . .
RCM Implementation Made Simple is all about finding thosevulnerabilities before they occur and result in an unwanted con-sequence of failure.
5.9 Chapter Summary
Once again, we covered a lot in this chapter, but in a very logical,straightforward manner, so let’s review the highlights. Refer toFigures 5.7a and 5.7b.
RCM Made Simple:The Implementation Process 143
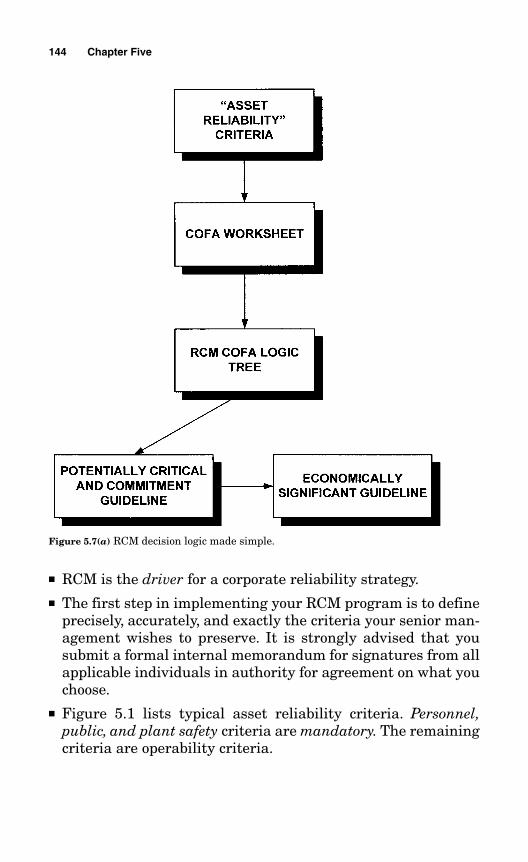
■ RCM is the driver for a corporate reliability strategy.■ The first step in implementing your RCM program is to define
precisely, accurately, and exactly the criteria your senior man-agement wishes to preserve. It is strongly advised that yousubmit a formal internal memorandum for signatures from allapplicable individuals in authority for agreement on what youchoose.
■ Figure 5.1 lists typical asset reliability criteria. Personnel,public, and plant safety criteria are mandatory. The remainingcriteria are operability criteria.
144 Chapter Five
Figure 5.7(a) RCM decision logic made simple.
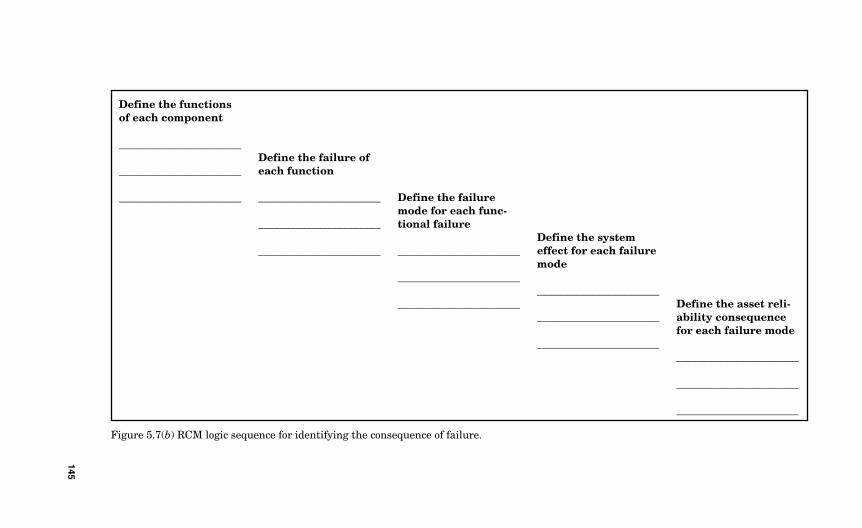
145
Figure 5.7(b) RCM logic sequence for identifying the consequence of failure.
Define the functionsof each component
_______________________
_______________________
_______________________
Define the failure ofeach function
_______________________
_______________________
_______________________
Define the failuremode for each func-tional failure
_______________________
_______________________
_______________________
Define the systemeffect for each failuremode
_______________________
_______________________
_______________________
Define the asset reli-ability consequencefor each failure mode
_______________________
_______________________
_______________________
■ It is perfectly acceptable to place qualifying conditions on thecriteria you select, such as a production or an assembly-lineinterruption with a duration of no more than 15 minutes, or 30 minutes, or 1 hour, or a power reduction of no more than 1percent, 5 percent, or 10 percent. Any qualifying conditionsyou choose should also have the buy-in of senior management.
■ Your PM program will consist of components classified as eithercritical safety or operability, potentially critical safety or oper-ability, commitment, or economic.
■ The RCM COFA Logic Tree is truly RCM ImplementationMade Simple. A complex logic process has been simplified toits basic elements while enhancing its thoroughness, accuracy,and clarity.
■ The Potentially Critical Guideline and the Economically Sig-nificant Guideline are integrated with the COFA Logic Tree tomaintain the simplicity for identifying hidden failure conse-quences and purely economic consequences.
■ The COFA Worksheet begins by describing all functions of thecomponent.
■ There is a functional failure corresponding to each function ofthe component.
■ There is a failure mode corresponding to each functional fail-ure. A component will have an associated failure mode for eachdifferent functional failure.
■ The failure modes are those that are dominant, or most likelyto occur. They do not include implausible or unrealistic failuremodes. Failure modes are the types of failure or the ways acomponent can fail. Failure modes would include, for example,“valve fails closed,” “valve fails open,” “switch fails to actuate,”“switch actuates prematurely,” or “pump fails to start.”
■ There is not a system effect for every failure mode.■ There is not an unwanted consequence for every failure mode.■ A component with a failure mode that results in an unwanted
consequence is classified as either critical, potentially critical,commitment, or economic.
146 Chapter Five
■ RCM translates the design functions of a component into theoperating objectives of the facility via a reliability program.
■ RCM Implementation Made Simple is in total concert with,and in many aspects is more advanced than, the SAE Stan-dard for RCM as delineated in SAE Document JA1011.
■ Streamlined versions of RCM fall far short of being suffi-ciently robust and comprehensive to identify the real vulnera-bilities of your plant or facility. Plant reliability and safety arerelated to the vulnerabilities that have not yet been identifiedbecause the failure consequences surrounding those vulnera-bilities have not yet occurred.
5.10 RCM Made “Difficult”
Now that’s an odd subsection, you might be thinking to your-self. It is. Nonetheless, in Chapter 3 I mentioned that I wouldinclude the old-fashioned way of developing an RCM programfor those readers who would prefer using the FMEA format toidentify functions at the system level and establish boundariesand interfaces that are a required part of the analysis if youchoose to identify system functions rather than componentfunctions using the COFA format. Either way is correct. How-ever, it is much more difficult and requires much more RCMexpertise to define system boundaries, interfaces, and func-tions at the system and subsystem level. If you have thatexpertise, the more difficult method of RCM may be appropri-ate for you.
The differences between the two methods are analogous to thefollowing scenarios. Some individuals prefer to use the old-fashioned slide rule rather than an electronic calculator. There isnothing wrong with using a slide rule; after all, it was in voguefor many, many years. Even though you have to manually decidewhere the decimal point goes and you have to keep flipping itover to arrive at an integer, it is an acceptable method to use.Similarly, some people feel more comfortable using an old-fashioned plug-in phone. They prefer knowing that the cord isattached. Others, however, have progressed to cordless cellphones. Either phone works just fine, though.
RCM Made Simple:The Implementation Process 147
Regardless of whether you choose the old-fashioned method ofclassical RCM or the simple method of classical RCM, there areno shortcuts allowed. The streamlined versions whereby youpick and choose specific systems or components to analyze arenot sanctioned in either case.
For those readers who want to stick with the FMEA format,developing your classical RCM program must include the follow-ing steps:
5.10.1 Determine system boundaries
The plant must be divided into discrete but arbitrary systems,which includes marking the plant P&IDs accordingly. The arbi-trary boundary envelops the entire system and is shown on theP&IDs. The boundary of a system must include everything nec-essary for the system to accomplish its function.
The system boundary points are noted on the respectiveP&IDs and are then identified on the interface sheets. Boundarydemarcations are drawn such that the controlled componentsand their associated controllers and instrumentation are withinthe system boundary. Boundaries are usually drawn at a valve,with the valve included as part of the system being analyzed, ifits function is for isolation of the system. There are nominallyseveral dozen arbitrary boundary points that must be identifiedfor each system to enclose that discrete system. Sometimesboundaries are extended beyond that shown on a given drawingto include components that are integral to the system logic. Allcomponents within the system boundary are included as part ofthe database for that specific system. A component can reside inonly one system.
5.10.2 Determine subsystemboundaries
Plant systems are frequently composed of a large number ofcomponents that serve a variety of functions to support the totaloperation of the system. Partitioning into subsystems refers toestablishing groupings of components that are related to per-
148 Chapter Five
forming a particular function within the system. All instru-ments and components that are necessary for the subsystem toperform its function are included within the subsystem bound-ary. The primary reason for partitioning into subsystems is soyou can analyze smaller slices of a larger system. There arenumerous subsystem arbitrary boundary points that must beidentified for each subsystem to enclose that discrete subsystemwithin the larger overall system. A component can reside in onlyone subsystem.
5.10.3 Determine interfaces
Establishing boundaries also includes identifying significantmechanical, electrical, and pneumatic inputs and/or control sig-nal interfaces. These inputs are necessary for the subsystemcomponents to function properly. All boundary points are speci-fied as either in-system boundary interfaces or out-systemboundary interfaces. If the boundary point component is supply-ing a function from another subsystem to the subsystem beinganalyzed, it is an in-system boundary interface. If the boundarypoint component provides a function from the subsystem beinganalyzed to another subsystem, it is an out-system boundaryinterface. Out-system boundary interfaces belong to the systembeing analyzed. In-system interfaces do not belong to the sub-system being analyzed. They belong to the subsystem governingtheir function. The boundary interface components are identi-fied to delineate the exact demarcation of each system and sub-system so that when analyzing other systems, no component willbe missed in the analysis.
5.10.4 Determine functions
When systems are partitioned into smaller subsystems, the sys-tem functions are specified at the subsystem level. Determiningsubsystem functions is an important step in the RCM analysis,since preserving these functions is the objective of the preven-tive maintenance program. Function definitions describe what
RCM Made Simple:The Implementation Process 149
the system or subsystem must accomplish. Criteria for definingfunctions can be ascertained by some of the following:
■ Subsystem in-interfaces that must be supported■ Subsystem out-interfaces that are provided to another system■ Internal interfaces that the subsystem provides as input to
another subsystem within the same system
An example of an in-interface that must be supported is asfollows:
When analyzing the circ pump subsystem of the circ water system,an in-interface is service water supplied by the service water sys-tem. This in turn requires that a function be defined when analyz-ing the service water system to “provide service water to the circwater pumps.”
Typical examples of subsystem functions could include the fol-lowing:
■ “Provide sufficient flow to the main condenser.”■ “Provide screen wash for cleaning the traveling bars and
screens.”
An example of an internal interface provided as input toanother subsystem within the same system is as follows:
In the circ pump subsystem, an internal interface is the interlocksignals provided from the condenser and discharge subsystem ofthe same circ water system. These interfaces to the circ pump sub-system are functions of the condenser and discharge subsystem.
5.10.5 Determine the functional failures
Determining the functional failures is the same process used inthe simplified classical RCM process. It is basically the oppositeof the function. For example, if the function reads “provide suffi-cient flow to the main condenser,” the functional failure will bewritten as “fails to provide sufficient flow to the main condenser.”
150 Chapter Five
5.10.6 Determine which equipment isresponsible for the functional failures
This is the step in the process where you need to determine pre-cisely what component I.D. is responsible for the functional fail-ure. You need to ascertain which component it is whose failureresults in a failure of the function.
The remaining steps of determining dominant failure modes,system effects, and plant consequences are similar to the processdescribed earlier in this chapter.
This gives you a very clear indication of why I wrote thisbook—and why RCM Implementation Made Simple is so muchmore robust and easier to understand and implement.
In the next chapter we will look at the PM task selection pro-cess.
RCM Made Simple:The Implementation Process 151

This page intentionally left blank
153
Chapter
6The PM Task Selection Process
This chapter explains the strategies for phase 2 of an RCM pro-gram. This is where preventive maintenance tasks are estab-lished to address the causes of failure for the equipmentpopulation identified in phase 1 (of the three phases of an RCMprogram). The PM tasks are relevant to components that welearned how to recognize via the COFA, the Potentially CriticalGuideline, and the Economically Significant Guideline. Theyare the components classified as critical, potentially critical,commitment, or economic.
I have intentionally separated this element of the process fromthe element for defining the component classification for severalreasons, but mainly because it makes the entire analysis simplerto understand. Secondly, as I mentioned earlier, these two ele-ments require different mind-sets and different expertise toobtain the optimum accuracy and maximum thoroughness of theprocess. Nevertheless, if you prefer to combine everything andcomplete the component classification, the PM task, and theperiodicity elements at the same time, that is a totally accept-able approach. I have found, however, that doing so disrupts themomentum of the thought process and interferes with the effi-ciency of completing the analysis. It is not that different frombuilding a house. There are certain elements of the building pro-cess that are more efficient and provide a better outcome whenthey are sequenced.
Copyright © 2006 by the McGraw-Hill Companies. Click here for terms of use.
6.1 Understanding PreventiveMaintenance Task Terminology
To begin, a basic understanding of the definitions of preventivemaintenance tasks is necessary to avoid confusion about themany different terms used in the industry. Terminology associ-ated with preventive maintenance tasks includes the following:time-directed, condition-directed, condition-based, proactive, reac-tive, predictive, failure-finding, in situ, on-condition, and surveil-lances. These terms mean different things to different people, andI am not advocating that any specific definition be used. However,I have chosen to use the fundamental RCM terms for the differentcategories of preventive maintenance, which is the conventionused in this chapter and throughout this book to describe preven-tive maintenance activities. There are also a myriad of differenttypes of PM activities, such as the following: overhauls, inspec-tions, performance tests, bench tests, oil sampling, thermography,vibration analysis, motor current signature analysis (MCSA), eddycurrent testing, hi-pot testing, calibrations, monitoring, replace-ments, disassemblies, cleaning, nondestructive testing (NDT), andacoustics.
People who are familiar with preventive maintenance mightuse these terms differently or interchangeably to mean the samething. Therefore, to avoid confusion, I use these terms for thethree basic categories of preventive maintenance tasks: condition-directed, time-directed, and failure-finding.
6.2 Condition-Directed,Time-Directed,and Failure-Finding Tasks
Throughout this chapter, preventive maintenance tasks consistof three general categories: condition-directed, time-directed, andfailure-finding. The different types of PM activities fall into one ofthese three categories. Condition-directed and time-directed pre-ventive maintenance is specifically intended to prevent failuresat the component level. These tasks address the different causesof failure in order to prevent equipment failures from occurring.Failure-finding preventive maintenance tasks do not preventfailures at the component level. Failure finding is a strategy to
154 Chapter Six
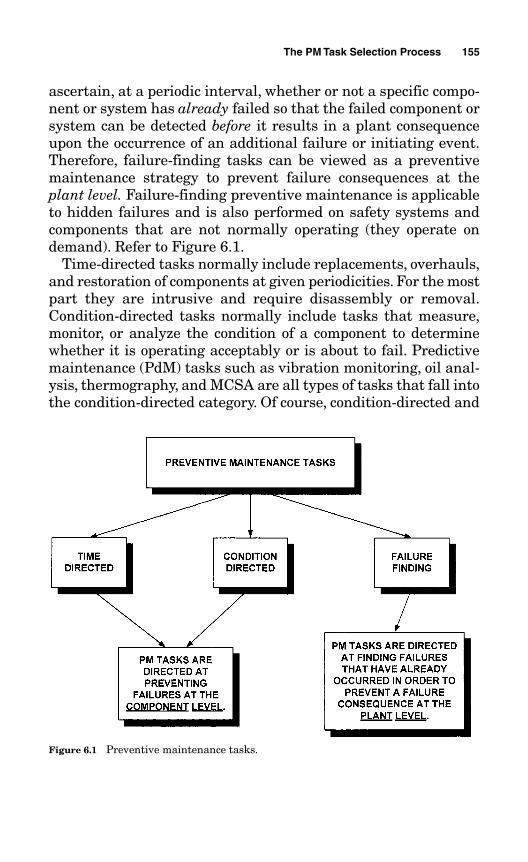
ascertain, at a periodic interval, whether or not a specific compo-nent or system has already failed so that the failed component orsystem can be detected before it results in a plant consequenceupon the occurrence of an additional failure or initiating event.Therefore, failure-finding tasks can be viewed as a preventivemaintenance strategy to prevent failure consequences at theplant level. Failure-finding preventive maintenance is applicableto hidden failures and is also performed on safety systems andcomponents that are not normally operating (they operate ondemand). Refer to Figure 6.1.
Time-directed tasks normally include replacements, overhauls,and restoration of components at given periodicities. For the mostpart they are intrusive and require disassembly or removal.Condition-directed tasks normally include tasks that measure,monitor, or analyze the condition of a component to determinewhether it is operating acceptably or is about to fail. Predictivemaintenance (PdM) tasks such as vibration monitoring, oil anal-ysis, thermography, and MCSA are all types of tasks that fall intothe condition-directed category. Of course, condition-directed and
The PM Task Selection Process 155
Figure 6.1 Preventive maintenance tasks.
failure-finding tasks still must be scheduled at some given peri-odicity, but that does not qualify them as time-directed.
There is a prevalent but misguided belief on the part of manyengineers and senior-level managers regarding condition-directed tasks. They still cling to the notion that even though acomponent has a condition-directed task specified but not atime-directed overhaul or replacement, it is a run-to-failure com-ponent. This is completely incorrect. Condition-directed mainte-nance is not run-to-failure. Condition-directed maintenance,according to its most basic definition, means . . .
Don’t overhaul or replace it until its condition indicates the need foroverhaul or replacement. Predictive maintenance techniques areused to determine the condition of the equipment so that requiredoverhaul or replacement can be scheduled to preclude the occur-rence of a functional failure.
Quite often the term proactive preventive maintenance is used toconnote taking action before failures occur, as opposed to reac-tive maintenance, which implies that no action is taken untilafter a failure occurs. Many people believe that proactive main-tenance is some new form of maintenance that just came on thescene in the past few years. Proactive preventive maintenance isreally synonymous with predictive maintenance, which is a sub-set of condition-based maintenance. Therefore, proactive preven-tive maintenance is not really new. Any newness comes from thenewer PdM techniques and the relatively new emphasis placedon PdM. The RCM philosophy has always been proactive, asadvocated in Nowlan and Heap’s work in 1978.
Another common misconception is that all preventive main-tenance is performed by the maintenance department. In fact,preventive maintenance is also performed by operations, engi-neering, chemistry, and other departments. Refer to Figure 6.2.When we get to the PM Task Worksheet, all applicable and effec-tive tasks will be described, including those performed by opera-tions, engineering, and others, as long as those activities areformally documented and proceduralized. Note that Figure 6.2uses the expressions “Operations PM Tasks” and “EngineeringPM Tasks.” Some of the activities these organizations performare indeed PM tasks. Maintenance is not the only departmentthat performs preventive maintenance. If operations is already
156 Chapter Six
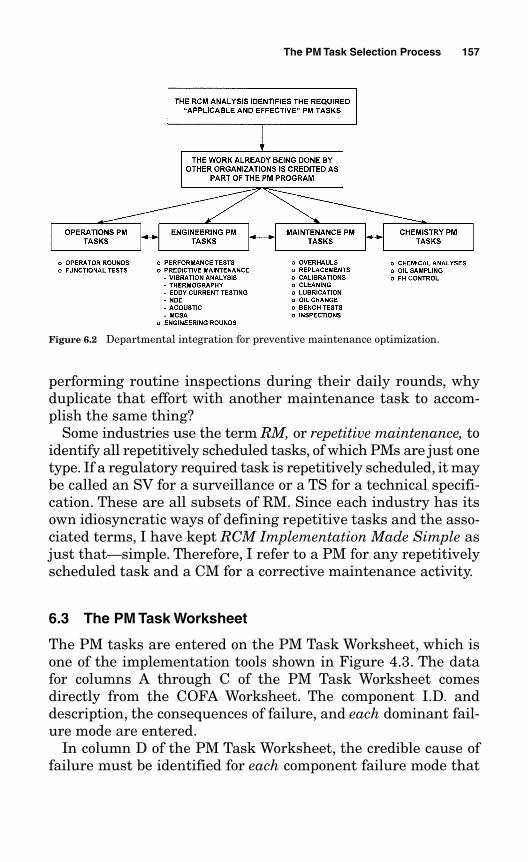
performing routine inspections during their daily rounds, whyduplicate that effort with another maintenance task to accom-plish the same thing?
Some industries use the term RM, or repetitive maintenance, toidentify all repetitively scheduled tasks, of which PMs are just onetype. If a regulatory required task is repetitively scheduled, it maybe called an SV for a surveillance or a TS for a technical specifi-cation. These are all subsets of RM. Since each industry has itsown idiosyncratic ways of defining repetitive tasks and the asso-ciated terms, I have kept RCM Implementation Made Simple asjust that—simple. Therefore, I refer to a PM for any repetitivelyscheduled task and a CM for a corrective maintenance activity.
6.3 The PM Task Worksheet
The PM tasks are entered on the PM Task Worksheet, which isone of the implementation tools shown in Figure 4.3. The datafor columns A through C of the PM Task Worksheet comesdirectly from the COFA Worksheet. The component I.D. anddescription, the consequences of failure, and each dominant fail-ure mode are entered.
In column D of the PM Task Worksheet, the credible cause offailure must be identified for each component failure mode that
The PM Task Selection Process 157
Figure 6.2 Departmental integration for preventive maintenance optimization.
resulted in an unwanted consequence for any of the asset reli-ability criteria regardless of whether it was critical, potentiallycritical, commitment, or economic. Each failure mode resultingin one of these classifications must have a preventive mainte-nance task specified to prevent its cause of failure. Invariably,there will be several causes of failure for each failure mode.
It is important that each failure mode be addressed because inone instance a component may fail in a certain way and the PMtask specified to prevent that cause of failure may be differentfrom a PM task to prevent a different cause of failure for a dif-ferent failure mode if the component failed in a different man-ner. More simply stated, a component can fail open or closed, oroperate prematurely, or fail to start, or stick, or bind, and therewill be different causes for these different failure modes, whichin turn require different PM tasks to address these differentcauses.
The cause of failure in most instances involves a straight-forward process. However, it is recommended that the failurecauses be determined by knowledgeable individuals with a thor-ough understanding of the equipment. These individuals shouldbe representatives from within the maintenance and engineer-ing organizations who are familiar with the specific equipment.Operations personnel may also have an input; however, mainte-nance and engineering types are usually more intimately famil-iar with internal failure mechanisms of the equipment than theoperators.
For example, the causes for a motor-operated valve failingopen (or failing closed) could be a failed motor, a failed torqueswitch, a failed limit switch, a bearing failure, an internalsolenoid failure, and so on. The causes of an electric pump failurecould be failed bearings, failed stator windings, a shaft failure,excessive impeller wear, overheat switch failure, internal electri-cal circuitry control failure, and so on. In many instances, a sin-gle task will address several failure causes.
6.4 The PM Task Selection Logic Tree
Before we enter the “applicable and effective” PM tasks in col-umn E to address and prevent the causes of failure for each fail-ure mode, an understanding of the task selection process is
158 Chapter Six
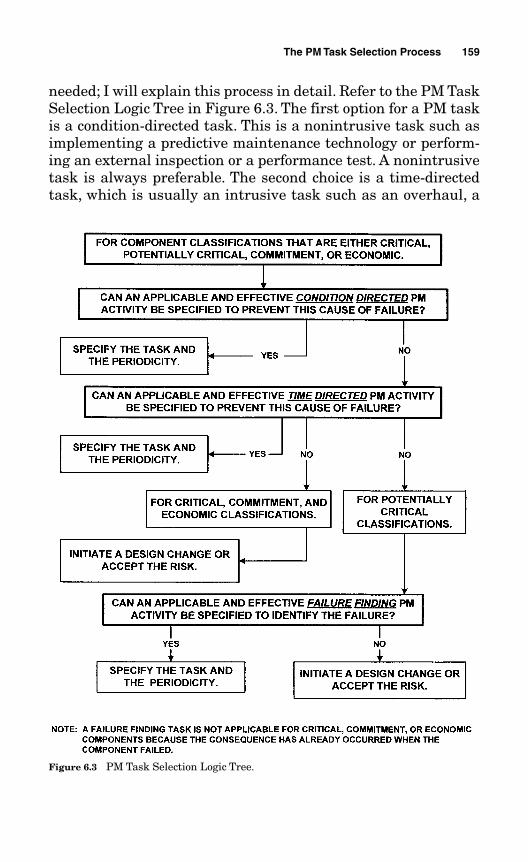
needed; I will explain this process in detail. Refer to the PM TaskSelection Logic Tree in Figure 6.3. The first option for a PM taskis a condition-directed task. This is a nonintrusive task such asimplementing a predictive maintenance technology or perform-ing an external inspection or a performance test. A nonintrusivetask is always preferable. The second choice is a time-directedtask, which is usually an intrusive task such as an overhaul, a
The PM Task Selection Process 159
Figure 6.3 PM Task Selection Logic Tree.
replacement, an internal inspection, or the like. Depending onwhether or not a condition-directed or a time-directed task isapplicable and effective, a design change may be required.
Note also that the PM task must be applicable and effective. Inorder to be applicable and effective, the proposed preventivetask must be such that it can be appropriately applied to thecomponent. It must be appropriate for addressing the failurecause. The preventive task must offer some degree of assurancethat it will prevent or at least minimize the exposure to a failureof the component. The selected task, based on a principle of pru-dent judgment by knowledgeable individuals, should have a rel-ative degree of pertinence and likelihood that it will prevent theoccurrence of the failure mechanism. You should ask, “Does thistask really make sense, or is it being identified only for the sakeof ‘doing something’ without regard for the criteria?”—in whichcase, it would not be applicable and effective.
I have seen many instances where equipment failures occurredand totally ineffective PMs were created only for the sake of con-vincing management that something was being done about thefailures. Such PMs are not applicable and effective. In thosecases, only a design change or an upgraded component is theanswer. If that is the conclusion you come to, then don’t shy awayfrom it.
Prudent judgment must prevail when identifying credible fail-ure causes and applicable and effective PM tasks. In someinstances it is appropriate to accept the fact that an applicableand effective preventive task cannot be identified. In such a case,either a failure-finding task or a design change may be warranted.
A failure-finding task is applicable only to potentially criticalcomponents because the unwanted consequence of failure forcritical, commitment, or economic components has alreadyoccurred when the component failed.
In the case of a hidden failure, if a preventive task cannot ade-quately ascertain a pending failure or prevent its occurrence, afailure-finding task must be specified. Failure-finding tasksascertain only that a hidden failure has already occurred, buthaving that knowledge allows you to prevent an unwanted plantconsequence before an additional failure or initiating eventshould occur.
160 Chapter Six
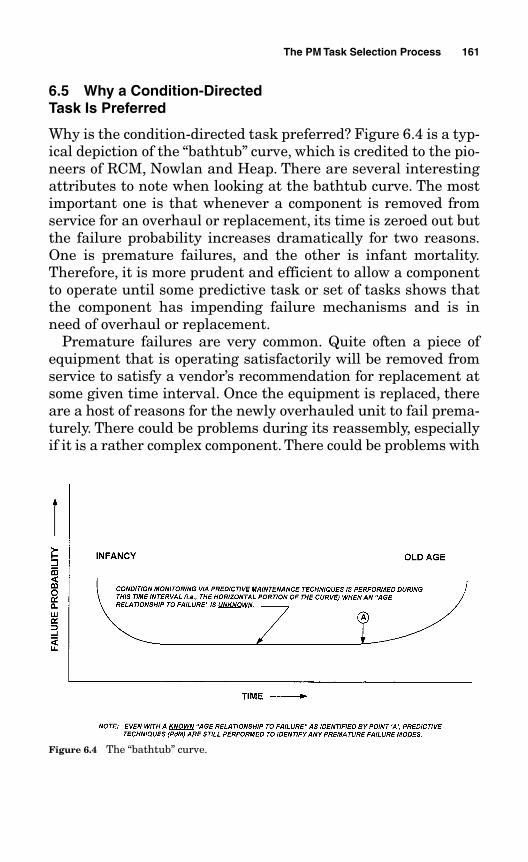
6.5 Why a Condition-Directed Task Is Preferred
Why is the condition-directed task preferred? Figure 6.4 is a typ-ical depiction of the “bathtub” curve, which is credited to the pio-neers of RCM, Nowlan and Heap. There are several interestingattributes to note when looking at the bathtub curve. The mostimportant one is that whenever a component is removed fromservice for an overhaul or replacement, its time is zeroed out butthe failure probability increases dramatically for two reasons.One is premature failures, and the other is infant mortality.Therefore, it is more prudent and efficient to allow a componentto operate until some predictive task or set of tasks shows thatthe component has impending failure mechanisms and is inneed of overhaul or replacement.
Premature failures are very common. Quite often a piece ofequipment that is operating satisfactorily will be removed fromservice to satisfy a vendor’s recommendation for replacement atsome given time interval. Once the equipment is replaced, thereare a host of reasons for the newly overhauled unit to fail prema-turely. There could be problems during its reassembly, especiallyif it is a rather complex component. There could be problems with
The PM Task Selection Process 161
Figure 6.4 The “bathtub” curve.
the replacement parts. There could be problems encounteredwhen reinstalling the component itself.
Another source of infant mortality occurs with new equipmentduring its “burn-in” period. Many components require this burn-in period to allow clearances, wear rings, seals, and other pieceparts to find their relaxed operating parameters.
Furthermore, if you replace a component before it becomesnecessary, you will lose all of the remaining time along the hori-zontal portion of the bathtub curve until point A in Figure 6.4 isfinally reached. For example, based on a vendor’s recommenda-tion, a component may be overhauled every 5 years, whether itneeds it or not, when it could have lasted for 10 years or more.Not only is that a waste of resources, but it diminishes the avail-able resources for other critical work.
There are some components that were designed to last the lifeof the plant, whether that is 20, 30, or 40-plus years. Everythingelse will eventually fail prior to that time, so why remove it untilits condition indicates the need for replacement?
Another interesting attribute is that Nowlan and Heap deter-mined that only approximately 11 percent of all components uni-versally exhibit a given wear-out point, shown as point A inFigure 6.4. This means that approximately 89 percent of all com-ponents fail randomly, and that is why a time-directed overhaulwithout regard to the condition of the component is not a goodpractice. There are, however, many components (those in the 11percent category) that exhibit an age relationship to failure, and atime-directed overhaul or replacement is the recommended task.
Oftentimes both a condition-directed task and a time-directedtask are specified for the component for different causes of fail-ure. For example, a condition-directed task may be specified toperiodically monitor the component for vibration to ensure thatan incipient bearing failure is not about to occur, while a time-directed overhaul may also be specified for the component if anage relationship to failure is known.
6.6 Determining the PM Task Frequency and Interval
Now we come to another milestone in the PM task selection pro-cess. How do you define the frequency and interval for the tasks?
162 Chapter Six
The frequency and interval (i.e., the periodicity) for the tasksselected are entered in column F of the PM Task Worksheet. Thefrequency is usually expressed as either hours, days, quarters,months, annually, or years. The interval is expressed numeri-cally. For example, a periodicity of once every four months wouldbe M4, a periodicity of every four years would be A4 or Y4,depending on whether you choose to use an annual or a yearlyexpression. Determining the periodicity can be extremely com-plicated or it can be quite simple and based on common sense. Iprefer the latter approach. But first let’s explore the more com-plicated version so you understand why that is not the preferredmethod except for calculating the probability of failure, or themean time between failures (MTBF).
Determining the probability of failure, or the MTBF, is anacceptable practice, since it is a calculation for estimating theoperating life of a component. Similarly, any calculations—suchas calculating the life of bearings, motor windings, pump wear,and so on—are all applicable for estimating the age relationshipto failure for a component. Some intelligence, however, is stillrequired when using these numbers. This becomes evident in theparagraph that follows.
The complicated method may involve other mathematical cal-culations, formulas, or statistical methods that are not easilydeveloped. However, this is only a minor reason for not pursuingthat route. More important, as you can see in Figure 6.5, PMtask frequency and interval considerations are more of an artthan a science. Just by reviewing these considerations, it is quiteevident that some “exact” mathematical model could determinethat 2.73 years is the optimum time for scheduling a periodicperformance test of a specific component, for example. What ifthat component requires a planned outage to gain access to it,and the outage is scheduled every three years? Will the outagehave to be scheduled sooner? What if “other” activities are per-formed on that component every two years? Will this requirethat 0.73 years after the component was worked on for someother PM activity, it must be tested again? This is not the waythe real world of maintenance works. You should be as efficientas possible and schedule work on the component as efficiently aspossible. Therefore, prudent engineering judgment would bemore practical by considering all of the conditional parameters
The PM Task Selection Process 163
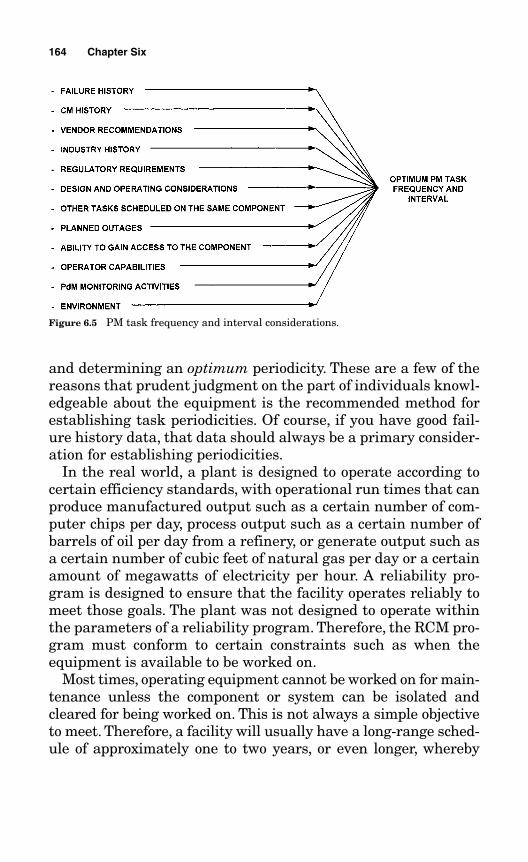
and determining an optimum periodicity. These are a few of thereasons that prudent judgment on the part of individuals knowl-edgeable about the equipment is the recommended method forestablishing task periodicities. Of course, if you have good fail-ure history data, that data should always be a primary consider-ation for establishing periodicities.
In the real world, a plant is designed to operate according tocertain efficiency standards, with operational run times that canproduce manufactured output such as a certain number of com-puter chips per day, process output such as a certain number ofbarrels of oil per day from a refinery, or generate output such asa certain number of cubic feet of natural gas per day or a certainamount of megawatts of electricity per hour. A reliability pro-gram is designed to ensure that the facility operates reliably tomeet those goals. The plant was not designed to operate withinthe parameters of a reliability program. Therefore, the RCM pro-gram must conform to certain constraints such as when theequipment is available to be worked on.
Most times, operating equipment cannot be worked on for main-tenance unless the component or system can be isolated andcleared for being worked on. This is not always a simple objectiveto meet. Therefore, a facility will usually have a long-range sched-ule of approximately one to two years, or even longer, whereby
164 Chapter Six
Figure 6.5 PM task frequency and interval considerations.
planned maintenance is scheduled during a complete overhaul ofthe entire plant or during an overhaul of sections of the plant at agiven time. Usually, a scheduled rotating basis is established forworking on the equipment in the various systems of a facility.These are the planned “windows of opportunity” to perform mostmaintenance work—especially intrusive maintenance activities.Obviously, any unplanned equipment failure always has thepotential to modify that schedule immediately. It is important toconsider such things as when your plant outages are scheduledand when the next production line outage is scheduled whenselecting the appropriate time for working on components thatcannot be isolated for access at other times.
When it has been determined that the periodicity at which theequipment needs to be worked on and the scheduled outages donot coincide, prudent judgment by individuals knowledgeableabout the equipment and the plant is once again the recom-mended method for either adjusting task periodicities or chang-ing plant outage intervals.
This is why selecting the appropriate PM task and periodicityis more art than science. In Chapter 8, we will find out how tomake prudent adjustments to the task intervals that we ini-tially established when we explore how to develop an RCM “liv-ing program.”
6.6.1 The optimum time to establish a reliability program
The optimum time to implement an RCM program is during thedesign stage of a new plant or facility. After the facility is built,the reliability program is more of a backfit. However, that is prob-ably when 98 percent of all reliability programs are developed.
The benefits of developing a reliability program as part of thedesign stage include the deliberation, to the extent possible, forallocating and devising ways to replace certain equipment with-out having to schedule an outage for accomplishing the mainte-nance work. Other benefits include the design of equipment sothat it can be maintained without having to first remove half ofa building to gain access to it. Additionally, provisions can bemade for utilizing predictive maintenance techniques to the
The PM Task Selection Process 165
maximum level for monitoring equipment, thereby minimizingthe need for intrusive maintenance.
Industries where the facility is a cruise ship, an aircraft, or anew power plant—or any new facility, for that matter—shouldbe especially attuned to this issue because they have the oppor-tunity to be proactive about establishing a reliability program.
Aircraft manufacturers, for example, are quite familiar withthis. Usually, the competition among two or more manufacturersfor selling the next-generation aircraft adopts a marketing strat-egy that addresses the ease of maintainability, the simplicity ofaccessibility, and the capability to perform online predictivemaintenance, all of which results in longer flying times and lessdowntime in the hangar.
One day this fundamental understanding of reliability will beso commonplace that reliability programs in general will becomemore a part of the design phase than a retrofit. It is preferable todesign equipment and facilities from the start in such a way thatequipment failures do not pose safety or operational concernsthat lead to unwanted consequences.
6.7 Is a Design ChangeRecommended?
The last column of the PM Task Worksheet, column G, includesthe recommendation for whether a design change is warranted.As we discussed in Chapter 3, a design change is the exceptionrather than the rule because it is not that often that a condition-directed or a time-directed task to prevent failure, or a failure-finding task to identify when a failure has occurred, cannot bespecified. However, there are those occasions when this is notpossible and a design change is mandatory or else you accept therisk of failure.
Most tasks are relatively simple and inexpensive. They do notautomatically migrate toward a complete overhaul. As we havelearned, intrusive overhauls and replacements are the lastchoice in preventive maintenance. In Chapter 3, we analyzed thefuel oil pumps for the emergency diesel generator. We found thatthose pumps were potentially critical because of their hiddenfailure consequences. The optimum task in that instance was a
166 Chapter Six
failure-finding task to ensure that both pumps were operatingvia an inspection. The inspection was included as part of the pro-cedure governing the diesel each time it was started, which wasonce every 30 days. A design change was not necessary.
6.8 Completing a Typical PM Task Worksheet
To see how the PM Task Worksheet is completed, let’s look at atypical example. The PM Task Worksheet is shown in Figure 4.3.We will use the two-way valve GHI that we analyzed in Figures5.4a through 5.4g as our example. On the PM Task Worksheet,we enter the component I.D. and description, and in column B,we enter the critical consequences of failure for valve GHI.
Component I.D. and description.Valve I.D.: GHITwo-Way Isolation Valve
What were the consequences of failure?1.a. A power reduction.1.c. A plant shutdown.
In column C of the PM Task Worksheet, we describe the domi-nant component failure modes associated with the two conse-quences of failure. Each dominant failure mode that resulted inan unwanted consequence of failure must be analyzed. This isentered in column C of the PM Worksheet.
Describe each dominant component failure mode.1.a. Valve fails closed.1.c. Valve fails to transfer to the emergency position.
In column D of the worksheet, we describe all of the possiblecredible failure causes for each dominant component failuremode. Remember, this is just a representative example for a typ-ical valve type and depends on the exact type of valve installedin your facility; the causes of failure may be very different fromthe ones in this example. However, I have also intentionally usedthis example to show that the causes for each different failure
The PM Task Selection Process 167
mode could be similar. In this instance, the causes for the failuremode of “valve fails closed” and the failure mode of “valve fails totransfer to the emergency position” are similar. This is notunusual, and it is acceptable to specify the credible failurecauses for 1.c. as “the same as for 1.a.”
Describe the credible failure cause for each dominant failuremode.1.a. (1) Valve binds
(2) Bearing failure(3) Motor failure(4) Torque switch fails(5) Limit switch fails(6) “Other,” depending on specific equipment type
1.c. (1) Valve binds(2) Bearing failure(3) Motor failure(4) Torque switch fails(5) Limit switch fails(6) “Other,” depending on specific equipment type
In columns E and F of the worksheet, the applicable and effec-tive PM tasks and the frequency and interval of the tasks aredefined for each failure cause. There is such great diversity inthis decision and selection process that I will not attempt toinclude any typical examples. The tasks and their periodicitiesare ascertained from the PM Task Logic Tree and Figure 6.5. AsI mentioned earlier in this chapter, the tasks and their periodic-ities are determined by prudent technical decisions made byknowledgeable individuals. Finally, column E is where you candefine whether a design change is recommended.
6.9 Institute Technical Restraints
You are probably thinking, “What exactly does this mean?” Themessage here is to avoid what repeatedly seems to happen: oncethe RCM program is established, new tasks get added with verylittle oversight or scrutiny. Seldom do they undergo the same rigors of analysis that the original program was based on. Before
168 Chapter Six
you know it, your PM program has grown by 20 percent to 30 per-cent. One way to avoid the buildup of nonapplicable and effectivePM tasks is to implement a process that ensures that any newproposed additions to the program go through the same COFAlogic analysis for their justification. If you do not institute sometype of requirement for a technical justification before any addi-tional task can be added to the program, you will find that yourprogram will grow and slowly accumulate unnecessary work.
As we discuss in Chapter 8, new tasks will always be requiredas new issues develop, and you do not want to stifle that part ofthe process. However, you should not allow the process to get outof control, either. This is not always easy to do; probably the bestway to manage this restraint would be to implement an approvalprocess for new PMs and make it the administrative responsi-bility of the department in your organization that is accountablefor preventive maintenance.
6.10 A Sampling Strategy
Now that we have learned how to recognize critical and poten-tially critical components and understand a little more about thePM tasks and the periodicities of those tasks, let’s exploreanother area that is very much a part of real life in the world ofmaintenance and reliability but is seldom discussed.
What if you have just completed your RCM analysis and foundthat one of the most critical components you have is a majorpump, for example. The pump could be quite large and very com-plex. There might be a half dozen similar pumps in your plant,all of which are critical and have been in service for 15 or moreyears and have never been overhauled before. Now, assume thatit will cost several thousand dollars (maybe even several hun-dred thousand dollars) to accomplish the overhaul. Will you go tosenior management and tell them that you just completed thisRCM program and the results have determined that all thesepumps should be overhauled? Suppose you have several dozenlarge motors in your plant that likewise are all critical, havebeen in operation for over 15 years, and have never had the sta-tors rewound or the bearings replaced. Would you schedule all ofthem for overhaul at once? Probably not.
The PM Task Selection Process 169
Even though you have strong suspicions that those compo-nents definitely need attention because pump seals, impellers,stator windings, and bearings don’t last forever, even if you havebeen religiously performing the routine predictive tasks such asmonitoring for excessive vibration, sampling and changing theoil, and so on, it would still not be an easy feat to convince seniormanagement to buy into this grandiose overhaul plan—that is,unless your senior management is visionary, engineering-oriented, reliability-savvy, and willing to make bold decisions.Sadly, though, most senior management does not fit that mold.They would be especially hard to convince if none of these criti-cal components has failed yet. Remember reading in Chapters 1and 3 about running on luck? So what do you do?
The most prudent approach to this administrative problem isto convince senior management that you need to perform a “sam-pling” overhaul inspection of at least one of each type of equip-ment. Select the one in the most hostile environment and theone that has been in service the longest. The aim is to inspect theone that was operating under the most severe conditions. Oncethe sample component is removed, I recommend a very thoroughinspection of all aspects including clearances, the condition ofthe stator windings, the condition of the bearings, the impellerwear, and any other precise measurements that will indicate itscondition or degradation.
Depending on what you find, you should have a more techni-cally based initiative to deal with the rest of that specific popu-lation. That way you will at least know if the equipment is ingood enough condition to continue operating for many moreyears without concern. Or you may find that the entire compo-nent population is in imminent danger of failing in a short time.This is a real-life problem that has occurred in nuclear and otherindustries as well. Dealing with the remaining population ofequipment then requires crisis management. Many facilitiesfind themselves in a worst-case situation where a host of immi-nent failures are on the horizon. That is the price paid for theneglect of a premier preventive maintenance program.
Another reason for performing a sampling inspection is to con-firm the validity of your predictive maintenance technologies. Itis not uncommon for major failure mechanisms to go undetected
170 Chapter Six
on some equipment, even with a swarm of PdM tasks that areregularly accomplished. This, too, is a real-life problem thatoccurs all too often.
6.11 Common Mode Failures
Common mode failures are failures of a population of equipmentall of which is subject to the same failure mode. As with the prob-lem of an entire population of similar equipment failing within asimilar time frame due to neglect of a preventive maintenanceprogram, you must also be vigilant about the possibility of com-mon mode failures occurring to a population of similar equip-ment. This is a situation to avoid.
Common mode failures have the potential to occur anytimeyou have a significant population of similar equipment. Exam-ples include a facility with a large population of motor-operatedvalves or air-operated valves, all of which were manufactured bythe same vendor, or only a few of each type of valve in dozens ofyour plants around the world. A typical commercial aircraft mayhave only one or two similar valves per plane, but there may behundreds of that type of aircraft in the fleet.
Imagine what would happen if you discovered that a flawexisted during the assembly of a component, or an incorrect partwas installed at the common shop that performed all of the over-hauls, or a failure mechanism just manifested itself in a popula-tion of several dozen or even several hundred like components.You would definitely not be in a comfort zone, but it is not anuncommon situation in which to find yourself. When such situa-tions occur, a mandatory bulletin or directive is usually issuedby the FDA, NASA, the NRC, or the FAA, if you come under reg-ulatory scrutiny, to inspect all suspect components within a veryshort time frame. Even if you aren’t subject to regulatoryscrutiny, you will come under economic scrutiny by senior man-agement when they learn that several of the corporation’s facili-ties are in jeopardy of an unscheduled and premature shutdown,perhaps for reasons that you cannot justify.
There is no absolute guarantee that this situation will neverhappen to you. However, there are actions that can be taken tominimize your exposure to such occurrences. It would be pru-
The PM Task Selection Process 171
dent to institute a sampling program that periodically inspectsone or two of the components of the population to ensure that allis well before any problems rear their ugly heads and allow youvery little time to react appropriately and efficiently with aplanned course of action. A sampling program that performs anin-depth internal inspection of the sampled components canyield a very accurate prognosis for wear patterns, internal flaws,and other incipient failure mechanisms that may not be observ-able using PdM techniques.
6.12 Different Predictive Maintenance (PdM) Techniques
We have learned about condition-directed maintenance and howPdM, which is a subset of condition-directed maintenance, is thepreferred PM task because it is mostly nonintrusive. As I men-tioned in Chapter 3, PM tasks can be grouped together, and it ismore efficient to handle them that way. Some of the newer meth-ods employ templates that usually include an array of predictivetechniques that are applied to a family of like components. Theperiodicity of the PdM tasks is different for each one dependingon the environment, criticality classification, and operating con-ditions such as whether the component operates in continuousduty mode or cyclic duty. For example, a common template couldbe applied to all electric motors with a certain horsepower rat-ing. This template would consist of several different PdM tasksincluding vibration analysis, oil sampling, MCSA, thermogra-phy, inspection, and so on. The time intervals for the PdM tasks,however, would be customized for each motor. Let’s look at a fewof the different types of PdM techniques.
6.12.1 Vibration monitoring and analysis
This application is used to detect bearing wear, an unbalancedcondition, or other alignment problems mostly in rotatingmachinery. Vibration sensors can detect loose or cracked supportmounts or support pads, bent or cracked shafts, and coupling
172 Chapter Six
The PM Task Selection Process 173
problems. The software for vibration analysis enables trendingof the vibration levels so that incipient failures can be monitoredas they progressively get worse.
6.12.2 Acoustic monitoring
This application is used to detect internal and external leaks inall types of valves such as motor-operated valves, air-operatedvalves, manual valves, and check valves. In these cases, usuallyair or water leaks by or through a butterfly, diaphragm, or otherinternal part of a valve. This type of monitoring also detectsleaks through heat exchanger tubes that are cracked.
6.12.3 Thermography or infrared monitoring
This is a very commonly used technique for finding “hot spots”using an infrared camera. Electrical connections that havebecome loose are easily detected by this technique. This applica-tion is also used to detect any parameter that may be runninghotter than normally expected, such as relay coils and motorwindings.
6.12.4 Oil sampling and analysis
This is a very common technique to detect incipient bearing orinternal gear failures. A small amount of oil is drained from theunit and analyzed and inspected for wear particles and othercontaminants such as water intrusion into the oil reservoir.Some of the latest advances in oil sampling include simple-to-use on-site equipment. Previously, oil samples were usually sentto an off-site laboratory for analysis.
6.12.5 X-ray or radiography inspection
This application uses X-rays to detect subsurface flaws in weldsor other metallic parts such as casings or valve bodies. Extremecare must be taken when employing this technology to avoidharm to personnel from the X-rays.
6.12.6 Magnetic particle inspection
This application detects surface cracks in metallic parts by set-ting up a magnetic field around the part to be inspected.
6.12.7 Eddy current testing
Eddy current testing is very similar to magnetic particle inspec-tion. It produces a magnetic field and an eddy current flow todetect surface flaws.
6.12.8 Ultrasonic testing
This method also detects flaws in metallic parts. It is similar toradiography, except it uses sound waves to detect the flaws.
6.12.9 Liquid penetrant
This technique uses a dye to detect surface cracks in pipes,welds, and other metallic parts. The dye is viewed under anultraviolet light, and the crack becomes visible where the dyewas absorbed into it.
6.12.10 Motor current signatureanalysis (MCSA)
This technique detects problems with motors, such as crackedrotor bars and some motor winding problems. A clamp-on probeanalyzes motor current traces. Experience with MCSA has beensomewhat mixed relative to the accuracy of its findings.
6.12.11 Boroscope inspections
This technique uses a boroscope to visually inspect internalparts of equipment that cannot be inspected externally. Ofcourse, there must be points of entry to accept the boroscope forthe inspection. This is commonly used for turbine inspectionsand internal inspections of large valves.
174 Chapter Six
6.12.12 Diagnostics for motor-operated valves
The commonly used diagnostic technique for motor-operatedvalves is called MOVATS. This consists of a set of equipmentthat recognizes a pattern signature of the valve to measure ahost of readings. These include motor current, torque switch set-tings, stem thrust, switch actuation, and the electrical conditionof the motor.
6.12.13 Diagnostics for air-operated valves
This is a diagnostic test box used to detect diaphragm leakage,air-operated solenoid problems, and other internal problemsthat arise with air-operated valves.
Many of the PdM techniques described here are used in con-junction with other PdM tasks. For example, oil sampling andanalysis, vibration monitoring, and thermography may all beemployed on the same component. Using several different PdMtechniques will usually detect an incipient failure, where usingonly one PdM task alone may not. New PdM technologies arebecoming cutting-edge, and newer techniques are being developedevery day. Continuous monitoring with some of these PdM appli-cations, rather than the periodic use of these techniques, offerseven greater potential for recognition of incipient problems.
6.13 Chapter Summary
This chapter has shown how a very important element of theRCM effort—selection of PM tasks—can be made straightfor-ward and uncomplicated. Refer to Figures 6.6a and 6.6b, whichreinforce the idea that classical RCM can indeed be made simple.
Let’s summarize what we have covered in this chapter.
■ There are three general categories of preventive maintenancetasks: condition-directed, time-directed, and failure-finding.
■ There are a host of different types of tasks that fall into one ofthe three categories. They include overhauls, inspections, per-
The PM Task Selection Process 175
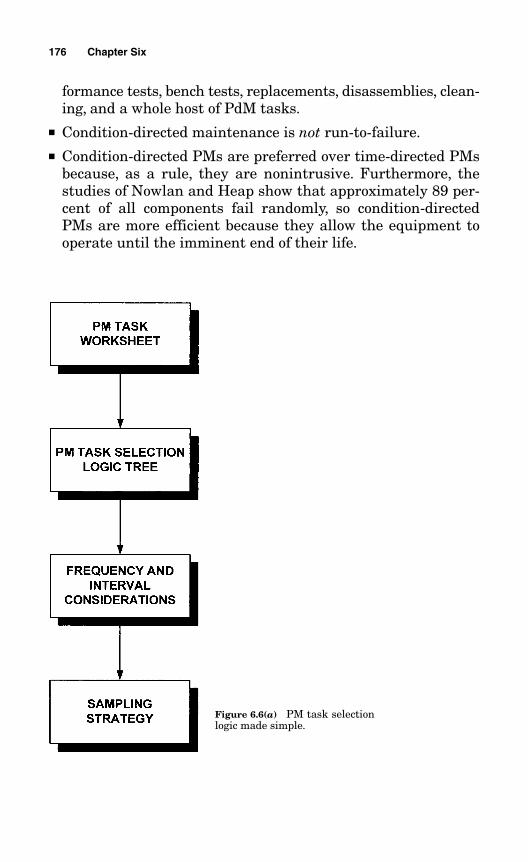
formance tests, bench tests, replacements, disassemblies, clean-ing, and a whole host of PdM tasks.
■ Condition-directed maintenance is not run-to-failure.■ Condition-directed PMs are preferred over time-directed PMs
because, as a rule, they are nonintrusive. Furthermore, thestudies of Nowlan and Heap show that approximately 89 per-cent of all components fail randomly, so condition-directedPMs are more efficient because they allow the equipment tooperate until the imminent end of their life.
176 Chapter Six
Figure 6.6(a) PM task selectionlogic made simple.
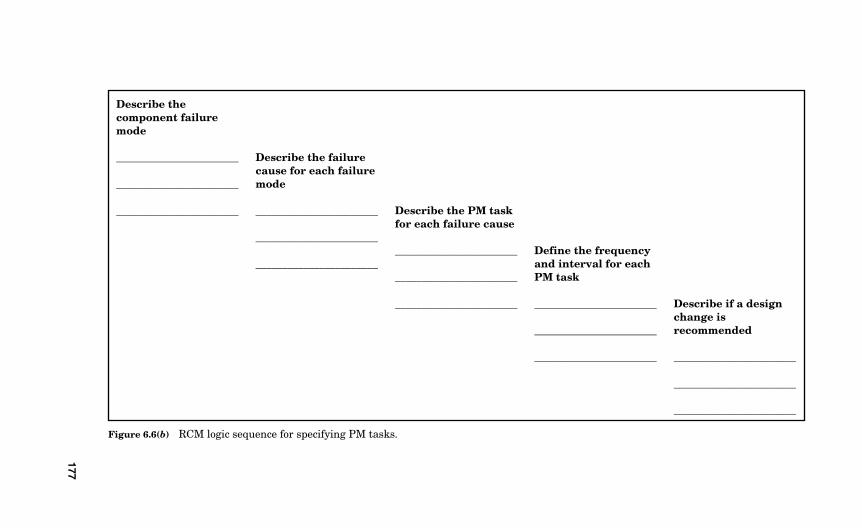
177
Figure 6.6(b) RCM logic sequence for specifying PM tasks.
Describe thecomponent failuremode
_______________________
_______________________
_______________________
Describe the failurecause for each failuremode
_______________________
_______________________
_______________________
Describe the PM taskfor each failure cause
_______________________
_______________________
_______________________
Define the frequencyand interval for eachPM task
_______________________
_______________________
_______________________
Describe if a designchange is recommended
_______________________
_______________________
_______________________
■ Predictive maintenance techniques are used to determine thecondition of the equipment so that required overhaul orreplacement can be planned and scheduled to preclude theoccurrence of a functional failure.
■ Time-directed PMs such as overhauls and replacementsshould be specified when an age-to-failure relationship isknown. The studies by Nowlan and Heap show that onlyapproximately 11 percent of all components exhibit an agerelationship to failure.
■ Failure-finding tasks are applicable to potentially critical com-ponents because potentially critical components are the resultof hidden failures. Failure-finding tasks are not applicable tocritical, commitment, or economic components because theirfailure consequences are immediate. Failure-finding preven-tive maintenance is also performed on safety systems andcomponents that are not normally operating (they operate ondemand).
■ Operations, engineering, and other departments also performPM tasks in addition to the maintenance department.
■ There are usually several failure causes responsible for eachfailure mode.
■ There are usually several PM tasks to prevent each failurecause. Selecting PM tasks requires prudent engineering judg-ment on the part of individuals who are knowledgeable aboutthe equipment.
■ The failure cause must be credible.■ The PM task must be applicable and effective.
■ In the absence of an applicable and effective task, a designchange may be required.
■ Determining the optimum frequency and interval is based onmany different considerations and requires prudent engineer-ing judgment on the part of individuals who are knowledge-able about the equipment.
■ The optimum time to establish a reliability program is duringthe design stage of the facility.
178 Chapter Six

■ A sampling strategy is always prudent and sometimes neces-sary.
■ PdM tasks include vibration monitoring, acoustic monitoring,thermography, oil sampling, X-ray inspection, magnetic parti-cle inspection, eddy current testing, ultrasonic testing, liquidpenetrant, MCSA, boroscope inspections, motor-operatedvalve diagnostics, and air-operated valve diagnostics.
There is one category of equipment we have not discussed tothis point. How do you handle instruments? Chapter 7 addressesthis topic.
The PM Task Selection Process 179

This page intentionally left blank
181
Chapter
7RCM for Instruments
Instruments are an important part of your maintenance strat-egy, and they constitute an area that needs to be addressed inorder to ensure their reliability. Instruments are normally seg-regated from other types of components. Although they do havea distinct equipment I.D., they are usually in a class type of theirown. In most industries there are special technicians who pro-vide for the calibration, maintenance, replacement, and repair ofinstruments. Different industries use different conventions forterminology applied to instruments. For example, instrumentscan function to control another component, switch something onor off, or provide an alarm; they can provide a reading of a cer-tain parameter such as temperature or pressure; or they canmonitor an electrical current or voltage. In many industries, blackboxes are considered instruments. In some industries, instru-ments are also identified as instrument “loops.” An instrumentloop might consist of a transmitter, a sensor, an indicator, and asignal conditioner.
Instruments generally receive very little attention in terms ofjustifying when a calibration interval can be extended or when itshould be reduced. Likewise, very little attention is given to thetolerance criterion that constitutes a calibration failure.
This chapter offers some guidance in regard to the preventivemaintenance of instruments that provide only an indicator read-ing. Functional instrument preventive maintenance is governedby the RCM process. Nonfunctional instruments do not employ a
Copyright © 2006 by the McGraw-Hill Companies. Click here for terms of use.
specific process, but there are some logical decisions that can bemade about their preventive maintenance activities.
7.1 Instrument Categories
I classify instruments into two categories: those instruments thatprovide a function and those instruments that provide only anindication, usually from a gage or a monitor. This second cate-gory includes all instruments that do not provide a specific func-tion. Many times a reading on a gage causes an action to be takenthat requires the initiation of a function, but that action is takenby a person, not the instrument.
If an instrument provides a function, it is analyzed in theCOFA Worksheet and the PM Task Worksheet along with allother components. If it does not provide a function, it is analyzedin accordance with the Instrument Logic Tree, explained later inthis chapter.
An instrument code of FI, designating a functional instrument,is assigned to those instruments that provide a function. If theinstrument provides a function, it is no different from any otherfunctional component—it encompasses a function, a functionalfailure, a failure mode, and a consequence of failure. It will alsohave a cause of failure and an applicable and effective PM toaddress each cause of failure.
An instrument code of II, designating an indication instrument,is assigned to those instruments that provide only an indicationreadout, typically via a gage or a monitor. The majority of instru-ments are in the II group.
The component classification of FIs is governed by the COFA,the Potentially Critical Guideline, and the Economically Signifi-cant Guideline. Instruments designated as II are analyzed in theInstrument Logic Tree, as shown in Figure 7.1. If an indicationinstrument is sufficiently important that a certain indicationreadout requires that personnel actions be taken, the instrumentcannot be considered for a run-to-failure classification. However,if its indication readout does not require any immediate inter-vention and it is found to have redundancy, then it may be consid-ered for run-to-failure status. The typical preventive maintenanceactivity for IIs is a calibration at a given periodicity.
182 Chapter Seven
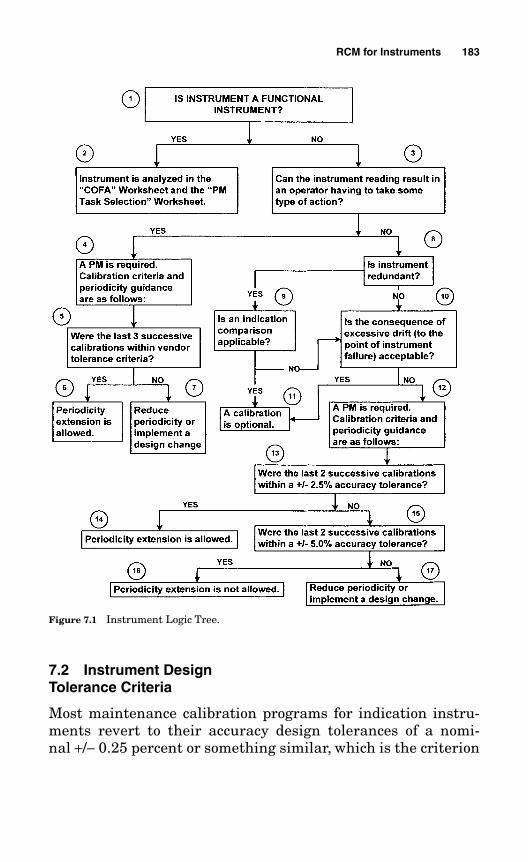
7.2 Instrument Design Tolerance Criteria
Most maintenance calibration programs for indication instru-ments revert to their accuracy design tolerances of a nomi-nal +/− 0.25 percent or something similar, which is the criterion
RCM for Instruments 183
Figure 7.1 Instrument Logic Tree.
established for brand-new instruments leaving the vendor.Instruments are subject to drift. Maintenance calibration his-tory data is usually the sole data source used as justification forchanging calibration periodicities. Using the +/−0.25 percent tol-erance levels almost ensures that most routine gages will notmeet this criterion when they are normally calibrated, and thecalibration test will thereby be declared “failed” when the instru-ment is calibrated.
In many instances this is too restrictive to allow sufficientflexibility in adjusting calibration periodicities, so the Instru-ment Logic Tree allows for more prudent accuracy tolerancesto be used when applicable. A razor blade, for example, has afactory-specified tolerance. After you use that razor blade onlyone time, it no longer meets the restrictive factory design toler-ance, but as we know, the razor blade is still usable until it isdetermined to be out of tolerance for normal use.
I have been very deliberate and specific about when thesemore realistic accuracy tolerances can be used. If you shouldelect to use these relaxed tolerance criteria, I suggest that youobtain approval from your management to do so. I have includedthem only as anecdotal information based on experience. How-ever, it should be understood that whenever any instrument isrecalibrated for any reason, it is always recalibrated using theoriginal design accuracy tolerances.
The as-found calibration criteria used to determine a calibra-tion failure for functional instruments (FI) are always in accor-dance with the vendor design tolerance standard criteria. Relaxedtolerance criteria for FIs are not permitted.
Figure 7.1 very deliberately specifies the number of previoussuccessive calibration readings that are required to have beenfound “acceptable” in order to justify making any changes to thecalibration periodicity. For nonfunctional instruments whosereadings could result in operator actions being taken, three pre-vious successive calibrations must have been in accordance withvendor tolerance criteria in order to justify a periodicity exten-sion. If the last three consecutive readings did not meet vendorcriteria, a reduction of the periodicity or a design change shouldbe explored.
184 Chapter Seven
For nonfunctional instruments whose readings would not resultin an operator having to take some type of action, the tolerancecriteria are relaxed, and there is the possibility that a calibra-tion may not be required.
7.3 The Instrument Logic Tree
Each block of the Instrument Logic Tree is explained in sequence.
7.3.1 Block 1: Is the instrument a functional instrument?
Starting with block 1, first determine whether the instrument isa functional instrument (FI) or a nonfunctional, indication-onlyinstrument (II). To be a functional instrument, it must provide afunction; for example, it provides an automatic trip function, acontrol function, an alarm function, or an interlock function. If itis a functional instrument, the logic proceeds to block 2.
7.3.2 Block 2: Instrument is analyzedin the COFA worksheet and the PM task selection worksheet.
If the instrument is a functional instrument, it is analyzed in theCOFA Worksheet and the PM Task Selection Worksheet like allother components. If it is not a functional instrument, it pro-ceeds along a logic path beginning with block 3.
7.3.3 Block 3: Can the instrumentreading result in an operator having toinitiate some kind of action?
Block 3 asks the question “Can the instrument reading resultin the operator having to take some type of action?” This meansthat even though it is a nonfunctional instrument, the infor-mation readout from that instrument may result in operationspersonnel having to initiate some type of action or manually per-form a certain function. This function might be a requirement toshut off a pump if a pressure reading gets too high or write a cor-
RCM for Instruments 185
rective maintenance order after observing an instrument read-ing indicating that a component requires corrective mainte-nance. This includes instruments used during operator roundsto verify the functional operability of components whose failurecan result in an unwanted consequence.
It is not uncommon that some personnel action is requiredwhen an instrument reading indicates a certain parameter limit.Sometimes a regulatory requirement or some other required com-mitment depends on observing an instrument reading to deter-mine whether a specific parameter limit has been reached. Thisincludes virtually all control room instruments.
The purpose of asking this question is so that a prudent main-tenance strategy is applied to a nonfunctional but importantinstrument, preventing it from being a candidate for run-to-failure. A yes answer to block 3 takes us to block 4. A no answertakes us to block 8.
7.3.4 Block 4: A PM is required.Calibration criteria and periodicityguidance are as follows.
This identifies that a PM is required. If there was no previouslyexisting PM, it should be added. Usually, this entails institut-ing a PM to calibrate the instrument. Block 4 also includes spe-cific calibration criteria and periodicity guidance. Note that thisguidance is more stringent than the logic that would follow if theanswer to block 3 was no. This takes us to block 5.
7.3.5 Block 5: Were the last threesuccessive calibrations within vendor tolerance criteria?
Block 5 asks whether the last three successive calibrations werewithin the vendor accuracy tolerance. This is the nominal +/−0.25percent tolerance. Since this block includes relatively importantnonfunctional instruments, a history of the last three successivereadings must be shown to have been within vendor tolerancecriteria. If the answer is yes, proceed to block 6. If the answer isno, proceed to block 7.
186 Chapter Seven
7.3.6 Block 6: Periodicity extension is allowed.
If the last three successive calibrations were within the vendortolerance limits, an extension of the calibration periodicity isallowed.
7.3.7 Block 7: Reduce periodicity or implement a design change.
If the last three successive calibrations were not within vendortolerance limits, an extension of the calibration periodicity is notallowed. A review of calibration records should be made to deter-mine whether a reduction of the periodicity or a design changeshould be explored.
7.3.8 Block 8: Is the instrumentredundant?
This question is to determine whether the instrument is redun-dant. Is there another independent instrument not prone to com-mon mode failure associated with this instrument that measuresthe same parameter or a comparable parameter? Oftentimesthere are several instruments measuring the same parameter.
7.3.9 Block 9: Is an indicationcomparison applicable?
This question asks whether or not one may reasonably expectcomparisons to be periodically made such that excessive drift ofone instrument would be noticed and corrective action could betaken. To be considered for a comparison, the comparison read-ings must be part of a documented procedure.
Instances where this would be a reasonable expectation includethe following:
■ Both instruments are monitored and are near each other, wherean operator would easily see both.
■ Both instruments are recorded on a log taken or reviewed bythe same individual.
RCM for Instruments 187
■ Both instruments are monitored by a computer programmedto recognize a disparity between readings.
Instances where this would not be considered a reasonableexpectation include the following:
■ The redundant instrument is not normally accessible, that is,it is located in an area that is not readily accessible.
■ The redundant instrument is not comparable in terms of indi-cation readout units.
■ A computer monitors both points but does not compare them.
7.3.10 Block 10: Is the consequence of excessive drift (to the point ofinstrument failure) acceptable?
In general, consider the economic and operational consequencesof instrument failure or drift. Evaluate the ability of the specifiedPM to prevent the failure or drift. Consider the cost or conse-quences of equipment failures that are monitored by the respec-tive instrument.
If problems that would be indicated by this instrument wouldmost likely show up on other instruments as well and if the costof the failure is low and the cost of the PM is low, then the PM isoptional.
On the other hand, if the instrument fails or drifts to the pointof failure, resulting in a condition that could last for a long timewithout appropriate indication, excessive drift is not acceptable.If the cost of failure of the equipment being monitored is high,excessive drift would similarly not be acceptable.
This block considers instruments that are not significant toeither plant safety, operability, or economics. As such, if theconsequence of excessive drift is acceptable, but not to the pointof instrument failure, then an allowable drift tolerance of upto +/−5 percent is considered acceptable. If drift to the point ofinstrument failure is acceptable and no operator evolutions arebased on the instrument readings, then a calibration PM isoptional.
188 Chapter Seven
7.3.11 Block 11: A calibration PM is optional.
This block is self-explanatory.
7.3.12 Block 12: A PM is required.Calibration criteria and periodicityguidance are as follows.
This identifies that a PM is required. If there was no previouslyexisting PM, it should be added. Usually, this entails institut-ing a PM to calibrate the instrument. Block 12 also includesspecific calibration criteria and periodicity guidance. Note thatthis guidance is less stringent than the logic that would follow ifthe answer to block 3 was yes.
7.3.13 Block 13: Were the last twosuccessive calibrations within a +/−2.5 percent accuracy tolerance?
This block is applicable only to instruments not considered sig-nificant to plant safety, operability, or economics and when exces-sive drift up to 2.5 percent is acceptable. If the last two successivecalibration readings were within +/−2.5 percent, then the calibra-tion is considered to be satisfactory and a periodicity extension isallowed. If the drift was not within +/−2.5 percent, block 15 askswhether the drift was within a +/−5 percent accuracy tolerance.
7.3.14 Block 14: Periodicity extensionis allowed.
An increase in the PM periodicity is allowed.
7.3.15 Block 15: Were the last twosuccessive calibrations within a +/−5.0 percent accuracy tolerance?
This block is also applicable only to instruments not consideredsignificant to plant safety, operability, or economics and whosecalibration drift history is greater than 2.5 percent but less than
RCM for Instruments 189
or equal to 5 percent. If the last two successive calibration read-ings were between 2.5 percent and 5 percent, then the existingperiodicity is acceptable and should not be changed. If the lasttwo successive calibration readings were greater than 5 percent,a decrease in the PM periodicity or a design change should beconsidered.
7.3.16 Block 16: Periodicity extensionis not allowed.
The existing PM periodicity is acceptable and an increase in theperiodicity is not allowed.
7.3.17 Block 17: Reduce periodicity or implement a design change.
A reduction of the PM periodicity or a design change should beexplored.
7.4 Chapter Summary
A review of this chapter includes the following key points:
■ Instruments are usually in a class type of their own.■ There are two fundamental categories of instruments: func-
tional instruments (FI) and indication-only instruments (II).Instruments may also be grouped together to form a loopwhereby the entire loop is considered to be the instrument.
■ Functional instruments provide a function and are no differ-ent from any other functional component. They have a func-tion, a functional failure, a failure mode, and a consequence offailure associated with them. They also have a cause of failureand an applicable and effective PM addressing each cause offailure.
■ Functional instruments are analyzed in the COFA, the Poten-tially Critical Guideline, and the Economically SignificantGuideline.
190 Chapter Seven
■ Indication instruments provide only an indication readout, typ-ically via a gage or a monitor. The majority of instruments arein this group.
■ Indication instruments are analyzed in the Instrument LogicTree.
■ Instruments are subject to drift.■ Calibration criteria for indication instruments usually revert
to the design tolerance of +/−0.25 percent. For many indicationinstruments, this is too restrictive.
■ The Instrument Logic Tree provides for relaxed tolerances in aprudent manner depending on whether the instrument readingcan result in an operator having to take some kind of action.
■ The Instrument Logic Tree provides guidance for either extend-ing a calibration PM periodicity, reducing a periodicity, or imple-menting a design change.
■ Previous calibration histories are required to justify periodic-ity changes.
■ If indication instruments are redundant and comparison read-ings can be obtained, a calibration PM is optional.
■ When any instrument, FI or II, is calibrated during its PMactivity, it is always calibrated to its design tolerance.
RCM for Instruments 191

This page intentionally left blank
193
Chapter
8The RCM Living Program
What is a living program? Like life itself, if a program is not liv-ing and evolving, it is either dormant or deceased. A living pro-gram is a program that continues to grow, evolve, change, andadjust. It continues to breathe and adapt to alterations to itsoriginal makeup. Not unlike the fields of medicine and sciencethat are constantly evolving, a maintenance program also mustevolve. If a maintenance program remains stagnant, it no longeroffers the benefits of its intended objective. Many people believethat once they implement their RCM program, they are finishedforever. They allow the program to go into a dormant mode.What if medical science remained dormant? We would not havethe modern medical wonders of today, which include the entirefield of genetics, being on the verge of a breakthrough on curingAlzheimer’s disease, laser eye surgery, and new pharmaceuticalsthat are being developed almost every day.
In Chapter 5, when we defined the asset reliability strategy, Imade the statement that RCM is the driver for a corporate reli-ability program. This becomes more evident as industry facesgreater worldwide competition. This, in turn, spurs plants andfactories to be more diligent about finding more effective andefficient ways of doing business and maintaining profitability. Aswe also know, the maintenance budget for any plant or facilityconstitutes a significantly large portion of the total outlay. Thus,maintenance has a significant role in the bottom line of the cor-
Copyright © 2006 by the McGraw-Hill Companies. Click here for terms of use.
poration. As worldwide competition continues to grow, the corpo-ration must change and adapt to that competition, and the main-tenance program of the corporation must also evolve and stay onthe cutting edge of new maintenance technologies, continuouslyadjusting its PM program to be as efficient as possible.
You have learned how to develop a premier RCM programbased on the data that you had at the time of implementation.This is especially true for the periodicities you prescribed forthe PM tasks. However, everything is subject to change. Thesechanges can come about as a result of new failure modes thatwere nonexistent at implementation but have become apparentsince that time. New changes in maintenance methods may havebeen sufficiently beneficial to allow periodicities to be extended.On the other hand, some changes in equipment parameters mayresult in the need to reduce periodicities to maintain reliability.Modifications to the plant, modifications to equipment, changesin operating characteristics, new PdM technologies, which areappearing everyday—all these factors contribute to the need toperiodically review and update your maintenance program.
The results of the RCM maintenance program are not set incement; rather, they are set in malleable clay. What is set in con-crete is the RCM decision logic that determines which equip-ment is required to have a preventive maintenance strategy andthe PM Task Selection Logic that determines the different cate-gories of preventive maintenance. The RCM methodology doesnot change, but the results of the analysis certainly will.
8.1 A Model for an RCM Living Program
This chapter explains some of the methods to help you keep yourRCM program current and accurate. Like a car that periodicallyrequires a tune-up to keep it running efficiently and reliably, amaintenance program also requires a periodic tune-up. The dif-ference, however, is that the periodicity for the maintenance pro-gram tune-up presents itself on an almost daily basis. It becomesan automatic tune-up—self-adjusting based on the evaluation ofcompleted PM tasks; or with new input from the various ven-dors, input from the industry at large, new requirements from
194 Chapter Eight
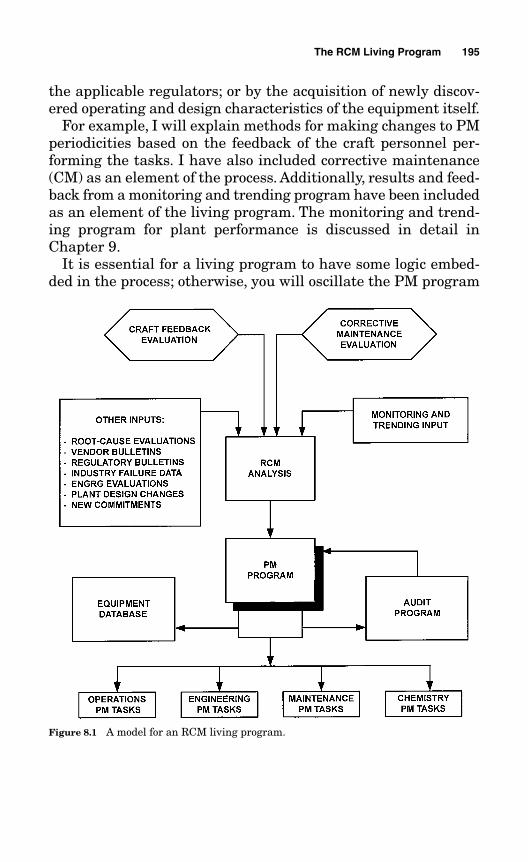
the applicable regulators; or by the acquisition of newly discov-ered operating and design characteristics of the equipment itself.
For example, I will explain methods for making changes to PMperiodicities based on the feedback of the craft personnel per-forming the tasks. I have also included corrective maintenance(CM) as an element of the process. Additionally, results and feed-back from a monitoring and trending program have been includedas an element of the living program. The monitoring and trend-ing program for plant performance is discussed in detail inChapter 9.
It is essential for a living program to have some logic embed-ded in the process; otherwise, you will oscillate the PM program
The RCM Living Program 195
Figure 8.1 A model for an RCM living program.
in a back-and-forth manner by extending periodicities and thenhaving to reduce them because you extended them too far. Thiswastes time and only results in confusion for everyone involved.Therefore, I have inserted some “intelligence” into the decisionprocesses to avert the possibility of overshooting and thus hav-ing to move a periodicity back and forth. This is all part of thecraft feedback element of the living program.
Figure 8.1 shows a model process for an RCM living program.Notice how the logic flows. All inputs feed directly into the RCManalysis. The craft feedback element and the corrective mainte-nance evaluation element are the main inputs. The other inputsand the monitoring and trending input also feed directly into theRCM engine. It is the RCM engine that drives the PM program.Extending from the PM program is the equipment database andan internal audit program. The PM program then becomes thedriver for the different organizations that perform PM tasks. Asnoted in Chapter 6, maintenance is not the only organizationperforming PM activities.
Let’s examine each element in detail.
8.1.1 The craft feedback evaluation element
This is perhaps one of the most significant elements of the livingprogram. There are many reasons why this element is impor-tant. A primary reason is that it provides direct feedback fromthe craft personnel performing the PM tasks that you estab-lished. This element verifies that the PM tasks are indeed accu-rate and correct, that they are scheduled at the right periodicity,and that they reflect the scope of work that is needed. When yourPM frequency and intervals were first established, they werebased on many factors. The feedback from the craft either vali-dates that those factors were accurate or presents a set of resultsthat provide a basis for changing the originally selected period-icity or scope of work.
The second reason for the importance of this element is that thecraft personnel themselves are involved in the process. Chapter 2mentioned the importance of having the craft personnel involved
196 Chapter Eight
in the RCM effort since they are the ultimate emissaries of theprogram. There probably is no quicker way to throw a wet blan-ket over all of your efforts than to specify time-directed PM tasksto be performed by craft personnel who can see that the equip-ment does not yet require the overhaul or replacement. This canmake them think that their work efforts are being wasted—andthey are correct to think so. If the craft personnel do not believein the results of your efforts, it won’t be long before senior man-agement begins to develop the same suspicious inquisitiveness.
This is really a matter of the craft personnel inheriting pride ofownership in the program. Chapter 2 also stated that there is nomonopoly on plant knowledge. Craft personnel are an extremelyvaluable source of information, and you will find them readyallies if you bring them into the process.
Experience has shown that the introduction of most new com-prehensive programs that affect a host of different stakeholdersachieve initial success. Nevertheless, if the program is force-fedto a major segment of the stakeholders, such as the working craftpersonnel, and they have no venue for making constructive sug-gestions, it won’t be long before that success diminishes. Remem-ber, the RCM effort may not reach 100 percent accuracy duringthe initial development process, but your program should strivefor that 100 percent goal once it has been implemented, based onthe feedback from the living program elements.
The craft feedback element can take on as much sophistica-tion as you desire, or it can remain relatively simple and still beeffective. It can be accomplished with simple forms, or it can beembedded in the software as part of your CMMS system, whichwas discussed in Chapter 4. For relatively large facilities with asizable equipment population, a computerized software processis highly recommended. For relatively smaller facilities, a simpleform may be all that is needed. Only you have the experienceand the knowledge to make that decision. I will outline a CraftFeedback methodology and logic that can be implemented eitherthrough the use of simple forms or via a more comprehensivesoftware program. You should see fit to modify, add to, or evendelete any area in order to achieve a better outcome for your spe-cific situation.
The RCM Living Program 197
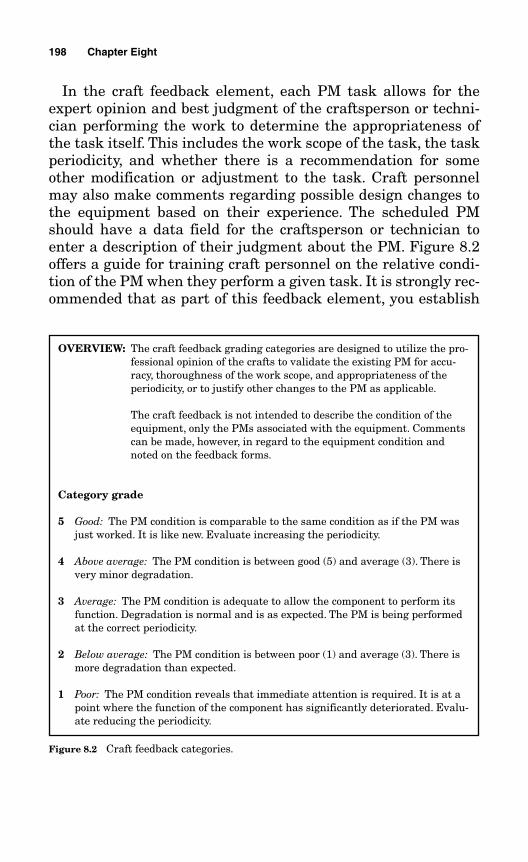
In the craft feedback element, each PM task allows for theexpert opinion and best judgment of the craftsperson or techni-cian performing the work to determine the appropriateness ofthe task itself. This includes the work scope of the task, the taskperiodicity, and whether there is a recommendation for someother modification or adjustment to the task. Craft personnelmay also make comments regarding possible design changes tothe equipment based on their experience. The scheduled PMshould have a data field for the craftsperson or technician toenter a description of their judgment about the PM. Figure 8.2offers a guide for training craft personnel on the relative condi-tion of the PM when they perform a given task. It is strongly rec-ommended that as part of this feedback element, you establish
198 Chapter Eight
OVERVIEW: The craft feedback grading categories are designed to utilize the pro-fessional opinion of the crafts to validate the existing PM for accu-racy, thoroughness of the work scope, and appropriateness of theperiodicity, or to justify other changes to the PM as applicable.
The craft feedback is not intended to describe the condition of theequipment, only the PMs associated with the equipment. Commentscan be made, however, in regard to the equipment condition andnoted on the feedback forms.
Category grade
5 Good: The PM condition is comparable to the same condition as if the PM wasjust worked. It is like new. Evaluate increasing the periodicity.
4 Above average: The PM condition is between good (5) and average (3). There isvery minor degradation.
3 Average: The PM condition is adequate to allow the component to perform itsfunction. Degradation is normal and is as expected. The PM is being performedat the correct periodicity.
2 Below average: The PM condition is between poor (1) and average (3). There ismore degradation than expected.
1 Poor: The PM condition reveals that immediate attention is required. It is at apoint where the function of the component has significantly deteriorated. Evalu-ate reducing the periodicity.
Figure 8.2 Craft feedback categories.
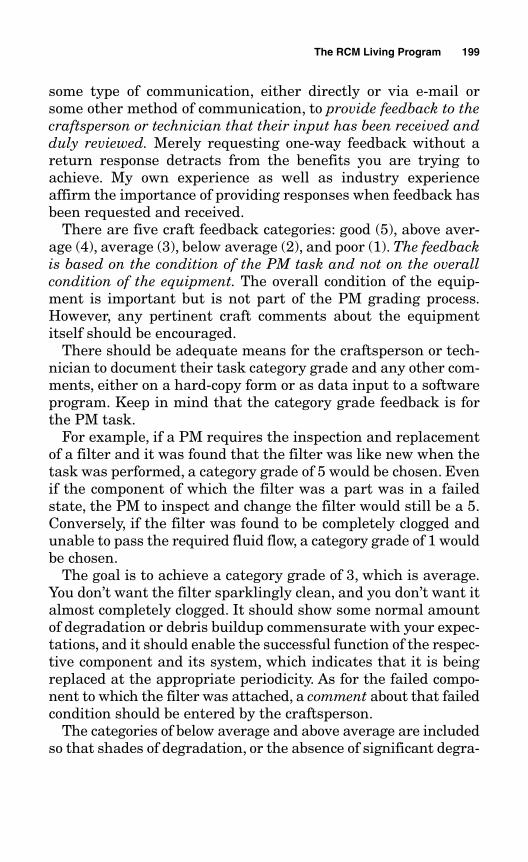
some type of communication, either directly or via e-mail orsome other method of communication, to provide feedback to thecraftsperson or technician that their input has been received andduly reviewed. Merely requesting one-way feedback without areturn response detracts from the benefits you are trying toachieve. My own experience as well as industry experienceaffirm the importance of providing responses when feedback hasbeen requested and received.
There are five craft feedback categories: good (5), above aver-age (4), average (3), below average (2), and poor (1). The feedbackis based on the condition of the PM task and not on the overallcondition of the equipment. The overall condition of the equip-ment is important but is not part of the PM grading process.However, any pertinent craft comments about the equipmentitself should be encouraged.
There should be adequate means for the craftsperson or tech-nician to document their task category grade and any other com-ments, either on a hard-copy form or as data input to a softwareprogram. Keep in mind that the category grade feedback is forthe PM task.
For example, if a PM requires the inspection and replacementof a filter and it was found that the filter was like new when thetask was performed, a category grade of 5 would be chosen. Evenif the component of which the filter was a part was in a failedstate, the PM to inspect and change the filter would still be a 5.Conversely, if the filter was found to be completely clogged andunable to pass the required fluid flow, a category grade of 1 wouldbe chosen.
The goal is to achieve a category grade of 3, which is average.You don’t want the filter sparklingly clean, and you don’t want italmost completely clogged. It should show some normal amountof degradation or debris buildup commensurate with your expec-tations, and it should enable the successful function of the respec-tive component and its system, which indicates that it is beingreplaced at the appropriate periodicity. As for the failed compo-nent to which the filter was attached, a comment about that failedcondition should be entered by the craftsperson.
The categories of below average and above average are includedso that shades of degradation, or the absence of significant degra-
The RCM Living Program 199
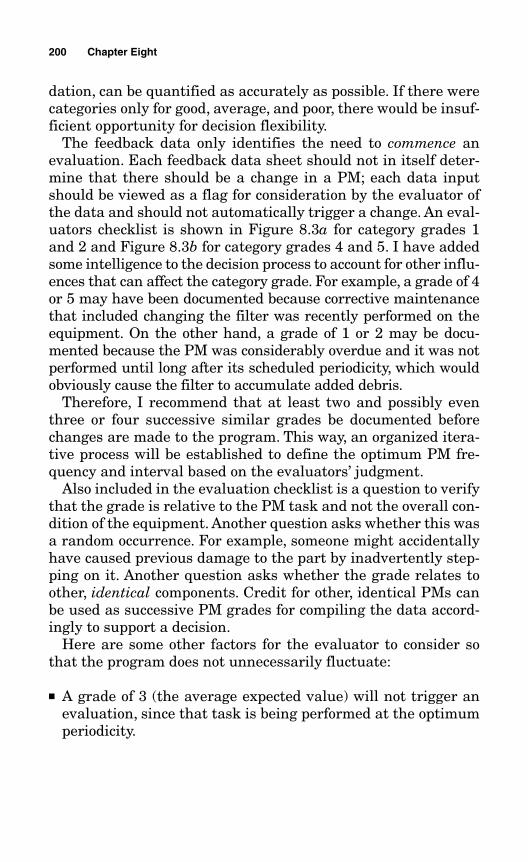
dation, can be quantified as accurately as possible. If there werecategories only for good, average, and poor, there would be insuf-ficient opportunity for decision flexibility.
The feedback data only identifies the need to commence anevaluation. Each feedback data sheet should not in itself deter-mine that there should be a change in a PM; each data inputshould be viewed as a flag for consideration by the evaluator ofthe data and should not automatically trigger a change. An eval-uators checklist is shown in Figure 8.3a for category grades 1and 2 and Figure 8.3b for category grades 4 and 5. I have addedsome intelligence to the decision process to account for other influ-ences that can affect the category grade. For example, a grade of 4or 5 may have been documented because corrective maintenancethat included changing the filter was recently performed on theequipment. On the other hand, a grade of 1 or 2 may be docu-mented because the PM was considerably overdue and it was notperformed until long after its scheduled periodicity, which wouldobviously cause the filter to accumulate added debris.
Therefore, I recommend that at least two and possibly eventhree or four successive similar grades be documented beforechanges are made to the program. This way, an organized itera-tive process will be established to define the optimum PM fre-quency and interval based on the evaluators’ judgment.
Also included in the evaluation checklist is a question to verifythat the grade is relative to the PM task and not the overall con-dition of the equipment. Another question asks whether this wasa random occurrence. For example, someone might accidentallyhave caused previous damage to the part by inadvertently step-ping on it. Another question asks whether the grade relates toother, identical components. Credit for other, identical PMs canbe used as successive PM grades for compiling the data accord-ingly to support a decision.
Here are some other factors for the evaluator to consider sothat the program does not unnecessarily fluctuate:
■ A grade of 3 (the average expected value) will not trigger anevaluation, since that task is being performed at the optimumperiodicity.
200 Chapter Eight
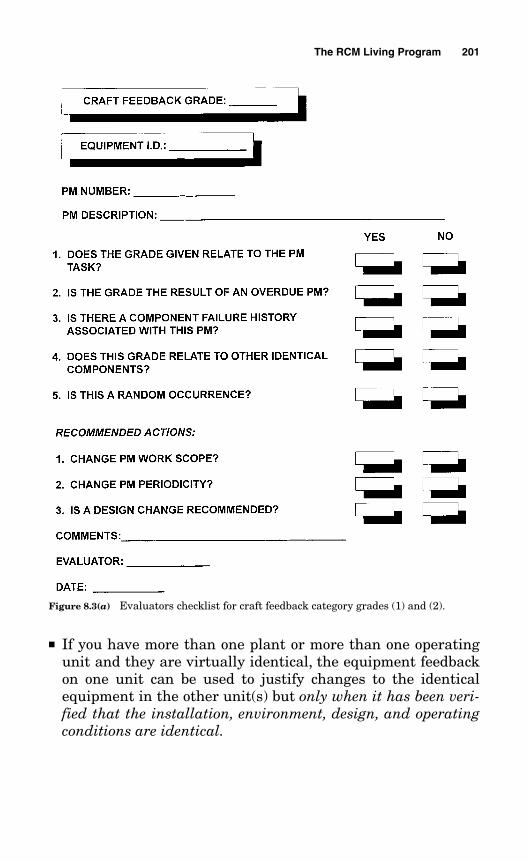
■ If you have more than one plant or more than one operatingunit and they are virtually identical, the equipment feedbackon one unit can be used to justify changes to the identicalequipment in the other unit(s) but only when it has been veri-fied that the installation, environment, design, and operatingconditions are identical.
The RCM Living Program 201
Figure 8.3(a) Evaluators checklist for craft feedback category grades (1) and (2).
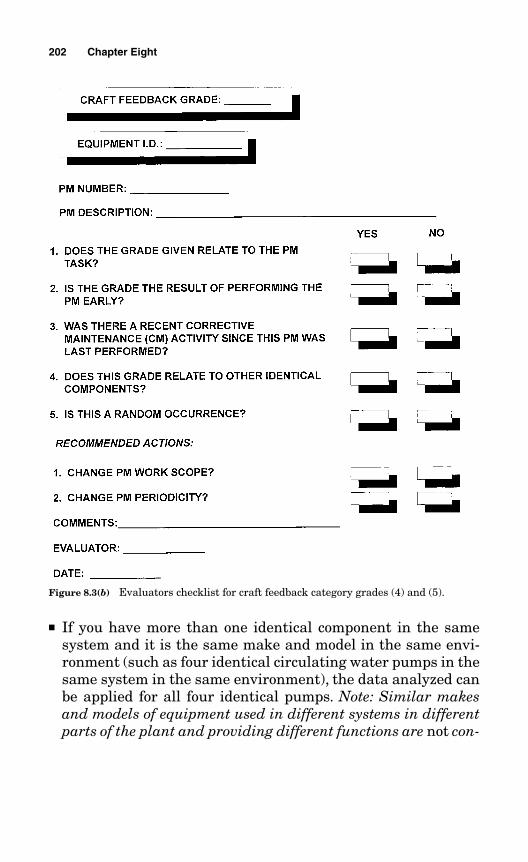
■ If you have more than one identical component in the samesystem and it is the same make and model in the same envi-ronment (such as four identical circulating water pumps in thesame system in the same environment), the data analyzed canbe applied for all four identical pumps. Note: Similar makesand models of equipment used in different systems in differentparts of the plant and providing different functions are not con-
202 Chapter Eight
Figure 8.3(b) Evaluators checklist for craft feedback category grades (4) and (5).
sidered identical, and the feedback data from one cannot beapplied to the other.
■ Many facilities will use a worklist for their PMs so that a sepa-rate PM is not planned and scheduled four separate times, forexample. In the case of the four circulating water pumps, thepumps are identical, they are in the same location, they func-tion the same, and the filters on all four pumps are identical.Therefore, instead of issuing four separate PM tickets, onlyone PM is planned and it includes cleaning all four pump fil-ters. Sometimes other work scope is scheduled on that sameticket—for example, changing the gearbox oil. If you shoulddetermine that the filter periodicity can be extended but theoil change cannot, then you have a choice: you can schedule thefilters on a different ticket to capture the benefit of the extendedperiodicity, or it may be more appropriate to keep the same peri-odicity and perform the filter maintenance and the oil changetogether on the same ticket. The decision is yours.
■ What about weekly, monthly, and quarterly PMs? These areperformed so often that it should not take long to verify theiroptimum periodicity. Once that has been determined, you maywish to evaluate whether you want to continue to include theweekly, monthly, and quarterly PMs in your feedback pro-gram, if only to reduce the number of data forms you will be receiving. This will free up your time to concentrate onreviewing and analyzing the other data inputs for the rest ofyour components.
8.1.2 The corrective maintenance (CM)evaluation element
The preventive maintenance program is continually optimizedby comparing prescribed preventive maintenance tasks againstactual corrective maintenance (CM) experience in order to effectchanges to the program as deemed appropriate.
This element of the living program evaluates corrective main-tenance activities to review for the discovery of failure modesthat may not have been identified in the original analysis or that
The RCM Living Program 203
were not apparent at the time of the original analysis. It alsoreviews CM histories to determine whether new PMs should beimplemented or changes should be made to the scope of existingPMs. If a specific component has a high CM history that can beaddressed by a PM, it might be that the component was over-looked as an economic component and should have been cap-tured in the Economically Significant Guideline.
The CM evaluation could result in adding PMs, deleting PMs,increasing or decreasing the PM work scope, extending or reduc-ing the PM periodicities, or determining that the plant can toler-ate the corrective maintenance and no further action is required.The CM evaluation is a very important input to the living pro-gram to ensure that the preventive maintenance program is upto date and as efficient as possible.
If a critical, potentially critical, commitment, or economic com-ponent continues to have a history of pertinent corrective main-tenance activity, it could be an indicator of any of the followingconditions:
■ The PMs for those components are deficient in their scope ofwork.
■ The periodicities of the PMs for those components could beincorrect.
■ The PMs are not being performed when scheduled.■ Deficiencies in the work control process exist relative to plan-
ning and scheduling the work.■ Parts availability is a problem.■ A design change may be necessary.
Of course, the PM tasks must have had an opportunity to be inplace for at least one complete scheduled cycle. Corrective main-tenance can occur if the PMs have not yet had time to be embed-ded in the program.
As I mentioned in Chapter 5, a CM count by itself is not anindicator of a deficient PM program. Some RCM books will auto-matically classify a component as critical if it has a large num-ber of CMs. That is an incorrect indicator. There are a multitude
204 Chapter Eight
of CMs generated to correct very minor deficiencies that do notthreaten the operability or functionality of the component. Exam-ples include minor nicks or scratches, minor packing adjustments,and missing I.D. tags. Counting these totally irrelevant CMs andusing them to justify a preventive maintenance program deci-sion is neither prudent nor cost effective.
The types of CMs that must be included in a preventive main-tenance program decision process include those CMs that weregenerated due to a failure or significant degradation of a critical,potentially critical, commitment, or economic component.
The threshold for generating a CM varies depending on yourindustry and the type of plant or facility. Some industries do notallow any work to be performed that was not specifically includedin the PM work scope. If the PM was to inspect a specific piecepart and the part next to it was in need of repair, a new CM wouldbe required for the piece part that was not included in the workscope. Some industries allow more flexibility about the additionalwork that can be performed based on the knowledge and experi-ence of the craft personnel performing the PM. Understandingthis supports the disavowal of another generally accepted fal-lacy: that a metric included in your PM program should be aPM/CM ratio. Any directive for a specific number of CMs thatshould be expected for each PM is questionable at best. Mostreliability experts have abandoned this mistaken correlationlong ago.
Another issue that is central to CMs is how they relate to pre-dictive maintenance. As we learned, PdM is the task of choicefor the PM program. But what happens when a PdM task findsa motor bearing vibrating excessively that requires immediatereplacement? Is the motor replacement included as part of thePdM task (i.e., a condition-directed PM), or is a CM generated toreplace the motor once the PdM task has discovered the exces-sive vibration? Chapter 10 delves deeper into this question.
8.1.3 The “other inputs” element
A living program is always affected by various inputs that resultfrom a multitude of sources. Each one of these inputs can affectthe PM program. Some of the more common ones are as follows.
The RCM Living Program 205
8.1.3.1 Root-cause evaluations Depending on the industry, youmay or may not be familiar with root-cause evaluations. In mostregulated industries such as airlines and nuclear power, a com-ponent failure that resulted in a significant failure consequenceentails a formal root-cause evaluation to not only determine thecause of the failure but also ascertain which barriers were insuf-ficient to have allowed the failure to occur. Some of the factorsthat are considered include: What human-factor deficienciesexisted? What procedural inadequacies existed? Was there amanagement culture issue that led to the failure? Has this typeof failure occurred before? Has a similar failure occurred withinthe industry? The main objective of a root-cause evaluation isto prevent that occurrence from ever happening again. Severalrecommendations usually result from a root-cause evaluation.Invariably one of the recommendations includes some type of cor-rective action relative to the preventive maintenance program.
Some industries that are not regulated may nevertheless befamiliar with this rigorous type of evaluation and are aware ofthe corrective actions that result. Industries not familiar withroot-cause evaluations may wish to learn more about the valueof implementing this strategy.
8.1.3.2 Vendor bulletins Vendor bulletins are another source ofinformation that oftentimes result in a change to the preventivemaintenance program. Vendor manual recommendations for pre-ventive maintenance tasks to be performed on their equipmentare obviously going to be ultraconservative. The vendors want tominimize their warranty obligations, and the more spare partsyou order, certainly the happier their financial people will be. Asnoted in Chapter 6, vendor recommendations should be only oneof many considerations for establishing your PM program. Rou-tine vendor-recommended tasks should always be tempered byyour own actual in-house experience.
Vendor bulletins are another issue. Quite often, a design defi-ciency or some other type of manufacturing flaw is reported to avendor, and they are required to take action accordingly. A ven-dor bulletin should be taken more seriously than the routine ven-dor manual PM recommendations. You may need to take rather
206 Chapter Eight
quick corrective action on equipment supplied by a vendor whohas issued a bulletin delineating a design deficiency.
8.1.3.3 Regulatory bulletins Industries governed by regulatoryentities often receive regulatory bulletins. These bulletins havea very high priority of importance. A regulatory agency fre-quently issues a bulletin—sometimes in the form of an informa-tion notice—when something needs immediate attention. Thismight be a new requirement to perform a specific inspection, ora certain part replacement might be required. This is quite com-mon in commercial aviation when a design problem has beendiscovered by the airframe manufacturer or the FAA. In mostinstances when a regulatory bulletin or information notice ispublished, it affects some aspect of the maintenance program.
Bulletins and information notices can be issued by OSHA, EPA,NASA, NRC, FDA, or any regulatory agency. It is not uncommonthat a totally new preventive maintenance program additionbecomes a permanent requirement as the result of a bulletin orinformation notice. If the component under scrutiny has notalready been identified as critical or potentially critical, it willbecome a commitment component.
8.1.3.4 Industry failure data This is another source of input tothe living program. As previously mentioned, many industriesshare their failure data with each other. Even in a competitiveenvironment, sharing of important failure data trumps thesecrecy factor. No one wants to see another plant or facility havea fire, an explosion, or an injury, caused by a known defect thatcould have been prevented by sharing technical knowledge.Therefore, failure data about similar equipment used by othersin the same industry is a consideration for the preventive main-tenance program at your facility.
It is important to note that this industry data needs to be care-fully reviewed before blindly implementing any changes to yourprogram. For example, just because a component caused an eventat one facility does not automatically mean that a like compo-nent will cause the same event at another facility. You need toknow whether it was a design defect or an operating condition
The RCM Living Program 207
that caused the failure. A design defect could be common to anyplant using that component. An operating condition where thelike component was used in a totally different environment withtotally different operating parameters may not necessitate thatyou change your program. What if valve XYZ was used in asmelter where the failure was caused by temperatures in excessof 1000°F, but you use a similar XYZ valve in a refrigerated areawhere the temperature never reaches ambient? Industry datafunctions only as a flag. Further evaluation is required to ascer-tain its applicability to your facility.
8.1.3.5 Engineering evaluations These are similar to root-causeevaluations, but they are not quite as formal. For facilities thathave an engineering staff, it is very common for plant events andequipment failures to trigger an engineering evaluation. When-ever this occurs, a change of some kind to the preventive main-tenance is almost always guaranteed. Again, if the componentbeing evaluated has not already been classified as critical orpotentially critical, it would most likely be recommended as acommitment component following the engineering evaluation,albeit an internal commitment.
8.1.3.6 Plant design changes Plant design changes and modifi-cations may affect the PM program through the addition of newequipment or through changes to the way the existing equip-ment operates and functions. It is an obvious input to the RCManalysis to determine the classification for any new components.They range from being critical to being run-to-failure. The RCMprocess determines whether the new equipment or the new func-tional design of the existing equipment has an effect on the pre-ventive maintenance program. The COFA Worksheet and theCOFA Decision Logic Tree yield the correct resolution.
8.1.3.7 New commitments This input is similar to the commit-ments that could come about through root-cause evaluations,vendor bulletins, regulatory bulletins, information notices, andengineering evaluations. Depending on your industry, a new com-mitment may also come about by “edict.” It is not an uncommon
208 Chapter Eight
occurrence for a CEO, vice president, or director to declare acommitment. It would be unlikely, however, if their edict was notalready included in your asset reliability criteria, discussed inChapter 5. If it wasn’t included, it now needs to be.
8.1.4 Monitoring and trending
Monitoring and trending is a term that can have very differentconnotations depending on what it refers to. Monitoring andtrending can refer to either individual components or the entireplant. When it refers to individual components, monitoring andtrending is performed to detect incipient failures and degrada-tion rates for a component before total failure of the componentoccurs. It includes performing condition-monitoring PdM activi-ties, analyzing the results of those activities, and comparing themto previous readings to detect trends and rates of equipmentdegradation. This feedback loop is a very important element foradjusting PM periodicities and for effecting other changes to thePM program such as whether failure of the component can be pre-vented by different or more frequent planned maintenance.
When monitoring and trending refers to the entire plant, itentails establishing metrics to monitor and trend the overallperformance of your plant. Chapter 9 is devoted entirely to mon-itoring and trending overall plant performance. It is the naviga-tional radar by which you can tell whether your RCM programis performing as it was intended. This data is also extremelyimportant as an input to your living program and provides veryinsightful feedback on the effectiveness of your PM program.
8.1.5 The RCM analysis element
All input elements feed directly into the RCM engine. It is withinthe RCM analysis element that all decisions regarding changesto the preventive maintenance program are made. All inputsgo through the same COFA logic to determine their applicabil-ity to the PM program, except, of course, for any new regulatoryrequired commitments that automatically become part of thepreventive maintenance program.
The RCM Living Program 209
The craft feedback, corrective maintenance evaluation, andmonitoring and trending elements do not automatically invokechanges to the PM program until they are reviewed and subse-quently analyzed in the RCM process. It is important to main-tain vigilance about the PMs added to the program or you willfind your program escalating with mostly unnecessary work.
The inputs to the RCM engine are dynamic and proactive. Theinput elements should be continuously evaluated on a real-timebasis. This goes beyond the SAE JA1011 document, which rec-ommends only a periodic review. I have positioned the logic forthe living program so that you do not have to wait for a periodicreview to take action, because doing so places you in a reactivemode by definition.
Your RCM-based preventive maintenance program shouldremain cutting-edge by incorporating changes as soon as theybecome evident. This could result in prudent additions to the pro-gram, or it could result in deleting PMs from the program. Peri-odicity changes could also go in either direction. They may beextended, or they may need to be reduced. New PdM technologiescould be implemented to eliminate time-directed PMs. The pro-gram remains dynamic; hence, it is truly a living program.
8.1.6 Equipment database
The equipment database should always remain current. Eachequipment I.D. should be classified according to the COFA logicas to whether it is critical, potentially critical, commitment, eco-nomic, or run-to-failure. Some facilities may wish to designateonly the classifications of critical, potentially critical, commit-ment, and economic components and assume all other compo-nents are run-to-failure. This is acceptable as long as eachcomponent is analyzed and accounted for. Without a specificdesignation, it cannot be determined whether the undesignatedcomponent is an RTF component or an unanalyzed component.
8.1.7 The PM audit
This is an important element to consider. The audit program Iam advocating should be periodic. Different facilities and differ-
210 Chapter Eight
ent industries will have their own methodologies for how andwhen changes are made to the PM program and who makesthem. It is highly recommended that one group and one super-visor be responsible and ultimately accountable for adminis-tering all changes to the program. He or she should be thegatekeeper for all changes. A program where changes can bemade by anyone with access to the electronic database or to theindex card filing system discussed in Chapter 4 is an invitationto trouble and causes problems. There have been many instanceswhere lack of controls has allowed unauthorized entry to thedatabase to delete tasks, change periodicities, and even addtasks without any justification whatsoever and without anyoneknowing about the changes except for the person making them.If this is the type of arrangement your facility has and if youare in a regulated environment, you are in for a hard time.Even if you are not in a regulated environment, this is still nota good practice.
Distinct procedural guidance on who is responsible andaccountable for administering all changes to the preventivemaintenance program, how the changes are to be documented,and when they occur is an absolute necessity. The programadministrator does not have to be the RCM point of contact. Theadministrator should, however, be the single point of contact fordocumenting and maintaining the records for all changes.
There is one small challenge for the program administrator.As we learned, the preventive maintenance program is not amaintenance-only program. It is a plantwide preventive main-tenance program with various organizations all contributing toperforming the various PM activities. Therefore, the recom-mended PM activities for each component should delineate veryclearly which group has responsibility for a given task. For exam-ple, if the PM Task Selection Logic Tree credited an operatorwalk-around as the inspection type of PM for a given component,that responsibility needs to be documented accordingly.
The final PM program that compiles all of the PM tasks for allof the components in the program should clearly identify who isresponsible and accountable for performing each task. In manyindustries, the engineering organization is responsible for PdMactivities such as thermography, vibration analysis, and oil anal-
The RCM Living Program 211
ysis. Remember, these are condition-directed PM tasks that arecredited with maintaining the reliability of critical equipment. Ifthere is no accountability on the part of whoever performs thesetasks and if there is no documentation that these tasks are beingperformed at the required periodicity, you have a major flaw inyour preventive maintenance program.
Oftentimes, the work activities by organizations other thanmaintenance are not included in a common CMMS system, andany omissions concerning work being accomplished, or when itwas accomplished and who accomplished it, escape detection.Thisis not a good situation. There are many ways to administrativelyhandle this challenge, and it is best left to each facility to deter-mine how to achieve this absolutely imperative requirement.
Just imagine having to explain to senior management how amajor unwanted plant event occurred when it was caused by thefailure of a component classified as critical. This is especiallyegregious when the component was supposed to be monitored forincipient failures by a host of recommended PdM tasks to pre-vent its ultimate failure, but those tasks were never accomplishedor were seldom done on time. However, no one recognized thisbecause of administrative loopholes and a lack of accountabilityin your preventive maintenance program process. Sitting in yourvice president’s office explaining this event and the reasons for itis not the most desirable position to be in.
In summary, an audit of the PM program should be made peri-odically to ensure that no unauthorized changes have been madeand that all scheduled PM activities, regardless of the responsi-ble organization, have been appropriately accomplished.
8.2 Chapter Summary
Following is a summary of the living program elements:
■ A living program is a live program that continues to grow,evolve, change, and adjust.
■ It is essential for a living program to have some logic embed-ded in the process; otherwise, you will oscillate the PM pro-gram in a back-and-forth manner by extending periodicities
212 Chapter Eight
and then having to reduce them because you extended themtoo far.
■ The craft feedback element allows for the expert opinion andbest judgment of the craftsperson or technician performing thework to determine the appropriateness of the task itself. Thisincludes the work scope of the task, the task periodicity, andwhether there is a recommendation for some other modifica-tion or adjustment to the task.
■ There are five craft feedback categories: good (5), above aver-age (4), average (3), below average (2), and poor (1). The feed-back is based on the condition of the PM task and not on theoverall condition of the equipment.
■ The goal is to achieve a category grade of (3), which is average.■ Intelligence has been added to the decision process to account
for other influences that can affect the category grade.■ Similar makes and models of equipment used in different sys-
tems in different parts of the plant and performing differentfunctions are not considered identical, and the feedback datafrom one cannot be applied to the others.
■ The corrective maintenance evaluation element of the livingprogram evaluates corrective maintenance activities to reviewfor the discovery of failure modes that may not have been iden-tified in the original analysis or for new failure modes thatwere not apparent at the time of the original analysis. It alsoreviews CM histories to determine whether new PMs shouldbe implemented or changes should be made to the scope ofexisting PMs.
■ A root-cause evaluation is used in most regulated industriessuch as the airlines and nuclear power, where a componentfailure that resulted in a significant failure consequence entailsa formal root-cause evaluation to not only determine the causeof failure but also ascertain which barriers were insufficient tohave allowed the failure to occur.
■ A vendor bulletin is issued if a design deficiency or some othertype of manufacturing flaw is reported to a vendor and they
The RCM Living Program 213
are required to take action accordingly.A vendor bulletin shouldbe taken more seriously than the routine vendor manual PMrecommendations.
■ A regulatory agency generally issues a bulletin—sometimesin the form of an information notice—when something needsimmediate attention.
■ Many industries share their failure data with each other. Evenin a competitive environment, sharing of important failure dataoverrides the secrecy factor. No one wants another plant orfacility to have a fire, an explosion, or an injury caused by aknown defect that could have been prevented by sharing tech-nical knowledge. Therefore, failure data about similar equip-ment used by others in the same industry is a considerationfor the preventive maintenance program at your facility.
■ In facilities that have an engineering staff, it is very commonfor plant events and equipment failures to trigger an engi-neering evaluation. Whenever this occurs, a change of somekind to the preventive maintenance program is almost alwaysguaranteed.
■ Plant design changes and modifications may affect the PMprogram through the addition of new equipment or throughchanges to the way the existing equipment operates andfunctions.
■ Monitoring and trending plant performance data is the navi-gational radar by which you can tell whether your RCM pro-gram is performing as it was intended.
■ All input elements feed directly into the RCM engine. It iswithin the RCM analysis element that all decisions regardingchanges to the preventive maintenance program are made.
■ The equipment database should always remain current. Eachequipment I.D. should be classified according to the COFAlogic, as to whether it is critical, potentially critical, commit-ment, economic, or run-to-failure.
■ It is highly recommended that one group and one supervisorbe responsible and ultimately accountable for administeringall changes to the preventive maintenance program.
214 Chapter Eight

■ The recommended PM activities for each component shoulddelineate very clearly which group has responsibility for agiven task.
■ An audit of the PM program should be made periodically toensure that no unauthorized changes have been made andthat all scheduled PM activities, regardless of the responsibleorganization, have been appropriately accomplished.
The RCM Living Program 215

This page intentionally left blank
217
Chapter
9An RCM Monitoring
and Trending Strategy
Chapter 3 briefly explained how to tell whether your plant isreliable. After you have performed a comprehensive RCM analy-sis and allowed some finite period of time for the program tobecome embedded, if there is a very clear absence of any seriousconsequences of failure at your plant, and your workload is uti-lized primarily for planned maintenance activities rather thanunplanned events, then that is somewhat of an indicator of ahealthy reliability program.
Let’s go further than settling for “somewhat of an indicator”and delve into a strategy that monitors and measures aggregateperformance criteria so that you can be proactive in quantita-tively assessing your plant reliability. An aggregate philosophyaffords you the capability of making quicker decisions instead ofreactively responding to make any course corrections if they areneeded.
I will show you how to establish vernier navigational metricsso that relatively small adjustments are all that would be neces-sary to make any needed course corrections to your reliabilityprogram. The data required for these metrics can easily beobtained, and if you have a comprehensive CMMS system orinternal IT resources, the metrics can be computerized to mini-mize any labor-intensive efforts. The plant performance calcula-
Copyright © 2006 by the McGraw-Hill Companies. Click here for terms of use.
tions and graphs used here can be easily created with a simpleExcel spreadsheet.
9.1 What Is Reliability and How Do You Measure It?
Reliability is a commonly used term, but what is it? How do youmeasure it? Does it encompass just counting the number of planttrips per year to determine whether your plant is reliable or not?Or is it the capacity factor of your plant? Is it the mean timebetween failure (MTBF) for certain components? As you will seelater in this chapter, these generic and rather thin measuringstandards, which are the most commonly associated measure-ments of reliability, can be deceiving and even lull you into afalse sense of comfort and security if they are used alone.
Reliability was defined by Nowlan and Heap as “the probabil-ity that an item will survive to a specified operating age underspecified operating conditions without failure.” That is a correctdefinition in regard to the reliability of a specific item basedsolely on failures. But how do you measure the reliability of theentire entity? What are the precursors to failure that cause con-cern that the entire plant may not be reliable? Addressing theseconcerns requires more depth than just looking at reliability asthe probability of failure of a given item.
Applying Nowlan’s definition of reliability to the human body,the reliability of a person could be defined as “the probabilitythat an individual will survive to a specified age under specifiedliving conditions without dying.” This is likewise a correct state-ment. But as we know, there are many subtle precursors to fail-ure that can affect that outcome. For example, how many caraccidents was the person involved in and was he or she at faultfor most of them? This is an indicator of reckless driving habitsand maybe the person won’t live to a very old age if that indica-tor continues at the same level. How many times was the indi-vidual overdue for a physical examination? This is an indicationof apathy in regard to one’s health. How many times was theperson cited for serious infractions of the law? This is an indica-tion that the person’s behavior may be imprudent and that he or
218 Chapter Nine
she may not have as many years to live as anticipated. Was theperson a smoker or a heavy drinker? Did the person’s activitiesinclude high-risk sports like skydiving and bungee jumping?These are all valid precursors that provide some insight into theindividual’s longevity. Can you see how these examples are anal-ogous to precursers at your facility?
Reliability is more than just the probability that an individualitem will survive without failure. Likewise, it is more thanmerely counting gross numbers of failures or the number of lostproduction days resulting from some type of equipment failure.It is necessary to go beyond Nowlan and Heap’s definition andview reliability more as a measurement of events, which I defineas the cumulative and integrated rate of unwanted aggregateevents per unit of time, where the events are not limited to justequipment failures. By this, I mean that reliability includes awhole host of unwanted events and occurrences that can be mea-sured as a rate of unit operating hours. Reliability represents abroader spectrum of events than just failures, and thus, reliabil-ity measurements can offer much more intuitive insight fordetermining how well your facility is performing.
In many industries, a major fallacy comes into play when com-paring one operating entity to another. This is true when com-parisons are made without applying a normalizing reliabilityperformance rate input to the equation by simply counting thenumber of failures or the number of power reductions or thenumber of times a plant incurred an unwanted trip. This fallacyis particularly misleading when you are comparing, for example,the reliability of one plant to that of another. All such compar-isons should be normalized by using a rate per x number of unitoperating hours.
For example, one plant experiences a certain number of occur-rences when it has operated for only 50 percent of the availabletime compared to the same number of occurrences at anotherplant that was operational for 100 percent of the comparisonperiod. This is hardly an accurate or fair standard for compari-son. Later in this chapter I will introduce you to some typicalaggregate performance metrics that I have found to be quite use-ful for determining how well a facility is being run.
An RCM Monitoring and Trending Strategy 219
9.2 Monitoring Reliability Is LikeMonitoring the Human Body
For years I have observed how inadequate the power generationindustry was in regard to monitoring its own effectiveness, aswell as its failure to establish an accurate and potent metric tomeasure reliability performance. It has been a struggle to instillany real intelligence in this issue.
If your facility operates the way the electric utility industrydoes, your navigation tools for assessing plant performance areprobably somewhat crude and rather general. The most com-monly referenced measurement factors are metrics such as thenumber of unplanned shutdowns in the past year and theamount of capacity factor that was lost in the past year. It is notwrong to use these metrics; they are just not good enough.
The metrics I use to monitor the health of a facility are analo-gous to the metrics for monitoring the health of the human body.The metrics shown in Figure 9.1 can be applied to your entireplant or to each individual system. As noted in Chapter 4, youralphanumeric component database will probably be sortable bysome type of system designator. If you have this sort capability,the metrics can be applied on a system basis. If you do not havethis sort capability, it is not necessary to create it since the met-rics can be applied to the entire facility. As you will see later inthis chapter, it is easier to apply the metrics to the entire facility,but there are inherent advantages to monitoring each systemindividually. Once again, the choice is yours.
9.3 Caution: Avoid Analysis ParalysisPerformance Monitoring
I have mentioned several times that any program, whether it isan RCM program or a monitoring and trending program, can bemade extremely difficult and complex or very robust and simple.I prefer the latter. A powerful example can be found in thenuclear power industry. As sophisticated as this industry mayseem to be, the navigation tools it used for many years to trackits own performance were based on two primary metrics: (1) howmany plant trips occurred? and (2) what was the plant capacity
220 Chapter Nine
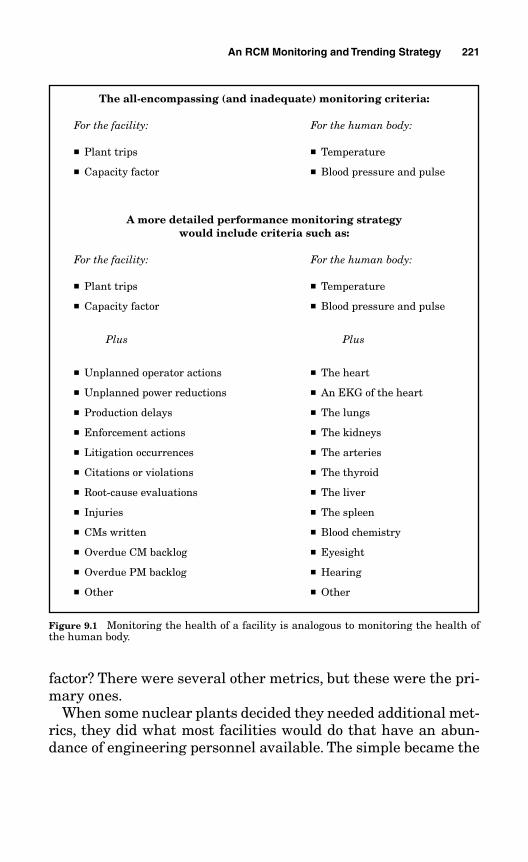
factor? There were several other metrics, but these were the pri-mary ones.
When some nuclear plants decided they needed additional met-rics, they did what most facilities would do that have an abun-dance of engineering personnel available. The simple became the
An RCM Monitoring and Trending Strategy 221
The all-encompassing (and inadequate) monitoring criteria:
For the facility: For the human body:
■ Plant trips ■ Temperature
■ Capacity factor ■ Blood pressure and pulse
A more detailed performance monitoring strategy would include criteria such as:
For the facility: For the human body:
■ Plant trips ■ Temperature
■ Capacity factor ■ Blood pressure and pulse
Plus Plus
■ Unplanned operator actions ■ The heart
■ Unplanned power reductions ■ An EKG of the heart
■ Production delays ■ The lungs
■ Enforcement actions ■ The kidneys
■ Litigation occurrences ■ The arteries
■ Citations or violations ■ The thyroid
■ Root-cause evaluations ■ The liver
■ Injuries ■ The spleen
■ CMs written ■ Blood chemistry
■ Overdue CM backlog ■ Eyesight
■ Overdue PM backlog ■ Hearing
■ Other ■ Other
Figure 9.1 Monitoring the health of a facility is analogous to monitoring the health ofthe human body.
complex, and the monitoring program became an empire untoitself. What had been a one-page metric became a metric “book”consisting of several hundred pages, which for the most part wasunusable and impractical. The metrics consisted of innumerablesubjective opinions, attitudes, and beliefs, accompanied by exten-sive excuses to justify poor performance.
Performance metrics are intended to provide senior manage-ment with a snapshot of how reliably their asset is performing.Vice presidents do not have two weeks to read a “book” filledwith opinions to ferret out that answer. The metrics should besimple, comprehensive, and objective, and they should providean aggregate snapshot of reliability.
9.4 The Aggregate Metrics
Think how comprehensive your medical examination would be ifthe only monitoring that took place was to record your tempera-ture, blood pressure, and pulse. That would hardly constitute athorough physical examination to determine your level of healthand the performance of your body. What about your heartrhythm, kidney function, lung capacity, blood chemistry, bonedensity, and so on?
As unlikely as it may seem, the extent of monitoring thatmany industries use to determine the health and reliability oftheir facilities is analogous to the limited monitoring of yourphysical well-being that would include only your temperature,blood pressure, and pulse. That is way too Spartan in today’scomplex environment to effectively evaluate the performanceand reliability of a facility.
The metrics I used to create the monitoring and trendingstrategy include all of the possible events and performance datathat can have an impact on plant reliability. Unplanned tripsand capacity factors are included in the metrics, but they are notthe only considerations. The events I refer to are those caused byequipment problems or an inadequate preventive maintenanceprogram; they are not events caused by the weather, an act ofGod, or human intervention. I have attempted to integrate all ofthe possible dynamics that can occur, with a weighting factor
222 Chapter Nine
incorporated for each one depending on the relative importanceof the event or occurrence.
The monitoring and trending strategy is simple to understandand simple to use, and the results can be computed and graphedautomatically even within a basic Excel spreadsheet. The ulti-mate plant performance rate is made to be as objective as possi-ble. As long as the weighting factor remains constant for eachevent type, the calculated six-month moving average of youraggregate plant performance rate will maintain its degree ofconsistency and objectivity so that it becomes a true trendingcomparison of your system and/or plant rate of performancefrom one time interval to the next, whether it be week to week,month to month, or year to year.
Furthermore, reliability should be measured per a unit of time.It is more appropriately measured as a rate per 1000 unit oper-ating hours, for example. Therefore, the aggregate metrics I havecompiled are computed for a given rate of time. I do not believethat performance should be based on a static gross number ofoccurrences. Reliability can thus be measured in quantitativeterms rather than based on opinions or loose interpretations andpredictions by those responsible for assembling and managingthe monitoring program. If objectivity is missing from the moni-toring and trending strategy, it becomes too easy to manipulateand skew the results.
Let’s look at each one of the metrics.
9.4.1 Unplanned plant or facility trips
Unplanned trips are a metric weighted with a relatively heavyfactor. This is an event that should not be occurring with any reg-ularity. It results in a total loss of production, generating capabil-ity, or mission objective, and in many instances it triggers theactuation of emergency systems. In an automobile manufactur-ing plant, how many times did the assembly line shut down? Howmany times did a cruise ship require a tugboat escort back to har-bor? How many times did an electrical generating unit shutdown? How many satellite launches were aborted? How manyflights were cancelled? These are all considered plant trips.
An RCM Monitoring and Trending Strategy 223
An excessive number of these events per year is an indicationthat your facility is not operating as reliably as possible, andimprovement in your preventive maintenance program or possi-bly some design changes may be needed if the PM program aloneis unable to eliminate these occurrences.
9.4.2 Capacity factor
How much less than 100 percent of the available time did yourplant operate, not counting planned outage time and otherplanned downtime? Obviously plant trips, power reductions, andproduction delays are functions of this metric. This is an accept-able metric, but all too often it is used in isolation, and whenused by itself, it does not provide a realistic indication of overallplant performance. Later in this chapter you will see how thismetric by itself can be quite misleading.
9.4.3 Unplanned operator actions
This is an indicator of the number of times plant operators havebeen required to take some type of unplanned action to cir-cumvent an unwanted occurrence or take other compensatoryactions as the result of a component failure or some other defi-cient plant condition. In many industries, a logbook is main-tained to capture these unplanned operator events.
This is a subtle metric that is often overlooked but can be veryenlightening for revealing precursors to unwanted plant conse-quences and underlying equipment problems. For example, doeseach day present a myriad of challenges to the plant operators,where they are continually trying to avert some major unwantedevent, or does the facility run rather smoothly on a daily basis?There will be normally expected operator evolutions as a courseof routine operation of the plant, and those events are not con-sidered in this metric. Only those unexpected occurrences thatrequire some type of operator action that is totally out of theordinary routine are part of this metric.
Such an occurrence might be an immediate action required onthe part of the operator to avert a serious plant consequence, or
224 Chapter Nine
it might be an operator work-around. Operator work-aroundsare not considered normal practice, and they become a distrac-tion and diversion from normal operator duties. For example, awork-around could involve the manual operation of a componentor system that normally operates on auto. Continually having toestablish alternate operating parameters or other actions tocompensate for plant deficiencies can negatively influence thereaction time in the event of a real emergency. This is an impor-tant indication that a preventive maintenance program is inneed of more attention.
9.4.4 Unplanned power reductions
How many times has your facility had to downpower in order togain access to and clearance for the repair or replacement of afailed component? Many components cannot be worked on underfull-power conditions. Another consideration is how many timesa component has failed that required the immediate down-power of the plant to prevent it from tripping offline. A plantthat constantly has to downpower for unplanned reasons is obvi-ously not operating at its optimum reliability level. Power reduc-tions can last for minutes, hours, or even days and weeks. Thetime duration threshold for including this metric is based on theasset reliability criteria and the qualifying condition of time youselected. A pattern of unplanned power reductions, for whateverreason, that are in excess of several hours per occurrence is notan indication of a reliable plant.
9.4.5 Production delays
Does your facility constantly experience nuisance productiondelays even for short durations of time? These can be any one ofa host of different types of delays, such as assembly line delays,departure delays, launch delays, or manufacturing delays. Eventhough each one of these may be of a short duration, there issomething telling about having an abundance of them. An exces-sive number of these delays indicates a preventive maintenancedeficiency.
An RCM Monitoring and Trending Strategy 225
9.4.6 Enforcement actions
If your plant is subject to enforcement actions as a result of plantperformance issues, regardless of the reasons for them andregardless of how well you believe your plant is operating, youshould consider them a wake-up call telling you that all is notwell with your preventive maintenance program. Enforcementactions may occur as the result of an accumulation of insignifi-cant infractions that, when looked at in their totality, signify tothe regulators that something is amiss. In regulated industries,enforcement actions are a decidedly undesirable occurrencesince they can bring down the wrath of the regulators upon youand cause you to be subject to more oversight and scrutiny thanyou are accustomed to.
The regulators are continually getting smarter. Regulatedfacilities are subject to periodic routine inspections, and enforce-ment actions are quite common when the regulators perceive anundercurrent of problems. Even though a less visionary man-agement might try to sugarcoat the real issues by arguing thateverything is okay because the plant is running at 99 percentcapacity, it is only a matter of time before those underlying prob-lems not only result in a diminution of your capacity factor butcreate the real potential for a major unwanted event to occur.
Usually, enforcement actions are the result of a series of smallevents that are really precursors to larger unwanted events.Even though your capacity factor may be high and you may nothave had any plant trips (remember, this is analogous to lookingonly at your blood pressure and pulse rate), that does not inocu-late your facility against enforcement actions. This is anothersubtle metric that is usually dismissed if the plant is perceivedto be running at maximum output.
9.4.7 Litigation occurrences
These events are most undesirable, and for regulated industriesthey go hand in hand with enforcement actions. These are litiga-tion occurrences caused by equipment failures, not litigation asa result of patent infringement, for example, or any other litiga-tion outside the boundary of cause by the preventive mainte-nance program. Chapter 1 mentioned that a famous theme park
226 Chapter Nine
was in the headlines of the major newspapers for litigation thatresulted from injuries caused by mechanical malfunction. Themalfunction itself may have been considered insignificant by thetheme park corporation and downplayed as not being a seriousmechanical flaw, but the fallout was on the front page. Anyfuture “cut fingers” at that theme park caused by mechani-cal failure would likely make at least local headlines. This isanother precursor that presents an obvious opportunity to putadditional emphasis on the preventive maintenance program.
9.4.8 Citations and violations
Citations and violations constitute another subtle metric thatoften passes undetected as a precursor that something is wrong.You do not have to experience a host of equipment failures to accumulate a number of citations and violations. As withenforcement actions, even though your capacity factor might behigh and you might not have had any plant trips, that does notimmunize your facility against citations and violations. Cita-tions and violations may occur as the result of an accumulationof small, inconsequential infractions when looked at individu-ally, but when looked at in their entirety, they present a veryclear picture that deficiencies exist in your preventive mainte-nance program.
Accruing citations, violations, and enforcement actions can bean indicator that your management does not take preventivemaintenance seriously enough. As Chapter 3 mentioned, it is notuncommon for management to neatly package or whitewash anaccumulation of small events as individual isolated incidentsrather than viewing them cumulatively as the possible existenceof a much broader deficiency in your plant’s reliability.
9.4.9 Root-cause evaluations
Root-cause evaluations are usually reserved for the more signif-icant plant events. Whenever you find that root-cause evalua-tions are becoming more common in your facility, it is time totake a hard look at your maintenance practices. A reliable plantshould not be stacking up a multitude of these evaluations, as it
An RCM Monitoring and Trending Strategy 227
is an indicator of underlying problems with your maintenanceprogram. Once again, it is not uncommon—and in fact it is quitecommon—that the plant capacity factor is high and the numberof plant trips zero, but the metric precursors nevertheless reveala poorly run plant.
9.4.10 Injuries
This metric is a very good indicator that a facility is either runwell or not run so well. Injuries can occur either to employees orto members of the public in the case of facilities that cater to thepublic such as theme parks, cruise ships, and airlines. Personnelinjuries of any kind must be avoided as a foremost priority. It isan accepted fact that some injuries are caused by irresponsiblebehavior on the part of the employee or the public. For example,an employee stands on the topmost rung of a ladder when he orshe knows not to; thus, a subsequent fall would be due to theemployee’s carelessness. Similarly, if a member of the publicattempts to perform some unauthorized acrobatic stunt while ona ride at a theme park and is injured in the process, this injurywould also be the result of personal carelessness.
The injuries that are the indicators of a poor reliability pro-gram occur when the employee is following all of the proper pro-cedures and still incurs an injury. The incidence of any injury,even if it is not considered serious, is an indication of the poten-tial for more serious injury consequences. Any injury that wasnot the result of personal carelessness must be taken seriously.
Even if carelessness was the cause of the injury in question, youmust consider these issues: Did the facility take every measure toensure that appropriate warnings were in place to alert employ-ees and/or the public to such risks and take measures to safe-guard them? Were these warnings posted in public places? Wereemployee training programs adequate to handle the situation?
9.4.11 Rate of written CMs
A certain number of CMs each day are a routine expectation.This is a difficult metric to define. I include it because it doesprovide some insight into the rate at which CMs are being written—although CMs are not necessarily a negative attribute.
228 Chapter Nine
An RCM Monitoring and Trending Strategy 229
In fact, many plants consider that when a deficiency is found bya PdM activity, the deficiency then becomes a CM. This is anacceptable practice.
Usually CMs are prioritized according to their importance. Forexample, priority 1 CMs usually involve deficiencies that mustbe corrected immediately such as steam leaks, oil leaks, or per-sonnel hazards. Priority 2 CMs require attention usually withinone week. Priority 3 CMs commonly include corrective mainte-nance that can wait until the 12-week planning cycle recurs tobe scheduled for work. The weighting factors are slightly differ-ent for each priority of CM.
9.4.12 Overdue CM backlog
While the number of CMs written is not necessarily a negativeattribute, the inability to manage them once they have been cre-ated certainly is. The inability to manage CMs becomes evidentwhen reviewing the overdue CM backlog. CMs that start to stackup without being planned and completed when they are sched-uled is an excellent metric for judging how capable your facility’sresources are to handle the work. If corrective maintenancework cannot be accomplished when it is scheduled, it is only amatter of time before some unwanted plant event occurs. As welearned in Chapter 3, corrective maintenance is an integral partof the bigger picture of preventive maintenance, and addressingCMs ultimately becomes as important as addressing PMs.
A growing backlog of overdue CMs should be a warning sign ofimminent danger. If your facility cannot handle the CM work-load being generated, playing ostrich is not an option. You willneed to ascertain whether your organization is inefficient in itsability to plan, schedule, and accomplish routinely generatedwork or whether your workforce is understaffed and cannot copewith the workload. My experience indicates that most often it isthe former rather than the latter.
9.4.13 Overdue PM backlog
This is a very important metric. An efficiently operating plantwill have very few, if any, overdue PMs. A plant that is in troublewill have a whole host of overdue PMs. It does not take a lot of
230 Chapter Nine
insight to realize the jeopardy your facility will be placed in ifyour organization cannot cope with the need to complete PMswhen they are due.
If your facility cannot handle the PM workload, your organiza-tion is either inefficient or understaffed. As before, it is mostoften the former rather than the latter that causes an overduePM backlog.
In some regulated industries, a backlog of overdue PMs is suf-ficient reason for receiving a citation or a notice of violation fromthe regulators. This metric can be a judgment call by a near-sighted management who tend to argue that all is well as long asthe plant is operating at or near full capacity.
Like a growing backlog of overdue CMs, any backlog of over-due PMs should also be a warning sign that danger is ahead. Insome industries, there is a grace period for PMs that normallyallows an extension of up to 25 percent of the PM period toaccomplish the task. For example, if the periodicity is once peryear, the allowable extension of 25 percent would be threemonths. Therefore, the PM would not be considered delinquentuntil it is overdue for one year plus three months.
The 25 percent grace period is an allowable and acceptable timeframe extension to accommodate unplanned scheduling problems.Good plants use this allowable extension sparingly, as it wasintended. Other plants automatically use the 25 percent allowableextension as part of the normal planning process and then findthat they have delinquent PMs to deal with. Depending on yourindustry, you may or may not be familiar with the grace periodconcept. If you are not, it doesn’t matter, because you are alreadyscheduling your work according to the specified periodicity.
If your industry does use a grace period for PMs, note that themetric I use for PMs applies to any PM that is overdue accordingto its actual periodicity. It is not a metric for delinquent PMsthat are 25 percent beyond the point of being overdue. I deliber-ately defined it that way to circumvent any imprudent manipu-lation intended to avoid having to complete a PM on its due date.
9.5 Weighting Factors
By now you should have a good understanding of why the aggre-gate metrics I have presented here are much more insightful
when you are determining the health of your facility thanmerely keeping a count of the number of plant trips and thecapacity factor. Those metrics alone do not present a completepicture.
The weighting factors for the metrics should be developed by aconsensus of the engineering, maintenance, and operations rep-resentatives and should reflect the relative importance of eachevent. Some event metrics will specify a certain number ofexpected occurrences such as the number of CMs written or thenumber of CMs in the backlog. Therefore, the organization rep-resentatives should also specify the expected number of eventoccurrences per month, per quarter, or per year. This establishesmanagement’s expectations for performance comparisons fromone time interval to the next interval. Obviously, the number ofexpected occurrences for some events should be zero—such asfor the number of plant trips, citations and violations, orinjuries. I strongly recommend that the weighting factors andperformance expectations be formalized in a document signed bythe managers of the three participating organizations.
The weighting factors are arbitrary in that they serve only tocompare relative importance. Your weighting factors should bewhat you and your management deem prudent. Refer to Figure9.2 for some typical examples of weighting factors and expectednumbers of occurrences.
9.6 Performance Calculations
The performance calculations are based on a rate of time. In theexample in Figure 9.2, the expected number of occurrences andthe actual number of occurrences are per quarter for the entireplant—although it could be per week, per month, per year, orwhatever you choose. You could also set it up on a system basis.The metrics in Figure 9.2 are per occurrence. For example, theweighting factor of 2.0 for a plant trip is multiplied by the num-ber of occurrences per quarter.
As noted, some of the metrics will indicate expected numbersof occurrences per quarter as shown in Figure 9.2. Each priority1 CM that was overdue for between one and three months has aweighting factor of 0.010 per CM. The weighting factors can bewhatever you wish them to be as long as they represent the rel-
An RCM Monitoring and Trending Strategy 231
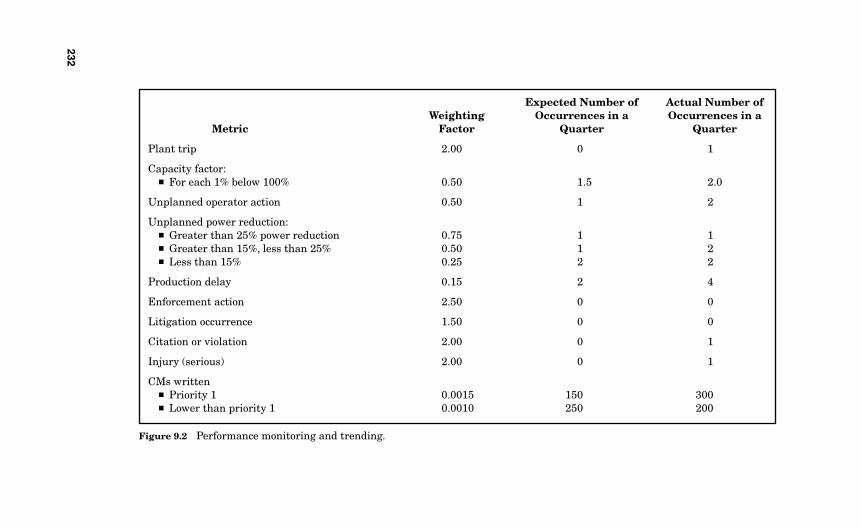
232
Expected Number of Actual Number ofWeighting Occurrences in a Occurrences in a
Metric Factor Quarter Quarter
Plant trip 2.00 0 1
Capacity factor:■ For each 1% below 100% 0.50 1.5 2.0
Unplanned operator action 0.50 1 2
Unplanned power reduction:■ Greater than 25% power reduction 0.75 1 1■ Greater than 15%, less than 25% 0.50 1 2■ Less than 15% 0.25 2 2
Production delay 0.15 2 4
Enforcement action 2.50 0 0
Litigation occurrence 1.50 0 0
Citation or violation 2.00 0 1
Injury (serious) 2.00 0 1
CMs written■ Priority 1 0.0015 150 300■ Lower than priority 1 0.0010 250 200
Figure 9.2 Performance monitoring and trending.
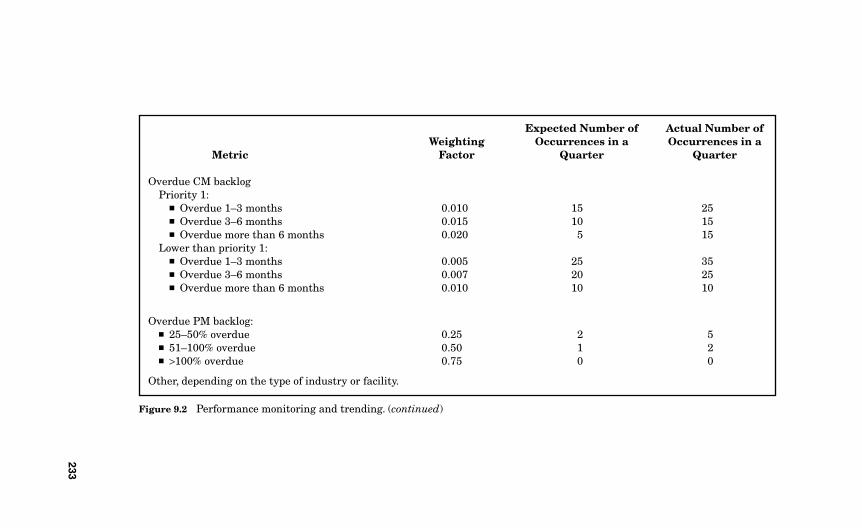
233
Expected Number of Actual Number ofWeighting Occurrences in a Occurrences in a
Metric Factor Quarter Quarter
Overdue CM backlogPriority 1:
■ Overdue 1–3 months 0.010 15 25■ Overdue 3–6 months 0.015 10 15■ Overdue more than 6 months 0.020 5 15
Lower than priority 1:■ Overdue 1–3 months 0.005 25 35■ Overdue 3–6 months 0.007 20 25■ Overdue more than 6 months 0.010 10 10
Overdue PM backlog:■ 25–50% overdue 0.25 2 5■ 51–100% overdue 0.50 1 2■ >100% overdue 0.75 0 0
Other, depending on the type of industry or facility.
Figure 9.2 Performance monitoring and trending. (continued)
ative importance of each metric. As you can see, an enforcementaction is weighted more heavily than a plant trip or a citation orviolation. A plant trip or citation or violation is weighted morethan a power reduction. The overdue CM backlog is weightedmore heavily than the rate of CMs written.
The performance monitoring and trending calculations can beapplied to the entire plant or to each individual system. Usingthe individual system basis provides a more diverse look at thereliability picture and breaks it down to a lower level. If youhave the capability to identify the individual components thattriggered each of the metrics, by system, then you will be able totake a more detailed snapshot of performance. If this capabilitydoes not exist, your performance monitoring can remain at theplant level to provide an overall snapshot of performance.
If your plant was not operating due to a planned outage oreven unplanned downtime, those hours are not included. Thereason for this is that if you had only one unplanned operatoraction in the quarter, for example, and your plant was not oper-ating for two months of the quarter, the effective performancerate of that one occurrence would not be the same as if the planthad been operating for the entire quarter. Looking at it anotherway, one could say that the plant had only one occurrence in theentire quarter, even though it was in operation for only fourweeks out of the entire quarter. Calculations that do not take theelement of time into consideration can result in an inaccuratestandard of measurement.
The performance rate calculations are shown in Figure 9.3.There is an expected performance rate (EPR) and an actual per-formance rate (APR). The EPR is the rate per 1000 plant operat-ing hours based on 24 hours/day × 90 days/quarter = 2160 hoursin the quarter. The EPR would be the sum of all of the expectednumbers of occurrences multiplied by their respective weightingfactors times 1000 and divided by 2160. As shown in Figure 9.3,the sum of all of the EPR metrics multiplied by the respectiveweighting factors is 5.54. Therefore, the expected performancerate is 5.54 × 1000/2160 = 2.57.
The APR would be the sum of all of the actual numbers ofoccurrences multiplied by their respective weighting factorstimes 1000 but divided by the actual number of operating hours
234 Chapter Nine
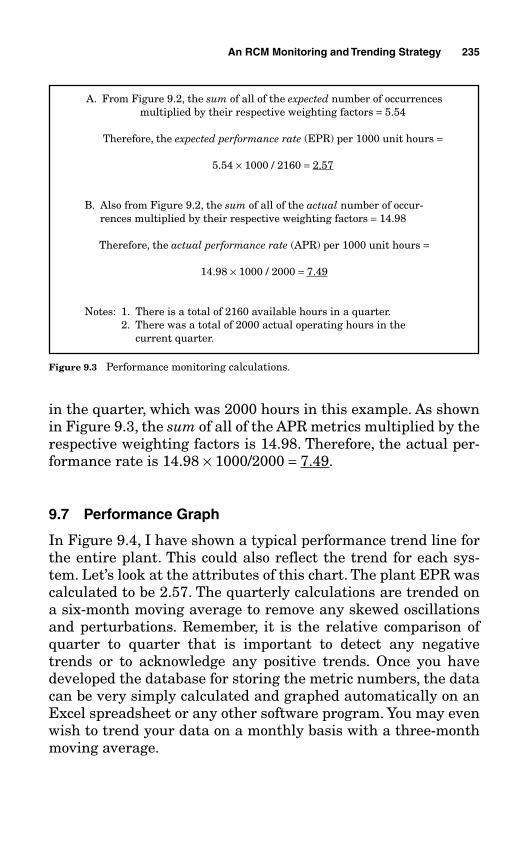
in the quarter, which was 2000 hours in this example. As shownin Figure 9.3, the sum of all of the APR metrics multiplied by therespective weighting factors is 14.98. Therefore, the actual per-formance rate is 14.98 × 1000/2000 = 7.49.
9.7 Performance Graph
In Figure 9.4, I have shown a typical performance trend line forthe entire plant. This could also reflect the trend for each sys-tem. Let’s look at the attributes of this chart. The plant EPR wascalculated to be 2.57. The quarterly calculations are trended ona six-month moving average to remove any skewed oscillationsand perturbations. Remember, it is the relative comparison ofquarter to quarter that is important to detect any negativetrends or to acknowledge any positive trends. Once you havedeveloped the database for storing the metric numbers, the datacan be very simply calculated and graphed automatically on anExcel spreadsheet or any other software program. You may evenwish to trend your data on a monthly basis with a three-monthmoving average.
An RCM Monitoring and Trending Strategy 235
A. From Figure 9.2, the sum of all of the expected number of occurrencesmultiplied by their respective weighting factors = 5.54
Therefore, the expected performance rate (EPR) per 1000 unit hours =
5.54 × 1000 / 2160 = 2.57
B. Also from Figure 9.2, the sum of all of the actual number of occur-rences multiplied by their respective weighting factors = 14.98
Therefore, the actual performance rate (APR) per 1000 unit hours =
14.98 × 1000 / 2000 = 7.49
Notes: 1. There is a total of 2160 available hours in a quarter.2. There was a total of 2000 actual operating hours in the
current quarter.
Figure 9.3 Performance monitoring calculations.
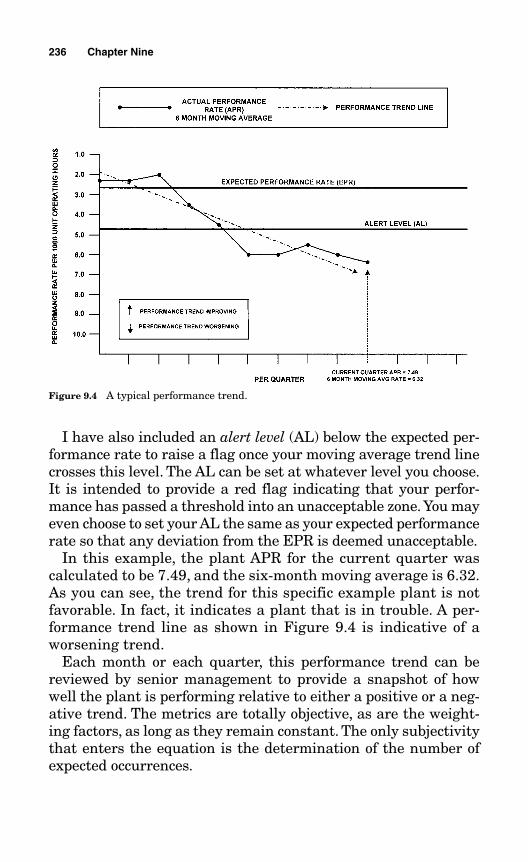
I have also included an alert level (AL) below the expected per-formance rate to raise a flag once your moving average trend linecrosses this level. The AL can be set at whatever level you choose.It is intended to provide a red flag indicating that your perfor-mance has passed a threshold into an unacceptable zone. You mayeven choose to set your AL the same as your expected performancerate so that any deviation from the EPR is deemed unacceptable.
In this example, the plant APR for the current quarter wascalculated to be 7.49, and the six-month moving average is 6.32.As you can see, the trend for this specific example plant is notfavorable. In fact, it indicates a plant that is in trouble. A per-formance trend line as shown in Figure 9.4 is indicative of aworsening trend.
Each month or each quarter, this performance trend can bereviewed by senior management to provide a snapshot of howwell the plant is performing relative to either a positive or a neg-ative trend. The metrics are totally objective, as are the weight-ing factors, as long as they remain constant. The only subjectivitythat enters the equation is the determination of the number ofexpected occurrences.
236 Chapter Nine
Figure 9.4 A typical performance trend.
What is most interesting to note is that a worsening perfor-mance trend, as depicted in Figure 9.4, is not atypical of a plantrunning at a 99 percent capacity level. It is that false sense ofcomfort when operating at the 99 percent capacity level that cancamouflage the aggregate metrics that clearly reveal a deterio-rating facility. The deteriorating condition would otherwise gounchecked until a major unwanted event or a series of eventsoccurs. It has been my experience in the airline industry and inthe nuclear industry that many airlines and nuclear facilitiesthat once boasted a 99 percent capacity factor without any ideaof their underlying problems eventually ended up on a regula-tor’s watch list within three to five years, if not sooner. This hashappened all too often.
A regulated facility that is heading toward a position on theinfamous watch list or any facility that ultimately finds itself indeep trouble in regard to its maintenance practices usually doesnot get there overnight. It is the cumulative effect of a series ofpreventive maintenance issues that leads to a slow but steadydecline in performance until it is too late to correct the situationwithout a drastic upheaval, possibly even leading to a change inthe plant management as a corrective action. This steady declineusually takes place under the radar. That is why a robust moni-toring and trending program that includes an aggregate of met-rics is so important in preventing that unwanted slide into areliability ravine.
Depending on your specific industry or type of facility, you maywish to include other metrics in your trending program—forexample, departure delays and cancellations for an airline, orthe number of lost barrels of oil for an oil drilling enterprise. Youmay also wish to use different weighting factors.
Remember, the objective of the monitoring and trending pro-gram is to discern any relative change in performance so that cor-rective measures can be immediately implemented.
9.8 Performance Graph by System
Figure 9.5 shows what individual system performance trendswould look like. These are snapshots per month or per quartercomputed for each system, similar to the plant performancetrend shown in Figure 9.4. The methodology and philosophy are
An RCM Monitoring and Trending Strategy 237
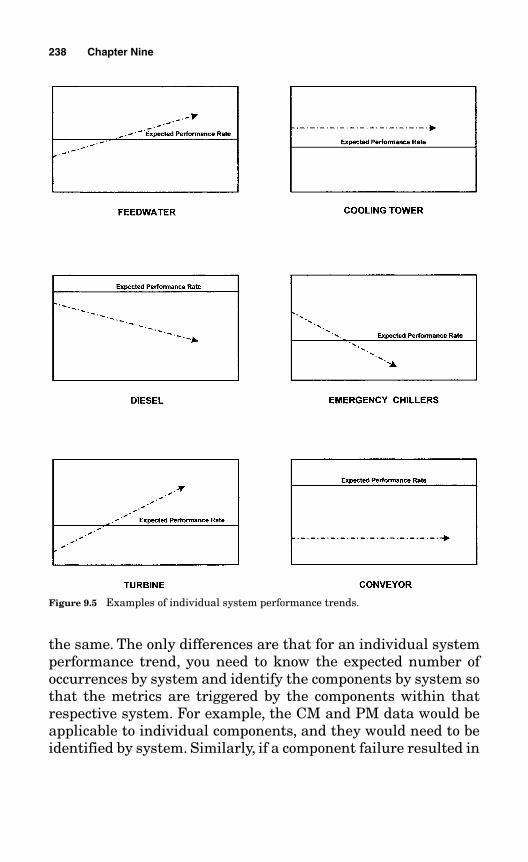
the same. The only differences are that for an individual systemperformance trend, you need to know the expected number ofoccurrences by system and identify the components by system sothat the metrics are triggered by the components within thatrespective system. For example, the CM and PM data would beapplicable to individual components, and they would need to beidentified by system. Similarly, if a component failure resulted in
238 Chapter Nine
Figure 9.5 Examples of individual system performance trends.
a plant trip or power reduction, you would need to know whatsystem that component belonged to.
If you elect to trend your performance by system, your manage-ment will quickly be able to determine at a glance which systemsare in need of extra support and which ones appear to be operat-ing reliably. It can afford your organization the opportunity toreallocate resources accordingly, as well as pinpoint incipientworsening trends by system to avert problems before they occur.
9.9 A Final Caution
Figure 9.6 raises this question: Can your facility be operating ata 99 percent capacity factor with no plant trips but claim owner-ship of the same system trends shown in Figure 9.6? The answeris: absolutely! Avoiding this scenario is what an aggregate moni-toring and trending program is all about.
9.10 Benchmarking
I encourage the proper use of benchmarking initiatives. Bench-marking is a technique that you may already be familiar with. Itconsists of sending a person or a team to another facility to findout how they are conducting business and see whether there issomething of value to learn from the experience of others.This canbe worthwhile, but I caution you about what I refer to as “incestu-ous” benchmarking, a practice that I have witnessed too often.
This occurs when plant A sends a team to benchmark plant Bto determine their best practices. What plant A does not know isthat plant B just visited plant C to find out how they are con-ducting business. You guessed it: plant C had just returned froma benchmarking trip to plant A, and plant A has therefore justbenchmarked itself! Sadly, this process is symptomatic of anunenlightened management team.
I recall a rather humorous experience in which a senior man-ager mentioned that he had just found out that facility X had areally good practice that they had touted to him. After he fin-ished explaining the great things that facility X was doing, Idiplomatically replied that their engineering manager had justvisited and the practices they were touting came from us!
An RCM Monitoring and Trending Strategy 239
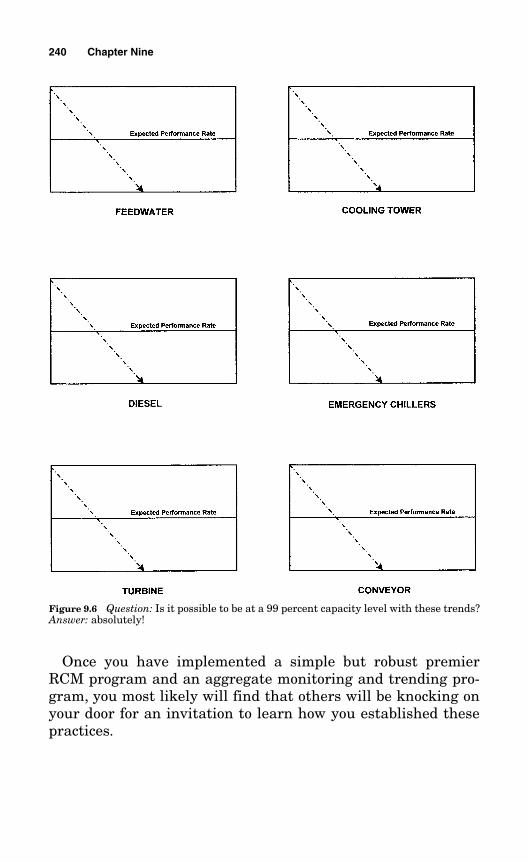
Once you have implemented a simple but robust premierRCM program and an aggregate monitoring and trending pro-gram, you most likely will find that others will be knocking onyour door for an invitation to learn how you established thesepractices.
240 Chapter Nine
Figure 9.6 Question: Is it possible to be at a 99 percent capacity level with these trends?Answer: absolutely!
9.11 More About Expected Performance Rates
Some facilities elect to absorb one plant trip per year. Therefore,rather than zero, the EPR for plant trips per quarter would be2.00 × 0.25 = 0.50. A plant may also choose to accept eight powerreductions per year with each one being greater than 25 percent.Therefore, rather than zero, the EPR increment for power reduc-tions per quarter would be 0.75 × 2 = 1.50.
It is the mind-set of higher management that determines thenegative influences they are willing to accept as a cost of doingbusiness. Some management may settle for as many as fournewspaper headlines per year proclaiming negative publicityabout major unwanted events that have occurred in their facil-ity. Some may accept that 10 plant trips per year are acceptable,or that a certain number of serious injuries are acceptable. Whena facility is too accommodating and accepts a lax EPR, that facil-ity is not a premier example of reliability. In fact, if such a man-agement mind-set exists, embarking on an RCM program mayprove to be a wasted effort.
9.12 Avoid Reliability Complacency
Facilities that continuously raise the bar each year, striving foreven better performance, and facilities that embrace a verystrict EPR are better plants that others should try to emulate.RCM is a perfect fit for their objectives. When the performancebar is constantly being raised, maintaining the status quo is notan option unless you want to fall behind the reliability leaders.
Unfortunately, and all too often, a certain smugness aboutbeing a good performer pervades senior management meetings.That is the point at which they typically believe they haveachieved reliability nirvana and begin to allow their facility toslip backward because they cease to be vigilant about their pre-ventive maintenance program. In my experience, this is a com-mon pitfall and should most definitely be avoided. I have seenextremely well-run plants with stellar performance slide intooblivion because of management complacency.
An RCM Monitoring and Trending Strategy 241
Plant reliability was not intended to be put on autopilot. Itrequires constant attention and involvement. An absence ofundesirable plant consequences for a mature plant means thatsomeone has been doing something right. It is usually at thesepeak performance times that management attempts to tweakthe system and begins an experimentation process to furtherreduce costs by cutting back on what they perceive as excessresources because the plant is operating so well. This road toreliability despair is more apt to occur when a new managementteam arrives, whose first order of business is to improve the bot-tom line.
Alternatively, I have seen plant managers who were too deeplyentrenched in their positions and were highly reluctant to intro-duce any changes for fear that they would be criticized for notimplementing them sooner. Instead of doing what the situationdemands, self-preservation and personal ego considerationsoften override prudent and sensible managerial decisions.
When you finally achieve a respectable reliability performanceprofile for your plant, the maintenance program can become atarget-rich opportunity for corporate bean counters. To their wayof thinking, since everything is running so well, there obviouslymust be room for cutting costs—which they proceed to do with-out any regard to the consequences. This is a major mistake—albeit one that occurs with too much regularity. Let’s look at howthis is depicted graphically.
9.13 How to Maintain Your Reliability Performance
As you ramp up your RCM effort, reliability is your number oneobjective. As Chapter 1 notes, RCM is a reliability program, nota PM reduction program. If you started with a Spartan preven-tive maintenance program, you will no doubt be adding workthat was not being done but should have been done, and yourstaffing needs will most likely increase.
Suppose yours is one of the facilities that performs too muchunnecessary work—for example, there are too many intrusivePMs for periodic overhauls and replacements rather than utiliz-ing more PdM activities. A sound RCM program affords you the
242 Chapter Nine
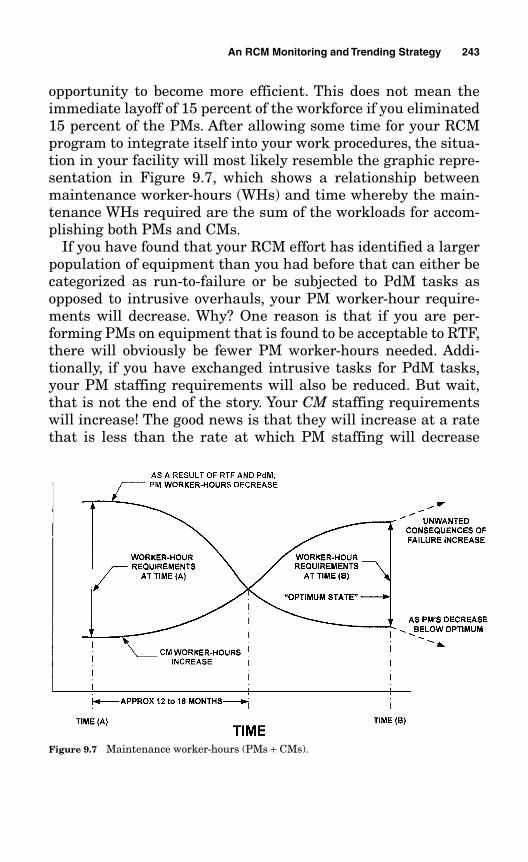
opportunity to become more efficient. This does not mean theimmediate layoff of 15 percent of the workforce if you eliminated15 percent of the PMs. After allowing some time for your RCMprogram to integrate itself into your work procedures, the situa-tion in your facility will most likely resemble the graphic repre-sentation in Figure 9.7, which shows a relationship betweenmaintenance worker-hours (WHs) and time whereby the main-tenance WHs required are the sum of the workloads for accom-plishing both PMs and CMs.
If you have found that your RCM effort has identified a largerpopulation of equipment than you had before that can either becategorized as run-to-failure or be subjected to PdM tasks asopposed to intrusive overhauls, your PM worker-hour require-ments will decrease. Why? One reason is that if you are per-forming PMs on equipment that is found to be acceptable to RTF,there will obviously be fewer PM worker-hours needed. Addi-tionally, if you have exchanged intrusive tasks for PdM tasks,your PM staffing requirements will also be reduced. But wait,that is not the end of the story. Your CM staffing requirementswill increase! The good news is that they will increase at a ratethat is less than the rate at which PM staffing will decrease
An RCM Monitoring and Trending Strategy 243
Figure 9.7 Maintenance worker-hours (PMs + CMs).
until a certain time interval, which from experience can be esti-mated at 12 to 18 months.
At some point the PMs and CMs will reach a state of equilib-rium. This is shown in Figure 9.7 as the “optimum state.” Hereare some considerations relative to RTF, PMs, CMs, PdMs, andstaffing:
■ With a greater understanding of the RTF concept and howRTF can become an integral part of your program, RTF-generated CMs will be mostly “emergent” work rather than“planned” work such as would be the expected outcome fromPMs and PdM tasks.
■ With PdM activities, CMs can be planned and scheduledaccordingly because of the advance warning of an impendingfailure.
Again, look at Figure 9.7. With any newly implemented RTFphilosophy, PMs will decrease rather rapidly; thus, PM worker-hours will also decrease rapidly and the number of CMs willbegin a rapid ascent for approximately 12 to 18 months. Worker-hours will then begin to stabilize. The overall resultant mainte-nance worker-hour requirement (PMs + CMs) at time (B) willprobably be less than they were at time (A) because of the effi-ciency of working on equipment when work is needed ratherthan performing unnecessary PM work when it is not needed. Acomponent will still need to be overhauled at some point, but theoverhaul won’t be done until the component needs it, and that iswhere much of the maintenance efficiency takes place.
This assessment is further supported universally by the “bath-tub” curve, whereby only 11 percent of all equipment shows adefinitive wear-out pattern—in other words, 89 percent of allequipment otherwise fails randomly. This underscores theimportance of performing PdM accordingly, as discussed inChapter 6.
Perhaps one of the most significant issues that industry facesis understanding the impact that PdM and RTF have “down-stream.” More to the point is that in the future much of yourwork will no longer be driven by PMs but instead will be drivenprimarily by emergent corrective maintenance. This is not a bad
244 Chapter Nine
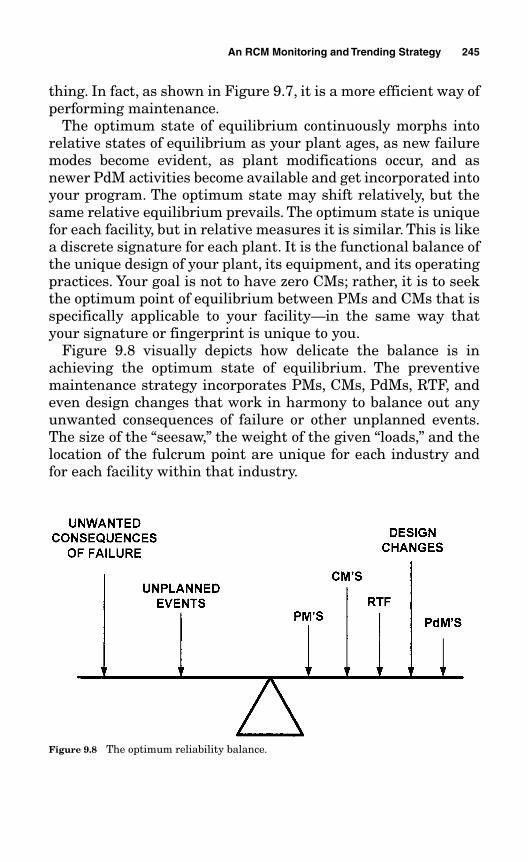
thing. In fact, as shown in Figure 9.7, it is a more efficient way ofperforming maintenance.
The optimum state of equilibrium continuously morphs intorelative states of equilibrium as your plant ages, as new failuremodes become evident, as plant modifications occur, and asnewer PdM activities become available and get incorporated intoyour program. The optimum state may shift relatively, but thesame relative equilibrium prevails. The optimum state is uniquefor each facility, but in relative measures it is similar. This is likea discrete signature for each plant. It is the functional balance ofthe unique design of your plant, its equipment, and its operatingpractices. Your goal is not to have zero CMs; rather, it is to seekthe optimum point of equilibrium between PMs and CMs that isspecifically applicable to your facility—in the same way thatyour signature or fingerprint is unique to you.
Figure 9.8 visually depicts how delicate the balance is inachieving the optimum state of equilibrium. The preventivemaintenance strategy incorporates PMs, CMs, PdMs, RTF, andeven design changes that work in harmony to balance out anyunwanted consequences of failure or other unplanned events.The size of the “seesaw,” the weight of the given “loads,” and thelocation of the fulcrum point are unique for each industry andfor each facility within that industry.
An RCM Monitoring and Trending Strategy 245
Figure 9.8 The optimum reliability balance.
Indiscriminately tweaking the preventive maintenance pro-gram below the optimum level without regard to the implica-tions of doing so results in a diminution of your overallreliability levels. Indiscriminately tweaking a premier reliabil-ity program is not unlike adding an extra measure of salt orsugar to a proven recipe. It can totally upset the balance of thatrecipe, making a connoisseur’s delight into something inedible.As shown in Figure 9.7, once PMs are decreased below their opti-mum level, an increase in unwanted consequences of failure willoccur with virtual certainty. I have witnessed this phenomenonfirsthand.
Figure 9.7 also sheds some light on the immediate, as opposedto the longer-term, issue of resources. As PMs decrease and oncePdM activities are fully embedded, a possible excess of resourcesmay be temporarily evident but this excess will be short-livedsince emergent CM work will begin to increase. You must bemindful not to hastily jettison any resources that will ultimatelybe needed in a relatively short time.
The resources needed at time (B) will ultimately be less thanthose needed at time (A) simply because of the trade-off of intru-sive work for PdM. However, at some point an overhaul orreplacement will still have to be done but not until it is truly nec-essary rather than at some arbitrary periodicity. Any resourcesavings at time (B) can be used for backlog work or to allow foran orderly attrition of those resources as a result of retirements,transfers, or the like.
9.14 Chapter Summary
■ Monitoring aggregate performance criteria allows you to beproactive in quantitatively assessing your plant reliability.
■ Reliability was defined by Nowlan and Heap as “the probabil-ity that an item will survive to a specified operating age underspecified operating conditions without failure.” This is a cor-rect definition in regard to the reliability of a specific compo-nent or a specific system, based solely on failures.
■ In addition to Nowlan and Heap’s definition, I view reliabilityas the cumulative and integrated rate of unwanted aggregate
246 Chapter Nine
events per unit of time where the events are not limited to justequipment failures.
■ The metrics used to monitor the health of a facility are analo-gous to those used to monitor the health of the human body.
■ Many industries have paid inadequate attention to establish-ing an accurate and potent metric to monitor and trend plantperformance and reliability.
■ A compilation of subjective opinions and rhetoric should not bepart of the monitoring and trending strategy.
■ Reliability can be measured in quantitative terms rather thanbased on the beliefs or loose predictions of those responsiblefor compiling and managing the monitoring program.
■ The metrics used in this book to create the monitoring andtrending strategy include virtually all of the possible influenc-ing events and performance data that can have an impact onplant reliability. This strategy objectively integrates all thepossible dynamics that can occur, with a weighting factorincorporated for each one depending on the relative impor-tance of the event.
■ Reliability should be measured per a specific unit of time. It ismore appropriately measured as a rate per 1000 unit operat-ing hours, for example; therefore, each metric is computed fora given rate of time. The metrics should not be a static grossnumber of occurrences.
■ The weighting factors for the metrics should be developed by aconsensus of the engineering, maintenance, and operationsorganizations and should reflect the relative importance ofeach event. The number of expected events should also bedeveloped by a consensus of these organizations.
■ The performance calculations are based on a rate of time. Thecalculations include the expected performance rate (EPR) andthe actual performance rate (APR).
■ The calculations can be graphed to show a snapshot of the per-formance rate of the entire plant. The calculations can also begraphed to show a snapshot of the performance rate of eachindividual system.
An RCM Monitoring and Trending Strategy 247
■ Your facility can be operating at a 99 percent capacity leveland still be headed into a reliability abyss that would go unde-tected if a robust aggregate monitoring and trending programwas absent from your strategy.
■ Facilities that continuously raise the bar each year, strivingfor even better performance, and that embrace a very strictEPR, are among the better-functioning plants that othersshould try to emulate. RCM is a perfect fit for their objectives.
■ A smoothly and efficiently operating plant can fall into obliv-ion if its management becomes complacent. Going from beinga “leader of the pack” to the “bottom of the pack” does not hap-pen overnight; it usually occurs gradually, over a period ofyears.
■ Plant reliability was not intended to be put on autopilot. Itneeds constant attention and involvement.
■ At some point the PMs and CMs will settle into a state of equi-librium (optimum state in Figure 9.7). Once PMs aredecreased below their optimum level, an increase in unwantedconsequences of failure will occur with virtual certainty.
■ With any newly implemented RTF philosophy, PMs willdecrease rapidly; thus worker-hours will decrease rapidly andCMs will begin a rapid ascent for approximately 12 to 18months. Worker-hours will then begin to stabilize.
■ The optimum state may shift relatively, but the same relativeequilibrium prevails. The optimum state is unique for eachfacility, but in relative measures it is similar to others. It is likea discrete signature for each plant. The goal is not to have zeroCMs; it is to seek the optimum level of equilibrium betweenPMs and CMs that is specifically applicable to your facility.
■ At some point an overhaul or replacement will still be requiredbut not until it is truly needed rather than at some arbitraryperiodicity.
248 Chapter Nine
249
Chapter
10RCM Implementation
Made Simple—Epilogue
Congratulations! You have just completed your journey towardlearning how simple it is to develop a premier classical RCMprogram. You have absorbed quite a bit of information, and youwill no doubt be inclined to revisit specific chapters in detail fora review of the finer points of each step of the process.
10.1 RCM as a Plant Culture
Throughout this book, I have occasionally mentioned how man-agement mind-sets and behaviors can influence the culture at a facility. By management culture, I mean the projected beliefs,passion, and sincerity that management exhibits and cultivatesthroughout the organization, in either a positive or a negativeway. In my numerous speaking engagements, in meeting withindustry leaders at different conferences, in visits to other facil-ities, and from firsthand experience, I have seen the effects ofboth good and bad cultures.
It is a distinct but intangible quality that distinguishes a goodculture from a not-so-good culture. The roots of an organiza-tional culture are found in the honest internal answers to suchquestions as these: Does your management believe in coveringup anything that is negative? Is there a hidden agenda that pro-motes “looking good” no matter what happens? Does your man-
Copyright © 2006 by the McGraw-Hill Companies. Click here for terms of use.
agement maintain only a lackadaisical belief in reliability? Issuperficial “lip service” paid to reliability issues, or perhaps a“flavor of the day” mentality exists? I have seen all of thesephilosophies in action, and none of them work very well. No mat-ter how hard a management team tries to cultivate an image ofcaring and self-assessment in regard to reliability, if the heartsand minds of that management team are not fully committed,their insincerity and shallowness will quickly be seen for whatthey are—smoke and mirrors. Eventually, the smoke clears andonly the mirrors remain.
In contrast, I have seen cultures where management was trulycommitted to achieving reliability success, and it showed in theiractions, their candor, and their willingness to fundamentallyaddress weaknesses with more than mere empty words. An atti-tude of denial, defensiveness, slick cover-up presentations, andother gimmickry were nonexistent. A positive culture is fosteredwhen a management team directs its efforts toward doing theright thing rather than expending the same amount of effort tocircumvent what needs to be done. Those facilities that channeltheir effort into a genuine push for reliability, even if it is ini-tially painful, will reap the rewards of a good culture.
Those individuals in responsible positions at your facility whohave the authoritative capability to establish a truly sincere cul-ture of reliability and preventive maintenance have a goldenopportunity to advance that culture using RCM. The best-runfacilities and the plants that are the shining examples of soundreliability practice are found to have in common a managementculture that is enlightened, sincere in its beliefs, and ever vigi-lant about maintaining a reputation for being the best andsafest plant it can be.
As you have learned, RCM is not just for the maintenancedepartment. It is not just for operations. And it is not just forengineering. RCM can be the catalyst for promoting a plant cul-ture that channels the energies of all parties toward a commongoal: a safe and reliable facility. That plant culture can beobtained with the collective involvement of all stakeholders—maintenance, operations, engineering, and the craft personneland technicians—working together with an understanding of thesimple logic and commonsense approach that RCM offers. When
250 Chapter Ten
applied correctly and simply, RCM is a universally accepted prac-tice that has withstood the test of time and has successfully heldup against an array of challenges to its straightforward logic.
As for the culture of safety, I am an absolute advocate when itcomes to personnel and plant safety. As I mentioned in Chapter1, I have had the opportunity to work in what are perhaps two ofthe most rigid industries in regard to safety standards: the com-mercial aviation and the commercial nuclear power industries.Compromising safety is never an option, and I have never lostsight of the fact that my decisions could affect the lives of grand-parents, sons, daughters, husbands, wives, and other loved oneswho were flying faster than 600 miles per hour at an altitude inexcess of 30,000 feet in a very sophisticated and complex aircraft.Nor have I ever forgotten how mistakes in a nuclear environ-ment potentially affect the lives of thousands of people living inan area surrounding a nuclear power plant. Adherence to safetyis mandatory.
10.2 A Step-by-Step Review of the Process
As an overall review of Chapters 1 through 9, Figures 10.1a, b,and c will briefly revisit each step of the process of RCM Imple-mentation Made Simple. You may wish to go back to a specificchapter for a more in-depth review.
10.2.1 Select an RCM point of contact
This is where you start. You need to select a person who hasleadership and communication skills to be your RCM singlepoint of contact (SPOC). This person should assemble at leastone representative each from maintenance, operations, engi-neering, and selected members of the craft. The representativescan be rotated from within the various organizations and the dif-ferent crafts, based on the applicable expertise needed at thatpoint of your analysis. All team members should become familiarwith RCM Implementation Made Simple.
Rather than prescribe some rigorous training program usingfacilitators and consultants, the SPOC should have the respon-
RCM Implementation Made Simple—Epilogue 251
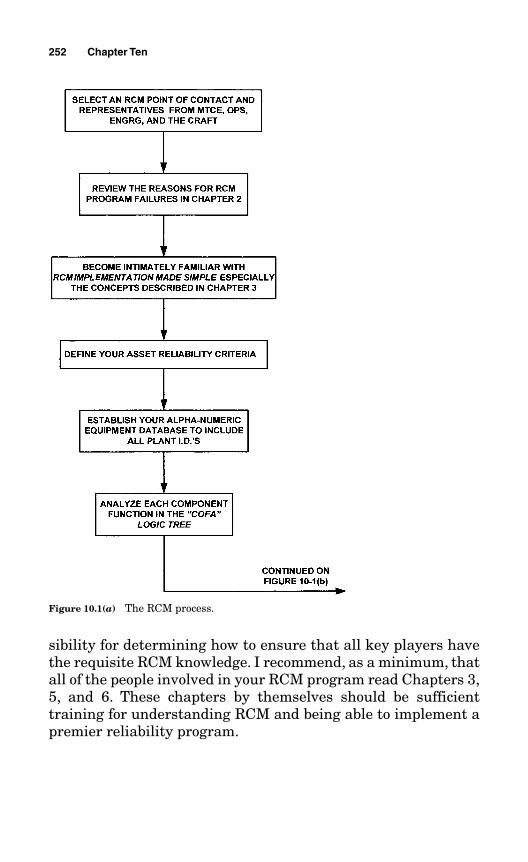
252 Chapter Ten
Figure 10.1(a) The RCM process.
sibility for determining how to ensure that all key players havethe requisite RCM knowledge. I recommend, as a minimum, thatall of the people involved in your RCM program read Chapters 3,5, and 6. These chapters by themselves should be sufficienttraining for understanding RCM and being able to implement apremier reliability program.
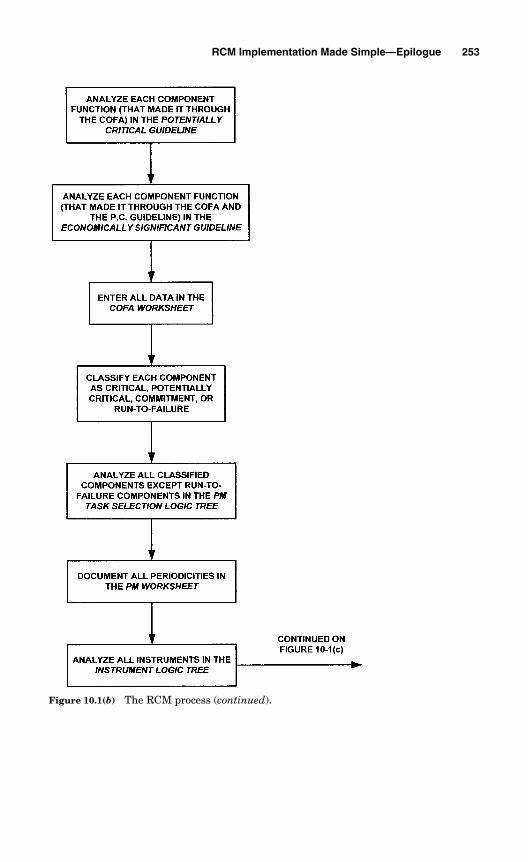
RCM Implementation Made Simple—Epilogue 253
Figure 10.1(b) The RCM process (continued).
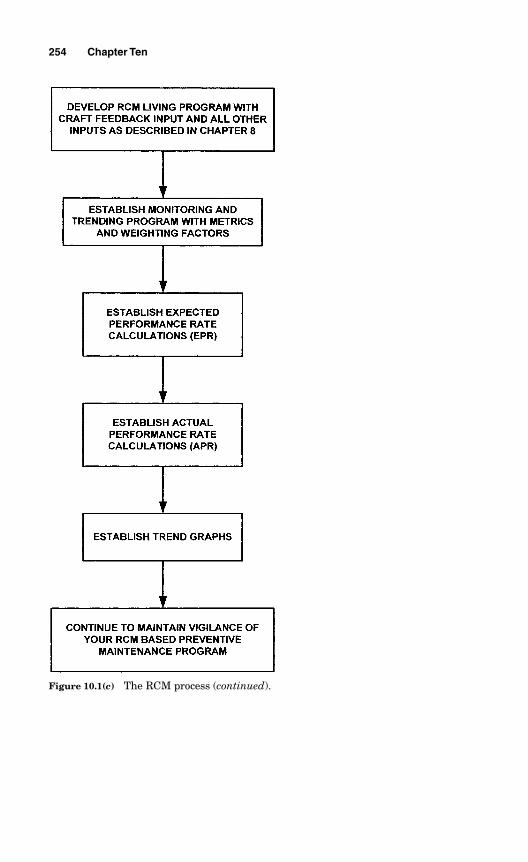
254 Chapter Ten
Figure 10.1(c) The RCM process (continued).
10.2.2 Review the reasons for RCM program failures
This is an area that the SPOC can explain to the team. You donot want to fall into the same traps, ditches, and sinkholes thathave swallowed others in their attempts to implement RCM pro-grams. In Chapter 2, I listed the most common reasons for fail-ing to successfully implement an RCM program. One majoringredient of such failure is the involvement of consultants. Notonly are they expensive, but most of them have less knowledge ofRCM than you have now that you have completed this book.
10.2.3 Understand the concepts
Understanding the concepts of RCM Implementation Made Sim-ple is perhaps the single most important element in the successfulimplementation of your RCM program. A sure pathway to successlies in understanding the concepts of hidden failures; critical com-ponents; single-failure and multiple-failure analyses; potentiallycritical components, which have been the missing link of RCM;the canon law of run-to-failure; the consequence of failure analy-sis (COFA); redundancy; backup; and standby functions.
I cannot overemphasize the importance of understandingthese concepts and applying them appropriately. RCM is funda-mentally a black-and-white, commonsense decision process onceyou understand the ground rules and concepts. All of these con-cepts are explained in great detail in Chapter 3.
Remember, too, that plant reliability and safety are related tothe vulnerabilities that have not yet been identified because thefailure consequences surrounding those vulnerabilities have notyet occurred.
RCM Implementation Made Simple is all about finding thosevulnerabilities before they occur and result in an unwanted con-sequence of failure.
10.2.4 Define your asset reliability criteria
This step in the process is where you determine your own indi-vidual plant reliability “gold standard.” It is the standard you set
RCM Implementation Made Simple—Epilogue 255
for maintaining the reliability of your facility. The asset reliabil-ity criteria you establish should be a clear and concise definitionof the unwanted events that you wish to avoid. It is what youbase your entire RCM logic on. Defending your facility againstthese unwanted events is what your preventive maintenanceprogram strategy is designed for. The RCM logic explores theconsequences of equipment failures for their impact on any ofthe asset reliability criteria you selected.
Because of the importance of selecting these criteria, it isstrongly recommended that the management heads of all stake-holder organizations sign a “memorandum of understanding”attesting to their concurrence, including any “qualifying condi-tions.” Figure 5.1 lists some typical asset reliability criteria. Dif-ferent industries and different types of facilities may havedifferent criteria goals; however, the first two criteria relative topersonnel and plant safety are mandatory, nonnegotiable crite-ria for any industry or plant. The remaining criterion coversthose unwanted operational events that you and managementhave decided must be avoided.
10.2.5 Establish your alphanumericequipment database
This is the database that includes all of the components in yourplant. It is at the equipment level where a discrete componentI.D. number is defined. These are the components that will beanalyzed within your RCM COFA Logic Tree for their functions.Analyzing all equipment I.D.s is a requirement, but doing soallows you to eliminate the tedious, resource-intensive, time-consuming task of creating system and subsystem boundariesand interfaces. Piece parts such as bearings, shafts, or springsare not considered components with an equipment I.D. Pieceparts become important when defining the specific causes of fail-ure at the equipment level. Refer to Chapters 4 and 6.
10.2.6 Analyze each componentfunction in the COFA Logic Tree
The COFA Logic Tree is where each function of the component isanalyzed for its consequence of failure. The functions are the
256 Chapter Ten
explanation for why the component is installed, and preservingthese functions is the main objective of the maintenance pro-gram. The functions describe what the component must accom-plish, and it is within the COFA Logic Tree that those functionsare analyzed for the effects of their failures.
The COFA Logic Tree is the step of the process that identifiescritical components based on their functional failure conse-quences. The COFA Logic Tree further determines whether acritical component failure will result in an unwanted personnelor plant safety consequence or an operational consequence. TheCOFA Logic Tree process will also guide you through the Poten-tially Critical Guideline and the Economically SignificantGuideline if the component is determined not to be a criticalcomponent. Refer to Figure 5.2a.
10.2.7 Analyze each componentfunction in the potentially critical guideline
If the first stage of the COFA Logic Tree determined that thefunctions of a component were not immediately critical, thefunctions are then analyzed within the Potentially CriticalGuideline to determine whether a functional failure, in combi-nation with additional multiple failures, an additional initiatingevent, or time could result in a critical plant effect. If it could, thecomponent is classified as a potentially critical component. Acommitment component is also identified within this guideline.Refer to Figure 5.2b.
10.2.8 Analyze each componentfunction in the economically significant guideline
If the component was not determined to be critical, potentiallycritical, or a commitment, it is analyzed within the Economi-cally Significant Guideline to determine whether its failureentails an economic concern. The failure of an economic compo-nent will only result in labor and/or material costs. Refer toFigure 5.2b.
RCM Implementation Made Simple—Epilogue 257
10.2.9 Enter all data in the COFA worksheet
All of the data is entered in the COFA Worksheet. This includeseach component I.D., the different functions of each component,the functional failures, whether the indication of failure is evi-dent, and the consequences of failure as determined by theCOFA Logic Tree, the Potentially Critical Guideline, and theEconomically Significant Guideline. Refer to Chapter 5.
10.2.10 Classify each component
Each component is classified as critical, potentially critical, com-mitment, economic, or run-to-failure on the COFA Worksheet.
10.2.11 Analyze all classifiedcomponents except run-to-failurecomponents in the PM task selectionlogic tree
This is the step where the PM tasks are specified for those com-ponents that were determined to be included in the PM pro-gram—that is, critical, potentially critical, commitment, andeconomic components. The PM tasks will be condition-directed,time-directed, or failure-finding. Predictive maintenance tasksare a subset of the condition-directed category. Condition-directed tasks are the first choice of preventive maintenanceactivity rather than intrusive time-directed tasks such as over-hauls, internal inspections, and replacements. Failure-findingtasks are specified for potentially critical components whose fail-ures are hidden. Refer to Chapter 6 and Figure 6.3.
10.2.12 Document all tasks andperiodicities on the PM task worksheet
All of the PM tasks and their periodicities are documented onthe PM Task Worksheet. Organizations other than maintenance,such as operations and engineering, also perform PM activities.
258 Chapter Ten
Another important point is that establishing PM periodicitiesthat do not have mandatory time intervals specified by a regula-tor is more of an art than a science. Refer to Figure 6.5.
10.2.13 Analyze instruments in the instrument logic tree
There are two instrument categories: functional instrumentsand instruments used for indication only. Instruments that pro-vide a function such as a level switch or a pressure switch areanalyzed in the COFA. Instruments that provide an indicationonly are analyzed within the Instrument Logic Tree. Refer toChapter 7 and Figure 7.1.
10.2.14 Develop your RCM living program
Because RCM is not a static, one-shot attempt to develop a pre-ventive maintenance program, it must remain a living andviable program, constantly being monitored for changes.
You have learned how to develop a premier RCM programbased on the knowledge and awareness of the information, facts,and data that you had at the time of implementing the RCM pro-gram. This is especially true of the periodicities you prescribedfor the PM tasks. However, everything is subject to change.These changes can come about as a result of new failure modesthat become apparent but were nonexistent at the time of imple-mentation. You may have experienced changes in maintenancemethods that have been sufficiently beneficial to allow periodic-ities to be extended. On the other hand, some changes in equip-ment parameters may have resulted in the need for reducingperiodicities to maintain reliability. Modifications to the plant,modifications to equipment, changes in operating characteris-tics, new PdM technologies, which are appearing everyday—allthese contribute to the need for periodically reviewing andupdating your maintenance program.
Your RCM living program consists of many elements. One ofthe most significant is the craft feedback element, which uses
RCM Implementation Made Simple—Epilogue 259
the expertise and involvement of the crafts personnel/techni-cians to provide insight into the PM tasks that have been estab-lished. Refer to Chapter 8 for a detailed review of the livingprogram elements.
10.2.15 Establish monitoring and trending program metrics
A strategy needs to be in place that monitors and measuresaggregate performance criteria so that you can be proactiveabout quantitatively assessing your plant reliability. An aggre-gate philosophy affords you a more in-depth measurement ofyour true underlying performance. It will also allow you to makequicker decisions as your program is being implemented insteadof having to wait until after you have completed your programand then reactively responding to make any major course cor-rections if they are needed.
You need to have a measurement standard based on a rate oftime by which to measure your performance. Crude metrics suchas counting the number of times your facility incurs anunwanted trip is one metric but not the only one. The metrics inChapter 9 are as objective as possible and easy to acquire, andthey include all pertinent factors that provide you with a truepicture of how well you are performing.
Each metric carries a weighting factor to differentiate its rela-tive importance. Even though the weighting factors are arbitrarilyestablished, as long as they remain constant, their relative impor-tance measurement remains constant. Refer to Chapter 9 for adetailed review of a model for a monitoring and trending program.
10.2.16 Establish your expected performance rate
As part of your monitoring and trending program, you need toestablish what your expectations are, and this is achieved byestablishing your expected performance rate (EPR) based on theexpected number of occurrences per unit of time for each indi-vidual metric. A nominal unit of time is per 1000 unit operatinghours computed on a quarterly basis. Refer to Chapter 9.
260 Chapter Ten
10.2.17 Establish your actual performance rate
The second measurement in your monitoring and trending pro-gram is your actual performance rate (APR). This measures yourperformance based on the actual number of occurrences of eachmetric. Refer to Chapter 9.
10.2.18 Establish your trend graphs
The results from the calculations of your expected performancerate and your actual performance rate are graphed to showeither a positive or a worsening trend. These graphs areextremely useful for providing senior management with a snap-shot of the aggregate of all the metrics. It is a quick means toprovide a very perceptive and intuitive look into the reliabilitywindow of your facility.
10.2.19 Maintain continued vigilance over your program
At some point in time, your PMs and CMs will find a state ofequilibrium. This is shown in Figure 9.7 as the optimum state.
Indiscriminately tweaking a premier reliability program is notunlike adding an extra measure of salt or sugar to a provenrecipe. It can totally upset the balance of that recipe, turning itfrom a connoisseur’s delight to something inedible.
Unfortunately, a sense of smugness about being a good per-former often pervades senior management meetings. This is thepoint at which they believe they have achieved reliability nir-vana and begin to allow their facility to slip backward becausethey cease being vigilant about their preventive maintenanceprogram. In my experience, this is a very common occurrenceand should most definitely be avoided.
Plant reliability was not intended to be put on autopilot. Itneeds constant attention and involvement. The absence ofunwanted plant consequences for a mature plant means thatsomeone has been doing something right. It is usually at thesepeak performance times that management attempts to tweakthe process and begins experimenting to further reduce more
RCM Implementation Made Simple—Epilogue 261
costs by eliminating what they perceive to be excess resourcesbecause the plant is operating so well. This road to reliabilityoblivion is more apt to appear when a new management teamarrives and their first order of business is to improve the bot-tom line.
When you finally achieve a respectable reliability performancefor your plant, the maintenance program can become a target-rich opportunity for corporate bean counters to begin slashingcosts. That would be a major mistake, but it’s one that, sadly,occurs with too much regularity.
Familiarize yourself with Figure 9.7 and Chapters 8 and 9.Stay continually involved and maintain constant vigilance aboutyour RCM program!
10.3 Taking Command of Your Own Ship
I sincerely hope that RCM Implementation Made Simple hasbeen an enlightening experience for you and that it will put youon a success path toward establishing a premier RCM-basedpreventive maintenance program. This book should have helpedyou to realize that implementing a classical RCM program doesnot require the costly assistance of consultants. It does notrequire any special training or facilitator intervention. It doesnot require the creation of system boundaries and interfaces. Itdoes not even require an engineering degree.
Throughout this journey, I have tried to remove all of the con-fusion, obfuscation, and complexity from a process that shouldnot be confusing, obfuscated, or complex. It is my goal that thisbook be used as an influence on setting a new universal stan-dard for every industry that wishes to improve its plant reliabil-ity by developing an RCM program.
RCM should not be kept a secret, such that only large corpora-tions with megabucks to spend on consultants are the beneficia-ries of this invaluable process. There are many paths toimproving reliability, but so far no other process has proven to beas effective as the RCM methodology for establishing the bestpreventive maintenance program attainable.
262 Chapter Ten

You now should have the tools to implement your own pro-gram and, like the captain of a ship, be in total control of thedecisions and the direction you wish to travel. It has been mypleasure to lead you to the dock, assist you in getting ready totake over the helm, and enable you to sail toward a successfuldestination where you are in total command of your own ship!
Neil B. Bloom
RCM Implementation Made Simple—Epilogue 263

This page intentionally left blank
265
Glossary
I have been encouraged by my colleagues to prepare a comprehen-sive RCM glossary that is more than the usual quick-phrase defini-tions found in most RCM-related books and references that in manyinstances are inadequate to explain or describe an RCM term. I fre-quently use examples as part of the definition in order to more clearlyexplain a term.
Run-to-Failure (RTF) is a typical example in which the existing sim-plistic definitions found in most RCM books are far too superficial toexplain the true meaning of RTF. A definition of RTF such as “the com-ponent is allowed to fail with no PMs needed” is totally inadequate.
Furthermore, the definitions I use are those that are applicable tothe RCM process. Obviously, Webster’s dictionary offers many otherdefinitions for the same words, but the more specific definitions that donot pertain to the RCM process are not considered.
APPLICABLE AND EFFECTIVE This term applies to each PM task.In order to be “applicable and effective,” the proposed task must beappropriate for addressing the respective failure mechanism. Based ona principle of prudent judgment by knowledgeable individuals, thetask should be pertinent and bear the likelihood that it will prevent thefailure mechanism. The “applicable and effective” task must offer somedegree of assurance that it will either prevent the failure or at the veryleast minimize the exposure to the failure, or minimize the exposure toa plant effect if it is a failure-finding task.
ASSET RELIABILITY CRITERIA The first step in implementing yourRCM program is to define precisely, accurately, and exactly the assetreliability criteria your senior management wishes to preserve. Todefine these criteria, the following concerns are considered: ensuringpersonnel and plant safety; preventing any unplanned productiondelays, unplanned facility shutdowns, power reductions, productioninterruptions, or the loss of generation or production capacity; prevent-ing any unwanted regulatory or environmental issues from bringingunwelcome publicity or litigation, and so on. It is strongly advised thata formal internal memorandum of understanding be signed by all appli-cable individuals in authority for agreement on what asset reliabilitycriteria you choose. Your asset reliability criteria are fundamentally the
Copyright © 2006 by the McGraw-Hill Companies. Click here for terms of use.
identification of all the unwanted consequences of failure that can occurto your facility and that must be prevented.
BACKUP COMPONENTS See STANDBY COMPONENTS.
BACKUP FUNCTIONS See STANDBY FUNCTIONS.
BOUNDARIES Ordinary classical RCM programs require the estab-lishment of system boundaries. Boundaries comprise several hundredspecific components that have to be identified when performing theanalysis at the system level. Identifying functions at the system levelrequires that each system be specifically defined to demarcate whereone system ends and another system begins. The system must be fur-ther dissected to include subsystems. An individual component canreside in only one subsystem of one system. Defining these bound-aries is totally arbitrary and extremely time consuming. RCM Imple-mentation Made Simple does not require the establishment of systemboundaries.
CANON LAW FOR RUN-TO-FAILURE A run-to-failure component isdesignated as such solely because it is understood to have no safety,operational, commitment, or economic consequence as the result of asingle failure. Also, the occurrence of the failure must be evident tooperations personnel.
As a result, there is no proactive preventive maintenance strategy toprevent failure. However, once failed, an RTF-designated componentdoes have a proactive corrective maintenance strategy commensuratewith all other components based on the plant conditions at that time.
CAUSES OF FAILURE See CREDIBLE FAILURE CAUSES.
CLASSICAL RCM This refers to the only truly acknowledged form ofRCM as it was intended by its pioneers in the commercial aviationindustry. Unfortunately, in its transfer from the airlines to other indus-tries, classical RCM took on unnecessary administrative burdens anda self-imposed cumbersome process of analysis and implementation.These self-imposed restrictive impediments to successfully completingan RCM program have led to high-risk, streamlined versions of theprocess that are not considered classical RCM.
The streamlined versions do not meet the specificity of the SAErequirements for an RCM program that are described in SAE Docu-ment JA1011. The goal of RCM Implementation Made Simple is tobring classical RCM back to its simpler and more understandable rootsso that it can be implemented successfully.
COFA The COFA is a brand-new term that stands for the consequenceof failure analysis. This format is more accurate, simpler to use, and
266 Glossary
more clearly understood than the commonly used FMEA (failure modesand effects analysis). The FMEA determines the consequence of fail-ure, but it does so by invoking the requirement to establish functions atthe system and subsystem level. System and subsystem functions inturn require the creation of boundaries and interfaces. The COFA estab-lishes functions at the component level. Boundaries and interfaces arenot required. The primary objective of RCM is to define the conse-quence of failure. The COFA does this directly and more accuratelythan the existing FMEA.
COFA LOGIC TREE The COFA Logic Tree takes a complex logic pro-cess and simplifies it to its basic elements while enhancing its thorough-ness, accuracy, and conceptual clarity. It integrates all of the logic foridentifying critical, potentially critical, commitment, and economic com-ponents. See ECONOMICALLY SIGNIFICANT GUIDELINE, POTEN-TIALLY CRITICAL GUIDELINE.
COFA WORKSHEET The COFA Worksheet is the format where all ofthe pertinent analysis is documented as decisions are made from theCOFA Logic Tree, the Potentially Critical Guideline, and the Economi-cally Significant Guideline.
COMMITMENT COMPONENTS Commitment components are thosecomponents that have certain regulatory, environmental, OSHA, insur-ance, or other commitments that must be maintained, thereby requir-ing a preventive maintenance strategy to preclude a component fromfailing and causing a commitment to be missed or resulting in an infrac-tion of the commitment. Some typical examples of commitments gov-erning certain components are insurance commitments required formajor pieces of equipment, state code commitments required for pres-sure vessels, EPA commitments related to environmental impacts orfluid or gaseous releases, OSHA commitments required for personnelsafety, and federal regulatory agency commitments such as FAA orNRC information notices and bulletins. Usually, a commitment compo-nent is also associated with the component being classified as eithercritical or potentially critical because of its importance.
COMMON MODE FAILURES Common mode failures are failures of apopulation of equipment all of which are subject to the same failuremode. There are actions that can be taken to minimize the exposure tothis occurrence. It would be a prudent practice to institute a samplingprogram that periodically inspects one or two of the components of thepopulation to ensure that all is well before any common mode problemsarise, allowing very little time to react appropriately and efficientlywith a planned course of action. A sampling program that performs anin-depth internal inspection of the sampled components can yield a
Glossary 267
very accurate prognosis of wear patterns, internal flaws, or other incip-ient failure mechanisms that may not be observable with PdM tech-niques alone.
COMPANION EQUIPMENT Companion equipment is those compo-nents associated with a critical or potentially critical component.Companion equipment could be an inlet or discharge check valve, acomponent providing an input signal, or a component that supportsone of the functions of the critical or potentially critical component.
These companion equipment components should already have beenindependently analyzed themselves to be either critical or potentiallycritical. However, when viewed as companion equipment, it is morelikely that they will not inadvertently be overlooked. Since all compo-nents will be analyzed regardless, it is a good check to ensure thatthose components associated with a critical or potentially critical com-ponent are also analyzed appropriately.
COMPONENT The terms equipment and component are synonymousin this book. This is the level at which an individual equipment I.D.number is assigned. It does not include piece parts of mechanical com-ponents such as bearings, shafts, seals, or piece parts of electrical com-ponents such as resistors, capacitors, or diodes. Piece parts are includedwhen analyzing the causes of failure of the equipment or component.
COMPONENT CLASSIFICATIONS Components identified as beingpart of the preventive maintenance program will fall under one of thefollowing classifications: critical, potentially critical, commitment, oreconomic. See COMMITMENT COMPONENTS, CRITICAL COMPO-NENTS, ECONOMIC COMPONENTS, POTENTIALLY CRITICALCOMPONENTS.
COMPONENT FAILURE The failure of a component occurs when thecomponent no longer provides either its design or its desired function.Note that the failure can be defined by a regulatory requirement spec-ifying that it must meet certain design operating conditions. In theabsence of a specific regulatory or operating requirement, the failure ofa component to provide its desired function is defined by the plantowner. The owner defines how much deviation from its like-new per-formance capability is acceptable. See FUNCTIONS.
CONDITION-DIRECTED TASK This is one of the three categories ofpreventive maintenance. Condition-directed tasks normally includetasks that measure, monitor, or analyze the condition of a componentto determine whether it is operating acceptably or is about to fail.A condition-directed task does not constitute run-to-failure status.
268 Glossary
Condition-directed maintenance means “don’t overhaul or replace ituntil its condition indicates the need for overhaul or replacement.” Pre-dictive maintenance techniques are used to determine the condition ofthe equipment so that required overhaul or replacement can be sched-uled to preclude the occurrence of a functional failure. See FAILURE-FINDING TASK, TIME-DIRECTED TASK.
CONDITION MONITORING This is another term for predictive main-tenance. See PREDICTIVE MAINTENANCE TASKS.
CONSEQUENCE OF FAILURE The consequence of failure is whathappens when a component fails. Will the failure affect personnel orplant safety? Will it affect the operability of the facility? Will it resultin significant material costs? The consequence of failure is what theRCM process is all about. Everything you do in RCM and every part ofthe analysis is driven to obtain the answer to only one question: whatis the consequence of failure? The COFA Logic Tree and the COFA Work-sheet guide you through the process to determine the consequence offailure for each component function.
Once the consequence of failure is determined, it will define either acritical, a potentially critical, a commitment, an economic, or a run-to-failure component. The next strategy is to figure out how to prevent theunwanted failure consequence by means of a prescriptive preventivemaintenance program that includes a vast selection of PM tasks fromwhich to choose. See COFA, COFA LOGIC TREE.
CONVENTIONS Conventions provide a common and consistentdescription of certain terms. They are used to describe the different PMtask categories and types. They are also used to describe the differentkinds of failure modes. Conventions are whatever you determine themto be. Normally used conventions for describing PM task categories arecondition-directed, time-directed, and failure-finding (See CONDITION-DIRECTED TASK, FAILURE-FINDING TASK, TIME-DIRECTEDTASK.) Predictive maintenance (see PREDICTIVE MAINTENANCETASKS) is the convention used to describe nonintrusive predictive-typetasks such as vibration monitoring, thermography, or oil analysis.
To avoid confusion, the conventions for some of the commonly usedfailure modes are presented here:
ACTUATES INADVERTENTLY This term describes that the compo-nent actuates when the proper signal or condition is not present.ACTUATES PREMATURELY This term describes that the compo-nent is out of adjustment or sticks or that some other failure ispresent that causes the component to indicate the proper conditionwhen that condition is not yet present.
Glossary 269
FAILS CLOSED This term covers three conditions: (1) componentfails closed, (2) component fails to remain open, and (3) componentfails to open.FAILS OPEN This term covers three conditions: (1) component failswhen it is open, (2) component fails to remain closed, and (3) compo-nent fails to close.FAILS TO ACTUATE This term is used to indicate that the compo-nent does not operate when the proper signal is received.FAILS TO FILTER This describes the failure of a filter or strainer toallow bypass flow or that it has holes, tears, or other damage thatprevents the desired filtering effect.FAILS TO POSITION This failure indicates that when a signal isreceived, the component position will not change.RESTRICTS FLOW This describes the condition when a filter or astrainer becomes either partially or completely clogged and does notallow the required flow to pass through.
CORNERSTONES OF RCM The three cornerstones of RCM are (1) know when a single-failure analysis is acceptable and when it isnot acceptable, (2) know how to identify hidden failures, and (3) knowwhen a multiple-failure analysis is required.
CORRECTIVE MAINTENANCE Corrective maintenance is a strat-egy to fix components once they have failed. A total proactive mainte-nance plan includes corrective maintenance as well as preventivemaintenance as an integral part of its strategy. These two entities areperformed integrally to prevent a failure consequence at the plantlevel.
CRAFT FEEDBACK This is one of the most significant elements ofthe living program. It provides direct feedback from the craft personnelperforming the PM tasks that were established. The craft feedbackelement allows for the expert opinion and best judgment of the craftpersonnel or technician to determine the appropriateness of the PMtask. This includes the work scope of the task, the task periodicity, andwhether there is a recommendation for some other modification oradjustment to the task.
CREDIBLE FAILURE CAUSES Credible failure causes are thosecauses of equipment failure that are most likely to occur and shouldnot include a list of all theoretical or postulated causes that in actual-ity may never occur. Pertinent experience in combination with prudentjudgment on the part of knowledgeable individuals is a necessary cri-terion in ascertaining credible failure causes.
270 Glossary
The causes of failure include failures of the piece parts, for example,bearing failures, seal failures, motor winding failures, limit switch fail-ures, gear failures, and shaft failures.
CRITICAL COMPONENTS Critical components are those componentsfor which the occurrence of the failure is evident and the failureimmediately results in an unwanted plant consequence. Critical com-ponent failures are at the top of the RCM component classificationhierarchy, having the top priority for preventing a failure becausetheir failure consequence is immediate. See POTENTIALLY CRITI-CAL COMPONENTS.
DEMAND MODE OF OPERATION Components that do not normallyoperate and are primarily used in standby safety systems and backupfunctions are analyzed in their demand mode of operation as thoughthey were called upon to function. The component’s function is normallyinactive or “not in use” when the system is in service and becomes activeonly when an event or signal occurs that triggers the demand for thecomponent’s functional activation.
DISASTERS Disasters can be caused by acts of nature, human error,or equipment failures. Acts-of-nature disasters such as hurricanes,earthquakes, tsunamis, tornados, and landslides do not lend themselvesto being tamed by human intervention, so for the most part they areunavoidable. There may be warning systems such as tsunami warningbuoys in the Pacific Rim or construction standards that may help toprevent structures from buckling during an earthquake, but the eventitself is unavoidable. On the other hand, human error, such as piloterror, judgment error, or operator error, offers latitude in circumvent-ing the potential for inducing a disaster.
Disasters that happen in factories, plants, or other facilities usuallyhave their origin in the failure of equipment. These types of failuresprobably offer the greatest latitude of all for circumventing their poten-tial to induce a disaster. Nothing is ever 100 percent reliable, whether itis an aircraft, a space shuttle, or a nuclear power plant. However, dis-asters caused by equipment failure have the capability to be harnessedto the degree that allows for the closest proximity to that 100 percentreliability threshold. That cannot be said for natural disasters orhuman-induced ones.
DOMINANT FAILURE MODE For each functional failure there is afailure mode. The dominant failure modes are those modes of failurethat are most likely to occur. For example, a failure mode of a valve orswitch would be that the valve “fails closed” or the switch “fails to actu-ate.” Note that the dominant failure modes are not the same as the fail-
Glossary 271
ure causes. The valve could fail closed because of hinge pin wear, forexample. The hinge pin wear is the cause of the dominant failure mode.
ECONOMICALLY SIGNIFICANT GUIDELINE Components that arenot classified as critical, potentially critical, or commitment could beeconomically significant. The Economically Significant Guideline gov-erns the decision process for the component being classified as eco-nomically significant.
ECONOMIC COMPONENTS Economically significant components arethose components whose failure results in an economic consequenceonly. The consequence of failure results only in labor and/or materialcosts. There is no safety or operational concern with the failure of an eco-nomic component. If the failure of a high-cost component also resulted ina safety or operational concern, it would default to the highest classifi-cation, which would be critical, potentially critical, or commitment.
EQUIPMENT See COMPONENT.
EVIDENT FAILURE In RCM terminology, an evident failure refers tothe ability of the operating crew, during their routine duties, to observethat a failure has occurred. Either the failure of the component itself isevident or the consequence of the failure is evident to the operatingcrew during their routine duties. See EVIDENT INDICATION.
EVIDENT INDICATION This is an indication of the failure of the spe-cific component, or an indication of related failure consequences involv-ing the component, that becomes evident. The indication of failuremust be evident to operators in the control room, in the auxiliary con-trol stations, or during formal, proceduralized operator rounds.
FACILITY Facility and plant are synonymous in this book. They arethe entities for which you should maintain a reliability program. Afacility or a plant could be any entity—a cruise ship, the space shuttle,an off-shore oil drilling platform, a manufacturing or production facil-ity, an aircraft, an electrical power station, the electrical grid network,a water treatment plant, a hospital, a refinery, an assembly line, apaper mill, or any other complex entity requiring a reliability program.
FAILURE See COMPONENT FAILURE.
FAILURE CAUSE The causes of failure involve the piece parts of theequipment. For example, the bearings could be a cause for a pump ormotor failure, the butterfly disc could be the cause for a valve failure,the internal diaphragm could be the cause for an air-operated valvefailure, and so on. The preventive maintenance strategy is designed toprevent functional failures by specifying PM tasks that target the
272 Glossary
causes of those functional failures in an effort to prevent them fromoccurring. See CREDIBLE FAILURE CAUSES.
FAILURE EFFECT See CONSEQUENCE OF FAILURE.
FAILURE-FINDING TASK This is one of the three categories of preven-tive maintenance. Failure-finding tasks are specified when a condition-directed or time-directed task is not applicable. A failure-finding taskwill not prevent a failure at the component level. Rather, a failure-finding task is part of the preventive maintenance strategy to deter-mine that a hidden failure has occurred. In doing so, the failure-findingtask can avert an unwanted consequence at the plant level before anadditional failure or initiating event occurs in combination with thehidden failure. See CONDITION-DIRECTED TASK, TIME-DIRECTEDTASK.
FAILURE MODE See DOMINANT FAILURE MODE.
FAILURE MODES AND EFFECTS ANALYSIS (FMEA) This is theaccustomed standard logic matrix for classical RCM, which requiresthat functions be defined at the system and subsystem level. Thisresults in the need to establish system boundaries and interfaces. InRCM Implementation Made Simple, the FMEA is replaced by the con-sequence of failure analysis (COFA). See COFA, COFA LOGIC TREE.
FAILURE MODES AND EFFECTS AND CRITICALITY ANALYSIS(FMECA) The FMECA is similar to the FMEA, except it also includesthe identification of the causes of failure at the same time as functionsand failure effects are being analyzed. In RCM Implementation MadeSimple, the causes of failure are analyzed separately within the PMTask Logic Tree and the PM Worksheet. This is to provide greater effi-ciency in the process of selecting the different types of PM tasksbecause PM tasks can be grouped together by component type. See PMTASK SELECTION LOGIC TREE, PM TASK WORKSHEET.
FREQUENCY Frequency is the specification of the base of time usedto determine the periodicity. The frequency is normally described interms of the following time base: hour, day, week, month, and year. Thefrequency is used in conjunction with the interval to define a specificperiodicity. See INTERVAL, PERIODICITY.
FUNCTIONAL FAILURES Typically, the functional failures are theexact opposites of the functions. For example, if the function is “to pro-vide a flow path for cooling heat exchanger X while pump Y is operat-ing,” the functional failure will be “fails to provide a flow path for coolingheat exchanger X while pump Y is operating.” See also FUNCTIONS.
Glossary 273
FUNCTIONS A function describes what the component must accom-plish.The function is the explanation for why the component is installed,and preserving these functions is the main objective of the mainte-nance program.
In the absence of a regulatory requirement that specifically definesthe operational parameters that the function must meet, the only func-tional definition you need to specify is a performance standard at alevel determined by you, the owner of the facility, and the owner ofyour RCM program. For example, in the absence of any other specificrequirements, the function of a pump could be written as: “provides thenecessary flow needed to maintain the tank inventory at its nominallevel.”
HIDDEN FAILURES Hidden failures do not result in an immediateplant effect since, by definition, for a plant-affecting situation to occur,the failure or the result of failure must be evident to operating person-nel. If the effects of a failure are not observable, the failure will have noimmediate impact. When a component is required to perform its func-tion and its consequence of failure is not evident—that is, the immedi-ate overall operation of the system remains unaffected in either thenormal or the demand mode of operation—the failure is a hidden fail-ure. The purpose of identifying hidden failures is to prevent the expo-sure to plant effects that could result from multiple failures, time, orother initiating events involving the respective component in its hid-den failure state.
HIDDEN FUNCTIONS A component has a hidden function wheneither of the following conditions exist:
1. The function is normally active or in use when the system is inservice, but there is no indication to operating personnel when thefunction is lost or ceases to perform.
2. The function is normally inactive or not in use when the system isin service and there is no indication to operating personnel thatthe function is not available when needed.
See also HIDDEN FAILURES, STANDBY COMPONENTS, ANDSTANDBY FUNCTIONS.
INDICATION OF FAILURE See EVIDENT FAILURE, EVIDENT INDI-CATION.
INITIATING EVENTS An additional event that can occur such as aloss of on-site power, flooding after a storm, a local fire, or any otherevent that could, in combination with an existing failure, result in anunwanted plant consequence. See POTENTIALLY CRITICAL COM-PONENTS.
274 Glossary
INSTRUMENT LOGIC TREE This logic tree guides you through theprocess of identifying the preventive maintenance strategy for instru-ments.
INSTRUMENTS Instruments can be either functional instruments,those that provide a specific function such as a level switch that con-trols another valve, or they can be indication-only instruments thatprovide only an indication reading from a gage or monitor, for example,and do not in themselves provide a direct function.
INTERFACES Interfaces are auxiliaries outside the system or sub-system that are required for operation of the system or subsystembeing analyzed. Interfaces provided by systems outside the systemare designated as out-system in-interfaces. Interfaces provided by theanalyzed system or subsystem that are needed to operate outside sys-tems are designated as in-system out-interfaces. Interfaces provided byanother subsystem within the same system are designated as in-system in-interfaces.
INTERVAL The interval is an integer used with the frequency todefine a specific periodicity. For example, if a PM task is accomplishedevery two months, the frequency would be monthly and the intervalwould be 2, which would read “M2.” The periodicity is therefore M2. Ifthe task is accomplished every six months the interval would be 6 andthe periodicity would be M6. See FREQUENCY, PERIODICITY.
LIVING RCM PROGRAM Because RCM is not a static, one-shotattempt to develop a preventive maintenance program, it must remaina living and viable program, constantly being monitored for changes.
Your RCM program was based on the knowledge and awareness ofthe information, facts, and data that you had at the time of imple-menting the program. This is especially true of the periodicities pre-scribed for the PM tasks. However, everything is subject to change.These changes can come about as a result of new failure modes thatbecome apparent but were nonexistent at the time of implementation.Changes in maintenance methods may be sufficiently beneficial to allowperiodicities to be extended. On the other hand, some changes in equip-ment parameters may have resulted in the need for reducing periodic-ities to maintain reliability. Modifications to the plant, modifications toequipment, changes in operating characteristics, and new PdM tech-nologies, which are appearing everyday, all contribute to the need forcontinuously reviewing and updating your maintenance program andmaintaining it as a living program.
MISSING LINK The missing link of RCM has been the absence of adefinitive category for component failures that are hidden and not
Glossary 275
immediately evident, which are referred to as potentially critical compo-nents (i.e., having the potential to become critical). See POTENTIALLYCRITICAL COMPONENTS.
MONITORING AND TRENDING This is a strategy that monitors andmeasures aggregate performance criteria to allow for quantitativelyassessing plant reliability. An aggregate philosophy affords the capa-bility to have an instantaneous snapshot of the reliability of the plantand the effectiveness of the preventive maintenance program. The mon-itoring and trending strategy shows the trended relationship betweenthe expected performance rate (EPR) and the actual performance rate(APR).
MULTIPLE FAILURES A multiple-failure analysis is required whenthe occurrence of a single failure is hidden. In the event of a hiddenfailure, an unwanted consequence may not occur until additional mul-tiple failures occur. Multiple-failure analysis is one of the three corner-stones of RCM. Even in the case of a run-to-failure component wherethe occurrence of the failure is evident, the failure must be corrected ina timely manner before additional multiple failures occur. See COR-NERSTONES OF RCM, POTENTIALLY CRITICAL COMPONENTS,CANON LAW FOR RUN-TO-FAILURE.
NONCREDIBLE FAILURE A noncredible failure has theoretical orpostulated causes that in actuality may never occur or are veryunlikely to occur. See CREDIBLE FAILURE CAUSES.
NORMAL MODE OF OPERATION The normal operating mode for acomponent or system is when the function of that component or sys-tem is normally active. The normal mode of operation represents theability to discern, during routine plant operation, that a component isfunctioning properly or that it has failed. See DEMAND MODE OFOPERATION.
OPERABILITY CONCERNS These are consequences of failure thatpertain to the operability of the facility, and are distinct from safetyconcerns and economic concerns. See ASSET RELIABILITY CRITE-RIA, ECONOMIC COMPONENTS.
OPERATOR ROUNDS Operator rounds are an integral part of anypreventive maintenance program. These are the routinely scheduled,formalized inspections made by the plant operating staff to ensure thatplant equipment is operating properly. They offer the ability to identifyequipment that may be making uncharacteristic noises, or to identifyoil, water, steam, or other fluid leaks. Operator rounds provide thecapability for routinely monitoring expected pressures, temperatures,electrical readings, and so on, of plant equipment.
276 Glossary
PERIODICITY The periodicity includes both the frequency and theinterval. For example, an A2 periodicity indicates an annual frequencyA plus the interval of 2, meaning the task is performed every two years.Using the frequency alone can be misleading. For example, extendingthe frequency from weekly to monthly means you perform the task lessoften, thereby increasing the periodicity. Conversely, reducing the fre-quency from monthly to weekly means you perform the task moreoften, thereby decreasing the periodicity.
PHASES OF RCM
Phase 1: Consists of identifying equipment that is important to plantsafety, generation (or production), and asset protection.
Phase 2: Consists of specifying the requisite PM tasks for the equip-ment identified in phase 1. These tasks must be both appli-cable and effective.
Phase 3: Consists of properly executing the tasks specified in phase 2.
PIECE PARTS These are the individual parts that are responsible forthe causes of equipment failures. See CREDIBLE FAILURE CAUSES.
PLANT See FACILITY.
PM TASK SELECTION LOGIC TREE This contains the logic for select-ing the PM category of either a time-directed, a condition-directed, or afailure-finding task. It also provides the logic for discerning when adesign change is necessary.
PM TASK WORKSHEET This is the worksheet on which decisions aredocumented relative to specifying the various PM tasks. It is applica-ble only to those components that were identified as critical, poten-tially critical, commitment, or economic.
POTENTIAL FAILURES This term should not be confused with poten-tially critical. Potential failures are incipient equipment failures thatare usually detected by predictive maintenance techniques such asvibration analysis, oil sampling, and thermography. A potential failurerefers to the detection of the impending or imminent failure of a com-ponent. It is a component that is about to fail—for example, a compo-nent that is vibrating, is running at a higher than normal temperature,has a fluid leak, or is making unusual noises.
POTENTIALLY CRITICAL COMPONENTS This component classifica-tion has been the missing link of RCM. A potentially critical componentis one whose immediate failure is not evident and is not immediatelycritical but has the potential to become critical either with a durationof time in and of itself, with an additional failure, or with an additionalinitiating event, at which time the consequence of the failure may unfor-
Glossary 277
tunately become quite evident (and critical). The potential to becomecritical can occur not just with an additional component failure, butalso with an additional initiating event, or even with an additional rou-tine plant evolution such as turning on a seldom-used system, switch-ing on a newly modified circuit, or shutting down a pump under certainconditions.
Potentially critical components can be thought of as sleeper cellslying in wait to wreak havoc upon your plant or facility. They are failedcomponents that are not evident, so no one knows they have failed.They are components that no longer perform their function, but youdon’t and won’t know about their loss of function and potential conse-quence of failure until an additional failure, initiating event, or evolutionoccurs, causing the sleeper cell to manifest itself. This is a vulnerabilitythat must be avoided!
The majority (approx 98 percent) of potentially critical componentsare so designated as a result of the effects of multiple failures or initi-ating events, as opposed to the effects of time duration (approximately2 percent). The reason for including the aspect of time duration is forthe analysis to be absolutely complete, thorough, and accurate so thatnothing escapes the analysis or is inadvertently omitted.
Potentially critical components as a result of multiple failures or initi-ating events: When two (or more) components (valves, pumps, motors,etc.) operate to supply a function that each can fulfill individually,and there is no indication of failure for each component individually,then a failure of one of the components is hidden (there is no indica-tion the component has failed), and the failure does not result in animmediate plant effect. However, if a second component should fail,or if some other initiating event or plant evolution takes place thatwould otherwise rely on the failed component, then a plant-effectingconsequence would occur. Hence, the component is considered poten-tially critical. For example, if there are two pumps normally operat-ing at the same time, a failure of the pump discharge check valve inthe open position will be hidden. Only when the associated pumpfails will the unwanted reverse flow path through the failed opencheck valve become evident.
Potentially critical components as a result of time: A typical exampleof being potentially critical due to time is if one panel of a multipanelcirculating-water traveling screen, which filters seaweed and otherocean debris, were to fail or become damaged, there would be no indi-cation that the panel had failed, nor would there be an immediateeffect. However, over a duration of time, the failure of one of thescreen’s panels, in and of itself, can eventually cause clogging of theheat exchangers by failing to filter debris, which will ultimatelyresult in a plant effect. Note that the traveling screen never fails
278 Glossary
completely or immediately and that you do not need to have a secondadditional failure for this consequence to occur. Another example ofclassifying a component as being potentially critical because of timeduration is a large tank that has a small leak that has not beendetected. This would not be evident immediately, nor would it requirea second multiple failure to manifest itself. However, over a givenduration of time, in and of itself, a plant consequence may occur, sincethe inventory of the tank represents an important function. These arevulnerabilities that you will not know about until they have alreadyresulted in a plant consequence—which is not the time to find outabout them. When that happens, it is too late to take preventiveaction.
POTENTIALLY CRITICAL GUIDELINE This guideline contains thelogic for determining when a component is classified as being potentiallycritical. It represents an extremely important facet of an RCM program.See POTENTIALLY CRITICAL COMPONENTS, RCM FILTER.
PREDICTIVE MAINTENANCE TASKS Predictive maintenance (PdM)is a subset of condition-directed maintenance and includes usingmostly nonintrusive technologies to monitor equipment for precursorsto failure. Predictive maintenance techniques are used to determine thecondition of the equipment so that incipient failures can be detectedand required overhaul or replacement can be scheduled to preclude theoccurrence of a functional failure.
Commonly used PdM techniques include vibration analysis, ther-mography, oil sampling and analysis, acoustic monitoring, radiographyinspection, magnetic particle inspection, eddy current testing, ultrasonictesting, liquid penetrant, motor current signature analysis, boroscopeinspections, motor-operated valve diagnostic testing, and air-operatedvalve diagnostic testing.
PREVENTIVE MAINTENANCE Preventive maintenance is the strat-egy designed to prevent an unwanted consequence of failure. Thisstrategy could be directed at preventing failures at the componentlevel or it could be designed for preventing failures directly at the plantlevel. Preventing failures at the component level is obviously a well-understood concept.
Preventing failures directly at the plant level, however, includes spec-ifying failure-finding tasks and including corrective maintenance aspart of the overall preventive maintenance strategy. Failure-findingtasks are necessary to preclude the occurrence of an unwanted plantconsequence as the result of a hidden failure in combination with addi-tional multiple failures or other initiating events. Corrective mainte-nance, too, must be addressed for an overall preventive maintenancestrategy to preclude the occurrence of an unwanted plant consequence
Glossary 279
as the result of failure of a run-to-failure component in combinationwith additional multiple failures or other initiating events. IncludingRTF components as part of the overall preventive maintenance strat-egy is virtually always overlooked.
Preventive maintenance includes specifying condition-directed, time-directed, or failure-finding tasks to prevent failure consequences. Aspart of these three main categories, predictive maintenance tasks,operator rounds, and a whole host of other types of tasks are prescribed.See CONDITION-DIRECTED TASK, CONSEQUENCE OF FAILURE,FAILURE-FINDING TASK, PREDICTIVE MAINTENANCE TASKS,TIME-DIRECTED TASK.
QUALIFYING CONDITIONS (FOR ASSET RELIABILITY CRITERIA)When selecting the asset reliability criteria, which are the consequencesthat must be avoided to ensure the protection and productive capabilityof your facility, qualifying conditions can sometimes be placed on thecriteria as a threshold point for allowing a certain amount of latitudebefore specifying that an unwanted consequence has actually occurred.For example, in the event of an unplanned power reduction, the thresh-old may be 30 minutes, meaning that as long as the power reductionwas for less than 30 minutes, the unplanned power reduction thresholdwould not be met. See ASSET RELIABILITY CRITERIA.
RCM FILTER This is a depiction of the filter displaying the uncompli-cated decision logic process of RCM Implementation Made Simple. Itillustrates how every component must pass through the different stagesof this filter to discern their classification. The first stage of the filterdetermines whether the component is critical, the second stage of the fil-ter determines whether the component is potentially critical, the thirdstage identifies commitment components, and the fourth stage defineseconomically significant components. Any component that makes itthrough all four filter stages is classified as run-to-failure. See COM-MITMENT COMPONENTS, CRITICAL COMPONENTS, ECONOMICCOMPONENTS, POTENTIALLY CRITICAL COMPONENTS, RUN-TO-FAILURE (RTF). See also Figure 5.3.
REDUNDANCY Redundancy is a widely misunderstood term. Redun-dancy means more than just having two components instead of onecomponent supplying a function, in the belief that preventive mainte-nance is not that important in such a situation. Although redundancy,according to its most basic definition, does mean that there is morethan one component available to perform a particular function, redun-dancy alone does not provide sufficient indication that one of the two(or more) redundant components has failed.
Standby and backup components are considered to offer redundancy,
280 Glossary
but they do not operate simultaneously. Truly redundant componentsusually operate simultaneously. Redundancy in general, however, doesnot imply that there is an indication of failure for each redundant com-ponent. See STANDBY COMPONENTS, STANDBY FUNCTIONS.
RELIABILITY Reliability is the probability that an item will surviveto a specified operating age, under specified operating conditions, with-out failure. More comprehensively, reliability can be defined as thecumulative and integrated rate of unwanted aggregate events per unitof time, where the events are not limited to just equipment failures.Reliability includes a whole host of unwanted events and occurrencesthat can be measured as a rate of time. Reliability represents a broaderspectrum of events than just failures; therefore, reliability measure-ments, not just limited to failures, can offer much more intuitive insightfor determining the effectiveness of your preventive maintenance pro-gram and how well your facility is being run.
RELIABILITY-CENTERED MAINTENANCE (RCM) RCM comprises aset of tasks generated on the basis of a systematic evaluation that areused to develop or optimize a maintenance program. RCM incorporatesdecision logic to ascertain the safety and operational consequences offailure and identifies the mechanisms responsible for those failures.
RUN-TO-FAILURE (RTF) RTF is the misunderstood orphan of reli-ability. Most people, engineers included, provide the automatic responsethat if a component fails and nothing happens, it is a run-to-failurecomponent. This is completely wrong. Another prevalent but totallyincorrect assumption is that having redundant components or redun-dant systems automatically means the component or system is run-to-failure. The common definition of RTF found in most RCM books willsimply state that “the component is allowed to fail with no PMsneeded.” That definition is far too shallow to accurately define RTF andprevent mismanagement of it. A very precise and prescriptive means ofidentifying when a component can be classified as run-to-failure isneeded. I have called this the Canon Law for Run-to-Failure. SeeCANON LAW FOR RUN-TO-FAILURE.
RUN-TO-FAILURE ANOMALIES If the component is low enough inthe hierarchy of relative importance, although the component failuremight be evident, there still may not be any plant consequence even ifthere were additional failures in conjunction with the original failure.When the logic delineates a multiple-failure scenario that still does nothave any unwanted consequence of failure, always ask, “Why is thecomponent even installed in the plant?” Another possible anomalywould exist for those components that are installed in your facilitystrictly for convenience or that have insignificant value. It is not
Glossary 281
uncommon to find that even though such components have failuresthat are not evident, in accordance with the process logic, they may stillend up being classified as RTF.
The inherent benefit of the canon law for run-to-failure is that itmakes these anomaly components stand out and be noticed, so that nocomponent of importance escapes the RCM logic. It provides a path forexception, but only after that exception has been carefully analyzed.Any anomaly components can then be evaluated for whether they shouldcontinue to be maintained or whether they should be considered forremoval from the plant entirely—but that decision is yours.
SAE STANDARD FOR RCM The Society of Automotive Engineers(SAE) developed a standard that entitles a process to be called an RCMprocess. The main reason for this was that the term RCM was beingapplied to a multitude of PM program enhancements that had no tech-nical logic and were not systematically developed. They were a con-glomeration of PM betterment efforts, or PM review efforts, or PMprogram updates, that were improperly described under the pretext ofbeing called RCM. The SAE wanted to ensure the isolation of theseother, rather arbitrary, efforts from the more defined and thoroughapproach of specifically applying RCM logic. In consequence, theyissued a fundamental standard referred to as SAE Document JA1011that had to be met in order to call the maintenance program process anRCM process.
SAMPLING This is a strategy that performs a comprehensive inter-nal inspection of specific components that have been in operation formany years without ever having been overhauled or replaced, and mayhave undetected incipient failure mechanisms taking place. There maybe strong suspicions that certain major components need to be over-hauled or replaced, because pump seals, impellers, stator windings,and bearings don’t last forever, even if you have been religiously per-forming routine predictive maintenance tasks such as monitoring forexcessive vibration and sampling and changing the oil. It is still not aneasy feat to convince senior management to buy into a widespreadoverhaul plan without evidence of equipment degradation, and that iswhere a sampling strategy can be of immense reliability value.
Another reason for performing a sampling inspection is to confirm thevalidity of your predictive maintenance technologies. It is not uncom-mon for major failure mechanisms to go undetected on some equipment,even with a host of PdM tasks that are regularly accomplished.
SINGLE-FAILURE ANALYSIS RCM is nominally a single-failure anal-ysis except when the failure is hidden. It then becomes a multiple-failure analysis. See HIDDEN FAILURES, HIDDEN FUNCTIONS,POTENTIALLY CRITICAL COMPONENTS.
282 Glossary
SLEEPER CELL This expression is used to describe how a hidden fail-ure remains undetected, similar to being in a sleeper cell mode, waitinguntil an additional failure or initiating event occurs, which in combina-tion with the hidden failure causes an unwanted plant consequence.
STANDBY COMPONENTS These components are described as eitherstandby, backup, or redundant components. Standby and backup com-ponents are usually not operated simultaneously. They operate in astandby or backup mode of operation in the event of failure or upon thedemand of another component. They may or may not be similar compo-nents. A standby or backup pump, for example, may activate on thedemand of a pressure or flow switch. They can function automaticallyon an input signal, or they can function by manual initiation. Unlikestandby or backup components, truly redundant components or systemsare usually like components or systems that operate simultaneously.
STANDBY FUNCTIONS These functions are usually associated withnormal standby and standby safety systems. The system must be ana-lyzed in its demand or functional operating mode to identify criticaland potentially critical components, since the system is not normallyoperating. Standby systems must have surveillance or failure-findingtasks specified on a periodic basis to ensure the operability of the sys-tem or component so it can function as intended to prevent a conse-quence of failure.
STREAMLINED RCM This includes various forms of preventive main-tenance that are truncated versions of classical RCM. For the most partthey do not meet the definition of an RCM program as defined by theSociety of Automotive Engineers in accordance with SAE DocumentJA1011. See SAE STANDARD FOR RCM.
TIME-DIRECTED TASK This is one of the three categories of preven-tive maintenance. Time-directed tasks are usually intrusive mainte-nance activities such as overhauls, disassemblies, replacements, andinternal inspections, which are scheduled according to a given period-icity. See CONDITION-DIRECTED TASK, FAILURE-FINDING TASK.
TIMELY MANNER This is the commonly used term for describing whencorrective maintenance on a run-to-failure component must be per-formed. A run-to-failure component must be corrected in a timely man-ner depending on the plant conditions at that time. The timely mannermay be measured in hours, days, or weeks depending on the judgmentand the decision process of operations and engineering personnel and onthe existing plant conditions. A timely manner cannot under any cir-cumstance be limitless. See CANON LAW FOR RUN-TO-FAILURE,CORRECTIVE MAINTENANCE, RUN-TO-FAILURE (RTF), RUN-TO-FAILURE ANOMALIES.
Glossary 283

This page intentionally left blank
285
Bibliography
Author’s Note: I have limited the bibliography to only those sourcesthat I consider pertinent to understanding RCM. There are, of course,many other good books and publications on RCM that I am familiarwith and could list, but for the most part they do not offer any addi-tional insight into RCM. The reference documents I have listed coverthe fundamental issues of RCM.
Air Transport Association of America. Airline/Manufacturer Mainte-nance Program Planning Document, Maintenance Steering Group(MSG)—2, 1970.
Air Transport Association of America. Airline Program DevelopmentDocument, Maintenance Steering Group (MSG)—3 Task Force Docu-ment, 1980.
Bloom, Neil. “Reliability Centered Maintenance—A Case Study.” Pre-sented at the Argonne National Laboratory in cooperation with theUnited States Nuclear Regulatory Commission, Argonne, IL, 1992.
Bloom, Neil. “The Role of RCM in the Overall Maintenance Program.”Presented at the International Atomic Energy Agency (IAEA),Vienna,Austria, 1991.
Bloom, Neil. “Understanding Hidden Failures in RCM Analyses.” Main-tenance Technology, 2003.
Bloom, Neil. “Understanding Hidden Failures in RCM Analyses,” Pre-sented at the Process and Power Plant Reliability Conference, Hous-ton, TX, 2003.
Moubray, John. “Is Streamlined RCM Worth the Risk?” MaintenanceTechnology, 2001.
Moubray, John. Reliability Centered Maintenance RCM II, 2nd ed.,Industrial Press, 1997.
Netherton, Dana. “RCM Tasks,” Maintenance Technology, 2004.Netherton, Dana. “Standard to Define RCM,” Maintenance Technology,
2003.Nowlan, F. Stanley, and Howard F. Heap. Reliability Centered Mainte-
nance. U.S. Department of Commerce, National Technical Informa-tion Services, Report Number AD/A066-579, December 1978.
Copyright © 2006 by the McGraw-Hill Companies. Click here for terms of use.

This page intentionally left blank
287
Index
Age, relationship to failure, 162–163,178
Aggregate metrics, 10, 217–223,239–240, 260–261
as part of performance graphs, 237weighting factors for, 230
“Applicable and effective,” 30, 67,80–82, 117, 158–160
instrument-related, 182 versus nonapplicable and effective,
169in phase 2 of RCM, 131and PM Worksheet, 100when it cannot be defined, 112
Asset reliability criteria, 30, 50, 80–82,100, 209, 255–256
defining, 107, 109–119, 129–132, 139,144
as part of aggregate metrics, 225as part of COFA, 157as part of PM Task Worksheet, 157 typical examples of, 111(See also Qualifying conditions)
Backup components and functions (seeStandby components and func-tions)
Bathtub curve, 161–162, 244Benchmarking, 239Boundaries, 3, 256, 262
associated with RCM made “diffi-cult,” 147–149
confusion concerning, 21–22eliminating requirement for, 75–78,
98–99unnecessary, 28, 34, 92
Cannon law for run-to-failure, 4, 25, 27,52–58, 68–70, 86, 255
definition of, 54–55 Causes of failure, 79, 87, 94, 102, 116,
153–154, 158–162, 167–168, 256(See also Credible failure cause;
Piece parts)
Classifications (see Component classifi-cations)
COFA, 87, 107–108, 146–147, 208–210,214, 255–259
compared to SAE Standard, 134defined, 4, 28as first stage of RCM filter, 119–120versus FMEA, 81–82, 95for instruments, 182, 185, 190integrated with PM task selection
logic, 153, 157, 169for plant design changes, 208reason for, 82, 90–100understanding of, 112–115, 119–140
COFA Logic Tree, 82, 124, 137–139,146, 256–258
diagram of, 113as first stage of RCM filter, 119–121understanding of, 112–115, 119–140(See also COFA)
COFA worksheet, 82, 97, 100, 105, 108,121–132, 137, 146, 157, 258
for instruments, 185for plant design changes, 208understanding of, 112–115(See also COFA; COFA Logic Tree)
Commitment components, 26, 50–55,74–75, 82, 86, 146, 160, 178,257–258
in living RCM program, 204–210in PM strategy, 50–51, 74, 100, 112related to implementation process,
112–119related to instruments, 186 as third stage of RCM filter, 119
Common mode failures, 43, 171, 187Companion equipment, 133 Component(s), 6–7, 17–18, 21–22
alphanumeric database of, 91–92analyzing, 77–78, 93assigned at specific I.D. number, 93classifications of, 73–74default, 67grouping of, 34
Copyright © 2006 by the McGraw-Hill Companies. Click here for terms of use.
Component(s) (Cont.):inappropriate classifications of,
25–26as sole level of importance, 22staying at level of, 34, 42, 45subtle classification differences of, 40synonymous with equipment, 78–79 (See also Commitment components;
Critical components; Economic com-ponents; Potentially critical compo-nents; Run-to-failure components)
Component classifications, 56, 72–74,110, 113, 129, 131
examples of, 72–73hierarchy of, 73–74
Concepts of RCM, 3–4, 8, 13–14, 18,55–56, 68–69, 85–86, 255
for averting disaster, 61–65explained for first time, 27–34if misunderstood, 21pertaining to hidden failures and
redundancy, 24–28as preparation for RCM implementa-
tion, 105Condition-directed task, 154–156,
159–162, 172, 175–176, 205, 212,258
(See also Bathtub curve; Failure-finding task; Time-directed task)
Confusion surrounding RCM, 17, 46,82, 262
regarding convention, 24, 94, 154regarding system boundaries and
interfaces, 21regarding system functions, 70regarding traditional renditions of
RCM, 114Consequence of failure, 4–6, 27–28, 85,
87, 115, 255–256anomalies and, 68and asset reliability criteria, 100, 129in bigger picture, 59–61depending on how function is writ-
ten, 67economics of, 27final destination of, 82independent of component pedigree,
81for instruments, 182, 190potential result of, 37–39, 48 quest for, 21, 79as ultimate objective of PM program,
57
Consequence of failure analysis(COFA) (see COFA)
Consultants, 3, 11, 13, 15–16, 95, 251,255, 262
Convention terminology, 24, 91, 105, 269for failure modes, 94for instruments, 181for PM tasks, 154
Cornerstones of RCM, 3, 32Corrective maintenance (CM), 8, 24–25,
39, 53–61, 81, 114, 157, 186 as integral part of run-to-failure, 27,
45, 53–61, 68–69, 86as part of living RCM program,
195–196, 200, 203–204, 210, 213as part of monitoring and trending,
229, 244Craft feedback, 10, 196–202, 210, 213,
259Credible failure cause, 160, 167–168
versus noncredible failure cause, 116Critical components, 17, 26, 34–35,
39–40, 52, 69, 85, 255–257beginning logic process by defining,
113–119deeper look at, 65as first stage of RCM filter, 119as part of component hierarchy,
73–74as part of defensive PM program
strategy, 75and sampling strategy, 169–170
Demand mode of operation, 33, 36,45–46, 67, 126, 155
(See also Normal mode of operation)Design change, 43, 64, 86, 112, 134,
141, 208, 224, 245and craft feedback element, 198for critical and potentially critical
components, 119depending on applicable and effective
task, 160for instruments, 184–191recommendation criteria for,
166–168, 204Disasters, 2, 141Divergent expectations, 23Dominant failure mode, 98–99,
167–168defined, 116, 146described for each functional failure,
124–130, 138
288 Index
Economic components, 51, 75, 82–83,86, 102, 160, 178, 258
in economic evaluation worksheet,113
as fourth stage of RCM filter, 119included in equipment database, 210
Economically significant guideline,112–120, 146, 153, 204, 257–258
illustrated, 114instrument-related, 182, 190as part of RCM filter, 119
Equipment (see Component)Evident failures, 10, 29, 33–55, 63–70,
82, 85–86, 258as first question to RCM COFA deci-
sion logic, 115–118as part of COFA worksheet, 124–132
Evident indication (see Evident fail-ures)
Facility, 12, 129synonymous with plant, 272(See also Types of facilities)
Failure:age-related (see Age, relationship to
failure)causes of (see Credible failure cause)effect of (see COFA; Consequence of
failure)evident (see Evident failures)hidden (see Hidden failures)
Failure-finding task, 43, 46, 154–156,160, 167, 178, 258
(See also Condition-directed task;Time-directed task)
Failure modes (see Dominant failuremode; Hidden failure mode)
Failure modes and effects analysis(FMEA):
versus COFA, 81–82, 87versus COFA spreadsheet, 95–100as part of RCM made “difficult,”
147–148Frequency and interval (see Periodicity)Functions, 12, 45, 87, 91, 93, 121, 138,
145, 256–258 described, 121, 123–125grouping not allowed for, 34, 202not required at system level, 22, 28related to companion equipment,
133specified at component level, 34,
76–82, 98–99
Functions (Cont.):(See also Confusion surrounding
RCM, regarding system functions;Standby functions)
Functional failures, 77, 80, 91, 99, 110,123–124, 150, 258
(See also Functions)
Health of plant, 217–231, 247Hidden failure mode, 66
(See also Hidden failures)Hidden failures, 3–4, 24–25, 66, 255
applicability to failure-finding tasks,155, 178
deeper look at, 65as first question to RCM COFA deci-
sion logic, 115–118not part of RTF philosophy, 52–55,
64–65related to missing link, 46–50, 85understanding more about, 27–42
Hidden functions, 274 (See also Hidden failures)
Hidden systems, 25 (See also Evident failures; Hidden
failures; Hidden functions;Standby functions; Testing hiddensystems)
Immediate effect, 25, 39, 46–49, 57(See also Critical components)
Initiating events, 47–50, 68, 75, 85, 155,160
and Potentially Critical Guideline,114, 118, 139, 257
Instrument logic tree, 182–183, 259(See also Instruments)
Instruments, 14, 26, 87, 181–191, 259Interfaces (see Boundaries)In-house control, 7, 16–19, 95, 109
Living RCM program, 10, 13–14, 79,165, 193–215, 259–260
analysis element, 209corrective maintenance element, 203craft feedback element (see Craft
feedback)engineering evaluations, 208equipment database, 210industry failure data, 207monitoring and trending, 208new commitments, 208other inputs, 205
Index 289
Living RCM program (Cont.):plant design changes, 208PM audit, 210regulatory bulletins, 207root-cause evaluations, 206vendor bulletins, 206
Living RCM program model, illus-trated, 195
Misunderstanding:of hidden failures, 24of redundancy, 70of run-to-failure, 25
Missing link, 18, 46, 64–65, 85, 255(See also Potentially critical compo-
nents)Monitoring and trending, 10, 195–196,
217–245, 260–261of equipment versus facility, 209
Multiple failures, 4, 25, 32–69, 85, 255
Normal mode of operation, 33, 45–47,66–67, 71–73, 85–87, 126, 178
(See also Demand mode of operation)Normally active (see Normal mode of
operation)Normally inactive (see Demand mode of
operation)
Operability testing (see Testing hiddensystems)
Operator rounds, 70, 116–117, 124, 186Operational criteria (see Asset reliabil-
ity criteria) Optimum state, 244–245, 248, 261
Performance, 13–14, 84, 195, 209, 214,260
calculations, 230–235comparison with human body,
220–222monitoring strategy, 221plant metrics of, 217, 219, 222–230weighting factors of, 230–231(See also Aggregate metrics; Monitor-
ing and trending; Performancegraphs; Performance rates)
Performance graph(s), 235–240, 261Performance rate(s), 219, 223, 234–236,
241, 247, 260–261actual, 234–235, 247, 261expected, 234–236, 241, 247,
260–261
Periodicity, 81, 83, 153, 156, 163–165,210, 212–213, 246, 248
and craft feedback, 196, 198–200, 203defined, 9–10 determining optimum for, 164–165for PdM tasks, 172for instruments, 182–191related to grace period, 230
Phases of RCM, 8, 29–31, 85, 131, 153 Piece parts, 79, 87, 93, 102, 162, 256
(See also Causes of failure)Plant (see Facility)Potential failure, of given component,
48Potentially critical components, 4, 8, 18,
27, 29, 37, 42–58, 62–69, 73–75,82–83, 100, 110–120, 133, 137–141,255–258
deeper look at, 65and failure-finding tasks, 160, 178and multiple failures, 48–49as second stage of RCM filter, 119and time, 48–49(See also Missing link; Potentially
Critical Guideline)Potentially Critical Guideline, 112–120,
139–140illustrated, 114 as part of RCM filter, 119(See also Potentially critical compo-
nents)Predictive maintenance (PdM), 30, 83,
155–159, 170types of, 172–175(See also Condition-directed task)
Preventive maintenance (PM), 1–13,46–47, 67–68, 107, 112, 250, 256
and aggregate metrics, 223–229compared to defensive strategy of
football team, 75and complacency, 241–246for instruments, 181–182integrated with corrective mainte-
nance, 57–59and living RCM program, 194,
203–214maintaining vigilance of, 261–262as means of translating plant design
objectives, 131monitoring of, 237–241and operator rounds, 70 as part of canon law for run-to-
failure, 53–57
290 Index
PM task selection logic tree for, 159,211, 258
and PM Task Worksheet, 100, 158three phases of, 30–32understanding PM task terminology
for, 154–157
Qualifying conditions, 109–111, 146,225, 256
(See also Asset reliability criteria)
RCM (see Reliability centered mainte-nance)
RCM concepts (see Concepts of RCM)RCM decision logic tree (see COFA
Logic Tree)RCM filter, 119–120RCM living program (see Living RCM
program)RCM pitfalls, 13–15, 18, 26Redundancy, 3, 8, 17, 34–37, 43, 50,
62–64, 70–73, 255misunderstanding of, 24–25(See also Standby functions)
Reliability, 3–5, 12–13, 27, 33, 65, 193,250–262
complacency about, 241–242maintaining performance of, 242–248measuring, 217–239optimum time to establish program
for, 165Reliability centered maintenance
(RCM), 1–14classical, 5–6, 28, 76, 79, 87, 175definition of, 8“made difficult,” 147–151not defined as PM reduction pro-
gram, 16, 23as plant culture, 249–251streamlined, 5–7, 141–143, 147–148as white elephant, 16
Run-to-failure, 1, 4, 8, 25–26, 37, 52–58,258
anomalies, 68–69canon law for, 54–55in component classifications, 73–74versus economic component, 102in equipment database, 210as misunderstood orphan of reliabil-
ity, 53, 56, 61as part of bigger picture, 59in RCM filter, 119–120(See also Canon law for run-to-failure)
SAE Standard, 14, 29, 80–81, 99,134–135, 147, 210
Safety criteria (see Asset reliability cri-teria)
Sampling strategy, 169–171Single failure, 3–4, 33–37, 50–55,
62–64, 75, 85, 117, 255Single point of contact (SPOC), 90, 108,
211, 251Sleeper cell, 7, 37, 43–48, 64, 141Standby components and functions,
3–4, 25, 34–40, 66–67, 70–73,86–87, 255
analyzing, 45
Testing hidden systems, 41–42, 45–47,62, 64–65, 85
Time-directed task, 155, 159–162, 258(See also Bathtub curve; Condition-
directed task; Failure-finding task) Timely manner, 38–39, 45, 53–58, 68
(See also Canon law for run-to-failure; Run-to-failure)
Types of facilities, 12, 272
Unnecessary burdens, 20, 28–29, 77
Work control organization, 30–31, 204
Index 291
ABOUT THE AUTHOR
Neil Bloom received his bachelor of science degree inmechanical engineering from the University of Miami,where he also minored in economics. He has worked in closeassociation for more than 30 years with the two leading-edge federal agencies most responsible for reliability andsafety, namely, the Federal Aviation Administration (FAA)and the Nuclear Regulatory Commission (NRC). His airlineand nuclear work in both engineering and maintenance hasafforded him unique background and knowledge as apractitioner of reliability centered maintenance (RCM). Heunderstands what can and cannot be done with classicalRCM. He knows what works and what doesn’t. Herecognizes the pitfalls and knows how to circumvent them.
Mr. Bloom has created totally new classical RCM conceptsand philosophies that go beyond the work of the pioneers ofRCM, namely, Stanley Nowlan and Howard Heap, in orderto make the entire process less daunting, morestraightforward, and simpler. He has been responsible fordeveloping and managing what is perhaps, even today, oneof the most comprehensive classical RCM programs everdeveloped. The program has analyzed more than 125,000components at one of the country’s largest nucleargenerating facilities.
Mr. Bloom has been a guest speaker on RCM at some ofthe most prestigious national and international conferences,including the Electric Power Research Institute (EPRI), theAmerican Society of Mechanical Engineers (ASME), theAmerican Nuclear Society (ANS), the Argonne NationalLaboratory (ANL), which is operated by the University ofChicago for the Department of Energy (DOE), the EdisonElectric Institute (EEI), and the International AtomicEnergy Agency (IAEA) in Vienna, Austria.
Mr. Bloom and his wife Bernadette reside in MonarchBeach, California. He can be reached via e-mail [email protected].
Copyright © 2006 by the McGraw-Hill Companies. Click here for terms of use.