Embed Size (px)
Citation preview

Journal of Physics Conference Series
OPEN ACCESS
Remote photoacoustic imaging for materialinspectionTo cite this article T Berer et al 2011 J Phys Conf Ser 278 012034
View the article online for updates and enhancements
You may also likeApparent directional spectral emissivitydetermination of semitransparent materialsChun-Yang Niu Hong Qi et al
-
Extending the flash method to measurethe thermal diffusivity of semitransparentsolidsAgustiacuten Salazar Arantza MendiorozEstibaliz Apintildeaniz et al
-
Laser plume evolution in the process ofnanopowder preparation using anytterbium fibre laserVV Osipov GS Evtushenko VVLisenkov et al
-
Recent citationsEdgar Scherleitner et al-
This content was downloaded from IP address 118391446 on 29112021 at 0449
Remote photoacoustic imaging for material
inspection
T Berer12 A Hochreiner1 B Reitinger12 H Grun2 and PBurgholzer12
1 Christian Doppler Laboratory of Photoacoustic Imaging and Laser Ultrasonics Hafenstrasse47-51 4020 Linz Austria2 Research Center for Non Destructive Testing GmbH (RECENDT) Hafenstrasse 47-51 4020Linz Austria
E-mail thomasbererrecendtat
Abstract We report on (to our knowledge) the first remote contactless photoacoustic imagingwith short excitation pulses on semitransparent solid polymer samples for material inspectionIn this work solid semitransparent samples are excited with pulses from a short pulse laser Thelocal absorption of the electromagnetic radiation leads to generation of broadband ultrasonicwaves Ultrasonic waves arriving on the sample surface are detected with a confocal Fabry-Perotinterferometer After data acquisition the absorbed energy density is reconstructed by utilizingan F-SAFT algorithm The work shows the potential of photoacoustic imaging on materialinspection of semitransparent solid materials
1 IntroductionIn photoacoustic imaging (PAI) - also termed optoacoustic or thermoacoustic imaging - a volumeof a semitransparent sample is illuminated with a short pulse of electromagnetic radiationeg a short laser pulse Depending on the spatially varying optical properties of the samplethe radiation is absorbed and scattered differently The local absorption in the sample leadsto local heating in sequence to thermal expansion and finally to the emission of broadbandultrasonic signals The goal of PAI is to reconstruct the absorbed energy density by measuringthe ultrasound signals outside the sample [1] Thus photoacoustic signals contain information oflight absorption at ultrasonic resolution The used pulses are so short that thermal conductivitycan be neglected during pulse time (rdquothermal confinementrdquo) The imaging modality is thereforedifferent as described in early publications about photoacoustics eg references [2 3] wherephotoacoustically generated thermal waves generated at relatively low frequencies interactwith features of a sample Although there is frequently confusion about that issue the termphotoacoustic instead of the alternatively used terms optoacoustic or thermoacoustic hasestablished in literature
Various publications about imaging with laser ultrasonic means exist and also publicationsof generation of ultrasound waves by laser ultrasonic techniques in (semi)transparent media egref [4] However up to now photoacoustic imaging with short laser pulses where the opticalabsorption at the excitation time is reconstructed in three dimensions was only applied tobiological or medical samples For these applications the sample is usually immersed in a tankfilled with water (or some other fluid) The fluid acts as coupling media between sample and
2nd International Symposium on Laser-Ultrasonics - Science Technology and Applications IOP PublishingJournal of Physics Conference Series 278 (2011) 012034 doi1010881742-65962781012034
Published under licence by IOP Publishing Ltd 1
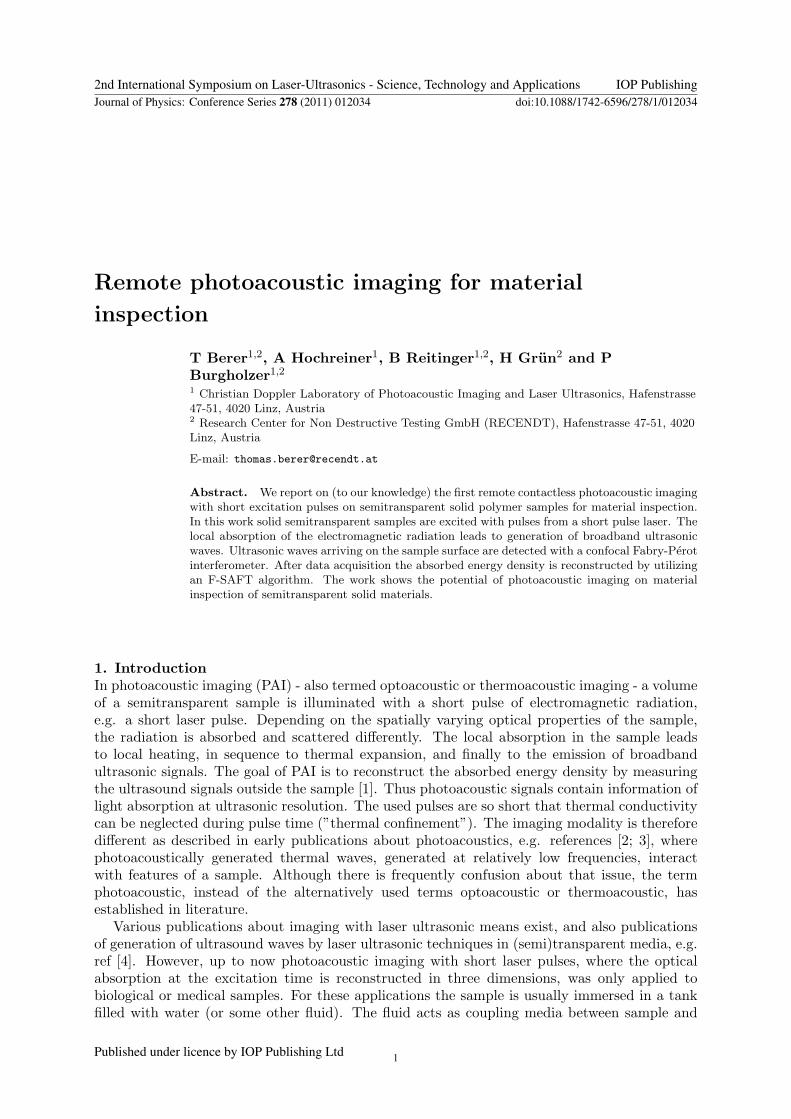
Figure 1 Schematic of the setup with the component labels given as follows M1 mirror L1to L6 lenses HW1 and HW2 half wave plates PBS polarizing beam splitter QW quarter waveplate CFP confocal Fabry-Perot cavity
detector Detection of the ultrasonic signals is usually done utilizing piezoelectric transducersbut also detection schemes using interferometric means exist[5ndash9] For material inspection egfor in-line process control a physical contact between sample and detector is a serious limitationTo take advantage of the remote generation of ultrasonic waves also the detection has to beaccomplished without physical contact to the sample In this work we excite ultrasonic waves insolid samples by short laser pulses For detection we utilize a confocal Fabry-Perot interferometer(CFPI) which measures the ultrasonic signals directly on the surface of the sample
2 Measurement SetupA schematic of the measurement setup is depicted in figure 1 A Q-switched NdYAG laseroperating at a wavelength of 1064 nm generated pulses with a pulse length of 20 ps and a beamdiameter of 9 mm The polarization of the pulses was adjusted to p-polarization with a halfwave plate HW1 Subsequently the beam was deflected by a mirror onto the sample Theangle between the surface normal of the sample and the incident beam was set to coincide withthe Brewstersrsquos angle Thus most of the incident radiation was transmitted into the sampleAbsorption of laser pulses inside the sample lead to broadband emission of acoustic wavesThese were detected and demodulated at the sample surface utilizing a confocal Fabry-Perotinterferometer The interferometer employed a 532 nm continuous wave laser with a power of1 W which was damped with an optical density filter to about 150 mW After passing through ahalf wave plate HW2 the (horizontal polarized) beam was focused onto the sample surface with alens L1 Light reflected from the sample surface was collected and collimated by a 2rdquo lens L2 andsubsequently reduced by a Keplarian telescope formed by the lenses L3 and L4 The beam thenpassed through a polarizing beam splitter PBS got circularly polarized by quarter wave plateQW and finally entered the confocal Fabry-Perot cavity The transmitted beam was focusedonto a photo diode the signal of which was used to stabilize the cavity Stabilization was doneusing a digital controller (based on an ARM processor) and an amplifier Back reflected lightfrom the CFPI experienced another λ4 rotation and was focused onto a fast photodiode afterreflection from the polarizing beam splitter The measured signal of the photodiode correspondsto the surface velocity of the sample To allow automatic measurements the sample was mountedonto a motorized xy-translational stage
2nd International Symposium on Laser-Ultrasonics - Science Technology and Applications IOP PublishingJournal of Physics Conference Series 278 (2011) 012034 doi1010881742-65962781012034
2
Figure 2 Photograph of the testedspecimen a) side view of the sample andb) view from the backside of the sampleThe sample consists of a base plate of asemitransparent polymer with a thickness of3 mm Onto the plate pieces of a black siliconglue are attached The back of the object isfilled with a transparent resin
Figure 3 Trace measured above a blackabsorbing silicon clue The first pulseoriginates from the glue
3 MeasurementsA sample was made from a 50times 50times 3 mm3 white semitransparent polymer board (figure 2a)The polymer is commonly used in automotive industries The transmission of the 3 mm thickpolymer sheet in the visible to the near infrared region was measured to be below 5 On theback of the polymer plane objects made of a black silicon glue also commonly used in automo-tive industries were placed (see figure 2b) To allow ultrasonic waves to propagate properly theback of the plane was filled with a transparent resin
Ultrasonic waves within the sample were excited with pulses from the generation laser with apulse energy of 50 mJ at a repetition rate of 10 Hz The acquired ultrasonic signals were averaged24 times A typical trace measured directly above a piece of black glue is depicted in figure 3The first pulse at a time of 15micros is the first arriving longitudinal wave A second pulse arrivingat about 36 micros is attributed to transversal waves The signal of the longitudinal wave which isback reflected at the polymerresin interface can be identified at 45 micros
For three dimensional imaging a sample area of 16times16 mm2 was measured by moving thesample in two directions with the translational stage The step size was set to 400 microm for bothscan directions A maximum intensity plot of the measured signals is depicted in figure 4bTo construct the ultrasonic signals at the time of excitation an F-SAFT algorithm [10] wasapplied on the data After reconstruction the absorbing structures appear at a depth of 3mmcorresponding to the thickness of the polymer board Due to the F-SAFT algorithm artifactsfrom the wave propagation which lead to blurring of the image are removed A maximumintensity plot of the reconstruction is depicted in figure 4c For the picture no image enhancementlike application of a threshold filtering of the data or contrast adjustment was applied As canbe seen the F-SAFT reconstruction does not only remove artifacts which arise from the differentarrival times of the waves but also increases the signal to noise ratio [11] For comparison aphotograph of the measured area is depicted in figure 4a To allow a better comparison betweenphotograph measured data and reconstructed data figure 4a is displayed mirrored at the y-axisAll absorbing objects are well resolved Also small details like the asymmetry in the objectsmouth are well reproduced
2nd International Symposium on Laser-Ultrasonics - Science Technology and Applications IOP PublishingJournal of Physics Conference Series 278 (2011) 012034 doi1010881742-65962781012034
3
Figure 4 a) Photograph of the measured object b) Maximum intensity plot of the acquiredsignals The scan size was 16mmtimes16 mm with 41 points on each axis leading to a step sizeof 400microm c) Maximum intensity plot of the F-SAFT reconstruction Note that no thresholdfiltering of the data or contrast enhancement was applied
4 ConclusionWe have reported on photoacoustic measurements on solid semitransparent polymer samplesUltrasonic waves within the specimen were excited with pulses from a picosecond pulse laserThe ultrasonic waves arriving the surface of the sample were detected and demodulated utilizinga confocal Fabry-Perot interferometer After acquisition the ultrasonic signals at the time ofexcitation were reconstructed using an F-SAFT algorithm All features of the measured objectare clearly visible This work shows that photoacoustic imaging may not only be valuable formedical or biological samples but has also great potential for inspecting semitransparent solidsamples
AcknowledgmentsThis work has been supported by the Christian Doppler Research Association by theFederal Ministry of Economy Family and Youth by the industrial partner INPROInnovationsgesellschaft fur fortgeschrittene Produktionssysteme in der Fahrzeugindustrie mbHby the Austrian Science Fund (FWF) project number S10503-N20 by the European RegionalDevelopment Fund (EFRE) in the framework of the EU-program Regio 13 and the federal stateUpper Austria
References[1] Xu N and Wang L V 2006 Rev Sci Instrum 77 041101[2] Rosencwaig A and Busse G 1980 Appl Phys Lett 36 725ndash727[3] Wong Y H Thomas R L and Pouch J J 1979 Appl Phys Lett 35 368ndash369[4] Matsuda O Tachizaki T Fukui T Baumberg J J and Wright O B 2005 Phys Rev B 71
115330[5] Paltauf G Nuster R Haltmeier M and Burgholzer P 2007 Appl Optics 46 3352ndash3358[6] Grun H Berer T Nuster R Paltauf G and Burgholzer P 2010 J Biomed Opt 15 021306[7] Zhang E Laufer J and Beard P 2008 Appl Opt 47 561ndash577[8] Payne B P Venugopalan V Mikic B B and Nishioka N S 2003 J Biomed Opt 8 273ndash280[9] Carp S A and Venugopalan V 2007 J Biomed Opt 12 12 064001
[10] Busse L J 1992 IEEE Trans Ultrason Ferroelectr Freq Control 39 174ndash179[11] Blouin A Levesque D Neron C Drolet D and Monchalin J P 1998 opt Express 2 531ndash539
2nd International Symposium on Laser-Ultrasonics - Science Technology and Applications IOP PublishingJournal of Physics Conference Series 278 (2011) 012034 doi1010881742-65962781012034
4
Remote photoacoustic imaging for material
inspection
T Berer12 A Hochreiner1 B Reitinger12 H Grun2 and PBurgholzer12
1 Christian Doppler Laboratory of Photoacoustic Imaging and Laser Ultrasonics Hafenstrasse47-51 4020 Linz Austria2 Research Center for Non Destructive Testing GmbH (RECENDT) Hafenstrasse 47-51 4020Linz Austria
E-mail thomasbererrecendtat
Abstract We report on (to our knowledge) the first remote contactless photoacoustic imagingwith short excitation pulses on semitransparent solid polymer samples for material inspectionIn this work solid semitransparent samples are excited with pulses from a short pulse laser Thelocal absorption of the electromagnetic radiation leads to generation of broadband ultrasonicwaves Ultrasonic waves arriving on the sample surface are detected with a confocal Fabry-Perotinterferometer After data acquisition the absorbed energy density is reconstructed by utilizingan F-SAFT algorithm The work shows the potential of photoacoustic imaging on materialinspection of semitransparent solid materials
1 IntroductionIn photoacoustic imaging (PAI) - also termed optoacoustic or thermoacoustic imaging - a volumeof a semitransparent sample is illuminated with a short pulse of electromagnetic radiationeg a short laser pulse Depending on the spatially varying optical properties of the samplethe radiation is absorbed and scattered differently The local absorption in the sample leadsto local heating in sequence to thermal expansion and finally to the emission of broadbandultrasonic signals The goal of PAI is to reconstruct the absorbed energy density by measuringthe ultrasound signals outside the sample [1] Thus photoacoustic signals contain information oflight absorption at ultrasonic resolution The used pulses are so short that thermal conductivitycan be neglected during pulse time (rdquothermal confinementrdquo) The imaging modality is thereforedifferent as described in early publications about photoacoustics eg references [2 3] wherephotoacoustically generated thermal waves generated at relatively low frequencies interactwith features of a sample Although there is frequently confusion about that issue the termphotoacoustic instead of the alternatively used terms optoacoustic or thermoacoustic hasestablished in literature
Various publications about imaging with laser ultrasonic means exist and also publicationsof generation of ultrasound waves by laser ultrasonic techniques in (semi)transparent media egref [4] However up to now photoacoustic imaging with short laser pulses where the opticalabsorption at the excitation time is reconstructed in three dimensions was only applied tobiological or medical samples For these applications the sample is usually immersed in a tankfilled with water (or some other fluid) The fluid acts as coupling media between sample and
2nd International Symposium on Laser-Ultrasonics - Science Technology and Applications IOP PublishingJournal of Physics Conference Series 278 (2011) 012034 doi1010881742-65962781012034
Published under licence by IOP Publishing Ltd 1
Figure 1 Schematic of the setup with the component labels given as follows M1 mirror L1to L6 lenses HW1 and HW2 half wave plates PBS polarizing beam splitter QW quarter waveplate CFP confocal Fabry-Perot cavity
detector Detection of the ultrasonic signals is usually done utilizing piezoelectric transducersbut also detection schemes using interferometric means exist[5ndash9] For material inspection egfor in-line process control a physical contact between sample and detector is a serious limitationTo take advantage of the remote generation of ultrasonic waves also the detection has to beaccomplished without physical contact to the sample In this work we excite ultrasonic waves insolid samples by short laser pulses For detection we utilize a confocal Fabry-Perot interferometer(CFPI) which measures the ultrasonic signals directly on the surface of the sample
2 Measurement SetupA schematic of the measurement setup is depicted in figure 1 A Q-switched NdYAG laseroperating at a wavelength of 1064 nm generated pulses with a pulse length of 20 ps and a beamdiameter of 9 mm The polarization of the pulses was adjusted to p-polarization with a halfwave plate HW1 Subsequently the beam was deflected by a mirror onto the sample Theangle between the surface normal of the sample and the incident beam was set to coincide withthe Brewstersrsquos angle Thus most of the incident radiation was transmitted into the sampleAbsorption of laser pulses inside the sample lead to broadband emission of acoustic wavesThese were detected and demodulated at the sample surface utilizing a confocal Fabry-Perotinterferometer The interferometer employed a 532 nm continuous wave laser with a power of1 W which was damped with an optical density filter to about 150 mW After passing through ahalf wave plate HW2 the (horizontal polarized) beam was focused onto the sample surface with alens L1 Light reflected from the sample surface was collected and collimated by a 2rdquo lens L2 andsubsequently reduced by a Keplarian telescope formed by the lenses L3 and L4 The beam thenpassed through a polarizing beam splitter PBS got circularly polarized by quarter wave plateQW and finally entered the confocal Fabry-Perot cavity The transmitted beam was focusedonto a photo diode the signal of which was used to stabilize the cavity Stabilization was doneusing a digital controller (based on an ARM processor) and an amplifier Back reflected lightfrom the CFPI experienced another λ4 rotation and was focused onto a fast photodiode afterreflection from the polarizing beam splitter The measured signal of the photodiode correspondsto the surface velocity of the sample To allow automatic measurements the sample was mountedonto a motorized xy-translational stage
2nd International Symposium on Laser-Ultrasonics - Science Technology and Applications IOP PublishingJournal of Physics Conference Series 278 (2011) 012034 doi1010881742-65962781012034
2
Figure 2 Photograph of the testedspecimen a) side view of the sample andb) view from the backside of the sampleThe sample consists of a base plate of asemitransparent polymer with a thickness of3 mm Onto the plate pieces of a black siliconglue are attached The back of the object isfilled with a transparent resin
Figure 3 Trace measured above a blackabsorbing silicon clue The first pulseoriginates from the glue
3 MeasurementsA sample was made from a 50times 50times 3 mm3 white semitransparent polymer board (figure 2a)The polymer is commonly used in automotive industries The transmission of the 3 mm thickpolymer sheet in the visible to the near infrared region was measured to be below 5 On theback of the polymer plane objects made of a black silicon glue also commonly used in automo-tive industries were placed (see figure 2b) To allow ultrasonic waves to propagate properly theback of the plane was filled with a transparent resin
Ultrasonic waves within the sample were excited with pulses from the generation laser with apulse energy of 50 mJ at a repetition rate of 10 Hz The acquired ultrasonic signals were averaged24 times A typical trace measured directly above a piece of black glue is depicted in figure 3The first pulse at a time of 15micros is the first arriving longitudinal wave A second pulse arrivingat about 36 micros is attributed to transversal waves The signal of the longitudinal wave which isback reflected at the polymerresin interface can be identified at 45 micros
For three dimensional imaging a sample area of 16times16 mm2 was measured by moving thesample in two directions with the translational stage The step size was set to 400 microm for bothscan directions A maximum intensity plot of the measured signals is depicted in figure 4bTo construct the ultrasonic signals at the time of excitation an F-SAFT algorithm [10] wasapplied on the data After reconstruction the absorbing structures appear at a depth of 3mmcorresponding to the thickness of the polymer board Due to the F-SAFT algorithm artifactsfrom the wave propagation which lead to blurring of the image are removed A maximumintensity plot of the reconstruction is depicted in figure 4c For the picture no image enhancementlike application of a threshold filtering of the data or contrast adjustment was applied As canbe seen the F-SAFT reconstruction does not only remove artifacts which arise from the differentarrival times of the waves but also increases the signal to noise ratio [11] For comparison aphotograph of the measured area is depicted in figure 4a To allow a better comparison betweenphotograph measured data and reconstructed data figure 4a is displayed mirrored at the y-axisAll absorbing objects are well resolved Also small details like the asymmetry in the objectsmouth are well reproduced
2nd International Symposium on Laser-Ultrasonics - Science Technology and Applications IOP PublishingJournal of Physics Conference Series 278 (2011) 012034 doi1010881742-65962781012034
3
Figure 4 a) Photograph of the measured object b) Maximum intensity plot of the acquiredsignals The scan size was 16mmtimes16 mm with 41 points on each axis leading to a step sizeof 400microm c) Maximum intensity plot of the F-SAFT reconstruction Note that no thresholdfiltering of the data or contrast enhancement was applied
4 ConclusionWe have reported on photoacoustic measurements on solid semitransparent polymer samplesUltrasonic waves within the specimen were excited with pulses from a picosecond pulse laserThe ultrasonic waves arriving the surface of the sample were detected and demodulated utilizinga confocal Fabry-Perot interferometer After acquisition the ultrasonic signals at the time ofexcitation were reconstructed using an F-SAFT algorithm All features of the measured objectare clearly visible This work shows that photoacoustic imaging may not only be valuable formedical or biological samples but has also great potential for inspecting semitransparent solidsamples
AcknowledgmentsThis work has been supported by the Christian Doppler Research Association by theFederal Ministry of Economy Family and Youth by the industrial partner INPROInnovationsgesellschaft fur fortgeschrittene Produktionssysteme in der Fahrzeugindustrie mbHby the Austrian Science Fund (FWF) project number S10503-N20 by the European RegionalDevelopment Fund (EFRE) in the framework of the EU-program Regio 13 and the federal stateUpper Austria
References[1] Xu N and Wang L V 2006 Rev Sci Instrum 77 041101[2] Rosencwaig A and Busse G 1980 Appl Phys Lett 36 725ndash727[3] Wong Y H Thomas R L and Pouch J J 1979 Appl Phys Lett 35 368ndash369[4] Matsuda O Tachizaki T Fukui T Baumberg J J and Wright O B 2005 Phys Rev B 71
115330[5] Paltauf G Nuster R Haltmeier M and Burgholzer P 2007 Appl Optics 46 3352ndash3358[6] Grun H Berer T Nuster R Paltauf G and Burgholzer P 2010 J Biomed Opt 15 021306[7] Zhang E Laufer J and Beard P 2008 Appl Opt 47 561ndash577[8] Payne B P Venugopalan V Mikic B B and Nishioka N S 2003 J Biomed Opt 8 273ndash280[9] Carp S A and Venugopalan V 2007 J Biomed Opt 12 12 064001
[10] Busse L J 1992 IEEE Trans Ultrason Ferroelectr Freq Control 39 174ndash179[11] Blouin A Levesque D Neron C Drolet D and Monchalin J P 1998 opt Express 2 531ndash539
2nd International Symposium on Laser-Ultrasonics - Science Technology and Applications IOP PublishingJournal of Physics Conference Series 278 (2011) 012034 doi1010881742-65962781012034
4
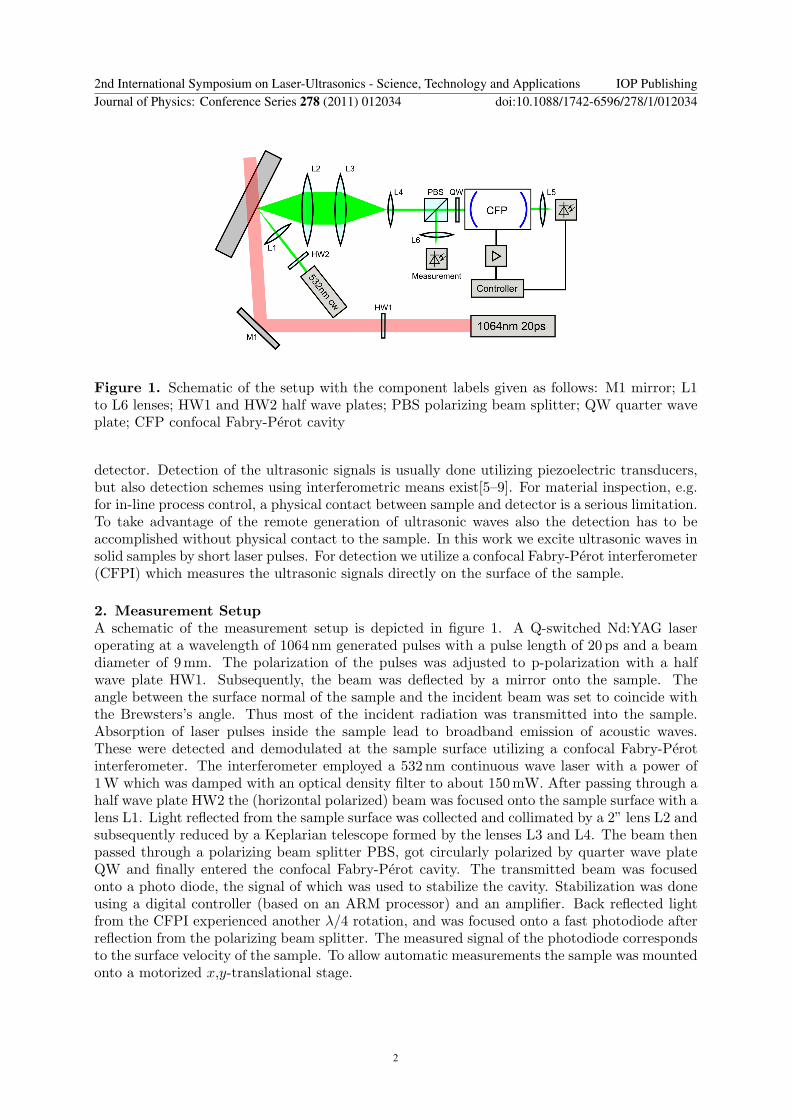
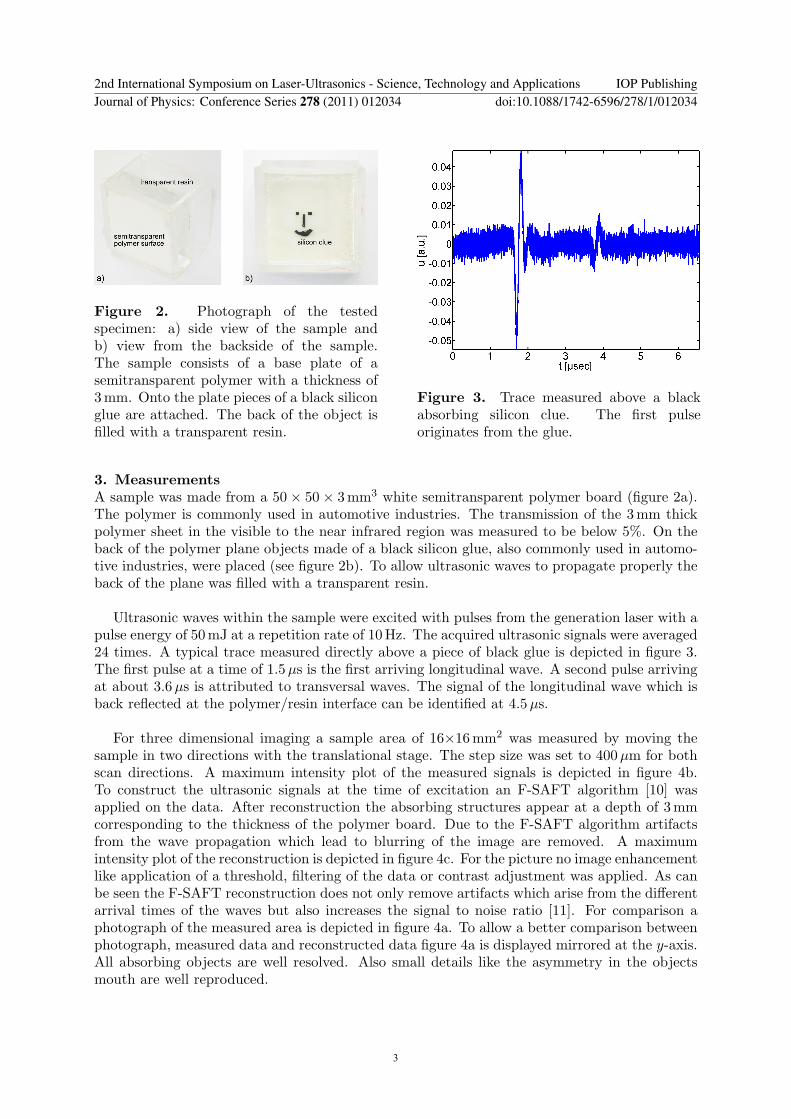
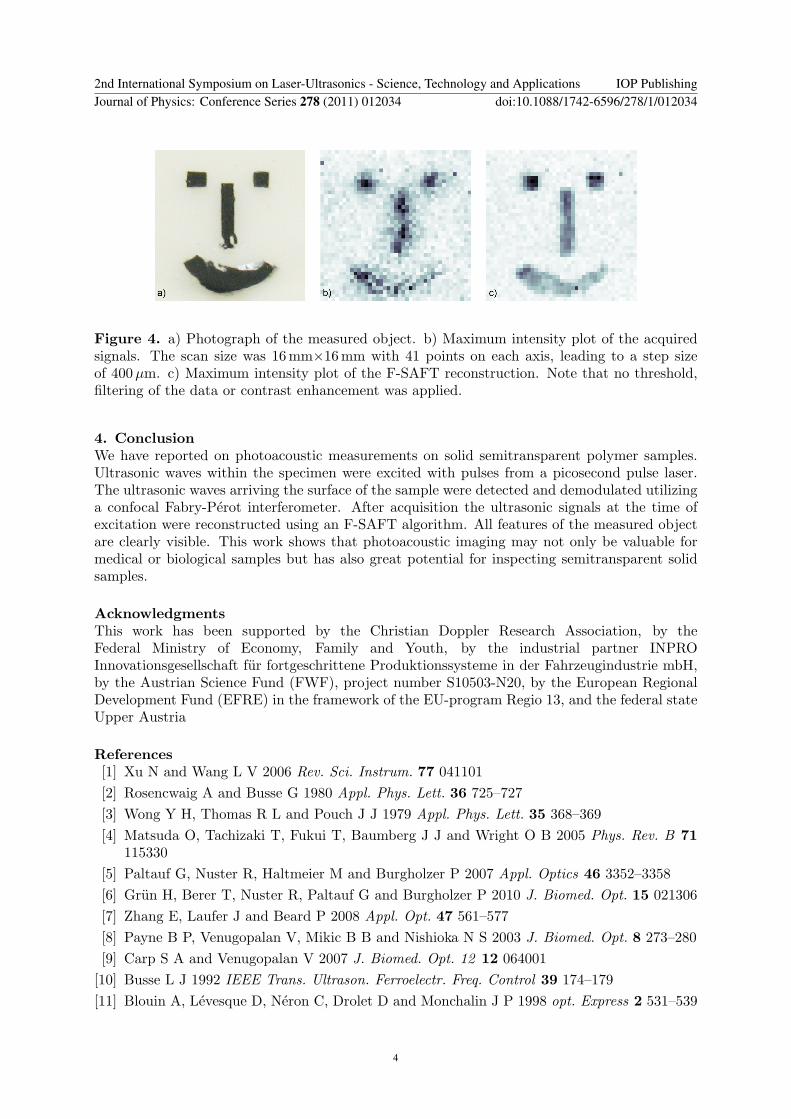