Embed Size (px)
Citation preview
Scholars' Mine Scholars' Mine
Masters Theses Student Theses and Dissertations
Spring 2008
Removal of heavy metals from electroplating wastewater using Removal of heavy metals from electroplating wastewater using
rice husk and coconut coir rice husk and coconut coir
Frency Mathew
Follow this and additional works at: https://scholarsmine.mst.edu/masters_theses
Part of the Chemical Engineering Commons
Department: Department:
Recommended Citation Recommended Citation Mathew, Frency, "Removal of heavy metals from electroplating wastewater using rice husk and coconut coir" (2008). Masters Theses. 5019. https://scholarsmine.mst.edu/masters_theses/5019
This thesis is brought to you by Scholars' Mine, a service of the Missouri S&T Library and Learning Resources. This work is protected by U. S. Copyright Law. Unauthorized use including reproduction for redistribution requires the permission of the copyright holder. For more information, please contact [email protected].
REMOVAL OF HEAVY METALS FROM ELECTROPLATING WASTEWATER
USING
RICE HUSK AND COCONUT COIR
by
FRENCY MATHEW
A THESIS
Presented to the Faculty of the Graduate School of the
MISSOURI UNIVERSITY OF SCIENCE AND TECHNOLOGY
In Partial Fulfillment of the Requirements for the Degree
MASTER OF SCIENCE IN CHEMICAL ENGINEERING
2008
Approved by
Craig D. Adams, Co - Advisor
l11
ABSTRACT
Heavy metal toxicity due to industrial wastewater has been a threat to the
environment for the past many decades, especially in the developing countries such as
India, China and Thailand where cost effectiveness of the removal process is a major
factor.
In this research, the effectiveness of two natural adsorbents, rice husk (RH) and
coconut coir (CC), which are cheaply available in these countries for the removal of
heavy metals from electroplating wastewaters were studied. Batch adsorption and
desorption studies were conducted on these adsorbents with Cr (VI), Cr (III), Cd (II), Cu
(II) and Ni (II). The effectiveness ofthe adsorbents were studied in the pH range from 2-
12. The adsorption mechanisms were also studied.
RH showed a maximum removal efficiency of99.5% for Ni (II), 80.0 °AJ for Cd
(II), 72.8% for Cr (VI), 56.2% for Cr (III) and 40.0% for Cu (II). CC showed 99.5%
for Ni (II), 92.8% for Cr (VI), 50.7% for Cr (III), 40.5% for Cd (II) and 40.4 <Yo for Cu
(II). Comparing the two adsorbents, CC was found to be more efficient for metal ion
removal than RH. Desorption studies showed that when Cr (Ill), Cd (II) and Cu (II) are
the adsorbates, the RH and CC can be regenerated and reused. For the other metals only
partial regeneration for RH and CC was possible.

IV
ACKNOWLEDGEMENTS
I would like to express my deep and sincere gratitude to my advisor, Dr. Douglas
K. Ludlow and co-advisor, Dr. Craig Adams for their patience, time, cooperation and
kind help without which this project would have been very difficult to complete. I would
also like to thank Dr. Kimberly Henthorn for being on my committee. I am very thankful
to Honglan Shi for all the help she has given me in the Environmental Research Center
(ERC) lab. I also thank all my lab buddies at ERC for being nice and friendly.
My deepest gratitude goes to my father, mother and brother for their unflagging
love, prayers and support. I will never forget the courage and strength I received from my
best friends, Ajay, Jincy and Merene, when things were not going on so well.
Finally, and most importantly I would like to thank God, for it is under his grace
that we learn, live and flourish.
v
TABLE OF CONTENTS
Page
ABSTRACT ......................................................................................... .iii
ACKNOWLEDGEMENTS ........................................................................ iv
LIST OF ILLUSTRATIONS ....................................................................... ix
LIST OF TABLES ................................................................................... xi
SECTION
1. LITERATURE REVIEW ............................................................... 1
1.1. INTRODUCTION ............................................................ 1
1.2. ELECTROPLATING PROCESS ........................................... 1
1.2.1. Cleaning ............................................................. 2
1.2.2. Plating ............................................................... 2
1.2.3. Rinsing ............................................................... 3
1.2.4. Drying ............................................................... 3
1.3. WASTEWATER FROM ELECTROPLATING INDUSTRY ......... .4
1.3.1. Characteristics of Electroplating Wastewater. ................. .4
1.3.2. Environmental and Health Problems ............................. 5
1.3.3. Effluent Standards .................................................. 6
1.4. HEAVY METAL TOXICITY ............................................... 8
1.4.1. Chromium ........................................................... 9
1.4.2. Cadmium ........................................................... 1 0
1.4.3. Copper .............................................................. 11
VI
1.4.4. Nickel ............................................................... 11
1.5. VARIOUS METHODS FOR TREATING ELECTROPLATING WASTEWATER ............................................................. 12
1.5.1. Chemical Precipitation ........................................... 12
1.5.2. Coagulation/ Flocculation ....................................... 13
1.5.3. Ion Exchange Method ............................................ 13
1.5.4. Electrolytic Deposition Method ................................. 14
1.5.5. Evaporation ........................................................ 14
1.5.6. Biosorption ......................................................... 14
1.5.7. Activated Carbon Adsorption ................................... 15
1.6. ADSORPTION .............................................................. 15
1.7. ADSORBENTS .............................................................. 16
1.7.1. Rice Husk .......................................................... 17
1.7.2. Coconut Coir. ...................................................... 17
2. EXPERIMENTAL MATERIALS AND METHODS ................................ 19
2.1. ADSORBENT PREPARATION .......................................... 19
2.1.1. Rice Husk .......................................................... 19
2.1.2. Coconut Coir. ...................................................... 20
2.2. ADSORBENT CHARACTERIZATION ................................. 21
2.3. REAGENTS .................................................................. 21
2.3.1. Preparation of Stock Solutions ................................... 22
2.3.2. Preparation of Standard Solutions for Calibration Curves .. 22
2.4. ANALYSIS OF METAL IONS ........................................... 22
2.5. BATCH ADSORPTION STUDIES ....................................... 23
VII
2.6. KINETIC STUDIES ......................................................... 26
2.7. DESORPTION STUDIES .................................................. 26
3. RESULTS AND DISCUSSION ...................................................... 28
3.1. CHARACTERIZATION OF ADSORBENTS ........................... 28
3.2. pH DRIFT METHOD- DETERMINATION OF ZERO POINT OF CHARGE OF ADSORBENTS ........................................ 29
3.3 BATCH ADSORPTION STUDIES- EFFECT OF pH ................. 32
3.3.1. Blank Samples ..................................................... 32
3.3.2. Cr (VI) Adsorption Studies ...................................... 33
3.3.3. Cr (III) Adsorption Studies ...................................... 36
3.3.4. Cd (II) Adsorption Studies ....................................... 38
3.3.5. Cu (II) Adsorption Studies ...................................... .41
3.3.6. Ni (II) Adsorption Studies ...................................... .44
3.4. COMPARISON OF ADSORBENTS .................................... .46
3.5. KINETIC STUDIES ........................................................ .48
3.6. DESORPTION STUDIES .................................................. 52
4. CONCLUSIONS ........................................................................ 54
5. RECOMMENDATIONS ............................................................... 55
APPENDICES
A. BATCH ADSORPTION DATA - RUN 1 ......................................... 56
B. BATCH ADSORPTION DATA- RUN 2 ......................................... 67
C. DESORPTION STUDIES DATA ................................................... 78

VIII
D. KINETIC STUDY DATA ............................................................ 81
BIBLIOGRAPHY ................................................................................... 83
VITA .................................................................................................. 89
IX
LIST OF ILLUSTRATIONS
Figure Page
3.1. Initial pH versus final equilibrium pH for Cr (VI) ion for RH- pH drift method for detem1ining the zero point of charge (pHzrc) ................................................ 31
3.2. Initial pH versus final equilibrium pH for Cr (VI) ion for CC- pH drift method for detem1ining the zero point of charge (pHzrc) ............................................... 31
3.3. Removal efficiency of Cr (VI) ions by RH and CC versus the final equilibrium pH ................................................................................................ 34
3.4. Speciation diagram of Cr (VI) ................................................................ 35
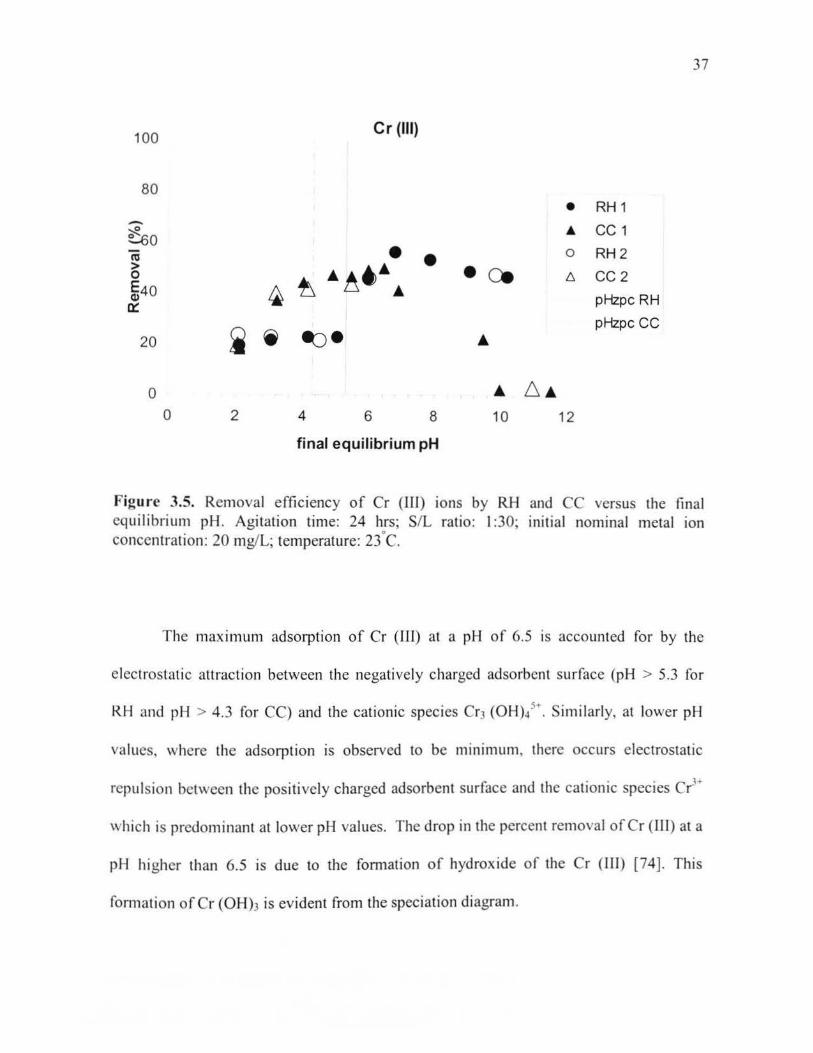
3.5. Removal efficiency ofCr (III) ions by RH and CC versus the final equilibrium pH .................................................................................................. 37
3 .6. Speciation diagram of Cr (III) ................................................................ 38
3. 7. Removal efficiency of Cd (II) ions by RH and CC versus the final equilibrium pH ................................................................................................ 39
3.8. Speciation diagram ofCd (II) ............................................................... .40
3.9. Removal efficiency ofCu (II) ions by RH and CC versus the final equilibrium pH ................................................................................................. 42
3.1 0. Speciation diagram ofCu (II) .............................................................. .43
3.11. Removal efficiency ofNi (II) ions by RH and CC versus the final equilibrium pH ............................................................................................... 44
3.12. Speciation diagram ofNi (II) .............................................................. .45
3.13. Removal efficiency of different metal ions versus final equilibrium pH on RH .... .47
3.14. Removal efficiency of different metal ions versus final equilibrium pH on CC. .... .47
3.15. Change in pH (Initial - Equilibrium) versus initial pH for each metal ion solution adsorbed on RH ............................................................................... 49
3.16. Change in pH (Initial - Equilibrium) versus initial pH for each metal ion solution adsorbed on CC ............................................................................... 50

X
3.17. Change in pH with time for RH for different metal ions ................................ 51
3.18. Change in pH with time for CC for different metal ions ................................ 51
3.19. Desorption efficiencies ofCr (VI), Cr (III), Cd (II), Cu (II) and Ni (II) for RH and CC initially adsorbed at pH 2 and desorbed at pH 2 ..................................... 52
XI
LIST OF TABLES
Table Page
1.1. Indian Standards for Maximum Permissible Limits for Industrial Effluent Discharges (in mg/L) [5] ........................................................................ 7
1.2. United States Environmental Protection Agency Electroplating Effluent Standards ... 8
2.1. Characteristics of Rice Husk ..................................................................... 20
2.2. Batch Adsorption Experiments ............................................................... 24
3.1. Porous Characteristics ofRH and CC ........................................................ 28
3.2. pH1 pc Values for RH and CC Calculated from pH Drift Method ....................... 30
3.3. Change in Final pH of Metal Ion Solution for the Batch Adsorption Studies ......... .48
1. LITERATURE REVIEW
1.1. INTRODUCTION
Electroplating or the metal finishing industry plays an important role in the
development of many metal manufacturing and other engineering industries in the world.
While the electroplating operations have become an integral part of the engineering
industries there has been a steady growth of independent and small to medium scale
electroplating industries, mainly in the developing countries of South East Asia like
India, Thai land and China.
In India, there are over 50,000 large, medium and small electroplating units
scattered in urban areas. The electroplating industry is mainly represented by small scale
units having distinct features such as tiny, family owned units; practicing old and
obsolete technologies having unskilled or semiskilled workers; located in unplanned and
unauthorized areas with lack of industrial infrastructure facilities; and working in small
shop areas [ 1 ] .
1.2. ELECTROPLATING PROCESS
Electroplating is the process of depositing a coating having a desirable form by
means of electrolysis i.e. by the use of electricity. Its purpose is generally to alter the
characteristics of a surface so as to provide improved appearance, ability to withstand
corrosive agents, resistance to abrasion, or other desired properties or a combination of
them, although occasionally it is used simply to alter dimensions. The process involves
the dissolving of metal at the anode and depositing at the cathode by passing electricity
2
through the electrolytic bath. Some metals which are commonly used for electroplating
are copper, chromium, nickel, lead, cadmium, tin, zinc, brass or combinations of them.
Platers immerse objects into a series of chemical baths in order to change their surface
conditions. The numbers of tanks and their chemical makeup differs based on the desired
result and every plating plant is different and thus is the constituents of the wastewaters.
The electroplating process involves mainly four steps: cleaning, plating, rinsing and
drying.
1.2.1. Cleaning. The metal to be plated should be pretreated before it can be
plated. The pretreatment includes degreasing and pickling which are done to remove the
grease, oil, rust or scale which will be present on the surface of the metal surface. Grease
on the metal surface comes from the machining, polishing and the preservation steps of
the metal. Degreasing is the process that removes oil, grease and solid dust particles from
metal surfaces. Even though there are greases of different nature such as organic,
petroleum or mineral oil grease, and each of them needs to be degreased with different
chemicals, the most commonly employed method is emulsification with metals cleaners.
Metal cleaners are solutions which contain mixtures of sodium carbonate, caustic soda,
trisodium phosphate, sodium silicate, sodium cyanide and borax.
Treatment of metallic surfaces in order to remove impurities, stains, rust or scale
with an acidic solution is called pickling. The two acids commonly used as pickling
liquor are hydrochloric acid and sulphuric acid.
1.2.2. Plating. Once the metal is cleaned, it is ready to be plated with the desired
metal. Wooden or steel vats are used according to the nature of the plating bath. Plating
operations are always wet. The pickled metals are placed in these vats containing the
3
metal which is to be plated onto the base metal. The electroplating bath contains metal
salts, alkalis and other bath control compounds in addition to plating metals like copper
and nickel. The base metal is plated with the respective metals by the process of
electrodeposition where the material to be plated acts as the cathode is dipped in the
electroplating bath which is the anode. In electroplating, metal ions supplied by the
dissolution of metals from anodes or other pieces are reduced on the work pieces
(cathodes) while in either acid, alkaline, or neutral solutions. The electroplating bath
contains metal salts, alkalis and other bath control compounds in addition to plating
metals like copper and nickel [2].
1.2.3. Rinsing. After the plating process, the plated metal is rinsed with water to
make sure that the plated surface will be free of any spots from the plating. This rinsing
may be done a couple of times. The surface is first dipped in a stationary cold bath and
then rinsed in a running water bath where it can be either a cold wash or a hot wash. In
the last rinse, commonly, deionized water is used.
1.2.4. Drying. After plating and rinsing the plated metal needs to be dried. There
are various methods employed for drying in electroplating industry such as placing the
metal in a heated oven or hanging the piece in a blast of hot air or high pressure
compressed air jet. Another method for drying small plated articles is to place them in a
centrifuge basket to throw the water off by centrifugal force. Hot sawdust is also
sometimes used where the sawdust absorbs moisture and also gives a slight degree of
polish to the plated metal and also removes any leftover stains [3].
4
1.3. WASTEWATER FROM ELECTROPLATING INDUSTRY
The electroplating industry consumes and discharges large volumes of
wastewater. This effluent is very hazardous, containing heavy metals such as nickel,
chromium, copper, zinc, lead and silver as well as cyanides, hydrogen sulfides, ammonia,
oil and grease and suspended solids. The characteristics of electroplating wastewater
differ from plant to plant depending on the type of plating and the method employed for
their treatment.
1.3.1. Characteristics of Electroplating Wastewater. After few days or weeks,
plating contents and acids used in the pretreatment and other steps get contaminated and
need to be disposed for maintaining the quality of plating. Most of the wastewater from
the electroplating plant comes from the rinse waters and the batch solutions used for
plating. The batch solutions have a high concentration of contaminants whereas the rinse
waters are comparatively dilute. In small shops, there is typically one central swill for
rinsing the articles from different stages in the process and they get contaminated quickly.
These discharges will be very dilute. The wastewater from the pretreatment step mainly
contains the cleaning solution and all the spent alkaline solutions containing suspended
solids. soaps, grease and oil. These spent alkaline solutions are held in steel vats for
controlled discharge. They have a pH of around 12 and before discharge they are mixed
with acid water to lower the pH.
Wastewater from pickling includes acidic rinse water, metallic salts and waste
acid. It usually has a pH below 2.5. The rinse water from the pickling stage is acidic and
it is stored in tanks for controlled discharge. It is more frequently discharged compared to
the other wastes. Metal wastes from plating baths include rinse waters from copper, zinc,
5
nickel, cadmium and lead vats. All these baths are seldom used together. These metals
are present in the wastewater in ionic form and are extremely toxic. The composite
plating waste may be acidic or alkaline depending on the type of baths that are used. The
effluent concentrations depend on various factors such as surface area, shape of the
article, thickness of the solution and drain time.
1.3.2 Environmental and Health Problems. Accumulation of heavy metals in
the food chain and their accumulation in nature is a common phenomenon. There are
copious amounts of water being discharged from these electroplating units without any
pretreatment before entering the water bodies. These wastewaters mainly contain heavy
and transition metals, cyanides, oil and grease and suspended solids at levels that are
hazardous to the environment and human health. They contain organic matter which
depletes the oxygen content from the water bodies and they also have inorganic matter
that make the water body unfit for further use and encourage undesirable growth of plants
in the water bodies. The acids and alkalis in the electroplating industrial discharge make
the receiving stream unsuitable for the growth of fish and other aquatic life. The heavy
metallic ions such as chromium, nickel, zinc, lead, silver, cadmium, copper, mercury and
other toxic substances like cyanide, sulphide, ammonia, chloramines, cause damage to
the flora and fauna. Oil and grease and other floating substances render the streams
unsightly and interfere with their self purification [ 4). Electroplating wastewater is
variable in character and alkaline in nature. In India, in places with scarcity of water,
people go to the rivers for bathing and washing. These wastewaters give off a very bad
smell which makes it very difficult for people who live near these polluted waterbodies.
The color of wastewater imparts visual pollution and persists for long distances in river
6
streams and decreases the recreational capacity of the stream. It also causes disturbed
penetration of sun rays which in tum can retard photosynthesis activity [ 1].
1.3.3. Effluent Standards. Until the 1950's, the electroplating industrial wastes
were discharged into the drains without any prior treatment. When the awareness came
about the high toxicity and corrosiveness of plating wastes streams, the authorities took
action to make sure that the plating facilities pretreated their wastewater prior to
discharge and they released national standards for the acceptable limits for the various
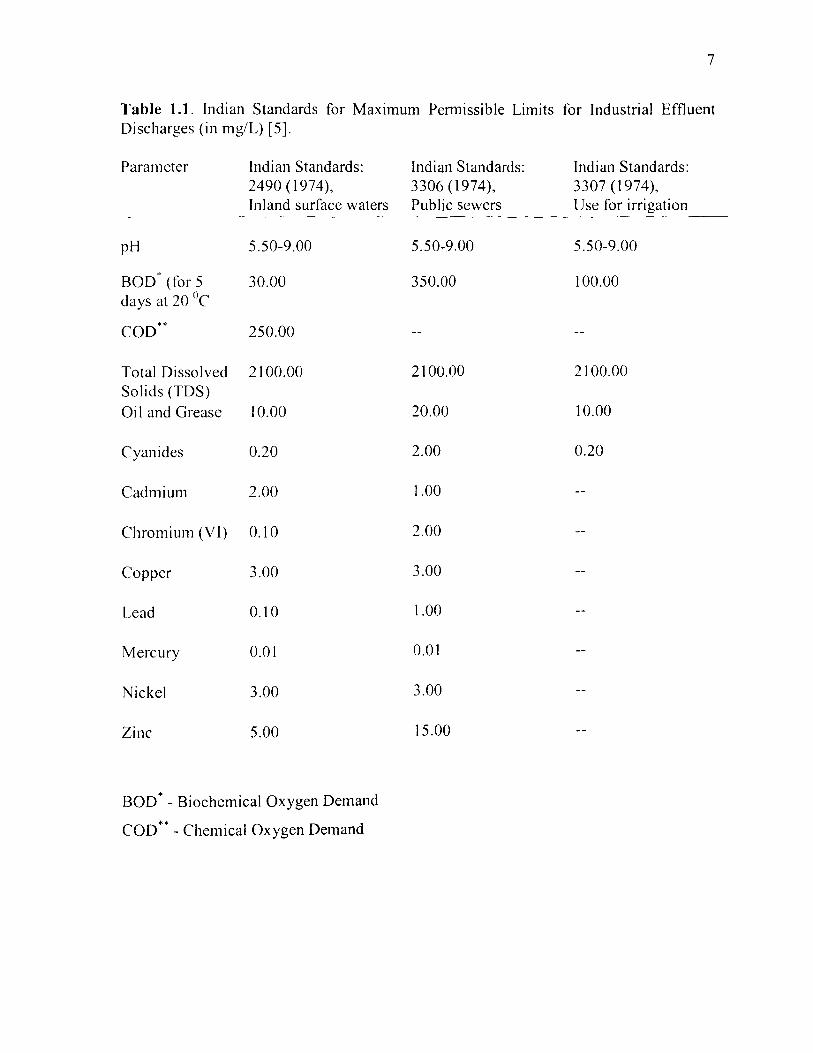
metals and compounds before they can be discharged to the watcrbodies. Table 1.1 shows
the Indian national standards for effluent discharge which was released in 1974 [5] and
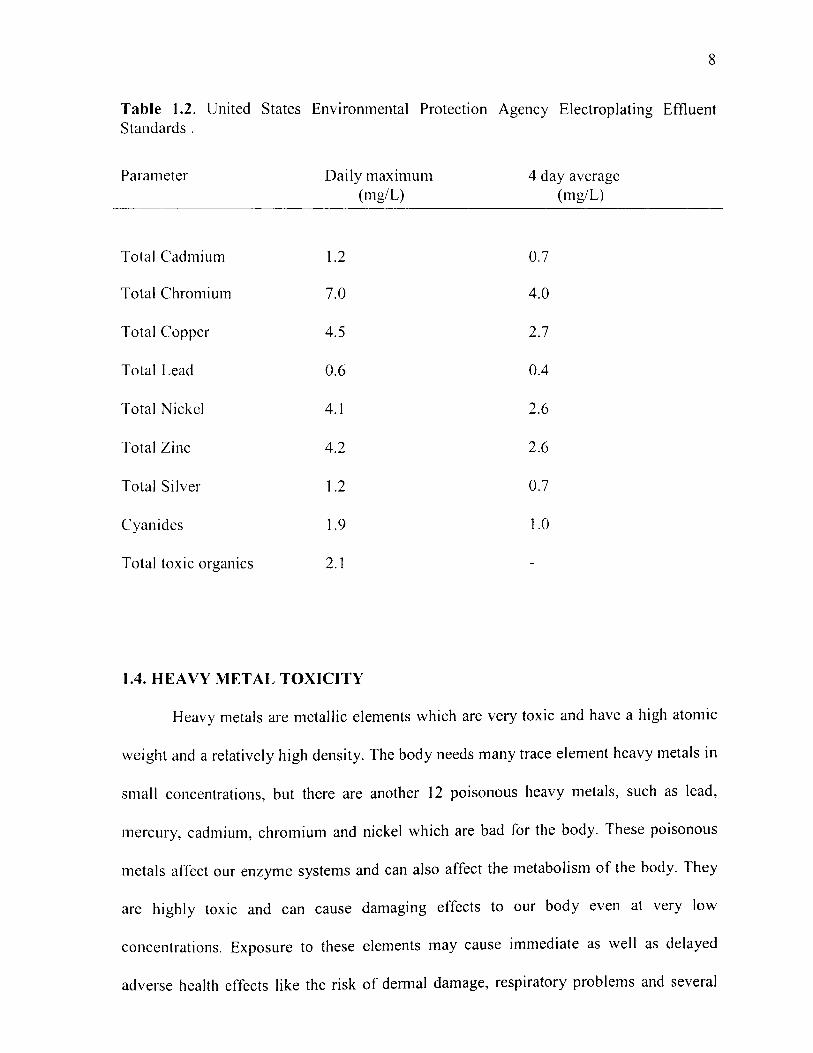
Table 1.2 shows the standards set for the electroplating industry by United States
Environmental Protection Agency (USEPA) [6]. As seen from the tables, the effluent
limits set by USEPA are much lower than the standards set by the Indian Government for
electroplating industries.
Even though the electroplating industry uses less water in comparison to the other
industries, their effluents are far more toxic. Electroplating wastewaters contain heavy
metals, cyanides and suspended solids which need to be treated before disposing into the
rivers because they are hazardous to the aquatic life and humans and pose a serious threat
to the environment. The tolerable limits of these heavy metals and other constituents in
water and land environment are in general very low. The heavy metals such as chromium,
cadmium, mercury, nickel, lead and cyanides arc the constituents which need careful
treatment because of their toxic effects.
7
Table 1.1. Indian Standards for Maximum Permissible Limits for Industrial Effluent Discharges (in mg/L) [5].
Parameter Indian Standards: 2490 (1974), Inland surface waters
pH 5.50-9.00
Boo* (for 5 30.00 days at 20 °C
coo** 250.00
Total Dissolved 2100.00 Solids (TDS) Oi 1 and Grease 10.00
Cyanides 0.20
Cadmium 2.00
Chromium (VI) 0.10
Copper 3.00
Lead 0.10
Mercury 0.01
Nickel 3.00
Zinc 5.00
BOD* - Biochemical Oxygen Demand
coo**- Chemical Oxygen Demand
Indian Standards: Indian Standards: 3306 (1974), 3307 (1974), Public sewers Use for irrigation
5.50-9.00 5.50-9.00
350.00 100.00
2100.00 2100.00
20.00 10.00
2.00 0.20
1.00
2.00
3.00
1.00
0.01
3.00
15.00
8
Table 1.2. United States Environmental Protection Agency Electroplating Effluent Standards .
Parameter
Total Cadmium
Total Chromium
Total Copper
Total Lead
Total Nickel
Total Zinc
Total Silver
Cyanides
Total toxic organics
Daily maximum (mg/L)
1.2
7.0
4.5
0.6
4.1
4.2
1.2
1.9
2.1
1.4. HEAVY METAL TOXICITY
4 day average (mg/L)
0.7
4.0
2.7
0.4
2.6
2.6
0.7
1.0
Heavy metals are metallic elements which are very toxic and have a high atomic
weight and a relatively high density. The body needs many trace element heavy metals in
small concentrations, but there are another 12 poisonous heavy metals, such as lead,
mercury, cadmium, chromium and nickel which are bad for the body. These poisonous
metals affect our enzyme systems and can also affect the metabolism of the body. They
are highly toxic and can cause damaging effects to our body even at very low
concentrations. Exposure to these elements may cause immediate as well as delayed
adverse health effects like the risk of dermal damage, respiratory problems and several
9
kinds of cancer. They tend to accumulate in the food chain and in the body. Once they
enter our body they get stored in soft and hard tissues which can cause chronic health
effects [7].
Environmental contamination and human exposure to heavy metals is a serious
growing problem throughout the world. As the use of heavy metals has tremendously
increased in the industrial process, humans are being exposed to them more and are
having a greater risk of health effects that they cause.
For this project we considered five toxic metals which are chromium (VI),
chromium (III), cadmium (II), copper (II) and nickel (II). The toxic effects each of these
heavy metals are discussed below.
1.4.1. Chromium. Chromium is one of the 129 priority pollutants listed by the
Environmental Protection Agency (EPA) [8]. Chromium has two main oxidation states:
[Cr (III)] and [Cr (VI)].
Chromium (Ill) compounds are stable and occur naturally in the environment and
are essential nutrients in our diet. Our body needs a very small amount of it for
maintaining the glucose, lipid and protein metabolism in our body. On the other hand, Cr
(VI) is toxic, non-biodegradable and is a carcinogenic [9].
Although Cr (III) is less toxic than Cr (VI), long term exposure to a high
concentration of Cr (III) may cause poisoning symptoms like allergic skin reactions.
Acute exposure causes nausea, vomiting, shock and coma and can be fatal. It can also
cause kidney and liver damage. Chronic exposure causes respiratory effects like ulcerated
perfonnation of the nasal septum, irritation of mucous membranes and general
bronchospasm. Chromium (VI) which is more toxic is associated with lung cancer and
10
kidney damage [ 1 0). In aquatic orgamsms, Cr (VI) has a high potential for
bioaccumulation which means it accumulates in their bodies and cause chronic effects.
Because of the toxic nature of Cr (VI), the discharge of Cr (VI) is regulated to
<0.05 mg/L to surface waters and 0.1 mg/L to inland surface waters according to the
US EPA, whereas the total chromium (containing Cr (III), Cr (VI) and other forms of
chromium) is regulated to be discharged at< 2 mg/L [11).
1.4.2. Cadmium. Cadmium is also listed by the EPA as one of the 129 priority
pollutants [8]. All cadmium compounds are potentially harmful or toxic. Cadmium acts
as a cumulative poison.
Acute cadmium toxicity in humans often leads to pneumonitis which can be fatal.
Signs of acute cadmium poisoning include vomiting, digestive tract irritation, colitis,
diarrhea and prostration [12]. The main health effect related with cadmium toxicity is
proteinuria which is caused by kidney damage. Studies have proven that cadmium also
affects the activities of certain enzymes in the body.
Cadmium mainly accumulates in the kidney and the excretion of cadmium from
the body is very slow and it takes about 10-40 years. Long time exposure to cadmium
causes lung, kidney and hematopoietic system damage due to build up, fragile bones and
anemia [ 13]. In studies conducted on animals cadmium has shown strong evidence of
cancer. There is not much evidence of cancer caused due to cadmium exposure in
humans.
Fish and wildlife are greatly affected by cadmium which is very toxic and causes
behavioral, growth and physiological problems in aquatic life at low concentrations.
Cadmium is the only metal which accumulates with the increasing age of an animal [14].
II
The discharge of cadmium is regulated to< 2.0 mg/L into inland surface waters in
India [ 15]. The allowable limit of cadmium in drinking water according to World Health
Organization (WHO) is <0.003 mg/L and <0.005 mg/L according to the USEP A [ 16].
1.4.3. Copper. Copper is an essential nutrient for humans and animals, with a
Recommended Daily Allowance (RDA) of 0.9 milligrams per day [ 17]. Copper is a
component of many body proteins.
Acute exposure to copper causes gastrointestinal effects such as nausea, vomiting
and diarrhea. Two grams or more of copper dose can cause serious effects such as
vascular injury and hemolytic anemia, resulting in severe renal and liver damage which
can lead to death [18].
Copper has both acute and chronic effect on aquatic organisms that can result in
death. They are known to bioconcentrate in some aquatic species. In mammals,
overexposure to copper can damage the liver and kidney [ 19]. It is the younger fishes that
are affected the most by the toxicity of copper. The adult fishes can tolerate small
concentrations of copper for small periods of time [20].
1.4.4. Nickel. Nickel is a dietary requirement for many organisms, but may be
toxic in larger doses. The human body contains approximately 100 mg of nickel [21].
Acute nickel toxicity effects are gastrointestinal symptoms like nausea, vomiting,
abdominal discomfort and diarrhea and neurological symptoms like headache, giddiness,
cough and shortness of breath. Many people develop dermatitis upon skin contact with
nickel. Nickel salts affect the pulmonary and digestive tract of humans. Exposure to
soluble nickel compounds also causes respiratory tract cancer if the dosage exceeds 1 !Jg
ofNi/ L [22].
12
Chronic health effects of nickel include chronic bronchitis and lung disease which
IS caused by reduced lung function. Nickel also affects the blood, liver, kidney and
immune systems [23]. There is some evidence of lung and nasal sinus cancers in humans.
Metallic nickel is teratogenic and carcinogenic to mammals [22].
1.5. VARIOUS METHODS FOR TREATING ELECTROPLATING WASTERWATER
There are many physical, chemical and biological methods that are currently
being used for treating electroplating wastewater. Some of the commonly used methods
are discussed below.
1.5.1. Chemical Precipitation. This is one of the cost effective ways of removing
heavy metals from wastewater. In this method a chemical additive is selected in such a
way that it will make the metal that is to be removed from the wastewater insoluble. After
the metal precipitates in the solution then it can be easily removed from the water by
filtering or settling. Most of the metals are precipitated as metal hydroxides by raising
the pH to a neutral or an alkaline level. However, this method is not effective enough to
meet the discharge effluent standards. Another problem with this method is that chelated
metal ions do not precipitate at all. So, for metal hydroxides more advanced treatments
such as reaction with organic or inorganic sulfides are employed. Chemical precipitation
uses hydroxide, carbonate or sulphide reagents for precipitation such as lime and soda
[24].
The theory of chemical precipitation IS a complex one. One of the many
disadvantages of this process is that the precipitation process is often left incomplete and
there are many side effects related to it. Even though it is a cost effective method for
13
wastewater treatment, it is not efficient enough to meet the discharge limits. Another
disadvantage of this process is that it generates large amounts of water rich sludge which
needs to be disposed [25].
1.5.2. Coagulation/ Flocculation. Flocculation is one of the widely used method
for removing suspended particles from wastewater. It is a process in which the metal to
be removed is separated out from the solution as floes or flakes which can then be easily
removed. Flocculation is often preceded by coagulation where, by the addition of a
coagulant, substances are aggregated into microscopic particles which then flocculate
into larger floes. In this process the destabilized suspension is mixed very slowly to
provide an opportunity for the particles to come into contact with one another and form
floes. The most commonly used coagulants-flocculants in wastewater treatment are
aluminum sulphate, calcium oxide, iron (III) chloride, iron (II) sulphate and sodium
silicate [26]. These are often used with various coagulant aids, such as synthetic
polyelectrolytes (anionic, cationic, or non-ionic polymers), fly ash and clay [27].
The disadvantage of this process is that it has a moderately higher total operation
and maintenance cost which is mainly due to sludge handling.
1.5.3. Ion Exchange Method. Ion exchange is a process in which the metal ions
are removed from the aqueous phase by the exchange of cations or anions between the
exchange medium and the wastewater. The materials used for making ion exchange
media are either natural or synthetic organic materials or inorganic polymeric materials.
These resins can be regenerated for re-use after their exchange capacity is exhausted.
Even though this is an efficient method for wastewater treatment, it is not that
widely used because of its high cost. Another disadvantage of this method is that during
14
the ion exchange process these resins absorb and store all the toxic chemicals which need
to be disposed. Large quantities of salt is formed which also need to be taken care of [25].
1.5.4. Electrolytic Deposition Method. This method is mainly used for treating
cyanide-containing wastewater. In this process the cyanide wastes are subjected to
electrolysis at high temperatures (95°C) for several days. One disadvantage of this
process is that the process may not reach completion and some residual cyanide and
cyanate remains which need further treatment [25].
1 .5.5. Evaporation. Evaporation of plating wastewater has been studied to
recover the plating metals. Single stage and multiple stage evaporation have been
employed. Because of high cost of equipment this method is not commonly used [25].
1.5.6. Biosorption. This is a biological sorption method used for heavy metal
removal from wastewater. Live or dead microorganisms or their derivatives are used in
biosorption. In this method the metal ions are complexed by the functional groups present
on their outer surfaces through the action of ligands. It is an effective and a cheaper
method compared to the other removal techniques [28].
The disadvantages of this process are that it takes a long time for the removal of
heavy metals and also that the regeneration of the material for further biosorption is not
possible [28].
1.5.7. Activated Carbon Adsorption. Adsorption using activated carbon is one
of the most attractive methods for heavy metal removal from wastewater because of its
high efficiency in removing metals [29]. This method is not that popular in developing
countries because of high initial and operating costs [30].
15
1.6. ADSORPTION
Adsorption is one of the more effective methods for removing heavy metals from
industrial wastewaters. Adsorption is the surface phenomenon of binding molecules or
particles in a solution onto a surface. It is also defined as the "increase in concentration of
a particular component at the surface or interface between two phases" [31]. The
substance that is removed from the liquid phase is called the adsorbate and the adsorbent
is the solid, liquid or gas phase onto which the adsorbate accumulates. Atoms at the
surface of a solid or liquid are subject to unbalanced forces of attraction which are merely
forces acting within the body of the material and are responsible for the phenomenon of
adsorption.
Adsorption is mainly of two types: physical adsorption and chemical adsorption.
The physical adsorption process does not involve the sharing or transfer of electrons. The
interactions are fully reversible enabling desorption to occur at the same temperature and
is not site specific. Whereas, chemical sorption involves chemical like bonding onto the
surface of adsorbents and is typically an irreversible process. Chemisorption is site
specific i.e. the chemisorbed molecules are fixed at specific sites.
For adsorption modeling, there is a need to find the rate detennining step of the
adsorptive process. Adsorption is a mass transfer operation and the kinetics involved in
the adsorption is simple. The adsorption process takes place in three steps: ( 1) the first
step is the transport of the adsorbate from bulk solution to the outer surface of the
adsorbent by molecular diffusion which is called extemal or film diffusion, (2) the second
step, known as intemal diffusion involves the transport of the adsorbate from the particle
surface to the interior sites by diffusion within the pore and migration along the solid
16
surface of the pore, (3) the third step is the adsorption of the solute on the active sites on
the interior of the pores [32].
1.7. ADSORBENTS
There are lots of adsorbents that are effective for heavy metal removal from
electroplating wastewater. The principal types of adsorbents are activated carbon,
synthetic polymeric, and silica based adsorbents. Many of these adsorbents are not used
widely because of their high cost. There are numerous small scale plating plants in
developing countries such as India, China and Thailand which are facing problems with
treating their wastewater before discharging into the drains because none of the
wastewater treatment processes that are effective are economical at the small scale. For
this reason, the effectiveness of low cost adsorbents for heavy metals removal is being
studied widely with the aim of finding cheap natural adsorbents that are easily available
and which are effective in removing the toxic heavy metals in the electroplating
wastewaters. Studies has been done on natural wastes where materials such as cotton
[33], walnut waste [34], peanut skin [35], sugarcane waste and onion hull [36], coffee
grounds [37], tea leaves [38], apple wastes [39], wool fiber [ 40], bark and other cellulosic
materials [ 41, 42, 43, 44, 45, 46, 47], cottonseed hulls, rice straw, soybean hulls [ 48] and
linseed flax [ 49] have been studied. In general, they present good adsorption capacity.
These unconventional natural adsorbents have advantages other than being abundant in
nature. Most of them need less prior processing and are waste by-products from some
other industry. So, they are an alternative to costlier adsorbents like activated carbon, or
synthetic polymers.
17
In the present study, the two natural adsorbents studied were: (1) rice husk and (2)
coconut coir.
1.7.1. Rice Husk. Rice husks are the outer covering of rice grains. They are the
by-products of the rice milling industry and comprise 23 %of the rice grain. Developing
countries such as China, India, Indonesia, Bangladesh and Thailand are the leading rice
producing countries [50]. Rice husk is abundantly available at minimal cost in these
developing countries as it is a waste material. It is used as a source of energy for boilers
in rice milling factories and also used as a building material, fertilizer and also in some
industries. However, the amount of rice husk available is in excess of all these local uses
and there are disposal problems [51]. It is a promising adsorbent, as it contains 15-22 <Yo
Si02 in hydrated amorphous form like silica gel [52] which is a good adsorbent.
1.7.2. Coconut Coir. Coconut coir is a natural adsorbent that is cheap and
avai !able in plenty in developing countries such as India and Sri Lanka. They are the
world's top two producers, accounting for 90% of the global coir fiber production [53).
It is also produced in Malaysia, Philippines and Thailand but in lesser quantities
compared to India and Sri Lanka.
Coir, cocopeat, coir fiber pith and coir dust are many terms used to describe the
material that is produced from coconut husks. Coconut husk is the fibrous layer of the
fruit inside the outer shell of a coconut. Coir is produced as a by-product when coconut
husks arc processed for the extraction of the long fibers from the husk. It is the binding
material that comes from the fiber fraction of the coconut husk [54]. The average yield of
coir is 80-90 g fiber per kg of husk [55]. The coir pith had been considered a nuisance
and disposal problem with little beneficial uses. Over the decades, coir pith piles grew
18
around the coir mills in India and Sri Lanka. It is bio-degradable but takes as long as 20
years to decompose. Lately it has been discovered that it has adsorbent properties and
adsorbent studies have been done. Coir is available in bulk or in blocks and have a pH of
5.2-6.8 [56].
In the current study, the removal efficiency of two cheap natural adsorbents, rice
husk and coconut coir for heavy metal ions Cr (VI), Cr (III), Cd (II), Cu (II) and Ni (II)
from a simulated electroplating wastewater were studied.
19
2. EXPERIMENTAL MATERIALS AND METHODS
2.1. ADSORBENT PREPARATION
In our study, we used two different adsorbents: rice husk and coconut coir. These
adsorbents were selected on their cost effectiveness and ready availability. These were
prepared in different ways.
2.1.1. Rice Husk. The rice husk used for the study was purchased from The
Quality Wine and Ale Supp~v. Elkhart, Indiana, USA [57]. The characteristics of the rice
husk were obtained from the manufacturer and are shown in Table 2.1. They are the outer
covering of the long white rice from a farm in Arkansas, USA. These are brown in color
with the size of long grain rice. The rice husks were washed with deionized water by
mixing it in a shaker for 2 hours. After that, the water was decanted, and the rice husk
was then again shaken with fresh water for another 2 hours. This process was repeated at
least four times until all the apparent excess material was removed from the rice husks.
The cleaned, wet rice husks were then placed on a large glass baking dish and dried in the
oven at 125° C for 18 hours. While it was in the oven, it was stirred occasionally. The
dried rice husks were taken out and sieved using a 200- mm sieve so that the fines from it
were removed. The larger cleaned rice husks particles were stored in precleaned
polypropylene bottles and kept air tight to avoid absorption of moisture from the
atmosphere. These prepared rice husks were used for the experiments.
20
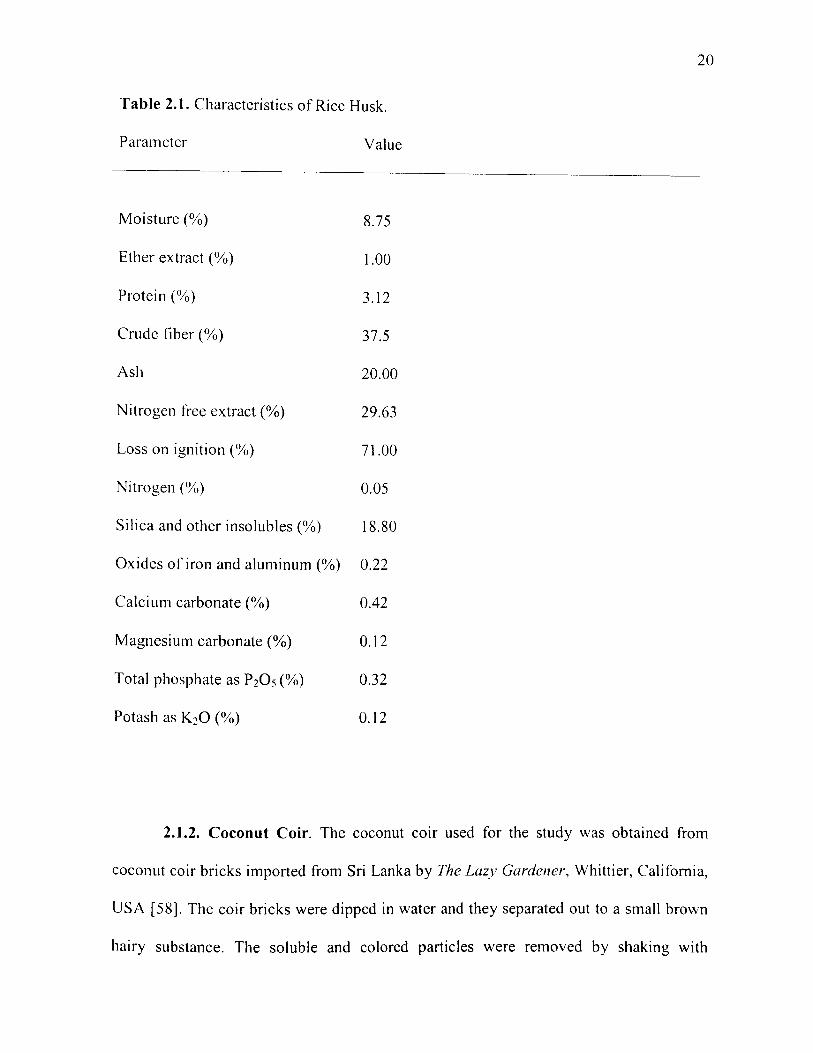
Table 2.1. Characteristics of Rice Husk.
Parameter Value
Moisture(%) 8.75
Ether extract(%) 1.00
Protein(%) 3.12
Crude fiber(%) 37.5
Ash 20.00
Nitrogen free extract(%) 29.63
Loss on ignition(%) 71.00
Nitrogen(%) 0.05
Silica and other insolubles (%) 18.80
Oxides ofiron and aluminum(%) 0.22
Calcium carbonate(%) 0.42
Magnesium carbonate(%) 0.12
Total phosphate as P205 (%) 0.32
Potash as K20 (%) 0.12
2.1.2. Coconut Coir. The coconut coir used for the study was obtained from
coconut coir bricks imported from Sri Lanka by The Lazy Gardener, Whittier, California,
USA [58]. The coir bricks were dipped in water and they separated out to a small brown
hairy substance. The soluble and colored particles were removed by shaking with
21
deionized water for 2 hours. The water was then decanted and again mixed with fresh
water. The washings were repeated until the water became colorless. This wet coir was
transferred to a glass baking dish and kept in the oven for drying at 125°C for 16 hours.
The dried coir was sieved using the fraction between 350-850 !Jm and stored in
precleaned airtight polypropylene bottles. This material was used for all the experiments.
2.2. ADSORBENT CHARACTERIZATION
The surface areas and pore volume of the adsorbents were measured by the BET
method (Brunauer Emmett Teller nitrogen adsorption technique) [59) using a
Quantachrome Instruments Autosorb-1 Surface Area Analyzer, USA.
2.3. REAGENTS
All reagents were of analytical grade and deionized water from a Milli-Q system
(Millipore S.A., Molsheim, France) was used throughout the experiments. The chromium
nitrate, sodium chromate, copper chloride, nickel chloride and cadmium chloride used for
preparing stock solutions were of the analytical grade. The other chemicals used were
sodium nitrate, sodium hydroxide and 67-70 % assay nitric acid. All of these were
purchased from Fisher Scientific, New Jersey, USA.
I M HN03 and 0.5 M NaOH solutions were prepared and used for adjusting the
pH of the solution. All pH measurements were carried out using a Coming 430 pH meter.
Sodium nitrate buffer solutions having ionic strength of 0.05 M were prepared by
dissolving 4.2495 g ofNaN03 granules in 1000 ml of deionized water.
22
2.3.1. Preparation of Stock Solutions. The synthetic wastewater solutions for
each ofthe metals were prepared from analytical grade chemicals. The stock solutions for
chromium (Ill), chromium (VI), cadmium (II), copper (II) and nickel (II) were prepared
from Cr (NO_~)J ·9H20, Na2Cr04, CdCh, CuCh·2H20 and NiCh ·6H20, respectively. The
stock solutions were prepared by dissolving the exact quantity of the chemicals in
deionized water to obtain 5866.67 mg of metal/L of the solution. The solutions were
diluted to the required concentrations for the experiments. Throughout our study, we used
a nominal metal ion concentration of20 mg/L ofthe metal solution after dilution.
2.3.2. Preparation of Standard Solutions for Calibration Curves. Standard
solutions of chromium, cadmium, copper and nickel were prepared from the 1000 mg/L
reference solutions suitable for flame atomic absorption spectrometry analysis which
were purchased from Fisher Scientific, New Jersey, USA. These standards were diluted
to the concentrations ranging from 0.1 mg/L to 50 mg/L and stored in polypropylene
bottles for use.
2.4. ANALYSIS OF METAL IONS
A Flame Atomic Absorption Spectrophotometer Perkin-Elmer 3110 model
(Norwalk, Connecticut, USA) was used to determine the concentrations of Cr (VI), Cr
(Ill), Cd (II), Cu (II) and Ni (II) in the aqueous solution at wavelengths of 357.9, 228.8,
324.8 and 232.4 nm, respectively. All these metals were analyzed using the air-acetylene
flame and the respective hollow cathode tubes which were purchased from Perkin-Elmer
(USA) were used. Measurements were recorded when three repeatable readings were
23
obtained. Metal ion concentrations were determined m reference to the appropriate
standard metal ion solutions.
2.5. BATCH ADSORPTION STUDIES
The adsorption experiments were all carried out by a batch technique at ambient
temperature (23± 1 ° C). A S/L ratio, which is the ratio of the mass of the adsorbent to the
volume of the buffer solution added, of 1:30 was used. For each experimental run, a fixed
amount of the adsorbent (3.67 g) was massed on a Metler Toledo balance and transferred
into 125 ml polypropylene bottles which were numbered and kept. Into each of these
bottles 110 ml of 0.05 M NaN03 buffer solution was added. The metal ion concentration
of the stock solution prepared was measured using the Atomic Absorption Spectrometer.
Each of these bottles was then spiked with 375 JlL of 5866.66 mg/L of this metal stock
solution. The initial pH values of each of the bottles were adjusted using 1 M HN03 and
0.5 M NaOH to an initial pH in the range of 2-12 at an increment of one unit using a
Coming 430 pH meter. The volume of the acid or base needed to adjust to the initial
desired pH was recorded. Table 2.2 shows the composition in each bottle that was
prepared.
After adjusting the pH, the bottles were tightly sealed and kept in a mechanical
shaker at low speed for 24 hours. After 24 hours, the bottles were taken from the shaker
and the final pH was recorded. A 10 ml aliquot of solution was filtered from each of the
bottles using a latex free syringe and 25 mm syringe filter (0.45 Jlm, nylon) and
transferred into 15 ml polypropylene tubes and capped. The filtrate was analyzed on an
Atomic Absorption Spectrophotometer to measure the residual concentration of the metal
24
ions left in the solution after adsorption onto the RH or CC. Nine sets of blank samples
were also prepared. The blanks that were prepared are as follows: bottles with adsorbent
and no metal ions; no adsorbent and no metal ions and no adsorbent but with metal ions.
The pH values of the blanks were adjusted to 2, 7 and 12 to study the pH variation over
24 hours. All the sets were carried out in duplicate to avoid any discrepancy in
experimental results.
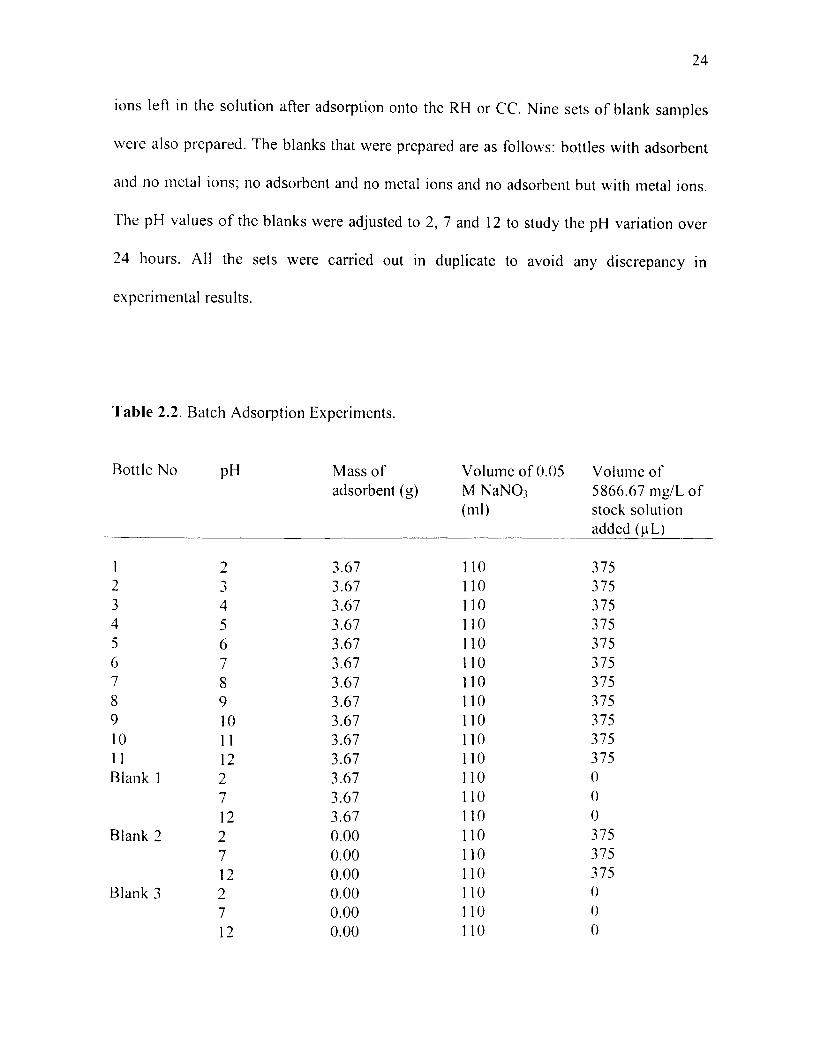
Table 2.2. Batch Adsorption Experiments.
Bottle No pH Mass of Volume of 0.05 Volume of adsorbent (g) M NaN03 5866.6 7 mg/L of
(ml) stock solution added ()lL)
I 2 3.67 110 375 2 3 3.67 110 375 3 4 3.67 110 375 4 5 3.67 110 375 5 6 3.67 110 375 6 7 3.67 110 375 7 8 3.67 110 375 8 9 3.67 110 375 9 10 3.67 110 375 10 1 1 3.67 110 375 II 12 3.67 110 375 Blank 1 2 3.67 110 0
7 3.67 110 0
12 3.67 110 0 Blank 2 2 0.00 110 375
7 0.00 110 375
12 0.00 110 375 Blank 3 2 0.00 II 0 ()
7 0.00 110 ()
12 0.00 110 0
25
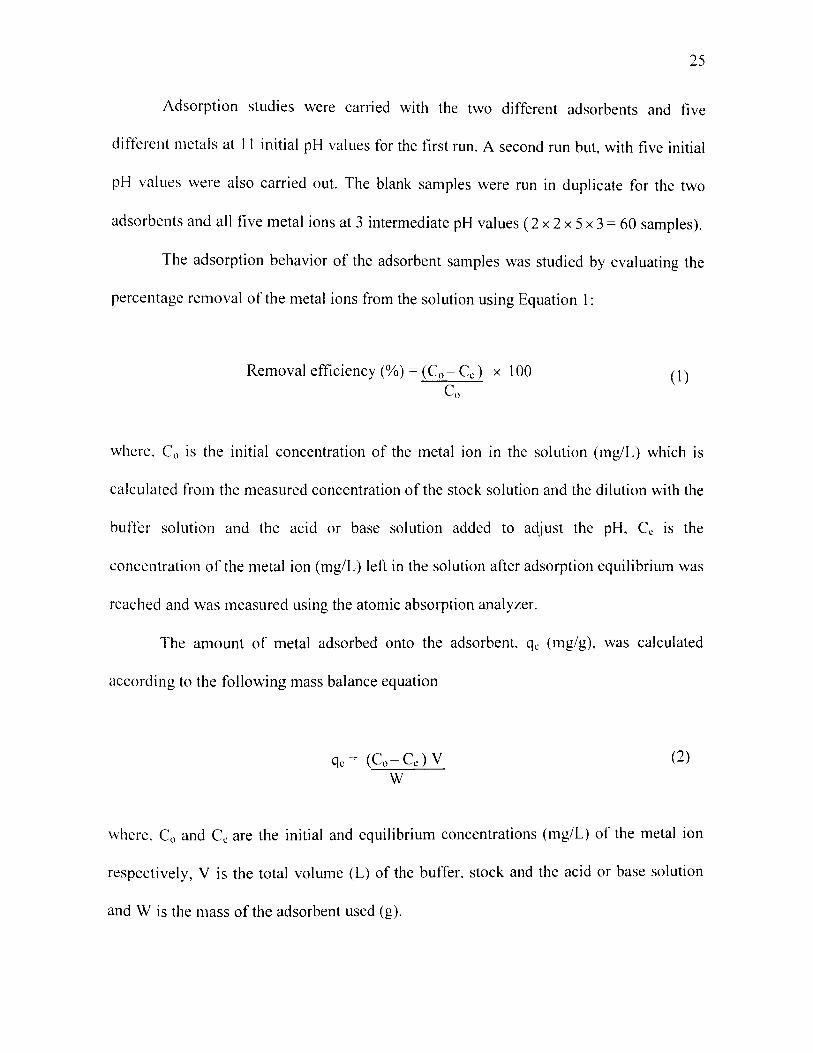
Adsorption studies were carried with the two different adsorbents and five
different metals at 11 initial pH values for the first run. A second run but, with five initial
pH values were also carried out. The blank samples were run in duplicate for the two
adsorbents and all five metal ions at 3 intermediate pH values ( 2 x 2 x 5 x 3 = 60 samples).
The adsorption behavior of the adsorbent samples was studied by evaluating the
percentage removal of the metal ions from the solution using Equation 1:
Removal efficiency (%) = (Co- Cc) x I 00
Co (I)
where, Co is the initial concentration of the metal ion in the solution (mg/L) which is
calculated from the measured concentration of the stock solution and the dilution with the
buffer solution and the acid or base solution added to adjust the pH, Cc is the
concentration of the metal ion (mg/L) left in the solution after adsorption equilibrium was
reached and was measured using the atomic absorption analyzer.
The amount of metal adsorbed onto the adsorbent, qc (mg/g), was calculated
according to the following mass balance equation
qc= (Co-Cc)V w
(2)
where, Co and C: are the initial and equilibrium concentrations (mg/L) of the metal ion
respectively, V is the total volume (L) of the buffer, stock and the acid or base solution
and W is the mass of the adsorbent used (g).
26
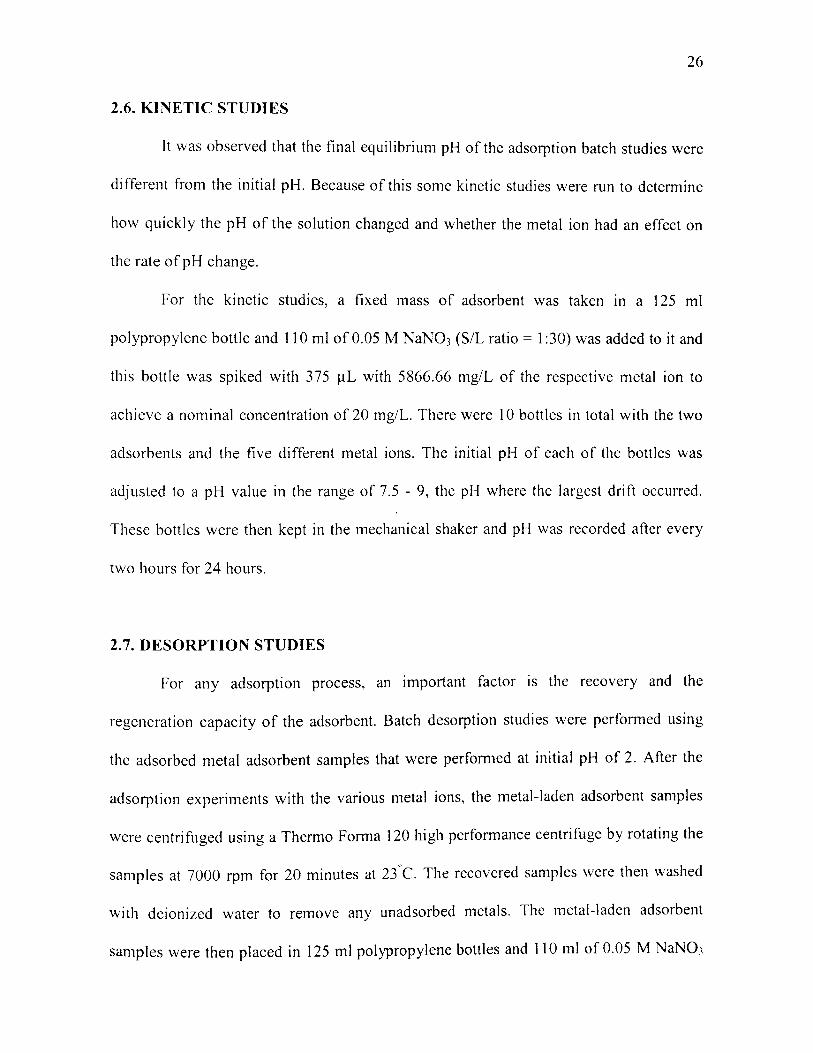
2.6. KINETIC STUDIES
It was observed that the final equilibrium pH of the adsorption batch studies were
different from the initial pH. Because of this some kinetic studies were run to determine
how quickly the pH of the solution changed and whether the metal ion had an effect on
the rate of pH change.
For the kinetic studies, a fixed mass of adsorbent was taken in a 125 ml
polypropylene bottle and 110 ml of 0.05 M NaN03 (S/L ratio = 1 :30) was added to it and
this bottle was spiked with 375 11L with 5866.66 mg/L of the respective metal ion to
achieve a nominal concentration of 20 mg/L. There were 10 bottles in total with the two
adsorbents and the five different metal ions. The initial pH of each of the bottles was
adjusted to a pH value in the range of 7.5 - 9, the pH where the largest drift occurred.
These bottles were then kept in the mechanical shaker and pH was recorded after every
two hours for 24 hours.
2.7. DESORPTION STUDIES
For any adsorption process, an important factor is the recovery and the
regeneration capacity of the adsorbent. Batch desorption studies were perfom1ed using
the adsorbed metal adsorbent samples that were perfom1ed at initial pH of 2. After the
adsorption experiments with the various metal ions, the metal-laden adsorbent samples
were centrifuged using a Thermo Forma 120 high performance centrifuge by rotating the
samples at 7000 rpm for 20 minutes at 23"c. The recovered samples were then washed
with deionized water to remove any unadsorbed metals. The metal-laden adsorbent
samples were then placed in 125 ml polypropylene bottles and 110 ml of 0.05 M NaN03
27
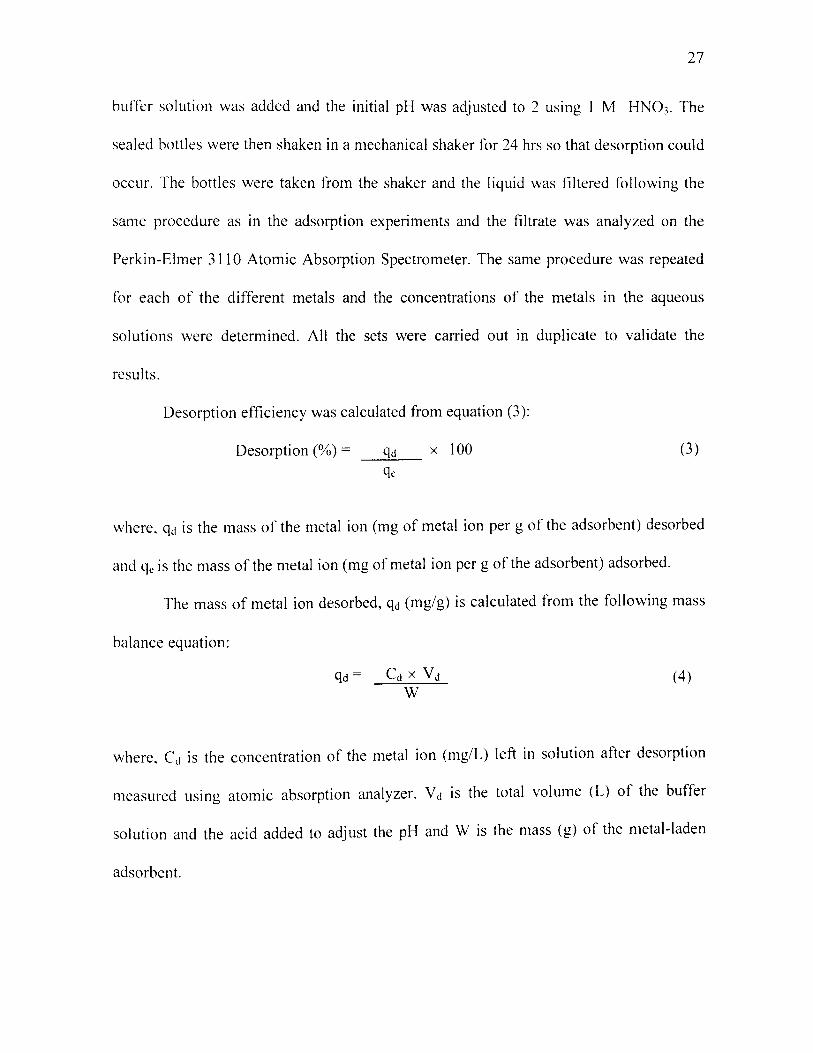
buffer solution was added and the initial pH was adjusted to 2 using 1 M HN03. The
scaled bottles were then shaken in a mechanical shaker for 24 hrs so that desorption could
occur. The bottles were taken from the shaker and the liquid was filtered following the
same procedure as in the adsorption experiments and the filtrate was analyzed on the
Perkin-Elmer 3110 Atomic Absorption Spectrometer. The same procedure was repeated
for each of the different metals and the concentrations of the metals in the aqueous
solutions were determined. All the sets were carried out in duplicate to validate the
results.
Desorption efficiency was calculated from equation (3 ):
Desorption (%) = X 100 (3)
where, qd is the mass of the metal ion (mg of metal ion per g of the adsorbent) dcsorbcd
and qc is the mass ofthe metal ion (mg of metal ion per g ofthe adsorbent) adsorbed.
The mass of metal ion desorbed, qd (mg/g) is calculated from the following mass
balance equation:
(4)
where, C1 is the concentration of the metal ion (mg/L) left in solution after desorption
measured using atomic absorption analyzer, Vd is the total volume (L) of the buffer
solution and the acid added to adjust the pH and W is the mass (g) of the metal-laden
adsorbent.
28
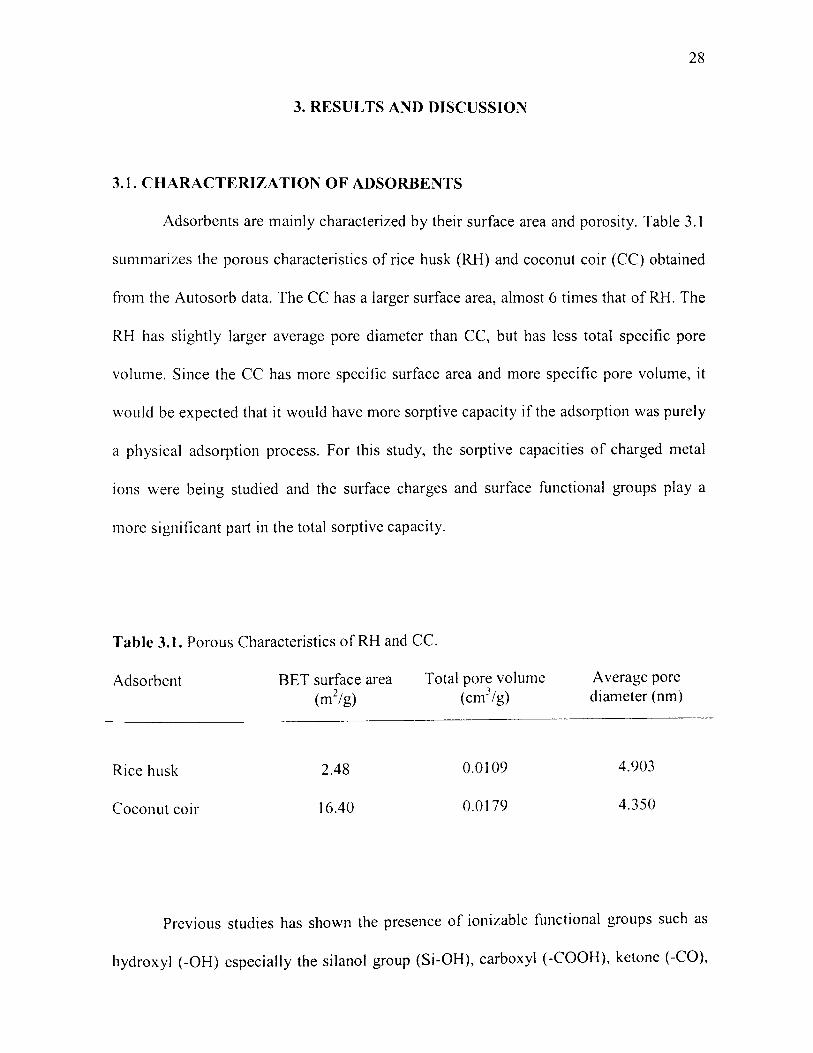
3. RESULTS AND DISCUSSION
3.1. CHARACTERIZATION OF ADSORBENTS
Adsorbents are mainly characterized by their surface area and porosity. Table 3.1
summarizes the porous characteristics of rice husk (RH) and coconut coir (CC) obtained
from the Autosorb data. The CC has a larger surface area, almost 6 times that of RH. The
RH has slightly larger average pore diameter than CC, but has less total specific pore
volume. Since the CC has more specific surface area and more specific pore volume, it
would be expected that it would have more sorptive capacity if the adsorption was purely
a physical adsorption process. For this study, the sorptive capacities of charged metal
ions were being studied and the surface charges and surface functional groups play a
more significant part in the total sorptive capacity.
Table 3.1. Porous Characteristics of RH and CC.
Adsorbent
Rice husk
Coconut coir
BET surface area (m2/g)
2.48
16.40
Total pore volume (cm3/g)
0.0109
0.0179
Average pore diameter (nm)
4.903
4.350
Previous studies has shown the presence of ionizable functional groups such as
hydroxyl (-OH) especially the silanol group (Si-OH), carboxyl (-COOH), ketone (-CO),
29
aldehyde (-CHO) and siloxane (Si- 0- Si) groups on the surface of RH [60, 61]. The
presence of these groups indicates that that RH will have good metal binding capacity
and will be an effective adsorbent for removing metal ions [61]. The main functional
groups among them involved in the adsorption mechanism of RH are the silanol and the
carboxylic groups [62, 63]. The pKa value of carboxylic group is around 4 [64] and that
ofthe silanol group is 7.2 [63].
The CC primarily contains a- cellulose, hemicellulose and lignin [65]. The
functional groups in lignin such as the phenolic hydroxyl group (C,H 5-0H), methoxyl (-
OCH,), carbonyl (-CO) and carboxyl ( -COOH) and the hydroxyl ( -OH) group in
cellulose are the functional groups present on the surface of CC. The main functional
groups responsible for the adsorption on the surface of CC are the methoxyl group
combined with the aromatic ring and the carbonyl groups [66].
3.2. pH DRIFT METHOD- DETERMINATION OF ZERO POINT OF CHARGE OF ADSORBENTS
The zero point of charge (pHzpc) of an adsorbent is an important characteristic
that detennines the pH at which the surface has net electrical neutrality. To detennine the
zero point of charge ofRH and CC, the pH drift method was employed [67, 68, 69]. The
pH drift method which was originally developed for activated carbon, provides a quick
yet reliable information on the pHZPc of an adsorbent [70].
During the batch adsorption studies, it was noted that there was a drift in the final
equilibrium pH. At low initial pH values there was a slight increase to the final
equilibrium pH and at higher initial pH there was a decreasing trend in the final pH. In
the pH drift method, the initial pH is plotted against the final equilibrium pH. The pH at
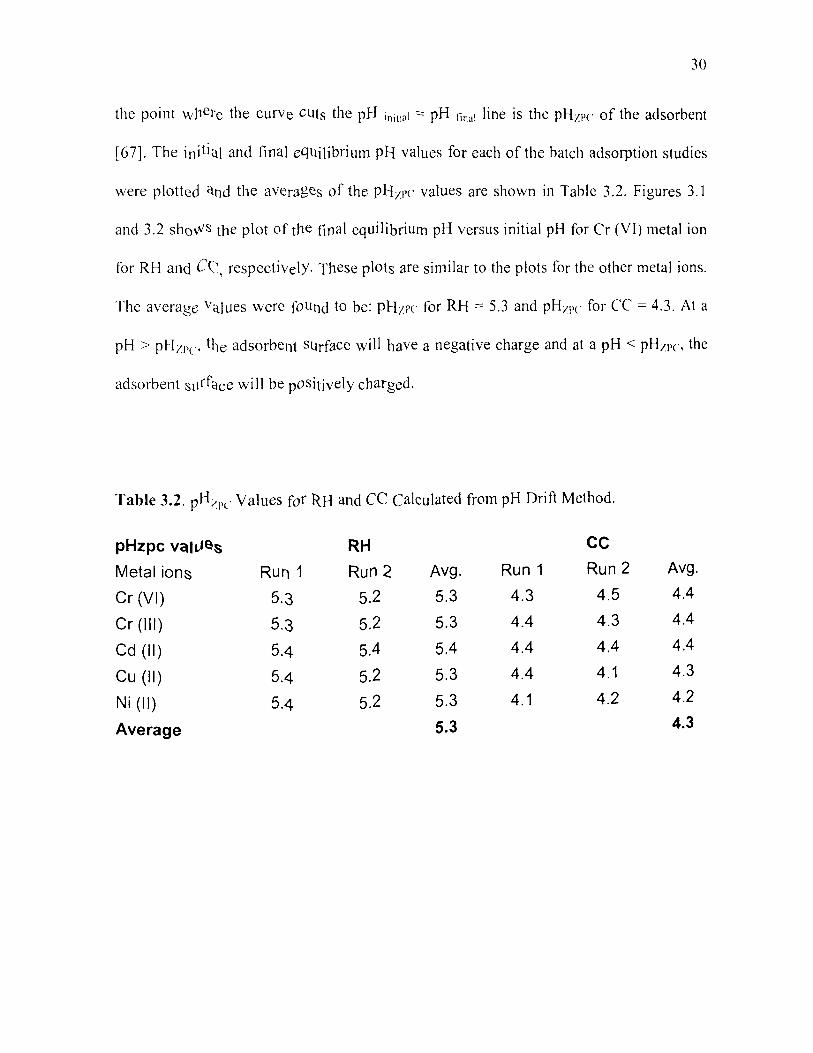
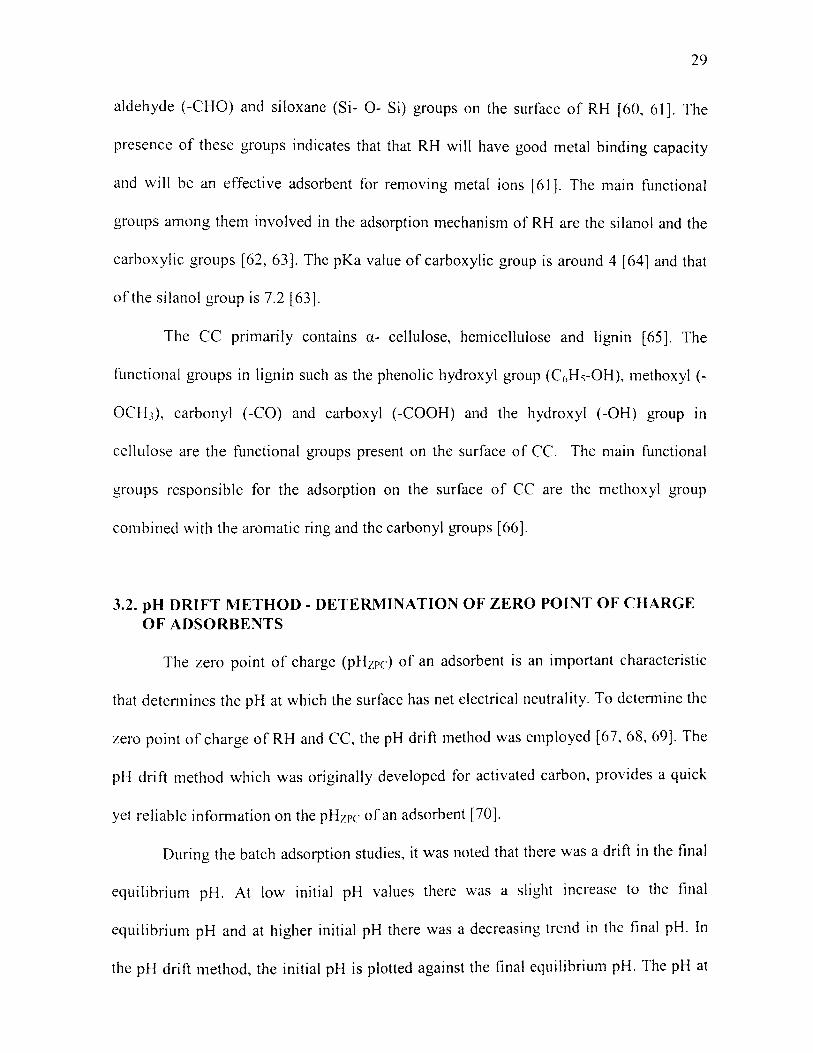
30
the point w11ete the curve CUts the pH initial ::::: pH tina! line is the pHzpc of the adsorbent
[67]. The initial and final equilibrium pB values for each of the batch adsorption studies
were plotted <tnd the averages of the pB7 pc values are shown in Table 3.2. Figures 3.1
and 3.2 sho~s the plot of t11e final equilibrium pH versus initial pH for Cr (VI) metal ion
for RH and CC', respectivelY- These plots are similar to the plots for the other metal ions.
The average Va)ues were foUnd to be: PBzrc for RH == 5.3 and pH;pc for CC = 4.3. At a
pH > pH 11'c• the adsorbent surface will have a negative charge and at a pH < pH/I'c. the
adsorbent sorface will be positively charged.
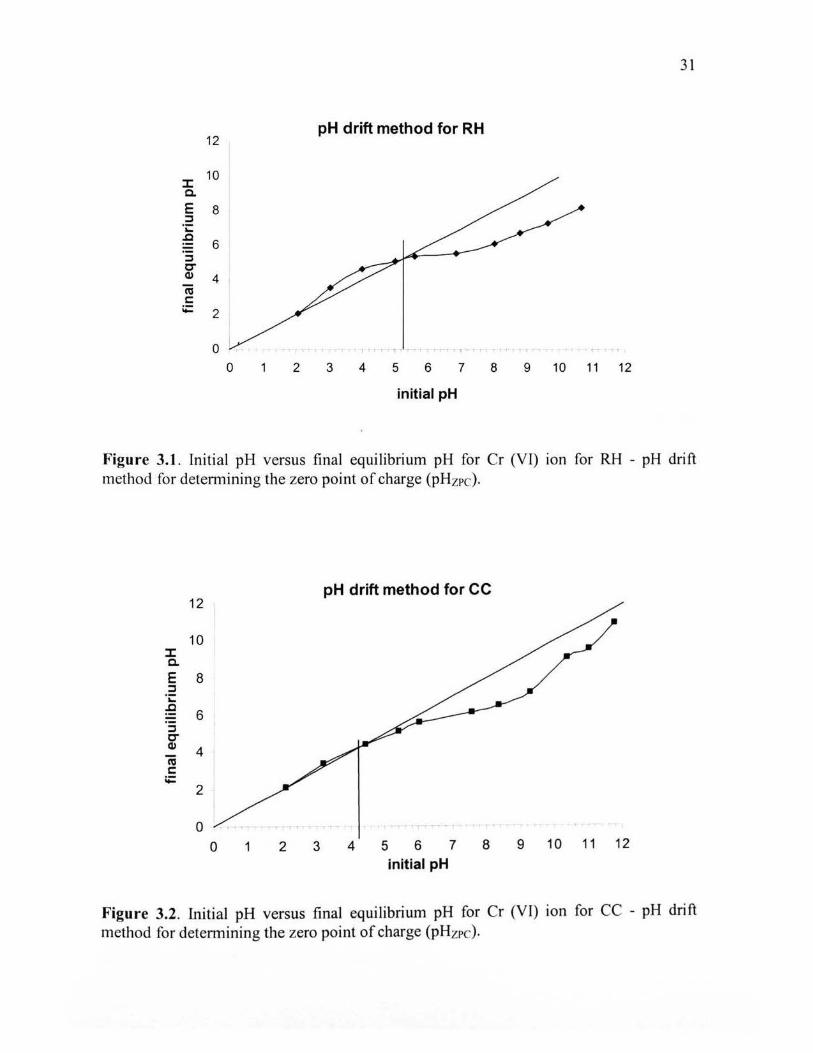
Table 3.2. pH~PC Values for RH and CC Calculated from pH Drift Method.
pHzpc vaiLJ~s RH cc Metal ions Run 1 Run 2 Avg. Run 1 Run 2 Avg.
Cr (VI) 5.3 5.2 5.3 4.3 4.5 4.4
Cr (Ill) 5.3 5.2 5.3 4.4 4.3 4.4
Cd (II) 5.4 5.4 5.4 4.4 4.4 4.4
Cu (II) 5.4 5.2 5.3 4.4 4.1 4.3
Ni (II) 5.4 5.2 5.3 4.1 4.2 4.2
Average 5.3 4.3
31
12 pH drift method for RH
:I: 10
c. E :::s 8
·;: .Q
6 :::s C" Q,) 4 nJ c: ;;:
2
0
0 2 3 4 5 6 7 8 9 10 11 12
initial pH
Figure 3.1 . Initial pH versus final equi librium pH for Cr (VI) ion for RH - pH drift method for determining the zero point of charge (pHzrc).
12 pH drift method for CC
10 :I: c. E 8 :::s ·;: .Q
6 ·-:::s C" Q,)
4 nJ c: ;;:
2
0
0 1 2 3 4 5 6 7 8 9 10 11 12
initial pH
Figure 3.2. Initial pH versus finaJ equilibrium pH for Cr (VI) ion for CC - pH drift method for determining the zero point of charge (pHzrc).
32
3.3. BATCH ADSORPTION STUDIES- EFFECT OF pH
pH is a very important parameter in the adsorption process. When the pH of a
solution changes, there will be changes in the dissociation of the functional groups on the
active sites of the adsorbent which causes a change in the adsorptive process. There will
also be changes in the speciation of metals in aqueous solution according to the pH
values [71].
The solution pH will have two effects: 1) on the adsorbent, depending on the
pHzpc value the adsorbent will have a net positive or negative charge and 2) on the nature
of the metal ion in the solution, i.e., whether it exists in the anionic (-) or cationic ( +)
state at a given pH.
The pH at which the adsorbent surface has a net neutral charge i.e. when the
surface charge density is zero, is called the pHzpc of the adsorbent. The adsorbent surface
can be positively or negatively charged depending on the functional groups present on
their surface. The charge on the surface is also dependent on the pH of the solution
depending on the net gain or loss of protons (H+). At a pH < pHzpc, the adsorbent surface
will be positively charged and at a pH > pHzpc, the adsorbent surface will be negatively
charged. Adsorption onto these adsorbents depends on the nature of the metal ions
(cationic or anionic) at the different pH values.
3.3.1. Blank Samples. Blank 1 (adsorbent+ buffer solution) showed a drift in the
pH value over the equilibrium period, whereas, Blank 2 (metal ion+ buffer solution) and
Blank 3 (only buffer solution) showed no change in the final equilibrium pH. From these
observations we can infer that the change in the final equilibrium pH for the batch
adsorption studies is primarily due to the adsorbent.
33
There was no change in the measured metal ion concentration for Blank 2 which
had the metal ion in it over the equilibrium period for the three pH values. This means
that there is no effect of the bottle or the buffer solution (0.05 M NaN03 ) on the
adsorption of metals.
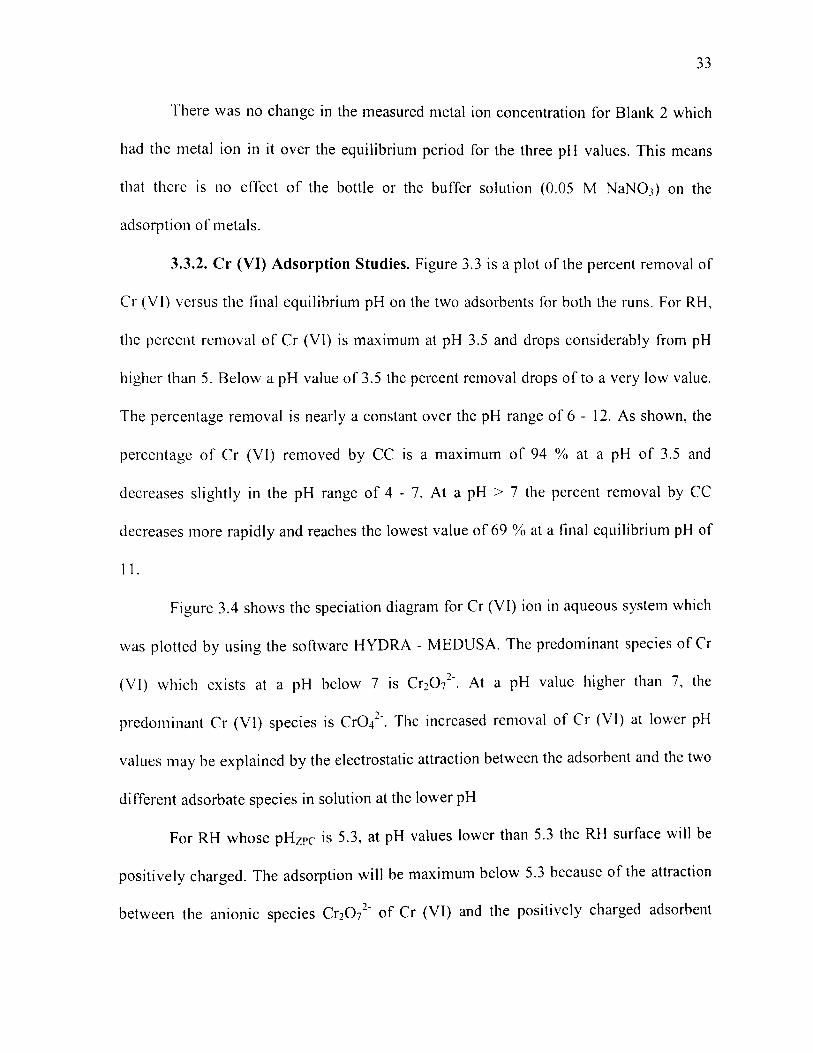
3.3.2. Cr (VI) Adsorption Studies. Figure 3.3 is a plot of the percent removal of
Cr (VI) versus the final equilibrium pH on the two adsorbents for both the runs. For RH,
the percent removal of Cr (VI) is maximum at pH 3.5 and drops considerably from pH
higher than 5. Below a pH value of 3.5 the percent removal drops of to a very low value.
The percentage removal is nearly a constant over the pH range of 6 - 12. As shown, the
percentage of Cr (VI) removed by CC is a maximum of 94 % at a pH of 3.5 and
decreases slightly in the pH range of 4 - 7. At a pH > 7 the percent removal by CC
decreases more rapidly and reaches the lowest value of 69 % at a final equilibrium pH of
11.
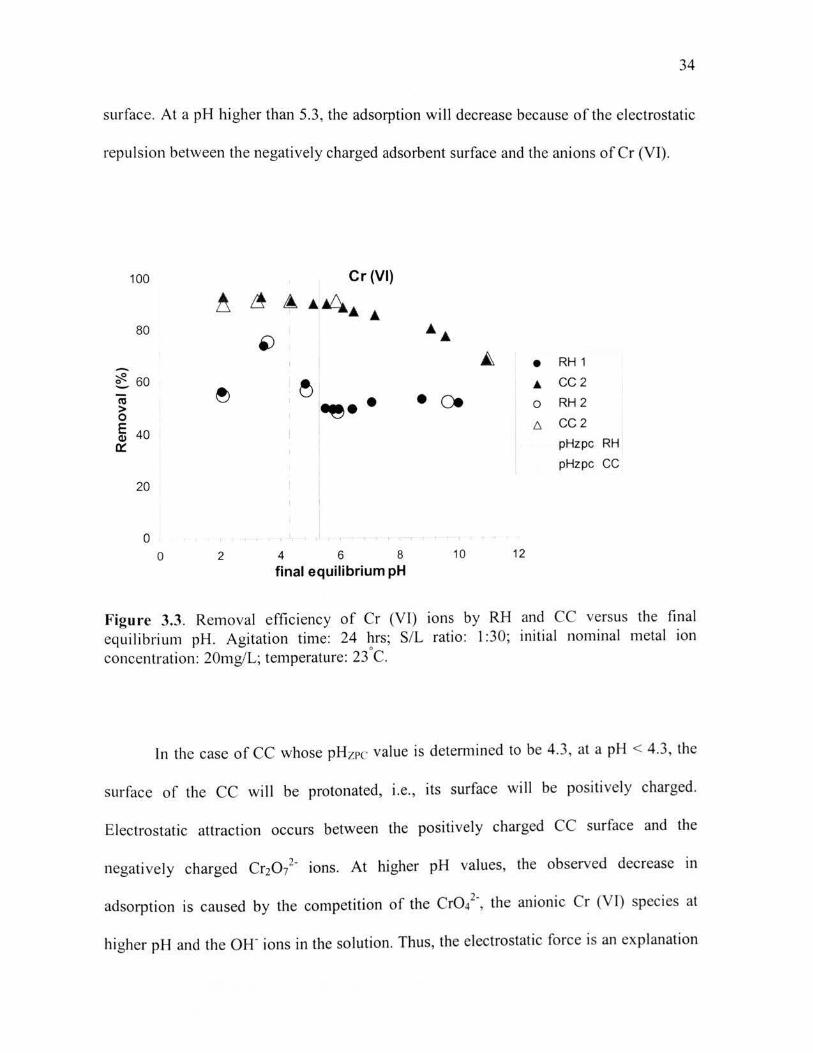
Figure 3.4 shows the speciation diagram for Cr (VI) ion in aqueous system which
was plotted by using the software HYDRA - MEDUSA. The predominant species of Cr
(VI) which exists at a pH below 7 is Cr20/-. At a pH value higher than 7, the
predominant Cr (VI) species is CrO/-. The increased removal of Cr (VI) at lower pH
values may be explained by the electrostatic attraction between the adsorbent and the two
different adsorbate species in solution at the lower pH
For RH whose pHzrc is 5.3, at pH values lower than 5.3 the RH surface will be
positively charged. The adsorption will be maximum below 5.3 because of the attraction
between the anionic species Cr20/- of Cr (VI) and the positively charged adsorbent
34
surface. At a pH higher than 5.3, the adsorption will decrease because of the electrostatic
repulsion between the negatively charged adsorbent surface and the anions of Cr (VI).
100
80
-?[?. 60 -l'O > 0
~ 40 rx:
20
0 0 2
~ ee• •
4 6 8
final equilibrium pH
•c.
10 12
e RH 1
.A CC2
o RH 2
6 CC2
pHzpc RH
pHzpc CC
Figure 3.3. Removal efficiency of Cr (VI) ions by RH and CC versus the final equilibrium pH. Agitation time: 24 hrs; S/L ratio: I :30; initial nominal metal ion concentration: 20mg/L; temperature: 23°C.
ln the case of CC whose pHzrc value is detennined to be 4.3, at a pH < 4.3, the
surface of the CC will be protonated, i.e., its surface will be positively charged.
Electrostatic attraction occurs between the positively charged CC surface and the
negatively charged Cr20 72" ions. At higher pH values, the observed decrease in
adsorption is caused by the competition of the CrO/, the anionic Cr (VI) species at
higher pH and the OH" ions in the solution. Thus, the electrostatic force is an explanation
35
for the increased adsorption of Cr (VI) at lower pi I values and decrease in adsorption at
higher pi I values.
100 C rO
4 2-
so c 1' 20 , 2 -
60 -~ 0 ....... = .9 4() -(j ~ s...
""' II C rO ~-
20
()
2 4 10 12
pH
Figure 3.4. peciation diagram of Cr (VI): Fraction (%)of Cr ~VI) versus pH: metal ion concentrat ion: 20 mg/L; ionic strength: 0.05 M: temperature: 25 C.
From literature we see that at a lower pH there can be a reduction ofCr (VI) to Cr
([II) [72 j. In this study, the Cr (Til) which may be formed from the reduction of Cr (VI)
was not measured independently. The atomic adsorption technique measured the total
chromium in the solution regardless of its ionic state (Cr (VI) or Cr (Ill)). The equation
for Cr (V I) reduction is given by Equation (5) [73]:
(5)
36
Chromic ions exist in aqueous solution as [Cr (H20)6]3+. The reduction of Cr (VI)
to Cr (III) may explain the drop off in adsorption on the CC at a low pH. Since the Cr
(III) does not adsorb as readily as Cr (VI), there could be less net adsorption at the lowest
pH. By the mechanism of ion exchange, these associated water molecules, [Cr (H 20)(i+,
are exchanged with carboxylic and hydroxyl ions on the surface of RH which causes
some adsorption.
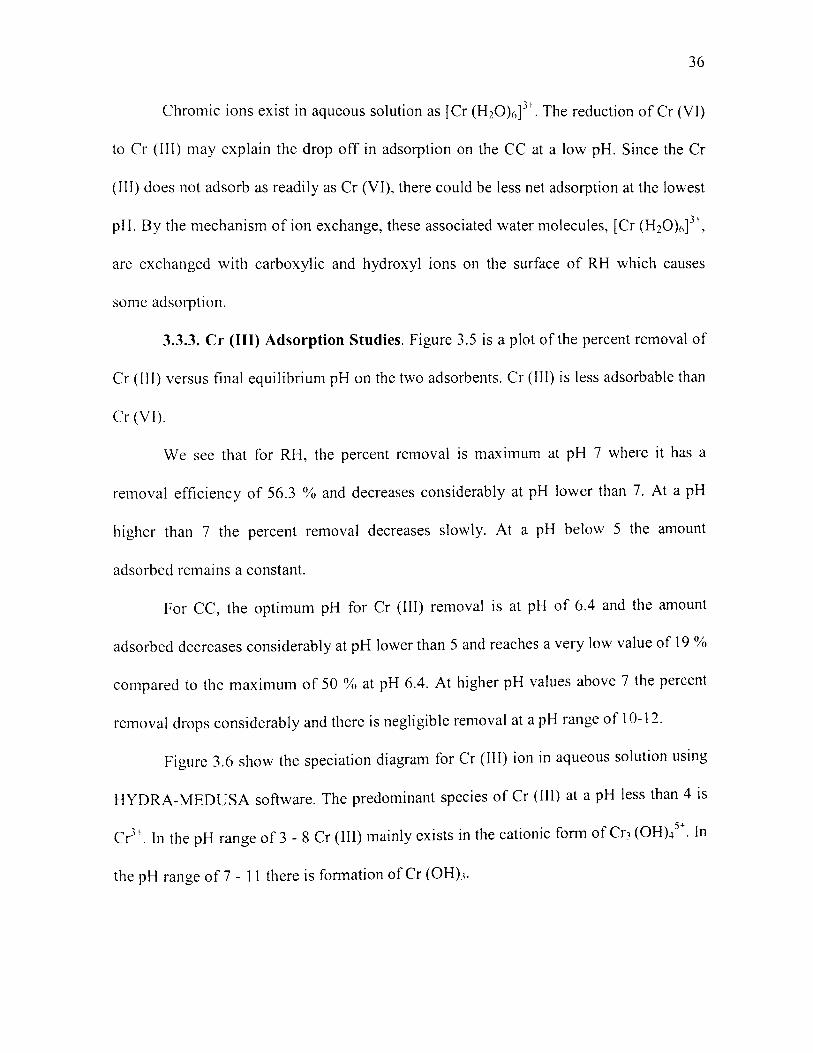
3.3.3. Cr (III) Adsorption Studies. Figure 3.5 is a plot of the percent removal of
Cr (III) versus final equilibrium pH on the two adsorbents. Cr (III) is less adsorbable than
Cr (VI).
We see that for RH, the percent removal is maximum at pH 7 where it has a
removal efficiency of 56.3 % and decreases considerably at pH lower than 7. At a pH
higher than 7 the percent removal decreases slowly. At a pH below 5 the amount
adsorbed remains a constant.
For CC, the optimum pH for Cr (III) removal is at pH of 6.4 and the amount
adsorbed decreases considerably at pH lower than 5 and reaches a very low value of 19%
compared to the maximum of 50 % at pH 6.4. At higher pH values above 7 the percent
removal drops considerably and there is negligible removal at a pH range of 10-12.
Figure 3.6 show the speciation diagram for Cr (III) ion in aqueous solution using
HYDRA-MEDUSA software. The predominant species of Cr (III) at a pH less than 4 is
Cr3+. In the pH range of 3- 8 Cr (III) mainly exists in the cationic fonn of Cr3 (OH)45'. In
the pH range of 7 - 11 there is formation of Cr (OH)J.
37
100 Cr (Ill)
80
• RH 1 -~0 • cc 1
"' • • 0 RH2 >
~ !\ £ ~•"\ •c. 0 b. CC2 E4o Q,) pHzpc RH 0::
i ~ ~· pHzpc CC
20
0 • 6 • 0 2 4 6 8 10 12
final equilibrium pH
Figure 3.5. Removal efficiency of Cr (Ill) ions by RH and CC versus the final equilibrium pH. Agitation time: 24 hrs; S/L ratio: I :30; initial nominal metal ion concentration : 20 mg/L; temperature: 23°C.
The maximum adsorption of Cr (Ill) at a pH of 6.5 is accounted for by the
e lectrostatic attraction between the negatively charged adsorbent surface (pH > 5.3 for
RH and pH > 4.3 for CC) and the cationic species Cr3 (OH)/+. Similarly, at lower pH
values, where the adsorption is observed to be minimum, there occurs electrostatic
repulsion between the positively charged adsorbent surface and the cationic species Cr3•
' hich is predominant at lower pH values. The drop in the percent removal of Cr (Ili) at a
pH higher than 6.5 is due to the formation of hydroxide of the Cr (Ill) [74). This
formation of Cr (OHh is evident from the speciation diagram.
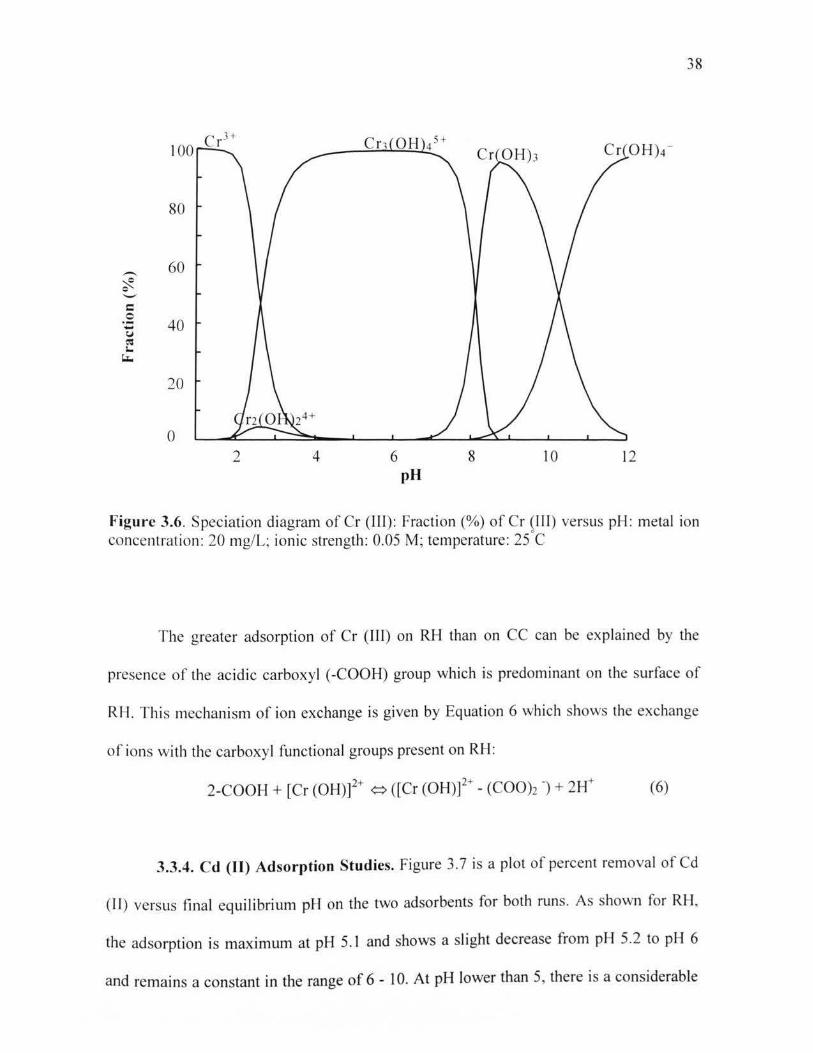
38
60
40
20
0 2 4 6 8 10 12
pH
Figure 3.6. Speciation diagram of Cr (Ill): Fraction (%) of Cr (III) versus pH: metal ion concentration: 20 mg/L; ionic strength: 0.05 M; temperature: 25°C
The greater adsorption of Cr (III) on RH than on CC can be explained by the
presence of the acid ic carboxyl ( -COOH) group which is predominant on the surface of
RH. This mechanism of ion exchange is given by Equation 6 which shows the exchange
of ions with the carboxyl functional groups present on RH:
2-COOH + [Cr (OH)]2+ <=> ([Cr (OH)]2+ - (C00)2 -) + 2H+ (6)
3.3.4. Cd (II) Adsorption Studies. Figure 3. 7 is a plot of percent removal of Cd
(II) versus final equilibrium pH on the two adsorbents for both runs. As shown for RH,
the adsorption is maximum at pH 5.1 and shows a slight decrease from pH 5.2 to pH 6
and remains a constant in the range of 6 - I 0. At pH lower than 5, there is a considerable
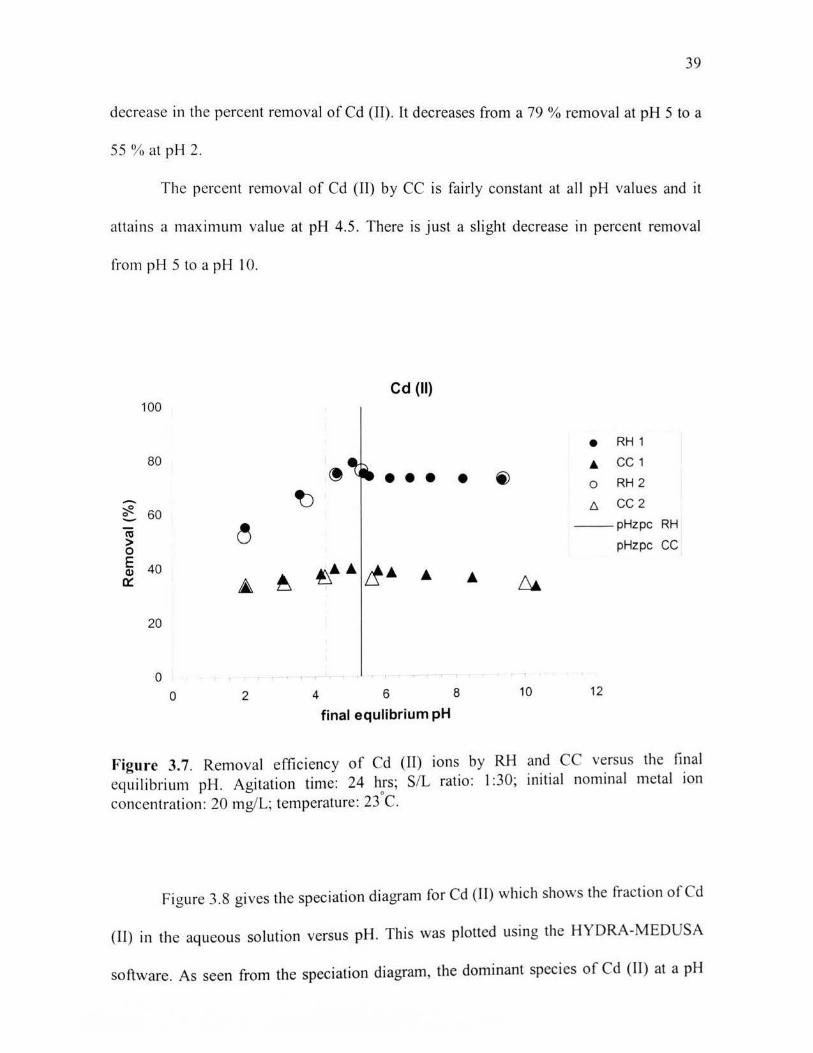
39
decrease in the percent removal of Cd (H). It decreases from a 79% removal at pH 5 to a
55% at pH 2.
The percent removal of Cd (II) by CC is fairly constant at all pH values and it
attains a maximum value at pH 4.5 . There is just a slight decrease in percent removal
from pH 5 to a pH 10.
Cd (II) 100
• RH 1
80 A. cc 1 ~ ••• • i)
0 RH 2
4b -~ 6 cc 2 0 60 ro ~
--pHzpc RH
> 0 pHzpc CC
E 40
~· If· Q) • 0:::: £ ~
20
0
0 2 4 6 8 10 12
final equlibrium pH
Figure 3. 7. Removal efficiency of Cd (II) ions by RH and CC versus the final equilibrium pH. Agitation time: 24 hrs; S/L ratio: I :30; initial nominal metal ion concentration: 20 mg/L; temperature: 23oC.
Figure 3.8 gives the speciation diagram for Cd (II) which shows the fraction ofCd
(ll) in the aqueous solution versus pH. This was plotted using the HYDRA-MEDUSA
software. As seen from the speciation diagram, the dominant species of Cd (II) at a pH
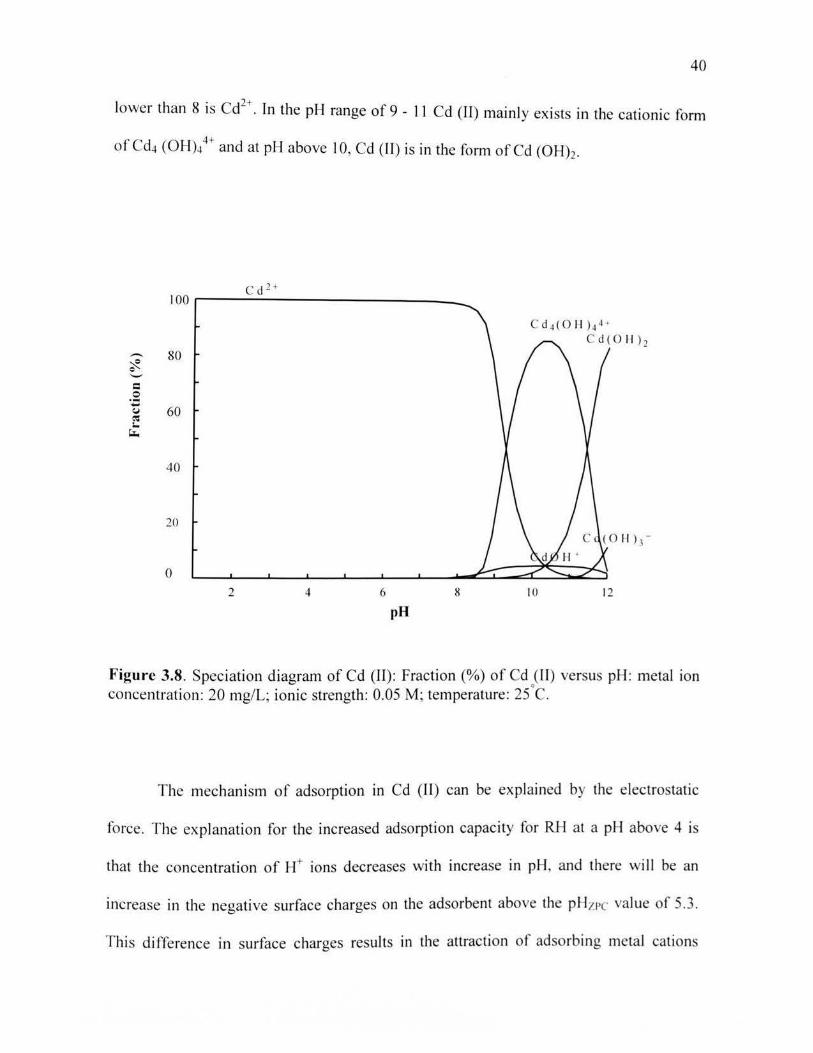
40
lower than 8 is Cd2+. In the pH range of 9 - II Cd (II) mainly exists in the cationic form
of Cd4 (OH)4 4+ and at pH above 10, Cd (II) is in the form of Cd (OH)l.
c d 2 + I 00 r--__:_-=-----------~
..-.. 80 ~ Q -= 0 - 60 CJ to: 1..
c..
40
20
0 2 4 6 8 10 12
pH
Figure 3.8. Speciation diagram of Cd (II): Fraction(%) of Cd (II) versus pH: metal ion concentration: 20 mg/L; ionic strength: 0.05 M; temperature: 25°C.
The mechanism of adsorption in Cd (II) can be explained by the electrostatic
force. The explanation for the increased adsorption capacity for RH at a pH above 4 is
that the concentration of H+ ions decreases with increase in pH, and there will be an
increase in the negative surface charges on the adsorbent above the pHzrc value of 5.3.
This difference in surface charges results in the attraction of adsorbing metal cations
41
mainly in the cationic form Cd2+ and they more easily get adsorbed onto the adsorbent
surface.
In the case of CC, whose surface is negatively charged above a pH > pHzpc i.e.
4.3, CC should have a maximum adsorption above a pH of 4.3 if the mechanism
controlling adsorption is the electrostatic attraction. From the experimental data the
maximum adsorption is taking place at a pH 4.5 which confirms that the mechanism of
electrostatic force for adsorption.
The Cd (II) adsorption on RH and CC can be also be explained by ion exchange
mechanism. The main functional groups on the surface of RH are the carboxyl and
hydroxyl groups that have cation exchange property [75] and that on the surface of CC
are the phenolic hydroxyl, carbonyl and the methoxyl groups which are responsible for
ion exchange onto their surface [76]. The mechanism taking place on RH is shown in
Equation 6.
(6)
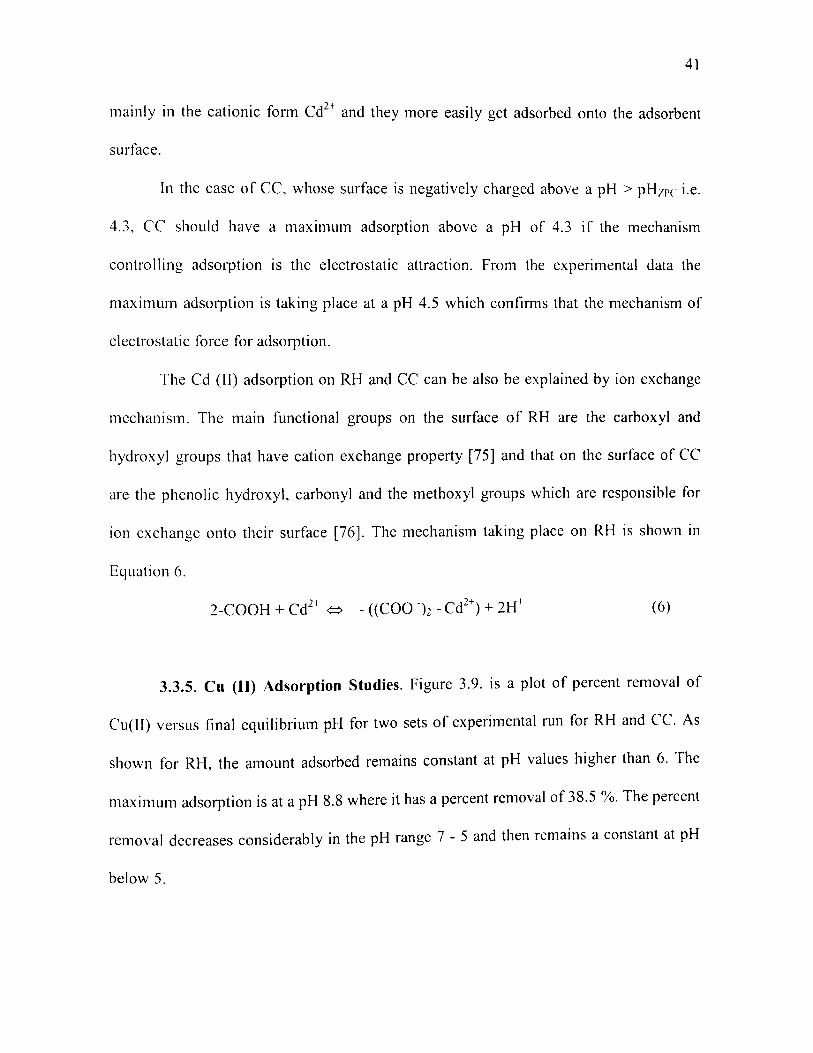
3.3.5. Cu (II) Adsorption Studies. Figure 3.9. is a plot of percent removal of
Cu(ll) versus final equilibrium pH for two sets of experimental run for RH and CC. As
shown for RH the amount adsorbed remains constant at pH values higher than 6. The '
maximum adsorption is at a pH 8.8 where it has a percent removal of 38.5 %. The percent
removal decreases considerably in the pH range 7 - 5 and then remains a constant at pH
below 5.
42
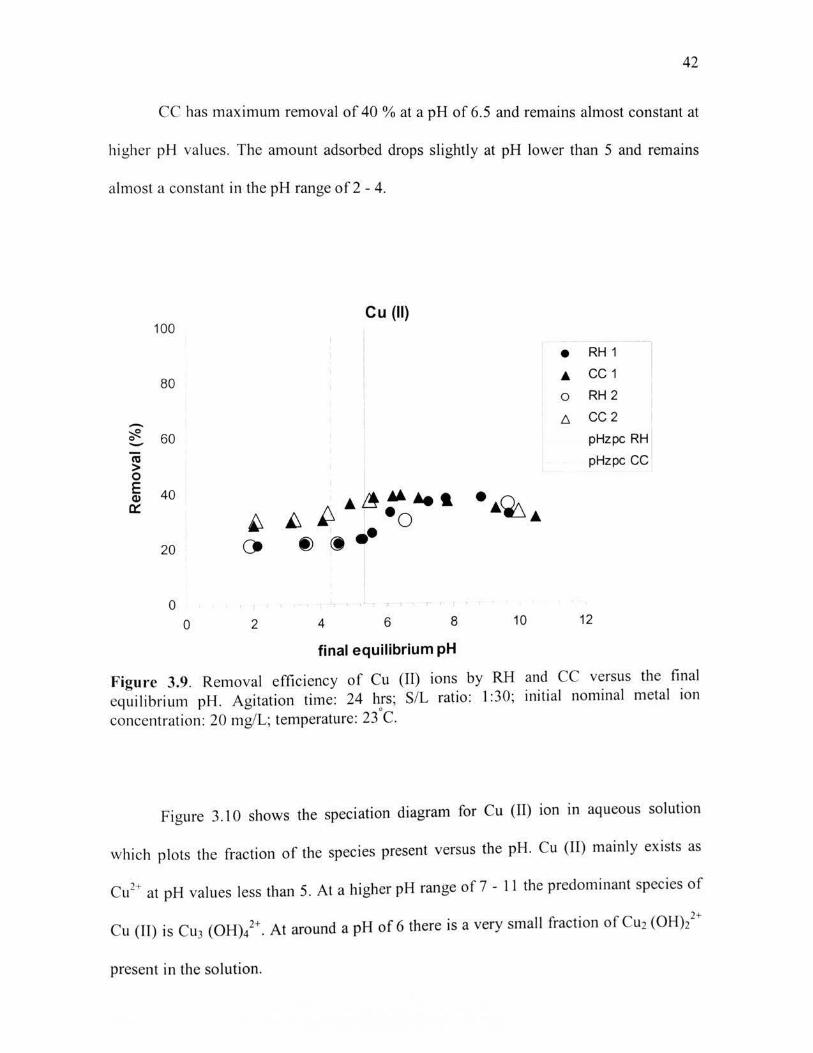
CC has maximum removal of 40 % at a pH of 6.5 and remains almost constant at
higher pH values. The amount adsorbed drops slightly at pH lower than 5 and remains
almost a constant in the pH range of2- 4.
Cu (II) 100
• RH 1
80 • cc 1
0 RH 2
- !:::. CC2
~ 60 pHzpc RH
C'O > pHzpc CC 0 E 40 ~ .~: .... (1)
··~. 0::
~ ~ 0 20 c. f) ~ ••
0 0 2 4 6 8 10 12
final equilibrium pH
Figure 3.9. Removal efficiency of Cu (II) ions by RH and CC versus the final equilibrium pH. Agitation time: 24 hrs; S/L ratio: I :30; initial nominal metal ion concentration: 20 mg/L; temperature: 23·C.
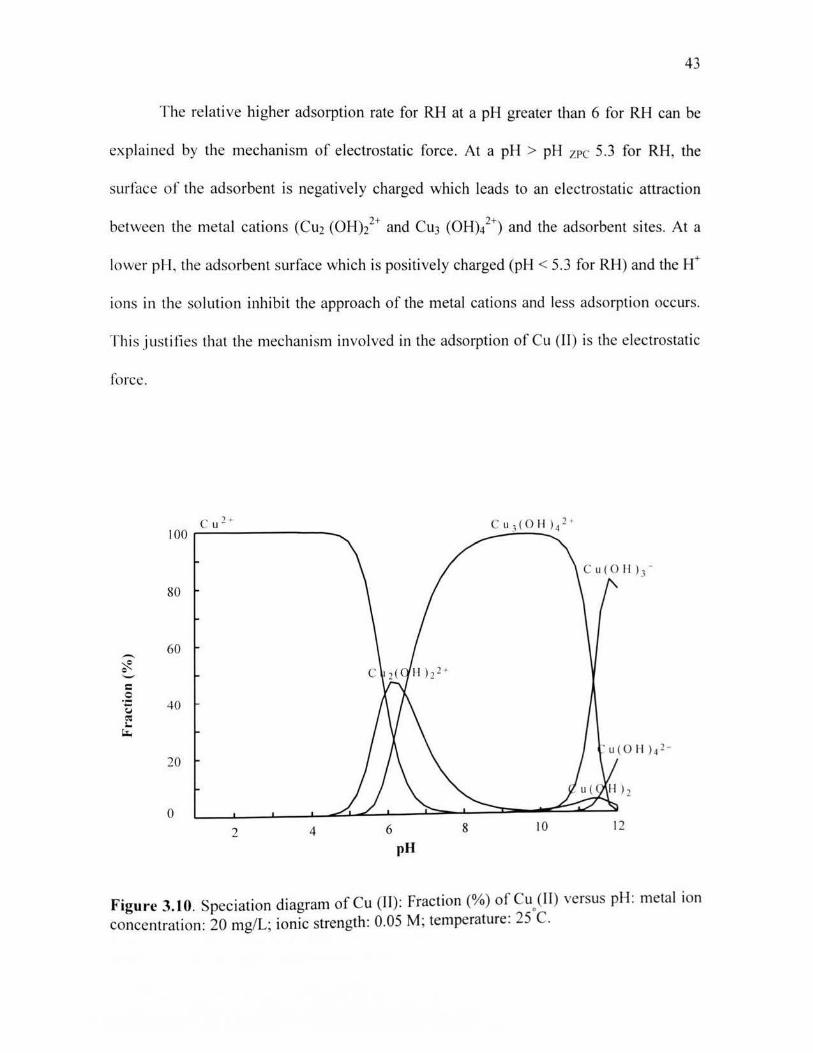
Figure 3.10 shows the speciation diagram for Cu (II) ion in aqueous solution
which plots the fraction of the species present versus the pH. Cu (II) mainly exists as
Cu2+ at pH values less than 5. At a higher pH range of 7 - 11 the predominant species of
Cu (IT) is Cu3
(OH)/+. At around a pH of 6 there is a very small fraction of Cu2 (0Hh2+
present in the solution.
43
The relative higher adsorption rate for RH at a pH greater than 6 for RH can be
explained by the mechanism of electrostatic force. At a pH > pH ZPC 5.3 for RH. the
surface of the adsorbent is negatively charged which leads to an e lectrostatic attraction
between the metal cations (Cu2 (OH)l + and Cu3 (OH)/ +) and the adsorbent sites. At a
lower pH, the adsorbent surface which is positively charged (pH < 5.3 for RH) and the H+
ions in the so lution inhibit the approach of the metal cations and less adsorption occurs.
This justifies that the mechanism involved in the adsorption of Cu (Il ) is the electrostatic
force.
c u 2+ I 00 ,...--------
80
60 ........ ~ 0 '-" c 0 ·c 40 c.J eo: 1..
'-'
20
0
2 4 6 8 10 12
pH
Figure 3. 10. Speciation diagram ofCu (II): Fraction(%) ofCu. (II) versus pH: metal ion concentration: 20 mg/L; ionic strength: 0.05 M; temperature: 25 C.
44
From the results we see that CC has greater adsorption at a pH greater than 6.
This trend can also be explained by the mechanism of electrostatic force whose surface is
negatively charged above a pH of 4.3. The cationic species of Cu (II) gets
electrostatically attracted to the negative CC surface above a pH of 4.3.
The acidic carboxylic group on RH is also responsible for adsorption of Cu (II) by
ion exchange mechanism which is shown in Equation 7:
-COOH + Cu (OHt ~ (-Coo·- Cu (OHt) + H+ (7)
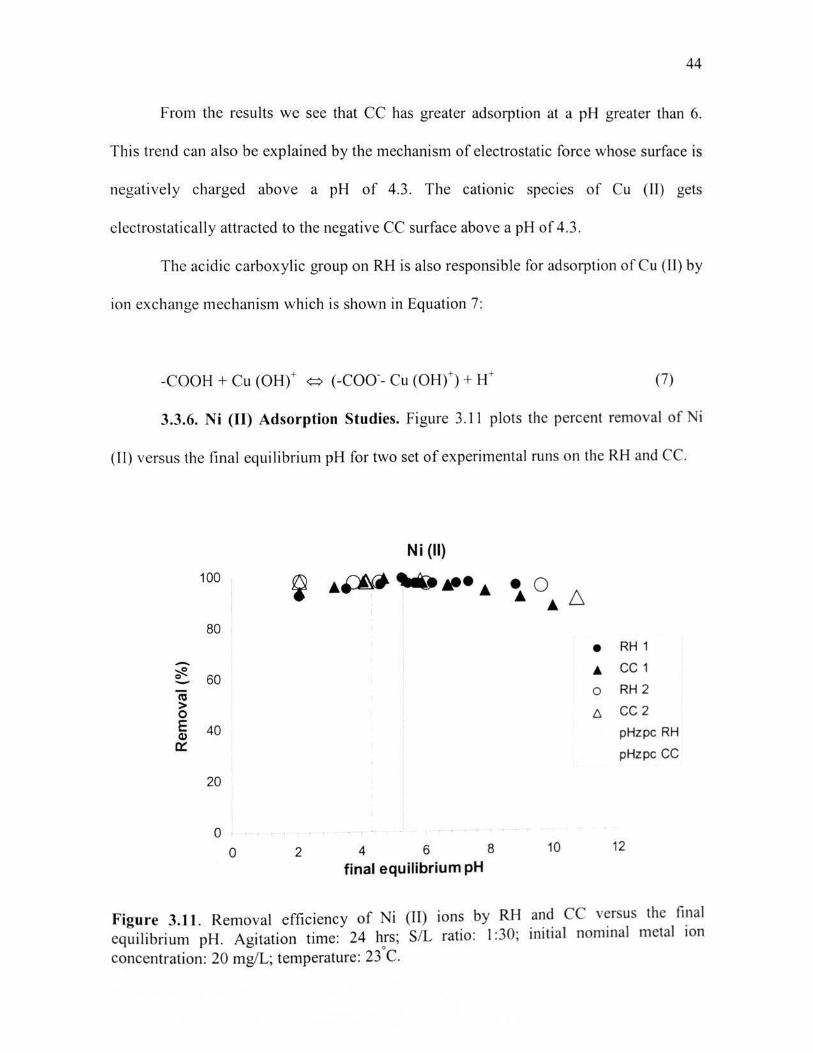
3.3.6. Ni (II) Adsorption Studies. Figure 3.11 plots the percent removal of Ni
(Il) versus the final equi librium pH for two set of experimental runs on the RH and CC.
N i (II)
100
~ .~~-·. • 0 • • 6
80
• RH 1
- cc 1 ~ A 0 60 -ns 0 RH 2 > 0 t:. CC2 E 40 pHzpc RH <I> a:: pHzpc CC
20
0
0 2 4 6 8 10 12
final equilibrium pH
Figure 3.11 . Removal efficiency of Ni (II) ions by RH an~ CC v~rsus the fi~al equilibrium pH. Agitation time: 24 h_rs; S/L ratio: l :30; init1al nom mal metal 10n
concentration: 20 mg/L; temperature: 23 C.
45
A maximum adsorption efficiency of 99.5% was obtained for Ni (II) using RH at
a pH of 5.2. At pH lower than 5 there is a slight decrease in the percent removal of Ni
(II ). ln the pH range of 5.5 - 9 the percent removal almost remained the same.
CC showed a maximum removal of 99.5 %a pH of 4.7. There was a decrease in
adsorption above a pH of 6 and it had the lowest removal of 88.0 %at a pH I 0. At pH
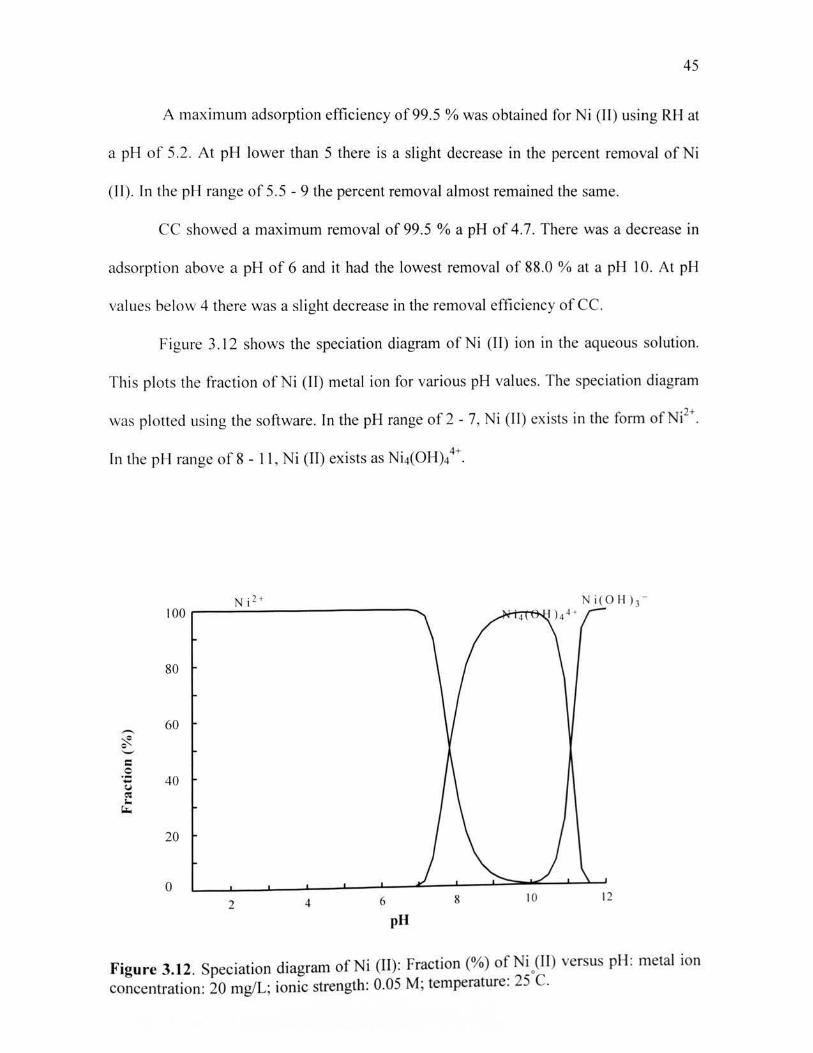
va lues below 4 there was a slight decrease in the removal efficiency of CC.
Figure 3. 12 shows the speciation diagram of Ni (II) ion in the aqueous solution.
This plots the fraction of Ni (II) metal ion for various pH values. The speciation diagram
was plotted using the software. In the pH range of 2 - 7, Ni (II) exists in the form of Ni2+.
fn the pH range of 8- 11 , Ni (II) exists as Ni4(0H)44+.
N j 2 + 100 ~-~~--------........
80
60
40
20
0 2 4 6 8 10 12
pH
Figure 3.12. Speciation diagram of Ni (II): Fraction(%) of Ni .(II) versus pH: metal ion concentration: 20 mg/L; ionic strength: 0.05 M; temperature: 25 C.
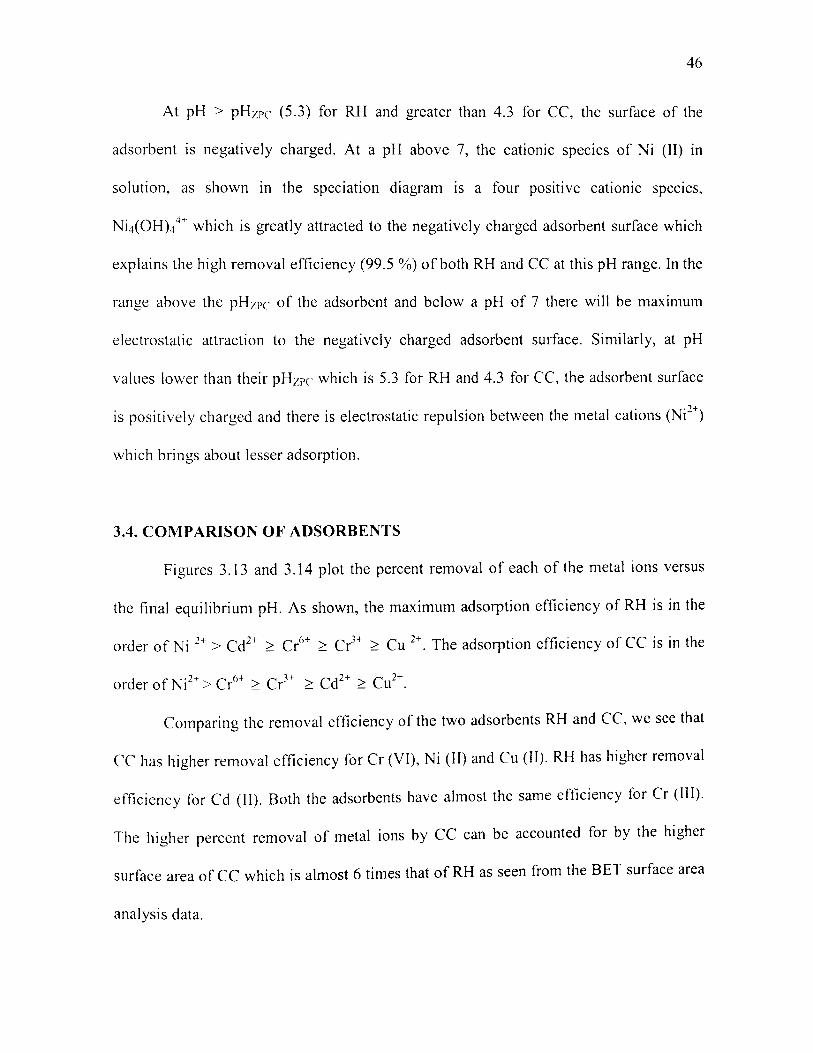
46
At pH > pHZPc (5.3) for RH and greater than 4.3 for CC, the surface of the
adsorbent is negatively charged. At a pH above 7, the cationic species of Ni (II) in
solution, as shown in the speciation diagram is a four positive cationic species,
Ni4(0H)4 4+ which is greatly attracted to the negatively charged adsorbent surface which
explains the high removal efficiency (99.5 %) ofboth RH and CC at this pH range. In the
range above the pHzpc of the adsorbent and below a pH of 7 there will be maximum
electrostatic attraction to the negatively charged adsorbent surface. Similarly, at pH
values lower than their pHzpc which is 5.3 for RH and 4.3 for CC, the adsorbent surface
is positively charged and there is electrostatic repulsion between the metal cations (Ni2+)
which brings about lesser adsorption.
3.4. COMPARISON OF ADSORBENTS
Figures 3.13 and 3.14 plot the percent removal of each of the metal ions versus
the final equilibrium pH. As shown, the maximum adsorption efficiency of RH is in the
order of Ni Z+ > Cd2+ 2 Cr6+ 2 Cr3+ 2 Cu 2
+. The adsorption efficiency of CC is in the
order ofNi2+ > Cr6+ 2 Cr3+ 2 Cd2
+ 2 Cu2+.
Comparing the removal efficiency of the two adsorbents RH and CC, we see that
CC has higher removal efficiency for Cr (VI), Ni (II) and Cu (II). RH has higher removal
efficiency for Cd (II). Both the adsorbents have almost the same efficiency for Cr (Ill).
The higher percent removal of metal ions by CC can be accounted for by the higher
surface area of CC which is almost 6 times that of RH as seen from the BET surface area
analysis data.
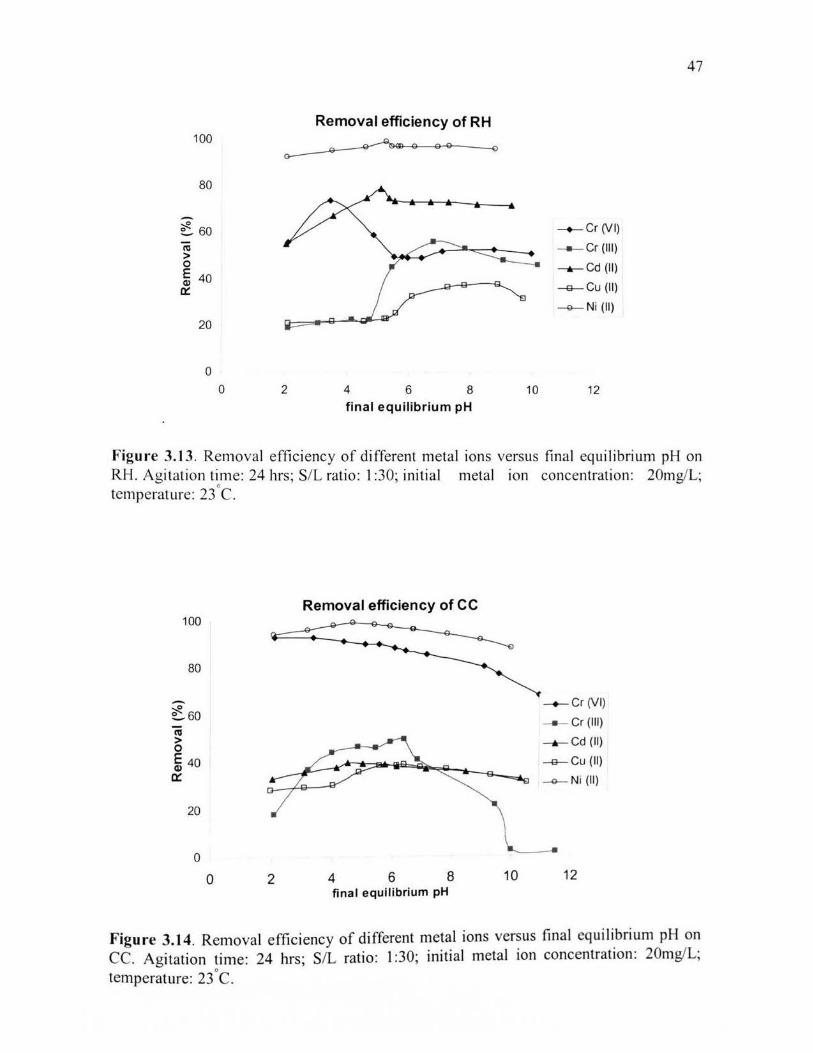
100
80
~ 60
"' > 0
~ 40 cr::
20
0 0 2
Removal efficiency of RH
4 6 8 final equilibrium pH
-+--- Cr (V I)
- cr(lll)
• ----.-- Cd (II)
-cu(ll)
- Ni (ll)
10 12
47
Figure 3.1 3. Removal efficiency of different metal ions versus final equilibrium pH on RH. Agitation time: 24 hrs; S/L ratio: 1 :30; initial metal ion concentration: 20mg!L·
Q '
temperature: 23 C.
100
80
-~60 "' > 0 E 40 Q)
cr::
20
0
0 2
Removal efficiency of CC
4 6 8 final equilibrium pH
10
-+--- Cr (VI)
- cr(lll)
_._cd (II)
-cu(ll)
-Q- Ni (ll)
12
Figure 3.14. Removal efficiency of different metal ions versus final equi librium pH on CC. Agitation time: 24 hrs; S/L ratio: I :30; initial metal ion concentration: 20mg/L; temperature: 23 o C.
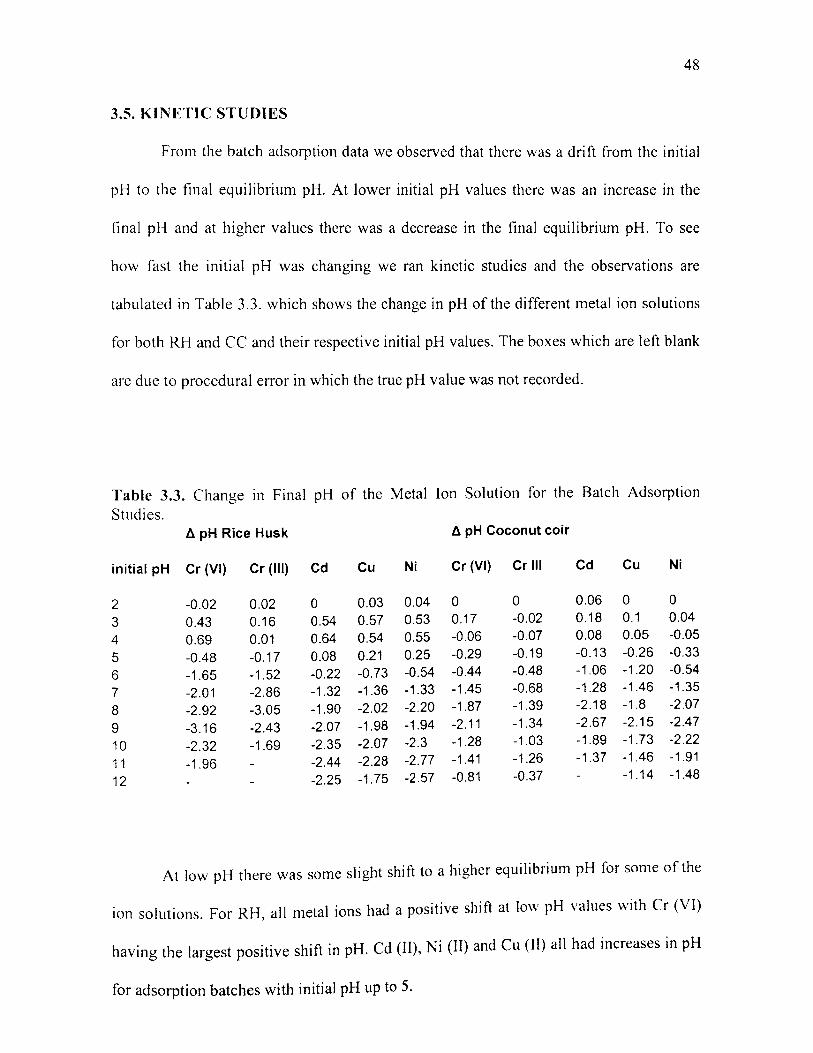
48
3.5. KINETIC STUDIES
From the batch adsorption data we observed that there was a drift from the initial
pH to the final equilibrium pH. At lower initial pH values there was an increase in the
final pH and at higher values there was a decrease in the final equilibrium pH. To see
how fast the initial pH was changing we ran kinetic studies and the observations are
tabulated in Table 3.3. which shows the change in pH of the different metal ion solutions
for both RH and CC and their respective initial pH values. The boxes which are left blank
are due to procedural error in which the true pH value was not recorded.
Table 3.3. Change in Final pH of the Metal Ion Solution for the Batch Adsorption
Studies. 11 pH Rice Husk 11 pH Coconut coir
initial pH Cr (VI) Cr (Ill) Cd Cu Ni Cr (VI) Crill Cd Cu Ni
2 -0.02 0.02 0 0.03 0.04 0 0 0.06 0 0
3 0.43 0.16 0.54 0.57 0.53 0.17 -0.02 0.18 0.1 0.04
4 0.69 0.01 0.64 0.54 0.55 -0.06 -0.07 0.08 0.05 -0.05
5 -0.48 -0.17 0.08 0.21 0.25 -0.29 -0.19 -0.13 -0.26 -0.33
6 -1.65 -1.52 -0.22 -0.73 -0.54 -0.44 -0.48 -1.06 -1.20 -0.54
7 -2.01 -2.86 -1.32 -1.36 -1.33 -1.45 -0.68 -1.28 -1.46 -1.35
8 -2.92 -3.05 -1.90 -2.02 -2.20 -1.87 -1.39 -2.18 -1.8 -2.07
9 -3.16 -2.43 -2.07 -1.98 -1.94 -2.11 -1.34 -2.67 -2.15 -2.47
10 -2.32 -1.69 -2.35 -2.07 -2.3 -1.28 -1.03 -1.89 -1.73 -2.22
11 -1.96 -2.44 -2.28 -2.77 -1.41 -1.26 -1.37 -1.46 -1.91
12 -2.25 -1.75 -2.57 -0.81 -0.37 -1.14 -1.48
At low pH there was some slight shift to a higher equilibrium pH for some of the
ion solutions. For RH, all metal ions had a positive shift at low pH values with Cr (VI)
having the largest positive shift in pH. Cd (II), Ni (II) and Cu (II) all had increases in pH
for adsorption batches with initial pH up to 5.
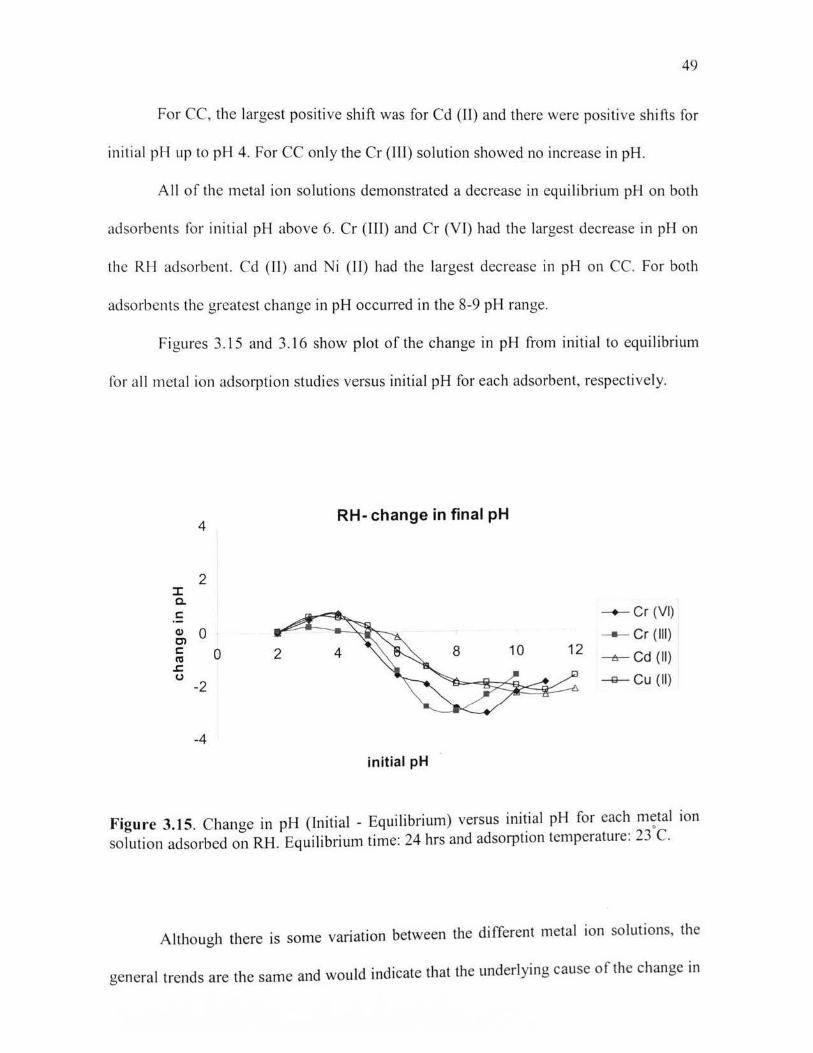
49
For CC, the largest positive shift was for Cd (II) and there were positive shifts for
initial pH up to pH 4. For CC only the Cr (TTI) solution showed no increase in pH.
All of the metal ion solutions demonstrated a decrease in equilibrium pH on both
adsorbents for initial pH above 6. Cr (III) and Cr (VI) had the largest decrease in pH on
the RH adsorbent. Cd (II) and Ni (II) had the largest decrease in pH on CC. For both
adsorbents the greatest change in pH occurred in the 8-9 pH range.
Figures 3.15 and 3.16 show plot of the change in pH from initial to equilibrium
for all metal ion adsorption studies versus initial pH for each adsorbent, respectively.
4 RH- change in final pH
2 :I: ~
c: --.- Cr (VI) Q) 0 - cr (Ill) 0'1 c: 0 --o- Cd (II) IV ~ 0 -a- Cu (II) -2
-4
initial pH
Figure 3.15. Change in pH (Initial - Equilibrium) versus initial pH for each m:tal ion solution adsorbed on RH. Equilibrium time: 24 hrs and adsorption temperature: 23 C.
Although there is some variation between the different metal ion solutions, the
general trends are the same and would indicate that the underlying cause of the change in
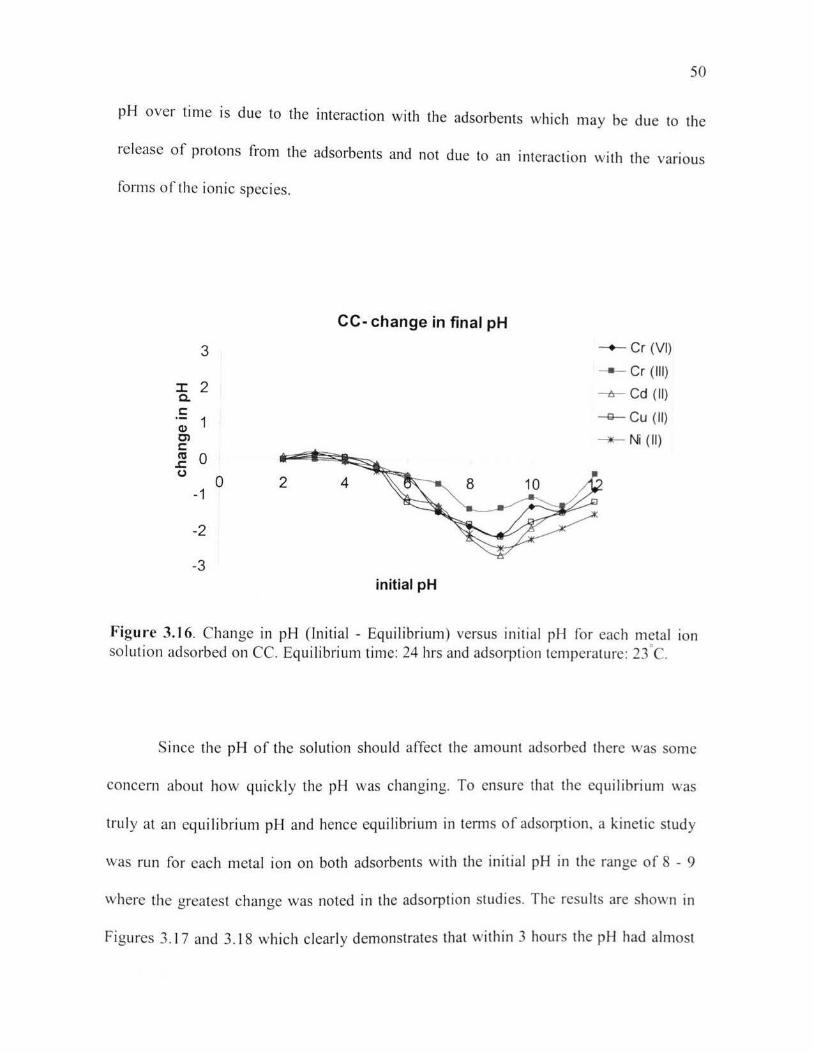
50
pH over time is due to the interaction with the adsorbents which may be due to the
release of protons from the adsorbents and not due to an interaction with the various
forms ofthe ionic species.
CC- change in final pH
3 ---+- Cr (VI)
-cr (Ill) :I: 2
---6-- Cd (II) c.. c: -e- Cu (II) C1> 1 Cl ~Ni(ll) c: C'tl 0 ..c: 0
0 -1
2 4
-2
-3 initial pH
Figure 3.1 6. Change in pH (Initial - Equilibrium) versus initial pH for each metal 10n solution adsorbed on CC. Equilibrium time: 24 hrs and adsorption temperature: 23.C.
Since the pH of the solution should affect the amount adsorbed there was some
concern about how quickly the pH was changing. To ensure that the equilibrium was
truly at an equilibrium pH and hence equilibrium in tern1s of adsorption, a kinetic study
was run for each metal ion on both adsorbents with the initial pH in the range of 8 - 9
where the greatest change was noted in the adsorption studies. The results are shown in
Figures 3.17 and 3.18 which clearly demonstrates that within 3 hours the pH had almost
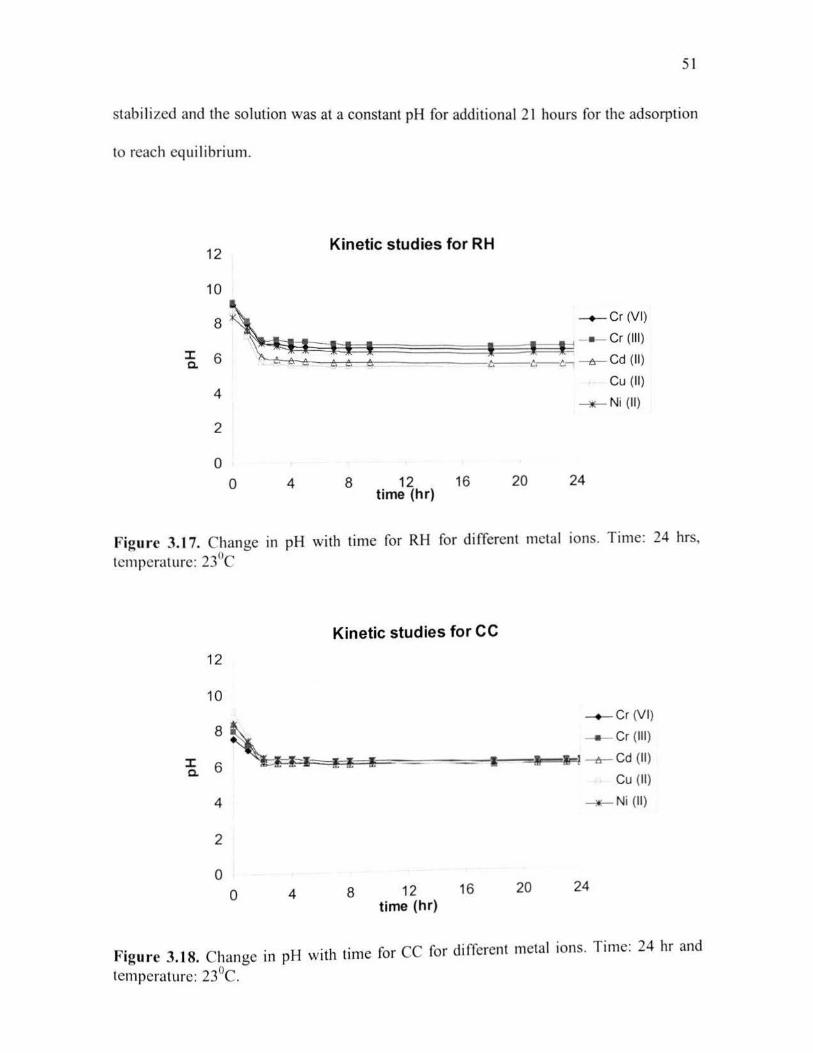
51
stabilized and the solution was at a constant pH for additional 21 hours for the adsorption
to reach equilibrium.
12 Kinetic studies for RH
10
~ :~! -+-Cr (VI)
I I I I - Cr (Ill) tr---t-. -c.- -o-Cd (II)
Cu (II)
~Ni (ll) 4
2
0
0 4 8 12 16 time (hr)
20 24
Figure 3. 17. Change in pH with time for RH for different metal ions. Time: 24 hrs, temperature: 23°C
12
10
4
2
0 0 4
Kinetic studies for CC
I
8 12 16 time (hr)
20
-+-Cr (VI)
Cr (Ill)
I 1Ft -o- Cd (II)
Cu (II)
~Ni(ll)
24
Figure 3.18. Change in pH with time for CC for different metal ions. Time: 24 hr and
temperature: 23°C.
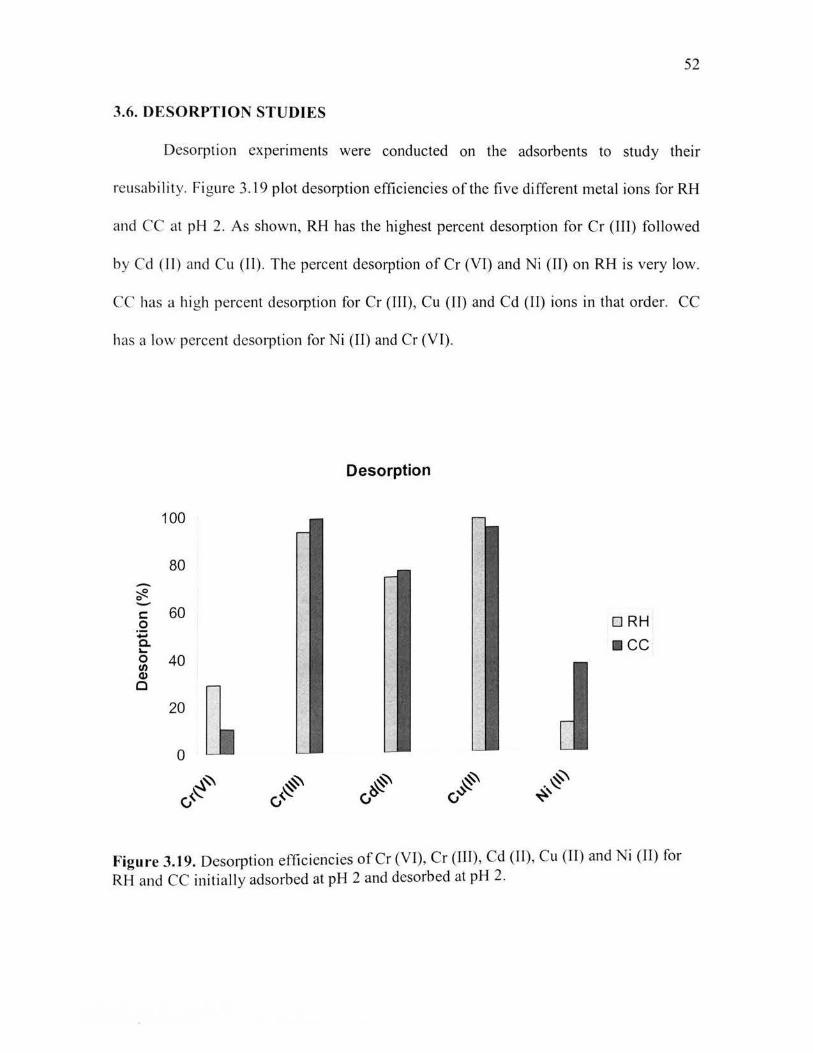
52
3.6. DESORPTION STUDIES
Desorption experiments were conducted on the adsorbents to study their
reusabi lity. Figure 3.19 plot desorption efficiencies of the five different metal ions for RH
and CC at pH 2. As shown, RH has the highest percent desorption for Cr (III) followed
by Cd (II) and Cu (I I). The percent desorption ofCr (VI) and Ni (II) on RH is very low.
CC has a high percent desorption fo r Cr (Ill), Cu (II) and Cd (II) ions in that order. CC
has a low percent desorption for Ni (II) and Cr (VI).
Desorption
100
80 -~ 0 -c 60 DRH 0 ~ c.. •cc a... 0 40 1/) (1) 0
~ 20
0
~~ v''
~ d~·
~ v~ ~ v.s . ~
~'
Figure 3. 19. Desorption efficiencies ofCr (VI), Cr (Ill), Cd (II), Cu (II) and Ni (11) for RH and CC initially adsorbed at pH 2 and desorbed at pH 2.
53
The percent desorption rates of the metal ions from the adsorbents gives us an
idea about the nature of adsorption that is happening on the surface of RH and CC.
Comparison of Figure 3.19 to Figures 3.13 and 3.14 shows that Cr (VI) and Ni (II) have
very low desorption rates for both the adsorbents at pH 2 compared to their high
percentage removal at the same pH. This means that the type of adsorption occurring here
is chemical adsorption where the adsorbates are more strongly chemically bonded to the
adsorbent surface.
Whereas, Cd (II), Cr (III) and Cu (II) have very high desorption rates obtained
with an acid solution (pH 2), which indicates that the type of adsorption here is physical
adsorption where the metals are not chemically bonded to the adsorbent surface and can
easily be desorbed.
54
4. CONCLUSIONS
The conclusions that can be drawn from the batch adsorption experiments conducted are:
•
•
•
The adsorption is pH dependent.
The zero point of charge (pHzrc) ofRH is 5.3 and that ofCC is 4.3 .
The mechanisms involved in the adsorption of the metal ions investigated are
electrostatic force and ion exchange mechanisms.
• RH has a better efficiency for Cr (VI), Ni (II) and Cd (II) where the highest removals
arc 99.5% for Ni (II), 80.0% for Cd (II) and 74.0% for Cr (VI).
• CC removes Cr (VI) and Ni (II) more efficiently than Cd (II), Cr (III) and Cu (II).
The highest percentage removals are 93.0% for Cr (VI) and 99.5 %>for Ni (II).
• Comparing the two adsorbents the percentage removal for CC is higher than RH
which maybe due to the higher surface area of CC.
• The blank studies show that the change in final equilibrium pH during the batch
experiments is due to the adsorbents.
• The kinetic study shows that the drift in pH occurs within the first 3 hours.
• Desorption studies show that RH and CC can be regenerated for reuse for the
adsorbates Cr (III), Cu (II) and Cd (II).
From the above conclusions, we see that the adsorbents we studied, RH and CC
have potential for being good metal ion sorbents for electroplating wastewater and are
good altematives, especially in developing countries since they are efficient. cheap and
easily available.
55
5. RECOMMENDATIONS
More experiments need to be conducted varying other factors such as the
adsorbent dosage, agitation time, sorbate concentration and temperature which have an
effect on the adsorption capacity so that optimum paratneters to achieve maximum
efficiency can be suggested for RH and CC.

APPENDIX A
BATCH ADSORPTION DATA - RUN 1
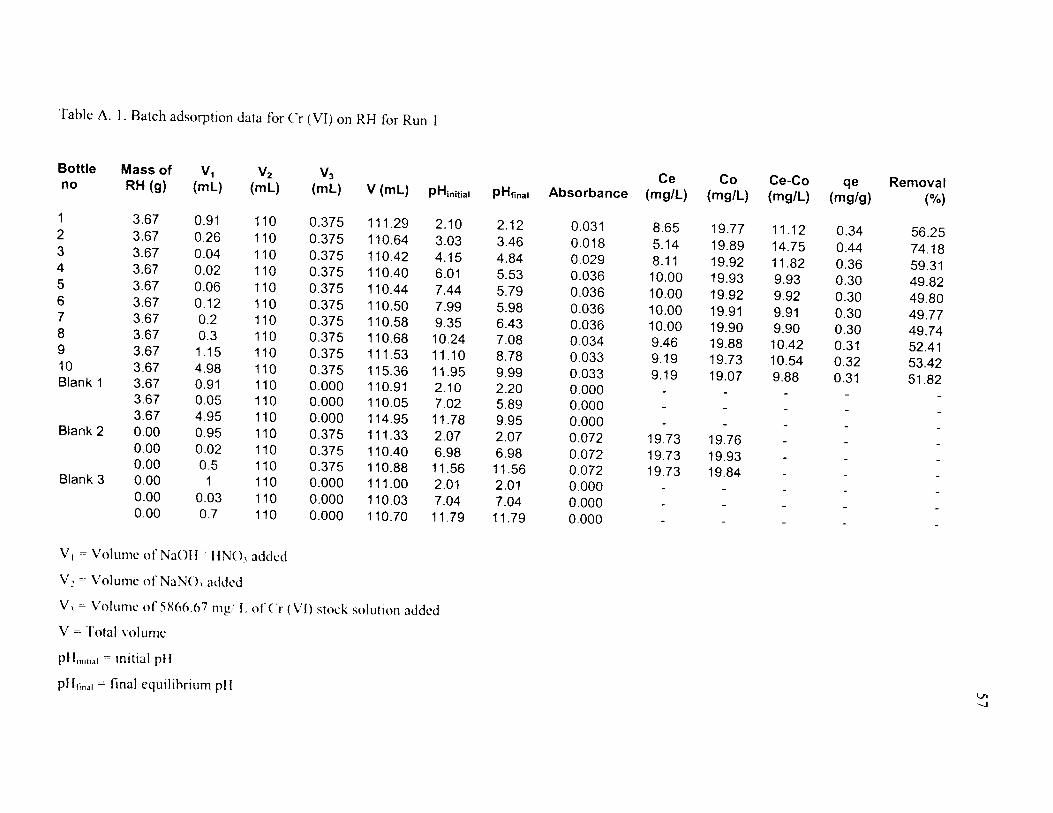
Table A. I. Batch adsorption data for Cr (VI) on RH for Run I
Bottle Mass of v1 V2 v3 Ce Co Ce-Co qe Removal no RH (g) (ml) (ml) (ml) V(ml) PH initial PH tina I Absorbance (mg/L) (mg/L) (mg/L) (mg/g) (%)
1 3.67 0.91 110 0.375 111.29 2.10 2.12 0.031 8.65 19.77 11.12 0.34 56.25 2 3.67 0.26 110 0.375 110.64 3.03 3.46 0.018 5.14 19.89 14.75 0.44 74.18 3 3.67 0.04 110 0.375 110.42 4.15 4.84 0.029 8.11 19.92 11.82 0.36 59.31 4 3.67 0.02 110 0.375 110.40 6.01 5.53 0.036 10.00 19.93 9.93 0.30 49.82 5 3.67 0.06 110 0.375 110.44 7.44 5.79 0.036 10.00 19.92 9.92 0.30 49.80 6 3.67 0.12 110 0.375 110.50 7.99 5.98 0.036 10.00 19.91 9.91 0.30 49.77 7 3.67 0.2 110 0.375 110.58 9.35 6.43 0.036 10.00 19.90 9.90 0.30 49.74 8 3.67 0.3 110 0.375 110.68 10.24 7.08 0.034 9.46 19.88 10.42 0.31 52.41 9 3.67 1.15 110 0.375 111.53 11.10 8.78 0.033 9.19 19.73 10.54 0.32 53.42 10 3.67 4.98 110 0.375 115.36 11.95 9.99 0.033 9.19 19.07 9.88 0.31 51.82 Blank 1 3.67 0.91 110 0.000 110.91 2.10 2.20 0.000 3.67 0.05 110 0.000 110.05 7.02 5.89 0.000 3.67 4.95 110 0.000 114.95 11.78 9.95 0.000
Blank 2 0.00 0.95 110 0.375 111.33 2.07 2.07 0.072 19.73 19.76 0.00 0.02 110 0.375 110.40 6.98 6.98 0.072 19.73 19.93 0.00 0.5 110 0.375 110.88 11.56 11.56 0.072 19.73 19.84 Blank 3 0.00 1 110 0.000 111.00 2.01 2.01 0.000 0.00 0.03 110 0.000 110.03 7.04 7.04 0.000 0.00 0.7 110 0.000 110.70 11.79 11.79 0.000
V 1 =Volume ofNaOII r IINO, added
V~ =Volume of NaNO, added
V, =---Volume of5X(l6.67 mg' L ofCr (V[) stock solution added
V =Total volume
pHmHtal = tnttial pH
pHtinal = final equtlihnum pll Vl ~

Table A. 2. Batch adsorption data for Cr (VI) on CC for Run 1
Mass V1 V2 v3 v Ce Co Co-Ce qe Bottle No ofCC(g) {ml) (ml) {ml) {ml) pH initial pH final Absorbance (mg/L) (mg/L) (mg/L) (mg/g) Removal(%)
1 3.67 2.60 110 0.375 112.98 2.09 2.09 0.004 1.35 19.47 18.12 0.56 93.06 2 3.67 0.90 110 0.375 111.28 3.19 3.36 0.004 1.35 19.77 18.42 0.56 93.16 3 3.67 0.20 110 0.375 110.58 4.43 4.37 0.005 1.62 19.90 18.27 0.55 91.85 4 3.67 0.50 110 0.375 110.88 5.39 5.10 0.006 1.89 19.84 17.95 0.54 90.47 5 3.67 1.10 110 0.375 111.48 6.00 5.56 0.006 1.89 19.74 17.84 0.54 90.41 6 3.67 1.80 110 0.375 112.18 7.54 6.09 0.007 2.16 19.61 17.45 0.53 88.98 7 3.67 2.30 110 0.375 112.68 8.33 6.46 0.008 2.43 19.53 17.09 0.52 87.54 8 3.67 3.50 110 0.375 113.88 9.27 7.16 0.009 2.70 19.32 16.62 0.52 86.01 9 3.67 9.00 110 0.375 119.38 10.34 9.06 0.012 3.51 18.43 14.92 0.49 80.94 10 3.67 10.00 110 0.375 120.38 10.97 9.56 0.014 4.05 18.28 14.22 0.47 77.82 11 3.67 17.00 110 0.375 127.38 11.73 10.92 0.019 5.41 17.27 11.87 0.41 68.70 Blank 1 3.67 2.70 110 0.000 112.70 2.01 2.02 0.000
3.67 1.30 110 0.000 111.30 6.94 6.01 0.000 3.67 16.50 110 0.000 126.50 11.69 10.86 0.000
Blank 2 0.00 0.95 110 0.375 111.33 2.03 2.03 0.072 19.73 19.76 0.00 0.02 110 0.375 110.40 7.05 7.05 0.072 19.73 19.93 0.00 0.50 110 0.375 110.88 11.78 11.78 0.072 19.73 19.84
Blank 3 0.00 1.00 110 0.000 111.00 2.04 2.04 0.000 0.00 0.03 110 0.000 110.03 6.97 6.97 0.000 0.00 0.70 110 0.000 110.70 11.50 11.50 0.000
V 1 = Volume of NaOH I HN03 added
V 2 = Volume of NaNO, added
V 1 =Volume of 5R66.67 mg/ L of Cr (VI) stock solution added
V =Total volume
pHiniual = initial pH
pHtinat = final equilibnum pH Vt 00
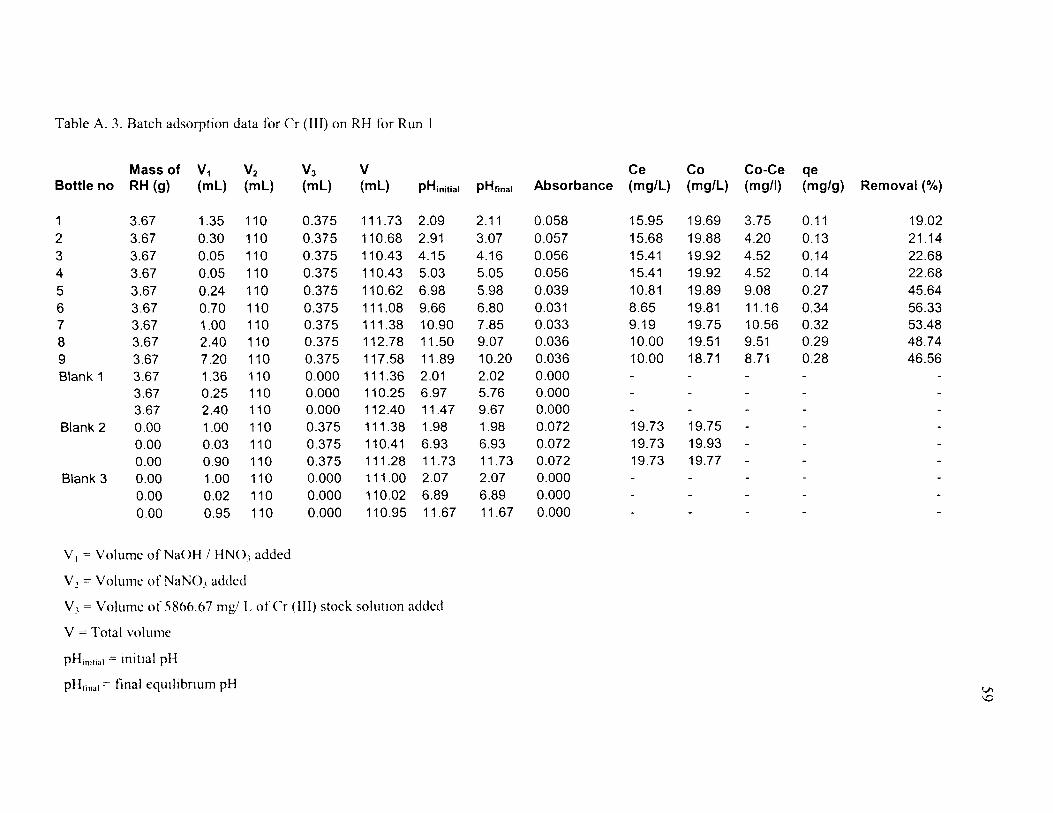
Table A. 3. Batch adsorption data for Cr (III) on RH for Run 1
Mass of V1 V2 v3 v Ce Co Co-Ce qe Bottle no RH (g) (ml) (ml) (ml) (ml) pH initial PHtinal Absorbance (mg/L) (mg/L) (mg/1) (mg/g) Removal(%)
1 3.67 1.35 110 0.375 111.73 2.09 2.11 0.058 15.95 19.69 3.75 0.11 19.02 2 3.67 0.30 110 0.375 110.68 2.91 3.07 0.057 15.68 19.88 4.20 0.13 21.14 3 3.67 0.05 110 0.375 110.43 4.15 4.16 0.056 15.41 19.92 4.52 0.14 22.68 4 3.67 0.05 110 0.375 110.43 5.03 5.05 0.056 15.41 19.92 4.52 0.14 22.68 5 3.67 0.24 110 0.375 110.62 6.98 5.98 0.039 10.81 19.89 9.08 0.27 45.64 6 3.67 0.70 110 0.375 111.08 9.66 6.80 0.031 8.65 19.81 11.16 0.34 56.33 7 3.67 1.00 110 0.375 111.38 10.90 7.85 0.033 9.19 19.75 10.56 0.32 53.48 8 3.67 2.40 110 0.375 112.78 11.50 9.07 0.036 10.00 19.51 9.51 0.29 48.74 9 3.67 7.20 110 0.375 117.58 11.89 10.20 0.036 10.00 18.71 8.71 0.28 46.56 Blank 1 3.67 1.36 110 0.000 111.36 2.01 2.02 0.000
3.67 0.25 110 0.000 110.25 6.97 5.76 0.000 3.67 2.40 110 0.000 112.40 11.47 9.67 0.000
Blank 2 0.00 1.00 110 0.375 111.38 1.98 1.98 0.072 19.73 19.75 0.00 0.03 110 0.375 110.41 6.93 6.93 0.072 19.73 19.93 0.00 0.90 110 0.375 111.28 11.73 11.73 0.072 19.73 19.77
Blank 3 0.00 1.00 110 0.000 111.00 2.07 2.07 0.000 0.00 0.02 110 0.000 110.02 6.89 6.89 0.000 0.00 0.95 110 0.000 110.95 11.67 11.67 0.000
V 1 =Volume ofNaOH I HN01 added
V :' = Volume of NaN01 added
V1 =Volume of5866.67 mg/ L ofC'r (III) stock solution added
V =Total volume
pH 111 ll,al = mitial pH
pHr;nal = final equilibrium pH Vl '-0
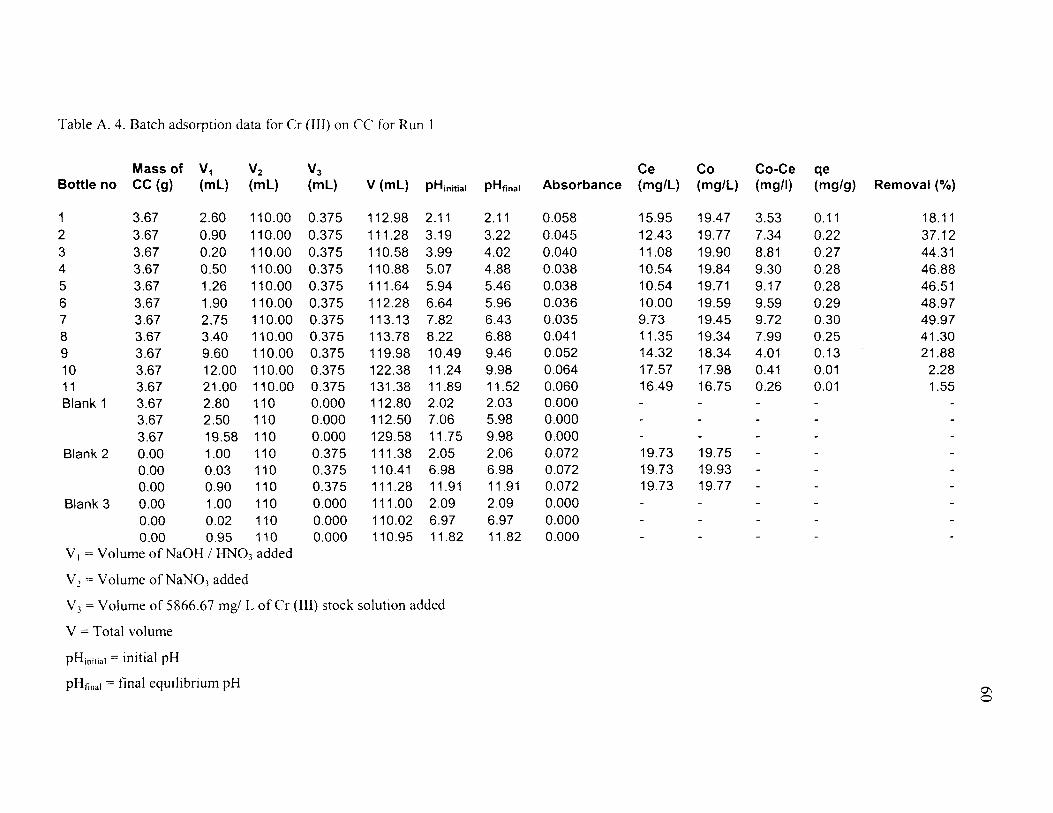
Table A. 4. Batch adsorption data for Cr (III) on CC for Run I
Mass of V1 V2 v3 Ce Co Co-Ce qe Bottle no cc (g) (ml) (ml) (ml) V (ml) pH initial pH final Absorbance (mg/L) (mg/L) (mg/1) (mg/g) Removal(%)
1 3.67 2.60 110.00 0.375 112.98 2.11 2.11 0.058 15.95 19.47 3.53 0.11 18.11 2 3.67 0.90 110.00 0.375 111.28 3.19 3.22 0.045 12.43 19.77 7.34 0.22 37.12 3 3.67 0.20 110.00 0.375 110.58 3.99 4.02 0.040 11.08 19.90 8.81 0.27 44.31 4 3.67 0.50 110.00 0.375 110.88 5.07 4.88 0.038 10.54 19.84 9.30 0.28 46.88 5 3.67 1.26 110.00 0.375 111.64 5.94 5.46 0.038 10.54 19.71 9.17 0.28 46.51 6 3.67 1.90 110.00 0.375 112.28 6.64 5.96 0.036 10.00 19.59 9.59 0.29 48.97 7 3.67 2.75 110.00 0.375 113.13 7.82 6.43 0.035 9.73 19.45 9.72 0.30 49.97 8 3.67 3.40 110.00 0.375 113.78 8.22 6.88 0.041 11.35 19.34 7.99 0.25 41.30 9 3.67 9.60 110.00 0.375 119.98 10.49 9.46 0.052 14.32 18.34 4.01 0.13 21.88 10 3.67 12.00 110.00 0.375 122.38 11.24 9.98 0.064 17.57 17.98 0.41 0.01 2.28 11 3.67 21.00 110.00 0.375 131.38 11.89 11.52 0.060 16.49 16.75 0.26 0.01 1.55 Blank 1 3.67 2.80 110 0.000 112.80 2.02 2.03 0.000
3.67 2.50 110 0.000 112.50 7.06 5.98 0.000 3.67 19.58 110 0.000 129.58 11.75 9.98 0.000
Blank 2 0.00 1.00 110 0.375 111.38 2.05 2.06 0.072 19.73 19.75 0.00 0.03 110 0.375 110.41 6.98 6.98 0.072 19.73 19.93 0.00 0.90 110 0.375 111.28 11.91 11.91 0.072 19.73 19.77
Blank 3 0.00 1.00 110 0.000 111.00 2.09 2.09 0.000 0.00 0.02 110 0.000 110.02 6.97 6.97 0.000 0.00 0.95 110 0.000 110.95 11.82 11.82 0.000
V 1 =Volume ofNaOH I HN03 added
V 2 = Volume of NaN03 added
V 3 =Volume of 5866.67 mg/ L of Cr (Ill) stock solution added
V =Total volume
pHinit1al = initial pH
pHr.naJ = final equilibrium pH 0\ 0

Table A. 5. Batch adsorption data for Cd (II) on RH for Run 1
Mass of V1 V2 v3 Ce Co Co-Ce qe Bottle No RH (g) (ml) (ml) (ml) V (ml) pH initial pH final Absorbance (mg/L) (mg/L) (mg/1) (mg/g) Removal(%)
1 3.67 1.36 110 0.375 111.74 2.05 2.05 0.132 8.80 19.69 10.89 0.33 54.47 2 3.67 0.20 110 0.375 110.58 3.03 3.57 0.107 6.48 19.90 13.41 0.40 67.07 3 3.67 0.05 110 0.375 110.43 3.99 4.63 0.090 4.91 19.92 15.02 0.45 75.08 4 3.67 0.00 110 0.375 110.38 5.01 5.09 0.082 4.17 19.93 15.77 0.47 78.83 5 3.67 0.05 110 0.375 110.43 5.60 5.38 0.090 4.91 19.92 15.02 0.45 75.08 6 3.67 0.10 110 0.375 110.48 6.88 5.56 0.093 5.19 19.91 14.73 0.44 73.64 7 3.67 0.20 110 0.375 110.58 8.03 6.13 0.094 5.28 19.90 14.62 0.44 73.09 8 3.67 0.33 110 0.375 110.71 8.80 6.73 0.094 5.28 19.87 14.59 0.44 72.97 9 3.67 0.44 110 0.375 110.82 9.66 7.31 0.094 5.28 19.85 14.58 0.44 72.88 10 3.67 0.97 110 0.375 111.35 10.68 8.24 0.095 5.37 19.76 14.39 0.44 71.94 Blank 1 3.67 1.34 110 0.000 111.34 2.03 2.04 0.000
3.67 0.15 110 0.000 110.15 7.08 5.69 0.000 3.67 1.01 110 0.000 111.01 11.69 9.87 0.000
Blank 2 0.00 1.10 110 0.375 111.48 2.05 2.05 0.250 19.72 19.74 0.00 0.02 110 0.375 110.40 6.98 6.98 0.250 19.72 19.93 0.00 0.80 110 0.375 111.18 11.56 11.56 0.250 19.72 19.79
Blank 3 0.00 1.15 110 0.000 111.15 2.04 2.04 0.000 0.00 0.02 110 0.000 110.02 6.99 6.99 0.000 0.00 0.80 110 0.000 110.80 11.78 11.78 0.000
V 1 = Volume of NaOH I HN03 added
V 2 = Volume of NaN01 added
V 1 =Volume of 5866.67 mg/ L of Cd (II) stock solution added
V =Total volume
pHinitial = initial pH
pHr.nal = final equilibrium pH 0'-
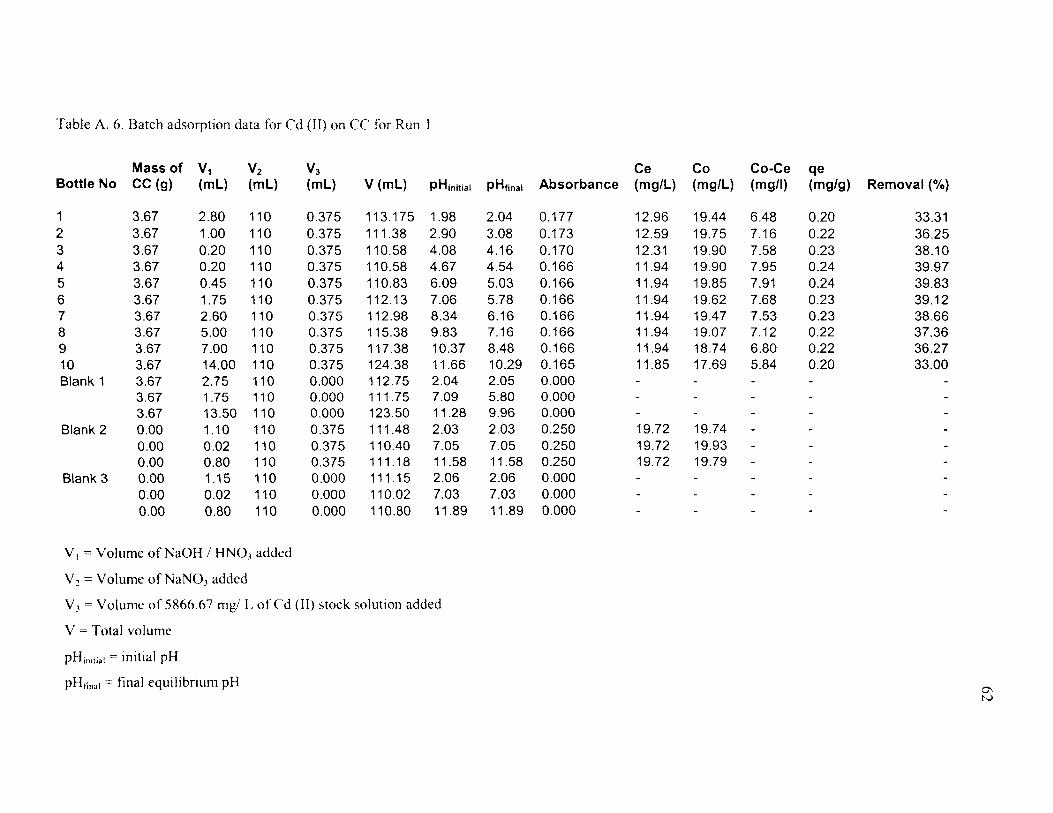
Table A. 6. Batch adsorption data for Cd (II) on CC for Run 1
Mass of V1 V2 v3 Ce Co Co-Ce qe Bottle No cc (g) (ml) (ml) (ml) V (ml) PH initial PHtinal Absorbance (mg/L) (mg/L) (mg/1) (mg/g) Removal(%)
1 3.67 2.80 110 0.375 113.175 1.98 2.04 0.177 12.96 19.44 6.48 0.20 33.31 2 3.67 1.00 110 0.375 111.38 2.90 3.08 0.173 12.59 19.75 7.16 0.22 36.25 3 3.67 0.20 110 0.375 110.58 4.08 4.16 0.170 12.31 19.90 7.58 0.23 38.10 4 3.67 0.20 110 0.375 110.58 4.67 4.54 0.166 11.94 19.90 7.95 0.24 39.97 5 3.67 0.45 110 0.375 110.83 6.09 5.03 0.166 11.94 19.85 7.91 0.24 39.83 6 3.67 1.75 110 0.375 112.13 7.06 5.78 0.166 11.94 19.62 7.68 0.23 39.12 7 3.67 2.60 110 0.375 112.98 8.34 6.16 0.166 11.94 19.47 7.53 0.23 38.66 8 3.67 5.00 110 0.375 115.38 9.83 7.16 0.166 11.94 19.07 7.12 0.22 37.36 9 3.67 7.00 110 0.375 117.38 10.37 8.48 0.166 11.94 18.74 6.80 0.22 36.27 10 3.67 14.00 110 0.375 124.38 11.66 10.29 0.165 11.85 17.69 5.84 0.20 33.00 Blank 1 3.67 2.75 110 0.000 112.75 2.04 2.05 0.000
3.67 1.75 110 0.000 111.75 7.09 5.80 0.000 3.67 13.50 110 0.000 123.50 11.28 9.96 0.000
Blank 2 0.00 1.10 110 0.375 111.48 2.03 2.03 0.250 19.72 19.74 0.00 0.02 110 0.375 110.40 7.05 7.05 0.250 19.72 19.93 0.00 0.80 110 0.375 111.18 11.58 11.58 0.250 19.72 19.79
Blank 3 0.00 1.15 110 0.000 111.15 2.06 2.06 0.000 0.00 0.02 110 0.000 110.02 7.03 7.03 0.000 0.00 0.80 110 0.000 110.80 11.89 11.89 0.000
V 1 =Volume ofNaOH I HN03 added
V~ =Volume ofNaN03 added
V 3 =Volume of5866.67 mg/ L ofCd {II) stock solution added
V =Total volume
pHmitial = initial pH
pHfinal = final equilibrium pH 0\ N

Table A. 7. Batch adsorption data for Cu (II) on RH for Run 1
Mass of V1 V2 v3 Ce Co Co-Ce qe Bottle No RH (g) (ml) (ml) (ml) V (ml) pH initial PH tina I Absorbance (mg/L) (mg/L) (mg/1) (mg/g) Removal(%)
1 3.67 1.20 110 0.375 111.58 2.08 2.11 0.137 15.55 19.72 4.17 0.13 21.15 2 3.67 0.20 110 0.375 110.58 2.95 3.52 0.137 15.55 19.90 4.35 0.13 21.86 3 3.67 0.05 110 0.375 110.43 4.00 4.54 0.137 15.55 19.92 4.38 0.13 21.97 4 3.67 0.03 110 0.375 110.41 5.01 5.22 0.135 15.31 19.93 4.61 0.14 23.15 5 3.67 0.05 110 0.375 110.43 6.02 5.29 0.135 15.31 19.92 4.61 0.14 23.13 6 3.67 0.10 110 0.375 110.48 6.93 5.57 0.131 14.85 19.91 5.07 0.15 25.44 7 3.67 0.28 110 0.375 110.66 8.14 6.12 0.118 13.34 19.88 6.54 0.20 32.92 8 3.67 0.56 110 0.375 110.94 9.25 7.27 0.111 12.52 19.83 7.31 0.22 36.85 9 3.67 0.80 110 0.375 111.18 9.87 7.80 0.109 12.29 19.79 7.50 0.23 37.89 10 3.67 2.00 110 0.375 112.38 11.16 8.88 0.107 12.06 19.58 7.52 0.23 38.41 11 3.67 4.45 110 0.375 114.83 11.45 9.70 0.115 12.99 19.16 6.17 0.19 32.21 Blank 1 3.67 1.15 110 0.000 111.15 2.02 2.03 0.000
3.67 0.09 110 0.000 110.09 6.96 5.58 0.000 3.67 5.10 110 0.000 115.10 11.67 9.85 0.000
Blank 2 0.00 1.10 110 0.375 111.48 2.04 2.04 0.173 19.73 19.74 0.00 0.03 110 0.375 110.41 7.00 7.00 0.174 19.85 19.93 0.00 0.95 110 0.375 111.33 11.86 11.86 0.173 19.73 19.76
Blank 3 0.00 1.10 110 0.000 111.10 2.03 2.03 0.000 0.00 0.03 110 0.000 110.03 7.06 7.06 0.000 0.00 0.95 110 0.000 110.95 11.84 11.84 0.000
V 1 =Volume ofNaOH I HN03 added
V 2 = Volume of NaN03 added
V 3 = Volume of 5866.67 mg/ L of Cu (II) stock solution added
V =Total volume
pH;nitial = initial pH
pHfinal = final equilibrium pH 0\ w

Table A. 8. Batch adsorption data for Cu (II) on CC for Run 1
Mass of V1 V2 v3 v Ce Co Co-Ce qe Bottle No cc (g) (ml) (ml) (ml) (ml) pH initial PH tina I Absorbance (mg/L) (mg/L) (mg/1) (mg/g) Removal(%)
1 3.67 2.60 110 0.375 112.98 1.98 1.98 0.123 13.92 19.47 5.55 0.17 28.52 2 3.67 0.50 110 0.375 110.88 3.00 3.10 0.123 13.92 19.84 5.92 0.18 29.85 3 3.67 0.20 110 0.375 110.58 4.00 4.05 0.122 13.80 19.90 6.09 0.18 30.63 4 3.67 0.50 110 0.375 110.88 5.15 4.89 0.112 12.64 19.84 7.20 0.22 36.30 5 3.67 1.30 110 0.375 111.68 6.79 5.59 0.107 12.06 19.70 7.64 0.23 38.79 6 3.67 2.00 110 0.375 112.38 7.62 6.16 0.106 11.94 19.58 7.64 0.23 39.00 7 3.67 2.50 110 0.375 112.88 8.22 6.42 0.105 11.83 19.49 7.67 0.24 39.33 8 3.67 3.50 110 0.375 113.88 9.13 6.98 0.106 11.94 19.32 7.38 0.23 38.19 9 3.67 5.00 110 0.375 115.38 9.56 7.83 0.106 11.94 19.07 7.13 0.22 37.37 10 3.67 8.80 110 0.375 119.18 10.77 9.31 0.107 12.06 18.46 6.40 0.21 34.68
11 3.67 15.00 110 0.375 125.38 11.65 10.51 0.107 12.06 17.55 5.49 0.19 31.28 Blank 1 3.67 2.55 110 0.000 112.55 2.00 2.01 0.000
3.67 1.40 110 0.000 111.40 6.95 5.68 0.000 3.67 15.00 110 0.000 125.00 11.67 10.02 0.000
Blank 2 0.00 1.10 110 0.375 111 .48 2.04 2.04 0.173 19.73 19.74 0.00 0.03 110 0.375 110.41 6.98 6.98 0.174 19.85 19.93 0.00 0.95 110 0.375 111.33 11.78 11.78 0.173 19.73 19.76
Blank 3 0.00 1.10 110 0.000 111.10 2.03 2.03 0.000 0.00 0.03 110 0.000 110.03 7.07 7.07 0.000 0.00 0.95 110 0.000 110.95 11.95 11.95 0.000
V, 'Volume ofNaOII 1 IINO, added
v.' .C Vnlumt• nfl\aNO, added
\', Volume of ~Xhh.h7 mg. of ( ·u (II) stm:k solution added
v Total volume
pflllliiiJI ,. Jnl(lal pfl
pfltlnJI c' final Cljtlll!hnum pli =-~
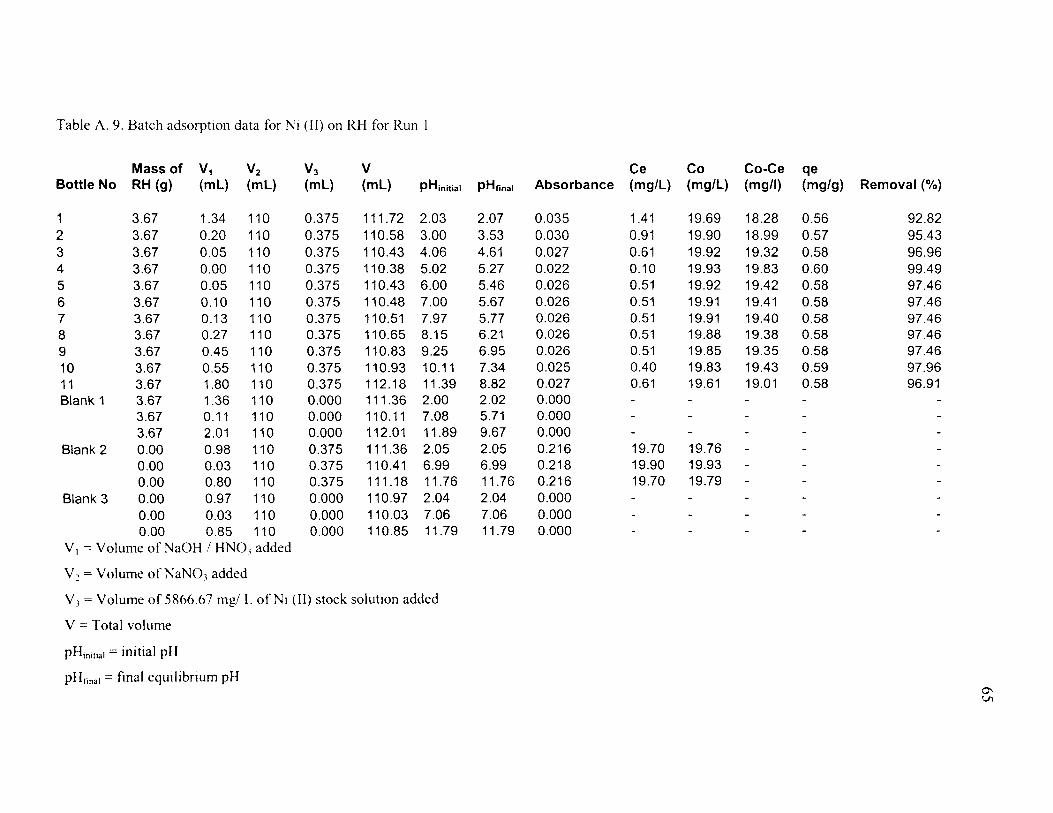
Table A. 9. Batch adsorption data for Ni (II) on RH for Run I
Mass of V1 V2 v3 v Ce Co Co-Ce qe Bottle No RH (g) (ml) (mL) (ml) (ml) pH initial PHr.nal Absorbance (mg/L) (mg/L) (mg/1) (mg/g) Removal(%)
1 3.67 1.34 110 0.375 111.72 2.03 2.07 0.035 1.41 19.69 18.28 0.56 92.82 2 3.67 0.20 110 0.375 110.58 3.00 3.53 0.030 0.91 19.90 18.99 0.57 95.43 3 3.67 0.05 110 0.375 110.43 4.06 4.61 0.027 0.61 19.92 19.32 0.58 96.96 4 3.67 0.00 110 0.375 110.38 5.02 5.27 0.022 0.10 19.93 19.83 0.60 99.49 5 3.67 0.05 110 0.375 110.43 6.00 5.46 0.026 0.51 19.92 19.42 0.58 97.46 6 3.67 0.10 110 0.375 110.48 7.00 5.67 0.026 0.51 19.91 19.41 0.58 97.46 7 3.67 0.13 110 0.375 110.51 7.97 5.77 0.026 0.51 19.91 19.40 0.58 97.46 8 3.67 0.27 110 0.375 110.65 8.15 6.21 0.026 0.51 19.88 19.38 0.58 97.46 9 3.67 0.45 110 0.375 110.83 9.25 6.95 0.026 0.51 19.85 19.35 0.58 97.46 10 3.67 0.55 110 0.375 110.93 10.11 7.34 0.025 0.40 19.83 19.43 0.59 97.96 11 3.67 1.80 110 0.375 112.18 11.39 8.82 0.027 0.61 19.61 19.01 0.58 96.91 Blank 1 3.67 1.36 110 0.000 111.36 2.00 2.02 0.000
3.67 0.11 110 0.000 110.11 7.08 5.71 0.000 3.67 2.01 110 0.000 112.01 11.89 9.67 0.000
Blank 2 0.00 0.98 110 0.375 111.36 2.05 2.05 0.216 19.70 19.76 0.00 0.03 110 0.375 110.41 6.99 6.99 0.218 19.90 19.93 0.00 0.80 110 0.375 111.18 11.76 11.76 0.216 19.70 19.79
Blank 3 0.00 0.97 110 0.000 110.97 2.04 2.04 0.000 0.00 0.03 110 0.000 110.03 7.06 7.06 0.000 0.00 0.85 110 0.000 110.85 11.79 11.79 0.000
V 1 =Volume ofNaOH I HN03 added
V2 =Volume ofNaN03 added
V 3 =Volume of 5866.67 mg/ L ofNi (II) stock solution added
V =Total volume
pHmit1at =initial pH
pHfinal = final equilibrium pH ~ Vl
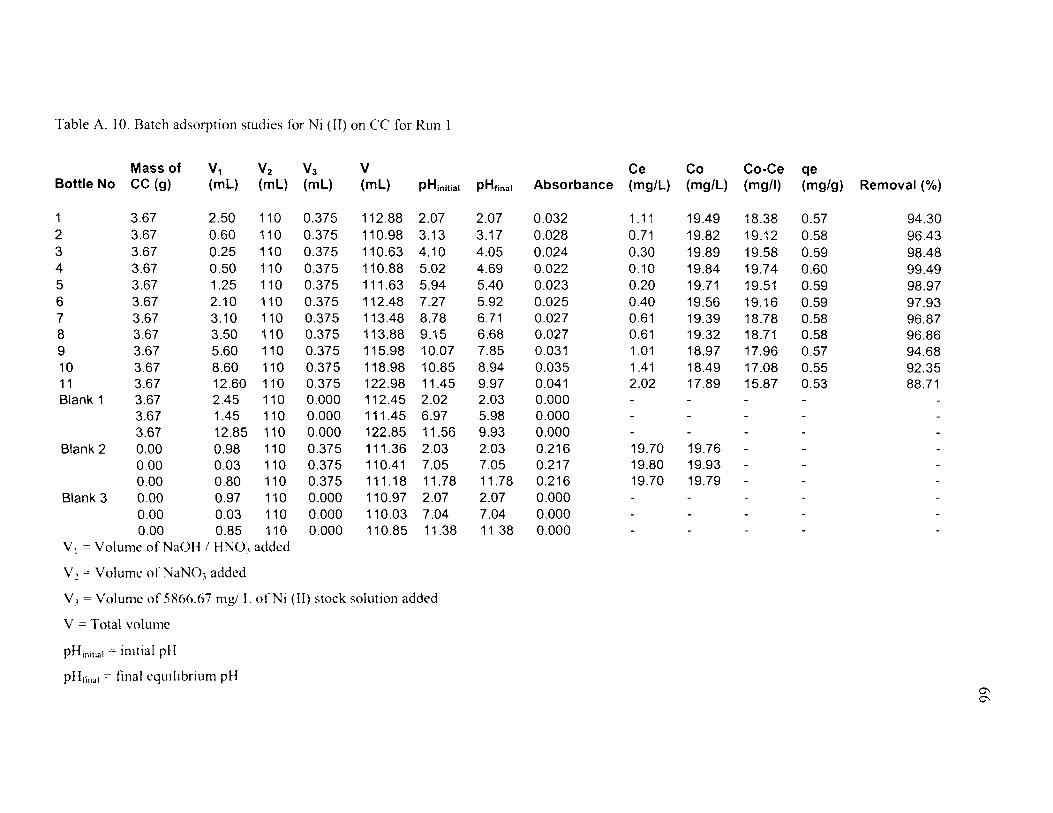
Table A. 10. Batch adsorption studies for Ni (II) on CC for Run 1
Mass of V1 V2 v3 v Ce Co Co-Ce qe Bottle No cc (g) (ml) (ml) (ml) (ml) pH initial PHtinal Absorbance (mg/L) (mg/L) (mg/1) (mg/g) Removal(%)
3.67 2.50 110 0.375 112.88 2.07 2.07 0.032 1 .11 19.49 18.38 0.57 94.30 2 3.67 0.60 110 0.375 110.98 3.13 3.17 0.028 0.71 19.82 19.12 0.58 96.43 3 3.67 0.25 110 0.375 110.63 4.10 4.05 0.024 0.30 19.89 19.58 0.59 98.48 4 3.67 0.50 110 0.375 110.88 5.02 4.69 0.022 0.10 19.84 19.74 0.60 99.49 5 3.67 1.25 110 0.375 111.63 5.94 5.40 0.023 0.20 19.71 19.51 0.59 98.97 6 3.67 2.10 110 0.375 112.48 7.27 5.92 0.025 0.40 19.56 19.16 0.59 97.93 7 3.67 3.10 110 0.375 113.48 8.78 6.71 0.027 0.61 19.39 18.78 0.58 96.87 8 3.67 3.50 110 0.375 113.88 9.15 6.68 0.027 0.61 19.32 18.71 0.58 96.86 9 3.67 5.60 110 0.375 115.98 10.07 7.85 0.031 1.01 18.97 17.96 0.57 94.68 10 3.67 8.60 110 0.375 118.98 10.85 8.94 0.035 1.41 18.49 17.08 0.55 92.35 11 3.67 12.60 110 0.375 122.98 11.45 9.97 0.041 2.02 17.89 15.87 0.53 88.71 Blank 1 3.67 2.45 110 0.000 112.45 2.02 2.03 0.000
3.67 1.45 110 0.000 111.45 6.97 5.98 0.000 3.67 12.85 110 0.000 122.85 11.56 9.93 0.000
Blank 2 0.00 0.98 110 0.375 111.36 2.03 2.03 0.216 19.70 19.76 0.00 0.03 110 0.375 110.41 7.05 7.05 0.217 19.80 19.93 0.00 0.80 110 0.375 111.18 11.78 11.78 0.216 19.70 19.79
Blank 3 0.00 0.97 110 0.000 110.97 2.07 2.07 0.000 0.00 0.03 110 0.000 110.03 7.04 7.04 0.000 0.00 0.85 110 0.000 110.85 11.38 11.38 0.000
V 1 = Volume of NaOH I HN03 added
V~ =Volume ofNaNO, added
V 1 =Volume of 5R66.67 mg/ L ofNi (II) stock solution added
V =Total volume
pHmit~al = initial pH
pHfinal = final equilibrium pH
"" ""

APPENDIX B
BATCH ADSORPTION OAT A - RUN 2
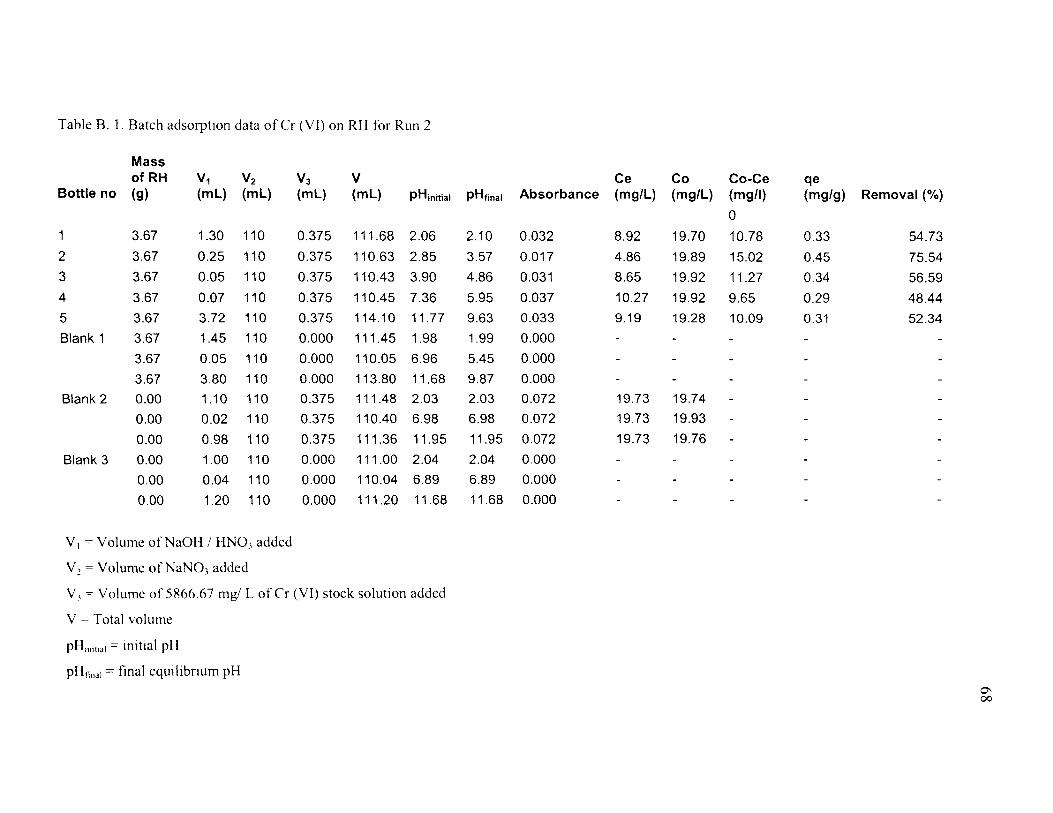
Table B. 1. Batch adsorption data ofCr (VI) on RH for Run 2
Mass ofRH V1 v2 v3 v Ce Co Co-Ce qe
Bottle no (g) (ml) (ml) (ml) (ml) pH initial pH final Absorbance (mg/L) (mg/L) (mg/1) (mg/g) Removal(%)
0
1 3.67 1.30 110 0.375 111.68 2.06 2.10 0.032 8.92 19.70 10.78 0.33 54.73
2 3.67 0.25 110 0.375 110.63 2.85 3.57 0.017 4.86 19.89 15.02 0.45 75.54
3 3.67 0.05 110 0.375 110.43 3.90 4.86 0.031 8.65 19.92 11.27 0.34 56.59
4 3.67 0.07 110 0.375 110.45 7.36 5.95 0.037 10.27 19.92 9.65 0.29 48.44
5 3.67 3.72 110 0.375 114.10 11.77 9.63 0.033 9.19 19.28 10.09 0.31 52.34
Blank 1 3.67 1.45 110 0.000 111.45 1.98 1.99 0.000
3.67 0.05 110 0.000 110.05 6.96 5.45 0.000
3.67 3.80 110 0.000 113.80 11.68 9.87 0.000
Blank 2 0.00 1.10 110 0.375 111.48 2.03 2.03 0.072 19.73 19.74
0.00 0.02 110 0.375 110.40 6.98 6.98 0.072 19.73 19.93
0.00 0.98 110 0.375 111.36 11.95 11.95 0.072 19.73 19.76
Blank 3 0.00 1.00 110 0.000 111.00 2.04 2.04 0.000
0.00 0.04 110 0.000 110.04 6.89 6.89 0.000
0.00 1.20 110 0.000 111.20 11.68 11.68 0.000
V 1 = Volume of NaOH I HN03 added
V 2 = Volume of NaN03 added
V, = Volume of 5866.6 7 mg/ L of Cr (VI) stock solution added
V =Total volume
pHmittal = initial pH
pH1inai = final equilibnum pH
"' 00
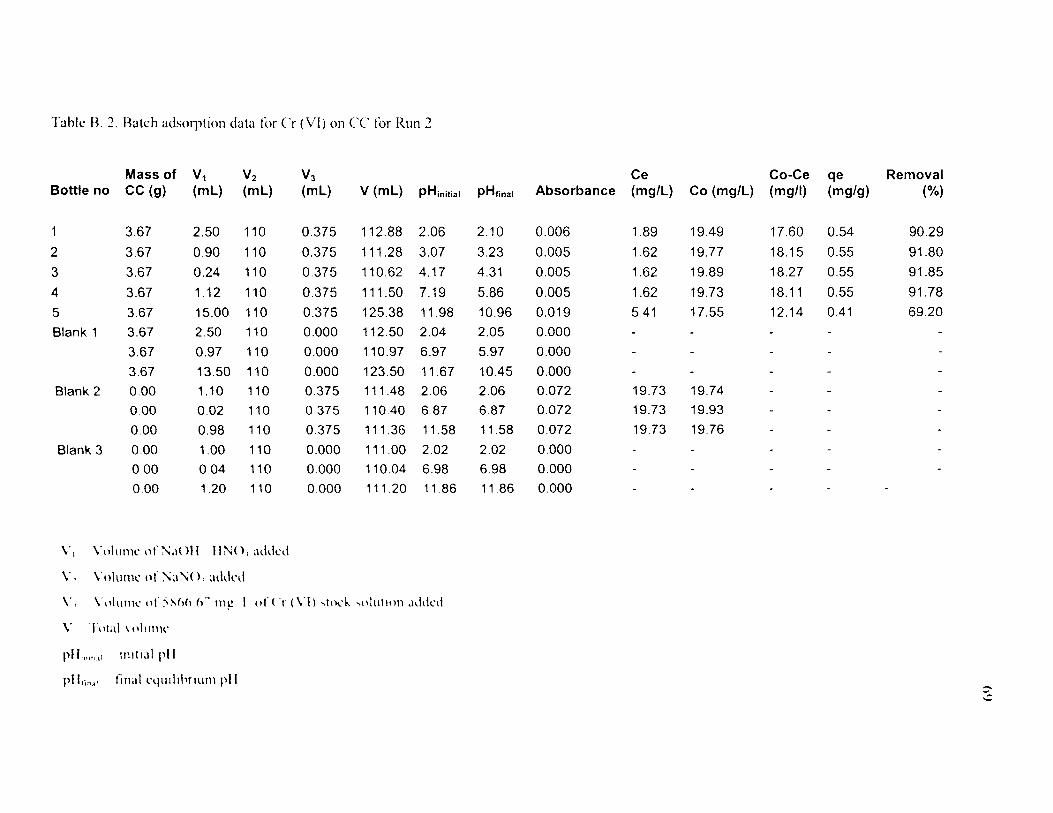
Table B. 2. Batch adsoq.1tion data for Cr (VI) on CC for Run 2
Mass of V1 V2 Bottle no cc (g) (ml) (ml)
1 3.67 2.50 110
2 3.67 0.90 110
3 3.67 0.24 110
4 3.67 1.12 110
5 3.67 15.00 110
Blank 1 3.67 2.50 110
3.67 0.97 110
3.67 13.50 110
Blank 2 0.00 1.10 110
0.00 0.02 110
0 00 0.98 110
Blank 3 0.00 1.00 110
0 00 0.04 110
0 00 1.20 110
\" 1 \"olurm: of~aOII 11r-..;o, added
\". \"nlumc nf ~a~(), added
pll,.,.,,, 1 tnttral pll
pfl 1,"·'' frnalcqurhhnurn pll
v3 (ml) V (ml) pH initial
0.375 112.88 2.06
0.375 111.28 3.07
0.375 110.62 4.17
0.375 111.50 7.19
0.375 125.38 11.98
0.000 112.50 2.04
0.000 110.97 6.97
0.000 123.50 11.67
0.375 111.48 2.06
0.375 110.40 6.87
0.375 111 .36 11.58
0.000 111 00 2.02
0.000 110 04 6.98
0.000 111.20 11 86
Ce Co-Ce qe Removal PHtinal Absorbance (mg/L) Co (mg/L) (mg/1) (mg/g) (%)
2.10 0.006 1.89 19.49 17.60 0.54 90.29
3.23 0.005 1.62 19.77 18.15 0.55 91.80
4.31 0.005 1.62 19.89 18.27 0.55 91.85
5.86 0.005 1.62 19.73 18.11 0.55 91.78
10.96 0.019 5.41 17.55 12.14 0.41 69.20
2.05 0.000
5.97 0.000
10.45 0.000
2.06 0.072 19.73 19.74
6.87 0.072 19.73 19.93
11.58 0.072 19.73 19.76
2 02 0.000
6.98 0.000
11 86 0.000
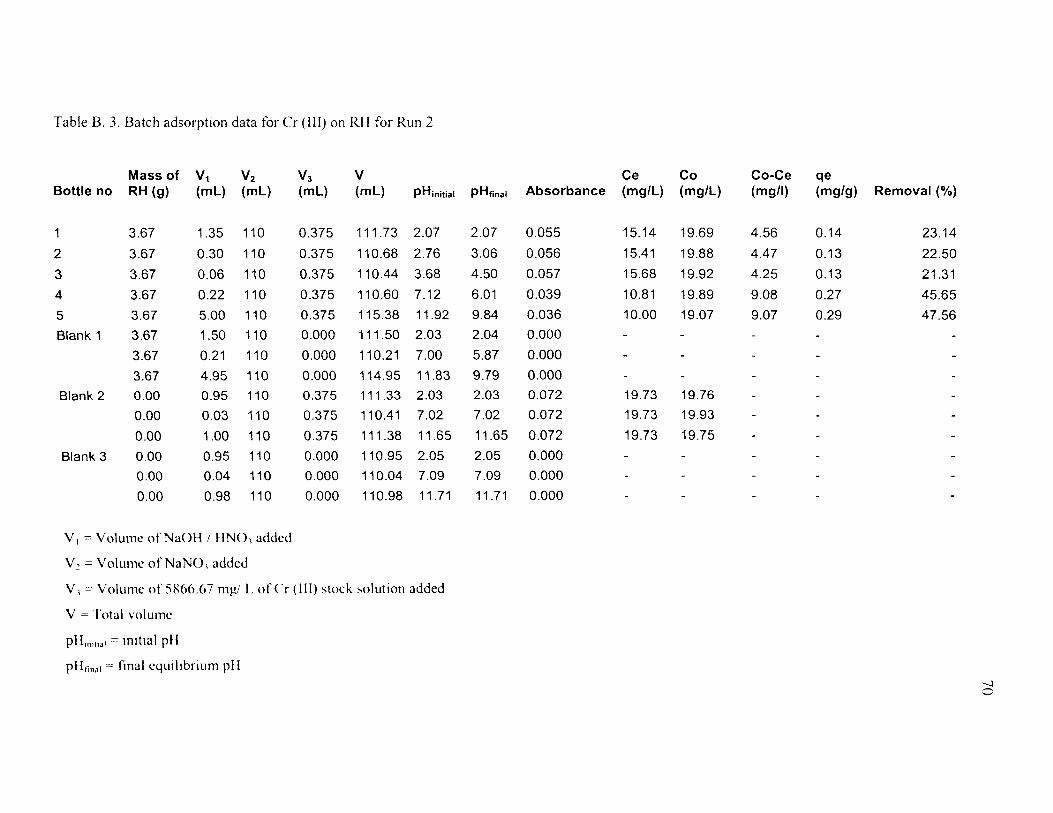
Table B. 3. Batch adsorption data for Cr (III) on RH for Run 2
Mass of V1 V2 v3 v Ce Co Co-Ce qe Bottle no RH (g) (ml) (ml) (ml) (ml) pH initial pH final Absorbance (mg/L) (mg/L) (mg/1) (mg/g) Removal(%)
1 3.67 1.35 110 0.375 111.73 2.07 2.07 0.055 15.14 19.69 4.56 0.14 23.14
2 3.67 0.30 110 0.375 110.68 2.76 3.06 0.056 15.41 19.88 4.47 0.13 22.50
3 3.67 0.06 110 0.375 110.44 3.68 4.50 0.057 15.68 19.92 4.25 0.13 21.31
4 3.67 0.22 110 0.375 110.60 7.12 6.01 0.039 10.81 19.89 9.08 0.27 45.65
5 3.67 5.00 110 0.375 115.38 11.92 9.84 0.036 10.00 19.07 9.07 0.29 47.56
Blank 1 3.67 1.50 110 0.000 111.50 2.03 2.04 0.000
3.67 0.21 110 0.000 110.21 7.00 5.87 0.000
3.67 4.95 110 0.000 114.95 11.83 9.79 0.000
Blank 2 0.00 0.95 110 0.375 111.33 2.03 2.03 0.072 19.73 19.76
0.00 0.03 110 0.375 110.41 7.02 7.02 0.072 19.73 19.93
0.00 1.00 110 0.375 111 .38 11.65 11.65 0.072 19.73 19.75
Blank 3 0.00 0.95 110 0.000 110.95 2.05 2.05 0.000
0.00 0.04 110 0.000 110.04 7.09 7.09 0.000
0.00 0.98 110 0.000 110.98 11.71 11.71 0.000
V 1 = Volume of NaOH I HN03 added
V~ =Volume ofNaNO, added
V, = Volume of 5866.6 7 mg/ L of Cr (Ill) stock solution added
V =Total volume
pH"''''•' = tl1lttal pH
pHrm•l = final cquiltbrium pH -....J ~
'"-'
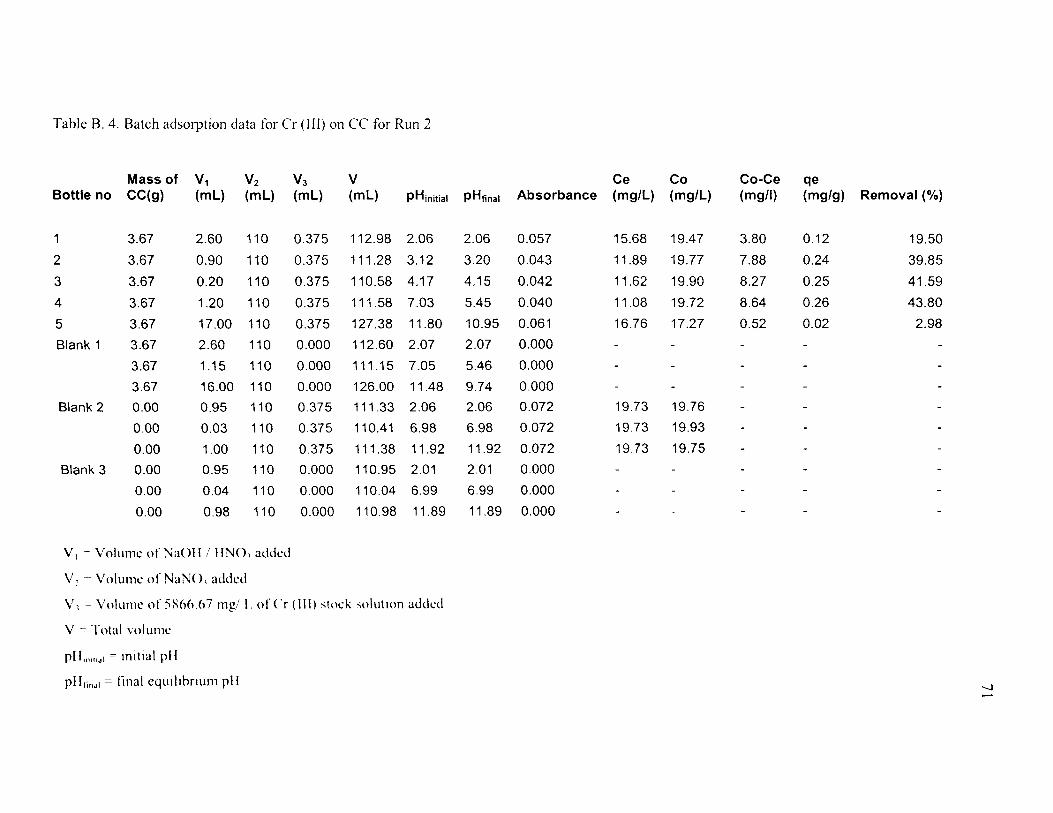
Table B. 4. Batch adsorption data for Cr (III) on CC for Run 2
Mass of V1 V2 v3 v Ce Co Co-Ce qe Bottle no CC(g) (ml) (ml) (ml) (ml) pH initial pH final Absorbance (mg/L) (mg/L) (mg/1) (mg/g) Removal(%)
1 3.67 2.60 110 0.375 112.98 2.06 2.06 0.057 15.68 19.47 3.80 0.12 19.50
2 3.67 0.90 110 0.375 111.28 3.12 3.20 0.043 11.89 19.77 7.88 0.24 39.85
3 3.67 0.20 110 0.375 110.58 4.17 4.15 0.042 11.62 19.90 8.27 0.25 41.59
4 3.67 1.20 110 0.375 111.58 7.03 5.45 0.040 11.08 19.72 8.64 0.26 43.80
5 3.67 17.00 110 0.375 127.38 11.80 10.95 0.061 16.76 17.27 0.52 0.02 2.98
Blank 1 3.67 2.60 110 0.000 112.60 2.07 2.07 0.000
3.67 1.15 110 0.000 111.15 7.05 5.46 0.000
3.67 16.00 110 0.000 126.00 11.48 9.74 0.000
Blank 2 0.00 0.95 110 0.375 111.33 2.06 2.06 0.072 19.73 19.76
0.00 0.03 110 0.375 110.41 6.98 6.98 0.072 19.73 19.93
0.00 1.00 110 0.375 111.38 11.92 11.92 0.072 19.73 19.75
Blank 3 0.00 0.95 110 0.000 110.95 2.01 2.01 0.000
0.00 0.04 110 0.000 110.04 6.99 6.99 0.000
0.00 0.98 110 0.000 110.98 11.89 11.89 0.000
V 1 =Volume ofNaOll I l!N01 added
v, Volume ofNaN01 added
V 1 ~· Volume of 5~66.(J7 mgl L of Cr (III) stock solutiOn added
V co Total volume
pll,"'''"' = Initial pH
pH 1;nJI =final equ!l1hnum pH -.J
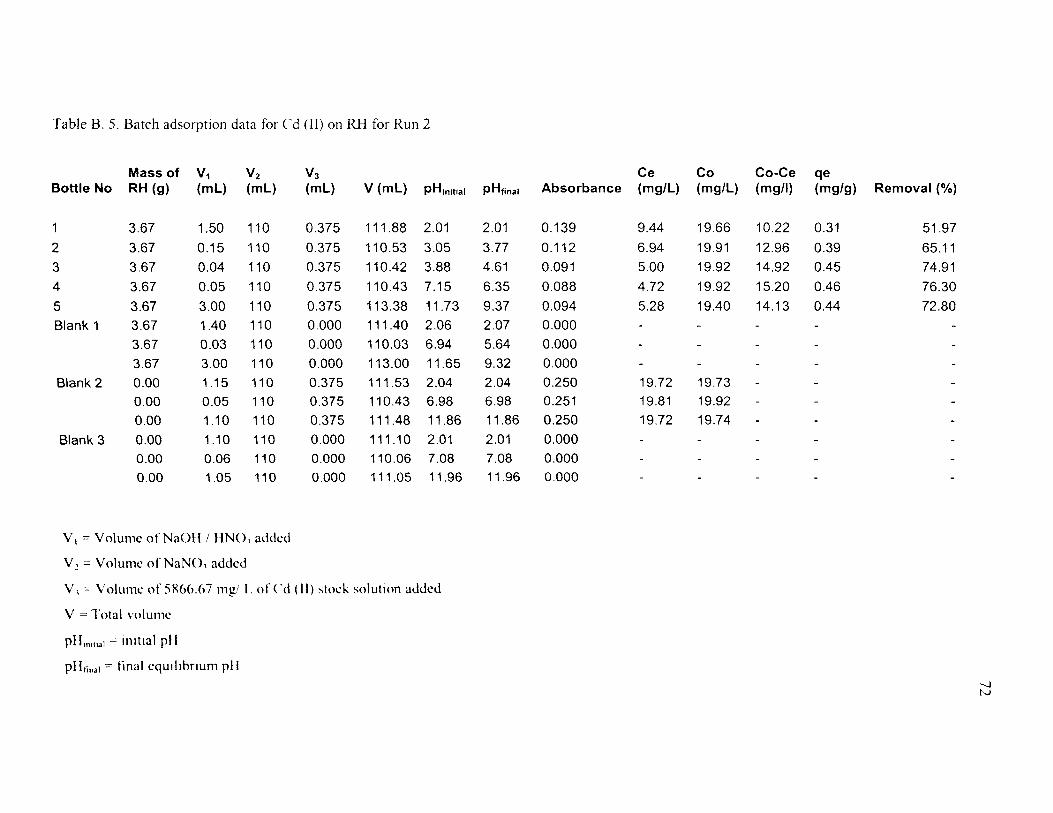
Table B. 5. Batch adsorption data for Cd (II) on RH for Run 2
Mass of V1 v2 Bottle No RH (g) (ml) (ml)
3.67 1.50 110
2 3.67 0.15 110
3 3.67 0.04 110
4 3.67 0.05 110
5 3.67 3.00 110
Blank 1 3.67 1.40 110
3.67 0.03 110
3.67 3.00 110
Blank 2 0.00 1.15 110
0.00 0.05 110
0.00 1.10 110
Blank 3 0.00 1.10 110
0.00 0.06 110
0.00 1.05 110
V 1 = Volume of NaOH I HNO, added
V~ =Volume ofNaNO, added
v3 (ml) V (ml) pH initial
0.375 111.88 2.01
0.375 110.53 3.05
0.375 110.42 3.88
0.375 110.43 7.15
0.375 113.38 11.73
0.000 111.40 2.06
0.000 110.03 6.94
0.000 113.00 11.65
0.375 111.53 2.04
0.375 110.43 6.98
0.375 111.48 11.86
0.000 111.10 2.01
0.000 110.06 7.08
0.000 111.05 11.96
V 1 =Volume of5R66.67 mg/ I. ofCd (II) stock solut1on added
V =Total volume
pllm,ll•l = Initial pH
pllr.nal =final eqlllllhrium pll
Ce Co Co-Ce qe pH final Absorbance (mg/L) (mg/L) (mg/1) (mg/g) Removal(%)
2.01 0.139 9.44 19.66 10.22 0.31 51.97
3.77 0.112 6.94 19.91 12.96 0.39 65.11
4.61 0.091 5.00 19.92 14.92 0.45 74.91
6.35 0.088 4.72 19.92 15.20 0.46 76.30
9.37 0.094 5.28 19.40 14.13 0.44 72.80
2.07 0.000
5.64 0.000
9.32 0.000
2.04 0.250 19.72 19.73 6.98 0.251 19.81 19.92
11.86 0.250 19.72 19.74
2.01 0.000
7.08 0.000
11.96 0.000
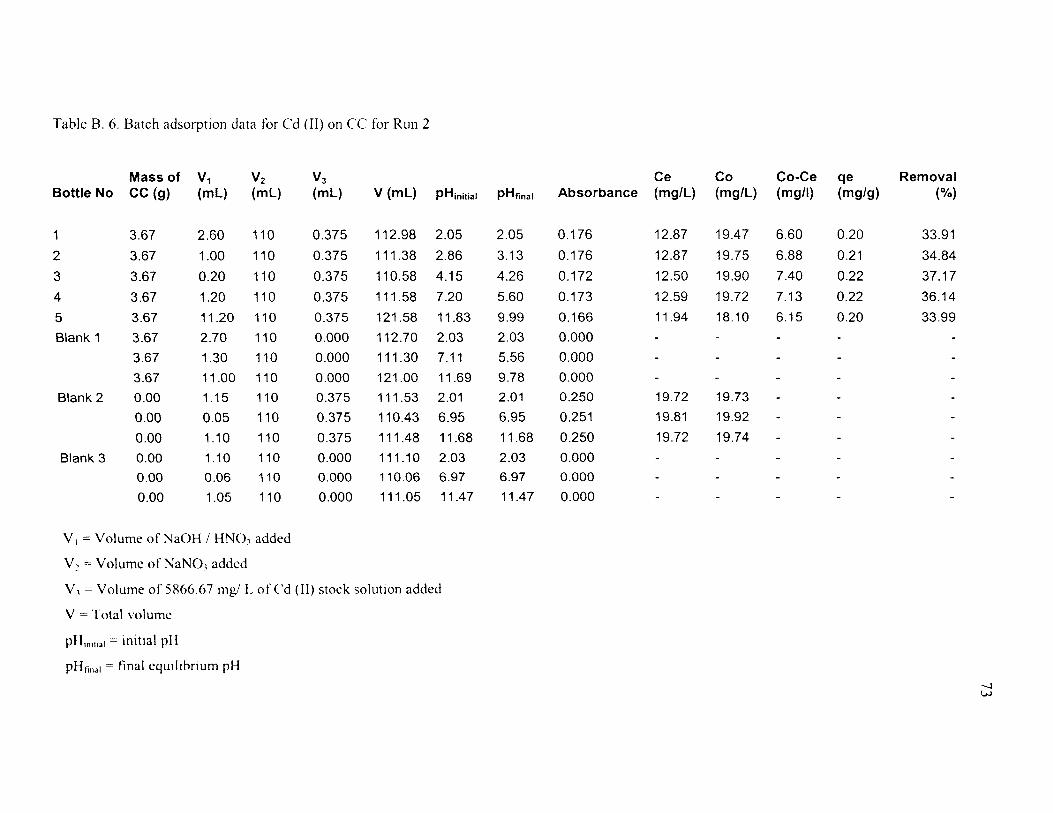
Table B. 6. Batch adsorption data for Cd (II) on CC for Run 2
Mass of v1 V2 v3 Ce Co Co-Ce qe Removal Bottle No cc (g) (ml) (ml) (ml) V (ml) pH initial pHfinal Absorbance (mg/L) (mg/L) (mg/1) (mg/g) (%)
1 3.67 2.60 110 0.375 112.98 2.05 2.05 0.176 12.87 19.47 6.60 0.20 33.91
2 3.67 1.00 110 0.375 111.38 2.86 3.13 0.176 12.87 19.75 6.88 0.21 34.84
3 3.67 0.20 110 0.375 110.58 4.15 4.26 0.172 12.50 19.90 7.40 0.22 37.17
4 3.67 1.20 110 0.375 111.58 7.20 5.60 0.173 12.59 19.72 7.13 0.22 36.14
5 3.67 11.20 110 0.375 121.58 11.83 9.99 0.166 11.94 18.10 6.15 0.20 33.99
Blank 1 3.67 2.70 110 0.000 112.70 2.03 2.03 0.000
3.67 1.30 110 0.000 111.30 7.11 5.56 0.000
3.67 11.00 110 0.000 121.00 11.69 9.78 0.000
Blank 2 0.00 1.15 110 0.375 111.53 2.01 2.01 0.250 19.72 19.73
0.00 0.05 110 0.375 110.43 6.95 6.95 0.251 19.81 19.92
0.00 1.10 110 0.375 111.48 11.68 11.68 0.250 19.72 19.74
Blank 3 0.00 1.10 110 0.000 111.10 2.03 2.03 0.000
0.00 0.06 110 0.000 110.06 6.97 6.97 0.000
0.00 1.05 110 0.000 111.05 11.47 11.47 0.000
V 1 = Volume of NaOH I HNO, added
V 2 = Volume of NaN03 added
V1 =Volume of5866.67 mg/ L ofCd (II) stock solution added
V = Total volume
pH;mual = initial pH
pHr.nal = final equilibrium pH -...] w
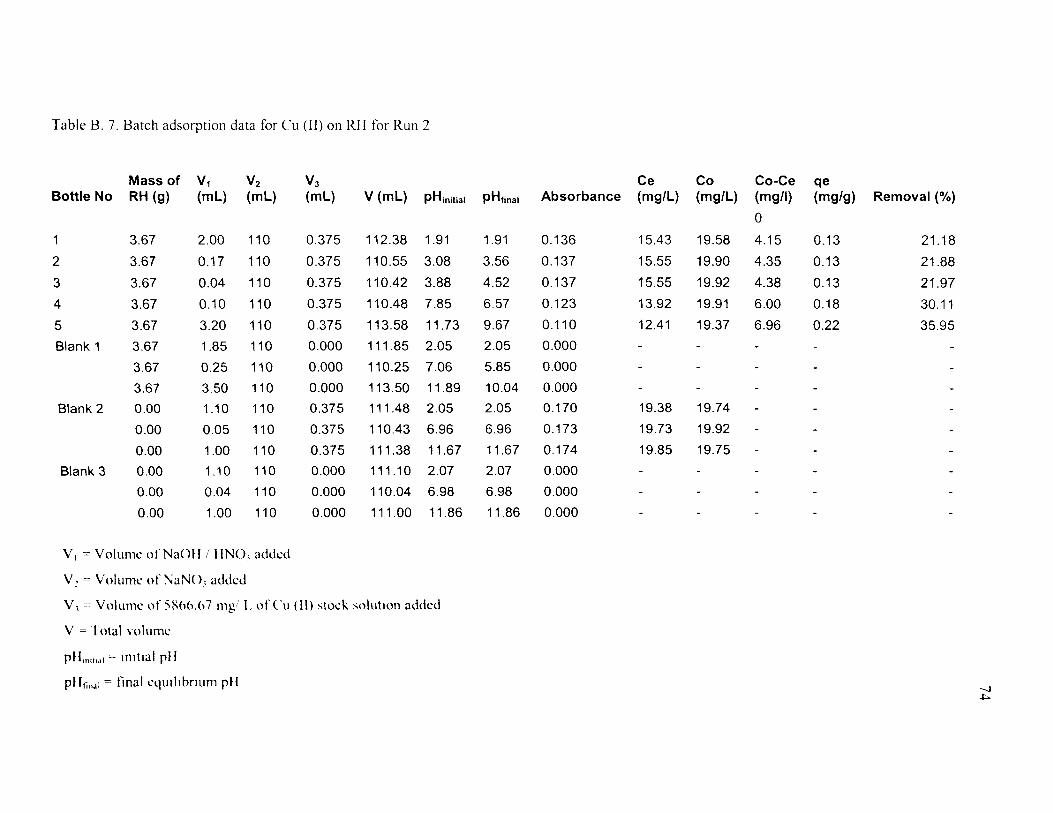
Table B. 7. Batch adsorption data for Cu (II) on RH for Run 2
Mass of V1 V2 v3 Ce Co Co-Ce qe Bottle No RH (g) (mL) (mL) (mL) V (mL) pH initial pH final Absorbance (mg/L) (mg/L) (mg/1) (mg/g) Removal(%)
0
1 3.67 2.00 110 0.375 112.38 1.91 1.91 0.136 15.43 19.58 4.15 0.13 21.18
2 3.67 0.17 110 0.375 110.55 3.08 3.56 0.137 15.55 19.90 4.35 0.13 21.88
3 3.67 0.04 110 0.375 110.42 3.88 4.52 0.137 15.55 19.92 4.38 0.13 21.97
4 3.67 0.10 110 0.375 110.48 7.85 6.57 0.123 13.92 19.91 6.00 0.18 30.11
5 3.67 3.20 110 0.375 113.58 11.73 9.67 0.110 12.41 19.37 6.96 0.22 35.95
Blank 1 3.67 1.85 110 0.000 111.85 2.05 2.05 0.000
3.67 0.25 110 0.000 110.25 7.06 5.85 0.000
3.67 3.50 110 0.000 113.50 11.89 10.04 0.000
Blank 2 0.00 1.10 110 0.375 111.48 2.05 2.05 0.170 19.38 19.74
0.00 0.05 110 0.375 110.43 6.96 6.96 0.173 19.73 19.92
0.00 1.00 110 0.375 111.38 11.67 11.67 0.174 19.85 19.75
Blank 3 0.00 1.10 110 0.000 111.10 2.07 2.07 0.000
0.00 0.04 110 0.000 110.04 6.98 6.98 0.000
0.00 1.00 110 0.000 111.00 11.86 11.86 0.000
V 1 =Volume ofNaOH i IINO, added
V, =Volume ofNaNO, added
V, =Volume of 5X6().()7 mgi L of Cu (II) stock solution added
V =Total volun1l'
pHnllto•l = mtttal pi!
pH1; ... t = tina! equtllbnum pH -....J +:>.

Table B. 8. Batch adsorption data for Cu (II) on CC for Run 2
Mass of v1 V2 v3 Ce Co Co-Ce qe Bottle No cc (g) (ml) (ml) (ml) V (ml) pH initial PH tina I Absorbance (mg/L) (mg/L) (mg/1) (mg/g) Removal(%)
1 3.67 2.50 110 0.375 112.88 2.07 2.07 0.120 13.57 19.49 5.92 0.18 30.38
2 3.67 0.90 110 0.375 111.28 3.00 3.20 0.121 13.69 19.77 6.08 0.18 30.78
3 3.67 0.21 110 0.375 110.59 4.18 4.20 0.118 13.34 19.89 6.56 0.20 32.96
4 3.67 1.15 110 0.375 111.53 6.88 5.47 0.109 12.29 19.73 7.44 0.23 37.69
5 3.67 11.30 110 0.375 121.68 11.78 9.96 0.107 12.06 18.08 6.02 0.20 33.31
Blank 1 3.67 2.70 110 0.000 112.70 1.99 1.99 0.000
3.67 1.25 110 0.000 111.25 7.06 5.89 0.000
3.67 10.65 110 0.000 120.65 11.38 9.96 0.000
Blank 2 0.00 1.10 110 0.375 111.48 2.01 2.01 0.173 19.73 19.74
0.00 0.05 110 0.375 110.43 6.89 6.89 0.173 19.73 19.92
0.00 1.00 110 0.375 111.38 11.89 11.89 0.173 19.73 19.75
Blank 3 0.00 1.10 110 0.000 111.10 2.03 2.03 0.000
0.00 0.04 110 0.000 110.04 7.03 7.03 0.000
0.00 1.00 110 0.000 111.00 11.76 11.76 0.000
V 1 =Volume ofNaOH I HNO, added
V, '"Volume ofNaNO, added
V, = Volume of 5~66.67 mg L ofCu (II) stock solut1on added
V ~· Total volume
pHmii•JI =· lntttal plf
pHr;n•l =final cqutlthnum pH -..1 VI
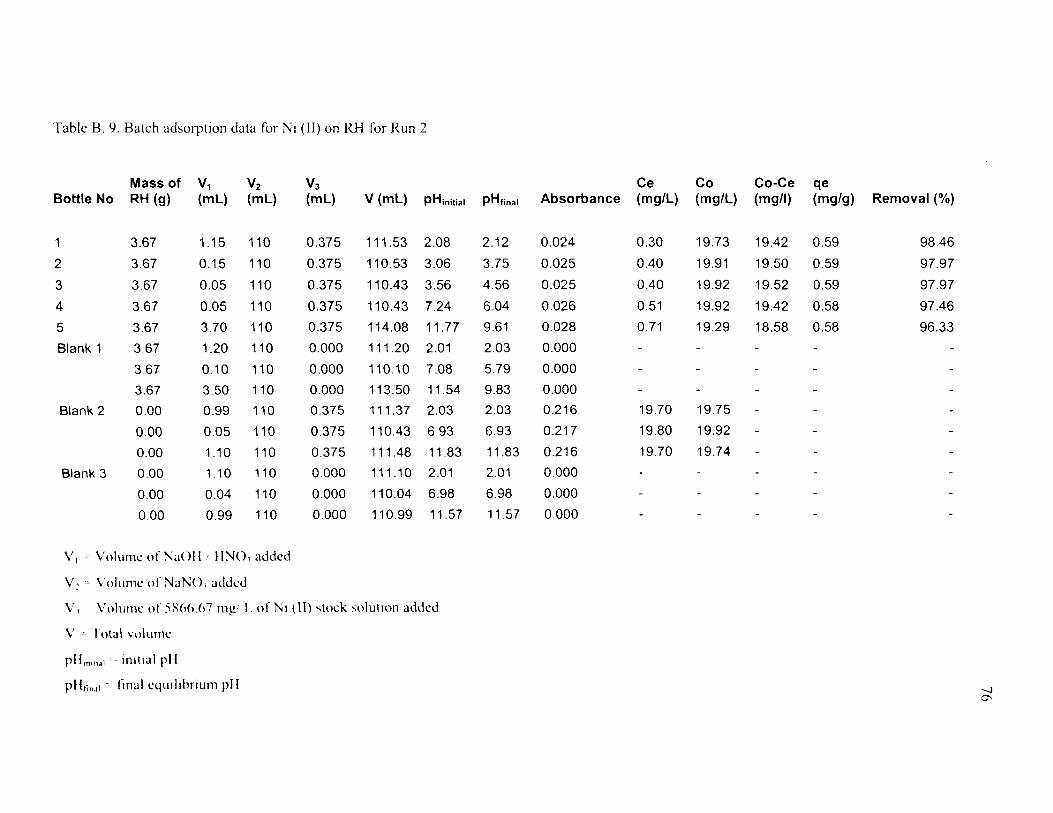
Table B. 9. Batch adsorption data for Ni (II) on RH for Run 2
Mass of V1 V2 v3 Ce Co Co-Ce qe Bottle No RH (g) (ml) (ml) (ml) V (ml) pH initial pH final Absorbance (mg/L) (mg/L) (mg/1) (mg/g) Removal(%)
1 3.67 1.15 110 0.375 111.53 2.08 2.12 0.024 0.30 19.73 19.42 0.59 98.46
2 3.67 0.15 110 0.375 110.53 3.06 3.75 0.025 0.40 19.91 19.50 0.59 97.97
3 3.67 0.05 110 0.375 110.43 3.56 4.56 0.025 0.40 19.92 19.52 0.59 97.97
4 3.67 0.05 110 0.375 110.43 7.24 6.04 0.026 0.51 19.92 19.42 0.58 97.46
5 3.67 3.70 110 0.375 114.08 11.77 9.61 0.028 0.71 19.29 18.58 0.58 96.33
Blank 1 3.67 1.20 110 0.000 111.20 2.01 2.03 0.000
3.67 0.10 110 0.000 110.10 7.08 5.79 0.000
3.67 3.50 110 0.000 113.50 11.54 9.83 0.000
Blank 2 0.00 0.99 110 0.375 111.37 2.03 2.03 0.216 19.70 19.75
0.00 0.05 110 0.375 110.43 6.93 6.93 0.217 19.80 19.92
0.00 1.10 110 0.375 111 .48 11.83 11.83 0.216 19.70 19.74
Blank 3 0.00 1.10 110 0.000 111.10 2.01 2.01 0.000
0.00 0.04 110 0.000 110.04 6.98 6.98 0.000
0.00 0.99 110 0.000 110.99 11.57 11.57 0.000
VI Volume of NaOII , II NO, added
v. Volume of NaNO, added
v, Volume of )l\66.67 m~ I. ofN1 (II) stock solution added
v o. Total volume
pllm"'·'' --_ llllttal pH
pfltinJI" final eqlllllhnum pll -....J o-
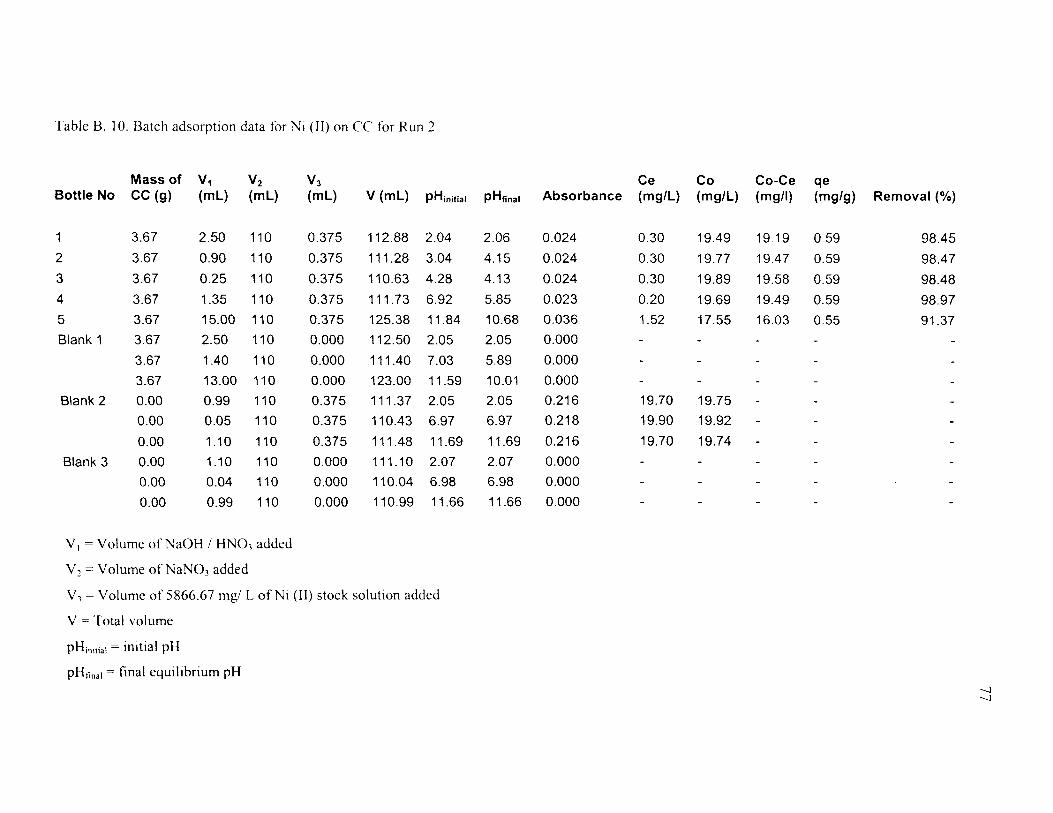
Table B. 10. Batch adsorption data for Ni (II) on CC for Run 2
Mass of V1 v2 v3 Ce Co Co-Ce qe Bottle No cc (g) (ml) (ml) (ml) V (ml) pH initial PHtinal Absorbance (mg/L) (mg/L) (mg/1) (mg/g) Removal(%)
1 3.67 2.50 110 0.375 112.88 2.04 2.06 0.024 0.30 19.49 19.19 0.59 98.45
2 3.67 0.90 110 0.375 111.28 3.04 4.15 0.024 0.30 19.77 19.47 0.59 98.47
3 3.67 0.25 110 0.375 110.63 4.28 4.13 0.024 0.30 19.89 19.58 0.59 98.48
4 3.67 1.35 110 0.375 111.73 6.92 5.85 0.023 0.20 19.69 19.49 0.59 98.97
5 3.67 15.00 110 0.375 125.38 11.84 10.68 0.036 1.52 17.55 16.03 0.55 91.37
Blank 1 3.67 2.50 110 0.000 112.50 2.05 2.05 0.000
3.67 1.40 110 0.000 111.40 7.03 5.89 0.000
3.67 13.00 110 0.000 123.00 11.59 10.01 0.000
Blank 2 0.00 0.99 110 0.375 111.37 2.05 2.05 0.216 19.70 19.75
0.00 0.05 110 0.375 110.43 6.97 6.97 0.218 19.90 19.92
0.00 1.10 110 0.375 111.48 11.69 11.69 0.216 19.70 19.74
Blank 3 0.00 1.10 110 0.000 111.10 2.07 2.07 0.000
0.00 0.04 110 0.000 110.04 6.98 6.98 0.000
0.00 0.99 110 0.000 110.99 11.66 11.66 0.000
V 1 = Volume of NaOH I HN03 added
V 2 = Volume of NaN03 added
V3 =Volume of5866.67 mg/ L ofNi (II) stock solution added
V =Total volume
pHinitial = initial pH
pHtinal = final equilibrium pH --..) --..)

APPENDIX C
DESORPTION STUDIES DATA
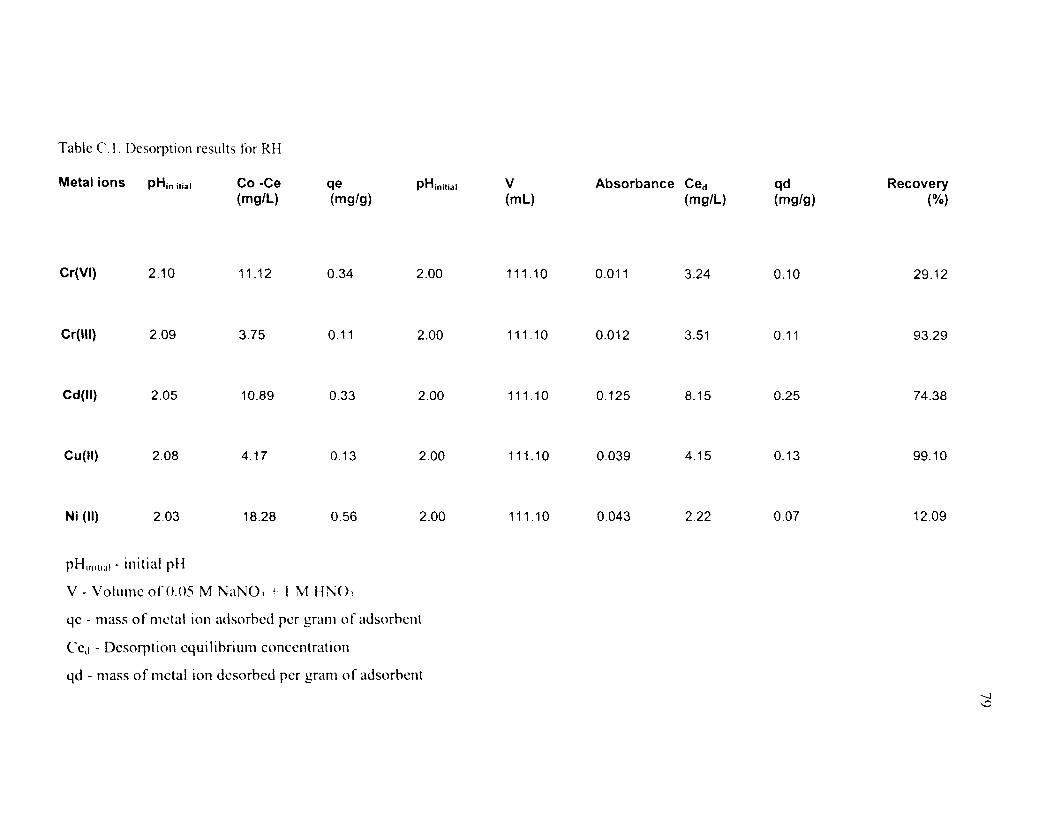
Table C. I. Desorption results for RH
Metal ions pH;n itial
Cr(VI} 2.10
Cr(lll) 2.09
Cd(ll) 2.05
Cu(ll) 2.08
Ni (II) 2.03
pHlllltl.JI- initial pH
Co-Ce (mg/L)
11.12
3.75
10.89
4.17
18.28
qe (mg/g)
0.34
0.11
0.33
0.13
0.56
V- Volume of0.05 M NaN01 + I M HN01
pHinitial
2.00
2.00
2.00
2.00
2.00
qe- mass of metal ion adsorbed per gram of adsorbent
C'ed- Desorption equilibrium concentration
qd - mass of metal ion dcsorbed per gram of adsorbent
v (ml)
111.10
111.10
111.10
111.10
111.10
Absorbance Ced (mg/L)
0.011 3.24
0.012 3.51
0.125 8.15
0.039 4.15
0.043 2.22
qd (mg/g)
0.10
0.11
0.25
0.13
0.07
Recovery (%)
29.12
93.29
74.38
99.10
12.09
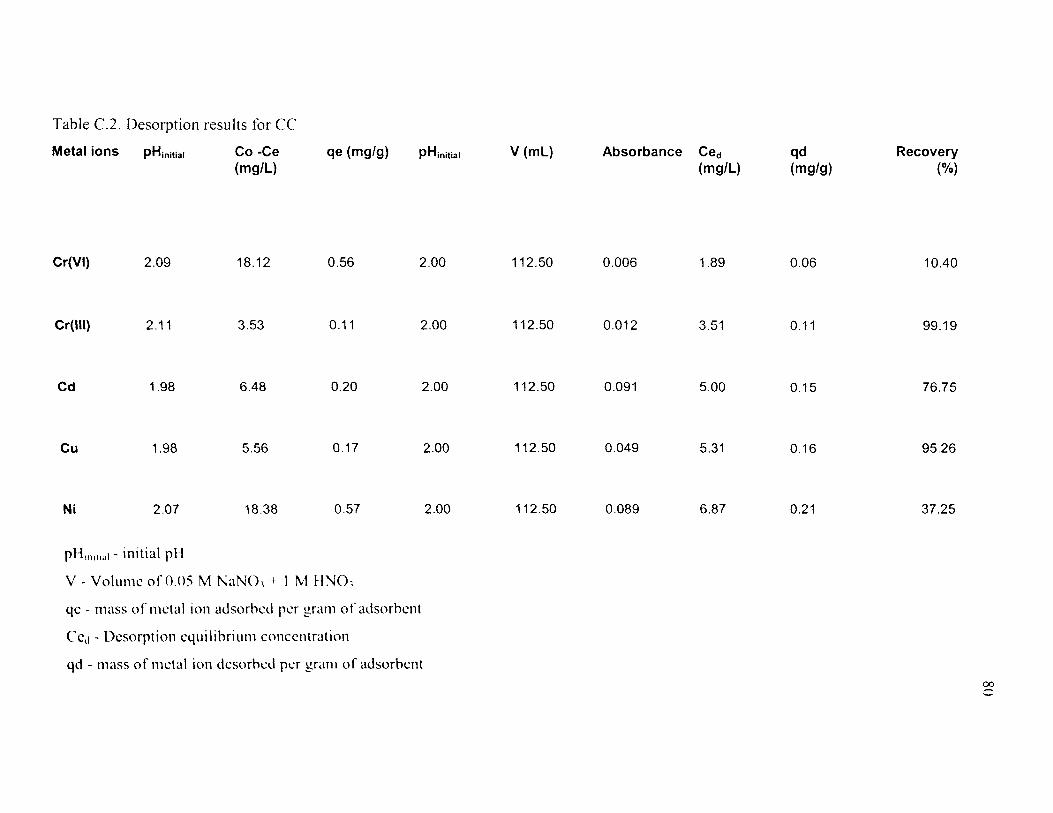
Table C.2. Desorption results for CC
Metal ions pHinitiai
Cr(VI) 2.09
Cr(lll) 2.11
Cd 1.98
Cu 1.98
Ni 2.07
pHunttal- initial pH
Co-Ce (mg/L)
18.12
3.53
6.48
5.56
18.38
qe (mg/g)
0.56
0.11
0.20
0.17
0.57
V- Volume ofO.OS M NaNO, + I M HNO,
pH initial
2.00
2.00
2.00
2.00
2.00
qc - mass of metal ion adsorbed per gram of adsorbent
Cc11 - Desorption equilibrium concentration
qd - mass of metal ion dcsorbcd per gram of adsorbent
V (mL) Absorbance Ced (mg/L)
112.50 0.006 1.89
112.50 0.012 3.51
112.50 0.091 5.00
112.50 0.049 5.31
112.50 0.089 6.87
qd (mg/g)
0.06
0.11
0.15
0.16
0.21
Recovery (%)
10.40
99.19
76.75
95.26
37.25

APPENDIX D
KINETIC STUDY DATA
Table 0.1. Kinetic studies data for RH and CC
pH Rice Husk pH Coconut coir
Time(hr) Cr(VI) Cr(lll) Cd(ll) Cu(ll) Ni(ll) Cr(VI) Cr(lll) Cd(ll) Cu(ll) Ni(ll)
0 9.11 9.23 9.15 8.75 8.36 7.55 7.92 8.43 9.03 8.37
1 8.04 8.14 7.64 7.27 7.62 6.91 7.17 7.33 7.67 7.42
2 6.97 7.05 6.13 5.79 6.88 6.26 6.42 6.23 6.31 6.47
3 6.82 7.05 5.95 5.68 6.69 6.19 6.36 6.16 6.23 6.36
4 6.72 6.96 5.86 5.59 6.49 6.19 6.36 6.14 6.21 6.35
5 6.67 6.95 5.83 5.58 6.48 6.17 6.32 6.12 6.18 6.32
7 6.61 6.84 5.78 5.55 6.41 6.09 6.23 6.04 6.10 6.21
8 6.59 6.79 5.76 5.53 6.37 6.07 6.21 6.03 6.09 6.20
9.5 6.57 6.78 5.75 5.52 6.35 6.06 6.19 6.01 6.07 6.18
18 6.50 6.68 5.66 5.44 6.26 5.94 6.06 5.90 5.94 6.04
21 6.49 6.69 5.67 5.45 6.27 5.95 6.07 5.91 5.95 6.05
23 6.49 6.69 5.67 5.45 6.27 5.95 6.07 5.91 5.95 6.05
24 6.49 6.69 5.67 5.45 6.27 5.95 6.07 5.91 5.95 6.05
00 tv
83
BIBLIOGRAPHY
~I] Upadhyay, Kanjan, "Solution for wastewater problem related to electroplating mdustry: An overview," Journal oflndustrial Pollution Control 22 (1) (2006), 59-66.
[2] Cushnie, C.George, Jr, "Electroplating wastewater pollution control technology," Noyes Publications, Park Ridge, N.J., U.S. A (1985), 24-26.
[3] O.llard, E.A. and Smith, E.A., "Handbook of industrial electroplating," American Elsevier Publishing Company Inc., New York, U.S. A (1964), 123-125.
[ 4] S., Anitha and Sasikumar, Sheela.C, "Studies on Physio-chemical characteristics of untreated and industrially treated electroplating effluent," Biochemical Cellular Archive 5 (2) (2005), 213-218.
[5] Dikshit, V.P., Agarwal, I.C., and Shukla, N.P., "Chromium removal from electroplating industries," Indian Journal of Environmental Protection 9 (9) ( 1989), 674-678.
[()] United States Environmental Protection Agency Guidance manual for electroplating and metal finishing pretreatment standards, February 1984, 18-19.
[7] Heavy metal toxicity, Tuberose.com, 2007, retrieved II October 2007, website: http://tuberose.com/Heavy Metal Toxicity.html
[8] Priority pollutants, epa.com, 2007, retrieved 29 December 2007, website: http://www. epa. gov /watersci ence/methods/po II utants. htm
[9] Chen, Shiao-Shing, Cheng, Chih-Yu, Chai, Pao-Hsuan and Chang, Yu-Min, "Reduction of chromate from electroplating wastewater from pH I to 2 using fluidized zero valent iron process," Journal of Hazardous Materials 142 (1-2) (2007), 362-367.
[I 0] Rana, S. V.S, "Environmental Pollution: Health and Toxicology," Alpha Science
International Ltd, U.K. (2006), 171.
[I I] Baral, A., Engelken, R.D., "Chromium based regulations and greening in metal finishing industries in USA," Environmental Science Policy 5 (2005), 121-133.
[ 12] Mahvi, Hossein Amir & Bazrafsham, Edriss, "Removal of Cadmium from Industrial effluents by Electrocoagulation process using aluminum electrodes," World Applied
Sciences Joumal 2 (1) (2007), 34-39.
84
[ 13] N~masivayam, C. & Ranganathan, K., "Removal of cadmium from wastewater by adsorption on waste Fe (III)/ Cr (III) hydroxide," Water Research 29 (7) ( 1995) 1717-1744. ' -
[ 14] Ra_na, S.V.S, "Environmental Pollution: Health and Toxicology," Alpha Science InternatiOnal Ltd, U.K. (2006), 166-167.
[ 15] Central Pollution Control Board, retrieved 29 December 2007, 2007, website: http://www.cpcb.nic.in/News%20Letters/Latest/cadmium/ch 15-CADMIUM.htm .
[ 16] Corrosion Doctors, retrieved 6 December, 2007, website: http://www.corrosiondoctors. org/E lements-T oxic/Cadmium.html
[ 17] CDA, Copper.org, 2007, retrieved 6 December 2007, website: http://www .copper.org/education/c-facts/c-health.html
[ 18] Rana, S.V.S, "Environmental Pollution: Health and Toxicology," Alpha Science International Ltd, U.K. (2006), 172.
[ 19] Monser, Lotfi and Adhoum, Nafaa, "Modified activated carbon for the removal of copper, zinc, chromium and cyanide from wastewater," Separation and Purification
Technology 26 (2-3) (2002), 137-146.
[20] Ajmal, Mohammed, Khan, Akhtar Hussain, Ahmad, Shamim and Ahmad, Anees, ''Role of sawdust in the removal of Cu (II) from industrial wastes," Water Research 32
( 1 0) ( 1998), 3085-3091.
[21] Nickel, Copper Wiki, October 2007, retrieved 6 December 2007. website:
http://www.copperwiki.org/index.php/Nickel
[22] Rana, S.V.S, "Environmental Pollution: Health and Toxicology," Alpha Science
International Ltd, U.K. (2006), 171.
[23] Zhang, Shuna, Cheng, Fangyi, Tao, Zhangliang, Gao, Feng and Chen . .Jun. "Removal of Nickel ions from wastewater by Mg(OH)2/ MgO nanostructures embedded inA1
20
3 membranes," Journal of Alloys and Compounds 426 (1-2) (2006 ). 281-285.
[24] Vanderviere, P.C., Bianchi, R. and Verstraete, W., "Treatm~nt and reuse o.: wastewater from the textile wet processing industry: review of emergmg technologies. Journal of Chemical Technology and Biotechnology 72 (2) ( 1998), 289-302.
[25] Upadhyay, Kanjan, "Solution for wastewate~ problem related to1
the el~~troplating industry: an overview," Journal oflndustrial PollutiOn Control 22 (1) (_006),) )-66.
[26] Flocculation, Wikipedia, Dec 2007, retrieved 6 December 2007. website:
http://en.wikipedia.org/wiki/Flocculation
85
[27] Semerjian, L. and Ayoub, G.M., "High ph magnesium coagulation flocculation in wastewater treatment," Advances in Environmental Research 7 (2003), 389-403.
[28] Ramakrishna, K.R. and Viraraghavan, T., "Dye removal using low cost adsorbents," Water Science Technology 36 (2-3) (1997), 189-196.
[29] Ouki, S.K., Neufeld, R.D. and Perry, R., "Use of activated carbon for the recovery of chromium from industrial wastewaters," Journal of Chemical Technology and Biotechnology 70 (1) (1997), 3-8.
[30] Monser, L. and Adhoum, N., "Modified activated carbon for the removal of copper, Zinc, chromium and cyanide from wastewater," Separation and Purification Technology, 26 (2-3) (2002), 137-146.
[31] Faust, Samuel D. and Aly, Osman M., "Adsorption process for water treatment," Butterworth Publishers (1987), 1-2.
[32] Tchobanoglous, George, Burton, Frank L. and Stensel, H. David, "Wastewater Engineering-Treatment and Reuse," (2003), 1138-1140.
[33] Roberts, E.J. and Rowland, S.P., "Removal of mercury from aqueous solutions by nitrogen containing chemically modified cotton," Environmental Science and Technology 7 ( 1973), 552-555.
[34] Randall, J.M., Hautala, E. and Waiss, A.C., "Removal and recycle of heavy metals ions from agricultural byproducts," Proc.4111 Mineral Waste Utilization Symposium, Chicago, IL. USA ( 1974).
[35] Randall, J.M., Reuter, F.M. and Waiss, A.C., "Removal of cupric ions from solution by contact with peanut skins," Journal of Applied Polymer Science 19 (1975), 1563-
1571.
[36] Kumar, P. and Dara, S.S., "Utilization of agricultural wastes for decontaminating industrial/domestic wastewaters from toxic metals," Agricultural Waste 4 ( 1982), 213-
223.
[37] Macchi, G., Marani, D. and Tirivanti, G., "Uptake of mercury by exhausted coffee grounds," Environmental Technical Letter 7 ( 1986 ), 431-444.
[38] Ahluwalia, S.S. and Goyal, D., "Removal of heavy metals by waste tea leaves from aqueous solutions," Engineering in Life Sciences 5 (2) (2005), 158-162.
[39] Maranon, E., and Sastre, H., "Heavy metal removal in packed beds using apple wastes," Bioresource Technology 38 (1991 ), 39-43.
86
[ 40] Balkose, D. and Baltacioglu, H., "Adsorption of heavy metals cations from aqueous solutions by wool fibers," Journal of Chemical Technology & Biotechnology 54 (1992), 393-397.
[ 41] Deshkar, A.M. and Dara, S.D, "Sorption of mercury by Techtona grandis bark," Asian Environment 10 ( 4) ( 1988), 3-11.
[ 42) Freer, J ., Baeza, J., Maturana, H. and Palma, G, "Removal and recovery of uranium by modified Pinus radiate D.Don bark," Journal of Chemical Technology & Biotechnology 46 (1989), 41-48.
[43] Randall, J.M., Garret, V., Bermann, R.L. and Waiss, A.C., "Use ofbark to remove heavy metal ions from waste solutions," Forest Production Journal 24 (9) (1974 ), 80-84.
[44] Randall, J.M., Hautala, E., Waiss, A.C and Tschernitz, J.L., "Modified barks as scavengers for heavy metal ions," Forest Production Journal 26 (8) (1976), 46-50.
[45] Randall, J.M., "Variation in effectiveness of barks as scavengers for heavy metal ions," Forest Production Journal27 (11) (1977), 51-56.
[ 46] Gaballah, I. and Kilbertus, G., "Recovery of heavy metals ions through decontamination of synthetic solutions and industrial effluents using modified barks," Journal ofGeochemical Exploration 62 (1-3) (1998), 241-286.
[ 4 7] Dcmirbas, Hyden, "Adsorption of lead and cadmium ions in aqueous solutions onto modified lignin from alkali glycerollignication," Journal of Hazardous Materials 109 (1-3) (2004 ), 221-226.
[ 48) Marshall, Wayne E and Champagne, Elaine T. "Agricultural byproducts as adsorbents for metal ions in laboratory prepared solutions and in manufacturing wastewater," Journal of Environmental Science & Health, Part A: Environmental Science and Engineering, 30 (2) (1995), 241-261.
[49] Taylor, D.T., Edyvean, R.G.J. and Johnson, OJ., "Investigations into the usc of linseed flax straw for the removal of metals from wastewater," Institution of Chemical Engineers Symposium series, Published by Institute of Chemical Engineers, Rugby,
England, 116-118.
[50] Top 10 rice producing countries, IRRI, 2007, retrieved 29 September 2007, website: http://www .irri.org/science/cnyinfo/1 O.asp
[51] Khalid, Nasir, Rahman, Asma and Ahmad, Shujaat, "Adsorption of cadmium from aqueous solutions on rice husk," Radiochim.Acta 83 (1998), 157-162.
87
[52] Patel, M., Karera, A. and Prasanna, P., "Effect of thermal and chemical treatments on carbon and silica contents in rice husk," Journal of Material Science 22 (1987), 2457-2463.
[53] Coir Trade, Natural Indian Coir fiber, 2006, retrieved 28 September 2007, website: http://coirboard.nic.in/coirtrade.htm
[54] Vishnudas, S., Savenije, H.H.G., van der Zaag, P., Ani!, K.R. and Balan, K., "Experimental study using coir geotextiles in watershed management," Hydrology and Earth System Sciences (Nov 2005), 2327-2350.
[55] Coconut-tree of life, FAO corporate document depository, retrieved 3 November 2007, website: http://www.fao.org/DOCREP/005/Y3612E/y3612e03.htm
[56] Coir, retrieved on 3 November 2007, Website: http:// www.dirtworks.net/Coir.html
[57] Rice hulls, Quality Wine and Ale supply, 2007, retrieved 10 December 2007, website: http://www.homebrewit.com/aisle.php
[58] Coconut coir fiber bricks, The Lazy Gardener, 2004, retrieved 10 December 2007, website: http://www. thelazygardeners.com/product info.php?products id=34 7
[59] Brunauer, S., Emmet, P. H. and Teller, E., "Adsorption of gases in multimolecular layers," Journal of American Chemical Society, 60 (1938), 309-318.
[60] Kluaymai-na-Ayudhya, Sriprapa, Thiravetyam, Paitip, Nakbanpote, Woranan and Chaprasert, Pavinee, "Removal of heavy metal complex dyes from synthetic textile wastewater by rice husk," Environmental Biotechnology: Biotechnology applications for treatment and utilization of Industrial waste, April 15-17 2002, New Zealand, 477-484.
[61] Tarley, Cesar Ricardo Teixeira and Arruda, Marco Aurelio Zezzi, "Biosorption of heavy metals using rice milling byproducts: Characterization and application for removal of metals from aqueous effluents," Chemosphere 54 (2004), 987-995.
[62] Hu, Ming-Jan, Wei, Yu-Ling, Yang, Yaw-Wen and Lee, Jyh-Fu, "X-ray adsorption spectroscopy study of chromium recovered from Cr (VI) - containing water with rice husk," .Journal of Physical and Condensed Matter 16 (2004), 3473-3478.
[63] Khalid, N., Rahman, A., Ahmad, S., Toheed, A. and Ahmed, J., "Adsorption behavior of rice husk for the decontamination of chromium from industrial effluents," Journal of Radioanalytical and Nuclear chemistry 240 (3) (1999), 775-781.
[64] Thompson, C.M., Medicinal Chemistry-Lecture 6 (2006), retrieved 31 December 2007, website: http://www.umt.edu/medchem/teaching/421 lect6.htm
88
[65] Anirudhan, T.S. and Unnithan, Maya R., "Arsenic (V) removal from aqueous solutions using an anion exchanger derived from coir pith and its recovery," Chemosphere 66 (1) (2007), 60-66.
[66] Suksabye, Parinda, Thiravetyan, Paitip, Nakbanpote and Chaybutra, Supanee, "Chromium removal from electroplating wastewater by coir pith," Journal of Hazardous Materials 141 (3) (2006), 637-644.
[ 6 7] Khan, Nasiruddin and Wahab, M. Farooq, "Characterization of chemically modified corncobs and its application in the removal of metal ions from aqueous solution," Journal of Hazardous Materials 141 (1) (2007), 237-244.
[68] Bessekhouad, Y, Robert, D., Weber, J-V and Chaoui, N., "Effect of alkaline doped Ti02 on photocatalytic efficiency," Journal of Photochemistry and Photobiology: Chemistry 167 (1) (2004), 49-57.
[69] Jia, Y. F., Xiao, B. and Thomas, K. M., "Adsorption of metal ions on nitrogen surface functional groups in activated carbons," Langmuir 18 (2) (2002), 470-478.
[70] Yang, Yaning, Chun, Yuan, Sheng, Guangyao and Huang, Minsheng, "pH dependence of pesticide adsorption by wheat residue derived carbon black," Langmuir 20 (16) (2004), 6736-6741.
[71] Nomanbhay, Saifuddin M and Palanisamy, Kumaran, "Removal of heavy metal from industrial wastewater using chitosan coated oil palm shell charcoal," Electronic Journal of Biotechnology 8 (1) (2005)
[72] Sham1a, D.C. and Forster, C.F., "A preliminary examination into the adsorption of hexavalent chromium using low cost sorbents," Bioresource Technology 47 (3) (1994), 257-264.
[73] Redded, Z., Gerende, C., Andres, Y. and Le Cloriec, P, "Mechanisms of Cr (VI) and Cr (Ill) from aqueous solutions by sugar beet pulp," Environmental Technology 24 (2) (2003 ), 257-264.
[74] Ahmadi, Hamid Seyyed, Haji Shabani, Ali Mohammed, Dadfarnia, Shayessteh and Taci, Masoumeh, "Online preconcentration of chromium by an 8-hydroxu quinoline micro column immobilized on surfactant coated alumina and flow injection atomic absorption spectrometry," Turkish Journal ofChemistry 31 (2007), 191-199.
[75] El- Shafey, E.I., "Sorption of Cd (II) and Se (IV) from aqueous solution using modified rice husk," Journal ofHazardous Materials 147 (1-2) (2007), 546-555.
[76 J Kadirvelu, K. & Namasivayam, C., "Activated carbon from coconut coir pith as metal adsorbent: Adsorption of Cd (II) from aqueous solution," Advances in Environmental Research 7 (2) (2003 ), 4 71-4 78.
89
VITA
Frency Mathew was born on January 24, 1983 in Pala, Kerala, India. She received
her Bachelor of Technology degree in Chemical Engineering from Thangal Kunju
Musaliar College of Engineering Kollam (Kerala University) in 2005. In 2006, she came
to University of Missouri, Rolla to pursue her Master of Science degree in Chemical
Engineering and received her M.S. in May 2008.