Embed Size (px)
Citation preview
DRIVE 0
Driving decarbonization of the EU building stock by enhancing a consumer centered and locally based
circular renovation process
Contract No.: 841850
Report: D6.1 Report on benchmarking on circularity and its potentials on the demo sites
Work Package: WP6 – Task 6.1 Benchmarking on circularity of the demonstration sites
Deliverable: D6.1 Status: Public
Prepared for:
European Commission
EASME
Project Advisor: Mr. Philippe Moseley
Prepared by:
Zuyd University of Applied Sciences, SURD research team
Dario Cottafava, Michiel Ritzen, John van Oorschot March 30th, 2020
This project has received funding from the European Union’s H2020 framework programme for research and
innovation under grant agreement no 841850. The sole responsibility for the content lies with the authors. It does
not necessarily reflect the opinion of the European Communities. The European Commission is not responsible to
any use that may be made of the information contained therein.
H2020 DRIVE 0_841850_WP6_Task 6.1 2
Summary
To achieve a decarbonized European society in general, the decarbonization of the built environment is one
of the most important and complex challenges. The built environment is responsible for 40% of final energy
consumption in the EU and embodied energy in buildings accounts for up to 60% of the building’s life cycle
energy, with collateral embodied CO2. Within the EU more than 50% of all extracted materials are attributed
to buildings. This exploitation of natural resources and its collateral environmental impact is a serious threat
to the natural, social and economic systems in the EU. Renewable energy technologies as well as reuse and
recycling of resources are needed to overcome this challenge. Therefor a transition to both a deep and
circular renovation of the total European built environment is necessary to meet the challenge of
decarbonization. However, current deep renovation solutions take merely the operational energy aspects
into account and not the embodied aspects such as embodied energy and embodied CO2.
In the EU project DRIVE 0 ‘Driving decarbonization of the EU building stock by enhancing a consumer centred
and locally based circular renovation process’, the aim is to develop circular deep renovation solutions,
addressing both operational and embodied impacts. Seven demonstrators are selected in seven countries,
representing different climatic zones in Europe, each with a specific local driver to explore the potential of
circular deep renovations. However, one of the ongoing challenges in academia and practice is how to assess
the level of circularity and provide guidance to improve the level of circularity, especially in this complex field
of the exisiting built environment.
The aim of this report is twofold. Firstly, this report presents a benchmark assessment of the circularity of
the seven demonstrators, by linking Building Environmental Assessment (with Embodied Energy and
Embodied CO2 as indicators), with Building Circularity Indicators (BCIs) and Design for Disassembly (DfD)
criteria. Secondly, this report presents a thorough literature review related to circularity assessment for the
built environment by discussing the current state of the art methodologies and approaches.
In the seven demonstrators, the Embodied Energy ranges between 1,49 GJ/m2 and 7,60 GJ/m2, while the
Embodied CO2 ranges between 0,15 tCO2/m2 and 0,73 tCO2/m2. The BCI ranges between 0,28; 0,27; and 0,28
and 0,10; 0,13; and 0,12, with respect to the mass, Embodied Energy and Embodied CO2 respectively. The
percentage of recoverable materials, in terms of mass, ranges between 24% and 86%.
This report gives insight in the environmental impact of the embodied aspects of the demonstrator as they
are now, and throughout the project, this impact will change due to material increase, decrease and change.
Moreover, the embodied (materials) related environmental impact will be combined with the operational
(energy) related impact to generate insight in the Life Cycle environmental impact.
This first benchmark shows the possibilities of combining environmental impact indicators with DfD
indicators to assess the level of circularity and provides guidance to improve the level of circularity. However,
more precise methodologies with respect to the self-declaration of practitioners and experts are needed to
assess the recovering potential of materials. In this first benchmark study the results presented show
different interpretation of the DfD indicators between the different demonstrators, giving insight in the
complexity of the scope, boundary conditions, and necessity of criteria to indicate to what extext the DfD
indicators relate to a material, a component in and of itself and its relationship to its context or all three
aspects.
H2020 DRIVE 0_841850_WP6_Task 6.1 3
Revision and history chart: VERSION DATE EDITORS COMMENT
Version 0 26-01-2020 DC, MRI First version provided
Version 1 09-03-2020 DC, MRI First version revised
Version 27-03-2020 DC, MRI First version submitted
Table of content
1 Introduction ............................................................................................................................................... 6
1.1 Material Passport ............................................................................................................................... 8
1.2 Reclamation Audit .............................................................................................................................. 9
1.3 Embodied Energy and Embodied CO2 .............................................................................................. 11
2 Assessment methodologies state-of-art for the built environment........................................................ 13
2.1 Life Cycle Assessment ...................................................................................................................... 14
2.2 Building Assessment Certificate ....................................................................................................... 16
2.3 Circularity Indicators ........................................................................................................................ 19
2.4 Design Criteria and Environmental Product Performance ............................................................... 23
2.5 Software ........................................................................................................................................... 29
3 A preliminary benchmarking ................................................................................................................... 32
3.1 Demonstrators description .............................................................................................................. 32
3.2 Mass, Embodied Energy and Embodied CO2 of materials ............................................................... 33
4 Towards a Circularity Readiness Indicator ............................................................................................... 39
4.1 Further improvement on Circularity Assessment ............................................................................ 39
4.2 Quantifying Recovering Potential .................................................................................................... 40
4.3 Results and Discussion ..................................................................................................................... 42
4.3.1. Recoverable percentage ........................................................................................................................ 42
4.3.2. Building Circularity Indicator.................................................................................................................. 44
5 Concluding Remarks ................................................................................................................................ 46
5.1 Recommendation and further improvements ................................................................................. 46
6 Bibliography ............................................................................................................................................. 47
Annex 1: List of relevant EPIs .......................................................................................................................... 50
Annex 2: Software and Database List .............................................................................................................. 53
Annex 3: Preliminary Survey ............................................................................................................................ 54
Annex 4: Bill of Materials ................................................................................................................................. 60
Annex 5: Explanations of the Design for Disassembly criteria ........................................................................ 90
H2020 DRIVE 0_841850_WP6_Task 6.1 4
List of Figures
Figure 1: From a sustainable to a regenerative approach representation. ...................................................... 6
Figure 2: Material End of Life Sankey diagram in the Netherlands. .................................................................. 7
Figure 3: Schematic representation of material information collected within the Madaster platform ........... 9
Figure 4: Percentage of identified components in a building with a recycling/reusing potential .................. 10
Figure 5: Representation of a reclamation audit process and possible paths for materials ........................... 11
Figure 6: Embodied Energy and Operational Energy representation. ............................................................ 12
Figure 7: Example of a weighting process for a Life Cycle Analysis: Recipe method ...................................... 15
Figure 8: Example of a weighting process for a Life Cycle Analysis: Sustainability Score. .............................. 16
Figure 9: New criteria proposed by the Dutch Green Building Council to integrate the BREEAM ................. 18
Figure 10: Material Circularity Indicator representation proposed by the Ellen MacArthur Foundation ...... 20
Figure 11: Building Circularity Indicator representation proposed by Verberne J.J.H .................................... 22
Figure 12: Building Circularity Indicator representation proposed by Alba Concepts .................................... 23
Figure 13: The layers of Brand…………………………………………………………………………………………………………………….24
Figure 14: Key aspects of building transformation .......................................................................................... 24
Figure 15: Weight for a Building Adaptative Index ......................................................................................... 26
Figure 16: Three levels classification of LCA software .................................................................................... 29
Figure 17: LCA software for the built environment and related Life Cycle Phases ......................................... 30
Figure 18: LadyBug tools collection ................................................................................................................. 31
Figure 19: Mass, embodied energy and CO2 per square meter per building layers. ...................................... 36
Figure 20: Mass, embodied energy and CO2 per square meter per End of Life strategy. .............................. 38
Figure 21: General representation of convergence among Macro, Meso and Micro assessment ................. 39
Figure 22: Generalization of the Material Circularity Indicator of the Ellen MacArthur Foundation. ............ 40
Figure 23: Estimation of the recovering potential for the seven demonstrators ........................................... 43
Figure 24: Building Circularity Indicators for the seven demonstrators with the two adopted approaches. . 44
Figure 25: Examples of interdependent elements or modular assembly. ...................................................... 91
Figure 26: Examples of form containment. ..................................................................................................... 92
List of Tables
Table 1: Relationships between Report Section and Drive 0 Tasks................................................................... 8
Table 2: Design factors for Design for Dissassembly. ...................................................................................... 25
Table 3: Fuzzy variables for DfD and relative weights depending on specific component and joint features 27
Table 4: General eco-design KPI for Design for Deconstruction. ................................................................... 28
Table 5: Drive 0 seven demonstrators overview. ............................................................................................ 32
Table 6: Mandatory and Optional Building Assessment Certificate ................................................................ 33
Table 7: General information of material within demonstrators. ................................................................... 33
Table 8: Embodied energy and Embodied CO2 of material within demonstrators. ........................................ 35
Table 9: The four DfD aspects adopted for the Drive 0 project. ..................................................................... 41
Table 10: Example of assessment of the Design for Disassembly criteria of two components. .................... 41
Table 11: Building Circularity Indicators for the seven demonstrators. .......................................................... 44
Table 12: Design for Disassembly criteria........................................................................................................ 90
H2020 DRIVE 0_841850_WP6_Task 6.1 5
Abbreviations
ALO/ULO Agricultural/Urban Land Occupation
HVAC Heating, Ventilation and Air Conditioning
BAC Building Assessment Certificate ICE Inventory on CO2 and Energy
BAMB Buildings As Material Banks IEE Initial Embodied Energy
BCI Building Circularity Indicator IR Intrinsic Recyclability
BIM Building Information Model ISO
International Standardisation Organisation
BoM Bill of Materials KPI Key Performance Indicator
CAD Computer Aided Design LCA Life Cycle Assessment
CC Climate Change LCC Life Cycle Costs
CE Circular Economy LCE Life Cycle Energy
CI Circularity Indicators LCSA Life Cycle Sustainability Assessment
DEE Demolition Embodied Energy MCA Multiple Correspondence Analysis
DfAD Design for Adaptability MCDA Multi Criteria Decision Analysis
DfD Design for Dissassembly MCI Material Circularity Indicator
DfF Design for Flexibility MIM Environmental Impact Monitor
DfR Design for Reuse/Recycling MRD Mineral Resource Depletion
DGBC Dutch Green Building Council MRS Material Reutilization Score
ECO2 Embodied CO2 nZEB nearly Zero Energy Building
EE Embodied Energy OE Operational Energy
EIO-LCA Extended Input-Output-based LCA PCI Product Circularity Indicator
EMF Ellen MacArthur Foundation RC Recycled Content
EoL End of Life REE Recurrent Embodied Energy
EPD Environmental Product Declaration RPI Resource Potential Indicator
EPI Environmental Product Performance Indicator SCI System Circularity Indicator
EROI Energy Return on Investment SLCA Social Life Cycle Assessment
EU European Union UNEP
United Nations Environmental Program
FFD Fossil Fuel Depletion VBRE Value Based Resource Efficiency
GHGs Green House Gases VPL Visual Programming Language
GWP Global Warming Potential WD Water Depletion
H2020 DRIVE 0_841850_WP6_Task 6.1 6
1 Introduction
The current economic system is based on the linear sequence of "take-make-use-dispose", relying on the
exploitation of raw materials and on the irreversible disposal of waste at the end of life. The actual model is
highly unsustainable: it produces annually more than 11bn tons of waste worldwide and over 50% of
greenhouse Gases (GHGs) emissions derive from raw materials management activities, i.e. extraction,
manufacturing, transportation and disposal [1]. In the European Union (EU), on average, resources are
exploited faster than the speed the planet is able to regenerate them [2]. A circular economy can contribute
to mitigate and avoid the negative externalities by following the principles stated by the Ellen MacArthur
Foundation, i.e. design out of waste and pollution, keep products and materials in use and regenerate natural
systems. We cannot just “do less bad”: a redesign of the whole production supply chain is necessary to
decouple the raw resources demand from the economic growth. In other words, a circular economy is
regenerative by design.
The built environment, as one of the most environmentally impactful economic sectors, needs to move from
an unsustainable to a “near zero impact” sector and contribute to a regenerative human activity. Generally,
current approaches tend to only reduce the negative externalities. On the other side of the spectrum,
regenerative design aims to empower the health and the wellbeing of human and of natural ecosystems. To
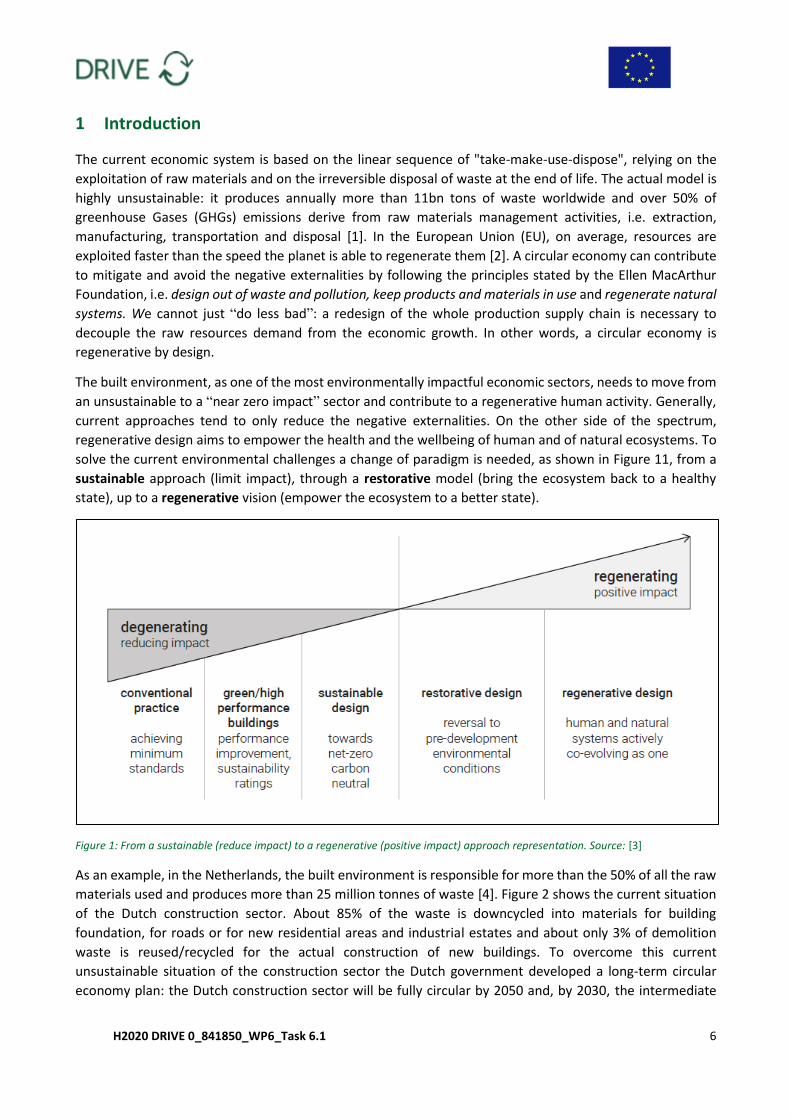
solve the current environmental challenges a change of paradigm is needed, as shown in Figure 11, from a
sustainable approach (limit impact), through a restorative model (bring the ecosystem back to a healthy
state), up to a regenerative vision (empower the ecosystem to a better state).
Figure 1: From a sustainable (reduce impact) to a regenerative (positive impact) approach representation. Source: [3]
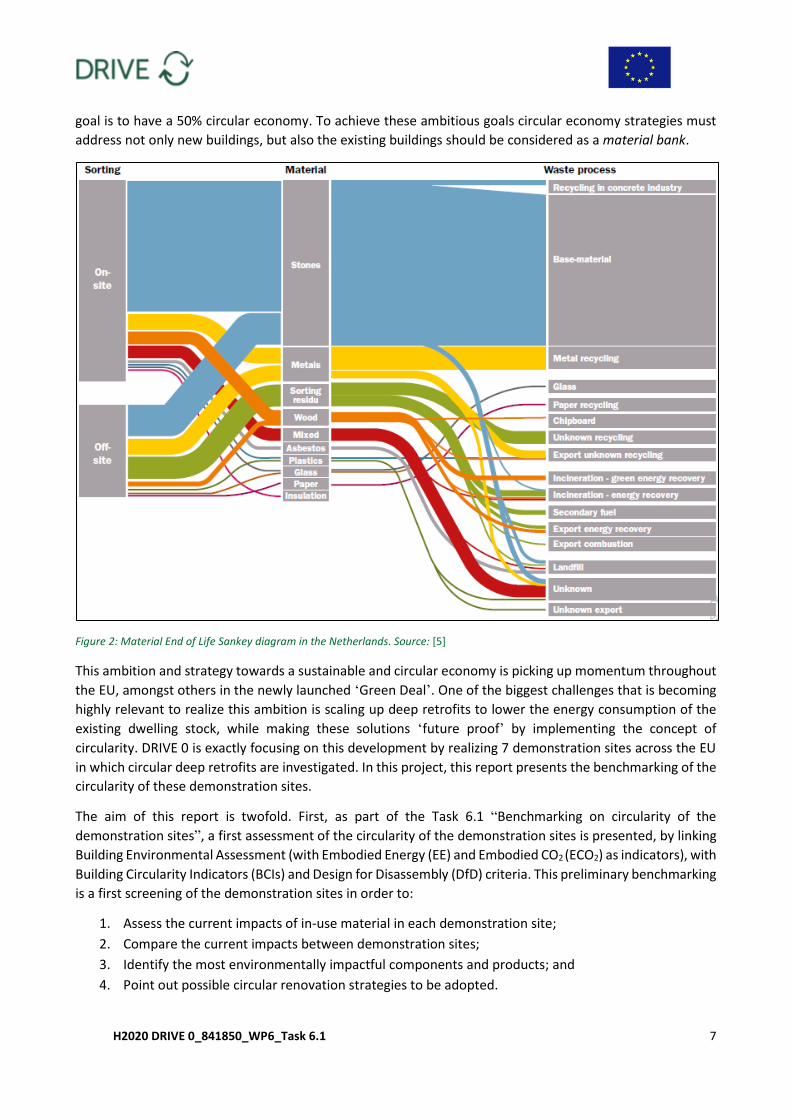
As an example, in the Netherlands, the built environment is responsible for more than the 50% of all the raw
materials used and produces more than 25 million tonnes of waste [4]. Figure 2 shows the current situation
of the Dutch construction sector. About 85% of the waste is downcycled into materials for building
foundation, for roads or for new residential areas and industrial estates and about only 3% of demolition
waste is reused/recycled for the actual construction of new buildings. To overcome this current
unsustainable situation of the construction sector the Dutch government developed a long-term circular
economy plan: the Dutch construction sector will be fully circular by 2050 and, by 2030, the intermediate
H2020 DRIVE 0_841850_WP6_Task 6.1 7
goal is to have a 50% circular economy. To achieve these ambitious goals circular economy strategies must
address not only new buildings, but also the existing buildings should be considered as a material bank.
Figure 2: Material End of Life Sankey diagram in the Netherlands. Source: [5]
This ambition and strategy towards a sustainable and circular economy is picking up momentum throughout
the EU, amongst others in the newly launched ‘Green Deal’. One of the biggest challenges that is becoming
highly relevant to realize this ambition is scaling up deep retrofits to lower the energy consumption of the
existing dwelling stock, while making these solutions ‘future proof’ by implementing the concept of
circularity. DRIVE 0 is exactly focusing on this development by realizing 7 demonstration sites across the EU
in which circular deep retrofits are investigated. In this project, this report presents the benchmarking of the
circularity of these demonstration sites.
The aim of this report is twofold. First, as part of the Task 6.1 “Benchmarking on circularity of the
demonstration sites”, a first assessment of the circularity of the demonstration sites is presented, by linking
Building Environmental Assessment (with Embodied Energy (EE) and Embodied CO2 (ECO2) as indicators), with
Building Circularity Indicators (BCIs) and Design for Disassembly (DfD) criteria. This preliminary benchmarking
is a first screening of the demonstration sites in order to:
1. Assess the current impacts of in-use material in each demonstration site;
2. Compare the current impacts between demonstration sites;
3. Identify the most environmentally impactful components and products; and
4. Point out possible circular renovation strategies to be adopted.
H2020 DRIVE 0_841850_WP6_Task 6.1 8
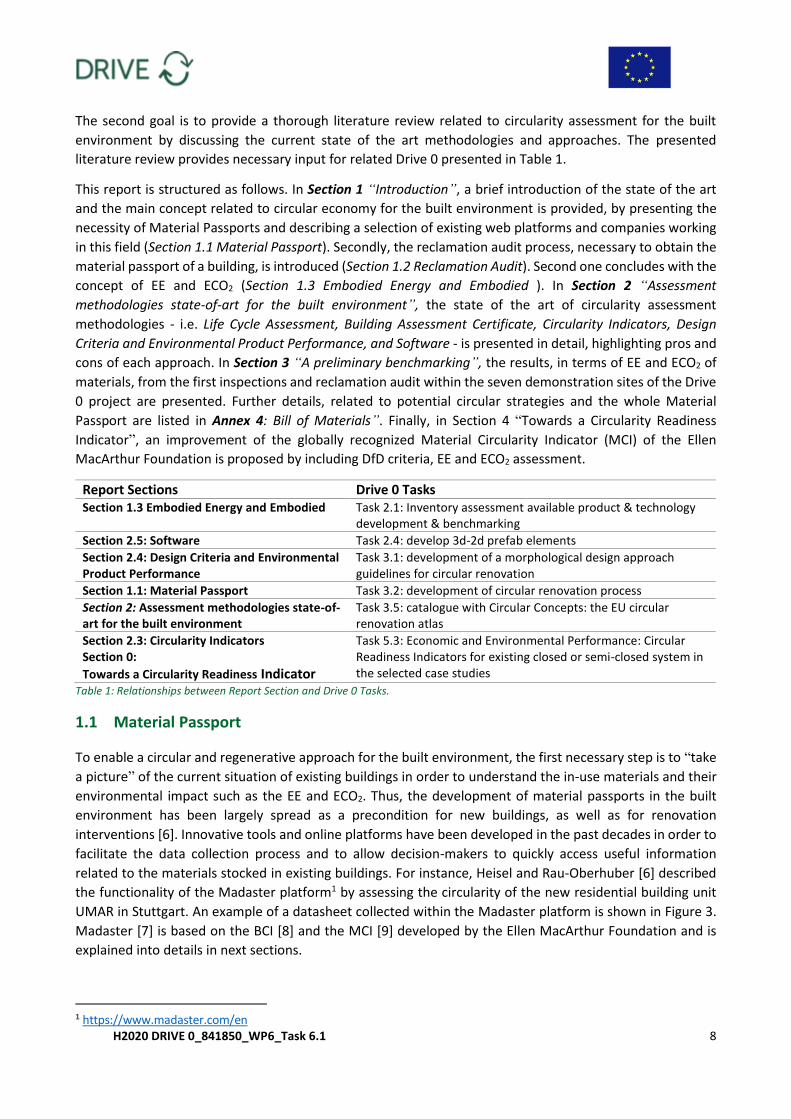
The second goal is to provide a thorough literature review related to circularity assessment for the built
environment by discussing the current state of the art methodologies and approaches. The presented
literature review provides necessary input for related Drive 0 presented in Table 1.
This report is structured as follows. In Section 1 “Introduction”, a brief introduction of the state of the art
and the main concept related to circular economy for the built environment is provided, by presenting the
necessity of Material Passports and describing a selection of existing web platforms and companies working
in this field (Section 1.1 Material Passport). Secondly, the reclamation audit process, necessary to obtain the
material passport of a building, is introduced (Section 1.2 Reclamation Audit). Second one concludes with the
concept of EE and ECO2 (Section 1.3 Embodied Energy and Embodied ). In Section 2 “Assessment
methodologies state-of-art for the built environment”, the state of the art of circularity assessment
methodologies - i.e. Life Cycle Assessment, Building Assessment Certificate, Circularity Indicators, Design
Criteria and Environmental Product Performance, and Software - is presented in detail, highlighting pros and
cons of each approach. In Section 3 “A preliminary benchmarking”, the results, in terms of EE and ECO2 of
materials, from the first inspections and reclamation audit within the seven demonstration sites of the Drive
0 project are presented. Further details, related to potential circular strategies and the whole Material
Passport are listed in Annex 4: Bill of Materials”. Finally, in Section 4 “Towards a Circularity Readiness
Indicator”, an improvement of the globally recognized Material Circularity Indicator (MCI) of the Ellen
MacArthur Foundation is proposed by including DfD criteria, EE and ECO2 assessment.
Report Sections Drive 0 Tasks Section 1.3 Embodied Energy and Embodied Task 2.1: Inventory assessment available product & technology
development & benchmarking
Section 2.5: Software Task 2.4: develop 3d-2d prefab elements
Section 2.4: Design Criteria and Environmental Product Performance
Task 3.1: development of a morphological design approach guidelines for circular renovation
Section 1.1: Material Passport Task 3.2: development of circular renovation process
Section 2: Assessment methodologies state-of-art for the built environment
Task 3.5: catalogue with Circular Concepts: the EU circular renovation atlas
Section 2.3: Circularity Indicators Section 0:
Towards a Circularity Readiness Indicator
Task 5.3: Economic and Environmental Performance: Circular Readiness Indicators for existing closed or semi-closed system in the selected case studies
Table 1: Relationships between Report Section and Drive 0 Tasks.
1.1 Material Passport
To enable a circular and regenerative approach for the built environment, the first necessary step is to “take
a picture” of the current situation of existing buildings in order to understand the in-use materials and their
environmental impact such as the EE and ECO2. Thus, the development of material passports in the built
environment has been largely spread as a precondition for new buildings, as well as for renovation
interventions [6]. Innovative tools and online platforms have been developed in the past decades in order to
facilitate the data collection process and to allow decision-makers to quickly access useful information
related to the materials stocked in existing buildings. For instance, Heisel and Rau-Oberhuber [6] described
the functionality of the Madaster platform1 by assessing the circularity of the new residential building unit
UMAR in Stuttgart. An example of a datasheet collected within the Madaster platform is shown in Figure 3.
Madaster [7] is based on the BCI [8] and the MCI [9] developed by the Ellen MacArthur Foundation and is
explained into details in next sections.
1 https://www.madaster.com/en

H2020 DRIVE 0_841850_WP6_Task 6.1 9
Figure 3: Schematic representation of material information collected within the Madaster platform. Source: [6]
Recently, in the EU funded BAMB project (Buildings As Material Banks)2, an online platform was developed
to increase the value of building materials and to enable circular solutions in the built environment. Within
the BAMB project, a circular building assessment prototype has been developed as a Beta version software.
This platform provides the assessment of reuse potential in a building design (BIM/CAD model) based upon
design decisions, material selection criteria, combined with BAMB generated datasets and other
external/user supplied data. The Dutch CIRDAX online platform3 provides a similar service. Starting from the
materials passport they offer a management online dashboard in order to have an overview of all the in-use
materials with additional information such as pictures, EE and ECO2 of materials. A module to integrate
BIM/CAD model is currently under development.
All investigated platforms and companies focus currently on the circular assessment of existing buildings and
on the data management and visualization of the bill of materials. Both Madaster and Cirdax evaluate the
potentially recoverable materials and components through a reclamation audit conducted by experts.
1.2 Reclamation Audit
A reclamation audit is a process in which the reuse, recycling or remanufacturing potential of the materials
used within a building is assessed and evaluated. The main aim is to highlight which products and components
may be reclaimed instead of being disposed into landfill or for energy recovery. Basically, the output of a
reclamation audit is an inventory of materials containing, at least, 1) enough information related to
products’ characteristic (quality, amount, type, …) and 2) optional and additional insights on possible
destinations, technical characteristics and tips for disassembly and removal process. Such an inventory
allows the owner, the involved architects or any other stakeholder in the demolition/renovation process to
indicate to a demolition/renovation contractors/subcontractors which components or products must be
carefully dismantled and to provide to them the necessary disassembly information. Moreover, third parties,
material or second-hand markets can be informed or involved in the selling process.
Generally, a reclamation audit can be conducted by the building owners, consultants (architects, engineers),
reuse/circular economy experts, reclamation dealers or construction/demolition contractors. Every
stakeholder in the construction sector has a different view on the recycling/reusing potential of products,
components or materials, as indicated in Figure 4. It is straightforward that a reclamation audit, in order to
be successful, has to be conducted by expert stakeholders such as consultants (architects/engineers) or a
dedicated salvage dealer. It seems, nowadays, that other stakeholders as the general or demolition
2 https://www.bamb2020.eu/ 3 https://www.cirdax.com/

H2020 DRIVE 0_841850_WP6_Task 6.1 10
contractors have not the skills, or they have no interest in identifying components for a potential
recycling/reuse subsequent step. The worst result is obtained by the owner itself.
Figure 4: Percentage of identified components and products in a building with a recycling/reusing potential by different construction stakeholders. Source: [10]
Finally, what defines if a material or a single component is potentially recyclable or reusable? Which are the
features/characteristics to identify the material and component? A preliminary list, not exhaustive, of the
main aspects which affect the feasibility to close the material loop is:
Easiness of dismantling/disassembly;
Existence of a demand;
Intrinsic qualities (aesthetic, technical, ...);
Condition and quality;
Price of the new equipment;
Logistics involved;
Etc.
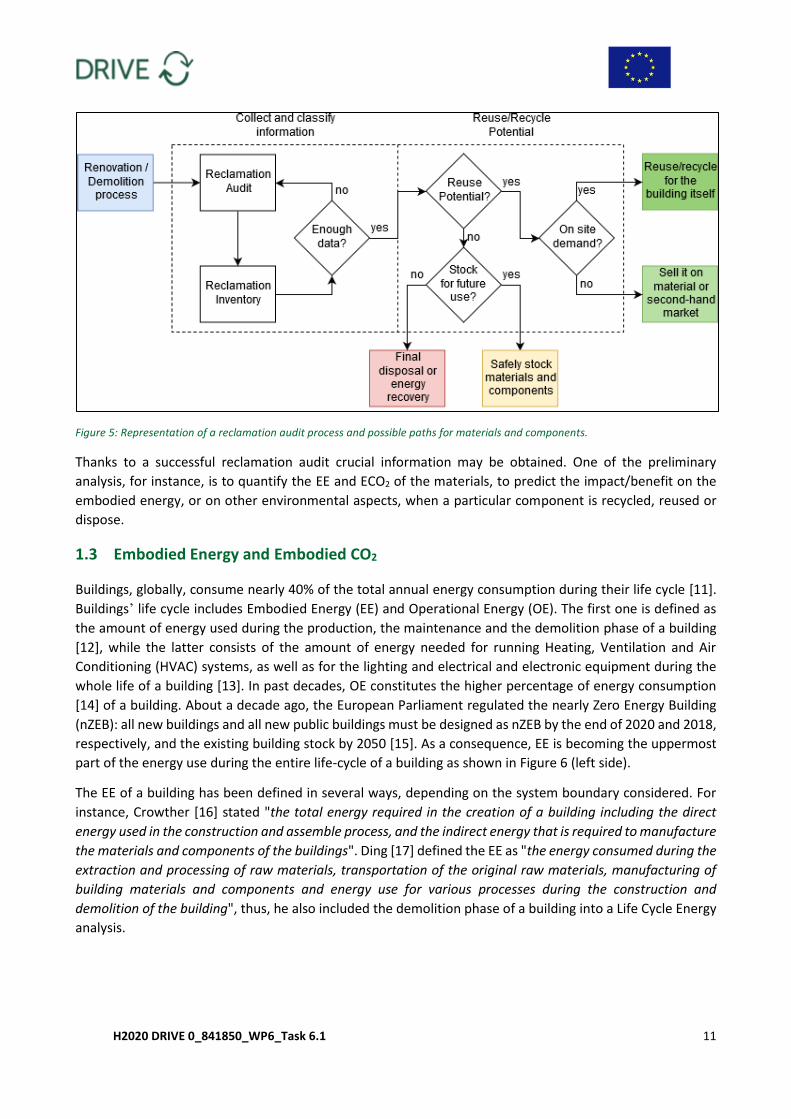
Currently, a recognized and standardized protocol does not exist. Typically, reclamation audits are conducted
by experts who identify reusable / recyclable components and materials according to their previous
knowledge and background. Figure 5 shows a representation of a reclamation audit and the possible paths
for components, products and materials during a renovation / demolition process of a building. Even if a
protocol does not exist yet and there is no consensus on the proper approach, several DfD criteria are largely
adopted by practitioners and experts and will be discussed in next sections.
H2020 DRIVE 0_841850_WP6_Task 6.1 11
Figure 5: Representation of a reclamation audit process and possible paths for materials and components.
Thanks to a successful reclamation audit crucial information may be obtained. One of the preliminary
analysis, for instance, is to quantify the EE and ECO2 of the materials, to predict the impact/benefit on the
embodied energy, or on other environmental aspects, when a particular component is recycled, reused or
dispose.
1.3 Embodied Energy and Embodied CO2
Buildings, globally, consume nearly 40% of the total annual energy consumption during their life cycle [11].
Buildings’ life cycle includes Embodied Energy (EE) and Operational Energy (OE). The first one is defined as
the amount of energy used during the production, the maintenance and the demolition phase of a building
[12], while the latter consists of the amount of energy needed for running Heating, Ventilation and Air
Conditioning (HVAC) systems, as well as for the lighting and electrical and electronic equipment during the
whole life of a building [13]. In past decades, OE constitutes the higher percentage of energy consumption
[14] of a building. About a decade ago, the European Parliament regulated the nearly Zero Energy Building
(nZEB): all new buildings and all new public buildings must be designed as nZEB by the end of 2020 and 2018,
respectively, and the existing building stock by 2050 [15]. As a consequence, EE is becoming the uppermost
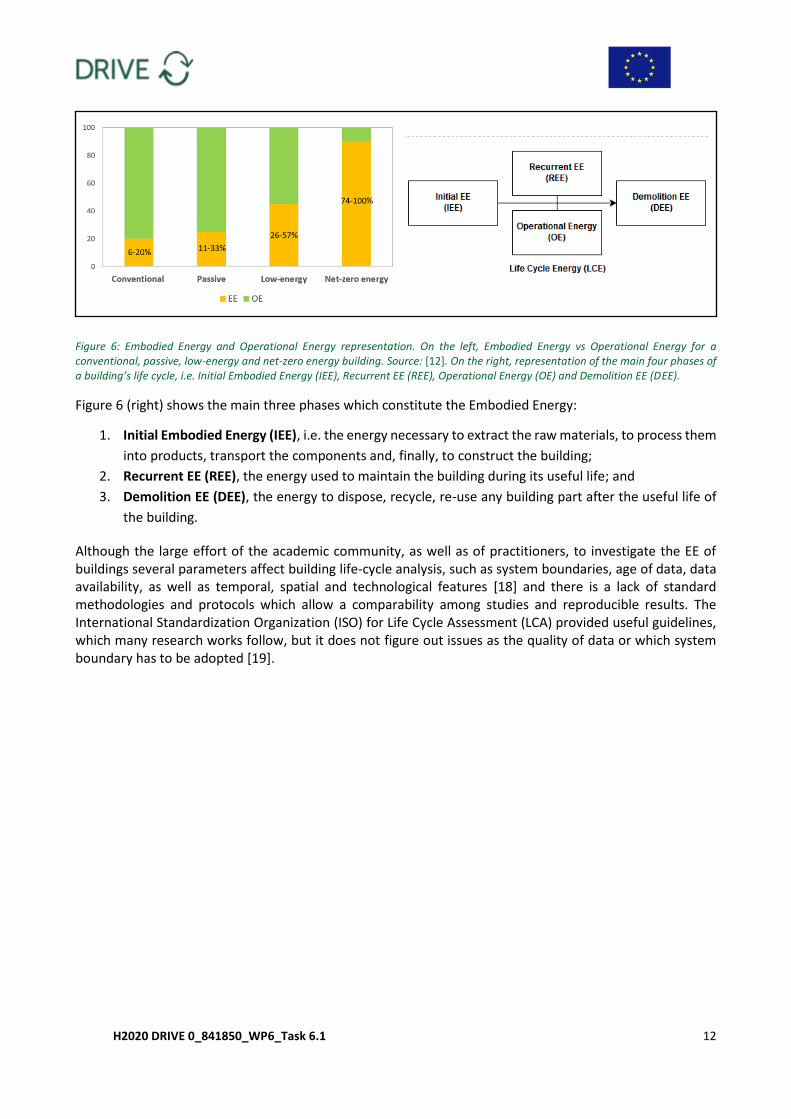
part of the energy use during the entire life-cycle of a building as shown in Figure 6 (left side).
The EE of a building has been defined in several ways, depending on the system boundary considered. For
instance, Crowther [16] stated "the total energy required in the creation of a building including the direct
energy used in the construction and assemble process, and the indirect energy that is required to manufacture
the materials and components of the buildings". Ding [17] defined the EE as "the energy consumed during the
extraction and processing of raw materials, transportation of the original raw materials, manufacturing of
building materials and components and energy use for various processes during the construction and
demolition of the building", thus, he also included the demolition phase of a building into a Life Cycle Energy
analysis.
H2020 DRIVE 0_841850_WP6_Task 6.1 12
Figure 6: Embodied Energy and Operational Energy representation. On the left, Embodied Energy vs Operational Energy for a conventional, passive, low-energy and net-zero energy building. Source: [12]. On the right, representation of the main four phases of a building’s life cycle, i.e. Initial Embodied Energy (IEE), Recurrent EE (REE), Operational Energy (OE) and Demolition EE (DEE).
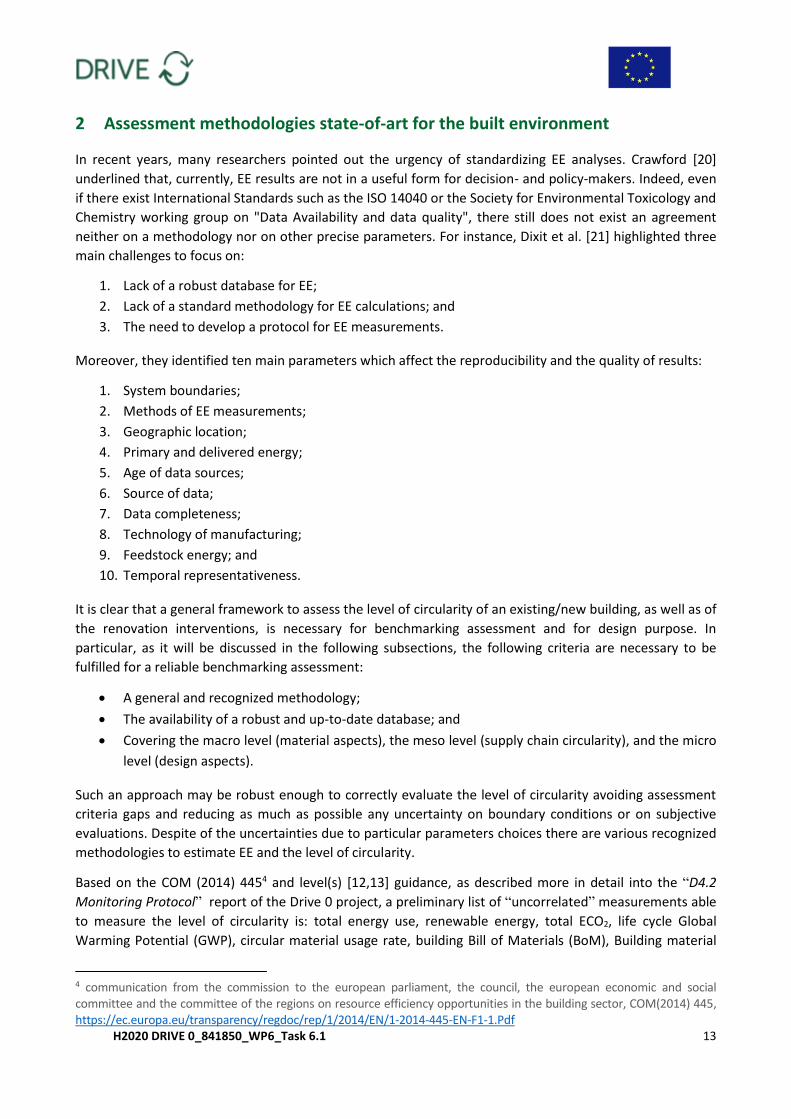
Figure 6 (right) shows the main three phases which constitute the Embodied Energy:
1. Initial Embodied Energy (IEE), i.e. the energy necessary to extract the raw materials, to process them
into products, transport the components and, finally, to construct the building;
2. Recurrent EE (REE), the energy used to maintain the building during its useful life; and
3. Demolition EE (DEE), the energy to dispose, recycle, re-use any building part after the useful life of
the building.
Although the large effort of the academic community, as well as of practitioners, to investigate the EE of buildings several parameters affect building life-cycle analysis, such as system boundaries, age of data, data availability, as well as temporal, spatial and technological features [18] and there is a lack of standard methodologies and protocols which allow a comparability among studies and reproducible results. The International Standardization Organization (ISO) for Life Cycle Assessment (LCA) provided useful guidelines, which many research works follow, but it does not figure out issues as the quality of data or which system boundary has to be adopted [19].
H2020 DRIVE 0_841850_WP6_Task 6.1 13
2 Assessment methodologies state-of-art for the built environment
In recent years, many researchers pointed out the urgency of standardizing EE analyses. Crawford [20]
underlined that, currently, EE results are not in a useful form for decision- and policy-makers. Indeed, even
if there exist International Standards such as the ISO 14040 or the Society for Environmental Toxicology and
Chemistry working group on "Data Availability and data quality", there still does not exist an agreement
neither on a methodology nor on other precise parameters. For instance, Dixit et al. [21] highlighted three
main challenges to focus on:
1. Lack of a robust database for EE;
2. Lack of a standard methodology for EE calculations; and
3. The need to develop a protocol for EE measurements.
Moreover, they identified ten main parameters which affect the reproducibility and the quality of results:
1. System boundaries;
2. Methods of EE measurements;
3. Geographic location;
4. Primary and delivered energy;
5. Age of data sources;
6. Source of data;
7. Data completeness;
8. Technology of manufacturing;
9. Feedstock energy; and
10. Temporal representativeness.
It is clear that a general framework to assess the level of circularity of an existing/new building, as well as of
the renovation interventions, is necessary for benchmarking assessment and for design purpose. In
particular, as it will be discussed in the following subsections, the following criteria are necessary to be
fulfilled for a reliable benchmarking assessment:
A general and recognized methodology;
The availability of a robust and up-to-date database; and
Covering the macro level (material aspects), the meso level (supply chain circularity), and the micro
level (design aspects).
Such an approach may be robust enough to correctly evaluate the level of circularity avoiding assessment
criteria gaps and reducing as much as possible any uncertainty on boundary conditions or on subjective
evaluations. Despite of the uncertainties due to particular parameters choices there are various recognized
methodologies to estimate EE and the level of circularity.
Based on the COM (2014) 4454 and level(s) [12,13] guidance, as described more in detail into the “D4.2
Monitoring Protocol” report of the Drive 0 project, a preliminary list of “uncorrelated” measurements able
to measure the level of circularity is: total energy use, renewable energy, total ECO2, life cycle Global
Warming Potential (GWP), circular material usage rate, building Bill of Materials (BoM), Building material
4 communication from the commission to the european parliament, the council, the european economic and social committee and the committee of the regions on resource efficiency opportunities in the building sector, COM(2014) 445, https://ec.europa.eu/transparency/regdoc/rep/1/2014/EN/1-2014-445-EN-F1-1.Pdf
H2020 DRIVE 0_841850_WP6_Task 6.1 14
passport, Environmental Product Declaration (EPD), recycled content, biobased materials, life span,
adaptability and deconstruction, durability, disassembly / reuse, de-/remountable connections, accessible
connections, construction and demolition waste and materials, construction waste, recycling rate, home
recycling, residential sharing, water consumption, re-circulation of water and Life Cycle Costs (LCC).
The necessity to aggregate and group monitoring measurements to facilitate the evaluation and the decision
process of decision-makers, designers, practitioners and involved stakeholders in general is straightforward,
as well as to better communicate results and achievements to private citizens and raise awareness on circular
practices. In conclusion, the present report will focus on the development of a general framework able to
highlight interconnections among life cycle phases, different levels of a products (materials, components,
product and supply chain) avoiding lack of data (from DB or from the process) and minimizing subjective
evaluation for circularity benchmarking and assessment.
In the following subsection, the state-of-art of the most recognized assessment methodologies is briefly
described and discussed, highlighting pros and cons of each group in order to select the most proper
benchmarking criteria and to further advance the development on the assessment of the level of circularity
in the built environment.
2.1 Life Cycle Assessment
Currently, the most adopted and recognized methods are [12]:
Process-based Life Cycle Assessment (LCA);
Environmentally Extended Input-Output-based LCA (EIO-LCA); and
Hybrid LCA.
Process-based LCA produced very precise results, allowing to quantify each step of the building life cycle but
it is “building-specific” and it suffers of an high uncertainty in the generalization of the results. The EIO-LCA
method adopts annual input-output models in order to cope the process-based LCA limitations. This model
extends system boundaries to a whole national economy and overcome building specific results by using
monetary values of the industry sectors, even if it produces sector-specific results. Finally, Hybrid LCA mixes
the two methodologies trying to optimize results by taking advantages from both techniques. According to
the ISO 14040 and the ISO 14044 standards5, a process-based LCA follows four stages:
1. Goal and scope;
2. Inventory;
3. Impact assessment; and
4. Interpretation of results.
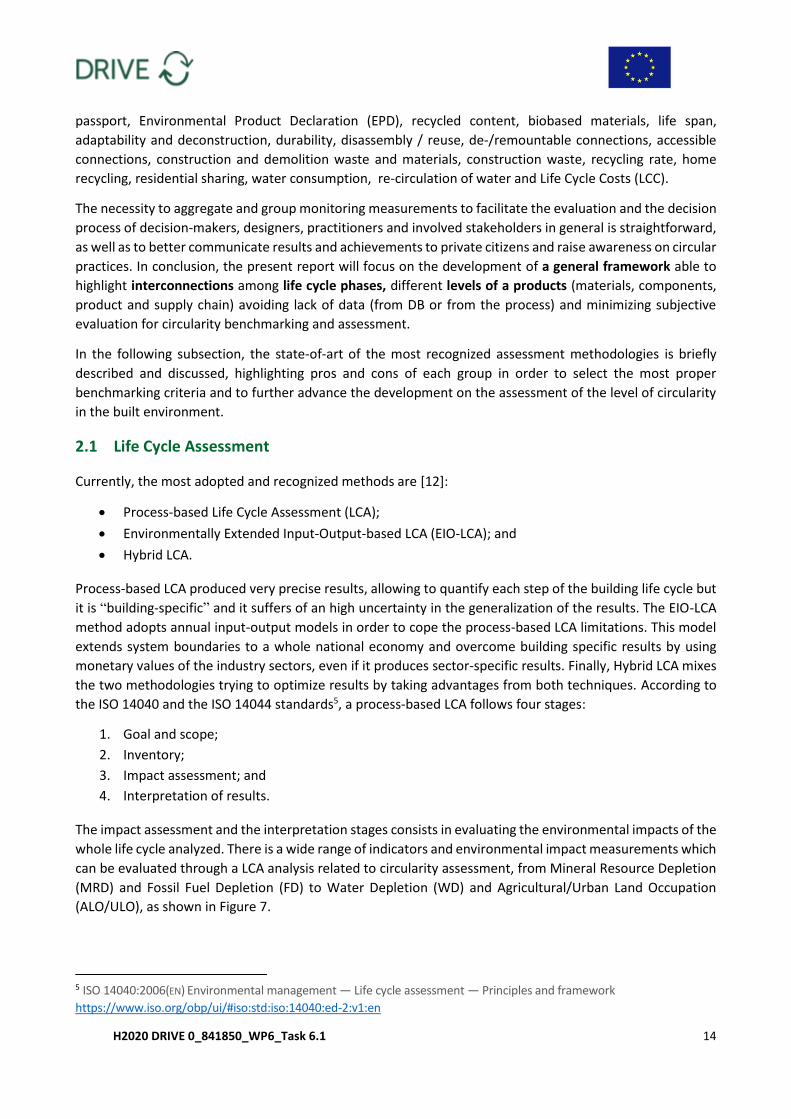
The impact assessment and the interpretation stages consists in evaluating the environmental impacts of the
whole life cycle analyzed. There is a wide range of indicators and environmental impact measurements which
can be evaluated through a LCA analysis related to circularity assessment, from Mineral Resource Depletion
(MRD) and Fossil Fuel Depletion (FD) to Water Depletion (WD) and Agricultural/Urban Land Occupation
(ALO/ULO), as shown in Figure 7.
5 ISO 14040:2006(EN) Environmental management — Life cycle assessment — Principles and framework
https://www.iso.org/obp/ui/#iso:std:iso:14040:ed-2:v1:en
H2020 DRIVE 0_841850_WP6_Task 6.1 15
Figure 7: Example of a weighting process for a Life Cycle Analysis: Recipe method. Source: [24]
With respect to the environmental assessment, the indicators are classified into Midpoints and Endpoints.
The midpoints result from environmental impact indicators such as Infra-red Forcing is a result of Climate
Change (CC) while the endpoints, generally, are aggregated indicators representing several midpoints, in
order to elaborate a simpler result for decision and policy-makers. One of the most adopted methods is the
Recipe Method [24], published for the first time in 2008 as a convergence between the CML and the Eco-
Indicator 99 methods. It consists of 18 Midpoints aggregated into 3 Endpoints6, shown in Figure 8.
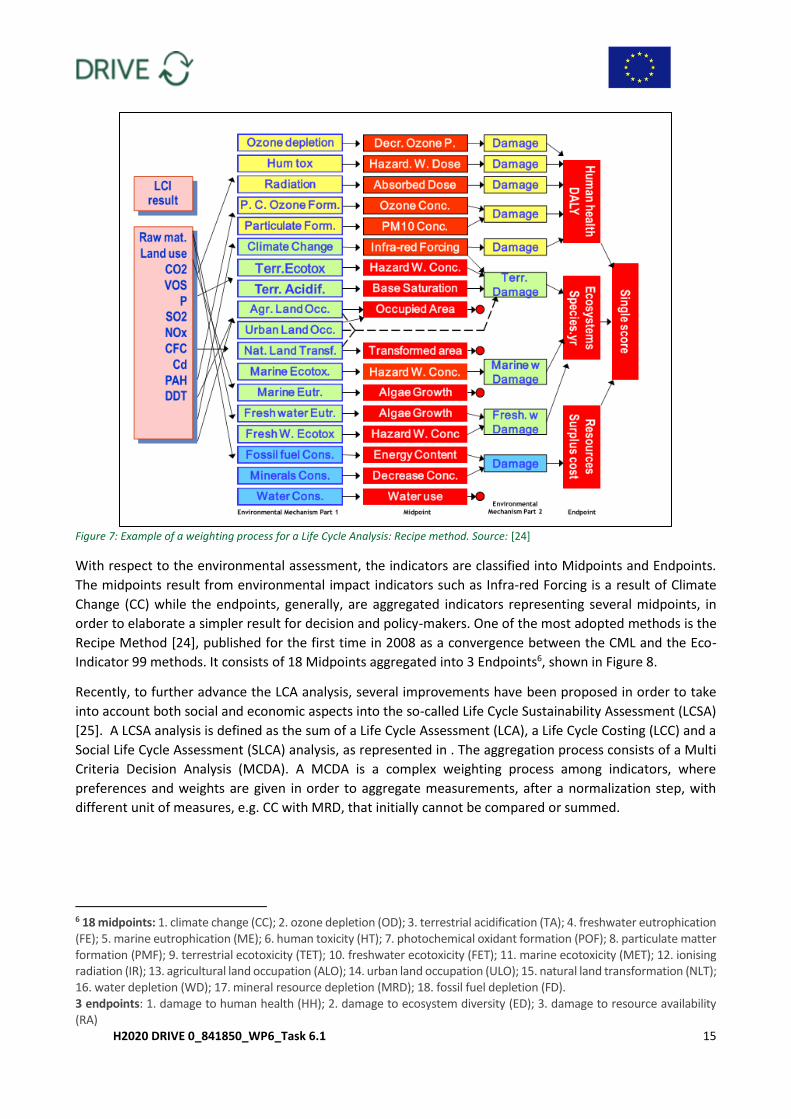
Recently, to further advance the LCA analysis, several improvements have been proposed in order to take
into account both social and economic aspects into the so-called Life Cycle Sustainability Assessment (LCSA)
[25]. A LCSA analysis is defined as the sum of a Life Cycle Assessment (LCA), a Life Cycle Costing (LCC) and a
Social Life Cycle Assessment (SLCA) analysis, as represented in . The aggregation process consists of a Multi
Criteria Decision Analysis (MCDA). A MCDA is a complex weighting process among indicators, where
preferences and weights are given in order to aggregate measurements, after a normalization step, with
different unit of measures, e.g. CC with MRD, that initially cannot be compared or summed.
6 18 midpoints: 1. climate change (CC); 2. ozone depletion (OD); 3. terrestrial acidification (TA); 4. freshwater eutrophication (FE); 5. marine eutrophication (ME); 6. human toxicity (HT); 7. photochemical oxidant formation (POF); 8. particulate matter formation (PMF); 9. terrestrial ecotoxicity (TET); 10. freshwater ecotoxicity (FET); 11. marine ecotoxicity (MET); 12. ionising radiation (IR); 13. agricultural land occupation (ALO); 14. urban land occupation (ULO); 15. natural land transformation (NLT); 16. water depletion (WD); 17. mineral resource depletion (MRD); 18. fossil fuel depletion (FD). 3 endpoints: 1. damage to human health (HH); 2. damage to ecosystem diversity (ED); 3. damage to resource availability (RA)
H2020 DRIVE 0_841850_WP6_Task 6.1 16
Figure 8: Example of a weighting process for a Life Cycle Analysis: Sustainability Score. Source: [25]
Concluding, an LCA analysis, and its improvements, is a powerful and robust methodology to assess
environmental impacts, allowing to take into account relevant dimensions for circularity, too. It’s globally
recognized and standardized, thanks to the ISO 14040 and 14044, and it relies on large available dataset.
However, a few limitations emerge, when applied to existing buildings in different countries and regions.
First, results computed by a LCA analysis are hardly generalizable due to geographical specific dataset.
Second, if it is feasible to assess recent products/services, thanks to up-to-date dataset, but assessing an
existing old building can be a very hard task, even impossible, due to lack of data on used materials and their
origin and traceability. Results from such an assessment could be meaningless due to too many assumptions
and hypotheses. Third, if a LCA of a “small” product may be feasible, in time and complexity, a whole LCA for
a ‘one of a kind’ complex buildings can be a challenging and very time-consuming task for practitioners due
to the large amount of used materials in the built environment, and the adoption of LCA, as a best practice,
can slow down due to time-constraints of practitioners, as well as lack of expertise and knowledge. This
aspect could be overcome thanks to plugin and add-on for common 2D and 3D modelling software (discussed
in a later section). Finally, to obtain a few final scores for decision-makers a weighting process is necessary;
indeed, a decision-maker can figure out, at maximum, a decision with less than 10 indicators. The
overabundance of environmental impacts may affect the decision process by reducing its efficiency.
However, weighting processes are highly criticized by the academic community [26], as well as they are not
recommended neither by the ISO standard.
2.2 Building Assessment Certificate
Nowadays, there exist dozens of certification schemes for the built environment all around the world. a
significant amount of countries has developed its own certification process with slight variations from one
scheme to another one. Lee [27] presented a comprehensive review of earlier assessment certificates of the
most known and worldwide adopted certificates: BREEAM from UK, LEED from USA, CASBEE from Japan,
BeamPlus from Hong Kong and ESGB from China 7. Many others exist, such as the Australian GreenStar, the
7 BREEAM: https://www.breeam.com/; LEED: https://new.usgbc.org/leed; CASBEE: http://www.ibec.or.jp/CASBEE/; BeamPlus: https://www.hkgbc.org.hk/eng/main/index;
H2020 DRIVE 0_841850_WP6_Task 6.1 17
Canadian BEPAC, the European EMAS and so on, but they are based on the same general assessment
approach, varying some criteria. Generally, the Building Assessment Certificates (BACs) are based on two or
more levels of criteria. Firstly, each criteria is evaluated through qualitative or quantitative questions;
secondly, many criteria are aggregated into macro categories by weighting each answer. For instance, the
BREEAM scheme was composed by three levels: 10 issues, 69 categories and 114 criteria. It includes issues
such as:
Management (22);
Health & wellbeing (14);
Energy (30);
Transport (9);
Water (9;
Materials (12);
Waste (7);
Land use & ecology (12);
Pollution (13); and
Innovation (10).
The numbers between the parentheses represent the maximum score obtainable for each issue, i.e. by
normalizing the score over the total possible score, it represents the weight for each single Issue. The LEED
scheme, instead, is based on a two levels system, categories and points. There are seven main categories:
Sustainable Sites (26);
Water Efficiency (10);
Energy & Atmosphere (35);
Materials & Resources (14);
Indoor Environment Quality (15);
Innovation in Design (6); and
Regional Priority (4).
The numbers between the parentheses represent the maximum score obtainable for each issue, i.e. by
normalizing the score over the total possible score, it represents the weight for each single Issue. Depending
on the obtained score, a final evaluation is given to the analyzed building. For instance, the LEED scheme has
a minimum score of 40-49 out of 110 to obtain the certificate, while the silver ranking is assigned for a total
score of 50-59, the gold one for 60-79 and the platinum evaluation for a score greater than 80.
Recently, there is an open debate on how to advance the BAC in order to include circularity criteria, too. For
instance, in “A framework for circular buildings” [28], the the Dutch Green Building Council (DGBC), in
collaboration with other private and public partners (Circle Economy, Metabolic, SGS Search, Redevo
Foundation) proposed new indicators to include circular economy criteria into the BREEAM scheme.
H2020 DRIVE 0_841850_WP6_Task 6.1 18
Starting from seven general strategies for the Circular Economy8 (CE), four main strategies for circular
buildings have been identified:
1. Reduce, to mitigate impacts the best strategy is to avoid new production;
2. Synergise, once resource demands have been minimized, the second strategy is identifying local
synergies;
3. Supply, the remaining resource demands must be provided by adopting clean, renewable and
recycled resources; and
4. Manage, information and data transparency are necessary for an efficient system.
These four circular strategies have been applied to the main impact indicators materials, energy, water,
biodiversity and ecosystem, human culture and society, health and wellbeing, multiple forms of value –
identifying new, or modifying existing, indicators in the BREEAM scheme.
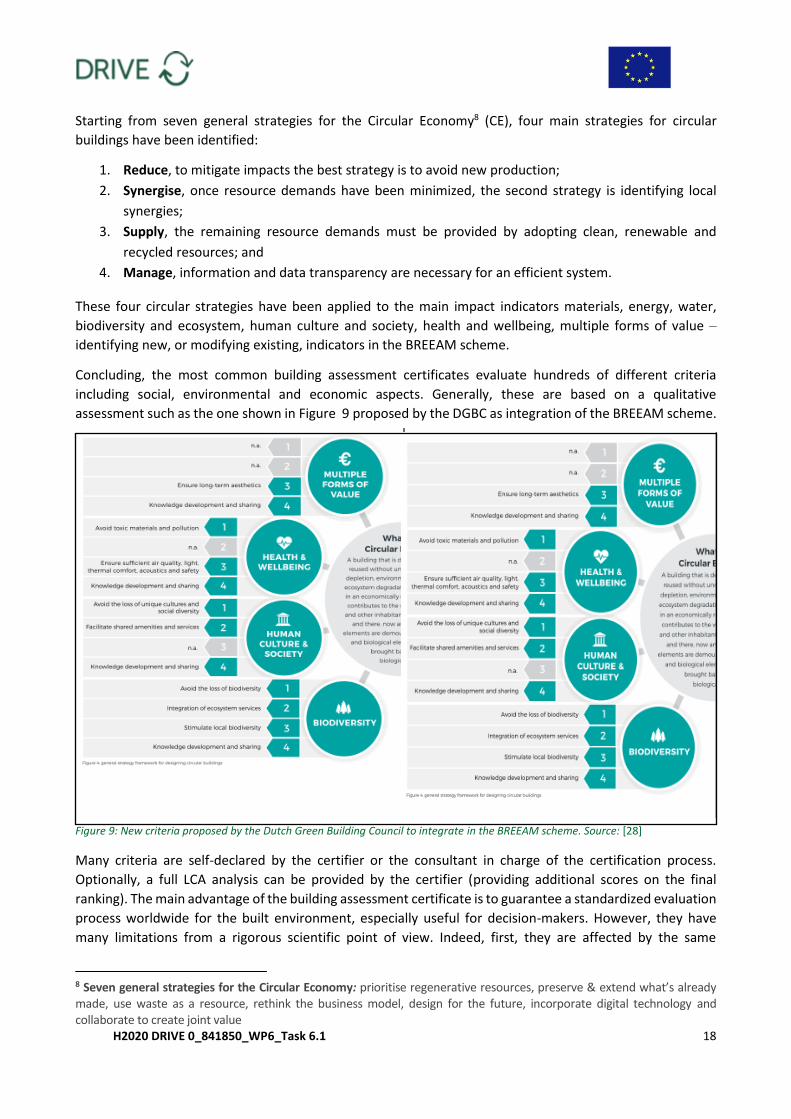
Concluding, the most common building assessment certificates evaluate hundreds of different criteria
including social, environmental and economic aspects. Generally, these are based on a qualitative
assessment such as the one shown in Figure 9 proposed by the DGBC as integration of the BREEAM scheme.
Figure 9: New criteria proposed by the Dutch Green Building Council to integrate in the BREEAM scheme. Source: [28]
Many criteria are self-declared by the certifier or the consultant in charge of the certification process.
Optionally, a full LCA analysis can be provided by the certifier (providing additional scores on the final
ranking). The main advantage of the building assessment certificate is to guarantee a standardized evaluation
process worldwide for the built environment, especially useful for decision-makers. However, they have
many limitations from a rigorous scientific point of view. Indeed, first, they are affected by the same
8 Seven general strategies for the Circular Economy: prioritise regenerative resources, preserve & extend what’s already made, use waste as a resource, rethink the business model, design for the future, incorporate digital technology and collaborate to create joint value
H2020 DRIVE 0_841850_WP6_Task 6.1 19
limitation of MCDA, i.e. the weighting process, and they can be influenced by the subjectivity of the certifier.
In addition, they roughly sum criteria related to completely different aspects without any strong and robust
methodology. Despite the criticisms, they still remain a useful tool for practitioners in order to quickly
evaluate the environmental “level” of a building, to communicate to the owners, the tenants or other
stakeholders and to roughly benchmark different buildings for decision-makers.
2.3 Circularity Indicators
In recent years, the CE gained momentum among researchers and practitioners. The academic community
put its effort to propose and introduce Circularity Indicators (CI) in order to evaluate the environmental
impact, the exploitation of virgin materials or the production of unrecoverable waste [9]. Newer metrics have
been introduced in order to assess the lifetime of products [29], the reuse potential [30] or the intensity of
use [9]. In 2019, Blanca Corona et al. [31] published a literature review proposing a classification based on
the 3E (Economy, Environment, Equity) of the most recognized CE indices, indicators and frameworks 9. They
evaluated each method based on 8 criteria:
1. Reducing input of resources;
2. Reducing emission levels (pollutants and GHG emissions);
3. Reducing material losses/waste;
4. Increasing input of renewable and recycled resources;
5. Maximising the utility and durability of products;
6. Creating local jobs at all skill levels;
7. Value added creation and distribution; and
8. Increase social wellbeing.
They concluded that none of the analyzed methods fulfils all the requirements. Saidani et al. [32], instead,
classified 55 CIs (currently, the largest categorized and ready-to-use database of circularity metrics) based on
10 criteria10:
1. Levels (micro, meso, macro);
2. Loops (maintain, reuse/remanufacture, recycle);
3. Performance (intrinsic, impacts);
4. Perspective (actual, potential);
5. Usages (e.g. improvement, benchmarking, communication);
6. Transversality (generic, sector-specific);
7. Dimension (single, multiple);
8. Units (quantitative, qualitative);
9. Format (e.g. web-based tool, Excel, formulas); and
10. Sources (academics, companies).
9 INDICES: New Product-level circularity metric, Material Circularity Indicator (MCI), CE Indicator Prototype (CEIP), Global
Circularity Metric, Circ(T), Circular Economic Value (CEV) and Circularity Index. INDICATORS: Circularity degree, Circular
Performance Indicator (CPI), Eco-efficiency index, Eco-efficient Value Ratio (EVR), Global Resource Indicator (GRI), Longevity
indicator, Resource Potential Indicator (RPI), Value-based resource efficiency (VRE) and Sustainable Circular Index (SCI).
FRAMEWORKS: Input-Output Analysis, Material Flow Analysis, Life Cycle Assessment
10 online selection tool (excel): https://linkinghub.elsevier.com/retrieve/pii/S0959652618330221
H2020 DRIVE 0_841850_WP6_Task 6.1 20
Finally, Parchomenko et al. [33] classified 63 metrics through a Multiple Correspondence Analysis (MCA) by
evaluating 24 features, mapping each metric into the Life Cycle Stage of a product/service. From their work,
it is straightforward that none of the existing metrics allows to evaluate the whole life cycle ánd take into
accounts all relevant aspects of the CE.
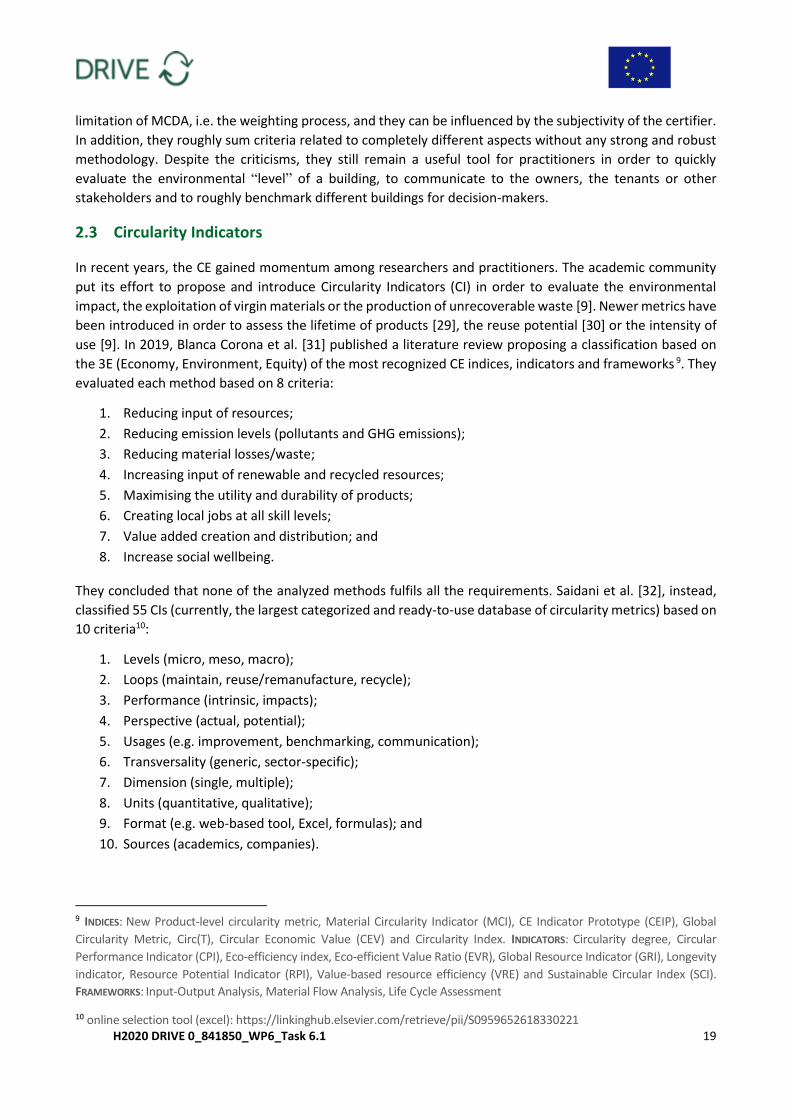
Currently, the most recognized and worldwide adopted indicator is the MCI proposed by the Ellen MacArthur
Foundation (EMF) in 2015, illustrated in Figure 10 [9]. The MCI is represented in and is based on three main
aspects:
1. The amount of Virgin Material “V”;
2. The product Utility “X”; and
3. The amount of unrecoverable Waste “W”.
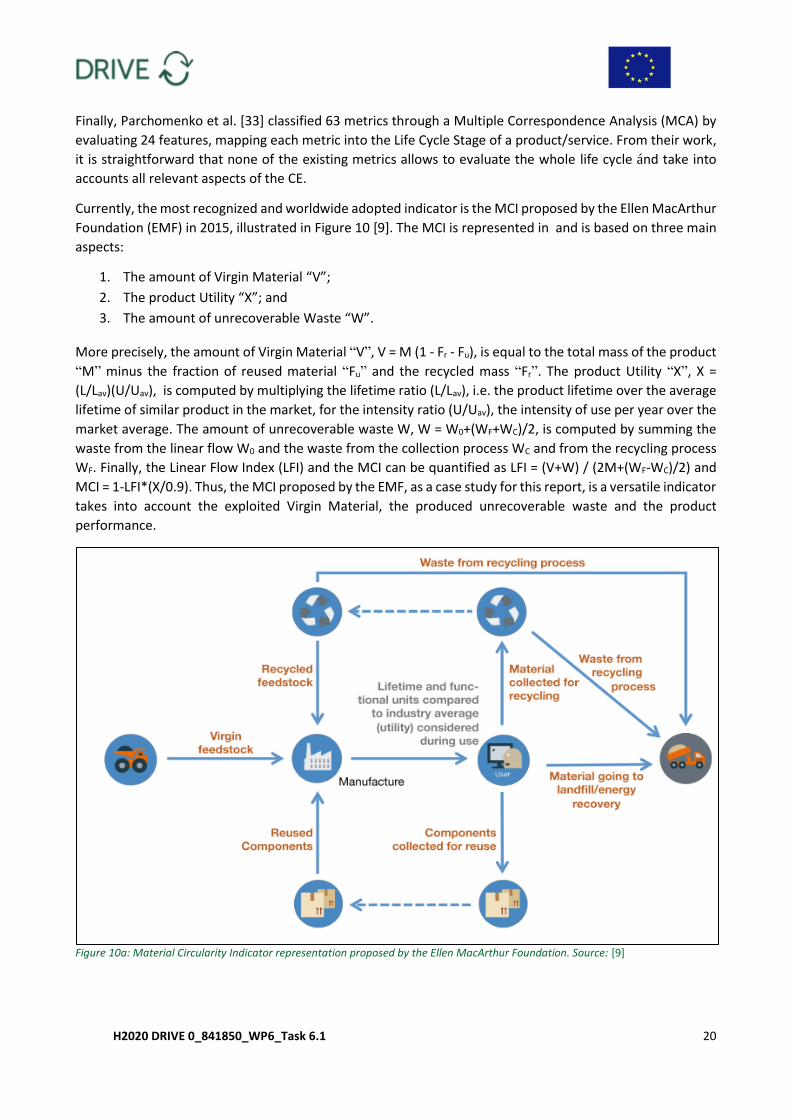
More precisely, the amount of Virgin Material “V”, V = M (1 - Fr - Fu), is equal to the total mass of the product
“M” minus the fraction of reused material “Fu” and the recycled mass “Fr”. The product Utility “X”, X =
(L/Lav)(U/Uav), is computed by multiplying the lifetime ratio (L/Lav), i.e. the product lifetime over the average
lifetime of similar product in the market, for the intensity ratio (U/Uav), the intensity of use per year over the
market average. The amount of unrecoverable waste W, W = W0+(WF+WC)/2, is computed by summing the
waste from the linear flow W0 and the waste from the collection process WC and from the recycling process
WF. Finally, the Linear Flow Index (LFI) and the MCI can be quantified as LFI = (V+W) / (2M+(WF-WC)/2) and
MCI = 1-LFI*(X/0.9). Thus, the MCI proposed by the EMF, as a case study for this report, is a versatile indicator
takes into account the exploited Virgin Material, the produced unrecoverable waste and the product
performance.
Figure 10a: Material Circularity Indicator representation proposed by the Ellen MacArthur Foundation. Source: [9]
H2020 DRIVE 0_841850_WP6_Task 6.1 21
Figure 10b: Material Circularity Indicator representation proposed by the Ellen MacArthur Foundation. Source: [9]
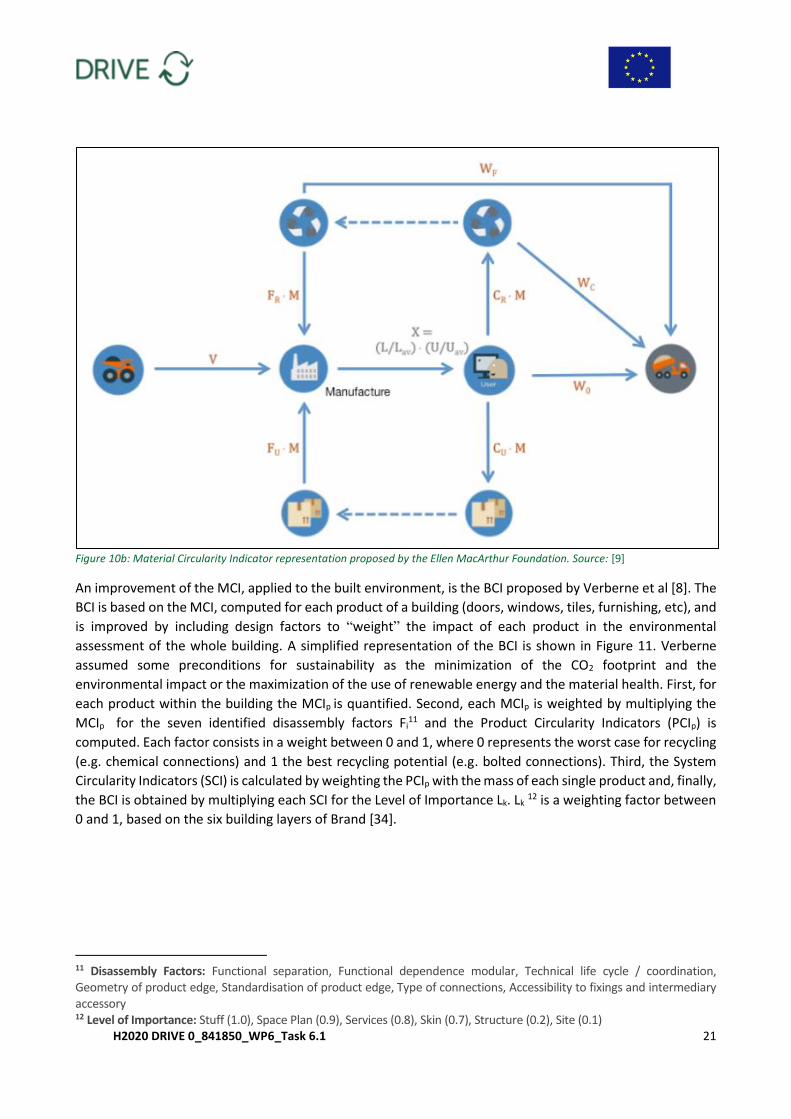
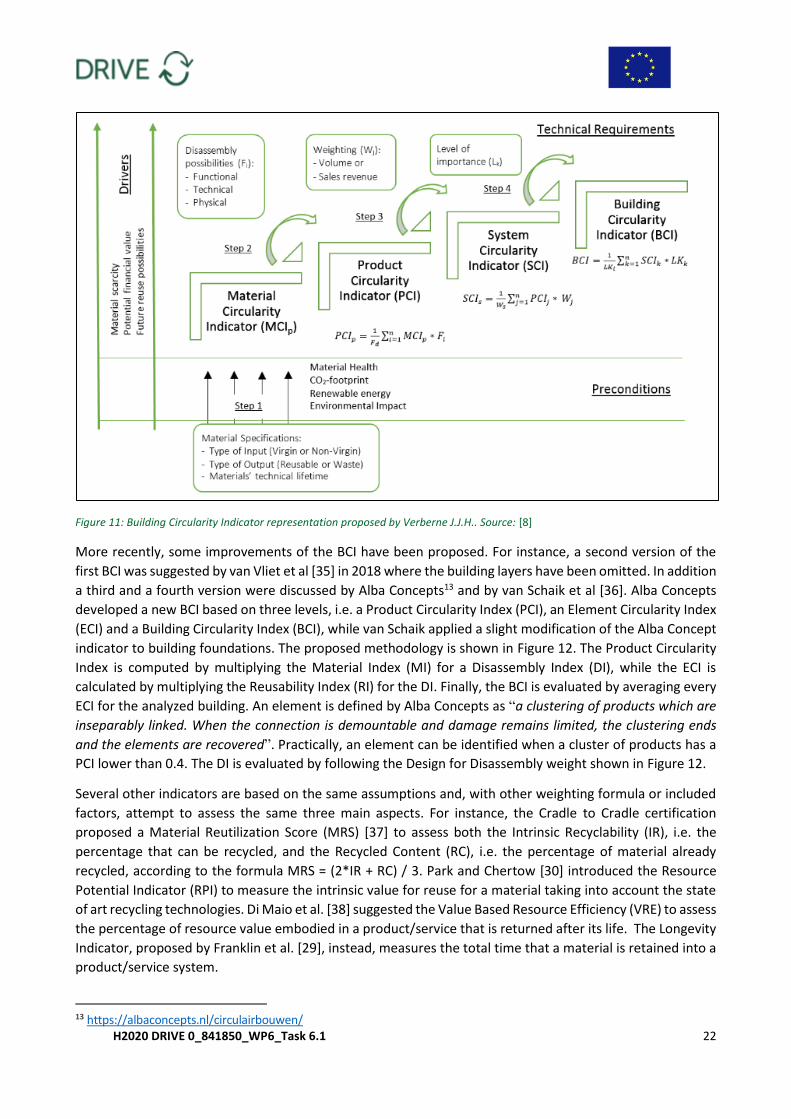
An improvement of the MCI, applied to the built environment, is the BCI proposed by Verberne et al [8]. The
BCI is based on the MCI, computed for each product of a building (doors, windows, tiles, furnishing, etc), and
is improved by including design factors to “weight” the impact of each product in the environmental
assessment of the whole building. A simplified representation of the BCI is shown in Figure 11. Verberne
assumed some preconditions for sustainability as the minimization of the CO2 footprint and the
environmental impact or the maximization of the use of renewable energy and the material health. First, for
each product within the building the MCIp is quantified. Second, each MCIp is weighted by multiplying the
MCIp for the seven identified disassembly factors Fi11 and the Product Circularity Indicators (PCIp) is
computed. Each factor consists in a weight between 0 and 1, where 0 represents the worst case for recycling
(e.g. chemical connections) and 1 the best recycling potential (e.g. bolted connections). Third, the System
Circularity Indicators (SCI) is calculated by weighting the PCIp with the mass of each single product and, finally,
the BCI is obtained by multiplying each SCI for the Level of Importance Lk. Lk 12 is a weighting factor between
0 and 1, based on the six building layers of Brand [34].
11 Disassembly Factors: Functional separation, Functional dependence modular, Technical life cycle / coordination, Geometry of product edge, Standardisation of product edge, Type of connections, Accessibility to fixings and intermediary accessory 12 Level of Importance: Stuff (1.0), Space Plan (0.9), Services (0.8), Skin (0.7), Structure (0.2), Site (0.1)
H2020 DRIVE 0_841850_WP6_Task 6.1 22
Figure 11: Building Circularity Indicator representation proposed by Verberne J.J.H.. Source: [8]
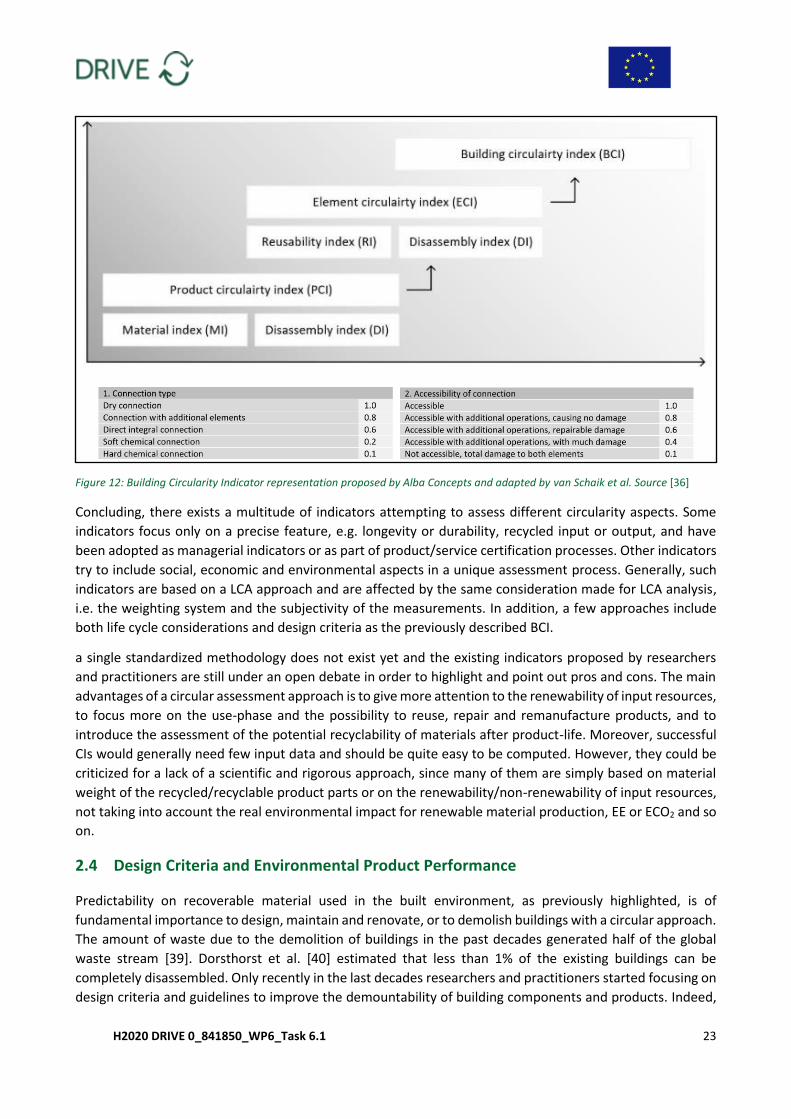
More recently, some improvements of the BCI have been proposed. For instance, a second version of the
first BCI was suggested by van Vliet et al [35] in 2018 where the building layers have been omitted. In addition
a third and a fourth version were discussed by Alba Concepts13 and by van Schaik et al [36]. Alba Concepts
developed a new BCI based on three levels, i.e. a Product Circularity Index (PCI), an Element Circularity Index
(ECI) and a Building Circularity Index (BCI), while van Schaik applied a slight modification of the Alba Concept
indicator to building foundations. The proposed methodology is shown in Figure 12. The Product Circularity
Index is computed by multiplying the Material Index (MI) for a Disassembly Index (DI), while the ECI is
calculated by multiplying the Reusability Index (RI) for the DI. Finally, the BCI is evaluated by averaging every
ECI for the analyzed building. An element is defined by Alba Concepts as “a clustering of products which are
inseparably linked. When the connection is demountable and damage remains limited, the clustering ends
and the elements are recovered”. Practically, an element can be identified when a cluster of products has a
PCI lower than 0.4. The DI is evaluated by following the Design for Disassembly weight shown in Figure 12.
Several other indicators are based on the same assumptions and, with other weighting formula or included
factors, attempt to assess the same three main aspects. For instance, the Cradle to Cradle certification
proposed a Material Reutilization Score (MRS) [37] to assess both the Intrinsic Recyclability (IR), i.e. the
percentage that can be recycled, and the Recycled Content (RC), i.e. the percentage of material already
recycled, according to the formula MRS = (2*IR + RC) / 3. Park and Chertow [30] introduced the Resource
Potential Indicator (RPI) to measure the intrinsic value for reuse for a material taking into account the state
of art recycling technologies. Di Maio et al. [38] suggested the Value Based Resource Efficiency (VRE) to assess
the percentage of resource value embodied in a product/service that is returned after its life. The Longevity
Indicator, proposed by Franklin et al. [29], instead, measures the total time that a material is retained into a
product/service system.
13 https://albaconcepts.nl/circulairbouwen/
H2020 DRIVE 0_841850_WP6_Task 6.1 23
Figure 12: Building Circularity Indicator representation proposed by Alba Concepts and adapted by van Schaik et al. Source [36]
Concluding, there exists a multitude of indicators attempting to assess different circularity aspects. Some
indicators focus only on a precise feature, e.g. longevity or durability, recycled input or output, and have
been adopted as managerial indicators or as part of product/service certification processes. Other indicators
try to include social, economic and environmental aspects in a unique assessment process. Generally, such
indicators are based on a LCA approach and are affected by the same consideration made for LCA analysis,
i.e. the weighting system and the subjectivity of the measurements. In addition, a few approaches include
both life cycle considerations and design criteria as the previously described BCI.
a single standardized methodology does not exist yet and the existing indicators proposed by researchers
and practitioners are still under an open debate in order to highlight and point out pros and cons. The main
advantages of a circular assessment approach is to give more attention to the renewability of input resources,
to focus more on the use-phase and the possibility to reuse, repair and remanufacture products, and to
introduce the assessment of the potential recyclability of materials after product-life. Moreover, successful
CIs would generally need few input data and should be quite easy to be computed. However, they could be
criticized for a lack of a scientific and rigorous approach, since many of them are simply based on material
weight of the recycled/recyclable product parts or on the renewability/non-renewability of input resources,
not taking into account the real environmental impact for renewable material production, EE or ECO2 and so
on.
2.4 Design Criteria and Environmental Product Performance
Predictability on recoverable material used in the built environment, as previously highlighted, is of
fundamental importance to design, maintain and renovate, or to demolish buildings with a circular approach.
The amount of waste due to the demolition of buildings in the past decades generated half of the global
waste stream [39]. Dorsthorst et al. [40] estimated that less than 1% of the existing buildings can be
completely disassembled. Only recently in the last decades researchers and practitioners started focusing on
design criteria and guidelines to improve the demountability of building components and products. Indeed,
H2020 DRIVE 0_841850_WP6_Task 6.1 24
during the design phase of a product, service or building, more than 70% of the environmental impact can
be determined and, consequently, prevented and minimized [41].
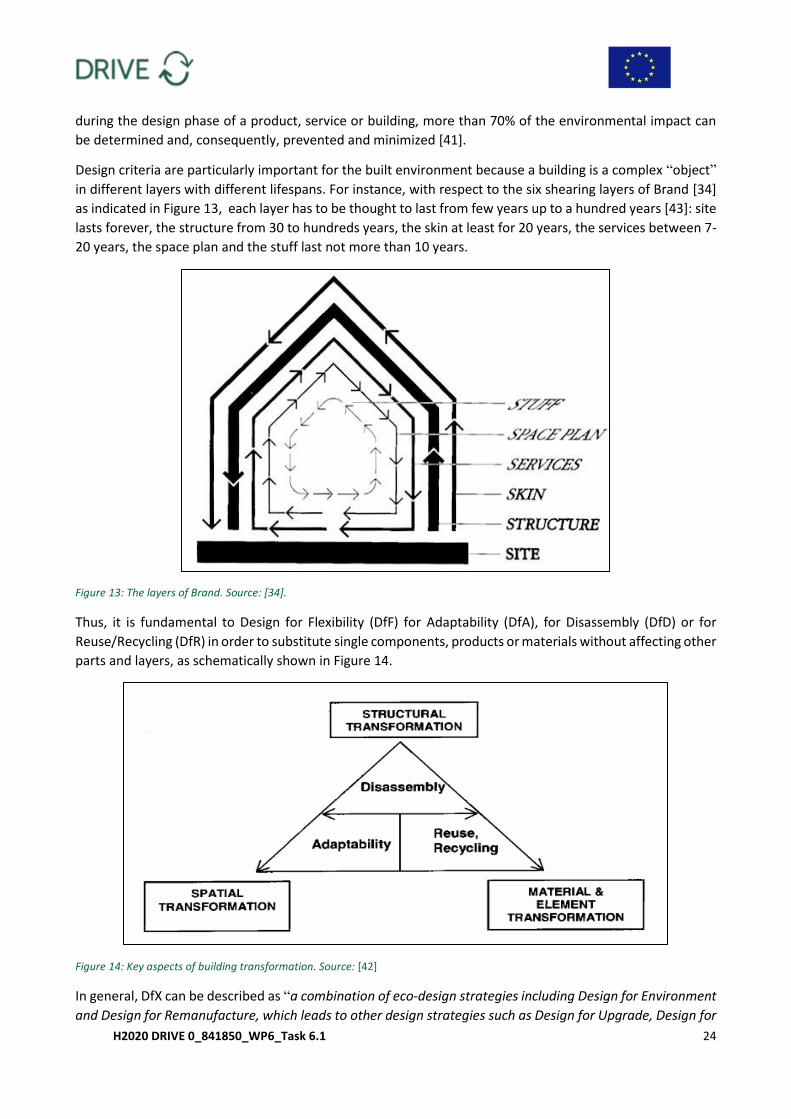
Design criteria are particularly important for the built environment because a building is a complex “object”
in different layers with different lifespans. For instance, with respect to the six shearing layers of Brand [34]
as indicated in Figure 13, each layer has to be thought to last from few years up to a hundred years [43]: site
lasts forever, the structure from 30 to hundreds years, the skin at least for 20 years, the services between 7-
20 years, the space plan and the stuff last not more than 10 years.
Figure 13: The layers of Brand. Source: [34].
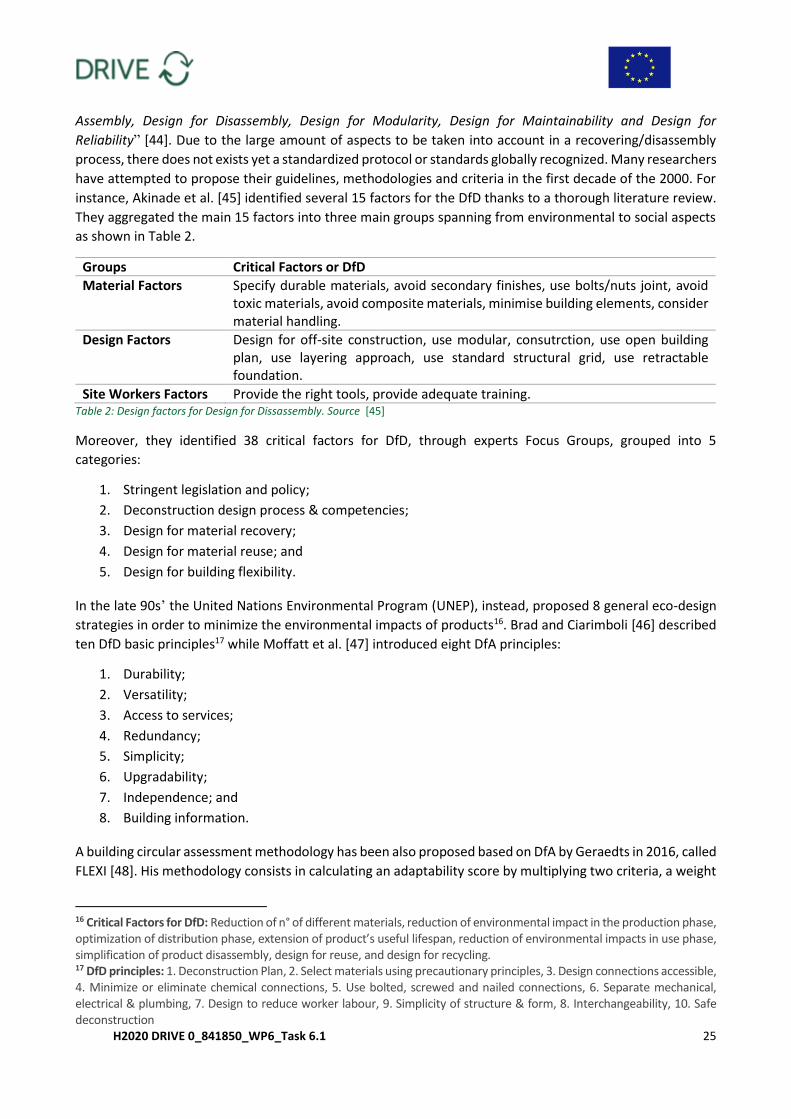
Thus, it is fundamental to Design for Flexibility (DfF) for Adaptability (DfA), for Disassembly (DfD) or for
Reuse/Recycling (DfR) in order to substitute single components, products or materials without affecting other
parts and layers, as schematically shown in Figure 14.
Figure 14: Key aspects of building transformation. Source: [42]
In general, DfX can be described as “a combination of eco-design strategies including Design for Environment
and Design for Remanufacture, which leads to other design strategies such as Design for Upgrade, Design for
H2020 DRIVE 0_841850_WP6_Task 6.1 25
Assembly, Design for Disassembly, Design for Modularity, Design for Maintainability and Design for
Reliability” [44]. Due to the large amount of aspects to be taken into account in a recovering/disassembly
process, there does not exists yet a standardized protocol or standards globally recognized. Many researchers
have attempted to propose their guidelines, methodologies and criteria in the first decade of the 2000. For
instance, Akinade et al. [45] identified several 15 factors for the DfD thanks to a thorough literature review.
They aggregated the main 15 factors into three main groups spanning from environmental to social aspects
as shown in Table 2.
Groups Critical Factors or DfD
Material Factors Specify durable materials, avoid secondary finishes, use bolts/nuts joint, avoid toxic materials, avoid composite materials, minimise building elements, consider material handling.
Design Factors Design for off-site construction, use modular, consutrction, use open building plan, use layering approach, use standard structural grid, use retractable foundation.
Site Workers Factors Provide the right tools, provide adequate training. Table 2: Design factors for Design for Dissassembly. Source [45]
Moreover, they identified 38 critical factors for DfD, through experts Focus Groups, grouped into 5
categories:
1. Stringent legislation and policy;
2. Deconstruction design process & competencies;
3. Design for material recovery;
4. Design for material reuse; and
5. Design for building flexibility.
In the late 90s’ the United Nations Environmental Program (UNEP), instead, proposed 8 general eco-design
strategies in order to minimize the environmental impacts of products16. Brad and Ciarimboli [46] described
ten DfD basic principles17 while Moffatt et al. [47] introduced eight DfA principles:
1. Durability;
2. Versatility;
3. Access to services;
4. Redundancy;
5. Simplicity;
6. Upgradability;
7. Independence; and
8. Building information.
A building circular assessment methodology has been also proposed based on DfA by Geraedts in 2016, called
FLEXI [48]. His methodology consists in calculating an adaptability score by multiplying two criteria, a weight
16 Critical Factors for DfD: Reduction of n° of different materials, reduction of environmental impact in the production phase, optimization of distribution phase, extension of product’s useful lifespan, reduction of environmental impacts in use phase, simplification of product disassembly, design for reuse, and design for recycling. 17 DfD principles: 1. Deconstruction Plan, 2. Select materials using precautionary principles, 3. Design connections accessible, 4. Minimize or eliminate chemical connections, 5. Use bolted, screwed and nailed connections, 6. Separate mechanical, electrical & plumbing, 7. Design to reduce worker labour, 9. Simplicity of structure & form, 8. Interchangeability, 10. Safe deconstruction
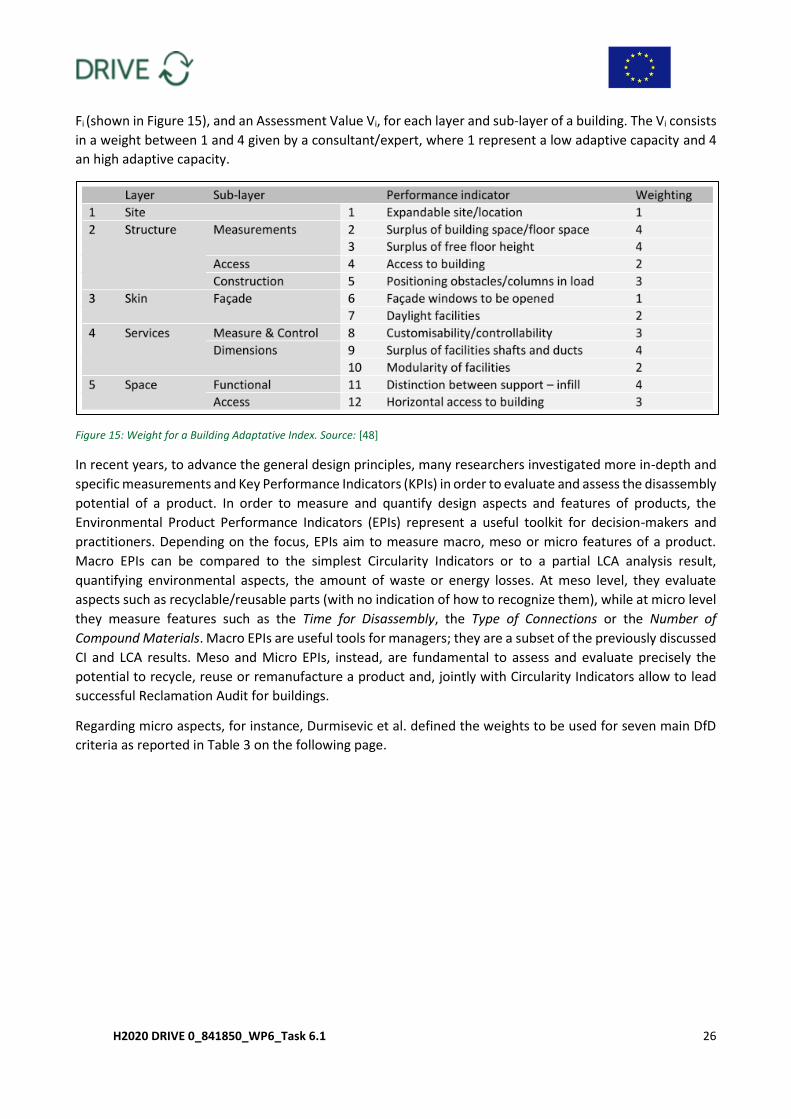
H2020 DRIVE 0_841850_WP6_Task 6.1 26
Fi (shown in Figure 15), and an Assessment Value Vi, for each layer and sub-layer of a building. The Vi consists
in a weight between 1 and 4 given by a consultant/expert, where 1 represent a low adaptive capacity and 4
an high adaptive capacity.
Figure 15: Weight for a Building Adaptative Index. Source: [48]
In recent years, to advance the general design principles, many researchers investigated more in-depth and
specific measurements and Key Performance Indicators (KPIs) in order to evaluate and assess the disassembly
potential of a product. In order to measure and quantify design aspects and features of products, the
Environmental Product Performance Indicators (EPIs) represent a useful toolkit for decision-makers and
practitioners. Depending on the focus, EPIs aim to measure macro, meso or micro features of a product.
Macro EPIs can be compared to the simplest Circularity Indicators or to a partial LCA analysis result,
quantifying environmental aspects, the amount of waste or energy losses. At meso level, they evaluate
aspects such as recyclable/reusable parts (with no indication of how to recognize them), while at micro level
they measure features such as the Time for Disassembly, the Type of Connections or the Number of
Compound Materials. Macro EPIs are useful tools for managers; they are a subset of the previously discussed
CI and LCA results. Meso and Micro EPIs, instead, are fundamental to assess and evaluate precisely the
potential to recycle, reuse or remanufacture a product and, jointly with Circularity Indicators allow to lead
successful Reclamation Audit for buildings.
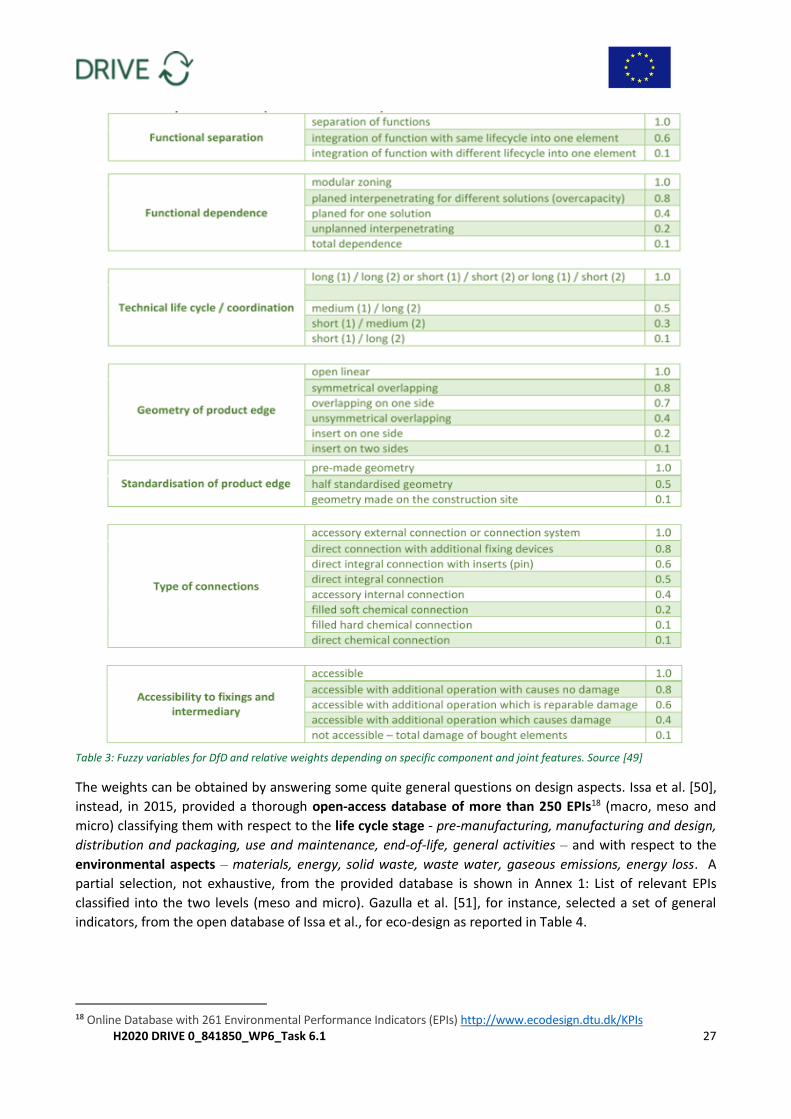
Regarding micro aspects, for instance, Durmisevic et al. defined the weights to be used for seven main DfD
criteria as reported in Table 3 on the following page.
H2020 DRIVE 0_841850_WP6_Task 6.1 27
Table 3: Fuzzy variables for DfD and relative weights depending on specific component and joint features. Source [49]
The weights can be obtained by answering some quite general questions on design aspects. Issa et al. [50],
instead, in 2015, provided a thorough open-access database of more than 250 EPIs18 (macro, meso and
micro) classifying them with respect to the life cycle stage - pre-manufacturing, manufacturing and design,
distribution and packaging, use and maintenance, end-of-life, general activities – and with respect to the
environmental aspects – materials, energy, solid waste, waste water, gaseous emissions, energy loss. A
partial selection, not exhaustive, from the provided database is shown in Annex 1: List of relevant EPIs
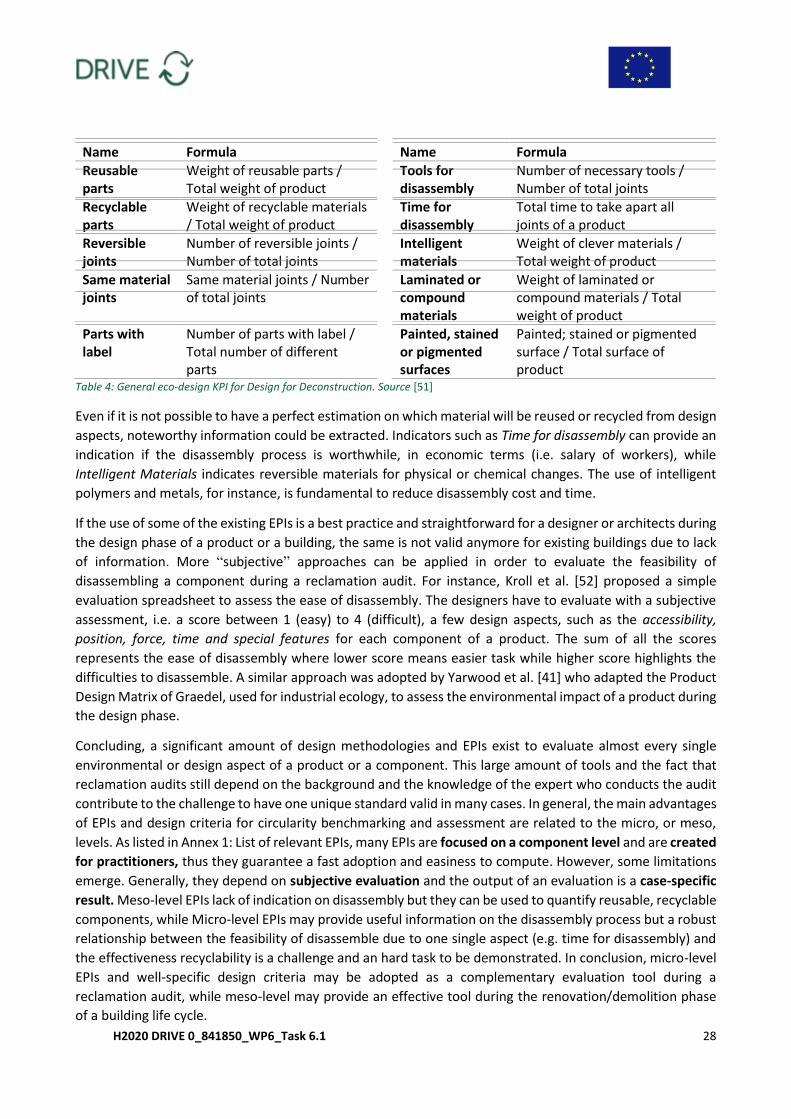
classified into the two levels (meso and micro). Gazulla et al. [51], for instance, selected a set of general
indicators, from the open database of Issa et al., for eco-design as reported in Table 4.
18 Online Database with 261 Environmental Performance Indicators (EPIs) http://www.ecodesign.dtu.dk/KPIs
H2020 DRIVE 0_841850_WP6_Task 6.1 28
Table 4: General eco-design KPI for Design for Deconstruction. Source [51]
Even if it is not possible to have a perfect estimation on which material will be reused or recycled from design
aspects, noteworthy information could be extracted. Indicators such as Time for disassembly can provide an
indication if the disassembly process is worthwhile, in economic terms (i.e. salary of workers), while
Intelligent Materials indicates reversible materials for physical or chemical changes. The use of intelligent
polymers and metals, for instance, is fundamental to reduce disassembly cost and time.
If the use of some of the existing EPIs is a best practice and straightforward for a designer or architects during
the design phase of a product or a building, the same is not valid anymore for existing buildings due to lack
of information. More “subjective” approaches can be applied in order to evaluate the feasibility of
disassembling a component during a reclamation audit. For instance, Kroll et al. [52] proposed a simple
evaluation spreadsheet to assess the ease of disassembly. The designers have to evaluate with a subjective
assessment, i.e. a score between 1 (easy) to 4 (difficult), a few design aspects, such as the accessibility,
position, force, time and special features for each component of a product. The sum of all the scores
represents the ease of disassembly where lower score means easier task while higher score highlights the
difficulties to disassemble. A similar approach was adopted by Yarwood et al. [41] who adapted the Product
Design Matrix of Graedel, used for industrial ecology, to assess the environmental impact of a product during
the design phase.
Concluding, a significant amount of design methodologies and EPIs exist to evaluate almost every single
environmental or design aspect of a product or a component. This large amount of tools and the fact that
reclamation audits still depend on the background and the knowledge of the expert who conducts the audit
contribute to the challenge to have one unique standard valid in many cases. In general, the main advantages
of EPIs and design criteria for circularity benchmarking and assessment are related to the micro, or meso,
levels. As listed in Annex 1: List of relevant EPIs, many EPIs are focused on a component level and are created
for practitioners, thus they guarantee a fast adoption and easiness to compute. However, some limitations
emerge. Generally, they depend on subjective evaluation and the output of an evaluation is a case-specific
result. Meso-level EPIs lack of indication on disassembly but they can be used to quantify reusable, recyclable
components, while Micro-level EPIs may provide useful information on the disassembly process but a robust
relationship between the feasibility of disassemble due to one single aspect (e.g. time for disassembly) and
the effectiveness recyclability is a challenge and an hard task to be demonstrated. In conclusion, micro-level
EPIs and well-specific design criteria may be adopted as a complementary evaluation tool during a
reclamation audit, while meso-level may provide an effective tool during the renovation/demolition phase
of a building life cycle.
Name Formula Name Formula
Reusable parts
Weight of reusable parts / Total weight of product
Tools for disassembly
Number of necessary tools / Number of total joints
Recyclable parts
Weight of recyclable materials / Total weight of product
Time for disassembly
Total time to take apart all joints of a product
Reversible joints
Number of reversible joints / Number of total joints
Intelligent materials
Weight of clever materials / Total weight of product
Same material joints
Same material joints / Number of total joints
Laminated or compound materials
Weight of laminated or compound materials / Total weight of product
Parts with label
Number of parts with label / Total number of different parts
Painted, stained or pigmented surfaces
Painted; stained or pigmented surface / Total surface of product
H2020 DRIVE 0_841850_WP6_Task 6.1 29
2.5 Software
The overview on environmental and circularity assessment cannot be concluded without a discussion on
existing software and database. Currently, there exists a significant amount of different software for LCA.
Some of them are specific for the built environment while others are generalist software for LCA; sometimes
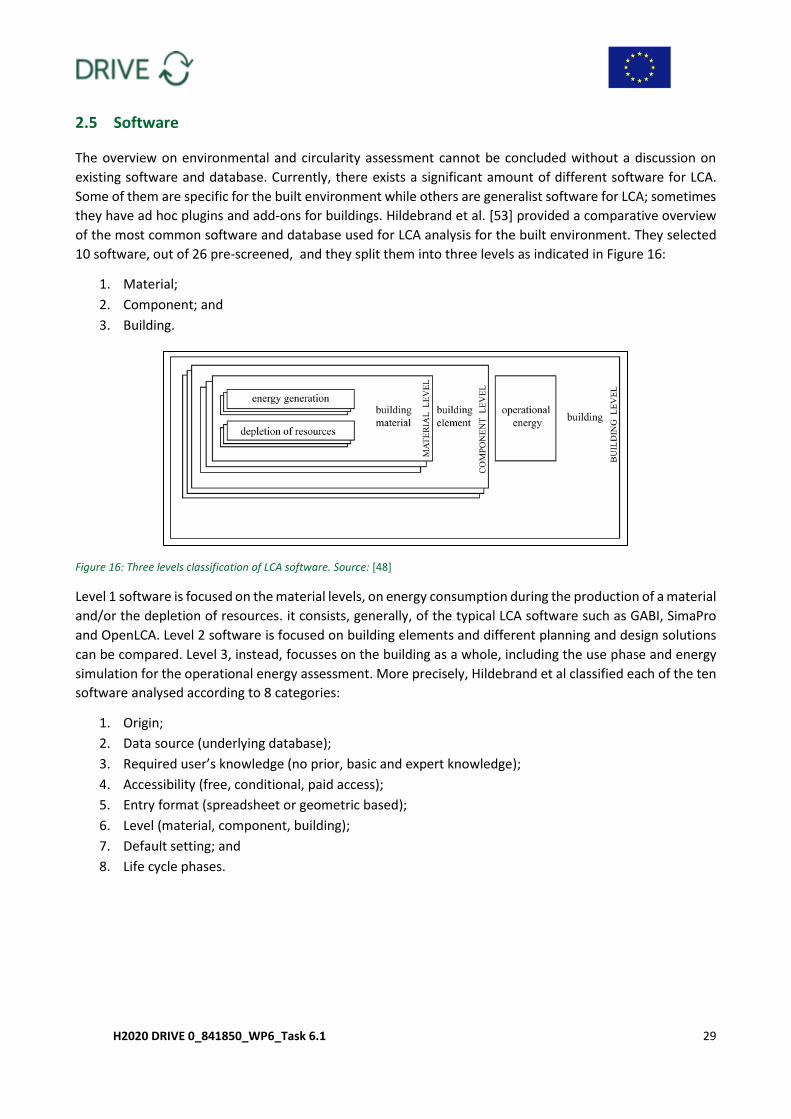
they have ad hoc plugins and add-ons for buildings. Hildebrand et al. [53] provided a comparative overview
of the most common software and database used for LCA analysis for the built environment. They selected
10 software, out of 26 pre-screened, and they split them into three levels as indicated in Figure 16:
1. Material;
2. Component; and
3. Building.
Figure 16: Three levels classification of LCA software. Source: [48]
Level 1 software is focused on the material levels, on energy consumption during the production of a material
and/or the depletion of resources. it consists, generally, of the typical LCA software such as GABI, SimaPro
and OpenLCA. Level 2 software is focused on building elements and different planning and design solutions
can be compared. Level 3, instead, focusses on the building as a whole, including the use phase and energy
simulation for the operational energy assessment. More precisely, Hildebrand et al classified each of the ten
software analysed according to 8 categories:
1. Origin;
2. Data source (underlying database);
3. Required user’s knowledge (no prior, basic and expert knowledge);
4. Accessibility (free, conditional, paid access);
5. Entry format (spreadsheet or geometric based);
6. Level (material, component, building);
7. Default setting; and
8. Life cycle phases.

H2020 DRIVE 0_841850_WP6_Task 6.1 30
The whole classification is resumed in Annex 2: Software and Database List and is based on the life cycle
phases19 of the Standard EN 15804 [54]. Figure 17 shows an infographics of the 10 software tools, related life
cycle phases, data entry format and required user’s knowledge. With respect to the 3D geometry software,
the three listed, Tally and 360 optimi allow to assess environmental impact and to design the building in 3D
at the same time. CAALA, still in its beta version, include operational energy computation and design criteria
between components but it has many default settings.
Figure 17: LCA software for the built environment and related Life Cycle Phases. Source: [48]
Moreover, various plugins and add-ons to the most common 3D CAD software may be adopted. For instance,
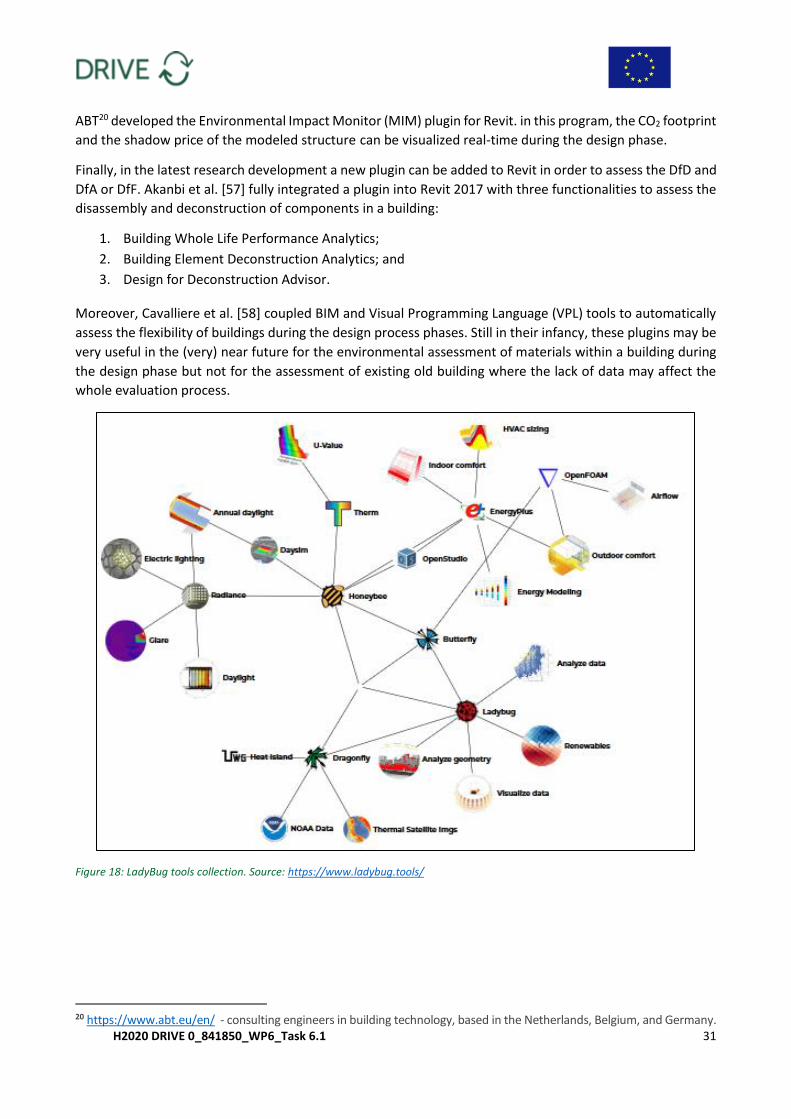
Naboni [3] suggested the use of the plugin Grasshopper and LadyBug to implement with Rhinoceros 3D
design environmental assessment. Ladybug Tools, for instance, is a thorough collection of open source and
free software to support environmental design, linking 3D CAD with validated simulation engines, as shown
in Figure 18. Kasimir Forth [55], describes pros and cons of semi-automated processes from BIM to LCA. BIM
programs can determine automatically surfaces and masses of used materials. By linking a plugin such as
Autodesk Dynamo, with LCA data, a preliminary assessment of the environmental impacts can be achieved.
Dalla Mora and Peron [56] discussed advantages and disadvantage of using Tally and One Click LCA, two
plugins for Revit. Tally plugin, which uses Gabi database, allows a comparison between different designs. One
Click LCA can be used to obtain certifications such as BREEAM and LEED and to create EPDs for materials.
19 A1 – Raw material supply; A2 – Transport (to the manufacturing facility); A3 – Manufacturing; A4 – Transport (to the construction site); A5 – Construction/ installation process; B1 – Use; B2 - Maintenance including transport; B3 – Repair and transport; B4 – Replacement including transport; B6 – Refurbishment including transport; B6 – Operational energy use; B7 – Operational water use; C1 – De-construction demolition; C2 – Transport; C3 – Waste processing; C4 – Disposal; and D – Re-use recovery and recycling potential.
H2020 DRIVE 0_841850_WP6_Task 6.1 31
ABT20 developed the Environmental Impact Monitor (MIM) plugin for Revit. in this program, the CO2 footprint
and the shadow price of the modeled structure can be visualized real-time during the design phase.
Finally, in the latest research development a new plugin can be added to Revit in order to assess the DfD and
DfA or DfF. Akanbi et al. [57] fully integrated a plugin into Revit 2017 with three functionalities to assess the
disassembly and deconstruction of components in a building:
1. Building Whole Life Performance Analytics;
2. Building Element Deconstruction Analytics; and
3. Design for Deconstruction Advisor.
Moreover, Cavalliere et al. [58] coupled BIM and Visual Programming Language (VPL) tools to automatically
assess the flexibility of buildings during the design process phases. Still in their infancy, these plugins may be
very useful in the (very) near future for the environmental assessment of materials within a building during
the design phase but not for the assessment of existing old building where the lack of data may affect the
whole evaluation process.
Figure 18: LadyBug tools collection. Source: https://www.ladybug.tools/
20 https://www.abt.eu/en/ - consulting engineers in building technology, based in the Netherlands, Belgium, and Germany.
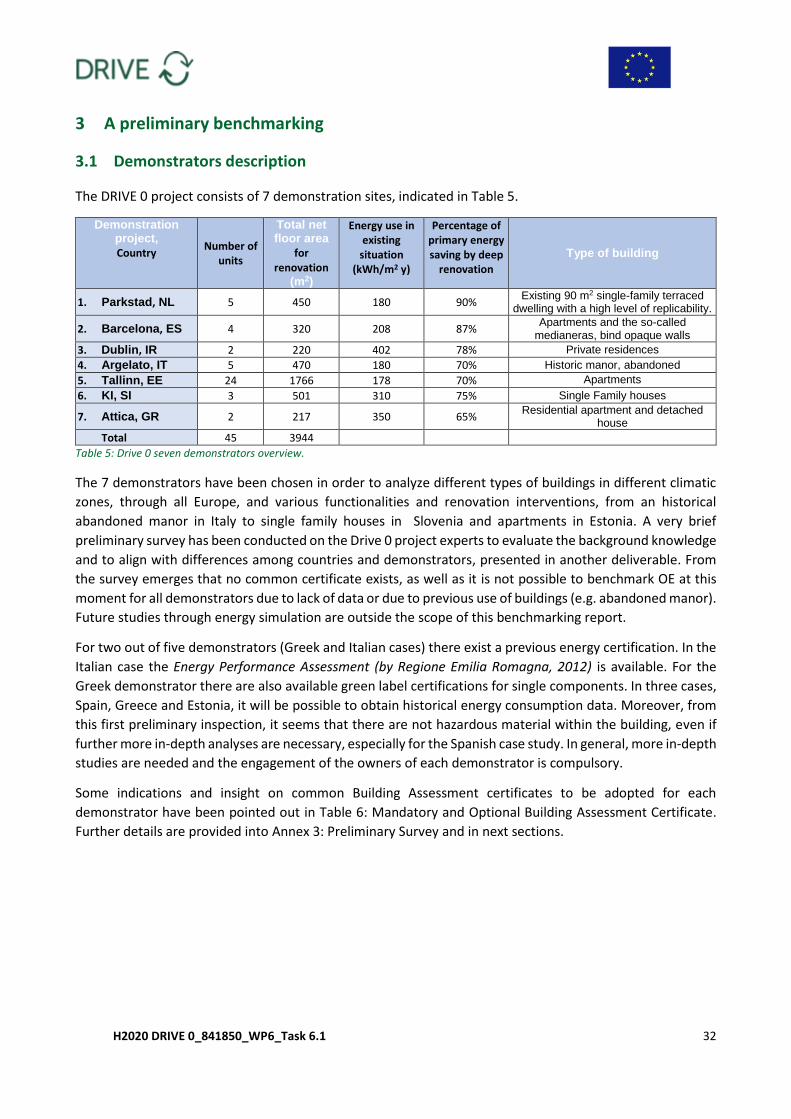
H2020 DRIVE 0_841850_WP6_Task 6.1 32
3 A preliminary benchmarking
3.1 Demonstrators description
The DRIVE 0 project consists of 7 demonstration sites, indicated in Table 5.
Demonstration project, Country
Number of units
Total net floor area
for renovation
(m2)
Energy use in existing
situation (kWh/m2 y)
Percentage of primary energy saving by deep
renovation
Type of building
1. Parkstad, NL 5 450 180 90% Existing 90 m2 single-family terraced
dwelling with a high level of replicability.
2. Barcelona, ES 4 320 208 87% Apartments and the so-called
medianeras, bind opaque walls
3. Dublin, IR 2 220 402 78% Private residences
4. Argelato, IT 5 470 180 70% Historic manor, abandoned
5. Tallinn, EE 24 1766 178 70% Apartments
6. KI, SI 3 501 310 75% Single Family houses
7. Attica, GR 2 217 350 65% Residential apartment and detached
house Total 45 3944
Table 5: Drive 0 seven demonstrators overview.
The 7 demonstrators have been chosen in order to analyze different types of buildings in different climatic
zones, through all Europe, and various functionalities and renovation interventions, from an historical
abandoned manor in Italy to single family houses in Slovenia and apartments in Estonia. A very brief
preliminary survey has been conducted on the Drive 0 project experts to evaluate the background knowledge
and to align with differences among countries and demonstrators, presented in another deliverable. From
the survey emerges that no common certificate exists, as well as it is not possible to benchmark OE at this
moment for all demonstrators due to lack of data or due to previous use of buildings (e.g. abandoned manor).
Future studies through energy simulation are outside the scope of this benchmarking report.
For two out of five demonstrators (Greek and Italian cases) there exist a previous energy certification. In the
Italian case the Energy Performance Assessment (by Regione Emilia Romagna, 2012) is available. For the
Greek demonstrator there are also available green label certifications for single components. In three cases,
Spain, Greece and Estonia, it will be possible to obtain historical energy consumption data. Moreover, from
this first preliminary inspection, it seems that there are not hazardous material within the building, even if
further more in-depth analyses are necessary, especially for the Spanish case study. In general, more in-depth
studies are needed and the engagement of the owners of each demonstrator is compulsory.
Some indications and insight on common Building Assessment certificates to be adopted for each
demonstrator have been pointed out in Table 6: Mandatory and Optional Building Assessment Certificate.
Further details are provided into Annex 3: Preliminary Survey and in next sections.
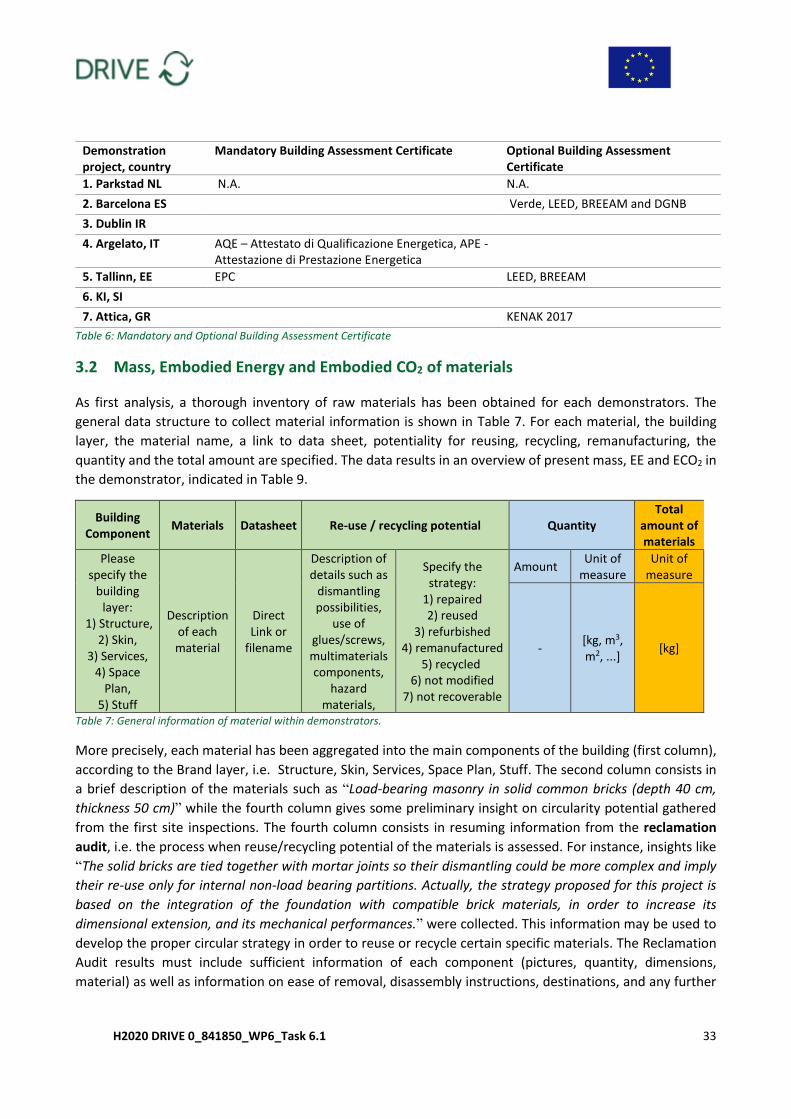
H2020 DRIVE 0_841850_WP6_Task 6.1 33
Demonstration project, country
Mandatory Building Assessment Certificate Optional Building Assessment Certificate
1. Parkstad NL N.A. N.A.
2. Barcelona ES Verde, LEED, BREEAM and DGNB
3. Dublin IR
4. Argelato, IT AQE – Attestato di Qualificazione Energetica, APE - Attestazione di Prestazione Energetica
5. Tallinn, EE EPC LEED, BREEAM
6. KI, SI
7. Attica, GR KENAK 2017
Table 6: Mandatory and Optional Building Assessment Certificate
3.2 Mass, Embodied Energy and Embodied CO2 of materials
As first analysis, a thorough inventory of raw materials has been obtained for each demonstrators. The
general data structure to collect material information is shown in Table 7. For each material, the building
layer, the material name, a link to data sheet, potentiality for reusing, recycling, remanufacturing, the
quantity and the total amount are specified. The data results in an overview of present mass, EE and ECO2 in
the demonstrator, indicated in Table 9.
Building Component
Materials Datasheet Re-use / recycling potential Quantity Total
amount of materials
Please specify the
building layer:
1) Structure, 2) Skin,
3) Services, 4) Space
Plan, 5) Stuff
Description of each material
Direct Link or
filename
Description of details such as
dismantling possibilities,
use of glues/screws, multimaterials components,
hazard materials,
Specify the strategy:
1) repaired 2) reused
3) refurbished 4) remanufactured
5) recycled 6) not modified
7) not recoverable
Amount Unit of
measure Unit of
measure
- [kg, m3, m2, ...]
[kg]
Table 7: General information of material within demonstrators.
More precisely, each material has been aggregated into the main components of the building (first column),
according to the Brand layer, i.e. Structure, Skin, Services, Space Plan, Stuff. The second column consists in
a brief description of the materials such as “Load-bearing masonry in solid common bricks (depth 40 cm,
thickness 50 cm)” while the fourth column gives some preliminary insight on circularity potential gathered
from the first site inspections. The fourth column consists in resuming information from the reclamation
audit, i.e. the process when reuse/recycling potential of the materials is assessed. For instance, insights like
“The solid bricks are tied together with mortar joints so their dismantling could be more complex and imply
their re-use only for internal non-load bearing partitions. Actually, the strategy proposed for this project is
based on the integration of the foundation with compatible brick materials, in order to increase its
dimensional extension, and its mechanical performances.” were collected. This information may be used to
develop the proper circular strategy in order to reuse or recycle certain specific materials. The Reclamation
Audit results must include sufficient information of each component (pictures, quantity, dimensions,
material) as well as information on ease of removal, disassembly instructions, destinations, and any further
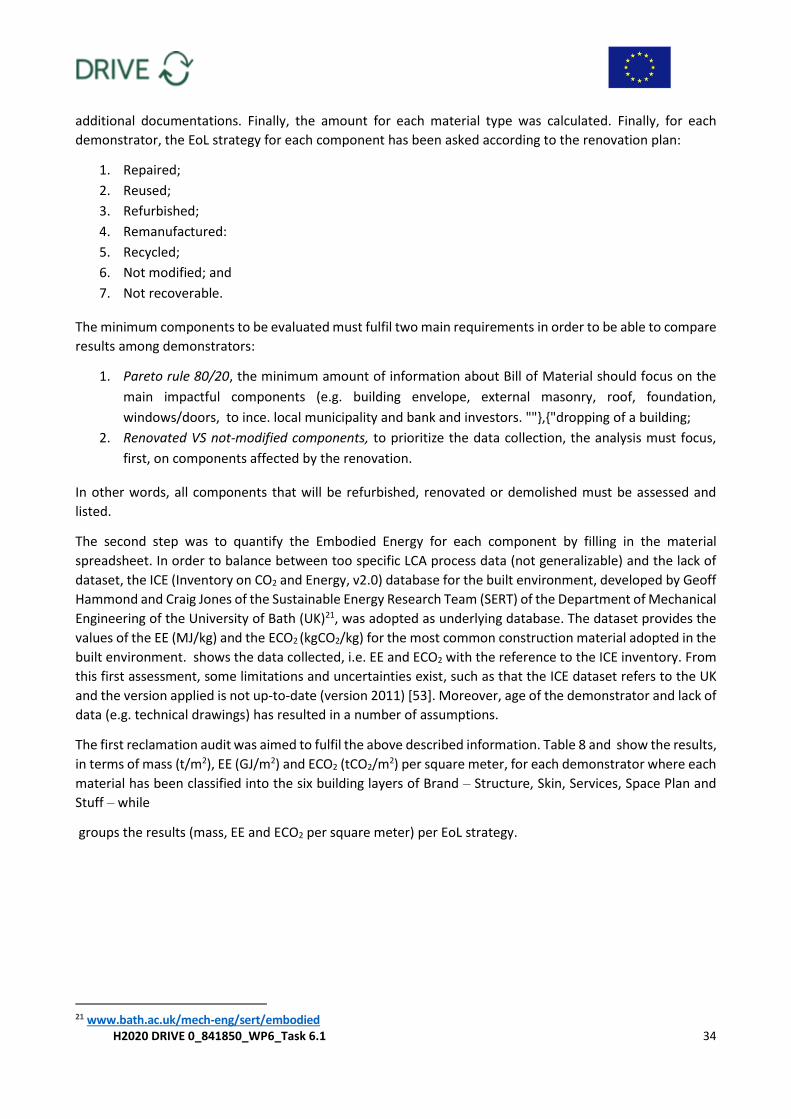
H2020 DRIVE 0_841850_WP6_Task 6.1 34
additional documentations. Finally, the amount for each material type was calculated. Finally, for each
demonstrator, the EoL strategy for each component has been asked according to the renovation plan:
1. Repaired;
2. Reused;
3. Refurbished;
4. Remanufactured:
5. Recycled;
6. Not modified; and
7. Not recoverable.
The minimum components to be evaluated must fulfil two main requirements in order to be able to compare
results among demonstrators:
1. Pareto rule 80/20, the minimum amount of information about Bill of Material should focus on the
main impactful components (e.g. building envelope, external masonry, roof, foundation,
windows/doors, to ince. local municipality and bank and investors. ""},{"dropping of a building;
2. Renovated VS not-modified components, to prioritize the data collection, the analysis must focus,
first, on components affected by the renovation.
In other words, all components that will be refurbished, renovated or demolished must be assessed and
listed.
The second step was to quantify the Embodied Energy for each component by filling in the material
spreadsheet. In order to balance between too specific LCA process data (not generalizable) and the lack of
dataset, the ICE (Inventory on CO2 and Energy, v2.0) database for the built environment, developed by Geoff
Hammond and Craig Jones of the Sustainable Energy Research Team (SERT) of the Department of Mechanical
Engineering of the University of Bath (UK)21, was adopted as underlying database. The dataset provides the
values of the EE (MJ/kg) and the ECO2 (kgCO2/kg) for the most common construction material adopted in the
built environment. shows the data collected, i.e. EE and ECO2 with the reference to the ICE inventory. From
this first assessment, some limitations and uncertainties exist, such as that the ICE dataset refers to the UK
and the version applied is not up-to-date (version 2011) [53]. Moreover, age of the demonstrator and lack of
data (e.g. technical drawings) has resulted in a number of assumptions.
The first reclamation audit was aimed to fulfil the above described information. Table 8 and show the results,
in terms of mass (t/m2), EE (GJ/m2) and ECO2 (tCO2/m2) per square meter, for each demonstrator where each
material has been classified into the six building layers of Brand – Structure, Skin, Services, Space Plan and
Stuff – while
groups the results (mass, EE and ECO2 per square meter) per EoL strategy.
21 www.bath.ac.uk/mech-eng/sert/embodied
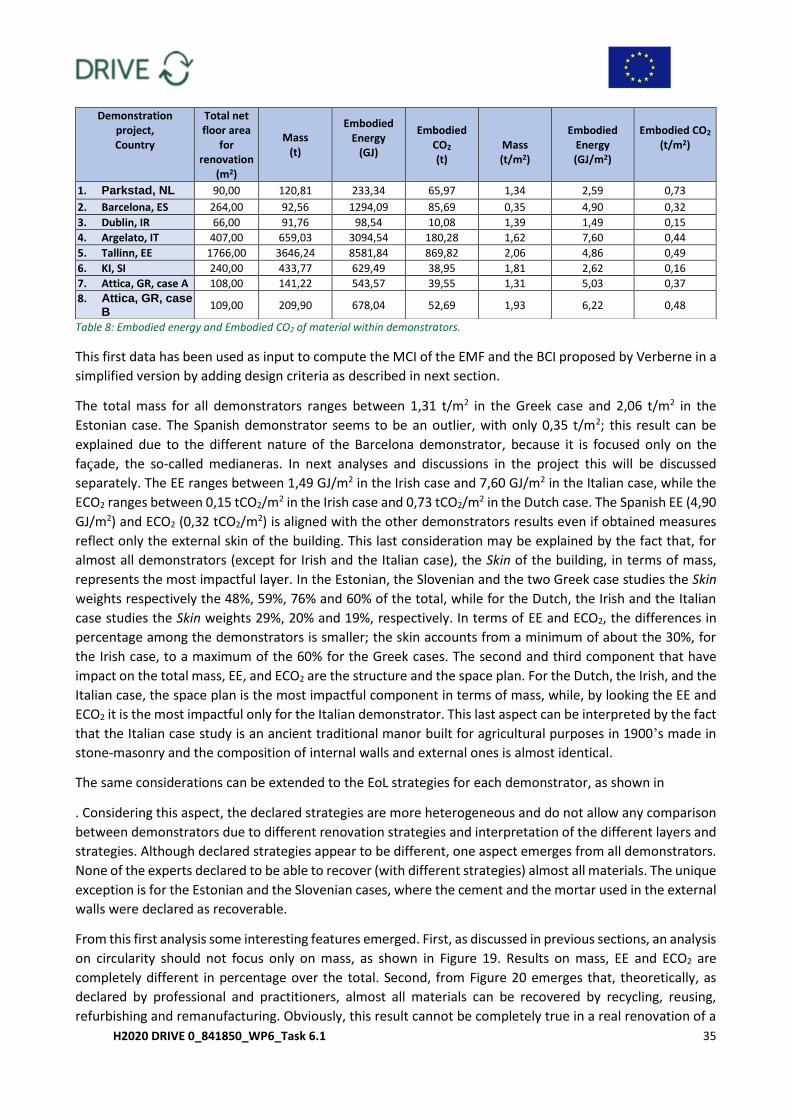
H2020 DRIVE 0_841850_WP6_Task 6.1 35
Table 8: Embodied energy and Embodied CO2 of material within demonstrators.
This first data has been used as input to compute the MCI of the EMF and the BCI proposed by Verberne in a
simplified version by adding design criteria as described in next section.
The total mass for all demonstrators ranges between 1,31 t/m2 in the Greek case and 2,06 t/m2 in the
Estonian case. The Spanish demonstrator seems to be an outlier, with only 0,35 t/m2; this result can be
explained due to the different nature of the Barcelona demonstrator, because it is focused only on the
façade, the so-called medianeras. In next analyses and discussions in the project this will be discussed
separately. The EE ranges between 1,49 GJ/m2 in the Irish case and 7,60 GJ/m2 in the Italian case, while the
ECO2 ranges between 0,15 tCO2/m2 in the Irish case and 0,73 tCO2/m2 in the Dutch case. The Spanish EE (4,90
GJ/m2) and ECO2 (0,32 tCO2/m2) is aligned with the other demonstrators results even if obtained measures
reflect only the external skin of the building. This last consideration may be explained by the fact that, for
almost all demonstrators (except for Irish and the Italian case), the Skin of the building, in terms of mass,
represents the most impactful layer. In the Estonian, the Slovenian and the two Greek case studies the Skin
weights respectively the 48%, 59%, 76% and 60% of the total, while for the Dutch, the Irish and the Italian
case studies the Skin weights 29%, 20% and 19%, respectively. In terms of EE and ECO2, the differences in
percentage among the demonstrators is smaller; the skin accounts from a minimum of about the 30%, for
the Irish case, to a maximum of the 60% for the Greek cases. The second and third component that have
impact on the total mass, EE, and ECO2 are the structure and the space plan. For the Dutch, the Irish, and the
Italian case, the space plan is the most impactful component in terms of mass, while, by looking the EE and
ECO2 it is the most impactful only for the Italian demonstrator. This last aspect can be interpreted by the fact
that the Italian case study is an ancient traditional manor built for agricultural purposes in 1900’s made in
stone-masonry and the composition of internal walls and external ones is almost identical.
The same considerations can be extended to the EoL strategies for each demonstrator, as shown in
. Considering this aspect, the declared strategies are more heterogeneous and do not allow any comparison
between demonstrators due to different renovation strategies and interpretation of the different layers and
strategies. Although declared strategies appear to be different, one aspect emerges from all demonstrators.
None of the experts declared to be able to recover (with different strategies) almost all materials. The unique
exception is for the Estonian and the Slovenian cases, where the cement and the mortar used in the external
walls were declared as recoverable.
From this first analysis some interesting features emerged. First, as discussed in previous sections, an analysis
on circularity should not focus only on mass, as shown in Figure 19. Results on mass, EE and ECO2 are
completely different in percentage over the total. Second, from Figure 20 emerges that, theoretically, as
declared by professional and practitioners, almost all materials can be recovered by recycling, reusing,
refurbishing and remanufacturing. Obviously, this result cannot be completely true in a real renovation of a
Demonstration project, Country
Total net floor area
for renovation
(m2)
Mass (t)
Embodied Energy
(GJ)
Embodied CO2
(t)
Mass (t/m2)
Embodied
Energy (GJ/m2)
Embodied CO2
(t/m2)
1. Parkstad, NL 90,00 120,81 233,34 65,97 1,34 2,59 0,73
2. Barcelona, ES 264,00 92,56 1294,09 85,69 0,35 4,90 0,32
3. Dublin, IR 66,00 91,76 98,54 10,08 1,39 1,49 0,15
4. Argelato, IT 407,00 659,03 3094,54 180,28 1,62 7,60 0,44
5. Tallinn, EE 1766,00 3646,24 8581,84 869,82 2,06 4,86 0,49
6. KI, SI 240,00 433,77 629,49 38,95 1,81 2,62 0,16
7. Attica, GR, case A 108,00 141,22 543,57 39,55 1,31 5,03 0,37
8. Attica, GR, case B
109,00 209,90 678,04 52,69 1,93 6,22 0,48
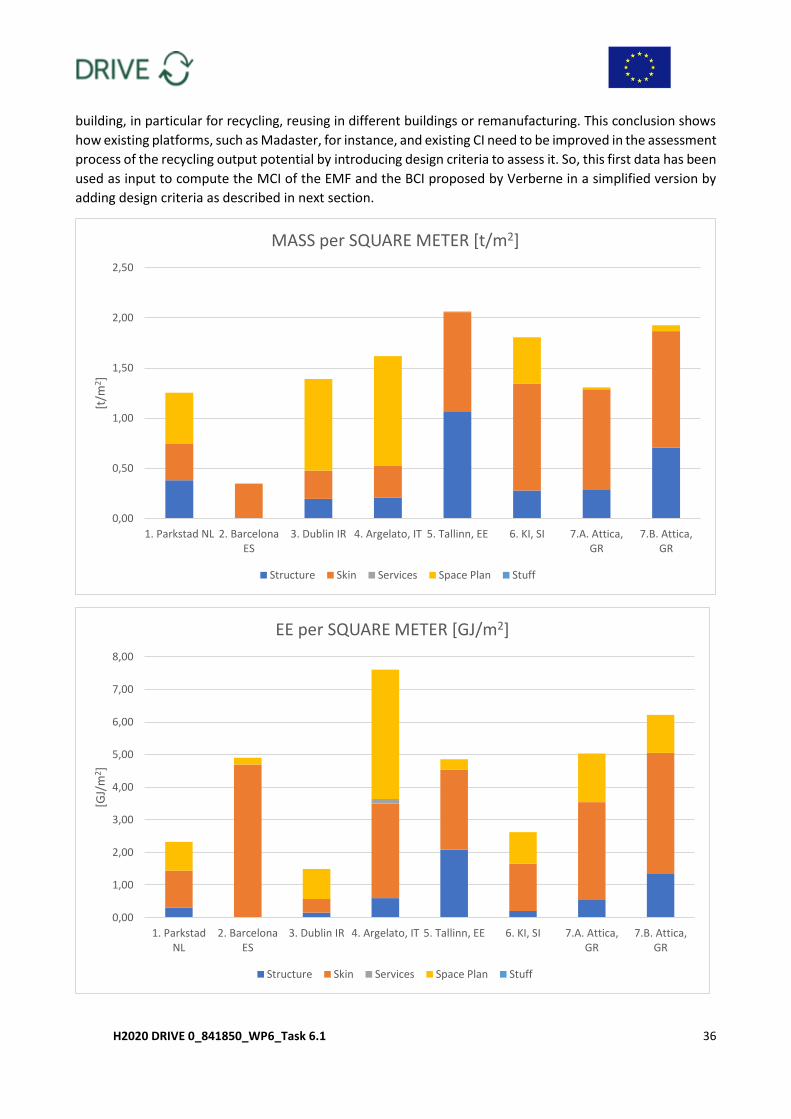
H2020 DRIVE 0_841850_WP6_Task 6.1 36
building, in particular for recycling, reusing in different buildings or remanufacturing. This conclusion shows
how existing platforms, such as Madaster, for instance, and existing CI need to be improved in the assessment
process of the recycling output potential by introducing design criteria to assess it. So, this first data has been
used as input to compute the MCI of the EMF and the BCI proposed by Verberne in a simplified version by
adding design criteria as described in next section.
0,00
0,50
1,00
1,50
2,00
2,50
1. Parkstad NL 2. BarcelonaES
3. Dublin IR 4. Argelato, IT 5. Tallinn, EE 6. KI, SI 7.A. Attica,GR
7.B. Attica,GR
[t/m
2 ]
MASS per SQUARE METER [t/m2]
Structure Skin Services Space Plan Stuff
0,00
1,00
2,00
3,00
4,00
5,00
6,00
7,00
8,00
1. ParkstadNL
2. BarcelonaES
3. Dublin IR 4. Argelato, IT 5. Tallinn, EE 6. KI, SI 7.A. Attica,GR
7.B. Attica,GR
[GJ/
m2 ]
EE per SQUARE METER [GJ/m2]
Structure Skin Services Space Plan Stuff
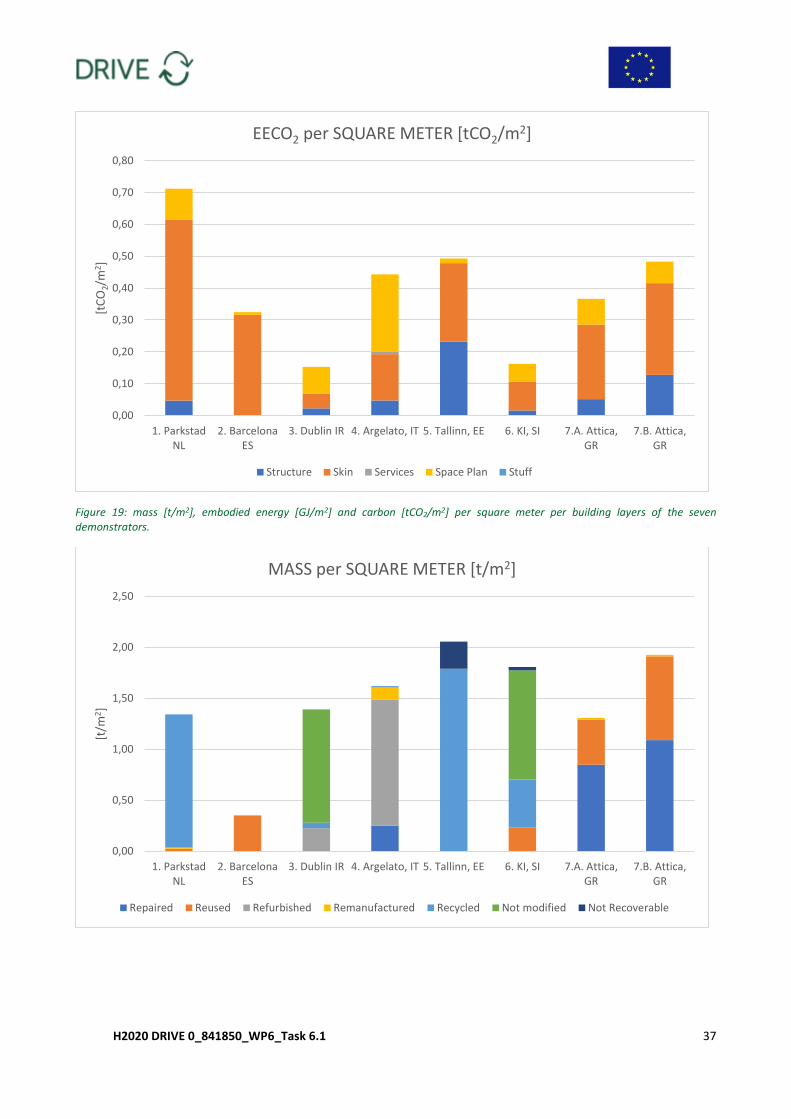
H2020 DRIVE 0_841850_WP6_Task 6.1 37
Figure 19: mass [t/m2], embodied energy [GJ/m2] and carbon [tCO2/m2] per square meter per building layers of the seven demonstrators.
0,00
0,10
0,20
0,30
0,40
0,50
0,60
0,70
0,80
1. ParkstadNL
2. BarcelonaES
3. Dublin IR 4. Argelato, IT 5. Tallinn, EE 6. KI, SI 7.A. Attica,GR
7.B. Attica,GR
[tC
O2/
m2 ]
EECO2 per SQUARE METER [tCO2/m2]
Structure Skin Services Space Plan Stuff
0,00
0,50
1,00
1,50
2,00
2,50
1. ParkstadNL
2. BarcelonaES
3. Dublin IR 4. Argelato, IT 5. Tallinn, EE 6. KI, SI 7.A. Attica,GR
7.B. Attica,GR
[t/m
2 ]
MASS per SQUARE METER [t/m2]
Repaired Reused Refurbished Remanufactured Recycled Not modified Not Recoverable
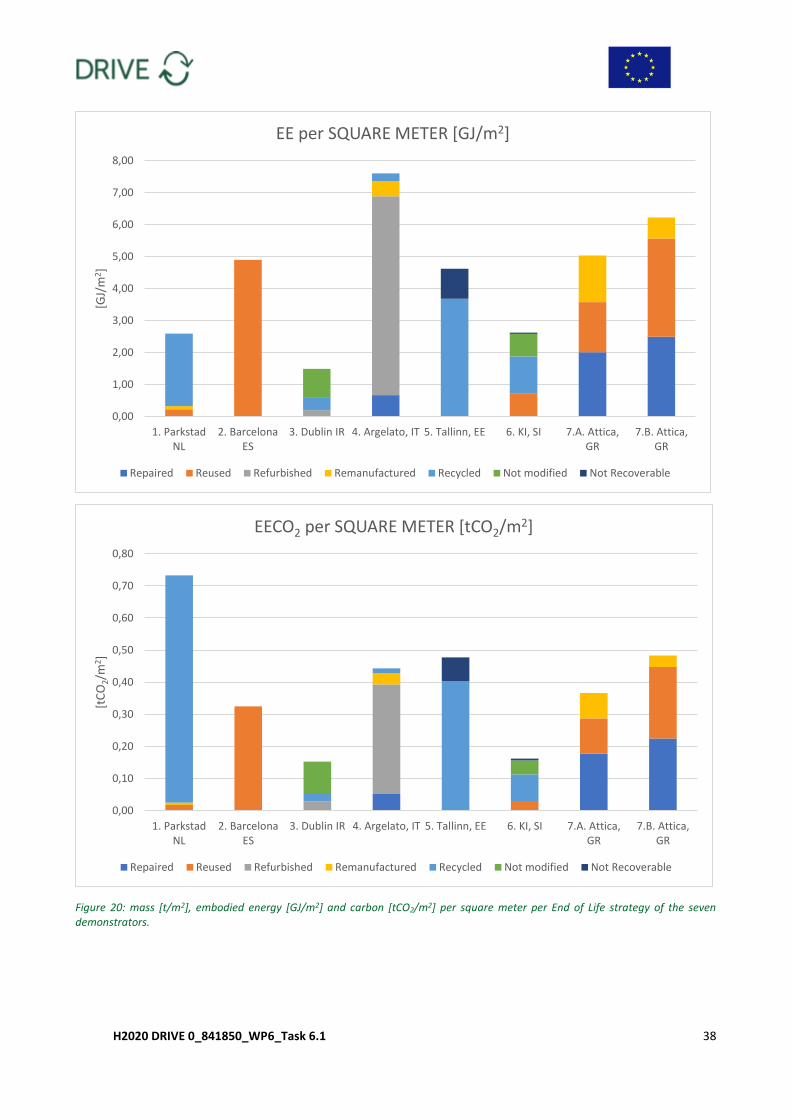
H2020 DRIVE 0_841850_WP6_Task 6.1 38
Figure 20: mass [t/m2], embodied energy [GJ/m2] and carbon [tCO2/m2] per square meter per End of Life strategy of the seven demonstrators.
0,00
1,00
2,00
3,00
4,00
5,00
6,00
7,00
8,00
1. ParkstadNL
2. BarcelonaES
3. Dublin IR 4. Argelato, IT 5. Tallinn, EE 6. KI, SI 7.A. Attica,GR
7.B. Attica,GR
[GJ/
m2 ]
EE per SQUARE METER [GJ/m2]
Repaired Reused Refurbished Remanufactured Recycled Not modified Not Recoverable
0,00
0,10
0,20
0,30
0,40
0,50
0,60
0,70
0,80
1. ParkstadNL
2. BarcelonaES
3. Dublin IR 4. Argelato, IT 5. Tallinn, EE 6. KI, SI 7.A. Attica,GR
7.B. Attica,GR
[tC
O2/m
2]
EECO2 per SQUARE METER [tCO2/m2]
Repaired Reused Refurbished Remanufactured Recycled Not modified Not Recoverable
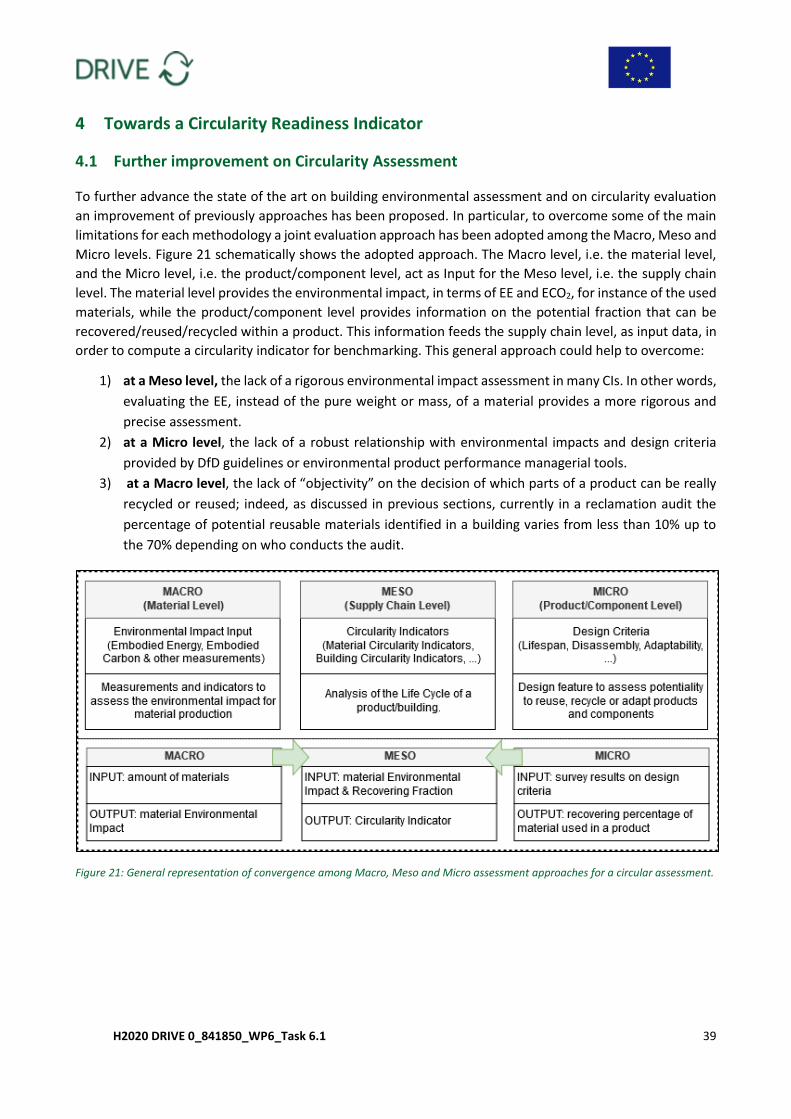
H2020 DRIVE 0_841850_WP6_Task 6.1 39
4 Towards a Circularity Readiness Indicator
4.1 Further improvement on Circularity Assessment
To further advance the state of the art on building environmental assessment and on circularity evaluation
an improvement of previously approaches has been proposed. In particular, to overcome some of the main
limitations for each methodology a joint evaluation approach has been adopted among the Macro, Meso and
Micro levels. Figure 21 schematically shows the adopted approach. The Macro level, i.e. the material level,
and the Micro level, i.e. the product/component level, act as Input for the Meso level, i.e. the supply chain
level. The material level provides the environmental impact, in terms of EE and ECO2, for instance of the used
materials, while the product/component level provides information on the potential fraction that can be
recovered/reused/recycled within a product. This information feeds the supply chain level, as input data, in
order to compute a circularity indicator for benchmarking. This general approach could help to overcome:
1) at a Meso level, the lack of a rigorous environmental impact assessment in many CIs. In other words,
evaluating the EE, instead of the pure weight or mass, of a material provides a more rigorous and
precise assessment.
2) at a Micro level, the lack of a robust relationship with environmental impacts and design criteria
provided by DfD guidelines or environmental product performance managerial tools.
3) at a Macro level, the lack of “objectivity” on the decision of which parts of a product can be really
recycled or reused; indeed, as discussed in previous sections, currently in a reclamation audit the
percentage of potential reusable materials identified in a building varies from less than 10% up to
the 70% depending on who conducts the audit.
Figure 21: General representation of convergence among Macro, Meso and Micro assessment approaches for a circular assessment.
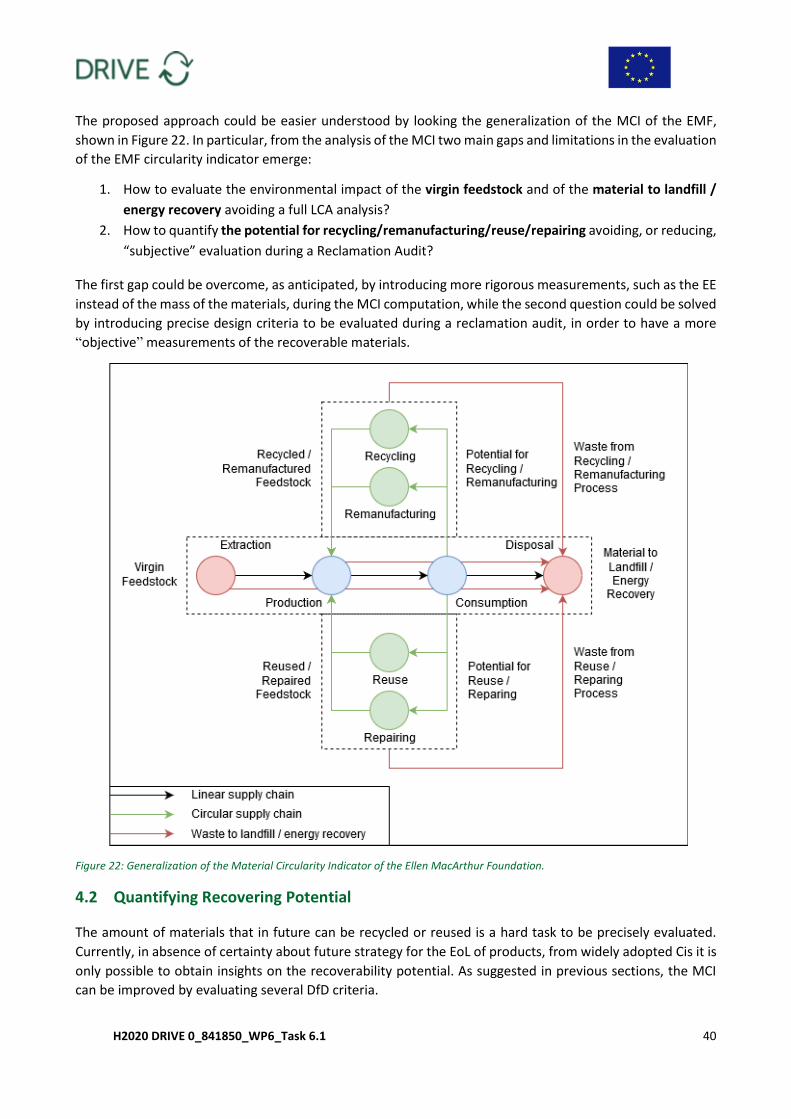
H2020 DRIVE 0_841850_WP6_Task 6.1 40
The proposed approach could be easier understood by looking the generalization of the MCI of the EMF,
shown in Figure 22. In particular, from the analysis of the MCI two main gaps and limitations in the evaluation
of the EMF circularity indicator emerge:
1. How to evaluate the environmental impact of the virgin feedstock and of the material to landfill /
energy recovery avoiding a full LCA analysis?
2. How to quantify the potential for recycling/remanufacturing/reuse/repairing avoiding, or reducing,
“subjective” evaluation during a Reclamation Audit?
The first gap could be overcome, as anticipated, by introducing more rigorous measurements, such as the EE
instead of the mass of the materials, during the MCI computation, while the second question could be solved
by introducing precise design criteria to be evaluated during a reclamation audit, in order to have a more
“objective” measurements of the recoverable materials.
Figure 22: Generalization of the Material Circularity Indicator of the Ellen MacArthur Foundation.
4.2 Quantifying Recovering Potential
The amount of materials that in future can be recycled or reused is a hard task to be precisely evaluated.
Currently, in absence of certainty about future strategy for the EoL of products, from widely adopted Cis it is
only possible to obtain insights on the recoverability potential. As suggested in previous sections, the MCI
can be improved by evaluating several DfD criteria.
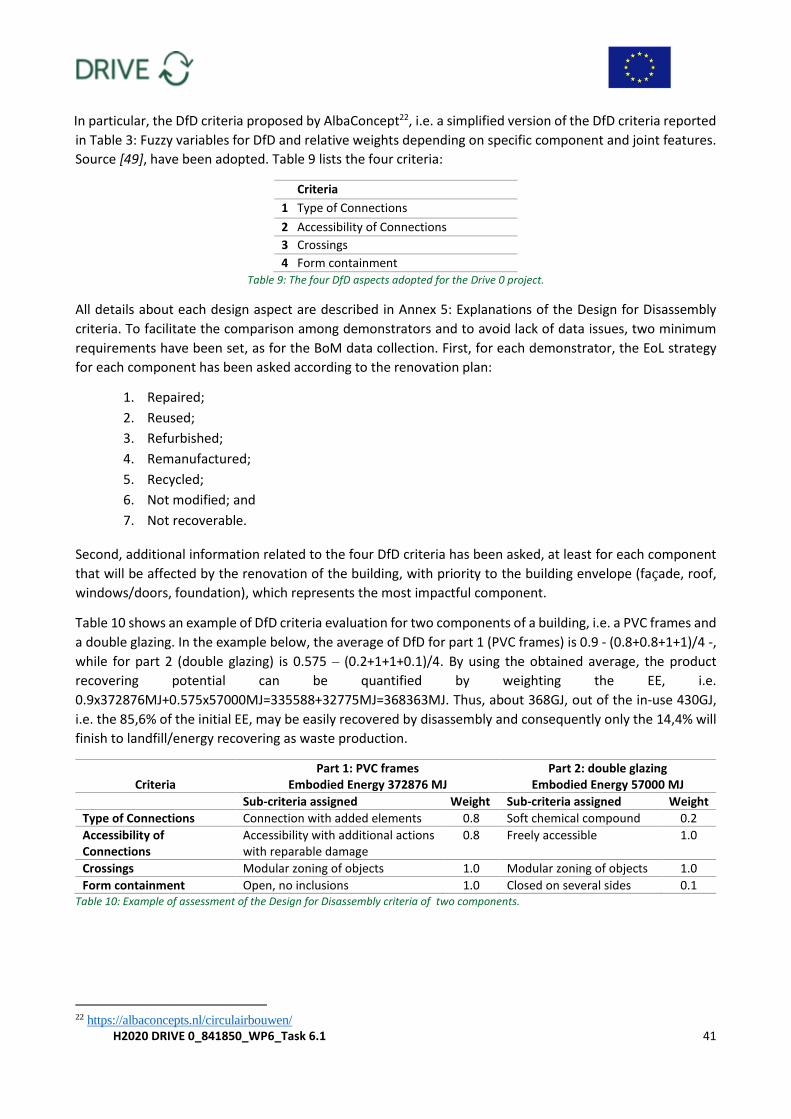
H2020 DRIVE 0_841850_WP6_Task 6.1 41
In particular, the DfD criteria proposed by AlbaConcept22, i.e. a simplified version of the DfD criteria reported
in Table 3: Fuzzy variables for DfD and relative weights depending on specific component and joint features.
Source [49], have been adopted. Table 9 lists the four criteria:
Criteria
1 Type of Connections
2 Accessibility of Connections
3 Crossings
4 Form containment
Table 9: The four DfD aspects adopted for the Drive 0 project.
All details about each design aspect are described in Annex 5: Explanations of the Design for Disassembly
criteria. To facilitate the comparison among demonstrators and to avoid lack of data issues, two minimum
requirements have been set, as for the BoM data collection. First, for each demonstrator, the EoL strategy
for each component has been asked according to the renovation plan:
1. Repaired;
2. Reused;
3. Refurbished;
4. Remanufactured;
5. Recycled;
6. Not modified; and
7. Not recoverable.
Second, additional information related to the four DfD criteria has been asked, at least for each component
that will be affected by the renovation of the building, with priority to the building envelope (façade, roof,
windows/doors, foundation), which represents the most impactful component.
Table 10 shows an example of DfD criteria evaluation for two components of a building, i.e. a PVC frames and
a double glazing. In the example below, the average of DfD for part 1 (PVC frames) is 0.9 - (0.8+0.8+1+1)/4 -,
while for part 2 (double glazing) is 0.575 – (0.2+1+1+0.1)/4. By using the obtained average, the product
recovering potential can be quantified by weighting the EE, i.e.
0.9x372876MJ+0.575x57000MJ=335588+32775MJ=368363MJ. Thus, about 368GJ, out of the in-use 430GJ,
i.e. the 85,6% of the initial EE, may be easily recovered by disassembly and consequently only the 14,4% will
finish to landfill/energy recovering as waste production.
Criteria
Part 1: PVC frames Embodied Energy 372876 MJ
Part 2: double glazing Embodied Energy 57000 MJ
Sub-criteria assigned Weight Sub-criteria assigned Weight
Type of Connections Connection with added elements 0.8 Soft chemical compound 0.2
Accessibility of Connections
Accessibility with additional actions with reparable damage
0.8 Freely accessible 1.0
Crossings Modular zoning of objects 1.0 Modular zoning of objects 1.0
Form containment Open, no inclusions 1.0 Closed on several sides 0.1 Table 10: Example of assessment of the Design for Disassembly criteria of two components.
22 https://albaconcepts.nl/circulairbouwen/
H2020 DRIVE 0_841850_WP6_Task 6.1 42
4.3 Results and Discussion
4.3.1. Recoverable percentage
In this subsection, the percentage of the recoverable materials is briefly reported, according to the approach
described in Section 4.2 by using DfD criteria as weight for the mass, EE and ECO2 for each component of
each demonstrator. Figure 23 shows, in percentage, the recovering potential for each demonstrator in terms
of mass, EE, and ECO2.
As concluded in previous section, more precise methodologies, with respect to the self-declaration of
practitioners and experts, are needed to assess the recovering potential of materials. In this subsection, the
percentage of the recoverable materials is briefly reported, according to the approach described in Section
4.2 by using DfD criteria as weight for the mass, EE and ECO2 for each component of each demonstrator.
Figure 24 shows, in percentage, the recovering potential for each demonstrator in terms of mass, EE and
ECO2 by evaluating it through the use of the design criteria.
From the following graphs a first straightforward conclusion is that the real recoverable percentage,
computed from the design criteria, is much lower than the self-declared 100%. The percentage varies from a
minimum of 24%, in terms of mass, for the Slovenian case study up to a maximum of 86% for the Estionian
case. The other demonstrators percentages lie between the 30% for the Irish and Italian case up to a 60% for
the Greek demonstrators. The Spanish recoverable percentage, since the DfD assessment refers only to the
external walls, component that is intrinsically harder to be disassembled, is much lower (18%) than the other
demonstrators. For the Estonian case, which has an higher recoverable percentage with respect to the other
cases, the result can be explained because of the analysed building already had a thermal insulation,
component that is easily detachable, and, consequently, the total recoverable percentage is very high.
Moreover, from Figure 23 a consideration can be done. Percentages seem to do not change to much among
mass, EE and ECO2 for the same demonstrator. Generally, results change with an error of + 2%, except for
the Irish case (+6%) and the Slovenian one (+4%). Thus, by assuming an uncertainty less than the 6%, in order
to compute the total recoverable percentage, it is indifferent to choose mass, EE or ECO2 as unit of measure.
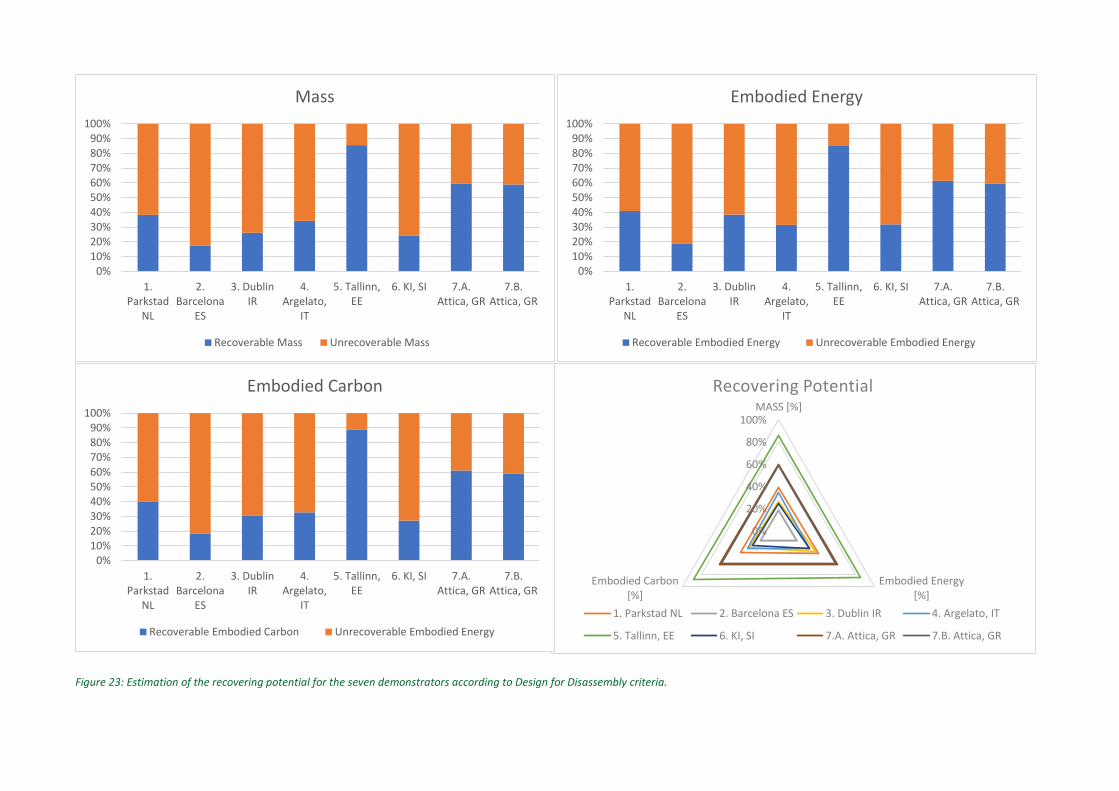
Figure 23: Estimation of the recovering potential for the seven demonstrators according to Design for Disassembly criteria.
0%
20%
40%
60%
80%
100%MASS [%]
Embodied Energy[%]
Embodied Carbon[%]
Recovering Potential
1. Parkstad NL 2. Barcelona ES 3. Dublin IR 4. Argelato, IT
5. Tallinn, EE 6. KI, SI 7.A. Attica, GR 7.B. Attica, GR
0%10%20%30%40%50%60%70%80%90%
100%
1.Parkstad
NL
2.Barcelona
ES
3. DublinIR
4.Argelato,
IT
5. Tallinn,EE
6. KI, SI 7.A.Attica, GR
7.B.Attica, GR
Mass
Recoverable Mass Unrecoverable Mass
0%10%20%30%40%50%60%70%80%90%
100%
1.Parkstad
NL
2.Barcelona
ES
3. DublinIR
4.Argelato,
IT
5. Tallinn,EE
6. KI, SI 7.A.Attica, GR
7.B.Attica, GR
Embodied Energy
Recoverable Embodied Energy Unrecoverable Embodied Energy
0%10%20%30%40%50%60%70%80%90%
100%
1.Parkstad
NL
2.Barcelona
ES
3. DublinIR
4.Argelato,
IT
5. Tallinn,EE
6. KI, SI 7.A.Attica, GR
7.B.Attica, GR
Embodied Carbon
Recoverable Embodied Carbon Unrecoverable Embodied Energy
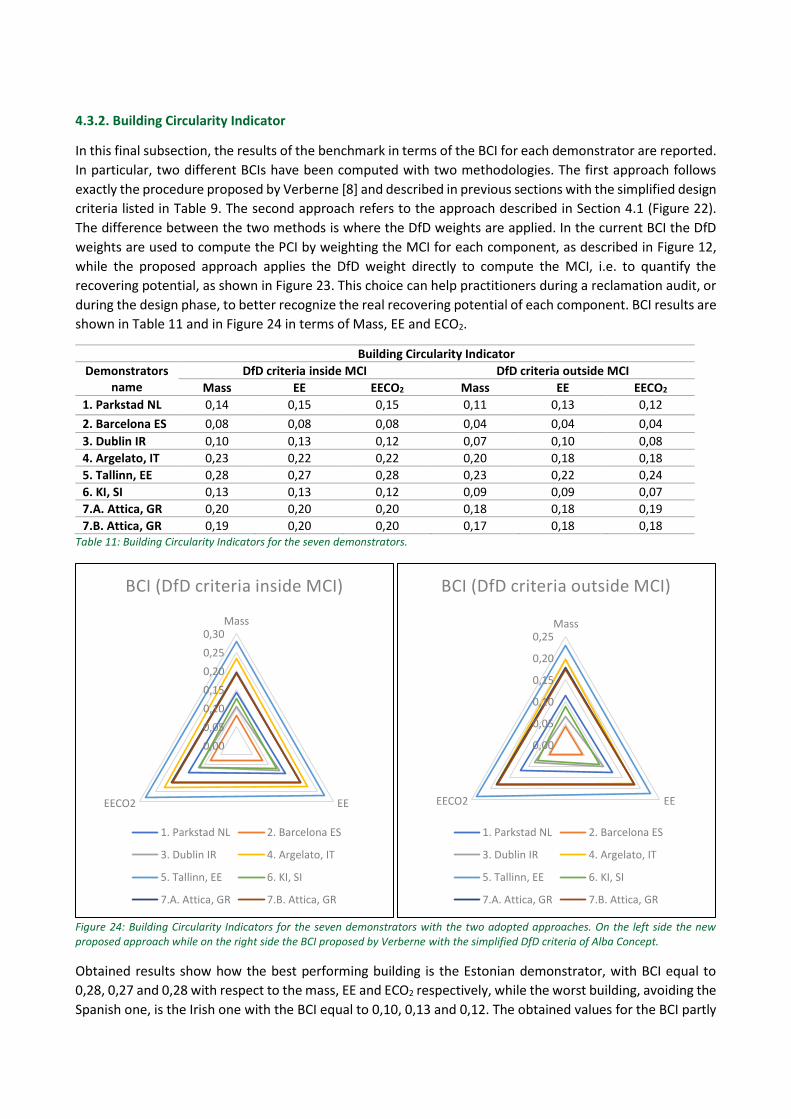
4.3.2. Building Circularity Indicator
In this final subsection, the results of the benchmark in terms of the BCI for each demonstrator are reported.
In particular, two different BCIs have been computed with two methodologies. The first approach follows
exactly the procedure proposed by Verberne [8] and described in previous sections with the simplified design
criteria listed in Table 9. The second approach refers to the approach described in Section 4.1 (Figure 22).
The difference between the two methods is where the DfD weights are applied. In the current BCI the DfD
weights are used to compute the PCI by weighting the MCI for each component, as described in Figure 12,
while the proposed approach applies the DfD weight directly to compute the MCI, i.e. to quantify the
recovering potential, as shown in Figure 23. This choice can help practitioners during a reclamation audit, or
during the design phase, to better recognize the real recovering potential of each component. BCI results are
shown in Table 11 and in Figure 24 in terms of Mass, EE and ECO2.
Building Circularity Indicator
Demonstrators name
DfD criteria inside MCI DfD criteria outside MCI
Mass EE EECO2 Mass EE EECO2
1. Parkstad NL 0,14 0,15 0,15 0,11 0,13 0,12
2. Barcelona ES 0,08 0,08 0,08 0,04 0,04 0,04
3. Dublin IR 0,10 0,13 0,12 0,07 0,10 0,08
4. Argelato, IT 0,23 0,22 0,22 0,20 0,18 0,18
5. Tallinn, EE 0,28 0,27 0,28 0,23 0,22 0,24
6. KI, SI 0,13 0,13 0,12 0,09 0,09 0,07
7.A. Attica, GR 0,20 0,20 0,20 0,18 0,18 0,19
7.B. Attica, GR 0,19 0,20 0,20 0,17 0,18 0,18 Table 11: Building Circularity Indicators for the seven demonstrators.
Figure 24: Building Circularity Indicators for the seven demonstrators with the two adopted approaches. On the left side the new proposed approach while on the right side the BCI proposed by Verberne with the simplified DfD criteria of Alba Concept.
Obtained results show how the best performing building is the Estonian demonstrator, with BCI equal to
0,28, 0,27 and 0,28 with respect to the mass, EE and ECO2 respectively, while the worst building, avoiding the
Spanish one, is the Irish one with the BCI equal to 0,10, 0,13 and 0,12. The obtained values for the BCI partly
0,00
0,05
0,10
0,15
0,20
0,25
0,30Mass
EEEECO2
BCI (DfD criteria inside MCI)
1. Parkstad NL 2. Barcelona ES
3. Dublin IR 4. Argelato, IT
5. Tallinn, EE 6. KI, SI
7.A. Attica, GR 7.B. Attica, GR
0,00
0,05
0,10
0,15
0,20
0,25Mass
EEEECO2
BCI (DfD criteria outside MCI)
1. Parkstad NL 2. Barcelona ES
3. Dublin IR 4. Argelato, IT
5. Tallinn, EE 6. KI, SI
7.A. Attica, GR 7.B. Attica, GR
H2020 DRIVE 0_841850_WP6_Task 6.1 45
reflect the previously discussed results in terms of recovering potential and are highly depending on
interpretation of the current guidelines.
Finally, from Table 11 and in Figure 24 it emerges that the proposed approach, i.e. DfD inside the MCI, shows
slightly higher values for the BCIs. The distance between the two indicators, i.e. the difference between the
values, in terms of mass, EE and ECO2, is quite constant and in any case not higher than 0,05. This small
difference, apparently negligible, is in reality not negligible. In the case studies within this report an initial
hypothesis about the utility, i.e. the average lifetime of each component, was done for all the components.
Indeed, due to lack of data, the utility was assumed equal to 1 for each component. Thus, the differences
between the two indicators are almost constant.
H2020 DRIVE 0_841850_WP6_Task 6.1 46
5 Concluding Remarks
The aim of this preliminary benchmarking was twofold. Firstly, quantifying and assessing the EE and the ECO2
of materials in order to have an order of magnitude. Consequently, by knowing the EE and ECO2 of the in-use
materials, it is possible to assess the environmental improvement for the renovations in terms of energy
saving (not only in terms of operational energy) and computing the EROI (Energy Return of Investments) of
the interventions. The EROI is a useful information on building deep renovations in order to engage relevant
stakeholders such as the owner or investment banks and companies and it may provide interesting tips and
insights for the Work Package 5 (Consumer centred Business models and Financing). Moreover, it is possible
to identify the most impactful materials and components, to better plan circular strategies and priorities EoL
scenarios, based on precise DfD criteria evaluated during first building site inspections and reclamation audit.
Secondly, the thorough literature review and the discussion presented in Section 2 will serve as input for
subsequent tasks and aims of the Drive 0 project such as the development of a Circularity Readiness Indicator
(Task 5.3), the development of a catalogue with Circular Concepts (Task 3.5) and the development of circular
renovation process (Task 3.2) as discussed in the introduction.
5.1 Recommendation and further improvements
From the analysis described within this report some limitations related to the circularity assessment
emerged.
Firstly, the data collection process to obtain precise information for the BoM needs detailed guidelines for
the practitioners and is open for interpretation. Precise minimum requirements have to be provided to the
experts responsible of the reclamation audit to allow meaningful comparison among different buildings.
Indeed, during the reclamation audit of the seven demonstrators of the Drive 0 project, different experts and
practitioners identified different priorities. For instance, it is necessary to survey, at least, the structure, the
skin and the space plan, i.e. the most impactful layers. Common in-depth boundary conditions must be
defined. In other words, during a reclamation audit one can decide to evaluate windows, or doors as a unique
component, or to separate each subcomponent. The same approach must be established for the services,
roofs and walls, etc. Unclear boundary conditions affect the comparison among different buildings due to
different level of details. It is necessary to avoid uncertainty if the assessment relates to a component in and
of itself or its relationship to its context or both. Building elements are often made of various components in
a hierarchy of elements.
Secondly, with respect to the DfD criteria further recommendations are needed. A balance between very
detailed design criteria, such as presented by Durmisevic, and general ones, such as presented by
AlbaConcepts, is essential, and possible application has to be taken into acoount. Too specific and precise
criteria means a very time-consuming process for the reclamation audit and can create difficulties in the
experts without design knowledge. Too broad and general criteria can result in meaningless results with too
high uncertainties. In any case, real examples for the practitioners which conduct the reclamation audit must
be provided to avoid misunderstanding during the design evaluation.
H2020 DRIVE 0_841850_WP6_Task 6.1 47
6 Bibliography
[1] “Global Material Resources Outlook to 2060,” 2018.
[2] “Measuring and Monitoring Resource Efficiency Factsheet,” 2017.
[3] E. L. H. Naboni, Ed., Regenerative Design in digital practice. A Handbook for the built environment. Eurac Research, 2019.
[4] E. Schut, M. Crielaard, and M. Mesman, “Circular economy in the Dutch construction sector: A perspective for the market and government,” 2015.
[5] S. van Leeuwen et al., “Circulair Bouwen in Perspectief,” 2018.
[6] F. Heisel and S. Rau-Oberhuber, “Calculation and evaluation of circularity indicators for the built environment using the case studies of UMAR and Madaster,” J. Clean. Prod., vol. 243, p. 118482, 2020.
[7] Madaster Services B.V., “Madaster Circularity Indicator explained,” p. 18, 2017.
[8] J. Verberne, “Building circularity indicators - an approach for measuring circularity of a building,” p. 165, 2016.
[9] E. Macarthur, “An Approach to Measuring Circularity,” Circ. Indic. An approach to Meas. Circ. Methodol., vol. 23, no. 1, pp. 159–161, 2015.
[10] D. Wassink, “Salvage Assessments in Seattle: Reflecting on a Policy Tool to Increase Building Material Recovery,” in Seeding New Growth, 2016.
[11] M. K. Dixit, C. H. Culp, and J. L. Fernández-Solís, “System boundary for embodied energy in buildings: A conceptual model for definition,” Renew. Sustain. Energy Rev., vol. 21, pp. 153–164, 2013.
[12] R. Azari and N. Abbasabadi, “Embodied energy of buildings: A review of data, methods, challenges, and research trends,” Energy Build., vol. 168, pp. 225–235, 2018.
[13] T. Ramesh, R. Prakash, and K. K. Shukla, “Life cycle energy analysis of buildings: An overview,” Energy Build., vol. 42, no. 10, pp. 1592–1600, 2010.
[14] R. J. Cole and P. C. Kernan, “Life-Cycle Energy Use in Office Buildings,” vol. 31, no. 4, pp. 307–317, 1996.
[15] “DIRECTIVE 2010/31/EU OF THE EUROPEAN PARLIAMENT AND OF THE COUNCIL,” Presse Med., vol. 63, no. 30, p. 619, 1955.
[16] P. Crowther, “DESIGN FOR DISASSEMBLY TO RECOVER EMBODIED ENERGY,” 16th Int. Conf. Passiv. Low Energy Archit., 1999.
[17] G. K. C. Ding, “The development of a multi-criteria approach for the measurement of sustainable performance for built projects and facilities,” A thesis Submitt. fulfilment Requir. Award Dr. Philos., p. 404, 2004.
[18] M. K. Dixit, J. L. Fernández-Solís, S. Lavy, and C. H. Culp, “Identification of parameters for embodied energy measurement: A literature review,” Energy Build., vol. 42, no. 8, pp. 1238–1247, 2010.
[19] J. Reap, F. Roman, S. Duncan, and B. Bras, “A survey of unresolved problems in life cycle assessment. Part 2: Impact assessment and interpretation,” Int. J. Life Cycle Assess., vol. 13, no. 5, pp. 374–388, 2008.
[20] R. H. Crawford, “Life cycle energy and greenhouse emissions analysis of wind turbines and the effect of size on energy yield,” Renew. Sustain. Energy Rev., vol. 13, no. 9, pp. 2653–2660, 2009.
[21] M. K. Dixit, J. L. Fernández-Solís, S. Lavy, and C. H. Culp, “Need for an embodied energy measurement protocol for buildings: A review paper,” Renew. Sustain. Energy Rev., vol. 16, no. 6, pp. 3730–3743,
H2020 DRIVE 0_841850_WP6_Task 6.1 48
2012.
[22] N. Dodd, M. Cordella, M. Traverso, and S. Donatello, Level(s)-A common EU framework of core sustainability indicators for office and residential buildings Part 3: How to make performance assessments using Level(s) (Draft Beta v1.0), no. August. 2017.
[23] N. Dodd, M. Cordella, M. Traverso, and S. Donatello, Level(s)-A common EU framework of core sustainability indicators for office and residential buildings Parts 1 and 2: Introduction to Level(s) and how it works (Draft Beta v1.0), no. August. 2017.
[24] M. Goedkoop and M. Huijbregts, “ReCiPe 2008 Characterisation,” pp. 4–20, 2013.
[25] M. Finkbeiner, E. M. Schau, A. Lehmann, and M. Traverso, “Towards life cycle sustainability assessment,” Sustainability, vol. 2, no. 10, pp. 3309–3322, 2010.
[26] M. Bengtsson and B. Steen, “Weighting in LCA - approaches and applications,” Environ. Prog., vol. 19, no. 2, pp. 101–109, 2000.
[27] W. L. Lee, “A comprehensive review of metrics of building environmental assessment schemes,” Energy Build., vol. 62, pp. 403–413, 2013.
[28] K. F. Ben Kubbinga, Max Bamberger, Edwin van Noort, Dirk van den Reek, Merlijn Blok, Gerard Roemers, Justin Hoek, “A framework for Circular Building,” 2018.
[29] E. Franklin-Johnson, F. Figge, and L. Canning, “Resource duration as a managerial indicator for Circular Economy performance,” J. Clean. Prod., vol. 133, pp. 589–598, 2016.
[30] J. Y. Park and M. R. Chertow, “Establishing and testing the ‘reuse potential’ indicator for managing wastes as resources,” J. Environ. Manage., vol. 137, pp. 45–53, 2014.
[31] B. Corona, L. Shen, D. Reike, J. Rosales Carreón, and E. Worrell, “Towards sustainable development through the circular economy—A review and critical assessment on current circularity metrics,” Resour. Conserv. Recycl., vol. 151, no. May, p. 104498, 2019.
[32] M. Saidani, B. Yannou, Y. Leroy, F. Cluzel, and A. Kendall, “A taxonomy of circular economy indicators,” J. Clean. Prod., vol. 207, pp. 542–559, 2019.
[33] A. Parchomenko, D. Nelen, J. Gillabel, and H. Rechberger, “Measuring the circular economy - A Multiple Correspondence Analysis of 63 metrics,” J. Clean. Prod., vol. 210, pp. 200–216, 2019.
[34] S. Brand, How buildings learn: What happens after they’re built. Penguin, 1995.
[35] M. van Vliet, “Disassembling the steps towards Building Circularity,” 2018.
[36] C. W. Van Schaik, “Circular building foundations,” no. June, 2019.
[37] M. Niero and P. P. Kalbar, “Coupling material circularity indicators and life cycle based indicators: A proposal to advance the assessment of circular economy strategies at the product level,” Resour. Conserv. Recycl., vol. 140, no. October 2018, pp. 305–312, 2019.
[38] F. Di Maio, P. C. Rem, K. Baldé, and M. Polder, “Measuring resource efficiency and circular economy: A market value approach,” Resour. Conserv. Recycl., vol. 122, pp. 163–171, 2017.
[39] C. J. Kibert, Sustainable construction: green building design and delivery. John Wiley & Sons, 2016.
[40] T. Dorsthorst, B., & Kowalczyk, “Design for recycling. Design for deconstruction and materials reuse,” in Proceedings of the International Council for Research and Innovation in Building Construction, 2002, pp. 70–80.
[41] J. Yarwood and P. Eagan, “Design for Environment Toolkit: a competitive edge for the future,” Matrix, p. 72, 1998.

H2020 DRIVE 0_841850_WP6_Task 6.1 49
[42] E. Durmisevic, “DESIGN ASPECTS OF DECOMPOSABLE BUILDING STRUCTURES,” Proc. CIB Task Gr., vol. 1, 2002.
[43] D. Stankovic et al., “Reconditioning and reconstruction: A second wind for Serbian kindergartens,” Procedia Eng., vol. 117, no. 1, pp. 751–765, 2015.
[44] T. F. Go, D. A. Wahab, and H. Hishamuddin, “Multiple generation life-cycles for product sustainability: The way forward,” J. Clean. Prod., vol. 95, pp. 16–29, 2015.
[45] O. O. Akinade et al., “Design for Deconstruction (DfD): Critical success factors for diverting end-of-life waste from landfills,” Waste Manag., vol. 60, pp. 3–13, 2017.
[46] B. Ciarimboli, N., & Guy, “Design for Disassembly in the built environment: a guide to cloosed-loop design and building,” 2007.
[47] P. Russell and S. Moffat, “Assessing the adaptability of buildings,” Int. Energy Agency Annex, vol. 31, no. Energy-related environmental impact of buildings, pp. 1–13, 2001.
[48] R. Geraedts, “FLEX 4 . 0 , a practical instrument to assess the adaptive capacity of buildings,” Energy Procedia, vol. 96, no. October, pp. 568–579, 2016.
[49] and C. J. A. Durmisevic, E., Ö. Ciftcioglu, “Knowledge Model for Assessing Disassembly Potential.,” 2006.
[50] I. I. Issa, D. C. A. Pigosso, T. C. McAloone, and H. Rozenfeld, “Leading product-related environmental performance indicators: a selection guide and database,” J. Clean. Prod., vol. 108, no. PartA, pp. 321–330, 2015.
[51] C. Cerdan, C. Gazulla, M. Raugei, E. Martinez, and P. Fullana-i-Palmer, “Proposal for new quantitative eco-design indicators: a first case study,” J. Clean. Prod., vol. 17, no. 18, pp. 1638–1643, 2009.
[52] E. Kroll, B. Beardsley, and A. Parulian, “A methodology to evaluate ease of disassembly for product recycling,” IIE Trans. (Institute Ind. Eng., vol. 28, no. 10, pp. 837–845, 1996.
[53] L. Hildebrand and R. Bach, “A Comparative Overview of Tools for Environmental Assessment of Materials , Components and Buildings,” no. July, 2018.
[54] “Sustainability of Structures - Environmental Product Declarations Basic Rules for the Product Category Construction Products; EN 15804:2012 (Vol. 15804:2012). Berlin: DIN Deutsches Institut für Normung e. V.[ German Institute for Standardization] Ecoinven,” 2012.
[55] K. Forth, “Semi-automated processes for BIM to LCA,” in Regenerative Design in digital Practice., 2019, pp. 271–277.
[56] T. D. Mora, “Evaluating tools coupling BIM and LCA,” in Regenerative Design in digital Practice., 2019, pp. 278–280.
[57] L. A. Akanbi et al., “Disassembly and deconstruction analytics system ( D-DAS ) for construction in a circular economy,” J. Clean. Prod., vol. 223, pp. 386–396, 2019.
[58] C. Cavalliere, G. Ra, D. Osso, F. Favia, and M. Lovicario, “Automation in Construction BIM-based assessment metrics for the functional fl exibility of building designs,” vol. 107, no. August, 2019.
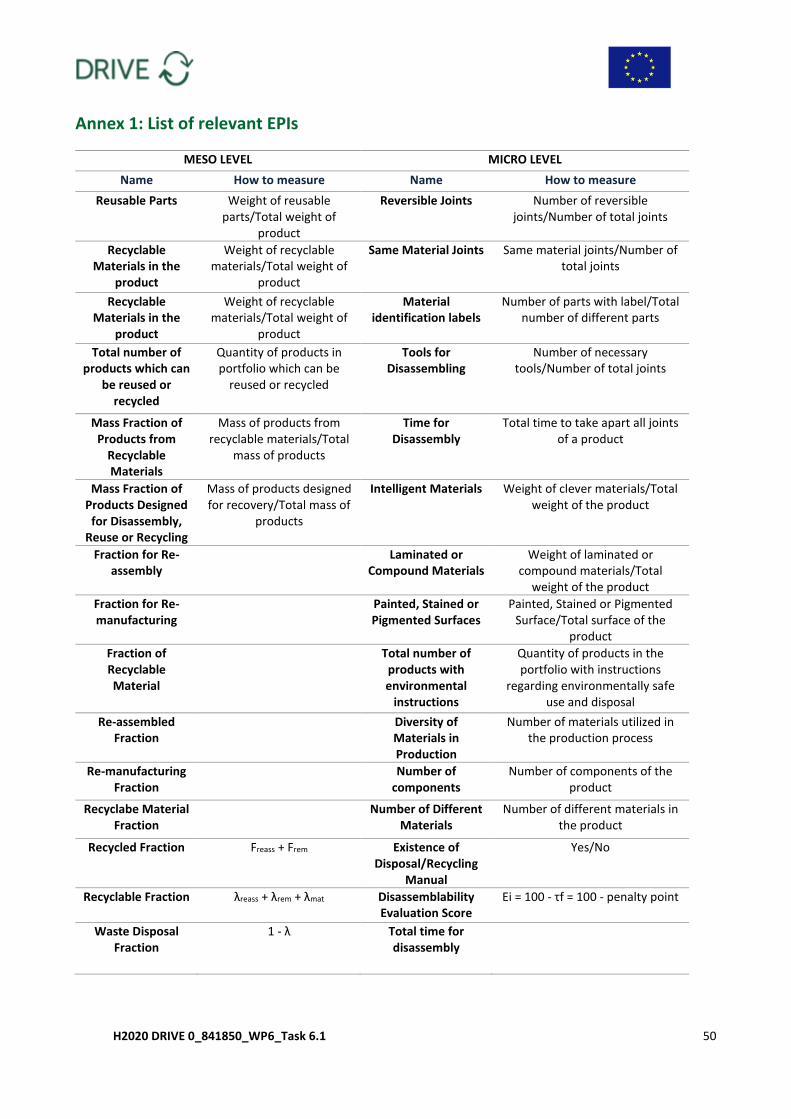
H2020 DRIVE 0_841850_WP6_Task 6.1 50
Annex 1: List of relevant EPIs
MESO LEVEL MICRO LEVEL
Name How to measure Name How to measure
Reusable Parts Weight of reusable parts/Total weight of
product
Reversible Joints Number of reversible joints/Number of total joints
Recyclable Materials in the
product
Weight of recyclable materials/Total weight of
product
Same Material Joints Same material joints/Number of total joints
Recyclable Materials in the
product
Weight of recyclable materials/Total weight of
product
Material identification labels
Number of parts with label/Total number of different parts
Total number of products which can
be reused or recycled
Quantity of products in portfolio which can be
reused or recycled
Tools for Disassembling
Number of necessary tools/Number of total joints
Mass Fraction of Products from
Recyclable Materials
Mass of products from recyclable materials/Total
mass of products
Time for Disassembly
Total time to take apart all joints of a product
Mass Fraction of Products Designed
for Disassembly, Reuse or Recycling
Mass of products designed for recovery/Total mass of
products
Intelligent Materials Weight of clever materials/Total weight of the product
Fraction for Re-assembly
Laminated or Compound Materials
Weight of laminated or compound materials/Total
weight of the product
Fraction for Re-manufacturing
Painted, Stained or Pigmented Surfaces
Painted, Stained or Pigmented Surface/Total surface of the
product
Fraction of Recyclable Material
Total number of products with environmental
instructions
Quantity of products in the portfolio with instructions
regarding environmentally safe use and disposal
Re-assembled Fraction
Diversity of Materials in Production
Number of materials utilized in the production process
Re-manufacturing Fraction
Number of components
Number of components of the product
Recyclabe Material Fraction
Number of Different Materials
Number of different materials in the product
Recycled Fraction Freass + Frem Existence of Disposal/Recycling
Manual
Yes/No
Recyclable Fraction λreass + λrem + λmat Disassemblability Evaluation Score
Ei = 100 - τf = 100 - penalty point
Waste Disposal Fraction
1 - λ Total time for disassembly
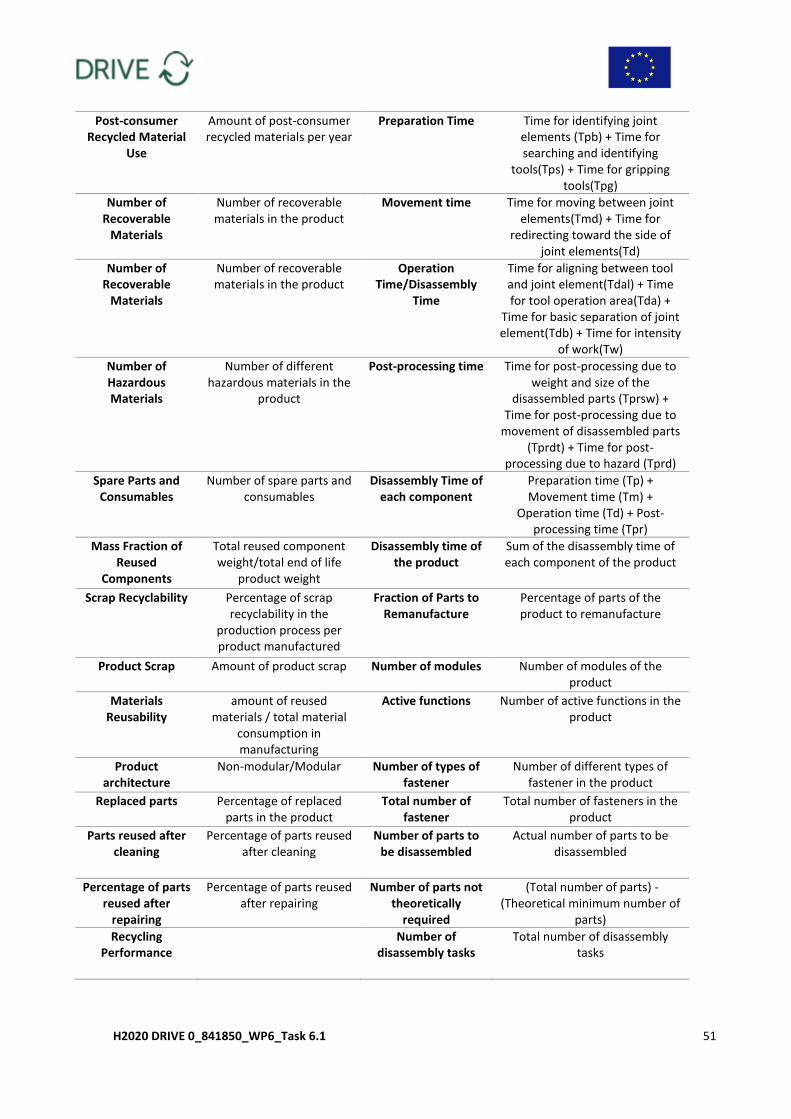
H2020 DRIVE 0_841850_WP6_Task 6.1 51
Post-consumer Recycled Material
Use
Amount of post-consumer recycled materials per year
Preparation Time Time for identifying joint elements (Tpb) + Time for searching and identifying
tools(Tps) + Time for gripping tools(Tpg)
Number of Recoverable
Materials
Number of recoverable materials in the product
Movement time Time for moving between joint elements(Tmd) + Time for
redirecting toward the side of joint elements(Td)
Number of Recoverable
Materials
Number of recoverable materials in the product
Operation Time/Disassembly
Time
Time for aligning between tool and joint element(Tdal) + Time for tool operation area(Tda) +
Time for basic separation of joint element(Tdb) + Time for intensity
of work(Tw)
Number of Hazardous Materials
Number of different hazardous materials in the
product
Post-processing time Time for post-processing due to weight and size of the
disassembled parts (Tprsw) + Time for post-processing due to
movement of disassembled parts (Tprdt) + Time for post-
processing due to hazard (Tprd)
Spare Parts and Consumables
Number of spare parts and consumables
Disassembly Time of each component
Preparation time (Tp) + Movement time (Tm) +
Operation time (Td) + Post-processing time (Tpr)
Mass Fraction of Reused
Components
Total reused component weight/total end of life
product weight
Disassembly time of the product
Sum of the disassembly time of each component of the product
Scrap Recyclability Percentage of scrap recyclability in the
production process per product manufactured
Fraction of Parts to Remanufacture
Percentage of parts of the product to remanufacture
Product Scrap Amount of product scrap Number of modules Number of modules of the product
Materials Reusability
amount of reused materials / total material
consumption in manufacturing
Active functions Number of active functions in the product
Product architecture
Non-modular/Modular Number of types of fastener
Number of different types of fastener in the product
Replaced parts Percentage of replaced parts in the product
Total number of fastener
Total number of fasteners in the product
Parts reused after cleaning
Percentage of parts reused after cleaning
Number of parts to be disassembled
Actual number of parts to be disassembled
Percentage of parts reused after
repairing
Percentage of parts reused after repairing
Number of parts not theoretically
required
(Total number of parts) - (Theoretical minimum number of
parts)
Recycling Performance
Number of disassembly tasks
Total number of disassembly tasks
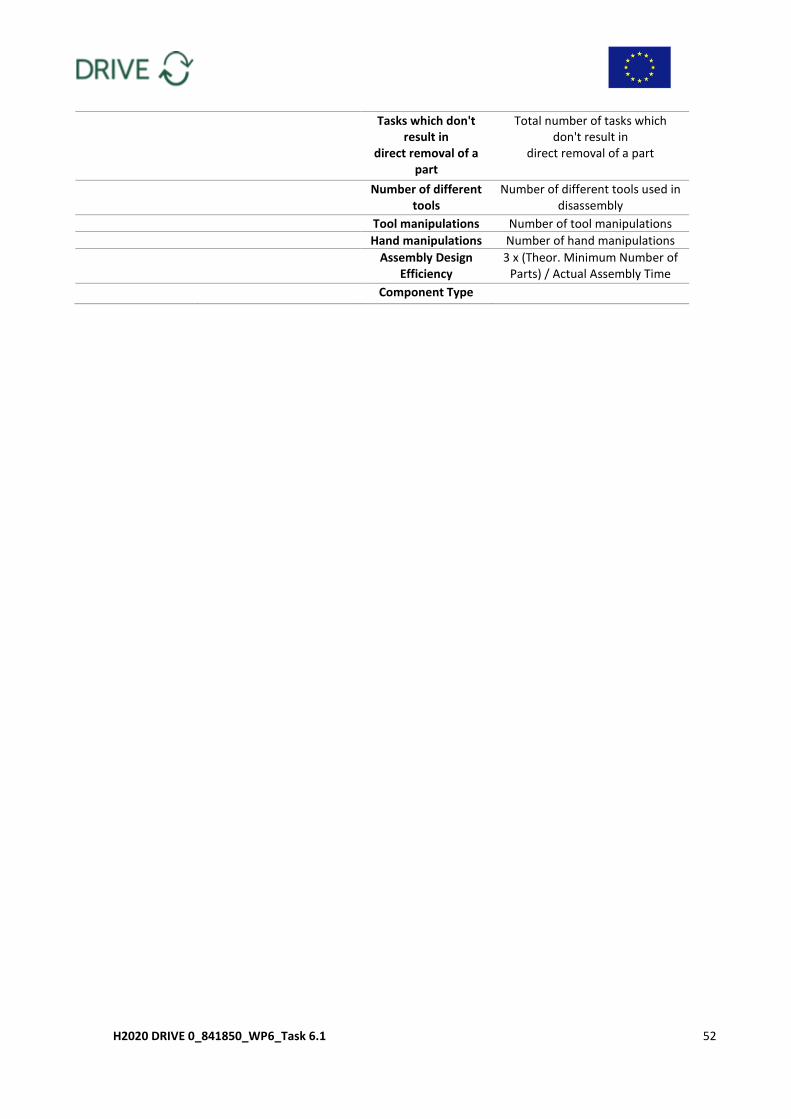
H2020 DRIVE 0_841850_WP6_Task 6.1 52
Tasks which don't result in
direct removal of a part
Total number of tasks which don't result in
direct removal of a part
Number of different tools
Number of different tools used in disassembly
Tool manipulations Number of tool manipulations
Hand manipulations Number of hand manipulations
Assembly Design Efficiency
3 x (Theor. Minimum Number of Parts) / Actual Assembly Time
Component Type
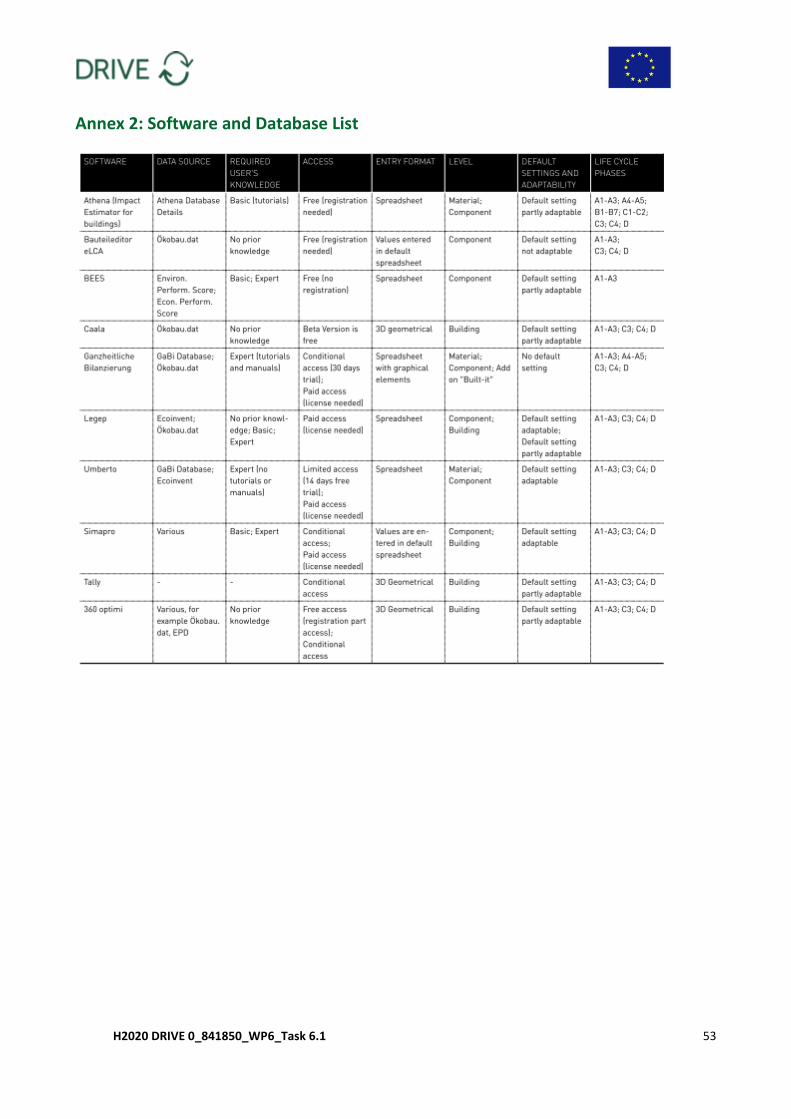
H2020 DRIVE 0_841850_WP6_Task 6.1 53
Annex 2: Software and Database List
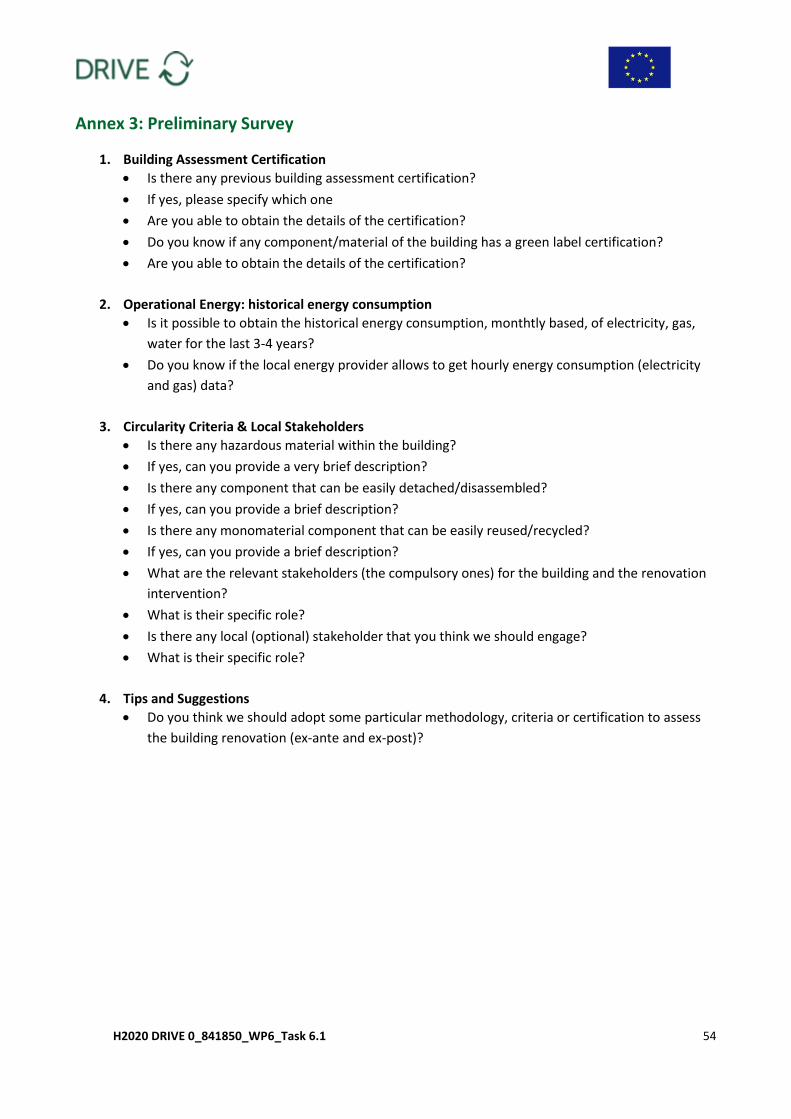
H2020 DRIVE 0_841850_WP6_Task 6.1 54
Annex 3: Preliminary Survey
1. Building Assessment Certification
Is there any previous building assessment certification?
If yes, please specify which one
Are you able to obtain the details of the certification?
Do you know if any component/material of the building has a green label certification?
Are you able to obtain the details of the certification?
2. Operational Energy: historical energy consumption
Is it possible to obtain the historical energy consumption, monthtly based, of electricity, gas,
water for the last 3-4 years?
Do you know if the local energy provider allows to get hourly energy consumption (electricity
and gas) data?
3. Circularity Criteria & Local Stakeholders
Is there any hazardous material within the building?
If yes, can you provide a very brief description?
Is there any component that can be easily detached/disassembled?
If yes, can you provide a brief description?
Is there any monomaterial component that can be easily reused/recycled?
If yes, can you provide a brief description?
What are the relevant stakeholders (the compulsory ones) for the building and the renovation
intervention?
What is their specific role?
Is there any local (optional) stakeholder that you think we should engage?
What is their specific role?
4. Tips and Suggestions
Do you think we should adopt some particular methodology, criteria or certification to assess
the building renovation (ex-ante and ex-post)?
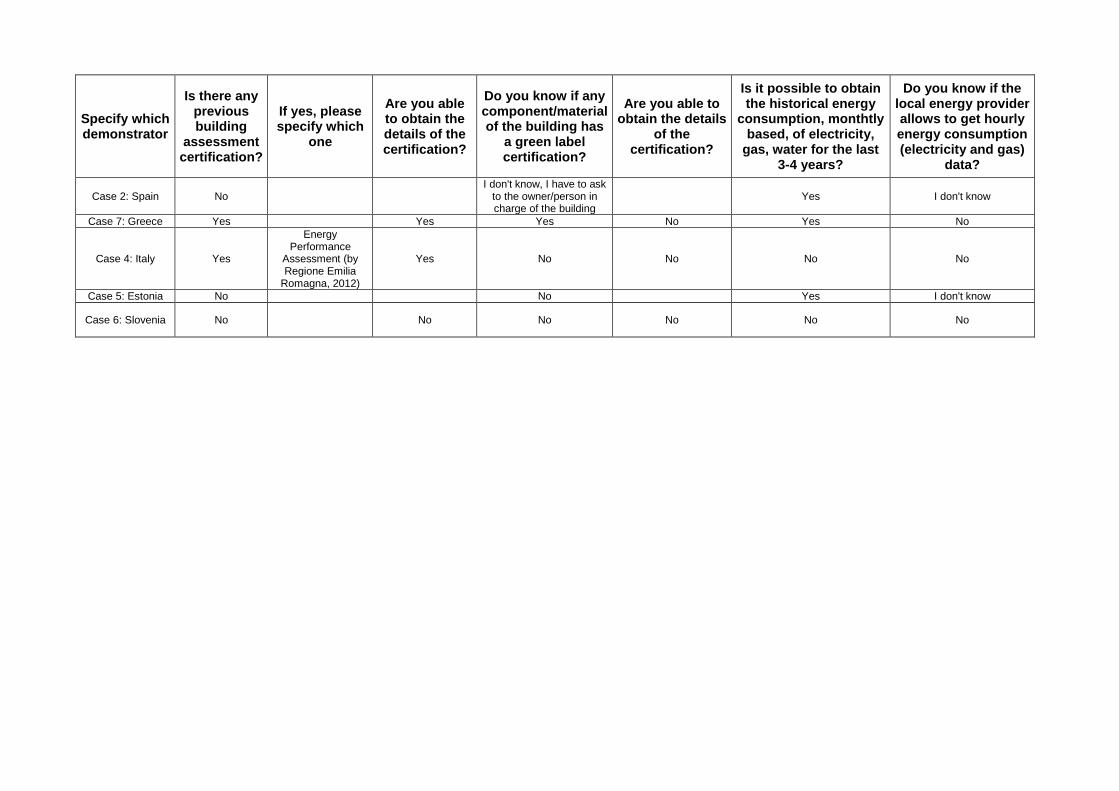
Specify which demonstrator
Is there any previous building
assessment certification?
If yes, please specify which
one
Are you able to obtain the details of the certification?
Do you know if any component/material of the building has
a green label certification?
Are you able to obtain the details
of the certification?
Is it possible to obtain the historical energy
consumption, monthtly based, of electricity,
gas, water for the last 3-4 years?
Do you know if the local energy provider allows to get hourly energy consumption (electricity and gas)
data?
Case 2: Spain No I don't know, I have to ask
to the owner/person in charge of the building
Yes I don't know
Case 7: Greece Yes Yes Yes No Yes No
Case 4: Italy Yes
Energy Performance
Assessment (by Regione Emilia
Romagna, 2012)
Yes No No No No
Case 5: Estonia No No Yes I don't know
Case 6: Slovenia No No No No No No
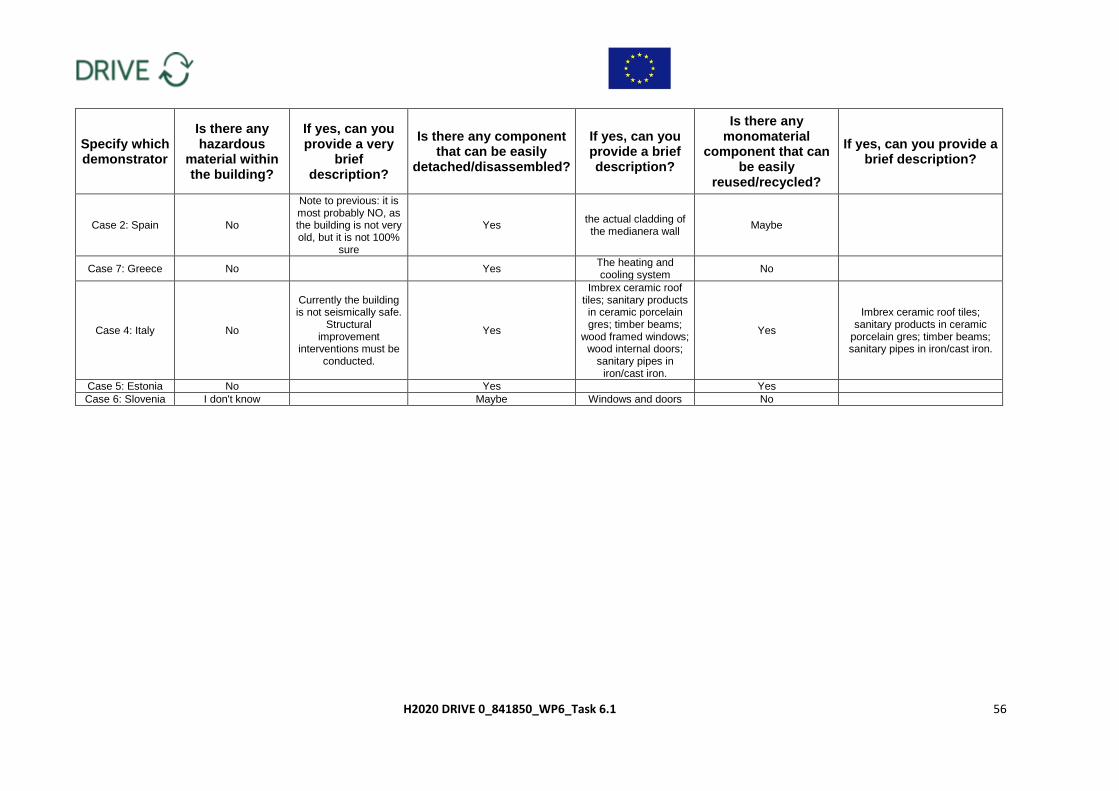
H2020 DRIVE 0_841850_WP6_Task 6.1 56
Specify which demonstrator
Is there any hazardous
material within the building?
If yes, can you provide a very
brief description?
Is there any component that can be easily
detached/disassembled?
If yes, can you provide a brief description?
Is there any monomaterial
component that can be easily
reused/recycled?
If yes, can you provide a brief description?
Case 2: Spain No
Note to previous: it is most probably NO, as the building is not very old, but it is not 100%
sure
Yes the actual cladding of the medianera wall
Maybe
Case 7: Greece No Yes The heating and cooling system
No
Case 4: Italy No
Currently the building is not seismically safe.
Structural improvement
interventions must be conducted.
Yes
Imbrex ceramic roof tiles; sanitary products in ceramic porcelain gres; timber beams;
wood framed windows; wood internal doors;
sanitary pipes in iron/cast iron.
Yes
Imbrex ceramic roof tiles; sanitary products in ceramic
porcelain gres; timber beams; sanitary pipes in iron/cast iron.
Case 5: Estonia No Yes Yes
Case 6: Slovenia I don't know Maybe Windows and doors No
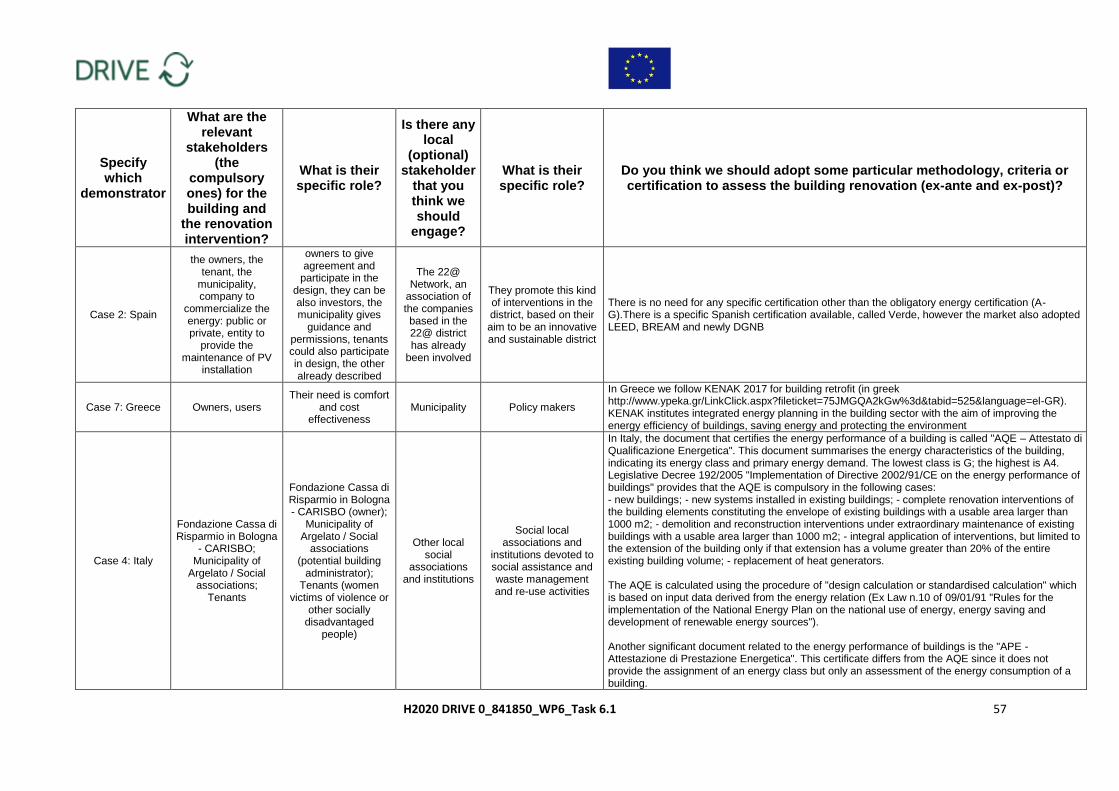
H2020 DRIVE 0_841850_WP6_Task 6.1 57
Specify which
demonstrator
What are the relevant
stakeholders (the
compulsory ones) for the building and
the renovation intervention?
What is their specific role?
Is there any local
(optional) stakeholder
that you think we should
engage?
What is their specific role?
Do you think we should adopt some particular methodology, criteria or certification to assess the building renovation (ex-ante and ex-post)?
Case 2: Spain
the owners, the tenant, the
municipality, company to
commercialize the energy: public or private, entity to
provide the maintenance of PV
installation
owners to give agreement and
participate in the design, they can be also investors, the municipality gives
guidance and permissions, tenants could also participate in design, the other already described
The 22@ Network, an
association of the companies based in the 22@ district has already
been involved
They promote this kind of interventions in the district, based on their aim to be an innovative and sustainable district
There is no need for any specific certification other than the obligatory energy certification (A-G).There is a specific Spanish certification available, called Verde, however the market also adopted LEED, BREAM and newly DGNB
Case 7: Greece Owners, users Their need is comfort
and cost effectiveness
Municipality Policy makers
In Greece we follow KENAK 2017 for building retrofit (in greek http://www.ypeka.gr/LinkClick.aspx?fileticket=75JMGQA2kGw%3d&tabid=525&language=el-GR). KENAK institutes integrated energy planning in the building sector with the aim of improving the energy efficiency of buildings, saving energy and protecting the environment
Case 4: Italy
Fondazione Cassa di Risparmio in Bologna
- CARISBO; Municipality of
Argelato / Social associations;
Tenants
Fondazione Cassa di Risparmio in Bologna - CARISBO (owner);
Municipality of Argelato / Social
associations (potential building
administrator); Tenants (women
victims of violence or other socially
disadvantaged people)
Other local social
associations and institutions
Social local associations and
institutions devoted to social assistance and waste management and re-use activities
In Italy, the document that certifies the energy performance of a building is called "AQE – Attestato di Qualificazione Energetica". This document summarises the energy characteristics of the building, indicating its energy class and primary energy demand. The lowest class is G; the highest is A4. Legislative Decree 192/2005 "Implementation of Directive 2002/91/CE on the energy performance of buildings" provides that the AQE is compulsory in the following cases: - new buildings; - new systems installed in existing buildings; - complete renovation interventions of the building elements constituting the envelope of existing buildings with a usable area larger than 1000 m2; - demolition and reconstruction interventions under extraordinary maintenance of existing buildings with a usable area larger than 1000 m2; - integral application of interventions, but limited to the extension of the building only if that extension has a volume greater than 20% of the entire existing building volume; - replacement of heat generators. The AQE is calculated using the procedure of "design calculation or standardised calculation" which is based on input data derived from the energy relation (Ex Law n.10 of 09/01/91 "Rules for the implementation of the National Energy Plan on the national use of energy, energy saving and development of renewable energy sources"). Another significant document related to the energy performance of buildings is the "APE - Attestazione di Prestazione Energetica". This certificate differs from the AQE since it does not provide the assignment of an energy class but only an assessment of the energy consumption of a building.
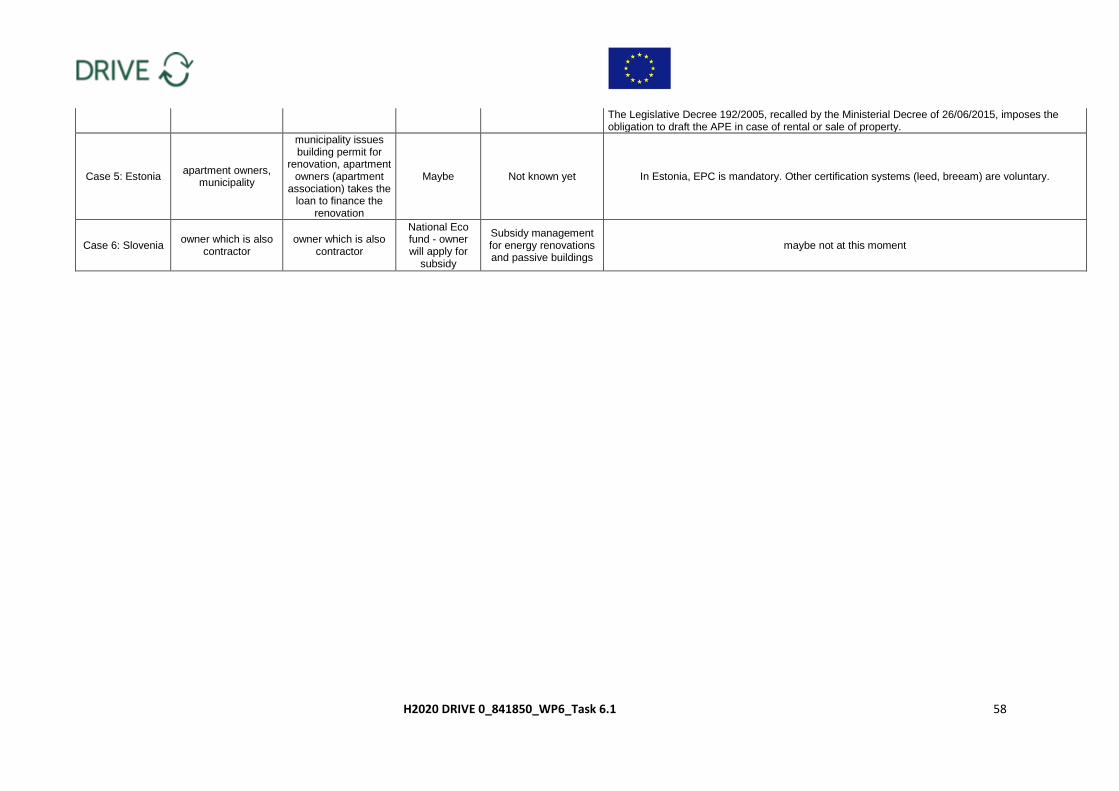
H2020 DRIVE 0_841850_WP6_Task 6.1 58
The Legislative Decree 192/2005, recalled by the Ministerial Decree of 26/06/2015, imposes the obligation to draft the APE in case of rental or sale of property.
Case 5: Estonia apartment owners,
municipality
municipality issues building permit for
renovation, apartment owners (apartment
association) takes the loan to finance the
renovation
Maybe Not known yet In Estonia, EPC is mandatory. Other certification systems (leed, breeam) are voluntary.
Case 6: Slovenia owner which is also
contractor owner which is also
contractor
National Eco fund - owner will apply for
subsidy
Subsidy management for energy renovations and passive buildings
maybe not at this moment

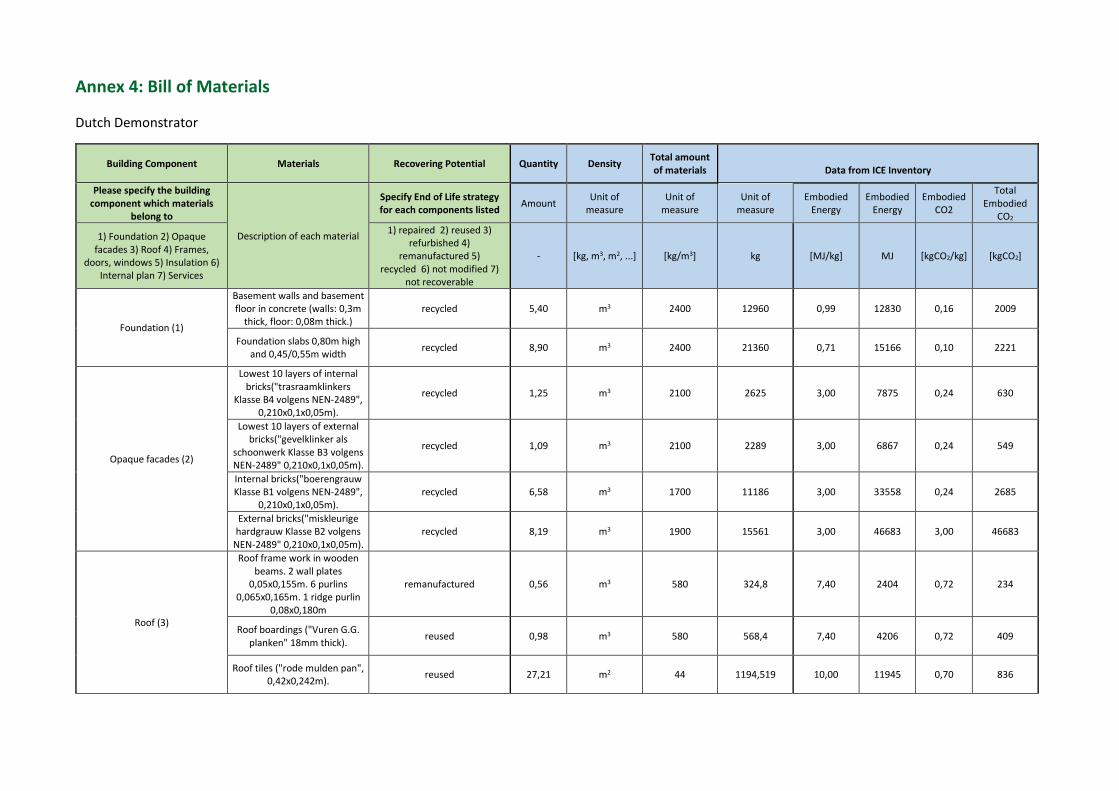
Annex 4: Bill of Materials
Dutch Demonstrator
Building Component Materials Recovering Potential Quantity Density Total amount of materials
Data from ICE Inventory
Please specify the building component which materials
belong to
Description of each material
Specify End of Life strategy for each components listed
Amount Unit of
measure Unit of
measure Unit of
measure Embodied
Energy Embodied
Energy Embodied
CO2
Total Embodied
CO2
1) Foundation 2) Opaque facades 3) Roof 4) Frames,
doors, windows 5) Insulation 6) Internal plan 7) Services
1) repaired 2) reused 3) refurbished 4)
remanufactured 5) recycled 6) not modified 7)
not recoverable
- [kg, m3, m2, ...] [kg/m3] kg [MJ/kg] MJ [kgCO2/kg] [kgCO2]
Foundation (1)
Basement walls and basement floor in concrete (walls: 0,3m
thick, floor: 0,08m thick.) recycled 5,40 m3 2400 12960 0,99 12830 0,16 2009
Foundation slabs 0,80m high and 0,45/0,55m width
recycled 8,90 m3 2400 21360 0,71 15166 0,10 2221
Opaque facades (2)
Lowest 10 layers of internal bricks("trasraamklinkers
Klasse B4 volgens NEN-2489", 0,210x0,1x0,05m).
recycled 1,25 m3 2100 2625 3,00 7875 0,24 630
Lowest 10 layers of external bricks("gevelklinker als
schoonwerk Klasse B3 volgens NEN-2489" 0,210x0,1x0,05m).
recycled 1,09 m3 2100 2289 3,00 6867 0,24 549
Internal bricks("boerengrauw Klasse B1 volgens NEN-2489",
0,210x0,1x0,05m). recycled 6,58 m3 1700 11186 3,00 33558 0,24 2685
External bricks("miskleurige hardgrauw Klasse B2 volgens
NEN-2489" 0,210x0,1x0,05m). recycled 8,19 m3 1900 15561 3,00 46683 3,00 46683
Roof (3)
Roof frame work in wooden beams. 2 wall plates
0,05x0,155m. 6 purlins 0,065x0,165m. 1 ridge purlin
0,08x0,180m
remanufactured 0,56 m3 580 324,8 7,40 2404 0,72 234
Roof boardings ("Vuren G.G. planken" 18mm thick).
reused 0,98 m3 580 568,4 7,40 4206 0,72 409
Roof tiles ("rode mulden pan", 0,42x0,242m).
reused 27,21 m2 44 1194,519 10,00 11945 0,70 836
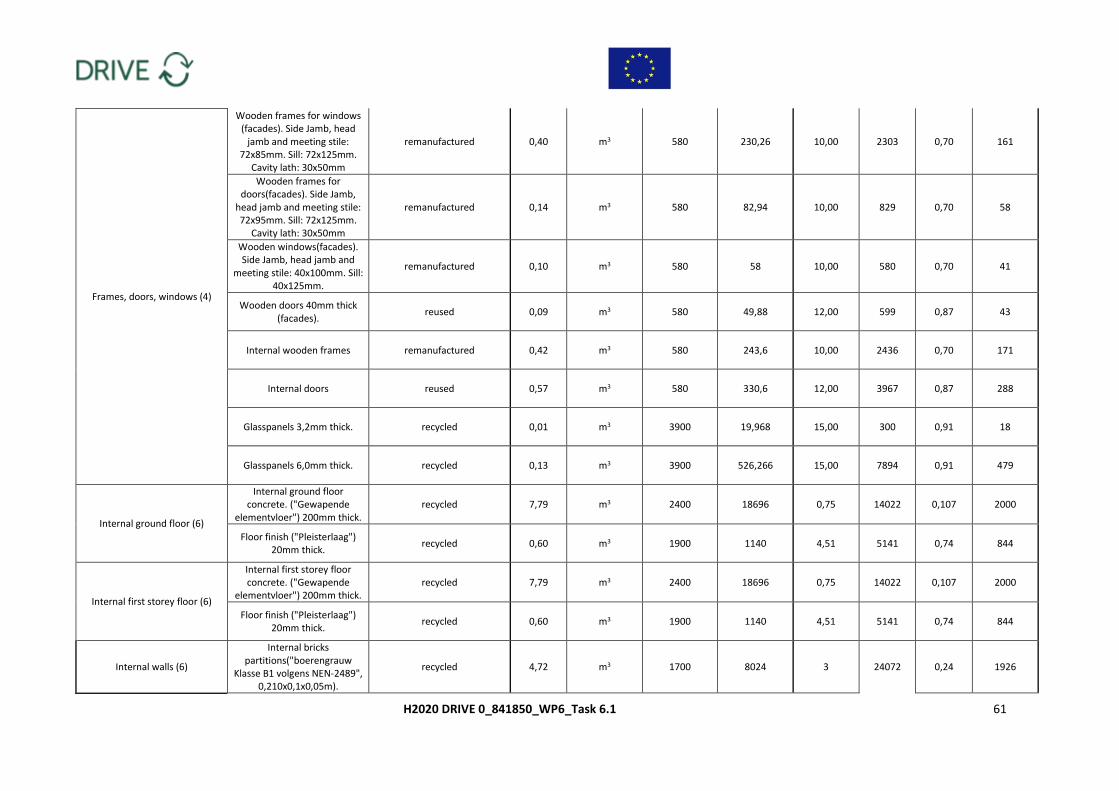
H2020 DRIVE 0_841850_WP6_Task 6.1 61
Frames, doors, windows (4)
Wooden frames for windows (facades). Side Jamb, head
jamb and meeting stile: 72x85mm. Sill: 72x125mm.
Cavity lath: 30x50mm
remanufactured 0,40 m3 580 230,26 10,00 2303 0,70 161
Wooden frames for doors(facades). Side Jamb,
head jamb and meeting stile: 72x95mm. Sill: 72x125mm.
Cavity lath: 30x50mm
remanufactured 0,14 m3 580 82,94 10,00 829 0,70 58
Wooden windows(facades). Side Jamb, head jamb and
meeting stile: 40x100mm. Sill: 40x125mm.
remanufactured 0,10 m3 580 58 10,00 580 0,70 41
Wooden doors 40mm thick (facades).
reused 0,09 m3 580 49,88 12,00 599 0,87 43
Internal wooden frames remanufactured 0,42 m3 580 243,6 10,00 2436 0,70 171
Internal doors reused 0,57 m3 580 330,6 12,00 3967 0,87 288
Glasspanels 3,2mm thick. recycled 0,01 m3 3900 19,968 15,00 300 0,91 18
Glasspanels 6,0mm thick. recycled 0,13 m3 3900 526,266 15,00 7894 0,91 479
Internal ground floor (6)
Internal ground floor concrete. ("Gewapende
elementvloer") 200mm thick. recycled 7,79 m3 2400 18696 0,75 14022 0,107 2000
Floor finish ("Pleisterlaag") 20mm thick.
recycled 0,60 m3 1900 1140 4,51 5141 0,74 844
Internal first storey floor (6)
Internal first storey floor concrete. ("Gewapende
elementvloer") 200mm thick. recycled 7,79 m3 2400 18696 0,75 14022 0,107 2000
Floor finish ("Pleisterlaag") 20mm thick.
recycled 0,60 m3 1900 1140 4,51 5141 0,74 844
Internal walls (6)
Internal bricks partitions("boerengrauw
Klasse B1 volgens NEN-2489", 0,210x0,1x0,05m).
recycled 4,72 m3 1700 8024 3 24072 0,24 1926
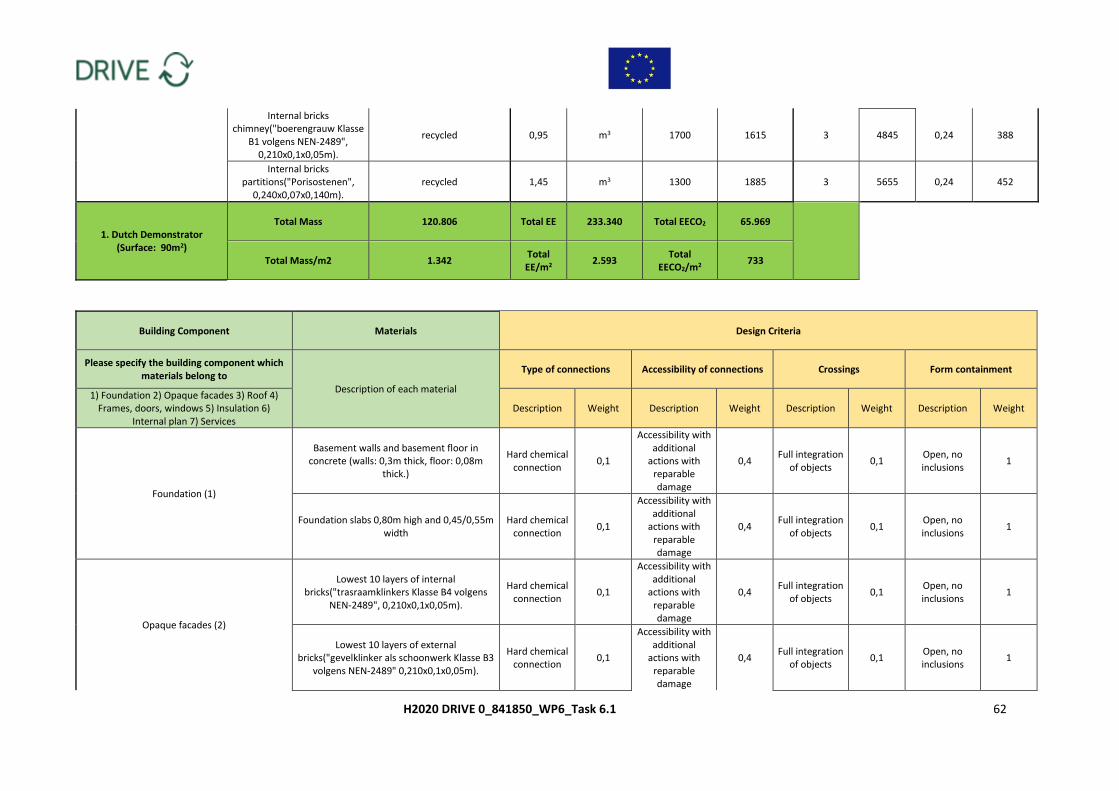
H2020 DRIVE 0_841850_WP6_Task 6.1 62
Internal bricks chimney("boerengrauw Klasse
B1 volgens NEN-2489", 0,210x0,1x0,05m).
recycled 0,95 m3 1700 1615 3 4845 0,24 388
Internal bricks partitions("Porisostenen",
0,240x0,07x0,140m). recycled 1,45 m3 1300 1885 3 5655 0,24 452
1. Dutch Demonstrator (Surface: 90m2)
Total Mass 120.806 Total EE 233.340 Total EECO2 65.969
Total Mass/m2 1.342 Total EE/m2
2.593 Total
EECO2/m2 733
Building Component Materials Design Criteria
Please specify the building component which materials belong to
Description of each material
Type of connections Accessibility of connections Crossings Form containment
1) Foundation 2) Opaque facades 3) Roof 4) Frames, doors, windows 5) Insulation 6)
Internal plan 7) Services Description Weight Description Weight Description Weight Description Weight
Foundation (1)
Basement walls and basement floor in concrete (walls: 0,3m thick, floor: 0,08m
thick.)
Hard chemical connection
0,1
Accessibility with additional
actions with reparable damage
0,4 Full integration
of objects 0,1
Open, no inclusions
1
Foundation slabs 0,80m high and 0,45/0,55m width
Hard chemical connection
0,1
Accessibility with additional
actions with reparable damage
0,4 Full integration
of objects 0,1
Open, no inclusions
1
Opaque facades (2)
Lowest 10 layers of internal bricks("trasraamklinkers Klasse B4 volgens
NEN-2489", 0,210x0,1x0,05m).
Hard chemical connection
0,1
Accessibility with additional
actions with reparable damage
0,4 Full integration
of objects 0,1
Open, no inclusions
1
Lowest 10 layers of external bricks("gevelklinker als schoonwerk Klasse B3
volgens NEN-2489" 0,210x0,1x0,05m).
Hard chemical connection
0,1
Accessibility with additional
actions with reparable damage
0,4 Full integration
of objects 0,1
Open, no inclusions
1
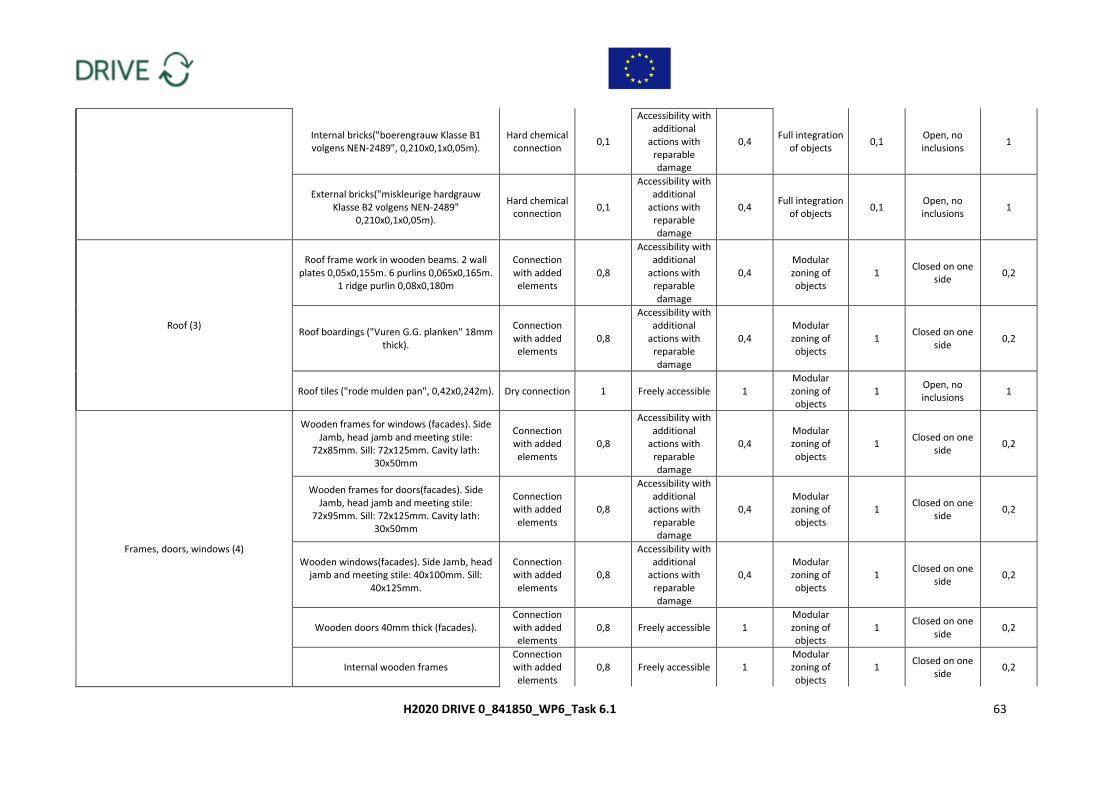
H2020 DRIVE 0_841850_WP6_Task 6.1 63
Internal bricks("boerengrauw Klasse B1 volgens NEN-2489", 0,210x0,1x0,05m).
Hard chemical connection
0,1
Accessibility with additional
actions with reparable damage
0,4 Full integration
of objects 0,1
Open, no inclusions
1
External bricks("miskleurige hardgrauw Klasse B2 volgens NEN-2489"
0,210x0,1x0,05m).
Hard chemical connection
0,1
Accessibility with additional
actions with reparable damage
0,4 Full integration
of objects 0,1
Open, no inclusions
1
Roof (3)
Roof frame work in wooden beams. 2 wall plates 0,05x0,155m. 6 purlins 0,065x0,165m.
1 ridge purlin 0,08x0,180m
Connection with added elements
0,8
Accessibility with additional
actions with reparable damage
0,4 Modular zoning of objects
1 Closed on one
side 0,2
Roof boardings ("Vuren G.G. planken" 18mm thick).
Connection with added elements
0,8
Accessibility with additional
actions with reparable damage
0,4 Modular zoning of objects
1 Closed on one
side 0,2
Roof tiles ("rode mulden pan", 0,42x0,242m). Dry connection 1 Freely accessible 1 Modular zoning of objects
1 Open, no inclusions
1
Frames, doors, windows (4)
Wooden frames for windows (facades). Side Jamb, head jamb and meeting stile:
72x85mm. Sill: 72x125mm. Cavity lath: 30x50mm
Connection with added elements
0,8
Accessibility with additional
actions with reparable damage
0,4 Modular zoning of objects
1 Closed on one
side 0,2
Wooden frames for doors(facades). Side Jamb, head jamb and meeting stile:
72x95mm. Sill: 72x125mm. Cavity lath: 30x50mm
Connection with added elements
0,8
Accessibility with additional
actions with reparable damage
0,4 Modular zoning of objects
1 Closed on one
side 0,2
Wooden windows(facades). Side Jamb, head jamb and meeting stile: 40x100mm. Sill:
40x125mm.
Connection with added elements
0,8
Accessibility with additional
actions with reparable damage
0,4 Modular zoning of objects
1 Closed on one
side 0,2
Wooden doors 40mm thick (facades). Connection with added elements
0,8 Freely accessible 1 Modular zoning of objects
1 Closed on one
side 0,2
Internal wooden frames Connection with added elements
0,8 Freely accessible 1 Modular zoning of objects
1 Closed on one
side 0,2
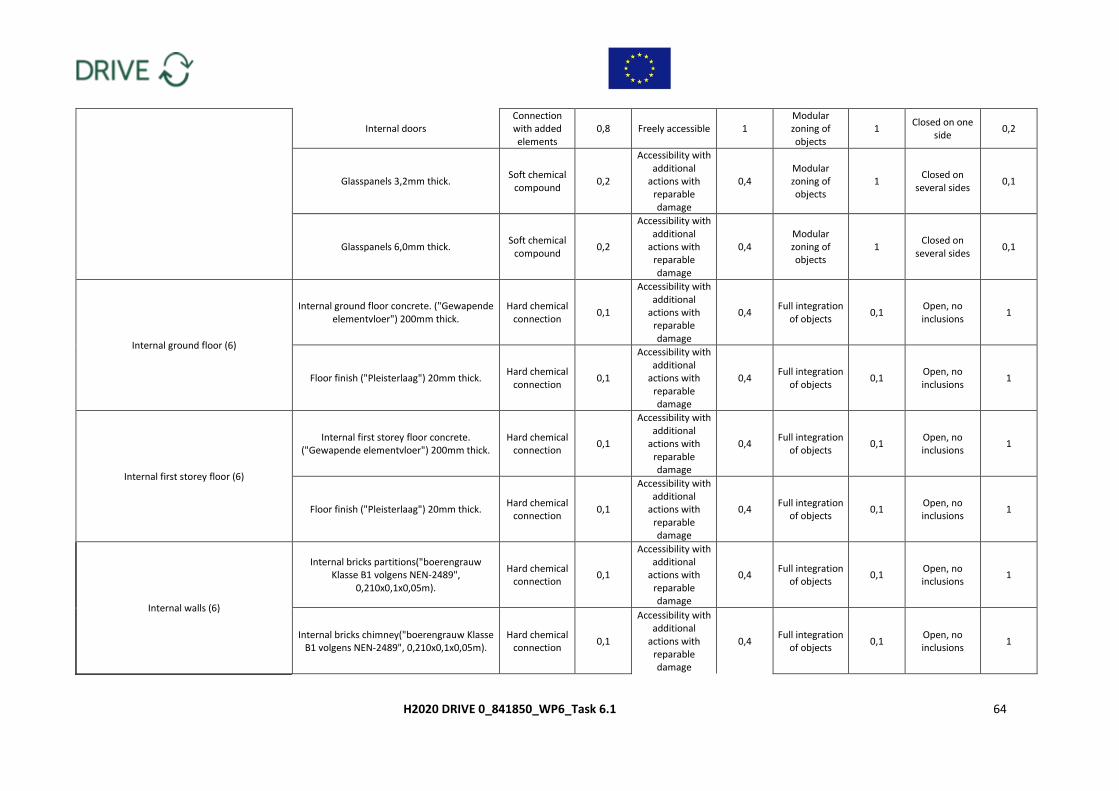
H2020 DRIVE 0_841850_WP6_Task 6.1 64
Internal doors Connection with added elements
0,8 Freely accessible 1 Modular zoning of objects
1 Closed on one
side 0,2
Glasspanels 3,2mm thick. Soft chemical
compound 0,2
Accessibility with additional
actions with reparable damage
0,4 Modular zoning of objects
1 Closed on
several sides 0,1
Glasspanels 6,0mm thick. Soft chemical
compound 0,2
Accessibility with additional
actions with reparable damage
0,4 Modular zoning of objects
1 Closed on
several sides 0,1
Internal ground floor (6)
Internal ground floor concrete. ("Gewapende elementvloer") 200mm thick.
Hard chemical connection
0,1
Accessibility with additional
actions with reparable damage
0,4 Full integration
of objects 0,1
Open, no inclusions
1
Floor finish ("Pleisterlaag") 20mm thick. Hard chemical
connection 0,1
Accessibility with additional
actions with reparable damage
0,4 Full integration
of objects 0,1
Open, no inclusions
1
Internal first storey floor (6)
Internal first storey floor concrete. ("Gewapende elementvloer") 200mm thick.
Hard chemical connection
0,1
Accessibility with additional
actions with reparable damage
0,4 Full integration
of objects 0,1
Open, no inclusions
1
Floor finish ("Pleisterlaag") 20mm thick. Hard chemical
connection 0,1
Accessibility with additional
actions with reparable damage
0,4 Full integration
of objects 0,1
Open, no inclusions
1
Internal walls (6)
Internal bricks partitions("boerengrauw Klasse B1 volgens NEN-2489",
0,210x0,1x0,05m).
Hard chemical connection
0,1
Accessibility with additional
actions with reparable damage
0,4 Full integration
of objects 0,1
Open, no inclusions
1
Internal bricks chimney("boerengrauw Klasse B1 volgens NEN-2489", 0,210x0,1x0,05m).
Hard chemical connection
0,1
Accessibility with additional
actions with reparable damage
0,4 Full integration
of objects 0,1
Open, no inclusions
1
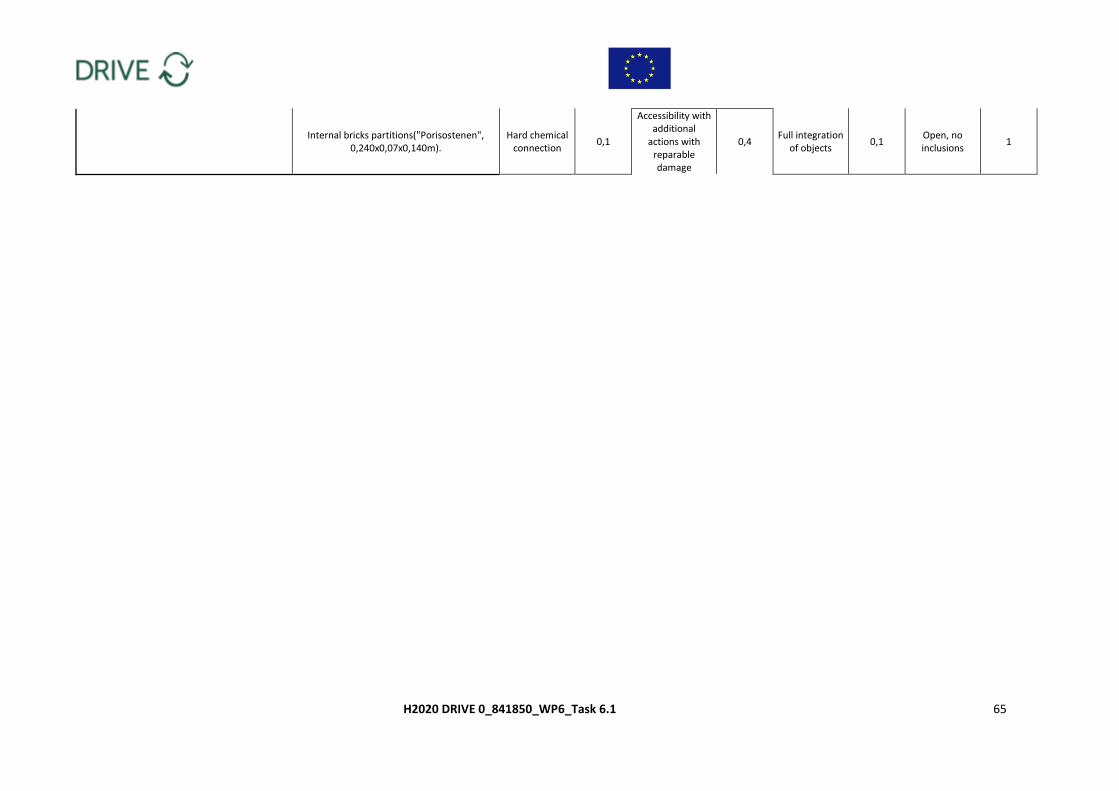
H2020 DRIVE 0_841850_WP6_Task 6.1 65
Internal bricks partitions("Porisostenen", 0,240x0,07x0,140m).
Hard chemical connection
0,1
Accessibility with additional
actions with reparable damage
0,4 Full integration
of objects 0,1
Open, no inclusions
1
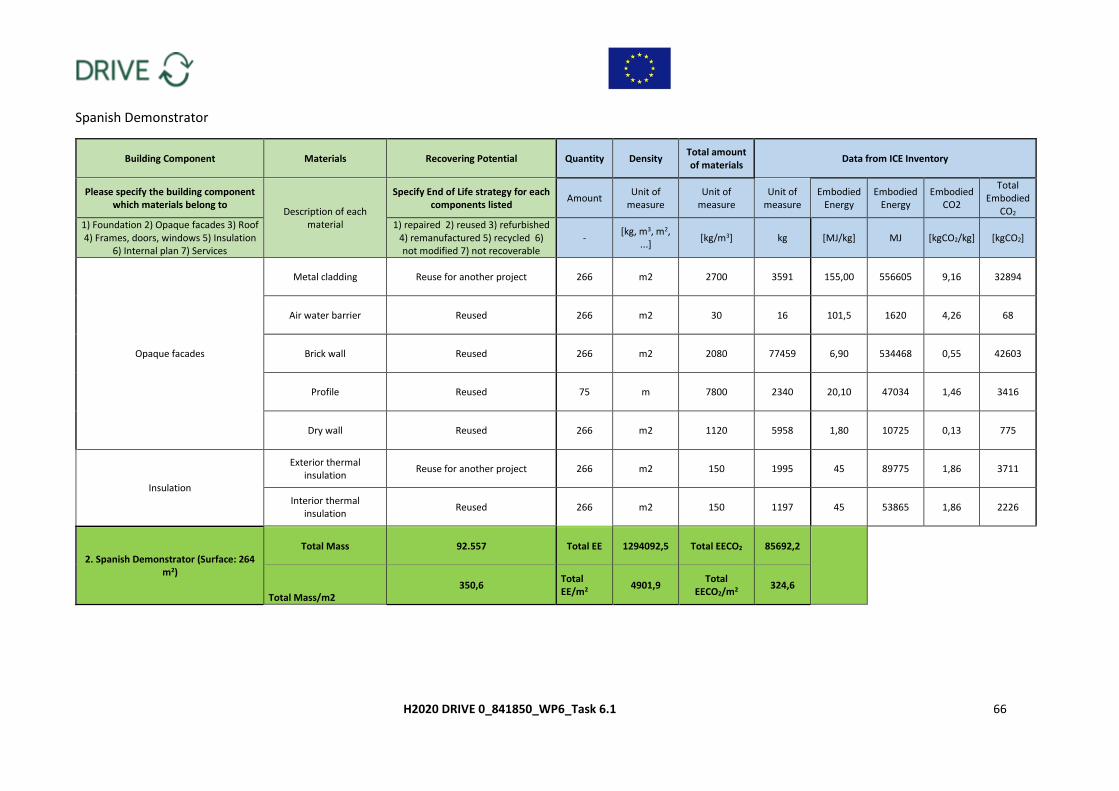
H2020 DRIVE 0_841850_WP6_Task 6.1 66
Spanish Demonstrator
Building Component Materials Recovering Potential Quantity Density Total amount of materials
Data from ICE Inventory
Please specify the building component which materials belong to
Description of each material
Specify End of Life strategy for each components listed
Amount Unit of
measure Unit of
measure Unit of
measure Embodied
Energy Embodied
Energy Embodied
CO2
Total Embodied
CO2
1) Foundation 2) Opaque facades 3) Roof 4) Frames, doors, windows 5) Insulation
6) Internal plan 7) Services
1) repaired 2) reused 3) refurbished 4) remanufactured 5) recycled 6) not modified 7) not recoverable
- [kg, m3, m2,
...] [kg/m3] kg [MJ/kg] MJ [kgCO2/kg] [kgCO2]
Opaque facades
Metal cladding Reuse for another project 266 m2 2700 3591 155,00 556605 9,16 32894
Air water barrier Reused 266 m2 30 16 101,5 1620 4,26 68
Brick wall Reused 266 m2 2080 77459 6,90 534468 0,55 42603
Profile Reused 75 m 7800 2340 20,10 47034 1,46 3416
Dry wall Reused 266 m2 1120 5958 1,80 10725 0,13 775
Insulation
Exterior thermal insulation
Reuse for another project 266 m2 150 1995 45 89775 1,86 3711
Interior thermal insulation
Reused 266 m2 150 1197 45 53865 1,86 2226
2. Spanish Demonstrator (Surface: 264 m2)
Total Mass 92.557 Total EE 1294092,5 Total EECO2 85692,2
Total Mass/m2 350,6
Total EE/m2
4901,9 Total
EECO2/m2 324,6
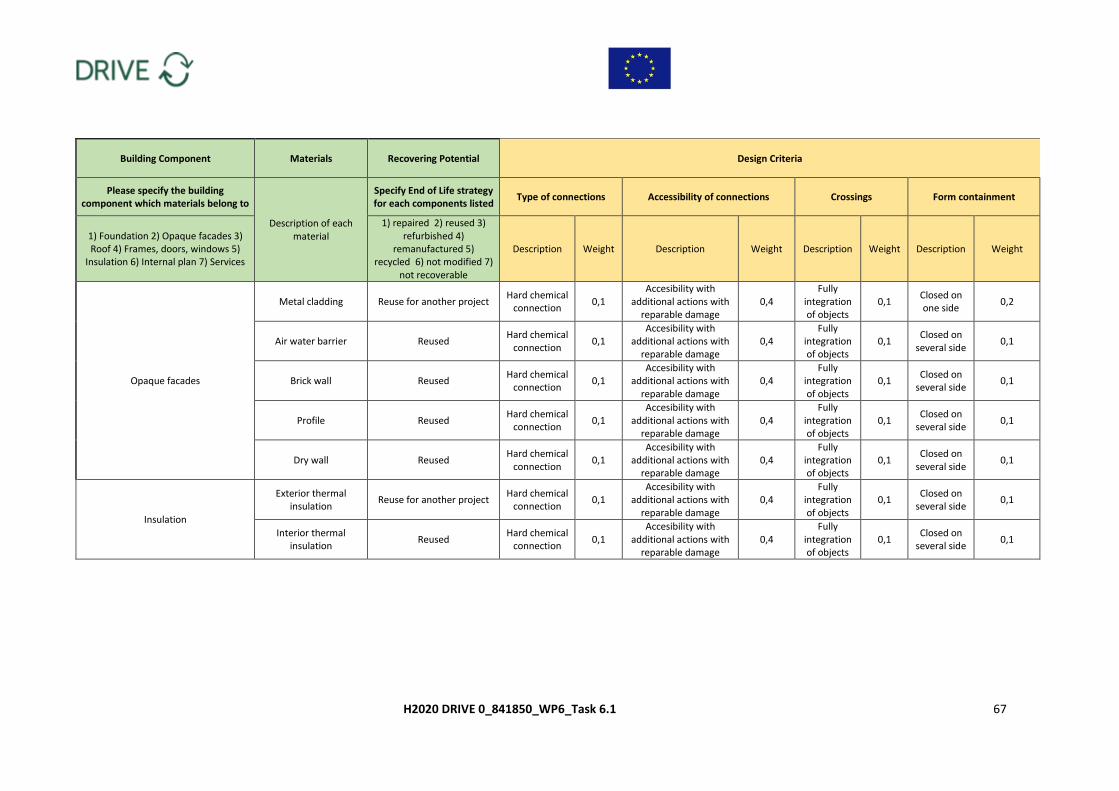
H2020 DRIVE 0_841850_WP6_Task 6.1 67
Building Component Materials Recovering Potential Design Criteria
Please specify the building component which materials belong to
Description of each material
Specify End of Life strategy for each components listed
Type of connections Accessibility of connections Crossings Form containment
1) Foundation 2) Opaque facades 3) Roof 4) Frames, doors, windows 5)
Insulation 6) Internal plan 7) Services
1) repaired 2) reused 3) refurbished 4)
remanufactured 5) recycled 6) not modified 7)
not recoverable
Description Weight Description Weight Description Weight Description Weight
Opaque facades
Metal cladding Reuse for another project Hard chemical
connection 0,1
Accesibility with additional actions with
reparable damage 0,4
Fully integration of objects
0,1 Closed on one side
0,2
Air water barrier Reused Hard chemical
connection 0,1
Accesibility with additional actions with
reparable damage 0,4
Fully integration of objects
0,1 Closed on
several side 0,1
Brick wall Reused Hard chemical
connection 0,1
Accesibility with additional actions with
reparable damage 0,4
Fully integration of objects
0,1 Closed on
several side 0,1
Profile Reused Hard chemical
connection 0,1
Accesibility with additional actions with
reparable damage 0,4
Fully integration of objects
0,1 Closed on
several side 0,1
Dry wall Reused Hard chemical
connection 0,1
Accesibility with additional actions with
reparable damage 0,4
Fully integration of objects
0,1 Closed on
several side 0,1
Insulation
Exterior thermal insulation
Reuse for another project Hard chemical
connection 0,1
Accesibility with additional actions with
reparable damage 0,4
Fully integration of objects
0,1 Closed on
several side 0,1
Interior thermal insulation
Reused Hard chemical
connection 0,1
Accesibility with additional actions with
reparable damage 0,4
Fully integration of objects
0,1 Closed on
several side 0,1
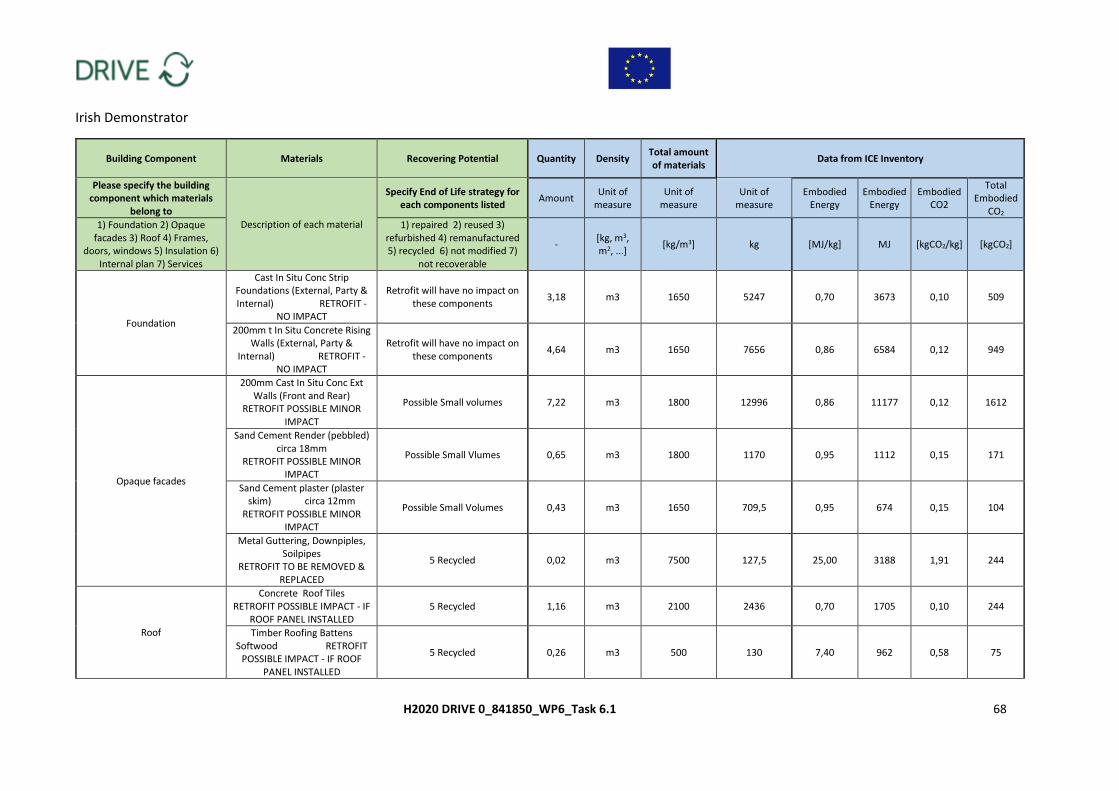
H2020 DRIVE 0_841850_WP6_Task 6.1 68
Irish Demonstrator
Building Component Materials Recovering Potential Quantity Density Total amount of materials
Data from ICE Inventory
Please specify the building component which materials
belong to Description of each material
Specify End of Life strategy for each components listed
Amount Unit of
measure Unit of
measure Unit of
measure Embodied
Energy Embodied
Energy Embodied
CO2
Total Embodied
CO2
1) Foundation 2) Opaque facades 3) Roof 4) Frames,
doors, windows 5) Insulation 6) Internal plan 7) Services
1) repaired 2) reused 3) refurbished 4) remanufactured 5) recycled 6) not modified 7)
not recoverable
- [kg, m3, m2, ...]
[kg/m3] kg [MJ/kg] MJ [kgCO2/kg] [kgCO2]
Foundation
Cast In Situ Conc Strip Foundations (External, Party & Internal) RETROFIT -
NO IMPACT
Retrofit will have no impact on these components
3,18 m3 1650 5247 0,70 3673 0,10 509
200mm t In Situ Concrete Rising Walls (External, Party &
Internal) RETROFIT - NO IMPACT
Retrofit will have no impact on these components
4,64 m3 1650 7656 0,86 6584 0,12 949
Opaque facades
200mm Cast In Situ Conc Ext Walls (Front and Rear)
RETROFIT POSSIBLE MINOR IMPACT
Possible Small volumes 7,22 m3 1800 12996 0,86 11177 0,12 1612
Sand Cement Render (pebbled) circa 18mm
RETROFIT POSSIBLE MINOR IMPACT
Possible Small Vlumes 0,65 m3 1800 1170 0,95 1112 0,15 171
Sand Cement plaster (plaster skim) circa 12mm
RETROFIT POSSIBLE MINOR IMPACT
Possible Small Volumes 0,43 m3 1650 709,5 0,95 674 0,15 104
Metal Guttering, Downpiples, Soilpipes
RETROFIT TO BE REMOVED & REPLACED
5 Recycled 0,02 m3 7500 127,5 25,00 3188 1,91 244
Roof
Concrete Roof Tiles RETROFIT POSSIBLE IMPACT - IF
ROOF PANEL INSTALLED 5 Recycled 1,16 m3 2100 2436 0,70 1705 0,10 244
Timber Roofing Battens Softwood RETROFIT
POSSIBLE IMPACT - IF ROOF PANEL INSTALLED
5 Recycled 0,26 m3 500 130 7,40 962 0,58 75
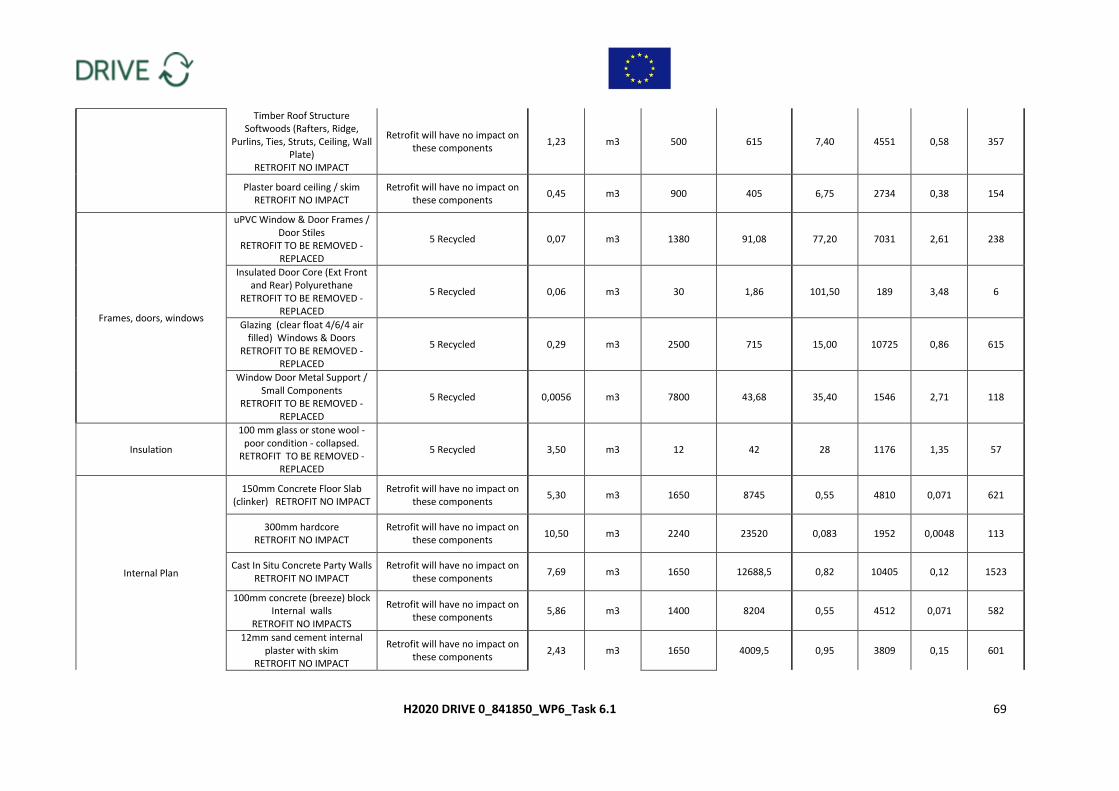
H2020 DRIVE 0_841850_WP6_Task 6.1 69
Timber Roof Structure Softwoods (Rafters, Ridge,
Purlins, Ties, Struts, Ceiling, Wall Plate)
RETROFIT NO IMPACT
Retrofit will have no impact on these components
1,23 m3 500 615 7,40 4551 0,58 357
Plaster board ceiling / skim RETROFIT NO IMPACT
Retrofit will have no impact on these components
0,45 m3 900 405 6,75 2734 0,38 154
Frames, doors, windows
uPVC Window & Door Frames / Door Stiles
RETROFIT TO BE REMOVED - REPLACED
5 Recycled 0,07 m3 1380 91,08 77,20 7031 2,61 238
Insulated Door Core (Ext Front and Rear) Polyurethane
RETROFIT TO BE REMOVED - REPLACED
5 Recycled 0,06 m3 30 1,86 101,50 189 3,48 6
Glazing (clear float 4/6/4 air filled) Windows & Doors
RETROFIT TO BE REMOVED - REPLACED
5 Recycled 0,29 m3 2500 715 15,00 10725 0,86 615
Window Door Metal Support / Small Components
RETROFIT TO BE REMOVED - REPLACED
5 Recycled 0,0056 m3 7800 43,68 35,40 1546 2,71 118
Insulation
100 mm glass or stone wool - poor condition - collapsed.
RETROFIT TO BE REMOVED - REPLACED
5 Recycled 3,50 m3 12 42 28 1176 1,35 57
Internal Plan
150mm Concrete Floor Slab (clinker) RETROFIT NO IMPACT
Retrofit will have no impact on these components
5,30 m3 1650 8745 0,55 4810 0,071 621
300mm hardcore RETROFIT NO IMPACT
Retrofit will have no impact on these components
10,50 m3 2240 23520 0,083 1952 0,0048 113
Cast In Situ Concrete Party Walls RETROFIT NO IMPACT
Retrofit will have no impact on these components
7,69 m3 1650 12688,5 0,82 10405 0,12 1523
100mm concrete (breeze) block Internal walls
RETROFIT NO IMPACTS
Retrofit will have no impact on these components
5,86 m3 1400 8204 0,55 4512 0,071 582
12mm sand cement internal plaster with skim
RETROFIT NO IMPACT
Retrofit will have no impact on these components
2,43 m3 1650 4009,5 0,95 3809 0,15 601
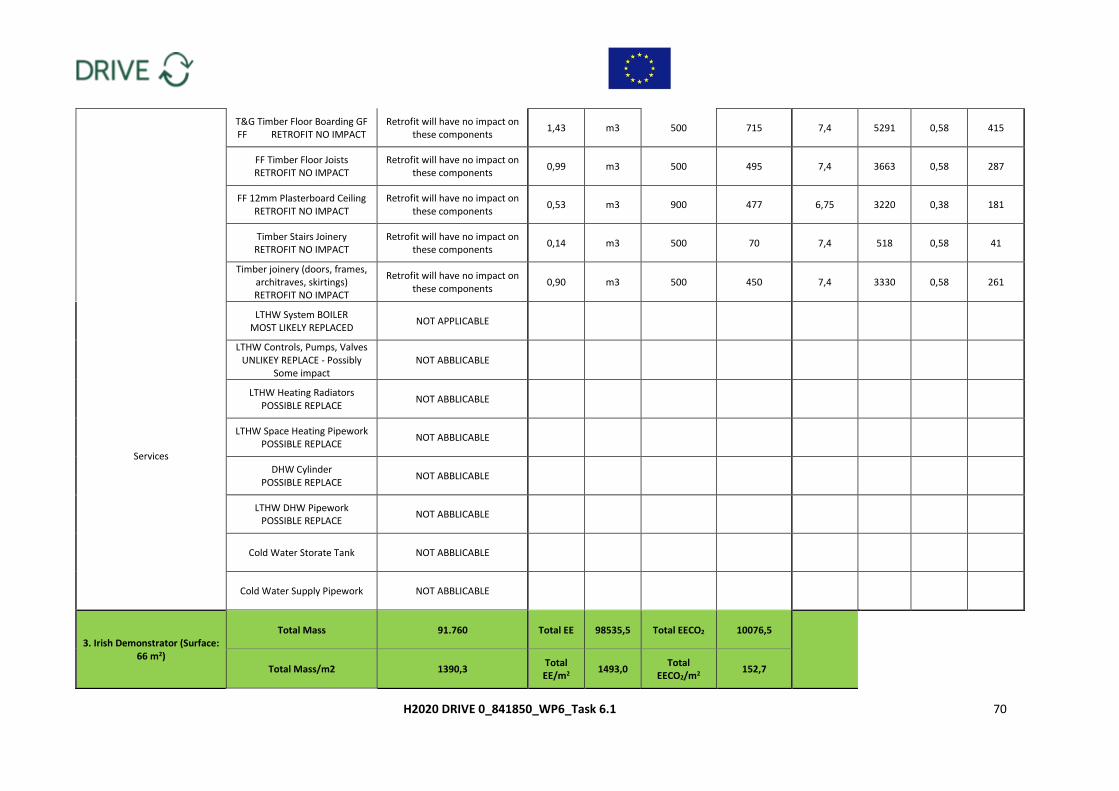
H2020 DRIVE 0_841850_WP6_Task 6.1 70
T&G Timber Floor Boarding GF FF RETROFIT NO IMPACT
Retrofit will have no impact on these components
1,43 m3 500 715 7,4 5291 0,58 415
FF Timber Floor Joists RETROFIT NO IMPACT
Retrofit will have no impact on these components
0,99 m3 500 495 7,4 3663 0,58 287
FF 12mm Plasterboard Ceiling RETROFIT NO IMPACT
Retrofit will have no impact on these components
0,53 m3 900 477 6,75 3220 0,38 181
Timber Stairs Joinery RETROFIT NO IMPACT
Retrofit will have no impact on these components
0,14 m3 500 70 7,4 518 0,58 41
Timber joinery (doors, frames, architraves, skirtings) RETROFIT NO IMPACT
Retrofit will have no impact on these components
0,90 m3 500 450 7,4 3330 0,58 261
Services
LTHW System BOILER MOST LIKELY REPLACED
NOT APPLICABLE
LTHW Controls, Pumps, Valves UNLIKEY REPLACE - Possibly
Some impact NOT ABBLICABLE
LTHW Heating Radiators POSSIBLE REPLACE
NOT ABBLICABLE
LTHW Space Heating Pipework POSSIBLE REPLACE
NOT ABBLICABLE
DHW Cylinder POSSIBLE REPLACE
NOT ABBLICABLE
LTHW DHW Pipework POSSIBLE REPLACE
NOT ABBLICABLE
Cold Water Storate Tank NOT ABBLICABLE
Cold Water Supply Pipework NOT ABBLICABLE
3. Irish Demonstrator (Surface: 66 m2)
Total Mass 91.760 Total EE 98535,5 Total EECO2 10076,5
Total Mass/m2 1390,3 Total EE/m2
1493,0 Total
EECO2/m2 152,7
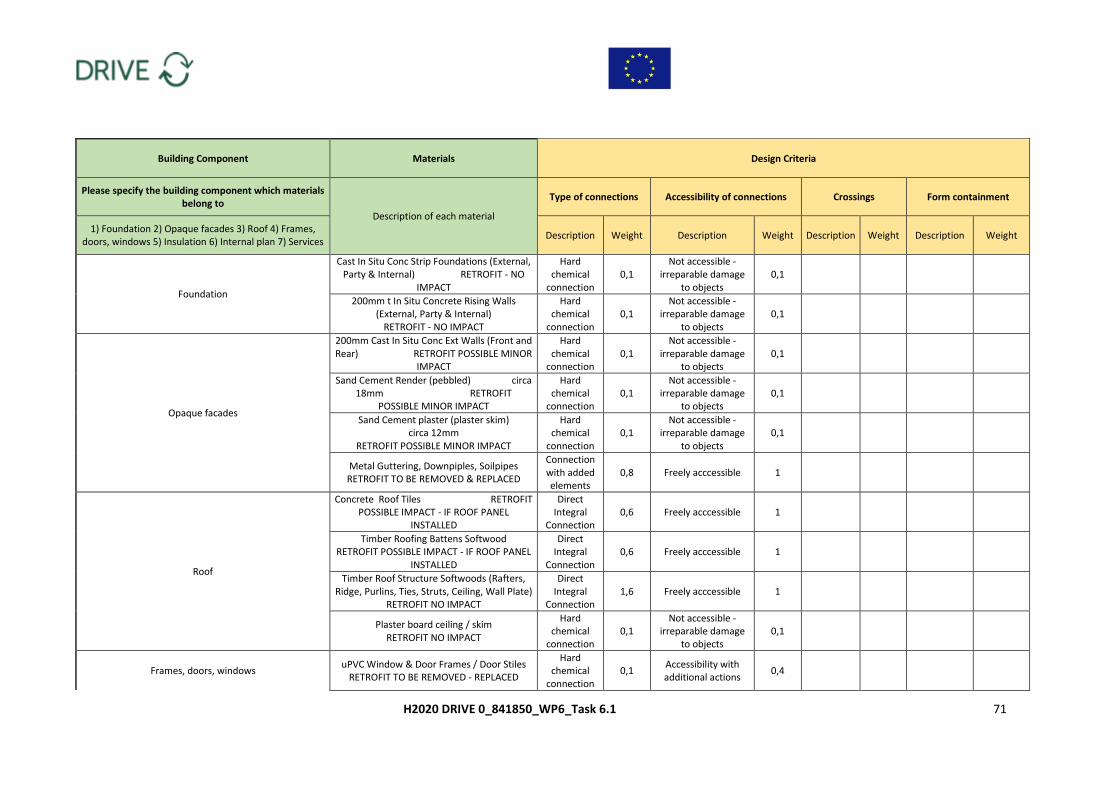
H2020 DRIVE 0_841850_WP6_Task 6.1 71
Building Component Materials Design Criteria
Please specify the building component which materials belong to
Description of each material
Type of connections Accessibility of connections Crossings Form containment
1) Foundation 2) Opaque facades 3) Roof 4) Frames, doors, windows 5) Insulation 6) Internal plan 7) Services
Description Weight Description Weight Description Weight Description Weight
Foundation
Cast In Situ Conc Strip Foundations (External, Party & Internal) RETROFIT - NO
IMPACT
Hard chemical
connection 0,1
Not accessible - irreparable damage
to objects 0,1
200mm t In Situ Concrete Rising Walls (External, Party & Internal)
RETROFIT - NO IMPACT
Hard chemical
connection 0,1
Not accessible - irreparable damage
to objects 0,1
Opaque facades
200mm Cast In Situ Conc Ext Walls (Front and Rear) RETROFIT POSSIBLE MINOR
IMPACT
Hard chemical
connection 0,1
Not accessible - irreparable damage
to objects 0,1
Sand Cement Render (pebbled) circa 18mm RETROFIT
POSSIBLE MINOR IMPACT
Hard chemical
connection 0,1
Not accessible - irreparable damage
to objects 0,1
Sand Cement plaster (plaster skim) circa 12mm
RETROFIT POSSIBLE MINOR IMPACT
Hard chemical
connection 0,1
Not accessible - irreparable damage
to objects 0,1
Metal Guttering, Downpiples, Soilpipes RETROFIT TO BE REMOVED & REPLACED
Connection with added elements
0,8 Freely acccessible 1
Roof
Concrete Roof Tiles RETROFIT POSSIBLE IMPACT - IF ROOF PANEL
INSTALLED
Direct Integral
Connection 0,6 Freely acccessible 1
Timber Roofing Battens Softwood RETROFIT POSSIBLE IMPACT - IF ROOF PANEL
INSTALLED
Direct Integral
Connection 0,6 Freely acccessible 1
Timber Roof Structure Softwoods (Rafters, Ridge, Purlins, Ties, Struts, Ceiling, Wall Plate)
RETROFIT NO IMPACT
Direct Integral
Connection 1,6 Freely acccessible 1
Plaster board ceiling / skim RETROFIT NO IMPACT
Hard chemical
connection 0,1
Not accessible - irreparable damage
to objects 0,1
Frames, doors, windows uPVC Window & Door Frames / Door Stiles
RETROFIT TO BE REMOVED - REPLACED
Hard chemical
connection 0,1
Accessibility with additional actions
0,4
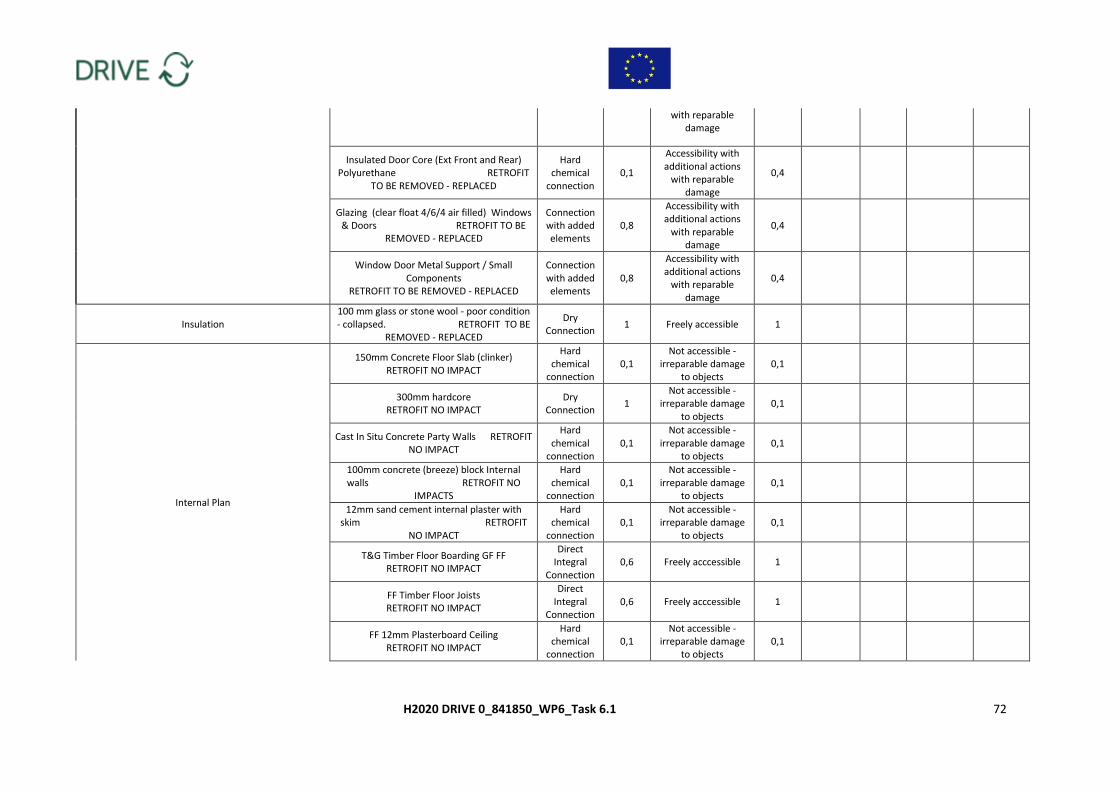
H2020 DRIVE 0_841850_WP6_Task 6.1 72
with reparable damage
Insulated Door Core (Ext Front and Rear) Polyurethane RETROFIT
TO BE REMOVED - REPLACED
Hard chemical
connection 0,1
Accessibility with additional actions
with reparable damage
0,4
Glazing (clear float 4/6/4 air filled) Windows & Doors RETROFIT TO BE
REMOVED - REPLACED
Connection with added elements
0,8
Accessibility with additional actions
with reparable damage
0,4
Window Door Metal Support / Small Components
RETROFIT TO BE REMOVED - REPLACED
Connection with added elements
0,8
Accessibility with additional actions
with reparable damage
0,4
Insulation 100 mm glass or stone wool - poor condition - collapsed. RETROFIT TO BE
REMOVED - REPLACED
Dry Connection
1 Freely accessible 1
Internal Plan
150mm Concrete Floor Slab (clinker) RETROFIT NO IMPACT
Hard chemical
connection 0,1
Not accessible - irreparable damage
to objects 0,1
300mm hardcore RETROFIT NO IMPACT
Dry Connection
1 Not accessible -
irreparable damage to objects
0,1
Cast In Situ Concrete Party Walls RETROFIT NO IMPACT
Hard chemical
connection 0,1
Not accessible - irreparable damage
to objects 0,1
100mm concrete (breeze) block Internal walls RETROFIT NO
IMPACTS
Hard chemical
connection 0,1
Not accessible - irreparable damage
to objects 0,1
12mm sand cement internal plaster with skim RETROFIT
NO IMPACT
Hard chemical
connection 0,1
Not accessible - irreparable damage
to objects 0,1
T&G Timber Floor Boarding GF FF RETROFIT NO IMPACT
Direct Integral
Connection 0,6 Freely acccessible 1
FF Timber Floor Joists RETROFIT NO IMPACT
Direct Integral
Connection 0,6 Freely acccessible 1
FF 12mm Plasterboard Ceiling RETROFIT NO IMPACT
Hard chemical
connection 0,1
Not accessible - irreparable damage
to objects 0,1
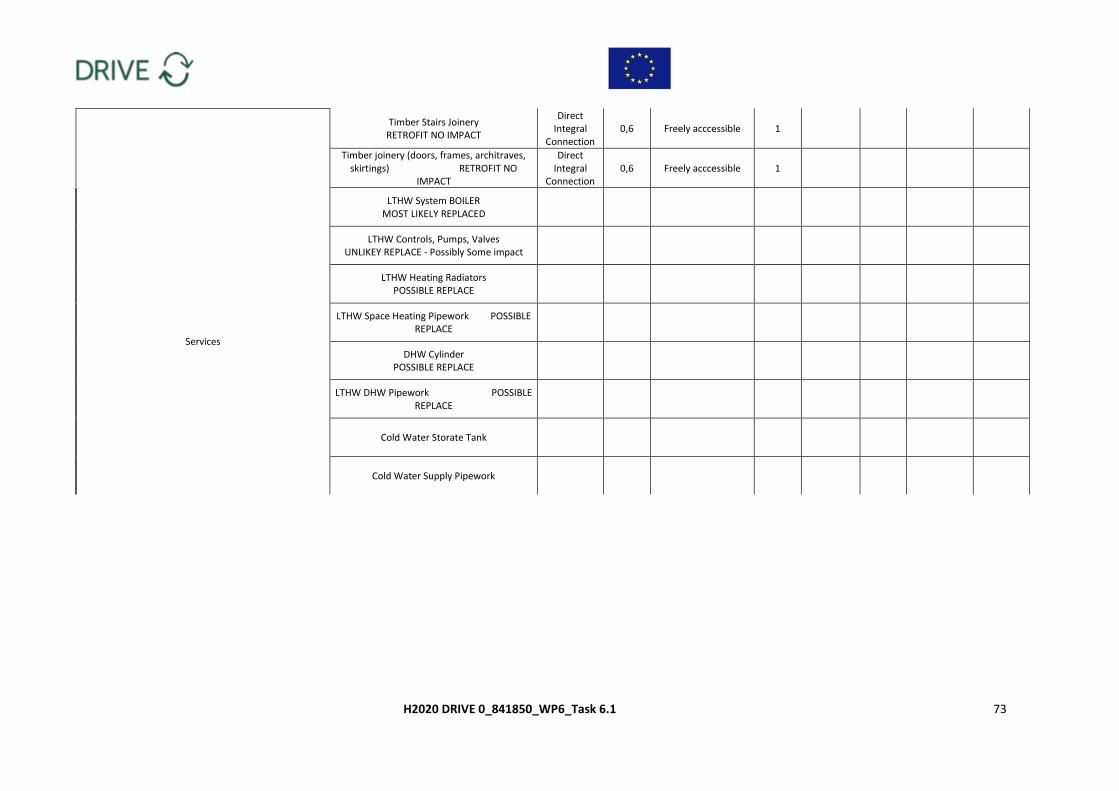
H2020 DRIVE 0_841850_WP6_Task 6.1 73
Timber Stairs Joinery RETROFIT NO IMPACT
Direct Integral
Connection 0,6 Freely acccessible 1
Timber joinery (doors, frames, architraves, skirtings) RETROFIT NO
IMPACT
Direct Integral
Connection 0,6 Freely acccessible 1
Services
LTHW System BOILER MOST LIKELY REPLACED
LTHW Controls, Pumps, Valves UNLIKEY REPLACE - Possibly Some impact
LTHW Heating Radiators POSSIBLE REPLACE
LTHW Space Heating Pipework POSSIBLE REPLACE
DHW Cylinder POSSIBLE REPLACE
LTHW DHW Pipework POSSIBLE REPLACE
Cold Water Storate Tank
Cold Water Supply Pipework
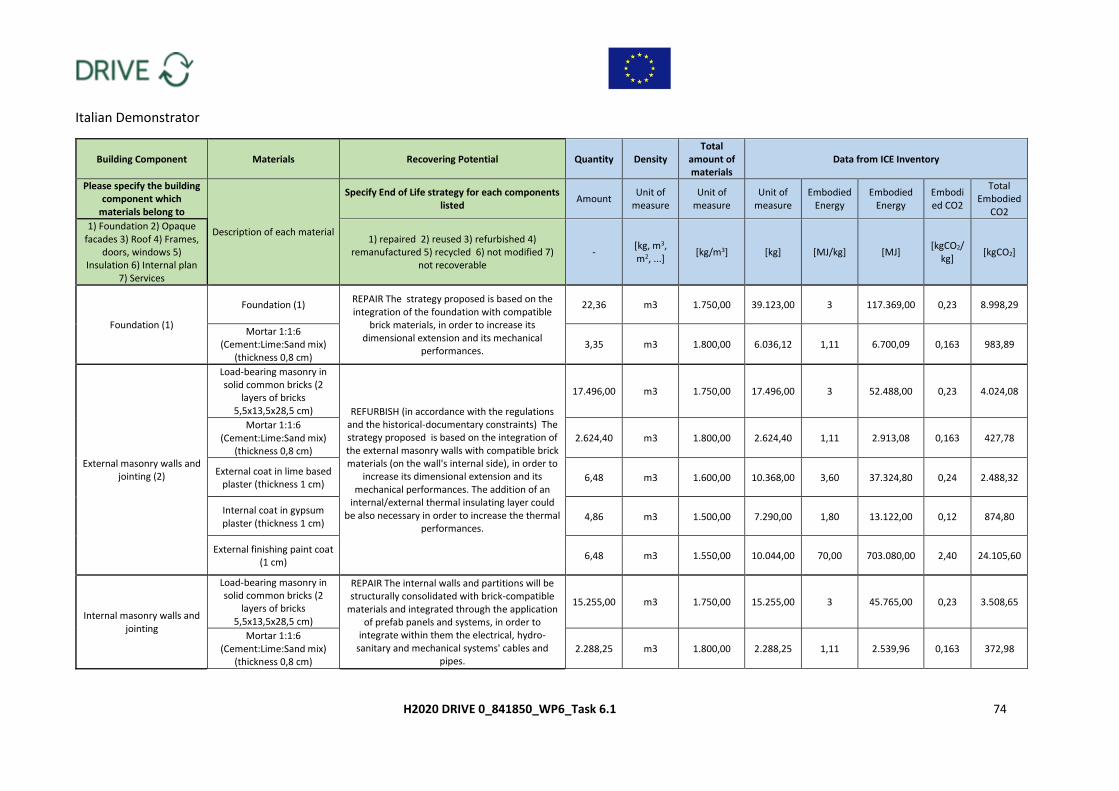
H2020 DRIVE 0_841850_WP6_Task 6.1 74
Italian Demonstrator
Building Component Materials Recovering Potential Quantity Density Total
amount of materials
Data from ICE Inventory
Please specify the building component which
materials belong to
Description of each material
Specify End of Life strategy for each components listed
Amount Unit of
measure Unit of
measure Unit of
measure Embodied
Energy Embodied
Energy Embodied CO2
Total Embodied
CO2
1) Foundation 2) Opaque facades 3) Roof 4) Frames,
doors, windows 5) Insulation 6) Internal plan
7) Services
1) repaired 2) reused 3) refurbished 4) remanufactured 5) recycled 6) not modified 7)
not recoverable -
[kg, m3, m2, ...]
[kg/m3] [kg] [MJ/kg] [MJ] [kgCO2/
kg] [kgCO2]
Foundation (1)
Foundation (1) REPAIR The strategy proposed is based on the integration of the foundation with compatible
brick materials, in order to increase its dimensional extension and its mechanical
performances.
22,36 m3 1.750,00 39.123,00 3 117.369,00 0,23 8.998,29
Mortar 1:1:6 (Cement:Lime:Sand mix)
(thickness 0,8 cm) 3,35 m3 1.800,00 6.036,12 1,11 6.700,09 0,163 983,89
External masonry walls and jointing (2)
Load-bearing masonry in solid common bricks (2
layers of bricks 5,5x13,5x28,5 cm) REFURBISH (in accordance with the regulations
and the historical-documentary constraints) The strategy proposed is based on the integration of the external masonry walls with compatible brick materials (on the wall's internal side), in order to
increase its dimensional extension and its mechanical performances. The addition of an
internal/external thermal insulating layer could be also necessary in order to increase the thermal
performances.
17.496,00 m3 1.750,00 17.496,00 3 52.488,00 0,23 4.024,08
Mortar 1:1:6 (Cement:Lime:Sand mix)
(thickness 0,8 cm) 2.624,40 m3 1.800,00 2.624,40 1,11 2.913,08 0,163 427,78
External coat in lime based plaster (thickness 1 cm)
6,48 m3 1.600,00 10.368,00 3,60 37.324,80 0,24 2.488,32
Internal coat in gypsum plaster (thickness 1 cm)
4,86 m3 1.500,00 7.290,00 1,80 13.122,00 0,12 874,80
External finishing paint coat (1 cm)
6,48 m3 1.550,00 10.044,00 70,00 703.080,00 2,40 24.105,60
Internal masonry walls and jointing
Load-bearing masonry in solid common bricks (2
layers of bricks 5,5x13,5x28,5 cm)
REPAIR The internal walls and partitions will be structurally consolidated with brick-compatible
materials and integrated through the application of prefab panels and systems, in order to
integrate within them the electrical, hydro-sanitary and mechanical systems' cables and
pipes.
15.255,00 m3 1.750,00 15.255,00 3 45.765,00 0,23 3.508,65
Mortar 1:1:6 (Cement:Lime:Sand mix)
(thickness 0,8 cm) 2.288,25 m3 1.800,00 2.288,25 1,11 2.539,96 0,163 372,98
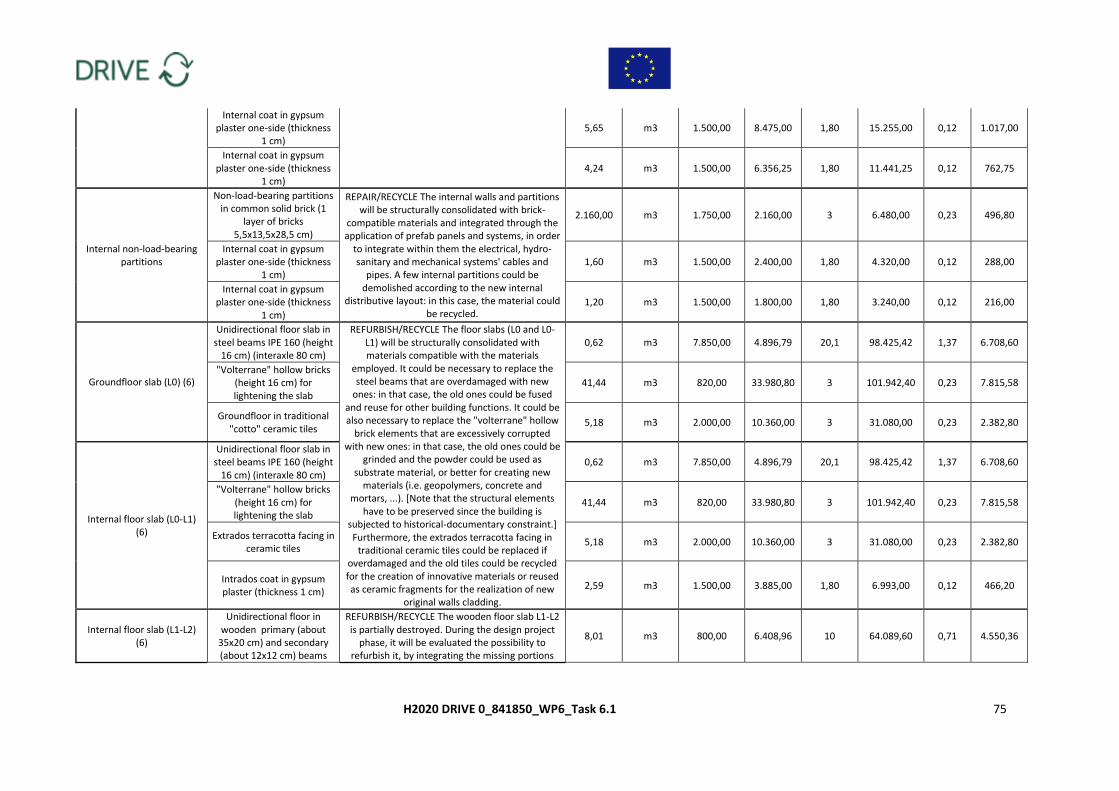
H2020 DRIVE 0_841850_WP6_Task 6.1 75
Internal coat in gypsum plaster one-side (thickness
1 cm) 5,65 m3 1.500,00 8.475,00 1,80 15.255,00 0,12 1.017,00
Internal coat in gypsum plaster one-side (thickness
1 cm) 4,24 m3 1.500,00 6.356,25 1,80 11.441,25 0,12 762,75
Internal non-load-bearing partitions
Non-load-bearing partitions in common solid brick (1
layer of bricks 5,5x13,5x28,5 cm)
REPAIR/RECYCLE The internal walls and partitions will be structurally consolidated with brick-
compatible materials and integrated through the application of prefab panels and systems, in order
to integrate within them the electrical, hydro-sanitary and mechanical systems' cables and
pipes. A few internal partitions could be demolished according to the new internal
distributive layout: in this case, the material could be recycled.
2.160,00 m3 1.750,00 2.160,00 3 6.480,00 0,23 496,80
Internal coat in gypsum plaster one-side (thickness
1 cm) 1,60 m3 1.500,00 2.400,00 1,80 4.320,00 0,12 288,00
Internal coat in gypsum plaster one-side (thickness
1 cm) 1,20 m3 1.500,00 1.800,00 1,80 3.240,00 0,12 216,00
Groundfloor slab (L0) (6)
Unidirectional floor slab in steel beams IPE 160 (height
16 cm) (interaxle 80 cm)
REFURBISH/RECYCLE The floor slabs (L0 and L0-L1) will be structurally consolidated with materials compatible with the materials
employed. It could be necessary to replace the steel beams that are overdamaged with new
ones: in that case, the old ones could be fused and reuse for other building functions. It could be also necessary to replace the "volterrane" hollow
brick elements that are excessively corrupted with new ones: in that case, the old ones could be
grinded and the powder could be used as substrate material, or better for creating new
materials (i.e. geopolymers, concrete and mortars, ...). [Note that the structural elements
have to be preserved since the building is subjected to historical-documentary constraint.] Furthermore, the extrados terracotta facing in
traditional ceramic tiles could be replaced if overdamaged and the old tiles could be recycled for the creation of innovative materials or reused as ceramic fragments for the realization of new
original walls cladding.
0,62 m3 7.850,00 4.896,79 20,1 98.425,42 1,37 6.708,60
"Volterrane" hollow bricks (height 16 cm) for lightening the slab
41,44 m3 820,00 33.980,80 3 101.942,40 0,23 7.815,58
Groundfloor in traditional "cotto" ceramic tiles
5,18 m3 2.000,00 10.360,00 3 31.080,00 0,23 2.382,80
Internal floor slab (L0-L1) (6)
Unidirectional floor slab in steel beams IPE 160 (height
16 cm) (interaxle 80 cm) 0,62 m3 7.850,00 4.896,79 20,1 98.425,42 1,37 6.708,60
"Volterrane" hollow bricks (height 16 cm) for lightening the slab
41,44 m3 820,00 33.980,80 3 101.942,40 0,23 7.815,58
Extrados terracotta facing in ceramic tiles
5,18 m3 2.000,00 10.360,00 3 31.080,00 0,23 2.382,80
Intrados coat in gypsum plaster (thickness 1 cm)
2,59 m3 1.500,00 3.885,00 1,80 6.993,00 0,12 466,20
Internal floor slab (L1-L2) (6)
Unidirectional floor in wooden primary (about
35x20 cm) and secondary (about 12x12 cm) beams
REFURBISH/RECYCLE The wooden floor slab L1-L2 is partially destroyed. During the design project
phase, it will be evaluated the possibility to refurbish it, by integrating the missing portions
8,01 m3 800,00 6.408,96 10 64.089,60 0,71 4.550,36
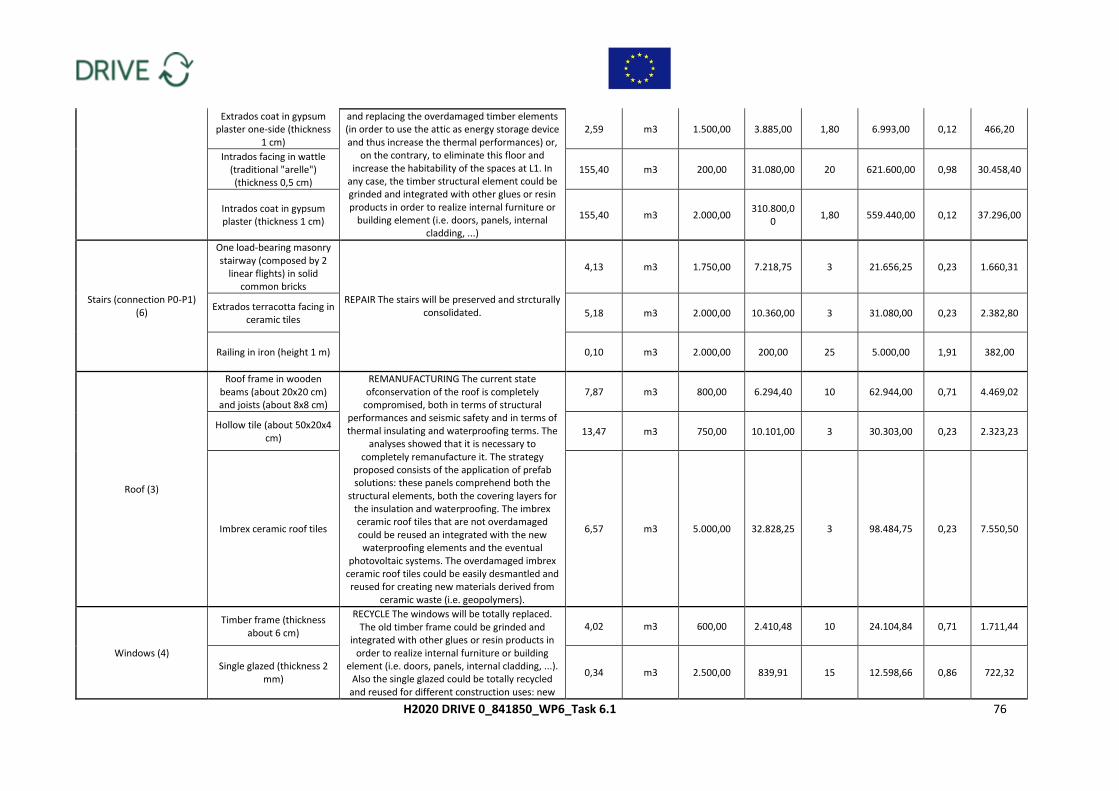
H2020 DRIVE 0_841850_WP6_Task 6.1 76
Extrados coat in gypsum plaster one-side (thickness
1 cm)
and replacing the overdamaged timber elements (in order to use the attic as energy storage device and thus increase the thermal performances) or,
on the contrary, to eliminate this floor and increase the habitability of the spaces at L1. In
any case, the timber structural element could be grinded and integrated with other glues or resin products in order to realize internal furniture or
building element (i.e. doors, panels, internal cladding, ...)
2,59 m3 1.500,00 3.885,00 1,80 6.993,00 0,12 466,20
Intrados facing in wattle (traditional "arelle") (thickness 0,5 cm)
155,40 m3 200,00 31.080,00 20 621.600,00 0,98 30.458,40
Intrados coat in gypsum plaster (thickness 1 cm)
155,40 m3 2.000,00 310.800,0
0 1,80 559.440,00 0,12 37.296,00
Stairs (connection P0-P1) (6)
One load-bearing masonry stairway (composed by 2
linear flights) in solid common bricks
REPAIR The stairs will be preserved and strcturally consolidated.
4,13 m3 1.750,00 7.218,75 3 21.656,25 0,23 1.660,31
Extrados terracotta facing in ceramic tiles
5,18 m3 2.000,00 10.360,00 3 31.080,00 0,23 2.382,80
Railing in iron (height 1 m) 0,10 m3 2.000,00 200,00 25 5.000,00 1,91 382,00
Roof (3)
Roof frame in wooden beams (about 20x20 cm) and joists (about 8x8 cm)
REMANUFACTURING The current state ofconservation of the roof is completely
compromised, both in terms of structural performances and seismic safety and in terms of thermal insulating and waterproofing terms. The
analyses showed that it is necessary to completely remanufacture it. The strategy
proposed consists of the application of prefab solutions: these panels comprehend both the
structural elements, both the covering layers for the insulation and waterproofing. The imbrex ceramic roof tiles that are not overdamaged could be reused an integrated with the new waterproofing elements and the eventual
photovoltaic systems. The overdamaged imbrex ceramic roof tiles could be easily desmantled and reused for creating new materials derived from
ceramic waste (i.e. geopolymers).
7,87 m3 800,00 6.294,40 10 62.944,00 0,71 4.469,02
Hollow tile (about 50x20x4 cm)
13,47 m3 750,00 10.101,00 3 30.303,00 0,23 2.323,23
Imbrex ceramic roof tiles 6,57 m3 5.000,00 32.828,25 3 98.484,75 0,23 7.550,50
Windows (4)
Timber frame (thickness about 6 cm)
RECYCLE The windows will be totally replaced. The old timber frame could be grinded and
integrated with other glues or resin products in order to realize internal furniture or building
element (i.e. doors, panels, internal cladding, ...). Also the single glazed could be totally recycled
and reused for different construction uses: new
4,02 m3 600,00 2.410,48 10 24.104,84 0,71 1.711,44
Single glazed (thickness 2 mm)
0,34 m3 2.500,00 839,91 15 12.598,66 0,86 722,32
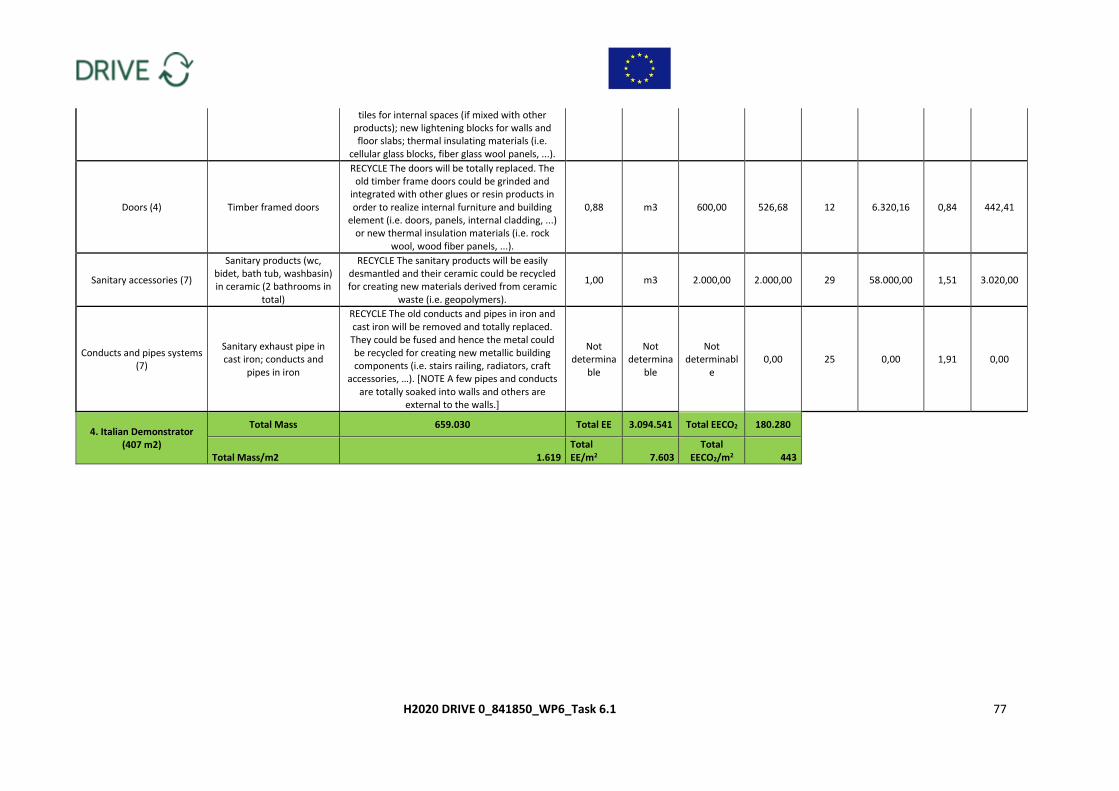
H2020 DRIVE 0_841850_WP6_Task 6.1 77
tiles for internal spaces (if mixed with other products); new lightening blocks for walls and floor slabs; thermal insulating materials (i.e.
cellular glass blocks, fiber glass wool panels, ...).
Doors (4) Timber framed doors
RECYCLE The doors will be totally replaced. The old timber frame doors could be grinded and
integrated with other glues or resin products in order to realize internal furniture and building
element (i.e. doors, panels, internal cladding, ...) or new thermal insulation materials (i.e. rock
wool, wood fiber panels, ...).
0,88 m3 600,00 526,68 12 6.320,16 0,84 442,41
Sanitary accessories (7)
Sanitary products (wc, bidet, bath tub, washbasin) in ceramic (2 bathrooms in
total)
RECYCLE The sanitary products will be easily desmantled and their ceramic could be recycled for creating new materials derived from ceramic
waste (i.e. geopolymers).
1,00 m3 2.000,00 2.000,00 29 58.000,00 1,51 3.020,00
Conducts and pipes systems (7)
Sanitary exhaust pipe in cast iron; conducts and
pipes in iron
RECYCLE The old conducts and pipes in iron and cast iron will be removed and totally replaced. They could be fused and hence the metal could be recycled for creating new metallic building components (i.e. stairs railing, radiators, craft
accessories, …). [NOTE A few pipes and conducts are totally soaked into walls and others are
external to the walls.]
Not determina
ble
Not determina
ble
Not determinabl
e 0,00 25 0,00 1,91 0,00
4. Italian Demonstrator (407 m2)
Total Mass 659.030 Total EE 3.094.541 Total EECO2 180.280
Total Mass/m2 1.619 Total EE/m2 7.603
Total EECO2/m2 443
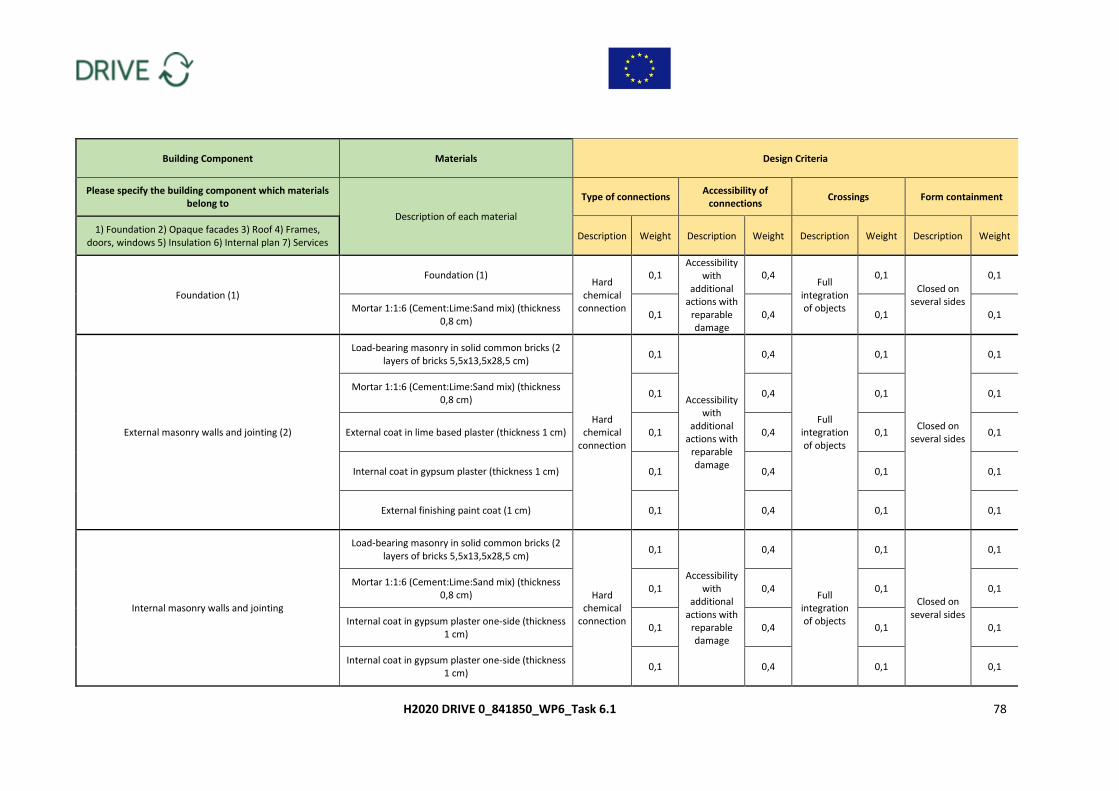
H2020 DRIVE 0_841850_WP6_Task 6.1 78
Building Component Materials Design Criteria
Please specify the building component which materials belong to
Description of each material
Type of connections Accessibility of
connections Crossings Form containment
1) Foundation 2) Opaque facades 3) Roof 4) Frames, doors, windows 5) Insulation 6) Internal plan 7) Services
Description Weight Description Weight Description Weight Description Weight
Foundation (1)
Foundation (1) Hard
chemical connection
0,1 Accessibility
with additional
actions with reparable damage
0,4 Full
integration of objects
0,1
Closed on several sides
0,1
Mortar 1:1:6 (Cement:Lime:Sand mix) (thickness 0,8 cm)
0,1 0,4 0,1 0,1
External masonry walls and jointing (2)
Load-bearing masonry in solid common bricks (2 layers of bricks 5,5x13,5x28,5 cm)
Hard chemical
connection
0,1
Accessibility with
additional actions with
reparable damage
0,4
Full integration of objects
0,1
Closed on several sides
0,1
Mortar 1:1:6 (Cement:Lime:Sand mix) (thickness 0,8 cm)
0,1 0,4 0,1 0,1
External coat in lime based plaster (thickness 1 cm) 0,1 0,4 0,1 0,1
Internal coat in gypsum plaster (thickness 1 cm) 0,1 0,4 0,1 0,1
External finishing paint coat (1 cm) 0,1 0,4 0,1 0,1
Internal masonry walls and jointing
Load-bearing masonry in solid common bricks (2 layers of bricks 5,5x13,5x28,5 cm)
Hard chemical
connection
0,1
Accessibility with
additional actions with
reparable damage
0,4
Full integration of objects
0,1
Closed on several sides
0,1
Mortar 1:1:6 (Cement:Lime:Sand mix) (thickness 0,8 cm)
0,1 0,4 0,1 0,1
Internal coat in gypsum plaster one-side (thickness 1 cm)
0,1 0,4 0,1 0,1
Internal coat in gypsum plaster one-side (thickness 1 cm)
0,1 0,4 0,1 0,1
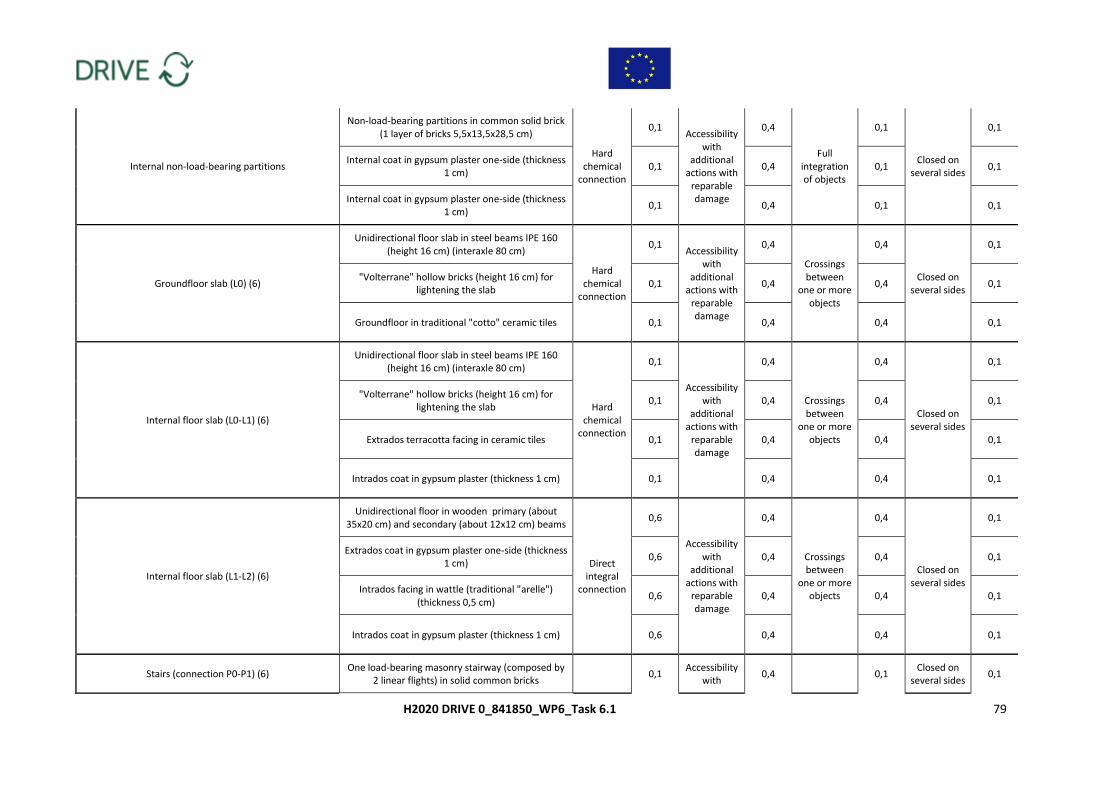
H2020 DRIVE 0_841850_WP6_Task 6.1 79
Internal non-load-bearing partitions
Non-load-bearing partitions in common solid brick (1 layer of bricks 5,5x13,5x28,5 cm)
Hard chemical
connection
0,1 Accessibility
with additional
actions with reparable damage
0,4
Full integration of objects
0,1
Closed on several sides
0,1
Internal coat in gypsum plaster one-side (thickness 1 cm)
0,1 0,4 0,1 0,1
Internal coat in gypsum plaster one-side (thickness 1 cm)
0,1 0,4 0,1 0,1
Groundfloor slab (L0) (6)
Unidirectional floor slab in steel beams IPE 160 (height 16 cm) (interaxle 80 cm)
Hard chemical
connection
0,1 Accessibility
with additional
actions with reparable damage
0,4
Crossings between
one or more objects
0,4
Closed on several sides
0,1
"Volterrane" hollow bricks (height 16 cm) for lightening the slab
0,1 0,4 0,4 0,1
Groundfloor in traditional "cotto" ceramic tiles 0,1 0,4 0,4 0,1
Internal floor slab (L0-L1) (6)
Unidirectional floor slab in steel beams IPE 160 (height 16 cm) (interaxle 80 cm)
Hard chemical
connection
0,1
Accessibility with
additional actions with
reparable damage
0,4
Crossings between
one or more objects
0,4
Closed on several sides
0,1
"Volterrane" hollow bricks (height 16 cm) for lightening the slab
0,1 0,4 0,4 0,1
Extrados terracotta facing in ceramic tiles 0,1 0,4 0,4 0,1
Intrados coat in gypsum plaster (thickness 1 cm) 0,1 0,4 0,4 0,1
Internal floor slab (L1-L2) (6)
Unidirectional floor in wooden primary (about 35x20 cm) and secondary (about 12x12 cm) beams
Direct integral
connection
0,6
Accessibility with
additional actions with
reparable damage
0,4
Crossings between
one or more objects
0,4
Closed on several sides
0,1
Extrados coat in gypsum plaster one-side (thickness 1 cm)
0,6 0,4 0,4 0,1
Intrados facing in wattle (traditional "arelle") (thickness 0,5 cm)
0,6 0,4 0,4 0,1
Intrados coat in gypsum plaster (thickness 1 cm) 0,6 0,4 0,4 0,1
Stairs (connection P0-P1) (6) One load-bearing masonry stairway (composed by
2 linear flights) in solid common bricks 0,1
Accessibility with
0,4 0,1 Closed on
several sides 0,1
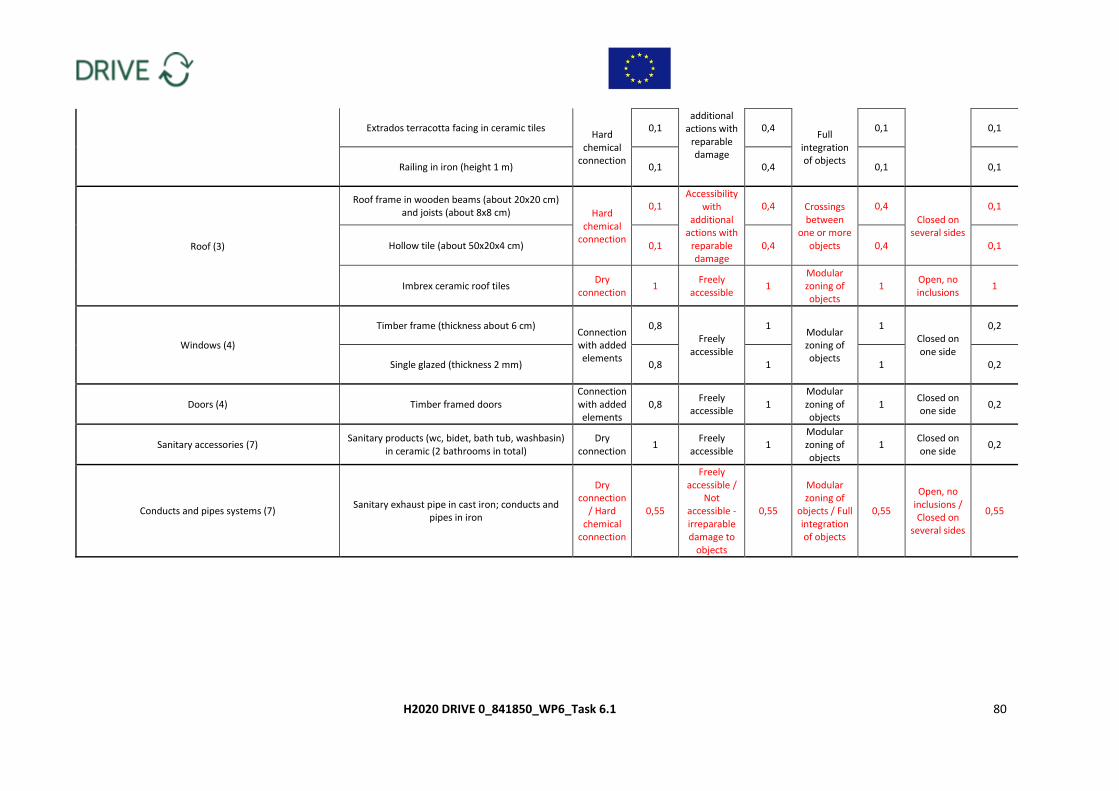
H2020 DRIVE 0_841850_WP6_Task 6.1 80
Extrados terracotta facing in ceramic tiles Hard
chemical connection
0,1 additional
actions with reparable damage
0,4 Full
integration of objects
0,1 0,1
Railing in iron (height 1 m) 0,1 0,4 0,1 0,1
Roof (3)
Roof frame in wooden beams (about 20x20 cm) and joists (about 8x8 cm) Hard
chemical connection
0,1 Accessibility
with additional
actions with reparable damage
0,4 Crossings between
one or more objects
0,4
Closed on several sides
0,1
Hollow tile (about 50x20x4 cm) 0,1 0,4 0,4 0,1
Imbrex ceramic roof tiles Dry
connection 1
Freely accessible
1 Modular zoning of objects
1 Open, no inclusions
1
Windows (4)
Timber frame (thickness about 6 cm) Connection with added elements
0,8 Freely
accessible
1 Modular zoning of objects
1 Closed on one side
0,2
Single glazed (thickness 2 mm) 0,8 1 1 0,2
Doors (4) Timber framed doors Connection with added elements
0,8 Freely
accessible 1
Modular zoning of objects
1 Closed on one side
0,2
Sanitary accessories (7) Sanitary products (wc, bidet, bath tub, washbasin)
in ceramic (2 bathrooms in total) Dry
connection 1
Freely accessible
1 Modular zoning of objects
1 Closed on one side
0,2
Conducts and pipes systems (7) Sanitary exhaust pipe in cast iron; conducts and
pipes in iron
Dry connection
/ Hard chemical
connection
0,55
Freely accessible /
Not accessible - irreparable damage to
objects
0,55
Modular zoning of
objects / Full integration of objects
0,55
Open, no inclusions / Closed on
several sides
0,55
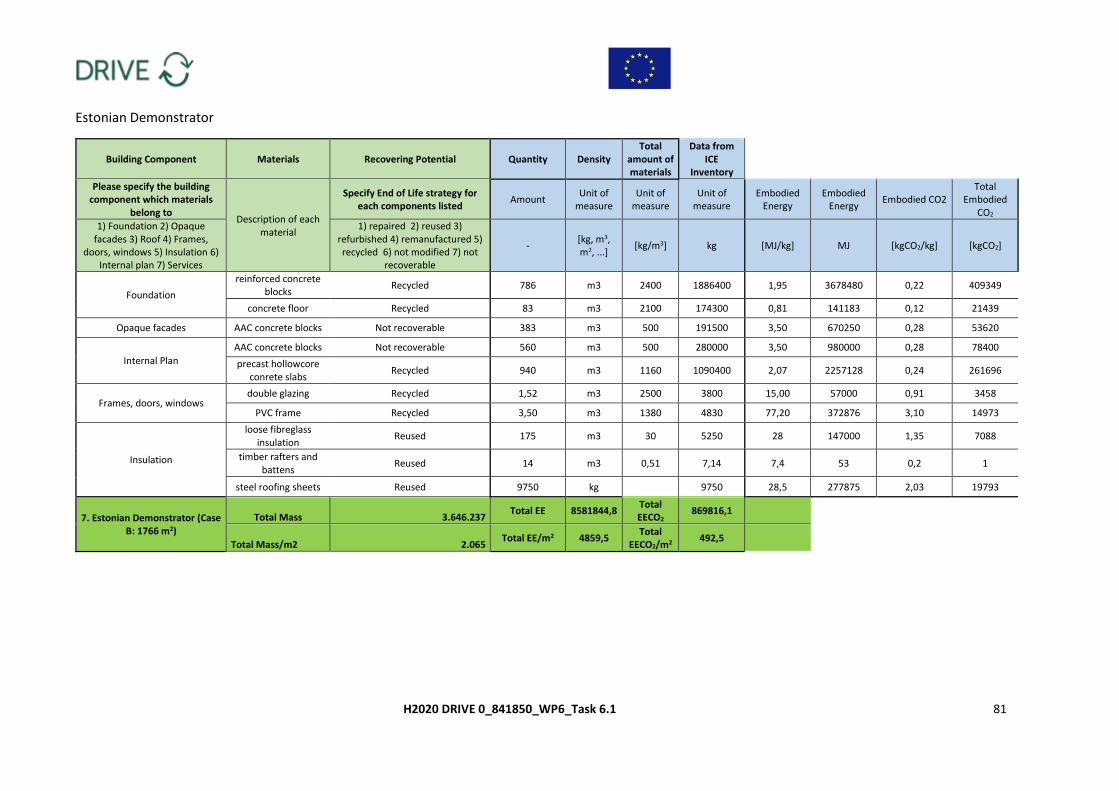
H2020 DRIVE 0_841850_WP6_Task 6.1 81
Estonian Demonstrator
Building Component Materials Recovering Potential Quantity Density Total
amount of materials
Data from ICE
Inventory
Please specify the building component which materials
belong to Description of each
material
Specify End of Life strategy for each components listed
Amount Unit of
measure Unit of
measure Unit of
measure Embodied
Energy Embodied
Energy Embodied CO2
Total Embodied
CO2
1) Foundation 2) Opaque facades 3) Roof 4) Frames,
doors, windows 5) Insulation 6) Internal plan 7) Services
1) repaired 2) reused 3) refurbished 4) remanufactured 5) recycled 6) not modified 7) not
recoverable
- [kg, m3, m2, ...]
[kg/m3] kg [MJ/kg] MJ [kgCO2/kg] [kgCO2]
Foundation
reinforced concrete blocks
Recycled 786 m3 2400 1886400 1,95 3678480 0,22 409349
concrete floor Recycled 83 m3 2100 174300 0,81 141183 0,12 21439
Opaque facades AAC concrete blocks Not recoverable 383 m3 500 191500 3,50 670250 0,28 53620
Internal Plan
AAC concrete blocks Not recoverable 560 m3 500 280000 3,50 980000 0,28 78400
precast hollowcore conrete slabs
Recycled 940 m3 1160 1090400 2,07 2257128 0,24 261696
Frames, doors, windows double glazing Recycled 1,52 m3 2500 3800 15,00 57000 0,91 3458
PVC frame Recycled 3,50 m3 1380 4830 77,20 372876 3,10 14973
Insulation
loose fibreglass insulation
Reused 175 m3 30 5250 28 147000 1,35 7088
timber rafters and battens
Reused 14 m3 0,51 7,14 7,4 53 0,2 1
steel roofing sheets Reused 9750 kg 9750 28,5 277875 2,03 19793
7. Estonian Demonstrator (Case B: 1766 m2)
Total Mass 3.646.237 Total EE 8581844,8
Total EECO2
869816,1
Total Mass/m2 2.065 Total EE/m2 4859,5
Total EECO2/m2
492,5
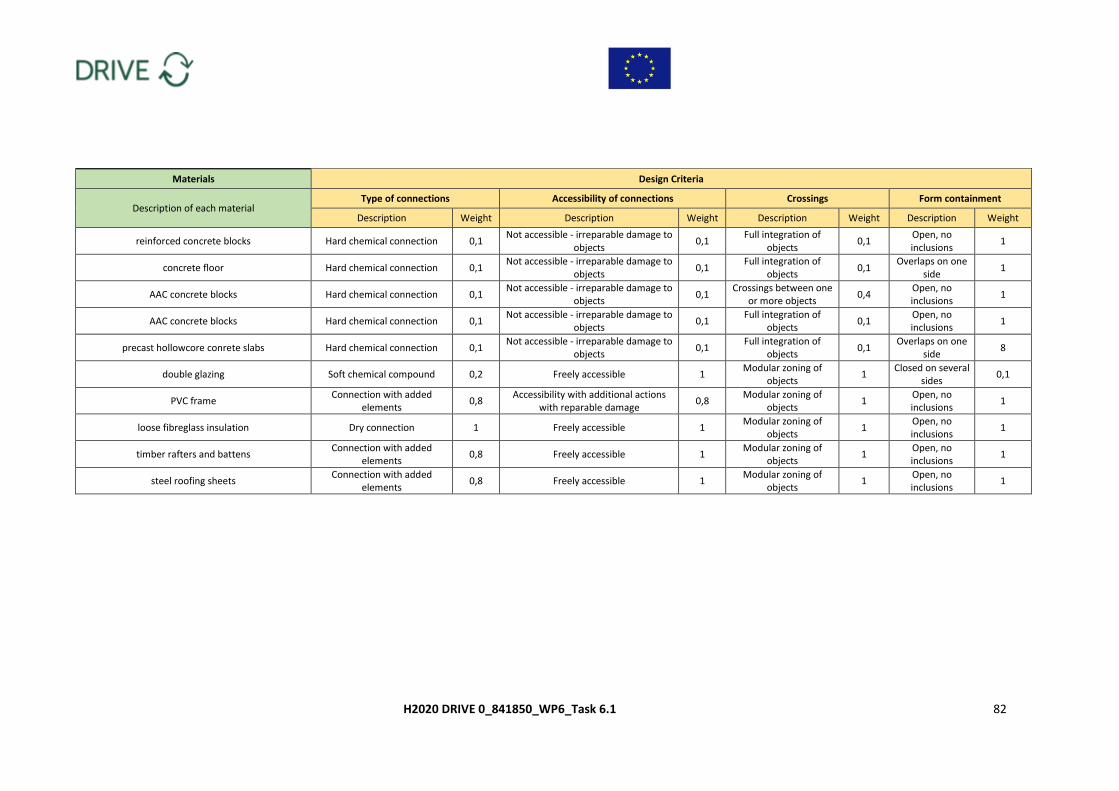
H2020 DRIVE 0_841850_WP6_Task 6.1 82
Materials Design Criteria
Description of each material Type of connections Accessibility of connections Crossings Form containment
Description Weight Description Weight Description Weight Description Weight
reinforced concrete blocks Hard chemical connection 0,1 Not accessible - irreparable damage to
objects 0,1
Full integration of objects
0,1 Open, no inclusions
1
concrete floor Hard chemical connection 0,1 Not accessible - irreparable damage to
objects 0,1
Full integration of objects
0,1 Overlaps on one
side 1
AAC concrete blocks Hard chemical connection 0,1 Not accessible - irreparable damage to
objects 0,1
Crossings between one or more objects
0,4 Open, no inclusions
1
AAC concrete blocks Hard chemical connection 0,1 Not accessible - irreparable damage to
objects 0,1
Full integration of objects
0,1 Open, no inclusions
1
precast hollowcore conrete slabs Hard chemical connection 0,1 Not accessible - irreparable damage to
objects 0,1
Full integration of objects
0,1 Overlaps on one
side 8
double glazing Soft chemical compound 0,2 Freely accessible 1 Modular zoning of
objects 1
Closed on several sides
0,1
PVC frame Connection with added
elements 0,8
Accessibility with additional actions with reparable damage
0,8 Modular zoning of
objects 1
Open, no inclusions
1
loose fibreglass insulation Dry connection 1 Freely accessible 1 Modular zoning of
objects 1
Open, no inclusions
1
timber rafters and battens Connection with added
elements 0,8 Freely accessible 1
Modular zoning of objects
1 Open, no inclusions
1
steel roofing sheets Connection with added
elements 0,8 Freely accessible 1
Modular zoning of objects
1 Open, no inclusions
1
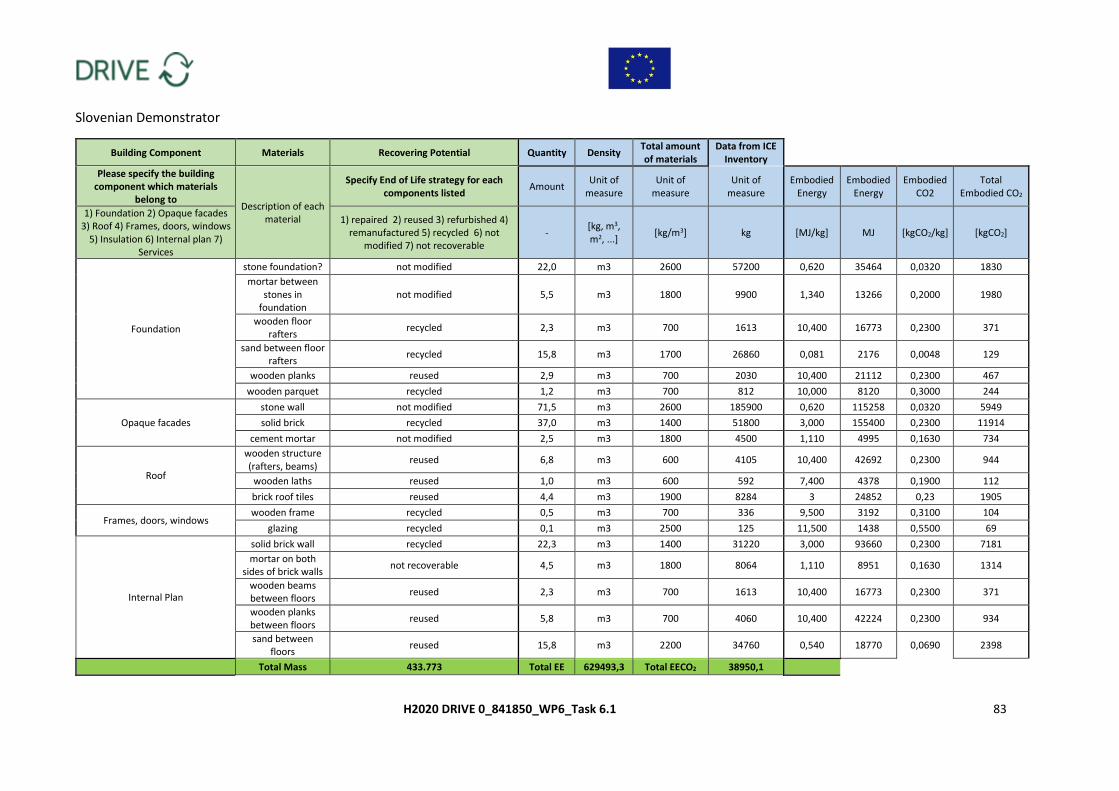
H2020 DRIVE 0_841850_WP6_Task 6.1 83
Slovenian Demonstrator
Building Component Materials Recovering Potential Quantity Density Total amount of materials
Data from ICE Inventory
Please specify the building component which materials
belong to Description of each
material
Specify End of Life strategy for each components listed
Amount Unit of
measure Unit of
measure Unit of
measure Embodied
Energy Embodied
Energy Embodied
CO2 Total
Embodied CO2
1) Foundation 2) Opaque facades 3) Roof 4) Frames, doors, windows
5) Insulation 6) Internal plan 7) Services
1) repaired 2) reused 3) refurbished 4) remanufactured 5) recycled 6) not
modified 7) not recoverable -
[kg, m3, m2, ...]
[kg/m3] kg [MJ/kg] MJ [kgCO2/kg] [kgCO2]
Foundation
stone foundation? not modified 22,0 m3 2600 57200 0,620 35464 0,0320 1830
mortar between stones in
foundation not modified 5,5 m3 1800 9900 1,340 13266 0,2000 1980
wooden floor rafters
recycled 2,3 m3 700 1613 10,400 16773 0,2300 371
sand between floor rafters
recycled 15,8 m3 1700 26860 0,081 2176 0,0048 129
wooden planks reused 2,9 m3 700 2030 10,400 21112 0,2300 467
wooden parquet recycled 1,2 m3 700 812 10,000 8120 0,3000 244
Opaque facades
stone wall not modified 71,5 m3 2600 185900 0,620 115258 0,0320 5949
solid brick recycled 37,0 m3 1400 51800 3,000 155400 0,2300 11914
cement mortar not modified 2,5 m3 1800 4500 1,110 4995 0,1630 734
Roof
wooden structure (rafters, beams)
reused 6,8 m3 600 4105 10,400 42692 0,2300 944
wooden laths reused 1,0 m3 600 592 7,400 4378 0,1900 112
brick roof tiles reused 4,4 m3 1900 8284 3 24852 0,23 1905
Frames, doors, windows wooden frame recycled 0,5 m3 700 336 9,500 3192 0,3100 104
glazing recycled 0,1 m3 2500 125 11,500 1438 0,5500 69
Internal Plan
solid brick wall recycled 22,3 m3 1400 31220 3,000 93660 0,2300 7181
mortar on both sides of brick walls
not recoverable 4,5 m3 1800 8064 1,110 8951 0,1630 1314
wooden beams between floors
reused 2,3 m3 700 1613 10,400 16773 0,2300 371
wooden planks between floors
reused 5,8 m3 700 4060 10,400 42224 0,2300 934
sand between floors
reused 15,8 m3 2200 34760 0,540 18770 0,0690 2398
Total Mass 433.773 Total EE 629493,3 Total EECO2 38950,1
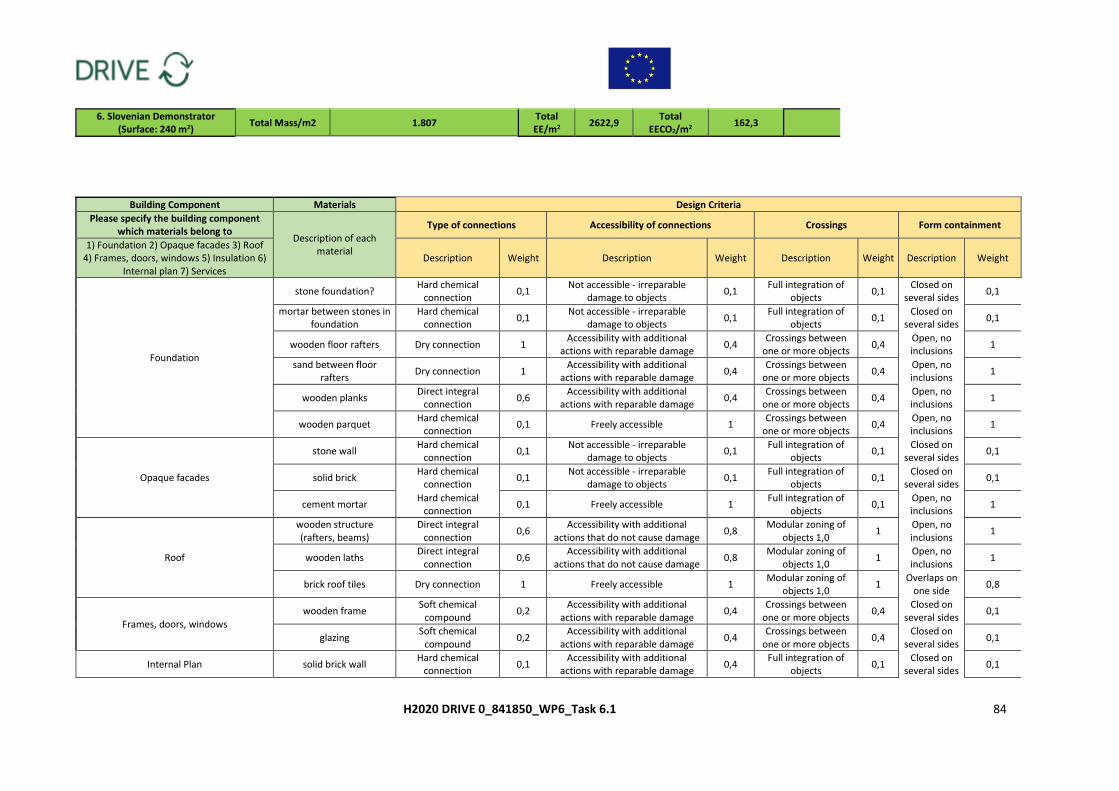
H2020 DRIVE 0_841850_WP6_Task 6.1 84
6. Slovenian Demonstrator (Surface: 240 m2)
Total Mass/m2 1.807 Total EE/m2
2622,9 Total
EECO2/m2 162,3
Building Component Materials Design Criteria
Please specify the building component which materials belong to
Description of each material
Type of connections Accessibility of connections Crossings Form containment
1) Foundation 2) Opaque facades 3) Roof 4) Frames, doors, windows 5) Insulation 6)
Internal plan 7) Services Description Weight Description Weight Description Weight Description Weight
Foundation
stone foundation? Hard chemical
connection 0,1
Not accessible - irreparable damage to objects
0,1 Full integration of
objects 0,1
Closed on several sides
0,1
mortar between stones in foundation
Hard chemical connection
0,1 Not accessible - irreparable
damage to objects 0,1
Full integration of objects
0,1 Closed on
several sides 0,1
wooden floor rafters Dry connection 1 Accessibility with additional
actions with reparable damage 0,4
Crossings between one or more objects
0,4 Open, no inclusions
1
sand between floor rafters
Dry connection 1 Accessibility with additional
actions with reparable damage 0,4
Crossings between one or more objects
0,4 Open, no inclusions
1
wooden planks Direct integral
connection 0,6
Accessibility with additional actions with reparable damage
0,4 Crossings between
one or more objects 0,4
Open, no inclusions
1
wooden parquet Hard chemical
connection 0,1 Freely accessible 1
Crossings between one or more objects
0,4 Open, no inclusions
1
Opaque facades
stone wall Hard chemical
connection 0,1
Not accessible - irreparable damage to objects
0,1 Full integration of
objects 0,1
Closed on several sides
0,1
solid brick Hard chemical
connection 0,1
Not accessible - irreparable damage to objects
0,1 Full integration of
objects 0,1
Closed on several sides
0,1
cement mortar Hard chemical
connection 0,1 Freely accessible 1
Full integration of objects
0,1 Open, no inclusions
1
Roof
wooden structure (rafters, beams)
Direct integral connection
0,6 Accessibility with additional
actions that do not cause damage 0,8
Modular zoning of objects 1,0
1 Open, no inclusions
1
wooden laths Direct integral
connection 0,6
Accessibility with additional actions that do not cause damage
0,8 Modular zoning of
objects 1,0 1
Open, no inclusions
1
brick roof tiles Dry connection 1 Freely accessible 1 Modular zoning of
objects 1,0 1
Overlaps on one side
0,8
Frames, doors, windows wooden frame
Soft chemical compound
0,2 Accessibility with additional
actions with reparable damage 0,4
Crossings between one or more objects
0,4 Closed on
several sides 0,1
glazing Soft chemical
compound 0,2
Accessibility with additional actions with reparable damage
0,4 Crossings between
one or more objects 0,4
Closed on several sides
0,1
Internal Plan solid brick wall Hard chemical
connection 0,1
Accessibility with additional actions with reparable damage
0,4 Full integration of
objects 0,1
Closed on several sides
0,1
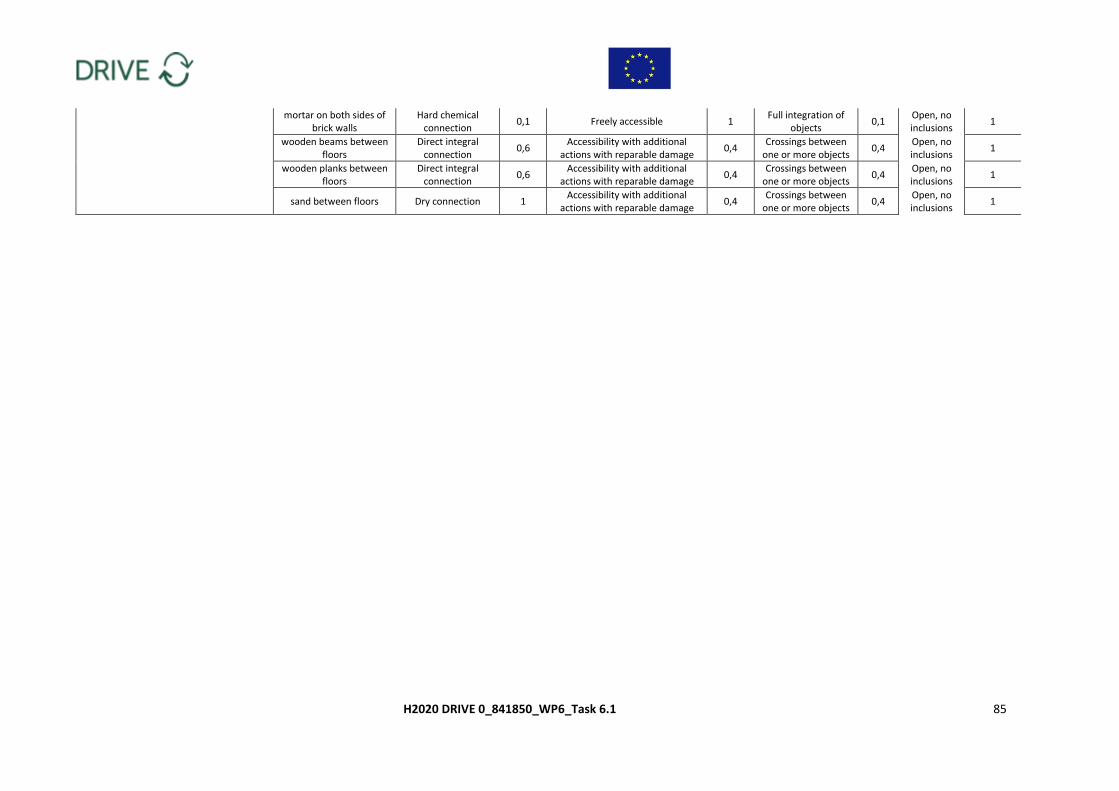
H2020 DRIVE 0_841850_WP6_Task 6.1 85
mortar on both sides of brick walls
Hard chemical connection
0,1 Freely accessible 1 Full integration of
objects 0,1
Open, no inclusions
1
wooden beams between floors
Direct integral connection
0,6 Accessibility with additional
actions with reparable damage 0,4
Crossings between one or more objects
0,4 Open, no inclusions
1
wooden planks between floors
Direct integral connection
0,6 Accessibility with additional
actions with reparable damage 0,4
Crossings between one or more objects
0,4 Open, no inclusions
1
sand between floors Dry connection 1 Accessibility with additional
actions with reparable damage 0,4
Crossings between one or more objects
0,4 Open, no inclusions
1
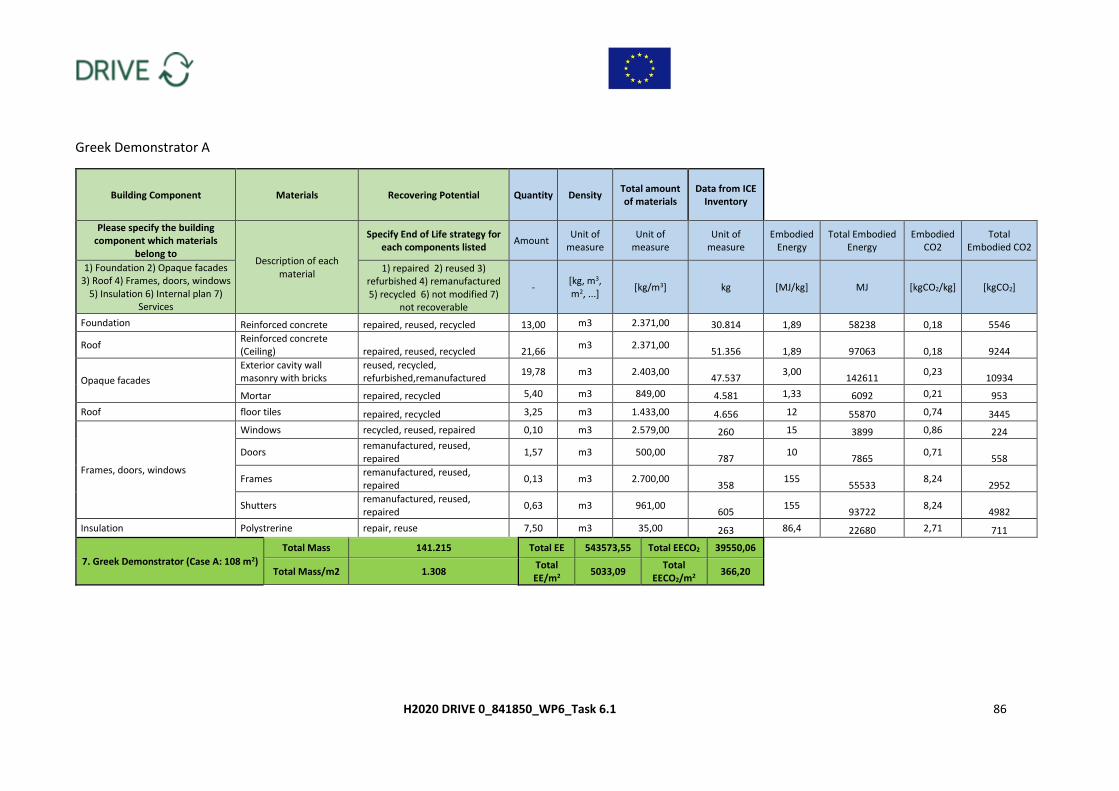
H2020 DRIVE 0_841850_WP6_Task 6.1 86
Greek Demonstrator A
Building Component Materials Recovering Potential Quantity Density Total amount of materials
Data from ICE Inventory
Please specify the building component which materials
belong to Description of each
material
Specify End of Life strategy for each components listed
Amount Unit of
measure Unit of
measure Unit of
measure Embodied
Energy Total Embodied
Energy Embodied
CO2 Total
Embodied CO2
1) Foundation 2) Opaque facades 3) Roof 4) Frames, doors, windows
5) Insulation 6) Internal plan 7) Services
1) repaired 2) reused 3) refurbished 4) remanufactured 5) recycled 6) not modified 7)
not recoverable
- [kg, m3, m2, ...]
[kg/m3] kg [MJ/kg] MJ [kgCO2/kg] [kgCO2]
Foundation Reinforced concrete repaired, reused, recycled 13,00 m3 2.371,00 30.814 1,89 58238 0,18 5546
Roof Reinforced concrete (Ceiling) repaired, reused, recycled 21,66
m3 2.371,00 51.356 1,89 97063 0,18 9244
Opaque facades
Exterior cavity wall masonry with bricks
reused, recycled, refurbished,remanufactured
19,78 m3 2.403,00 47.537
3,00 142611
0,23 10934
Mortar repaired, recycled 5,40 m3 849,00 4.581 1,33 6092 0,21 953
Roof floor tiles repaired, recycled 3,25 m3 1.433,00 4.656 12 55870 0,74 3445
Frames, doors, windows
Windows recycled, reused, repaired 0,10 m3 2.579,00 260 15 3899 0,86 224
Doors remanufactured, reused, repaired
1,57 m3 500,00 787
10 7865
0,71 558
Frames remanufactured, reused, repaired
0,13 m3 2.700,00 358
155 55533
8,24 2952
Shutters remanufactured, reused, repaired
0,63 m3 961,00 605
155 93722
8,24 4982
Insulation Polystrerine repair, reuse 7,50 m3 35,00 263 86,4 22680 2,71 711
7. Greek Demonstrator (Case A: 108 m2)
Total Mass 141.215 Total EE 543573,55 Total EECO2 39550,06
Total Mass/m2 1.308 Total EE/m2
5033,09 Total
EECO2/m2 366,20
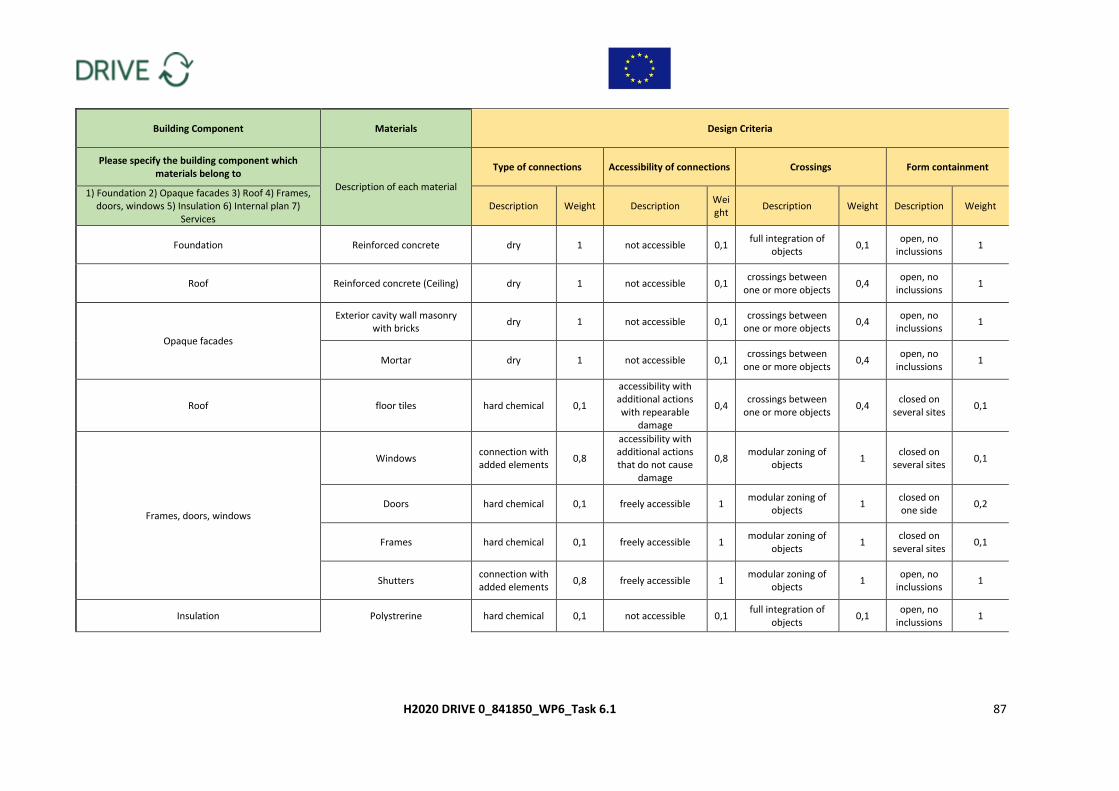
H2020 DRIVE 0_841850_WP6_Task 6.1 87
Building Component Materials Design Criteria
Please specify the building component which materials belong to
Description of each material
Type of connections Accessibility of connections Crossings Form containment
1) Foundation 2) Opaque facades 3) Roof 4) Frames, doors, windows 5) Insulation 6) Internal plan 7)
Services Description Weight Description
Weight
Description Weight Description Weight
Foundation Reinforced concrete dry 1 not accessible 0,1 full integration of
objects 0,1
open, no inclussions
1
Roof Reinforced concrete (Ceiling) dry 1 not accessible 0,1 crossings between
one or more objects 0,4
open, no inclussions
1
Opaque facades
Exterior cavity wall masonry with bricks
dry 1 not accessible 0,1 crossings between
one or more objects 0,4
open, no inclussions
1
Mortar dry 1 not accessible 0,1 crossings between
one or more objects 0,4
open, no inclussions
1
Roof floor tiles hard chemical 0,1
accessibility with additional actions with repearable
damage
0,4 crossings between
one or more objects 0,4
closed on several sites
0,1
Frames, doors, windows
Windows connection with added elements
0,8
accessibility with additional actions that do not cause
damage
0,8 modular zoning of
objects 1
closed on several sites
0,1
Doors hard chemical 0,1 freely accessible 1 modular zoning of
objects 1
closed on one side
0,2
Frames hard chemical 0,1 freely accessible 1 modular zoning of
objects 1
closed on several sites
0,1
Shutters connection with added elements
0,8 freely accessible 1 modular zoning of
objects 1
open, no inclussions
1
Insulation Polystrerine hard chemical 0,1 not accessible 0,1 full integration of
objects 0,1
open, no inclussions
1
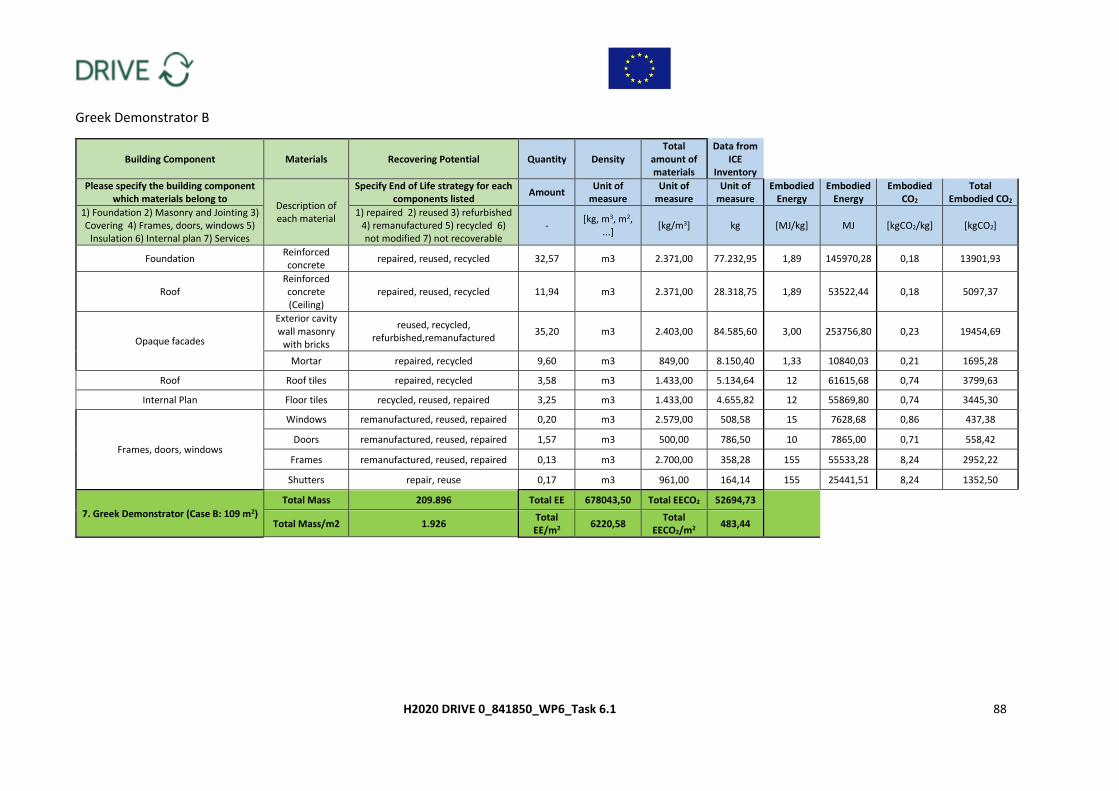
H2020 DRIVE 0_841850_WP6_Task 6.1 88
Greek Demonstrator B
Building Component Materials Recovering Potential Quantity Density Total
amount of materials
Data from ICE
Inventory
Please specify the building component which materials belong to
Description of each material
Specify End of Life strategy for each components listed
Amount Unit of
measure Unit of
measure Unit of
measure Embodied
Energy Embodied
Energy Embodied
CO2 Total
Embodied CO2
1) Foundation 2) Masonry and Jointing 3) Covering 4) Frames, doors, windows 5)
Insulation 6) Internal plan 7) Services
1) repaired 2) reused 3) refurbished 4) remanufactured 5) recycled 6) not modified 7) not recoverable
- [kg, m3, m2,
...] [kg/m3] kg [MJ/kg] MJ [kgCO2/kg] [kgCO2]
Foundation Reinforced concrete
repaired, reused, recycled 32,57 m3 2.371,00 77.232,95 1,89 145970,28 0,18 13901,93
Roof Reinforced concrete (Ceiling)
repaired, reused, recycled 11,94 m3 2.371,00 28.318,75 1,89 53522,44 0,18 5097,37
Opaque facades
Exterior cavity wall masonry
with bricks
reused, recycled, refurbished,remanufactured
35,20 m3 2.403,00 84.585,60 3,00 253756,80 0,23 19454,69
Mortar repaired, recycled 9,60 m3 849,00 8.150,40 1,33 10840,03 0,21 1695,28
Roof Roof tiles repaired, recycled 3,58 m3 1.433,00 5.134,64 12 61615,68 0,74 3799,63
Internal Plan Floor tiles recycled, reused, repaired 3,25 m3 1.433,00 4.655,82 12 55869,80 0,74 3445,30
Frames, doors, windows
Windows remanufactured, reused, repaired 0,20 m3 2.579,00 508,58 15 7628,68 0,86 437,38
Doors remanufactured, reused, repaired 1,57 m3 500,00 786,50 10 7865,00 0,71 558,42
Frames remanufactured, reused, repaired 0,13 m3 2.700,00 358,28 155 55533,28 8,24 2952,22
Shutters repair, reuse 0,17 m3 961,00 164,14 155 25441,51 8,24 1352,50
7. Greek Demonstrator (Case B: 109 m2)
Total Mass 209.896 Total EE 678043,50 Total EECO2 52694,73
Total Mass/m2 1.926 Total EE/m2
6220,58 Total
EECO2/m2 483,44
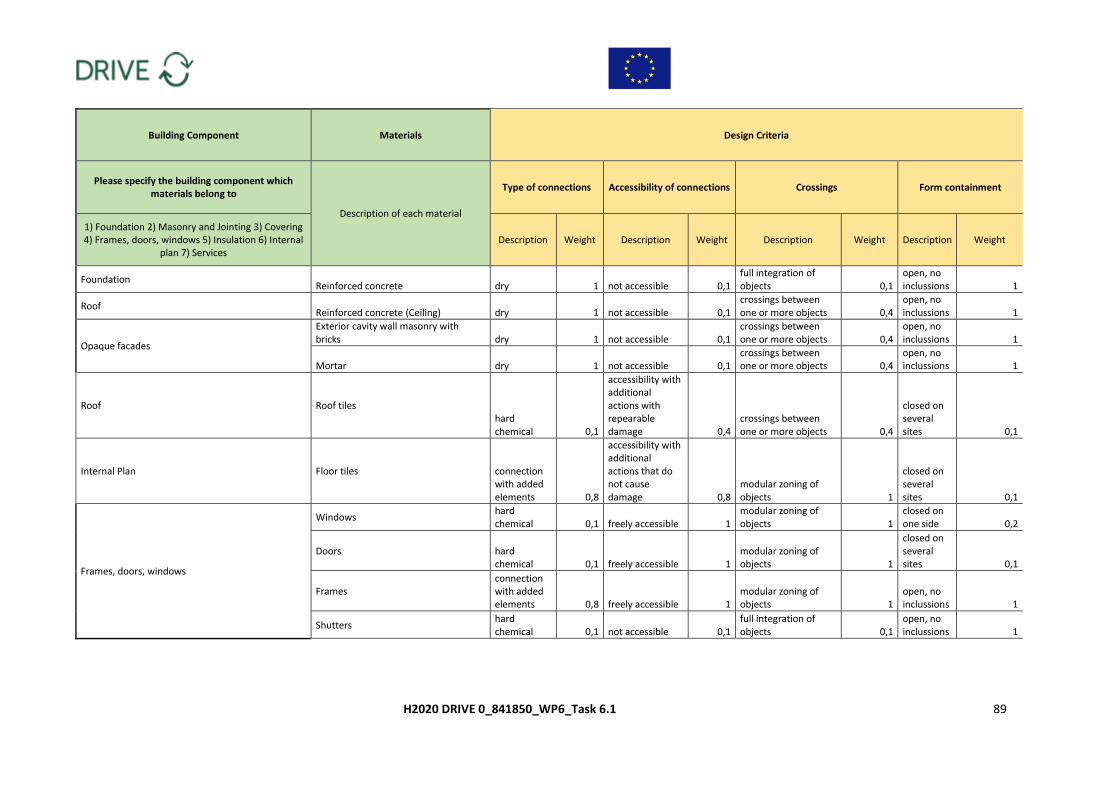
H2020 DRIVE 0_841850_WP6_Task 6.1 89
Building Component Materials Design Criteria
Please specify the building component which materials belong to
Description of each material
Type of connections Accessibility of connections Crossings Form containment
1) Foundation 2) Masonry and Jointing 3) Covering 4) Frames, doors, windows 5) Insulation 6) Internal
plan 7) Services Description Weight Description Weight Description Weight Description Weight
Foundation Reinforced concrete dry 1 not accessible 0,1
full integration of objects 0,1
open, no inclussions 1
Roof Reinforced concrete (Ceiling) dry 1 not accessible 0,1
crossings between one or more objects 0,4
open, no inclussions 1
Opaque facades
Exterior cavity wall masonry with bricks dry 1 not accessible 0,1
crossings between one or more objects 0,4
open, no inclussions 1
Mortar dry 1 not accessible 0,1 crossings between one or more objects 0,4
open, no inclussions 1
Roof Roof tiles hard chemical 0,1
accessibility with additional actions with repearable damage 0,4
crossings between one or more objects 0,4
closed on several sites 0,1
Internal Plan Floor tiles connection with added elements 0,8
accessibility with additional actions that do not cause damage 0,8
modular zoning of objects 1
closed on several sites 0,1
Frames, doors, windows
Windows hard chemical 0,1 freely accessible 1
modular zoning of objects 1
closed on one side 0,2
Doors hard chemical 0,1 freely accessible 1
modular zoning of objects 1
closed on several sites 0,1
Frames connection with added elements 0,8 freely accessible 1
modular zoning of objects 1
open, no inclussions 1
Shutters hard chemical 0,1 not accessible 0,1
full integration of objects 0,1
open, no inclussions 1
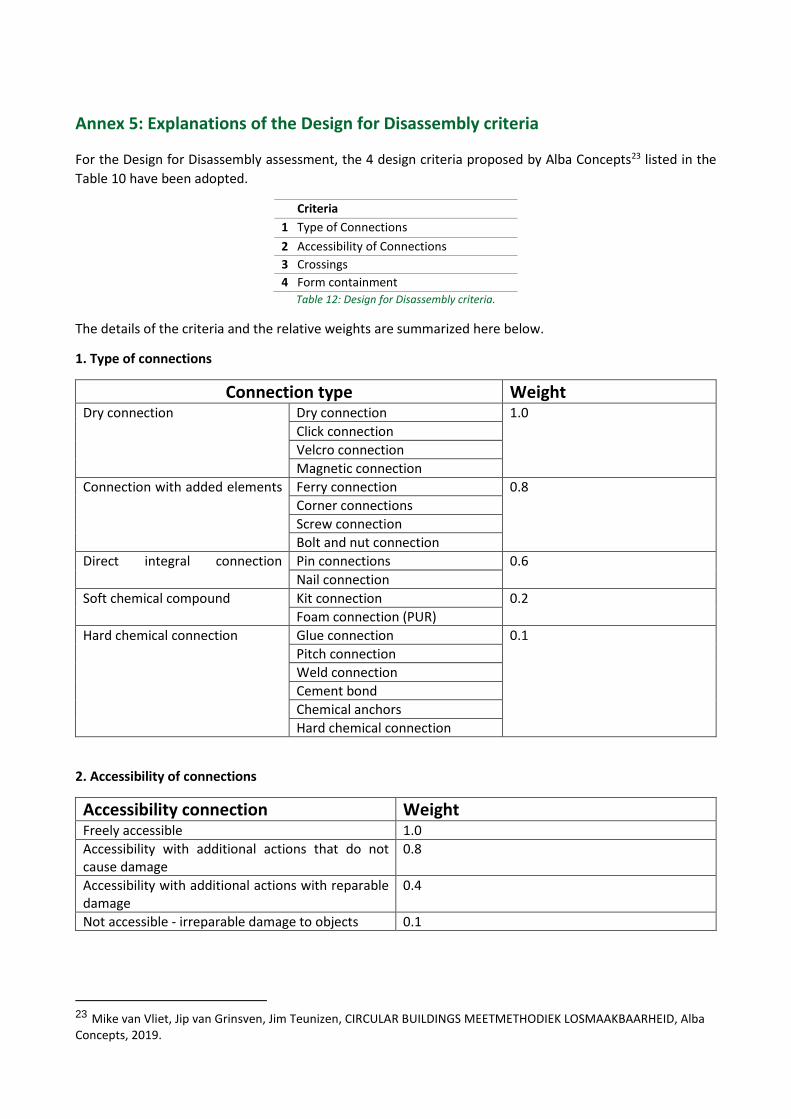
Annex 5: Explanations of the Design for Disassembly criteria
For the Design for Disassembly assessment, the 4 design criteria proposed by Alba Concepts23 listed in the
Table 10 have been adopted.
Criteria
1 Type of Connections
2 Accessibility of Connections
3 Crossings
4 Form containment
Table 12: Design for Disassembly criteria.
The details of the criteria and the relative weights are summarized here below.
1. Type of connections
Connection type Weight Dry connection Dry connection 1.0
Click connection
Velcro connection
Magnetic connection
Connection with added elements
Ferry connection 0.8
Corner connections
Screw connection
Bolt and nut connection
Direct integral connection
Pin connections 0.6
Nail connection
Soft chemical compound Kit connection 0.2
Foam connection (PUR)
Hard chemical connection Glue connection 0.1
Pitch connection
Weld connection
Cement bond
Chemical anchors
Hard chemical connection
2. Accessibility of connections
Accessibility connection Weight Freely accessible 1.0
Accessibility with additional actions that do not cause damage
0.8
Accessibility with additional actions with reparable damage
0.4
Not accessible - irreparable damage to objects 0.1
23 Mike van Vliet, Jip van Grinsven, Jim Teunizen, CIRCULAR BUILDINGS MEETMETHODIEK LOSMAAKBAARHEID, Alba Concepts, 2019.
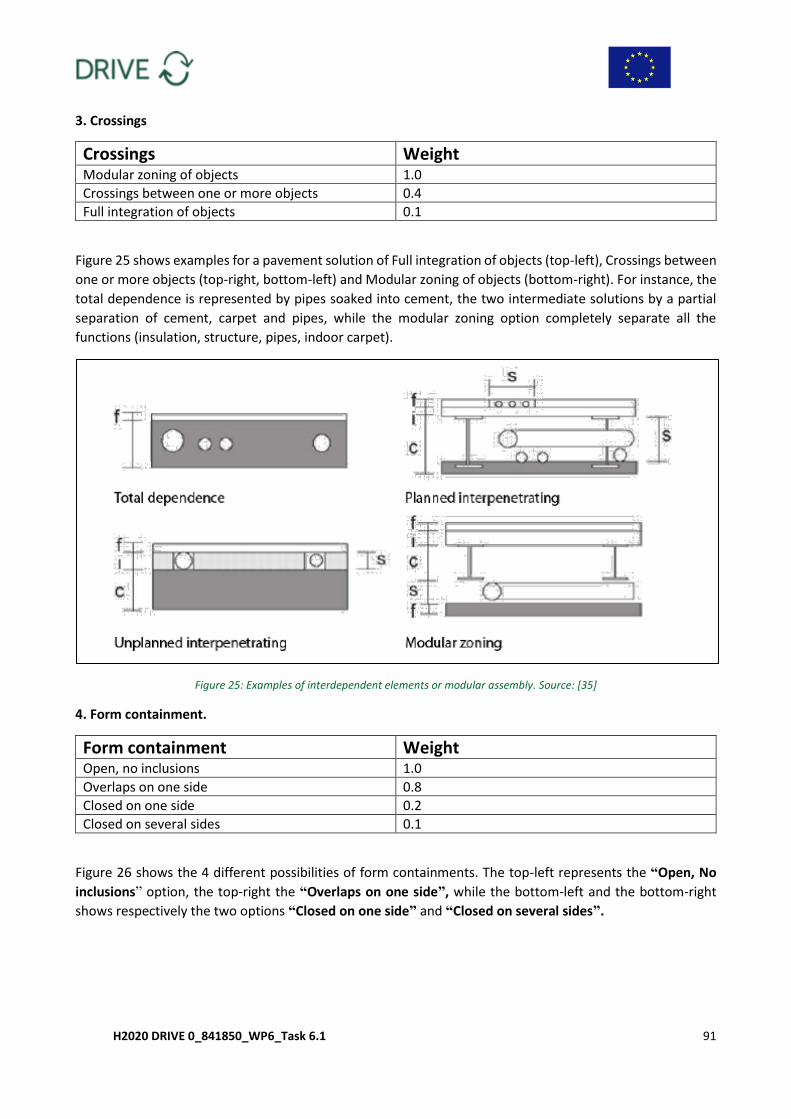
H2020 DRIVE 0_841850_WP6_Task 6.1 91
3. Crossings
Crossings Weight Modular zoning of objects 1.0
Crossings between one or more objects 0.4
Full integration of objects 0.1
Figure 25 shows examples for a pavement solution of Full integration of objects (top-left), Crossings between
one or more objects (top-right, bottom-left) and Modular zoning of objects (bottom-right). For instance, the
total dependence is represented by pipes soaked into cement, the two intermediate solutions by a partial
separation of cement, carpet and pipes, while the modular zoning option completely separate all the
functions (insulation, structure, pipes, indoor carpet).
Figure 25: Examples of interdependent elements or modular assembly. Source: [35]
4. Form containment.
Form containment Weight Open, no inclusions 1.0
Overlaps on one side 0.8
Closed on one side 0.2
Closed on several sides 0.1
Figure 26 shows the 4 different possibilities of form containments. The top-left represents the “Open, No
inclusions” option, the top-right the “Overlaps on one side”, while the bottom-left and the bottom-right
shows respectively the two options “Closed on one side” and “Closed on several sides”.
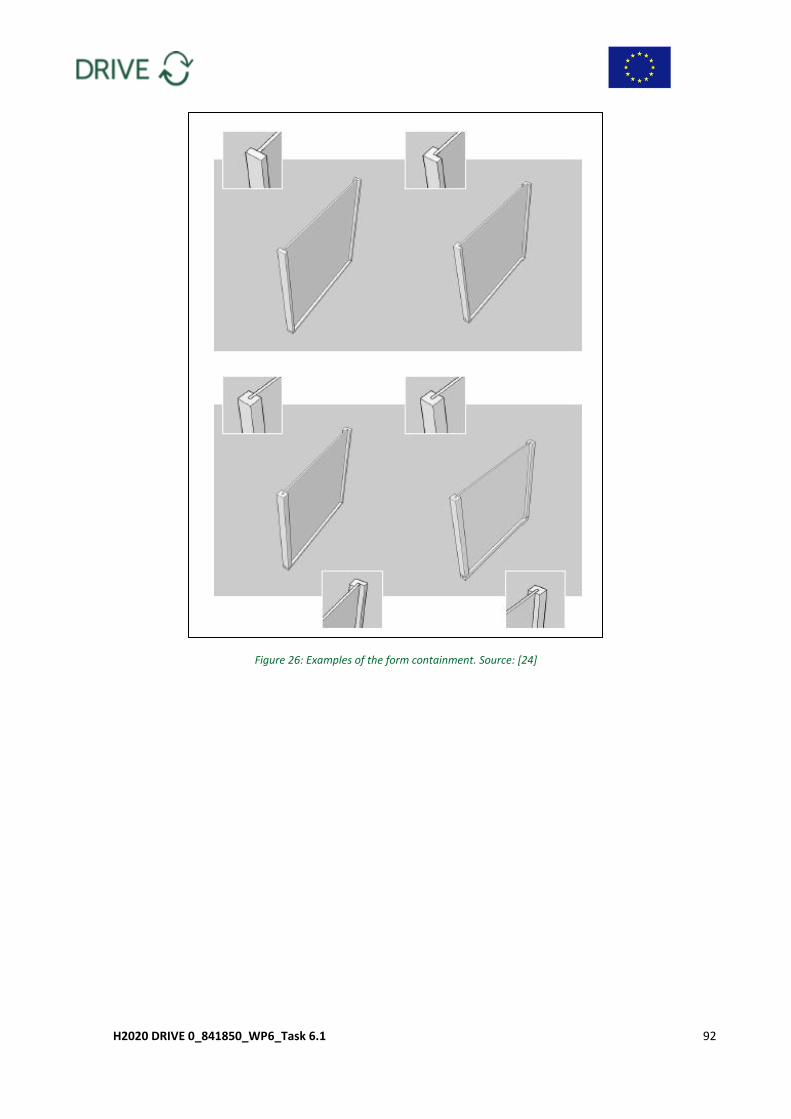
H2020 DRIVE 0_841850_WP6_Task 6.1 92
Figure 26: Examples of the form containment. Source: [24]


![Deliverable D6.1 Unique identifier analysis report and ... - D6.1_0.pdf · IoT6 D6.1 First report on Unique identifier analysis report and STIS, ONS, IoT6 integration 4 [1] Introduction](https://img.pdfslide.net/doc/110x75/6054ec1085851e347c0a47ed/deliverable-d61-unique-identifier-analysis-report-and-d610pdf-iot6-d61.jpg)