Embed Size (px)
Citation preview
REPORT
ON
PRODUCTIVITY RATIOS
OF
POWER PSUs

Every Business of this world is based on a Productivity Model. Production may be of Goods or
Services, but what matters the most is that, something relevant to the needs of this world is being
produced. To be very efficient in the production process and to be optimal on all aspects of the
production, an overall analysis of various inputs and outputs of the Production Model is required.
Productivity Ratio = Output(The amount produced by a person, machine, business or industry) Input(What is put into a process, system or business)
In present scenario, the market and industries have cut throat competition among its business
houses, it becomes mandatory for every single production house to keep a close watch on all the
relevant factors effecting its production and to execute the preventive/corrective measures
wherever necessary.
Productivity Ratio prepared by any organization also enables its management to analyze its
performance among its peer business units, and to come over the conclusion regarding the aspects
of organization, it is leading or lagging on. It also let the management to take initiative of buying the
best available ideas from its competitors, to enhance the efficiency of their production units by
implementing the advanced and effective business practices and technologies available in the
market.
Productivity Ratio is a fact based technique that is used to assess the real performance that in turn
is used to evaluate the strengths, weaknesses, opportunities and threats involved in a business
model. It removes the illusion of the Management to point out the non contributing factors and to
come across the real picture of their organization’s performance
Productivity Ratio study carried in SJVN by its Policy Section, is one of the best business
practices adopted which shall serve the objective of updating its management and all key officials
with the recent facts and figures of the Power Industry, which shall ultimately lead to enhancement
of SJVN’s business efficiency and help in adopting the most optimal business practices and
technologies used in the industry.
* * * * * * * *
PRODUCTIVITY RATIO – A technique to
differ Business’s MIRAGE and
MIRROR IMAGE
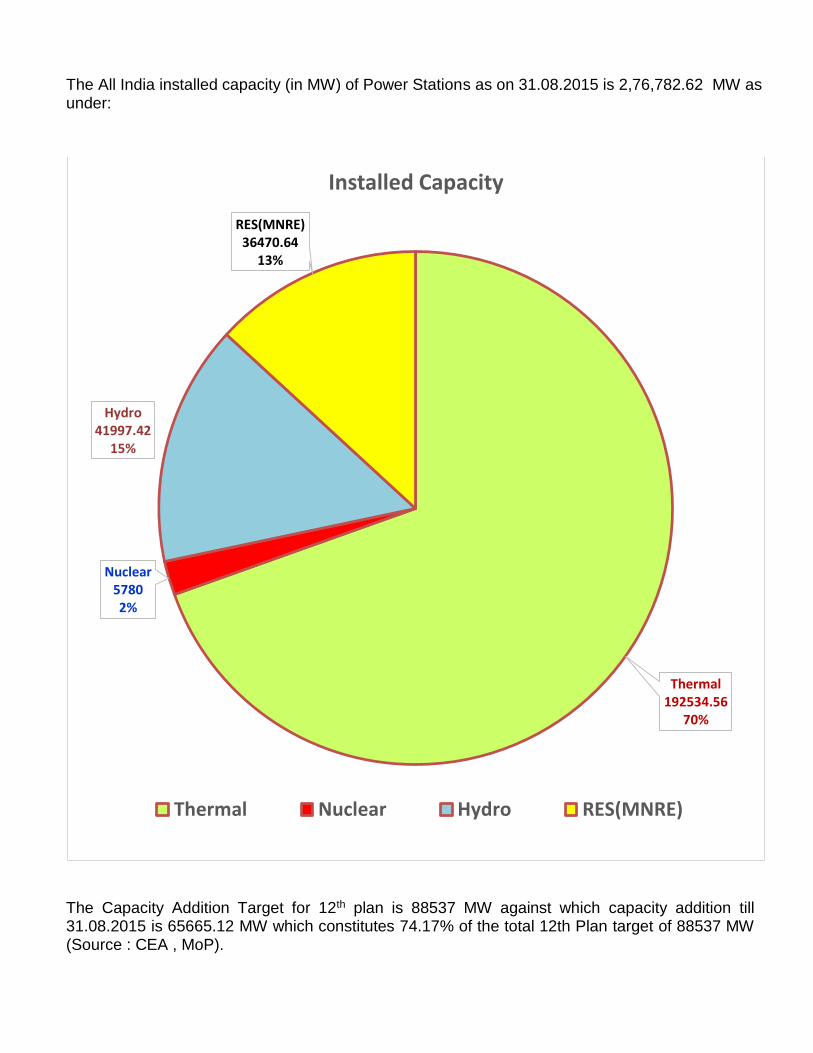
The All India installed capacity (in MW) of Power Stations as on 31.08.2015 is 2,76,782.62 MW as under:
The Capacity Addition Target for 12th plan is 88537 MW against which capacity addition till 31.08.2015 is 65665.12 MW which constitutes 74.17% of the total 12th Plan target of 88537 MW (Source : CEA , MoP).
Thermal192534.56
70%
Nuclear57802%
Hydro41997.42
15%
RES(MNRE)36470.64
13%
Installed Capacity
Thermal Nuclear Hydro RES(MNRE)
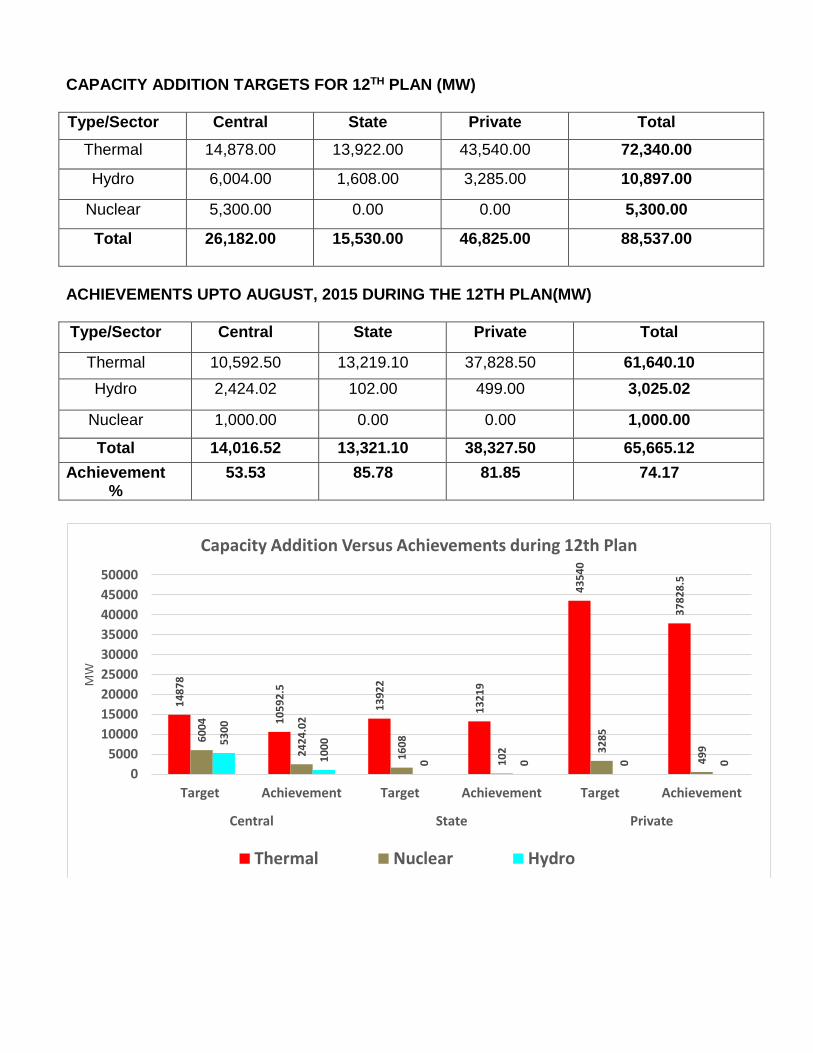
CAPACITY ADDITION TARGETS FOR 12TH PLAN (MW)
Type/Sector Central State Private Total
Thermal 14,878.00 13,922.00 43,540.00 72,340.00
Hydro 6,004.00 1,608.00 3,285.00 10,897.00
Nuclear 5,300.00 0.00 0.00 5,300.00
Total 26,182.00 15,530.00 46,825.00 88,537.00
ACHIEVEMENTS UPTO AUGUST, 2015 DURING THE 12TH PLAN(MW)
Type/Sector Central State Private Total
Thermal 10,592.50 13,219.10 37,828.50 61,640.10
Hydro 2,424.02 102.00 499.00 3,025.02
Nuclear 1,000.00 0.00 0.00 1,000.00
Total 14,016.52 13,321.10 38,327.50 65,665.12 Achievement
% 53.53 85.78 81.85 74.17
14
87
8
10
59
2.5
13
92
2
13
21
9
43
54
0
37
82
8.5
60
04
24
24
.02
16
08
10
2 32
85
49
9
53
00
10
00
0 0 0 0
0
5000
10000
15000
20000
25000
30000
35000
40000
45000
50000
Target Achievement Target Achievement Target Achievement
Central State Private
MW
Capacity Addition Versus Achievements during 12th Plan
Thermal Nuclear Hydro
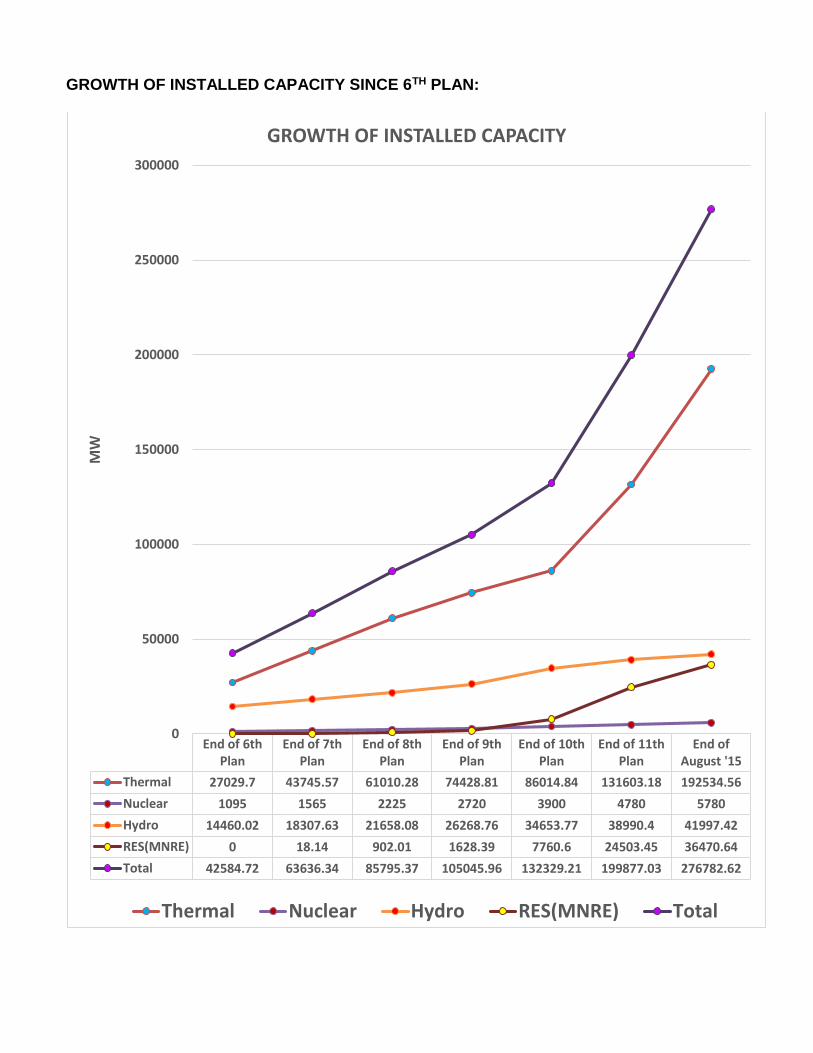
GROWTH OF INSTALLED CAPACITY SINCE 6TH PLAN:
168207.88 23333.15 993.53 5780.00 41997.4 35776.96 229251.74
End of 6thPlan
End of 7thPlan
End of 8thPlan
End of 9thPlan
End of 10thPlan
End of 11thPlan
End ofAugust '15
Thermal 27029.7 43745.57 61010.28 74428.81 86014.84 131603.18 192534.56
Nuclear 1095 1565 2225 2720 3900 4780 5780
Hydro 14460.02 18307.63 21658.08 26268.76 34653.77 38990.4 41997.42
RES(MNRE) 0 18.14 902.01 1628.39 7760.6 24503.45 36470.64
Total 42584.72 63636.34 85795.37 105045.96 132329.21 199877.03 276782.62
0
50000
100000
150000
200000
250000
300000
MW
GROWTH OF INSTALLED CAPACITY
Thermal Nuclear Hydro RES(MNRE) Total
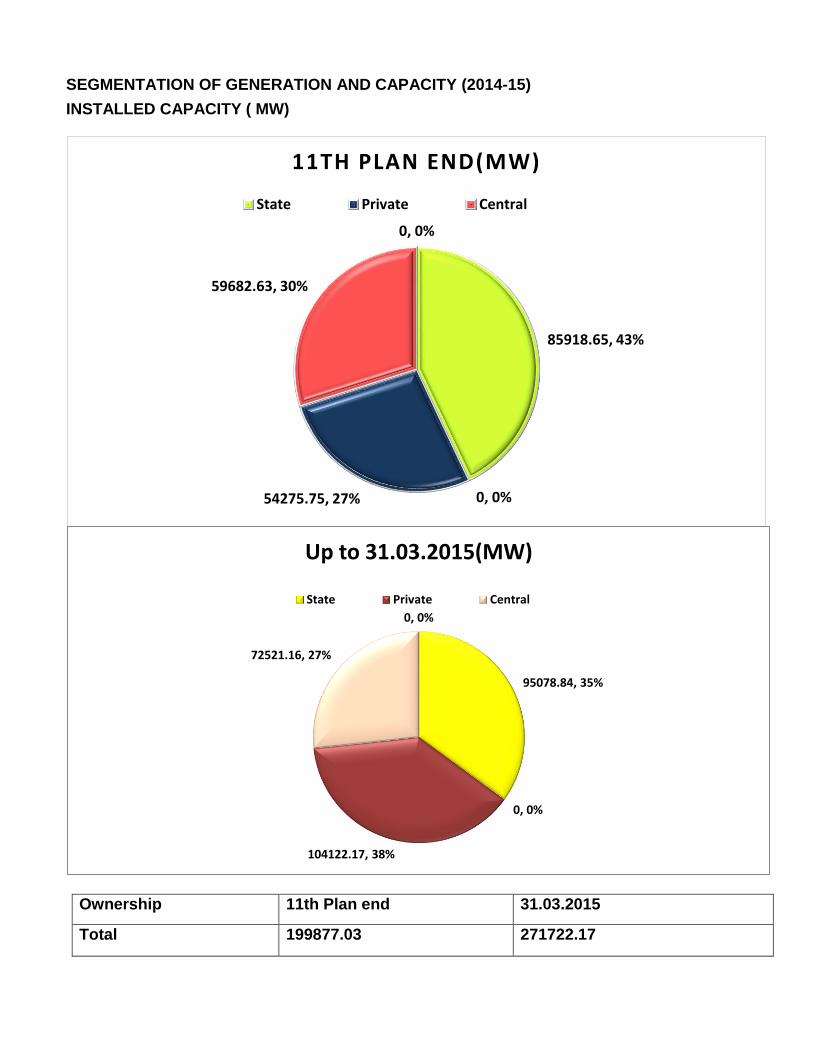
SEGMENTATION OF GENERATION AND CAPACITY (2014-15)
INSTALLED CAPACITY ( MW)
Ownership 11th Plan end 31.03.2015
Total 199877.03 271722.17
0, 0%
85918.65, 43%
0, 0%54275.75, 27%
59682.63, 30%
11TH PLAN END(MW)
State Private Central
0, 0%
95078.84, 35%
0, 0%
104122.17, 38%
72521.16, 27%
Up to 31.03.2015(MW)
State Private Central
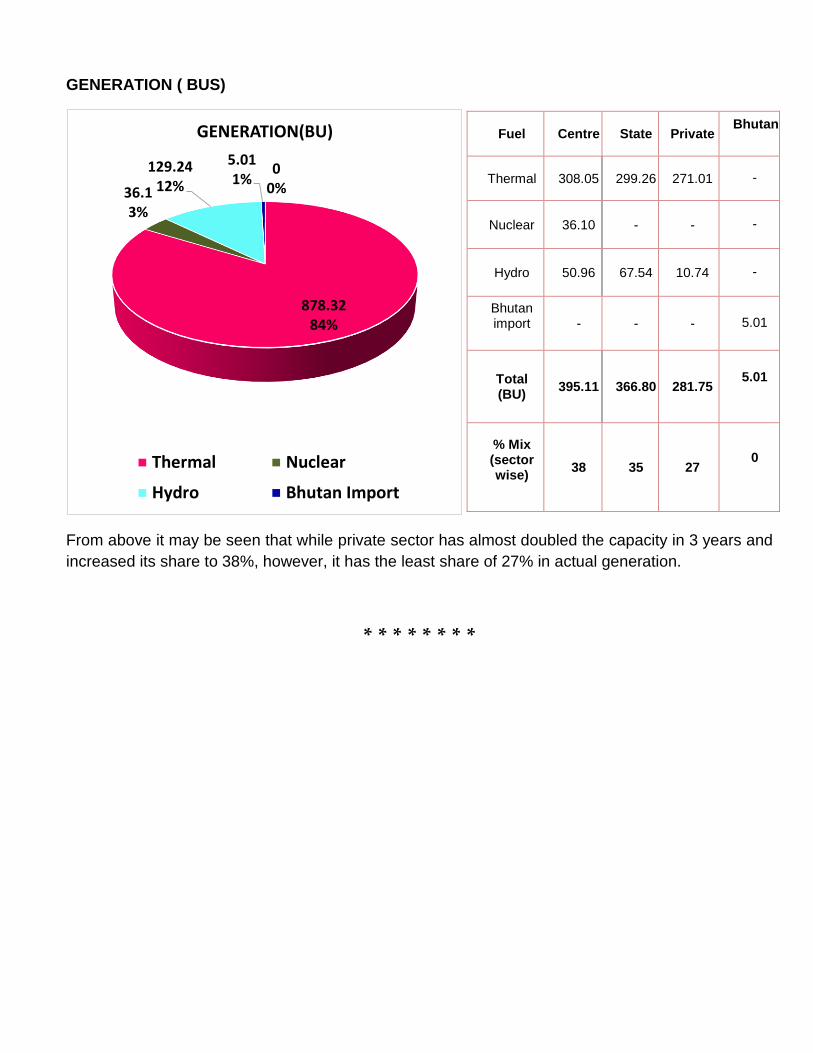
GENERATION ( BUS)
From above it may be seen that while private sector has almost doubled the capacity in 3 years and
increased its share to 38%, however, it has the least share of 27% in actual generation.
* * * * * * * *
00%
878.3284%
36.13%
129.2412%
5.011%
GENERATION(BU)
Thermal Nuclear
Hydro Bhutan Import
Fuel Centre State Private Bhutan
Thermal 308.05 299.26 271.01 -
Nuclear 36.10 - - -
Hydro 50.96 67.54 10.74 -
Bhutan import
- - - 5.01
Total (BU)
395.11 366.80 281.75 5.01
% Mix (sector wise)
38 35 27 0
There are 13 CPSEs in Power Generation /Transmission as per following details:
Power Generation
Sr.No. Enterprise
1 NTPC
2 NHPC
3 SJVN
4 THDC
5 NEEPCO
6 NPCIL
7 NHDC
8 Neyveli Lignite Corporation Limited
9 Kanti Bijlee Utpadan Nigam Limited(Subsidiary of NTPC)
10 REC Power Distribution Co. Ltd.(Subsidiary of REC)
Power Transmission
1 NTPC Electric Supply Co. Limited(Subsidiary of NTPC)
2 PGCIL
3 REC Transmission Projects Co. Ltd. (Subsidiary of REC)
To enable having a broad overview of the performance of Power CPSEs the parameters / details as under have been considered in preparing this report:
1. Productivity ratios a) Capacity Utilization b) Inventory Management
2. Important Indicators & Profitability ratios : a) Capital Employed b) Net Worth c) Net Current assets d) Net Profit e) Financial Ratios :
i) Sales to Capital Employed ii) Net Profit to Net Worth iii) Net Profit to Revenue iv) Net profit to Capital Employed
3. Total Regular Manpower 4. Manpower deployed per 1 MW 5. Average monthly emoluments per employee 6. Salary/Wages as %age of sales 7. Salary/Wages as % age of Net Profit 8. Sales per employee 9. Ranking of CPSEs in terms of Profit & Loss Before exceptional, extraordinary items & Tax 10. Ranking of CPSEs in terms of Net Turnover /Revenue 11. Ranking of CPSEs in terms of Employment 12. Ranking of CPSEs in terms of Gross Block
The data has been taken from Public Enterprise Survey 2013-14 and Annual Reports 2014-15
of CPSEs as per availability.
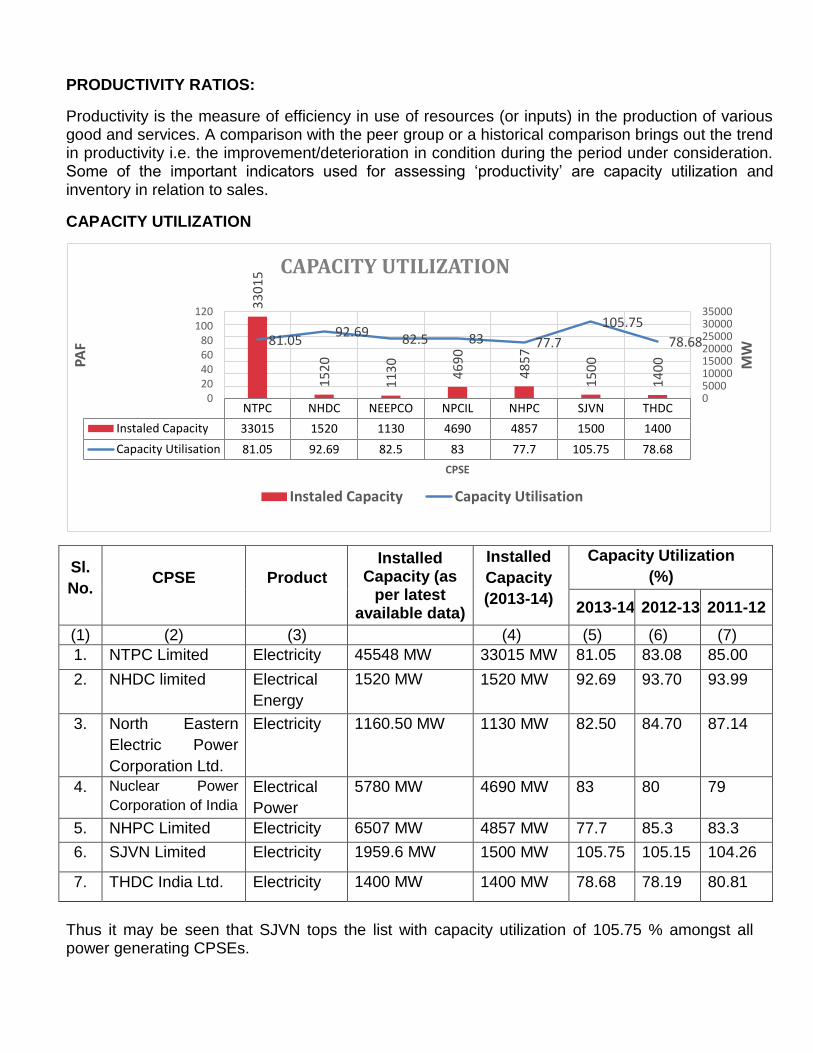
PRODUCTIVITY RATIOS:
Productivity is the measure of efficiency in use of resources (or inputs) in the production of various good and services. A comparison with the peer group or a historical comparison brings out the trend in productivity i.e. the improvement/deterioration in condition during the period under consideration. Some of the important indicators used for assessing ‘productivity’ are capacity utilization and inventory in relation to sales.
CAPACITY UTILIZATION
Sl.
No. CPSE Product
Installed Capacity (as
per latest available data)
Installed
Capacity
(2013-14)
Capacity Utilization
(%)
2013-14 2012-13 2011-12
(1) (2) (3) (4) (5) (6) (7)
1. NTPC Limited Electricity 45548 MW 33015 MW 81.05 83.08 85.00
2. NHDC limited Electrical
Energy
1520 MW 1520 MW 92.69 93.70 93.99
3. North Eastern
Electric Power
Corporation Ltd.
Electricity 1160.50 MW 1130 MW 82.50 84.70 87.14
4. Nuclear Power
Corporation of India
Electrical
Power
5780 MW 4690 MW 83 80 79
5. NHPC Limited Electricity 6507 MW 4857 MW 77.7 85.3 83.3
6. SJVN Limited Electricity 1959.6 MW 1500 MW 105.75 105.15 104.26
7. THDC India Ltd. Electricity 1400 MW 1400 MW 78.68 78.19 80.81
Thus it may be seen that SJVN tops the list with capacity utilization of 105.75 % amongst all power generating CPSEs.
NTPC NHDC NEEPCO NPCIL NHPC SJVN THDC
Instaled Capacity 33015 1520 1130 4690 4857 1500 1400
Capacity Utilisation 81.05 92.69 82.5 83 77.7 105.75 78.68
33
01
5
15
20
11
30
46
90
48
57
15
00
14
00
81.0592.69
82.5 83 77.7
105.75
78.68
020406080
100120
05000100001500020000250003000035000
PAF
CPSE
MW
CAPACITY UTILIZATION
Instaled Capacity Capacity Utilisation
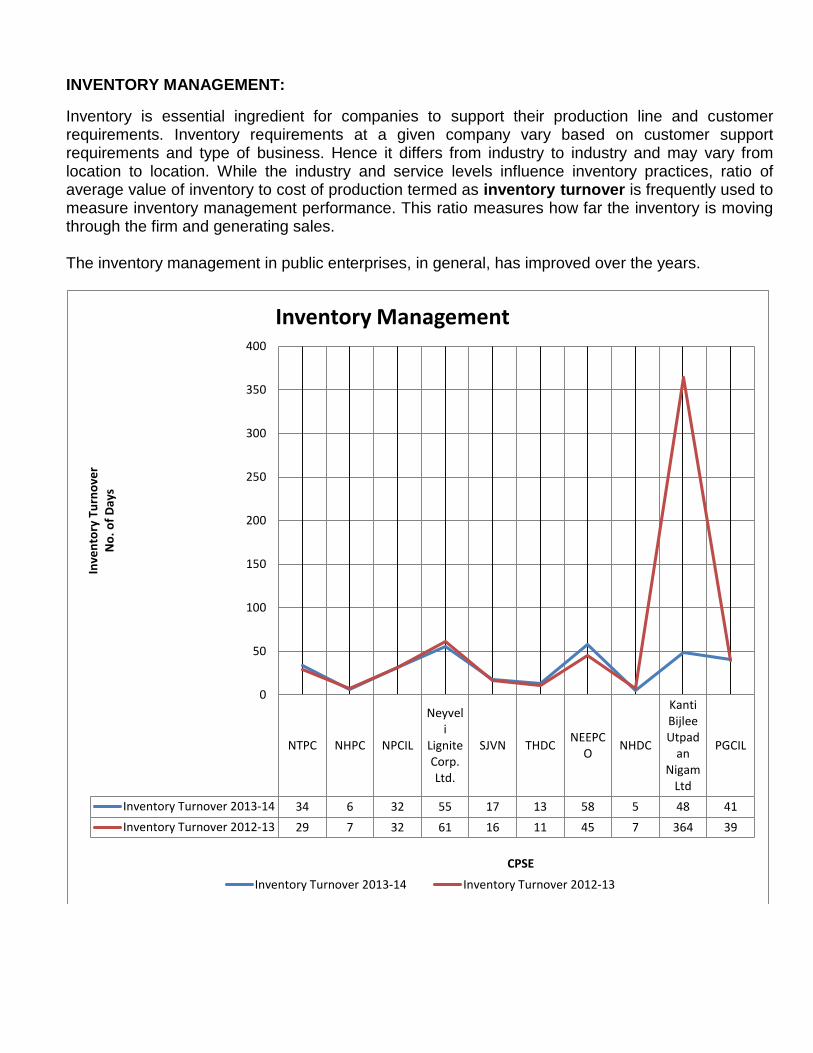
INVENTORY MANAGEMENT:
Inventory is essential ingredient for companies to support their production line and customer requirements. Inventory requirements at a given company vary based on customer support requirements and type of business. Hence it differs from industry to industry and may vary from location to location. While the industry and service levels influence inventory practices, ratio of average value of inventory to cost of production termed as inventory turnover is frequently used to measure inventory management performance. This ratio measures how far the inventory is moving through the firm and generating sales. The inventory management in public enterprises, in general, has improved over the years.
NTPC NHPC NPCIL
Neyveli
LigniteCorp.Ltd.
SJVN THDCNEEPC
ONHDC
KantiBijleeUtpad
anNigam
Ltd
PGCIL
Inventory Turnover 2013-14 34 6 32 55 17 13 58 5 48 41
Inventory Turnover 2012-13 29 7 32 61 16 11 45 7 364 39
0
50
100
150
200
250
300
350
400
Inve
nto
ry T
urn
ove
rN
o. o
f D
ays
CPSE
Inventory Management
Inventory Turnover 2013-14 Inventory Turnover 2012-13
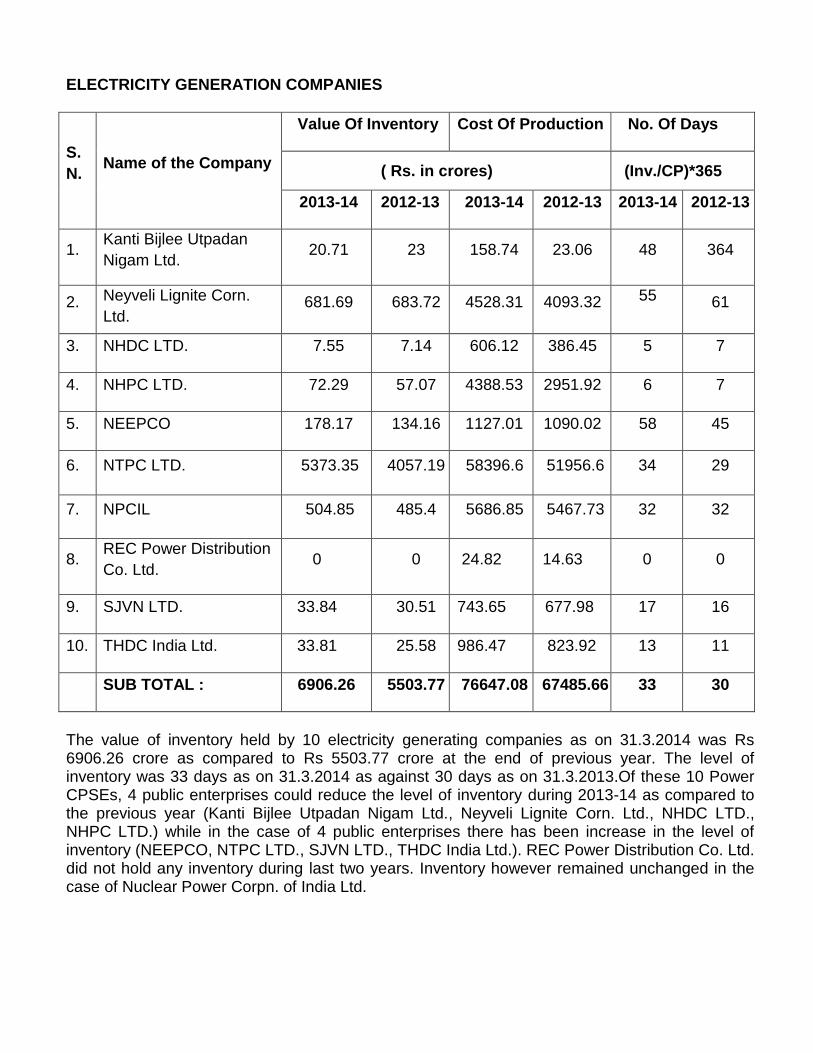
ELECTRICITY GENERATION COMPANIES
S.
N. Name of the Company
Value Of Inventory Cost Of Production No. Of Days
( Rs. in crores) (Inv./CP)*365
2013-14 2012-13 2013-14 2012-13 2013-14 2012-13
1. Kanti Bijlee Utpadan
Nigam Ltd. 20.71 23 158.74 23.06 48 364
2. Neyveli Lignite Corn.
Ltd. 681.69 683.72 4528.31 4093.32 55
61
3. NHDC LTD. 7.55 7.14 606.12 386.45 5 7
4. NHPC LTD. 72.29 57.07 4388.53 2951.92 6 7
5. NEEPCO 178.17 134.16 1127.01 1090.02 58 45
6. NTPC LTD. 5373.35 4057.19 58396.6 51956.6 34 29
7. NPCIL 504.85 485.4 5686.85 5467.73 32 32
8. REC Power Distribution
Co. Ltd. 0 0 24.82 14.63 0 0
9. SJVN LTD. 33.84 30.51 743.65 677.98 17 16
10. THDC India Ltd. 33.81 25.58 986.47 823.92 13 11
SUB TOTAL : 6906.26 5503.77 76647.08 67485.66 33 30
The value of inventory held by 10 electricity generating companies as on 31.3.2014 was Rs 6906.26 crore as compared to Rs 5503.77 crore at the end of previous year. The level of inventory was 33 days as on 31.3.2014 as against 30 days as on 31.3.2013.Of these 10 Power CPSEs, 4 public enterprises could reduce the level of inventory during 2013-14 as compared to the previous year (Kanti Bijlee Utpadan Nigam Ltd., Neyveli Lignite Corn. Ltd., NHDC LTD., NHPC LTD.) while in the case of 4 public enterprises there has been increase in the level of inventory (NEEPCO, NTPC LTD., SJVN LTD., THDC India Ltd.). REC Power Distribution Co. Ltd. did not hold any inventory during last two years. Inventory however remained unchanged in the case of Nuclear Power Corpn. of India Ltd.
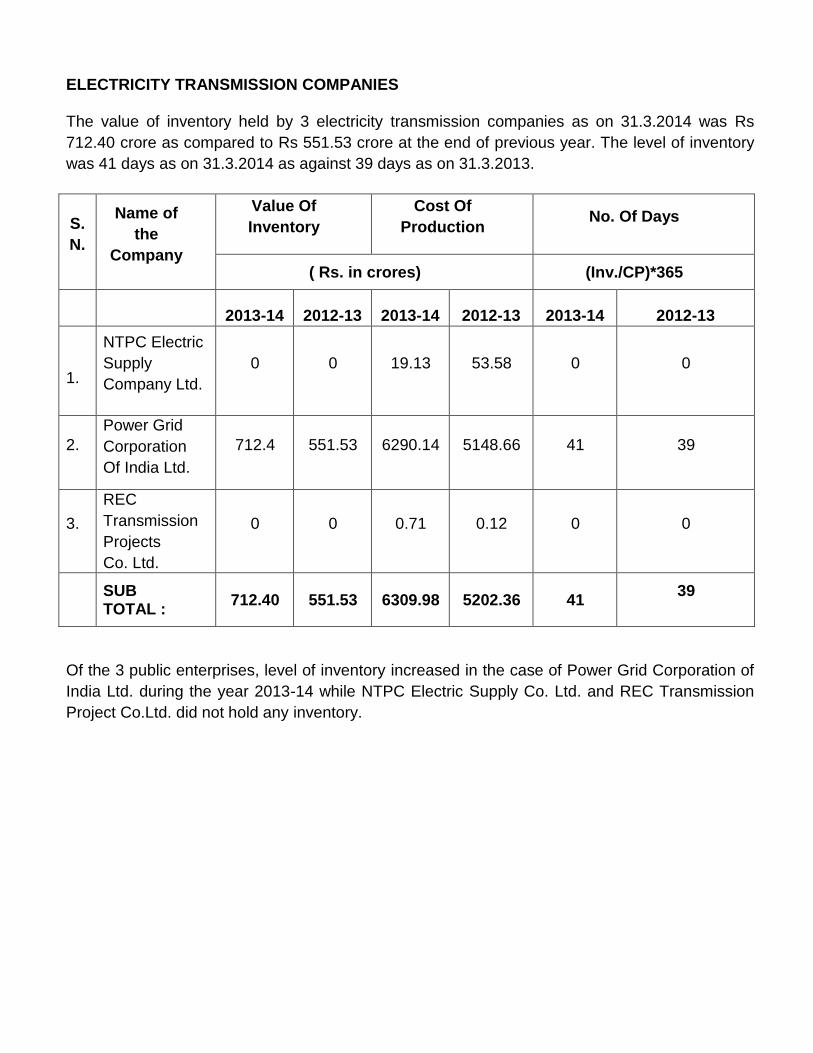
ELECTRICITY TRANSMISSION COMPANIES The value of inventory held by 3 electricity transmission companies as on 31.3.2014 was Rs
712.40 crore as compared to Rs 551.53 crore at the end of previous year. The level of inventory
was 41 days as on 31.3.2014 as against 39 days as on 31.3.2013.
S.
N.
Name of
the
Company
Value Of
Inventory
Cost Of
Production No. Of Days
( Rs. in crores) (Inv./CP)*365
2013-14 2012-13 2013-14 2012-13 2013-14 2012-13
1.
NTPC Electric
Supply
Company Ltd.
0 0 19.13 53.58 0 0
2.
Power Grid
Corporation
Of India Ltd.
712.4 551.53 6290.14 5148.66 41 39
3.
REC
Transmission
Projects
Co. Ltd.
0 0 0.71 0.12 0 0
SUB TOTAL :
712.40 551.53 6309.98 5202.36 41 39
Of the 3 public enterprises, level of inventory increased in the case of Power Grid Corporation of
India Ltd. during the year 2013-14 while NTPC Electric Supply Co. Ltd. and REC Transmission
Project Co.Ltd. did not hold any inventory.
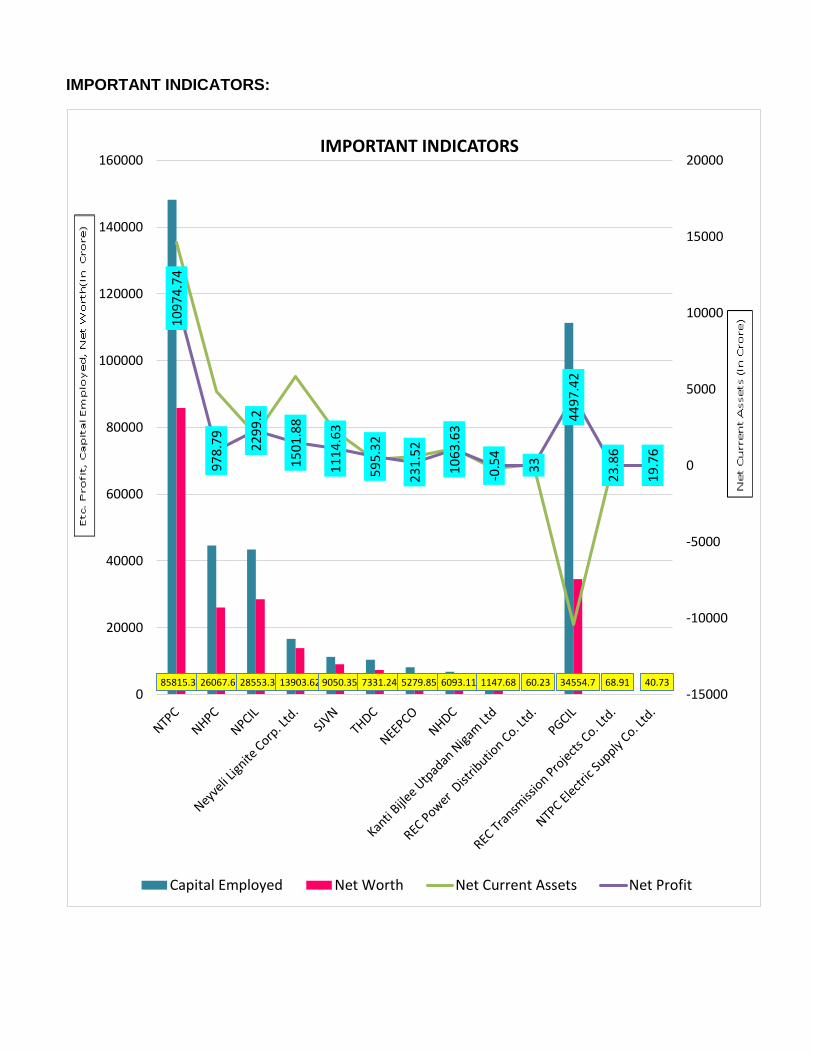
IMPORTANT INDICATORS:
85815.3226067.6528553.3613903.62 9050.35 7331.24 5279.85 6093.11 1147.68 60.23 34554.7 68.91 40.73
10
97
4.7
4
97
8.7
9
22
99
.2
15
01
.88
11
14
.63
59
5.3
2
23
1.5
2
10
63
.63
-0.5
4
33
44
97
.42
23
.86
19
.76
-15000
-10000
-5000
0
5000
10000
15000
20000
0
20000
40000
60000
80000
100000
120000
140000
160000IMPORTANT INDICATORS
Capital Employed Net Worth Net Current Assets Net Profit
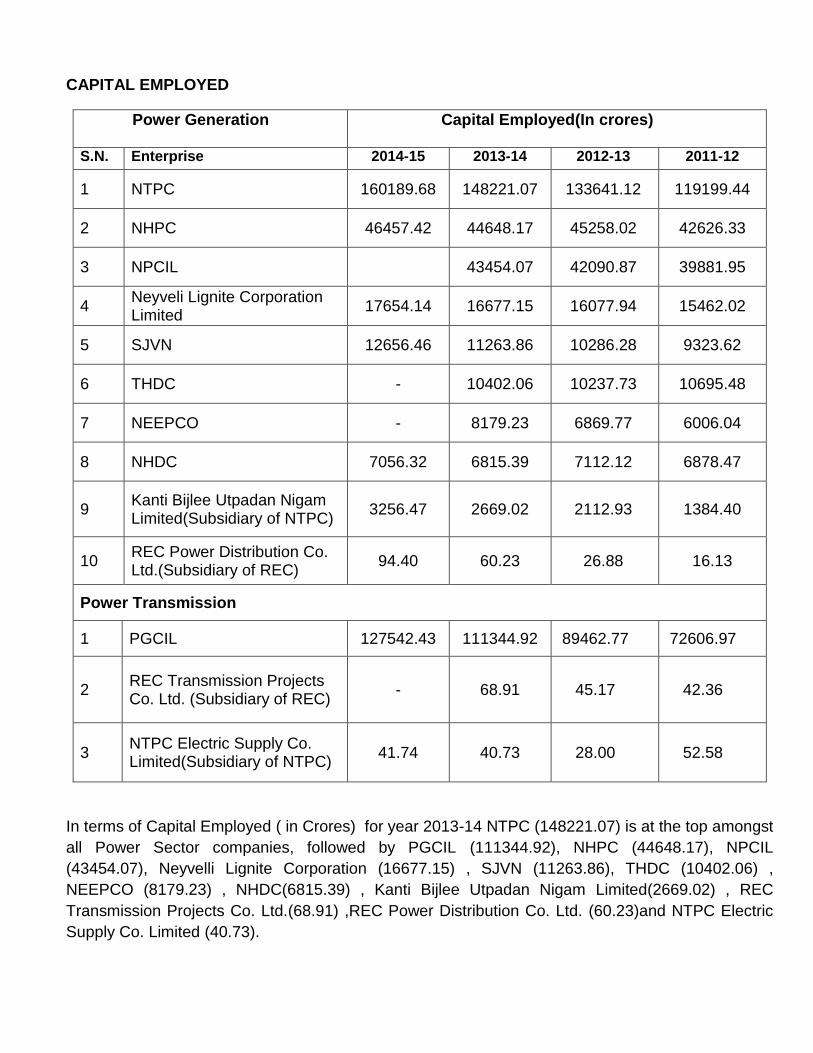
CAPITAL EMPLOYED
Power Generation Capital Employed(In crores)
S.N. Enterprise 2014-15 2013-14 2012-13 2011-12
1 NTPC 160189.68 148221.07 133641.12 119199.44
2 NHPC 46457.42 44648.17 45258.02 42626.33
3 NPCIL 43454.07 42090.87 39881.95
4 Neyveli Lignite Corporation Limited
17654.14 16677.15 16077.94 15462.02
5 SJVN 12656.46 11263.86 10286.28 9323.62
6 THDC - 10402.06 10237.73 10695.48
7 NEEPCO - 8179.23 6869.77 6006.04
8 NHDC 7056.32 6815.39 7112.12 6878.47
9 Kanti Bijlee Utpadan Nigam Limited(Subsidiary of NTPC)
3256.47 2669.02 2112.93 1384.40
10 REC Power Distribution Co. Ltd.(Subsidiary of REC)
94.40 60.23 26.88 16.13
Power Transmission
1 PGCIL 127542.43 111344.92 89462.77 72606.97
2 REC Transmission Projects Co. Ltd. (Subsidiary of REC)
- 68.91 45.17 42.36
3 NTPC Electric Supply Co. Limited(Subsidiary of NTPC)
41.74 40.73 28.00 52.58
In terms of Capital Employed ( in Crores) for year 2013-14 NTPC (148221.07) is at the top amongst
all Power Sector companies, followed by PGCIL (111344.92), NHPC (44648.17), NPCIL
(43454.07), Neyvelli Lignite Corporation (16677.15) , SJVN (11263.86), THDC (10402.06) ,
NEEPCO (8179.23) , NHDC(6815.39) , Kanti Bijlee Utpadan Nigam Limited(2669.02) , REC
Transmission Projects Co. Ltd.(68.91) ,REC Power Distribution Co. Ltd. (60.23)and NTPC Electric
Supply Co. Limited (40.73).
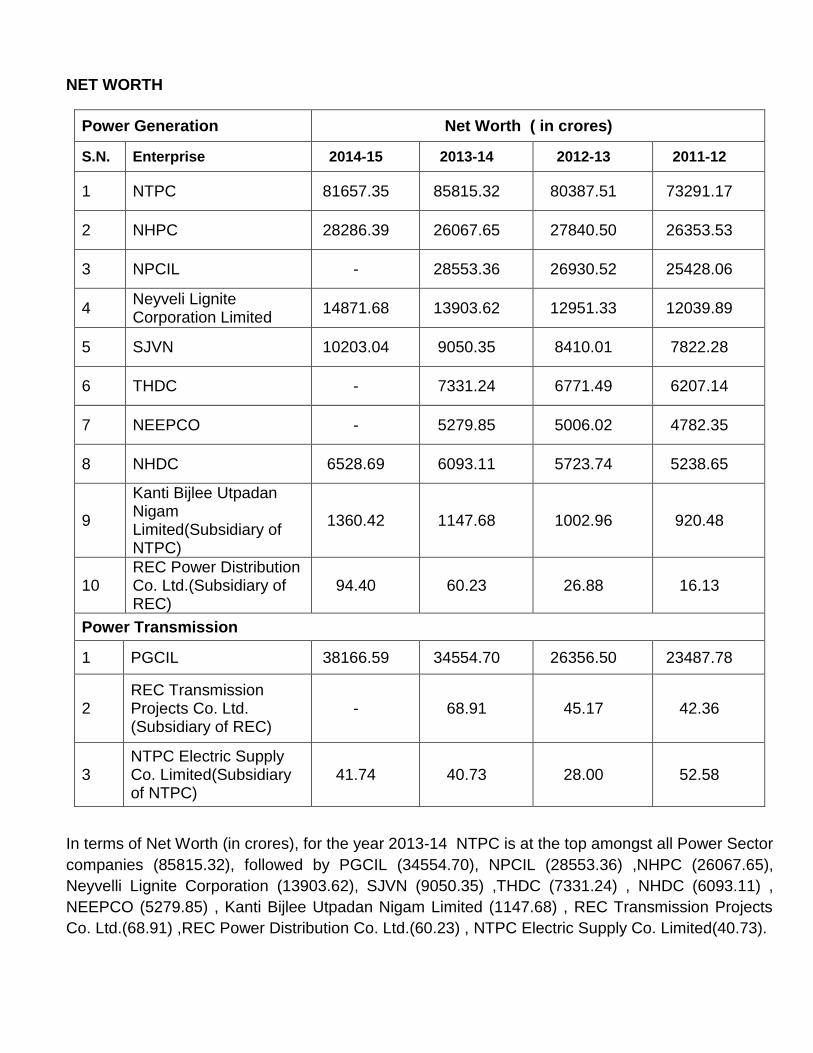
NET WORTH
Power Generation Net Worth ( in crores)
S.N. Enterprise 2014-15 2013-14 2012-13 2011-12
1 NTPC 81657.35 85815.32 80387.51 73291.17
2 NHPC 28286.39 26067.65 27840.50 26353.53
3 NPCIL - 28553.36 26930.52 25428.06
4 Neyveli Lignite Corporation Limited
14871.68 13903.62 12951.33 12039.89
5 SJVN 10203.04 9050.35 8410.01 7822.28
6 THDC - 7331.24 6771.49 6207.14
7 NEEPCO - 5279.85 5006.02 4782.35
8 NHDC 6528.69 6093.11 5723.74 5238.65
9
Kanti Bijlee Utpadan Nigam Limited(Subsidiary of NTPC)
1360.42 1147.68 1002.96 920.48
10 REC Power Distribution Co. Ltd.(Subsidiary of REC)
94.40 60.23 26.88 16.13
Power Transmission
1 PGCIL 38166.59 34554.70 26356.50 23487.78
2 REC Transmission Projects Co. Ltd. (Subsidiary of REC)
- 68.91 45.17 42.36
3 NTPC Electric Supply Co. Limited(Subsidiary of NTPC)
41.74 40.73 28.00 52.58
In terms of Net Worth (in crores), for the year 2013-14 NTPC is at the top amongst all Power Sector
companies (85815.32), followed by PGCIL (34554.70), NPCIL (28553.36) ,NHPC (26067.65),
Neyvelli Lignite Corporation (13903.62), SJVN (9050.35) ,THDC (7331.24) , NHDC (6093.11) ,
NEEPCO (5279.85) , Kanti Bijlee Utpadan Nigam Limited (1147.68) , REC Transmission Projects
Co. Ltd.(68.91) ,REC Power Distribution Co. Ltd.(60.23) , NTPC Electric Supply Co. Limited(40.73).
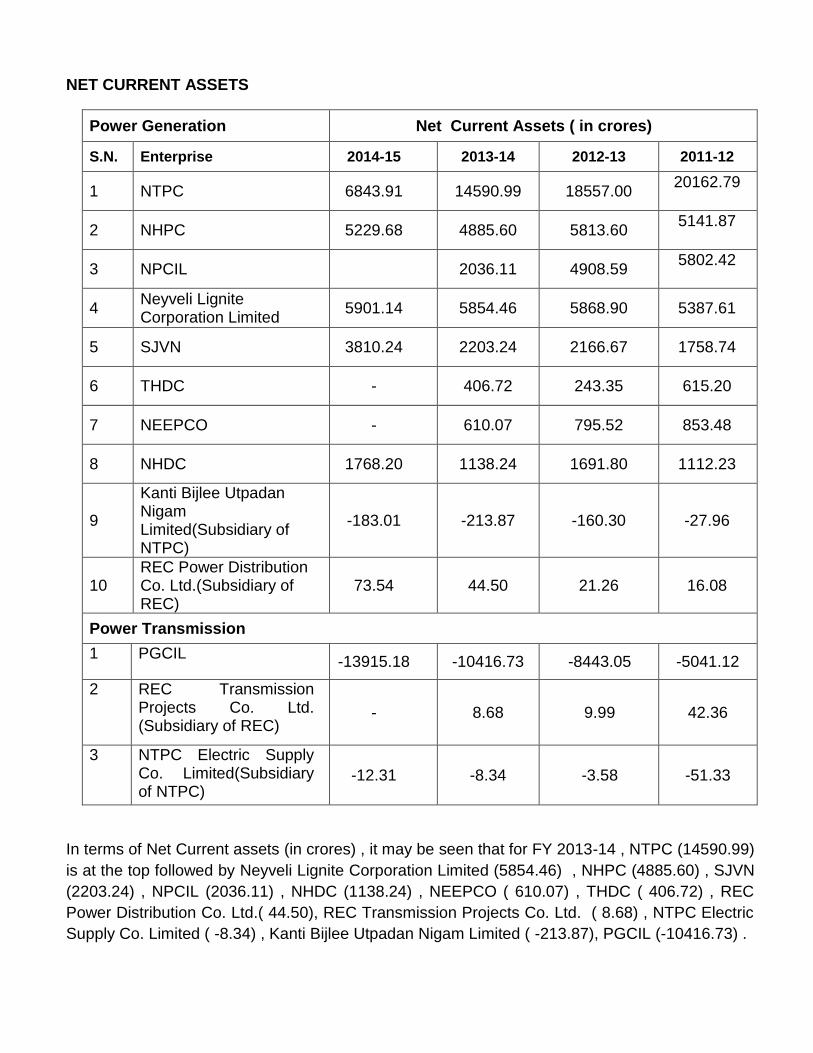
NET CURRENT ASSETS
Power Generation Net Current Assets ( in crores)
S.N. Enterprise 2014-15 2013-14 2012-13 2011-12
1 NTPC 6843.91 14590.99 18557.00 20162.79
2 NHPC 5229.68 4885.60 5813.60 5141.87
3 NPCIL 2036.11 4908.59 5802.42
4 Neyveli Lignite Corporation Limited
5901.14 5854.46 5868.90 5387.61
5 SJVN 3810.24 2203.24 2166.67 1758.74
6 THDC - 406.72 243.35 615.20
7 NEEPCO - 610.07 795.52 853.48
8 NHDC 1768.20 1138.24 1691.80 1112.23
9
Kanti Bijlee Utpadan Nigam Limited(Subsidiary of NTPC)
-183.01 -213.87 -160.30 -27.96
10 REC Power Distribution Co. Ltd.(Subsidiary of REC)
73.54 44.50 21.26 16.08
Power Transmission
1 PGCIL -13915.18 -10416.73 -8443.05 -5041.12
2 REC Transmission Projects Co. Ltd. (Subsidiary of REC)
- 8.68 9.99 42.36
3 NTPC Electric Supply Co. Limited(Subsidiary of NTPC)
-12.31 -8.34 -3.58 -51.33
In terms of Net Current assets (in crores) , it may be seen that for FY 2013-14 , NTPC (14590.99)
is at the top followed by Neyveli Lignite Corporation Limited (5854.46) , NHPC (4885.60) , SJVN
(2203.24) , NPCIL (2036.11) , NHDC (1138.24) , NEEPCO ( 610.07) , THDC ( 406.72) , REC
Power Distribution Co. Ltd.( 44.50), REC Transmission Projects Co. Ltd. ( 8.68) , NTPC Electric
Supply Co. Limited ( -8.34) , Kanti Bijlee Utpadan Nigam Limited ( -213.87), PGCIL (-10416.73) .
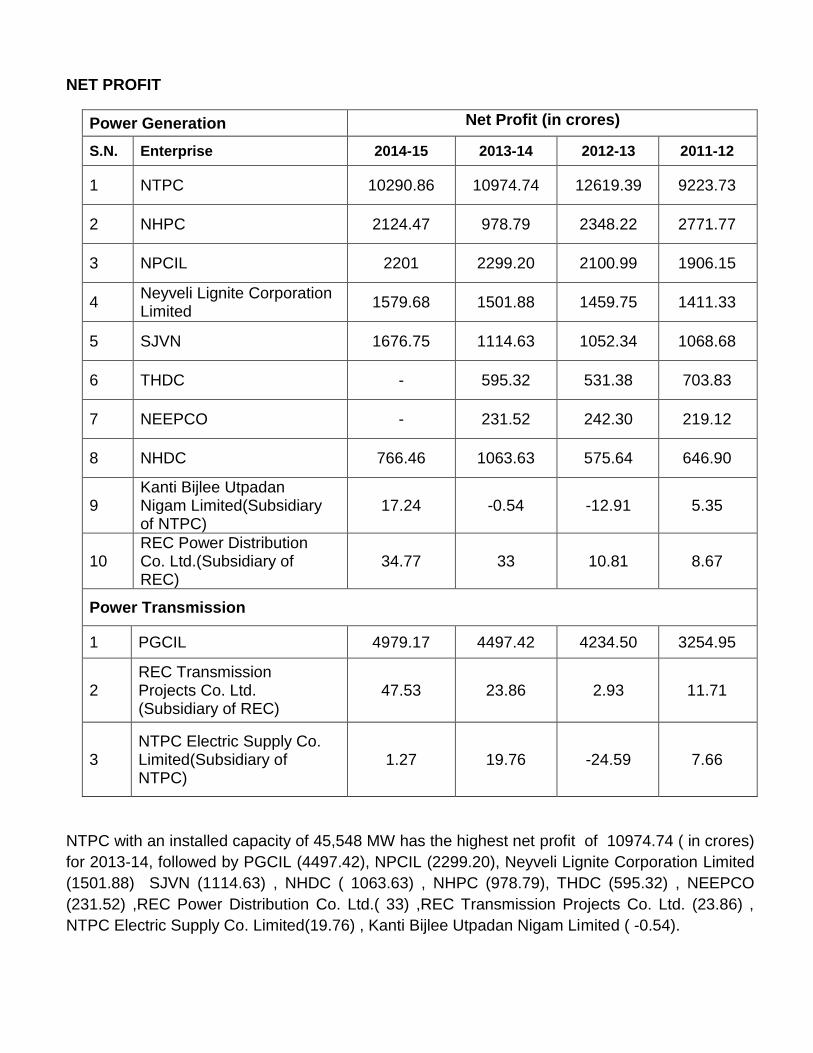
NET PROFIT
Power Generation Net Profit (in crores)
S.N. Enterprise 2014-15 2013-14 2012-13 2011-12
1 NTPC 10290.86 10974.74 12619.39 9223.73
2 NHPC 2124.47 978.79 2348.22 2771.77
3 NPCIL 2201 2299.20 2100.99 1906.15
4 Neyveli Lignite Corporation Limited
1579.68 1501.88 1459.75 1411.33
5 SJVN 1676.75 1114.63 1052.34 1068.68
6 THDC - 595.32 531.38 703.83
7 NEEPCO - 231.52 242.30 219.12
8 NHDC 766.46 1063.63 575.64 646.90
9 Kanti Bijlee Utpadan Nigam Limited(Subsidiary of NTPC)
17.24 -0.54 -12.91 5.35
10 REC Power Distribution Co. Ltd.(Subsidiary of REC)
34.77 33 10.81 8.67
Power Transmission
1 PGCIL 4979.17 4497.42 4234.50 3254.95
2 REC Transmission Projects Co. Ltd. (Subsidiary of REC)
47.53 23.86 2.93 11.71
3 NTPC Electric Supply Co. Limited(Subsidiary of NTPC)
1.27 19.76 -24.59 7.66
NTPC with an installed capacity of 45,548 MW has the highest net profit of 10974.74 ( in crores)
for 2013-14, followed by PGCIL (4497.42), NPCIL (2299.20), Neyveli Lignite Corporation Limited
(1501.88) SJVN (1114.63) , NHDC ( 1063.63) , NHPC (978.79), THDC (595.32) , NEEPCO
(231.52) ,REC Power Distribution Co. Ltd.( 33) ,REC Transmission Projects Co. Ltd. (23.86) ,
NTPC Electric Supply Co. Limited(19.76) , Kanti Bijlee Utpadan Nigam Limited ( -0.54).
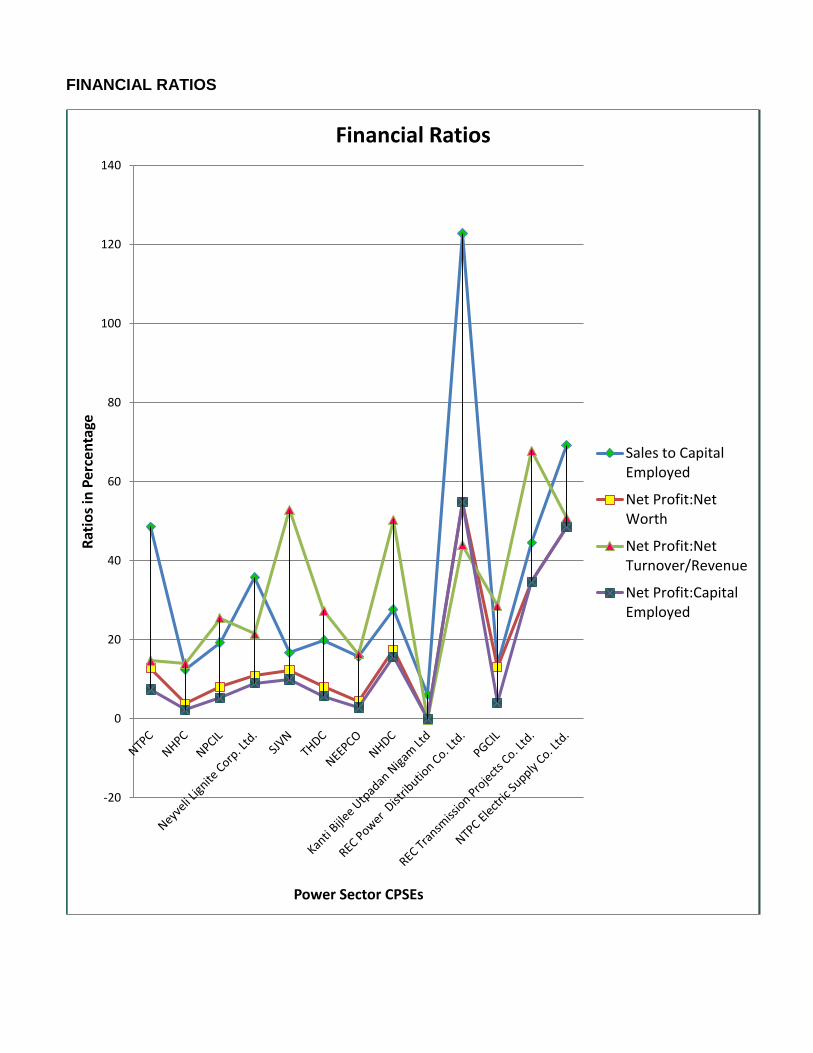
FINANCIAL RATIOS
-20
0
20
40
60
80
100
120
140
Rat
ios
in P
erce
nta
ge
Power Sector CPSEs
Financial Ratios
Sales to CapitalEmployed
Net Profit:NetWorth
Net Profit:NetTurnover/Revenue
Net Profit:CapitalEmployed
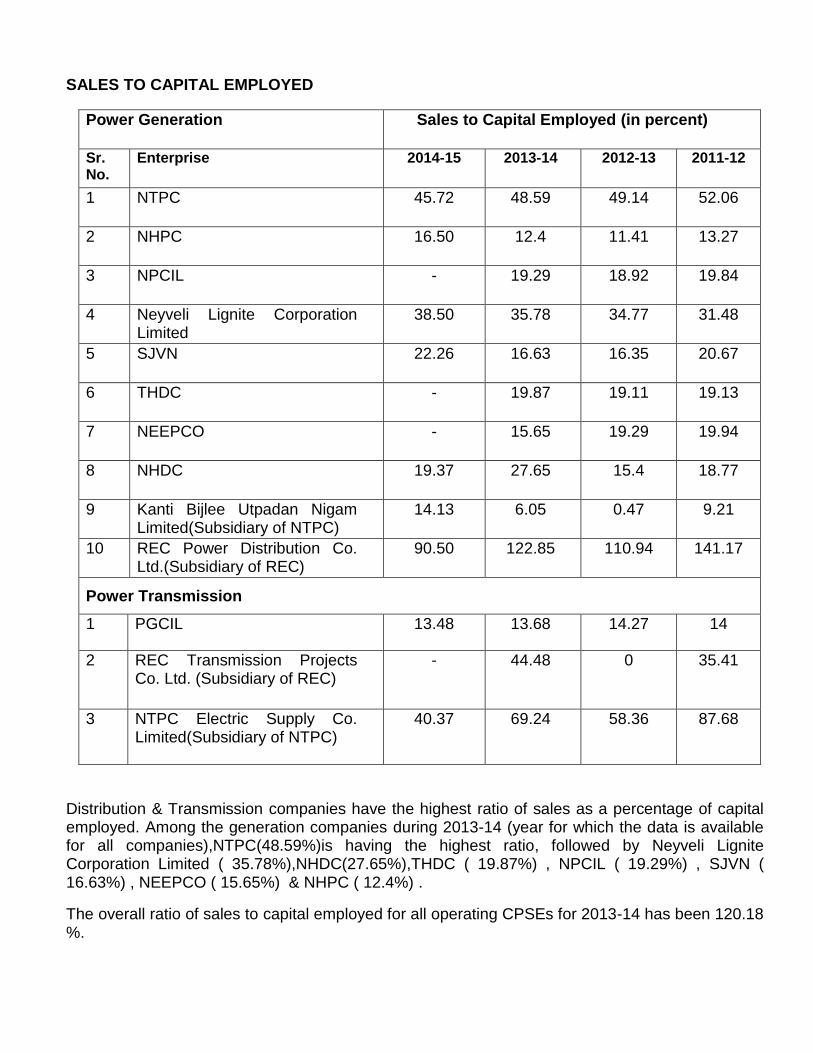
SALES TO CAPITAL EMPLOYED
Power Generation Sales to Capital Employed (in percent)
Sr.No.
Enterprise 2014-15 2013-14 2012-13 2011-12
1 NTPC 45.72 48.59 49.14 52.06
2 NHPC 16.50 12.4 11.41 13.27
3 NPCIL - 19.29 18.92 19.84
4 Neyveli Lignite Corporation Limited
38.50 35.78 34.77 31.48
5 SJVN 22.26 16.63 16.35 20.67
6 THDC - 19.87 19.11 19.13
7 NEEPCO - 15.65 19.29 19.94
8 NHDC 19.37 27.65 15.4 18.77
9 Kanti Bijlee Utpadan Nigam Limited(Subsidiary of NTPC)
14.13 6.05 0.47 9.21
10 REC Power Distribution Co. Ltd.(Subsidiary of REC)
90.50 122.85 110.94 141.17
Power Transmission
1 PGCIL 13.48 13.68 14.27 14
2 REC Transmission Projects Co. Ltd. (Subsidiary of REC)
- 44.48 0 35.41
3 NTPC Electric Supply Co. Limited(Subsidiary of NTPC)
40.37 69.24 58.36 87.68
Distribution & Transmission companies have the highest ratio of sales as a percentage of capital employed. Among the generation companies during 2013-14 (year for which the data is available for all companies),NTPC(48.59%)is having the highest ratio, followed by Neyveli Lignite Corporation Limited ( 35.78%),NHDC(27.65%),THDC ( 19.87%) , NPCIL ( 19.29%) , SJVN ( 16.63%) , NEEPCO ( 15.65%) & NHPC ( 12.4%) .
The overall ratio of sales to capital employed for all operating CPSEs for 2013-14 has been 120.18 %.
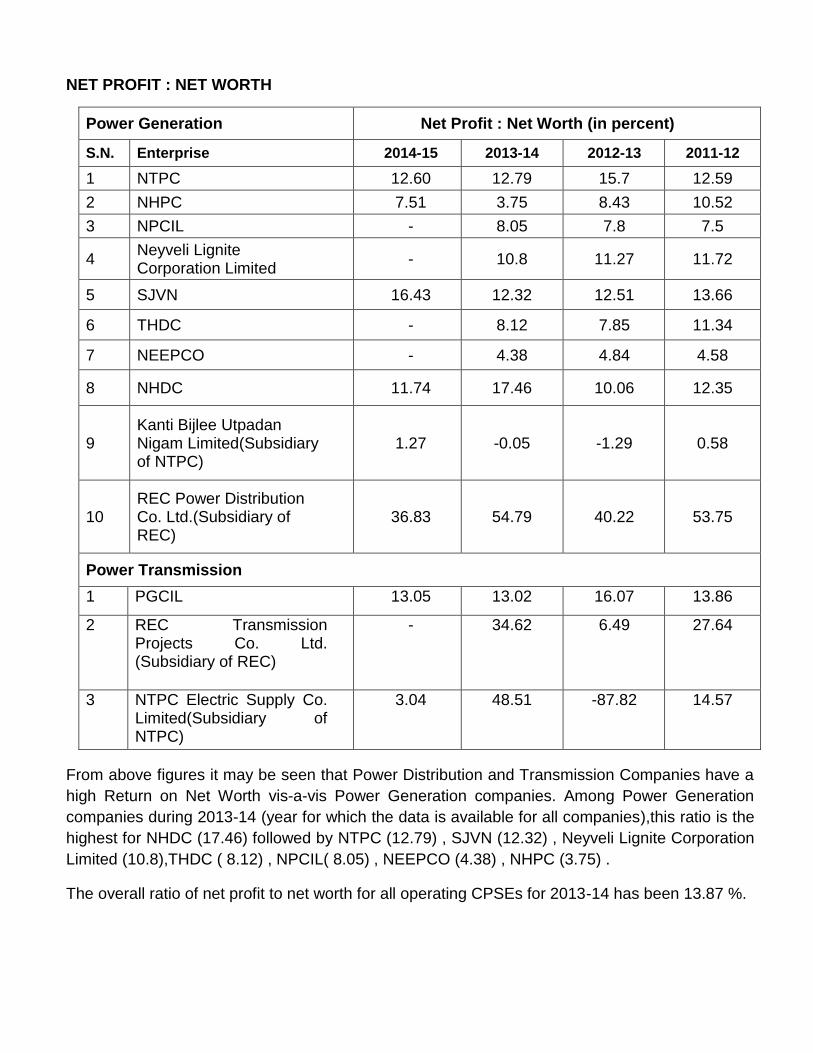
NET PROFIT : NET WORTH
Power Generation Net Profit : Net Worth (in percent)
S.N. Enterprise 2014-15 2013-14 2012-13 2011-12
1 NTPC 12.60 12.79 15.7 12.59
2 NHPC 7.51 3.75 8.43 10.52
3 NPCIL - 8.05 7.8 7.5
4 Neyveli Lignite Corporation Limited
- 10.8 11.27 11.72
5 SJVN 16.43 12.32 12.51 13.66
6 THDC - 8.12 7.85 11.34
7 NEEPCO - 4.38 4.84 4.58
8 NHDC 11.74 17.46 10.06 12.35
9 Kanti Bijlee Utpadan Nigam Limited(Subsidiary of NTPC)
1.27 -0.05 -1.29 0.58
10 REC Power Distribution Co. Ltd.(Subsidiary of REC)
36.83 54.79 40.22 53.75
Power Transmission
1 PGCIL 13.05 13.02 16.07 13.86
2 REC Transmission Projects Co. Ltd. (Subsidiary of REC)
- 34.62 6.49 27.64
3 NTPC Electric Supply Co. Limited(Subsidiary of NTPC)
3.04 48.51 -87.82 14.57
From above figures it may be seen that Power Distribution and Transmission Companies have a
high Return on Net Worth vis-a-vis Power Generation companies. Among Power Generation
companies during 2013-14 (year for which the data is available for all companies),this ratio is the
highest for NHDC (17.46) followed by NTPC (12.79) , SJVN (12.32) , Neyveli Lignite Corporation
Limited (10.8),THDC ( 8.12) , NPCIL( 8.05) , NEEPCO (4.38) , NHPC (3.75) .
The overall ratio of net profit to net worth for all operating CPSEs for 2013-14 has been 13.87 %.
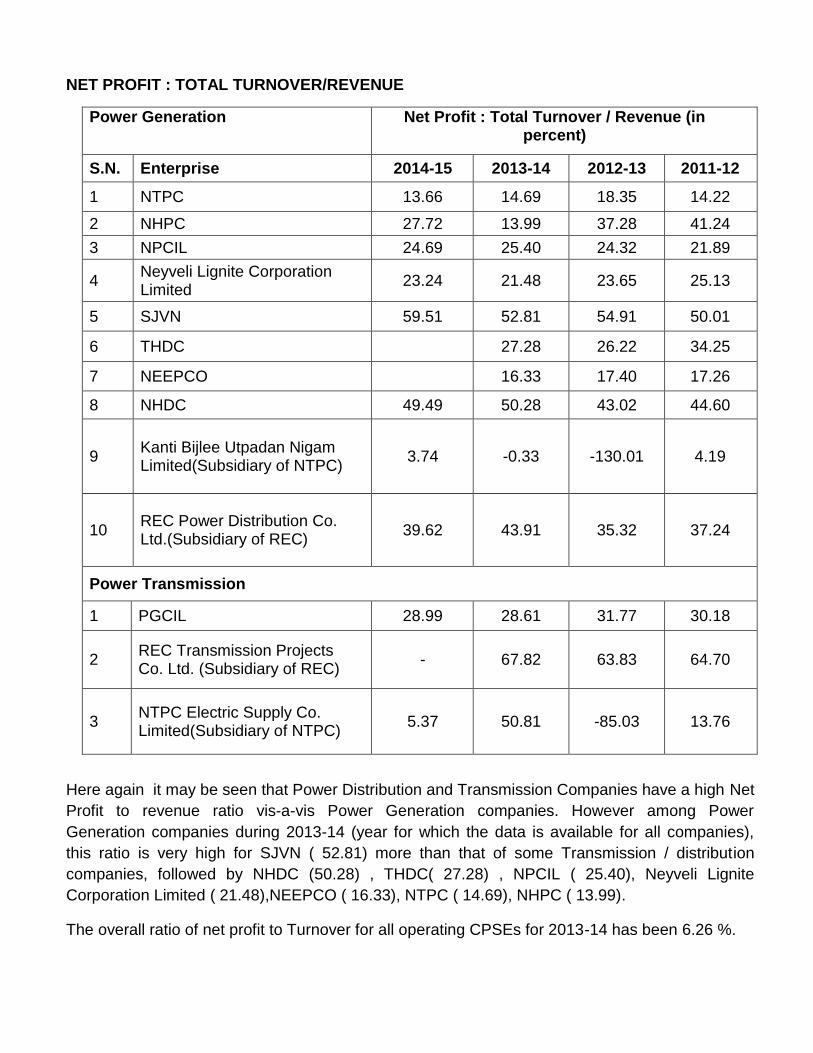
NET PROFIT : TOTAL TURNOVER/REVENUE
Power Generation Net Profit : Total Turnover / Revenue (in percent)
S.N. Enterprise 2014-15 2013-14 2012-13 2011-12
1 NTPC 13.66 14.69 18.35 14.22
2 NHPC 27.72 13.99 37.28 41.24
3 NPCIL 24.69 25.40 24.32 21.89
4 Neyveli Lignite Corporation Limited
23.24 21.48 23.65 25.13
5 SJVN 59.51 52.81 54.91 50.01
6 THDC 27.28 26.22 34.25
7 NEEPCO 16.33 17.40 17.26
8 NHDC 49.49 50.28 43.02 44.60
9 Kanti Bijlee Utpadan Nigam Limited(Subsidiary of NTPC)
3.74 -0.33 -130.01 4.19
10 REC Power Distribution Co. Ltd.(Subsidiary of REC)
39.62 43.91 35.32 37.24
Power Transmission
1 PGCIL 28.99 28.61 31.77 30.18
2 REC Transmission Projects Co. Ltd. (Subsidiary of REC)
- 67.82 63.83 64.70
3 NTPC Electric Supply Co. Limited(Subsidiary of NTPC)
5.37 50.81 -85.03 13.76
Here again it may be seen that Power Distribution and Transmission Companies have a high Net
Profit to revenue ratio vis-a-vis Power Generation companies. However among Power
Generation companies during 2013-14 (year for which the data is available for all companies),
this ratio is very high for SJVN ( 52.81) more than that of some Transmission / distribution
companies, followed by NHDC (50.28) , THDC( 27.28) , NPCIL ( 25.40), Neyveli Lignite
Corporation Limited ( 21.48),NEEPCO ( 16.33), NTPC ( 14.69), NHPC ( 13.99).
The overall ratio of net profit to Turnover for all operating CPSEs for 2013-14 has been 6.26 %.
NET PROFIT : CAPITAL EMPLOYED
Power Generation Net Profit : Capital Employed (in percent)
S.N. Enterprise 2014-15 2013-14 2012-13 2011-12
1 NTPC 6.42 7.40 9.44 7.74
2 NHPC 4.57 2.19 5.19 6.50
3 NPCIL 5.29 4.99 4.78
4 Neyveli Lignite Corporation Limited
8.95 9.01 9.08 9.13
5 SJVN 13.25 9.90 10.23 11.46
6 THDC 5.72 5.19 6.58
7 NEEPCO 2.83 3.53 3.65
8 NHDC 10.86 15.61 8.09 9.40
9 Kanti Bijlee Utpadan Nigam Limited(Subsidiary of NTPC)
0.53 -0.02 -0.61 0.39
10 REC Power Distribution Co. Ltd.(Subsidiary of REC)
36.83 54.79 40.22 53.75
Power Transmission
1 PGCIL 3.90 4.04 4.73 4.48
2 REC Transmission Projects Co. Ltd. (Subsidiary of REC)
34.62 6.49 27.64
3 NTPC Electric Supply Co. Limited(Subsidiary of NTPC)
3.04 48.51 -87.82 14.57
Power Distribution and Transmission Companies (except PGCIL) have a high Return on Capital
Employed vis-a-vis Power Generation companies. However among Power Generation
companies during 2013-14 (year for which the data is available for all companies), this ratio is the
highest for NHDC (15.61), followed by SJVN(9.90) &) Neyveli Lignite Corporation Limited (9.01).
The overall ratio of net profit to capital employed for all operating CPSEs for 2013-14 has been 7.53 %.
EMPLOYMENT(STATUS W.R.T ALL CPSES)
As on 31.3.2014, the 290 CPSEs employed over 13.51 lakh people (excluding contract workers) as compared to 14.02 lakh in 2012-13. The total strength of employees in PSEs has gone down by 50,213 persons due to superannuation, voluntary retirement etc. The salary and wages in all the CPSEs, at the same time went up during the year from Rs 1,16,363 crore in 2012-13 to Rs 1,21,038 crore in 2013-14 showing a growth of 4.02%. Per capita salary, wages and employees expenses increased to Rs 8,88,305 in 2013-14 from Rs 8,30,349 in the year 2012-13. Around 30% of the manpower of CPSEs belongs to managerial and supervisory cadres. The CPSEs, thus, have a highly skilled workforce, which is one of their basic strengths. Total number of employees in CPSEs is declining every year since 2006-07 except in the year 2011-12, on other hand per capita emoluments has been increasing. The per capita emolument which was Rs 3,25,869/ per annum in 2006-07 has increased to Rs 8,88,305/- per annum in year 2013-14. Employment and Average Annual Emoluments in CPSEs
Year Employees (in lakh)
(Excluding contract workers) Total Emoluments
(in crore)
Per capita Emoluments(Rupees)
2006-07 16.14 52586 325869
2007-08 15.65 64306 410898
2008-09 15.33 83045 541716
2009-10 14.90 87792 589210
2010-11 14.40 98402 683347
2011-12 14.50 105648 728606
2012-13 14.02 116363 830349
2013-14 13.51 121038 888305
EMPLOYMENT ( STATUS W.R.T POWER CPSES)
Power Generation Total Regular Employees
Sr.No. Enterprise ( Installed Capacity) 2014-15 2013-14 2012-13 2011-12
1 NTPC(45,548 MW ) 24372 23411 23872 24018
2 NHPC( 6507 MW) 9211 9845 10419 11028
3 NPCIL( 5780 MW) 11635 11772 11596 11677
4 Neyveli Lignite Corporation Limited ( 2740 MW)
16445 16849 17364 17733
5 SJVN( 1959.6 MW) 1819 1874 1797 1826
6 THDC ( 1400 MW) 2024 2067 2099 2145
7 NEEPCO ( 1160.50 MW) 2597 2729 2697 2848
8 NHDC ( 1520 MW) 533 540 547 553
9 Kanti Bijlee Utpadan Nigam Limited(Subsidiary of NTPC)- (220 MW)
- 195 168 152
10 REC Power Distribution Co. Ltd.(Subsidiary of REC)
- 0 11 141
Power Transmission
1 PGCIL - 8694 8909 9670
2 REC Transmission Projects Co. Ltd. (Subsidiary of REC)
- 0 0 0
3 NTPC Electric Supply Co. Limited(Subsidiary of NTPC)
- 87 122 151
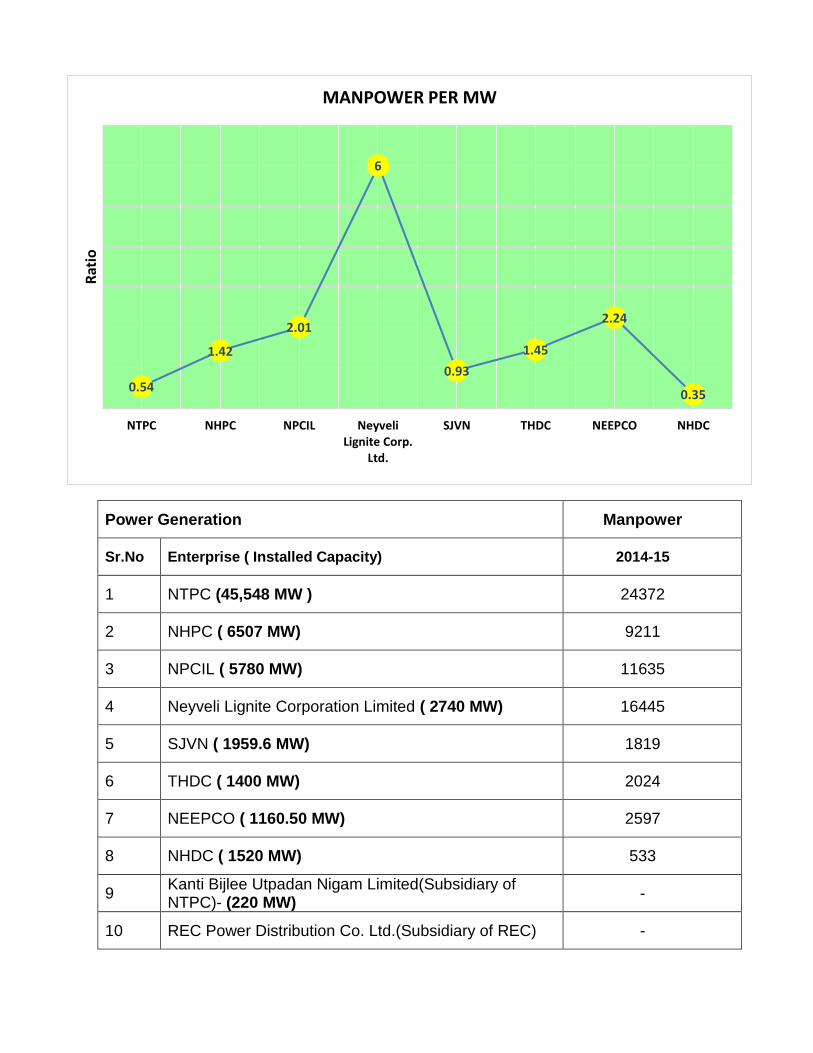
Power Generation Manpower
Sr.No Enterprise ( Installed Capacity) 2014-15
1 NTPC (45,548 MW ) 24372
2 NHPC ( 6507 MW) 9211
3 NPCIL ( 5780 MW) 11635
4 Neyveli Lignite Corporation Limited ( 2740 MW) 16445
5 SJVN ( 1959.6 MW) 1819
6 THDC ( 1400 MW) 2024
7 NEEPCO ( 1160.50 MW) 2597
8 NHDC ( 1520 MW) 533
9 Kanti Bijlee Utpadan Nigam Limited(Subsidiary of NTPC)- (220 MW)
-
10 REC Power Distribution Co. Ltd.(Subsidiary of REC) -
0.54
1.42
2.01
6
0.93
1.45
2.24
0.35
NTPC NHPC NPCIL NeyveliLignite Corp.
Ltd.
SJVN THDC NEEPCO NHDC
Rat
ioMANPOWER PER MW
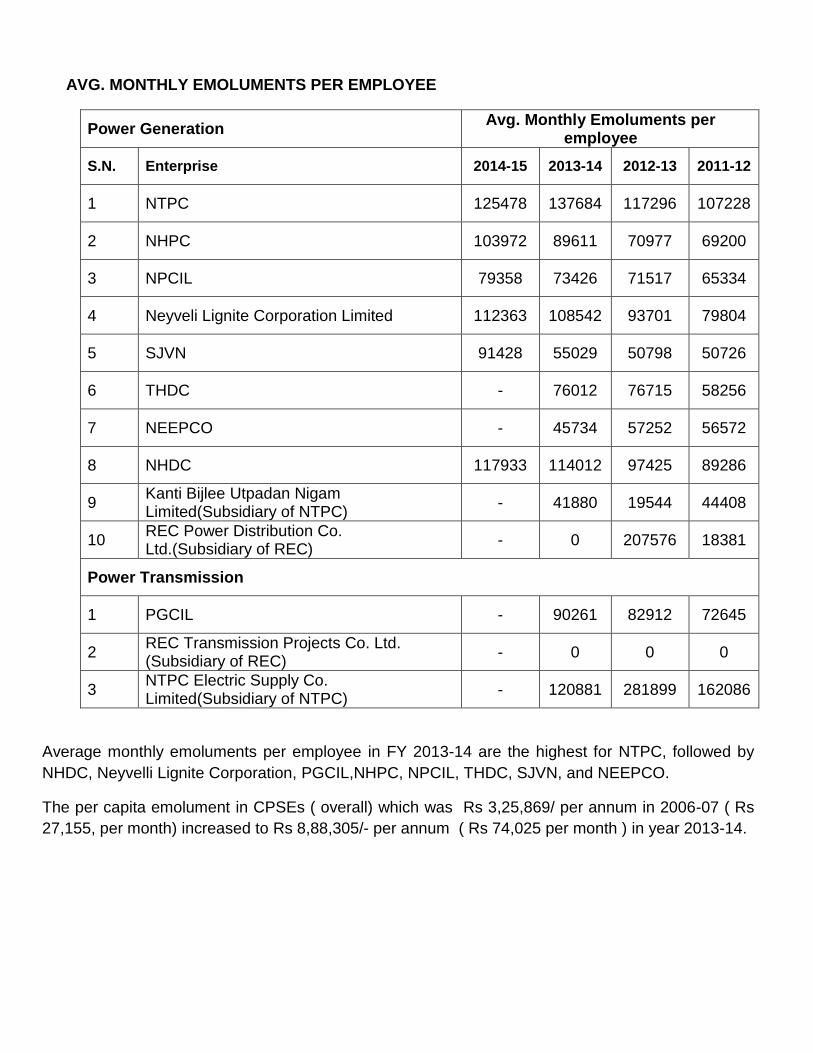
AVG. MONTHLY EMOLUMENTS PER EMPLOYEE
Power Generation Avg. Monthly Emoluments per
employee
S.N. Enterprise 2014-15 2013-14 2012-13 2011-12
1 NTPC 125478 137684 117296 107228
2 NHPC 103972 89611 70977 69200
3 NPCIL 79358 73426 71517 65334
4 Neyveli Lignite Corporation Limited 112363 108542 93701 79804
5 SJVN 91428 55029 50798 50726
6 THDC - 76012 76715 58256
7 NEEPCO - 45734 57252 56572
8 NHDC 117933 114012 97425 89286
9 Kanti Bijlee Utpadan Nigam Limited(Subsidiary of NTPC)
- 41880 19544 44408
10 REC Power Distribution Co. Ltd.(Subsidiary of REC)
- 0 207576 18381
Power Transmission
1 PGCIL - 90261 82912 72645
2 REC Transmission Projects Co. Ltd. (Subsidiary of REC)
- 0 0 0
3 NTPC Electric Supply Co. Limited(Subsidiary of NTPC)
- 120881 281899 162086
Average monthly emoluments per employee in FY 2013-14 are the highest for NTPC, followed by
NHDC, Neyvelli Lignite Corporation, PGCIL,NHPC, NPCIL, THDC, SJVN, and NEEPCO.
The per capita emolument in CPSEs ( overall) which was Rs 3,25,869/ per annum in 2006-07 ( Rs
27,155, per month) increased to Rs 8,88,305/- per annum ( Rs 74,025 per month ) in year 2013-14.
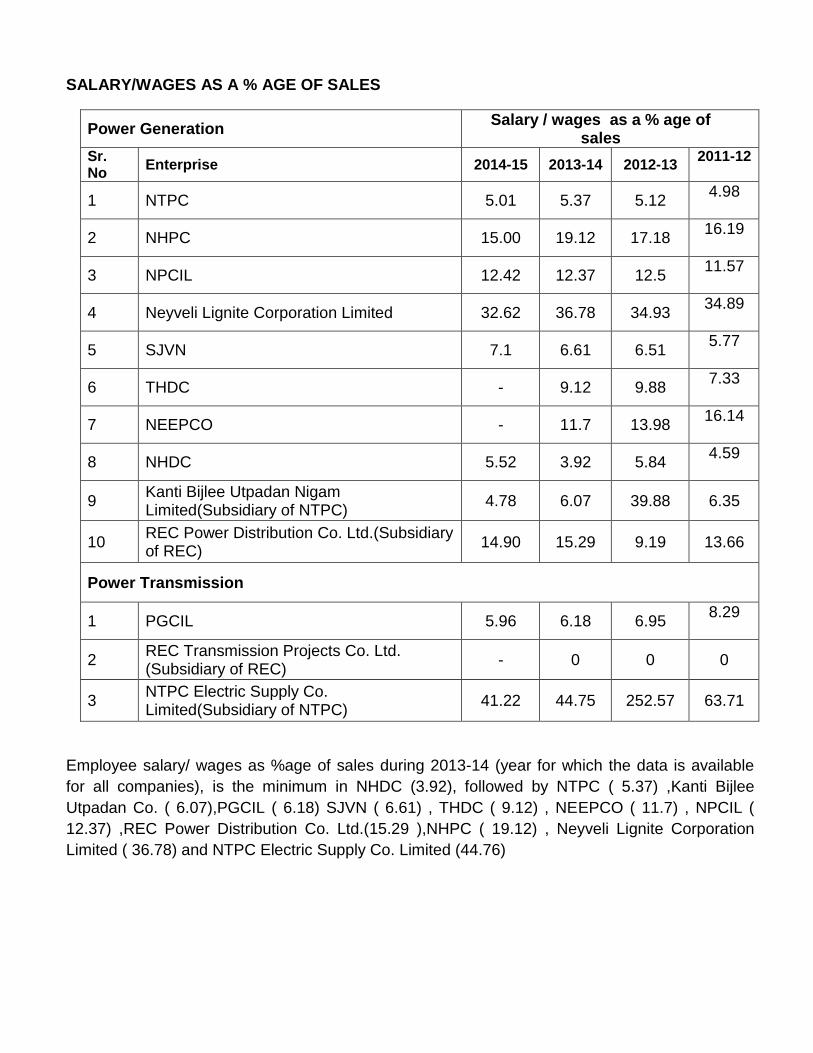
SALARY/WAGES AS A % AGE OF SALES
Power Generation Salary / wages as a % age of
sales Sr.No
Enterprise 2014-15 2013-14 2012-13 2011-12
1 NTPC 5.01 5.37 5.12 4.98
2 NHPC 15.00 19.12 17.18 16.19
3 NPCIL 12.42 12.37 12.5 11.57
4 Neyveli Lignite Corporation Limited 32.62 36.78 34.93 34.89
5 SJVN 7.1 6.61 6.51 5.77
6 THDC - 9.12 9.88 7.33
7 NEEPCO - 11.7 13.98 16.14
8 NHDC 5.52 3.92 5.84 4.59
9 Kanti Bijlee Utpadan Nigam Limited(Subsidiary of NTPC)
4.78 6.07 39.88 6.35
10 REC Power Distribution Co. Ltd.(Subsidiary of REC)
14.90 15.29 9.19 13.66
Power Transmission
1 PGCIL 5.96 6.18 6.95 8.29
2 REC Transmission Projects Co. Ltd. (Subsidiary of REC)
- 0 0 0
3 NTPC Electric Supply Co. Limited(Subsidiary of NTPC)
41.22 44.75 252.57 63.71
Employee salary/ wages as %age of sales during 2013-14 (year for which the data is available
for all companies), is the minimum in NHDC (3.92), followed by NTPC ( 5.37) ,Kanti Bijlee
Utpadan Co. ( 6.07),PGCIL ( 6.18) SJVN ( 6.61) , THDC ( 9.12) , NEEPCO ( 11.7) , NPCIL (
12.37) ,REC Power Distribution Co. Ltd.(15.29 ),NHPC ( 19.12) , Neyveli Lignite Corporation
Limited ( 36.78) and NTPC Electric Supply Co. Limited (44.76)
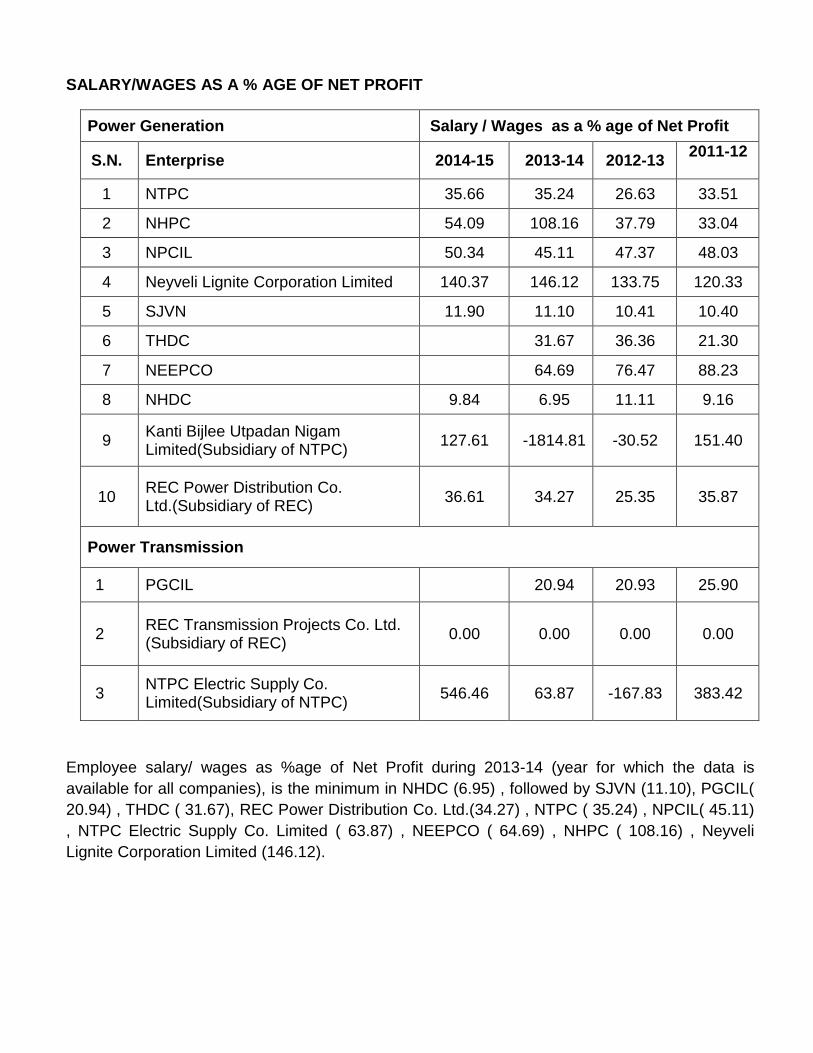
SALARY/WAGES AS A % AGE OF NET PROFIT
Power Generation Salary / Wages as a % age of Net Profit
S.N. Enterprise 2014-15 2013-14 2012-13 2011-12
1 NTPC 35.66 35.24 26.63 33.51
2 NHPC 54.09 108.16 37.79 33.04
3 NPCIL 50.34 45.11 47.37 48.03
4 Neyveli Lignite Corporation Limited 140.37 146.12 133.75 120.33
5 SJVN 11.90 11.10 10.41 10.40
6 THDC 31.67 36.36 21.30
7 NEEPCO 64.69 76.47 88.23
8 NHDC 9.84 6.95 11.11 9.16
9 Kanti Bijlee Utpadan Nigam Limited(Subsidiary of NTPC)
127.61 -1814.81 -30.52 151.40
10 REC Power Distribution Co. Ltd.(Subsidiary of REC)
36.61 34.27 25.35 35.87
Power Transmission
1 PGCIL 20.94 20.93 25.90
2 REC Transmission Projects Co. Ltd. (Subsidiary of REC)
0.00 0.00 0.00 0.00
3 NTPC Electric Supply Co. Limited(Subsidiary of NTPC)
546.46 63.87 -167.83 383.42
Employee salary/ wages as %age of Net Profit during 2013-14 (year for which the data is
available for all companies), is the minimum in NHDC (6.95) , followed by SJVN (11.10), PGCIL(
20.94) , THDC ( 31.67), REC Power Distribution Co. Ltd.(34.27) , NTPC ( 35.24) , NPCIL( 45.11)
, NTPC Electric Supply Co. Limited ( 63.87) , NEEPCO ( 64.69) , NHPC ( 108.16) , Neyveli
Lignite Corporation Limited (146.12).
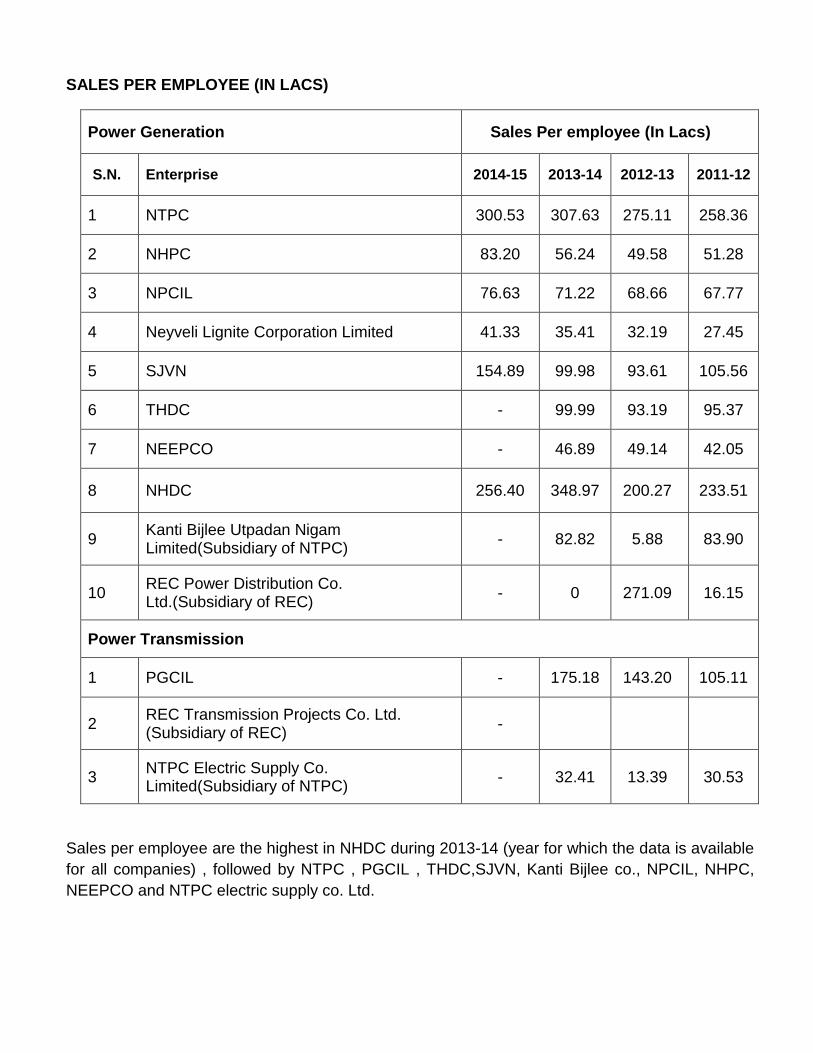
SALES PER EMPLOYEE (IN LACS)
Power Generation Sales Per employee (In Lacs)
S.N. Enterprise 2014-15 2013-14 2012-13 2011-12
1 NTPC 300.53 307.63 275.11 258.36
2 NHPC 83.20 56.24 49.58 51.28
3 NPCIL 76.63 71.22 68.66 67.77
4 Neyveli Lignite Corporation Limited 41.33 35.41 32.19 27.45
5 SJVN 154.89 99.98 93.61 105.56
6 THDC - 99.99 93.19 95.37
7 NEEPCO - 46.89 49.14 42.05
8 NHDC 256.40 348.97 200.27 233.51
9 Kanti Bijlee Utpadan Nigam Limited(Subsidiary of NTPC)
- 82.82 5.88 83.90
10 REC Power Distribution Co. Ltd.(Subsidiary of REC)
- 0 271.09 16.15
Power Transmission
1 PGCIL - 175.18 143.20 105.11
2 REC Transmission Projects Co. Ltd. (Subsidiary of REC)
-
3 NTPC Electric Supply Co. Limited(Subsidiary of NTPC)
- 32.41 13.39 30.53
Sales per employee are the highest in NHDC during 2013-14 (year for which the data is available
for all companies) , followed by NTPC , PGCIL , THDC,SJVN, Kanti Bijlee co., NPCIL, NHPC,
NEEPCO and NTPC electric supply co. Ltd.
In PSE Survey Report 2013-14, 290 CPSEs have been included (234 operating CPSEs and 56
CPSEs under construction) and their ranking on various parameters has also been depicted. In
this context the overall ranking as scored by SJVN on the various parameters and ranking
amongst 13 no. Power CPSEs as above is mentioned as under:
S.N Company Ranking in terms
of PBEET
Ranking in terms of Turnover
Ranking in terms of
employment
Ranking in terms of
Gross Block
1 NTPC 3 7 15 3
2 NHPC 25 41 28 9
3 NPCIL 18 32 24 8
4 Neyveli Lignite Corp. Ltd.
22 40 19 18
5 SJVN 28 64 122 22
6 THDC 38 62 62 24
7 NEEPCO 55 77 52 25
8 NHDC 27 64 151 29
9 Kanti Bijlee Utpadan Nigam Ltd
162 134 177 50
10 REC Power Distribution Co. Ltd.
93 148 0 255
11 PGCIL 10 20 29 5
12 REC Transmission Projects Co. Ltd.
82 173 0 269
13 NTPC Electric Supply Co. Ltd.
109 177 201 249
* * * * * * * *
Productivity is an objective concept which can be measured, ideally against a universal standard.
Within a time period, productivity ratios can be used to compare the firm's performance against
industry-wide data, compare its performance with similar firms and competitors, compare
performance among different departments within the firm, or compare the performance of the firm or
individual departments within the firm with the ratios obtained previously (i.e., is performance
improving or decreasing over time ?)
As such, organizations can monitor productivity for strategic reasons such as corporate planning,
organization improvement, or comparison with competitors. It can also be used for tactical reasons
such as project control or controlling performance to budget. Both Total Productivity ratios as well
as Partial Productivity ratios may be used for productivity improvement of an organization following
the under mentioned steps:
Develop productivity measures for all operations; measurement is the first step in managing and controlling an organization.
Look at the system as a whole in deciding which operations are most critical, it is over-all productivity that is important.
Plan most effective tools and tricks to manage controllable factors of organization’s productivity.
Develop methods for achieving productivity improvement such as soliciting ideas from employees (perhaps organizing teams of workers, engineers, and managers), studying how other firms have increased productivity, and reexamining the way work is done.
Establish reasonable goals for improvement. Make it clear that management supports and encourages productivity Measure improvements and publicize them.
Productivity ratio is the buzz word that is used as a key to frame the ‘Mool Mantras’ of an
organization’s survival and success in the competitive business world, where measuring, analyzing,
comparing and improving the business performance has been an all time tough task for
Managements.
SJVN Report on Productivity Ratios of Power PSUs, in all ways possible would serve to assess
SJVN’s real achievements and would enlist the areas where SJVN Management need to focus for
achieving the objective of SJVN’s continuous growth and betterment.
* * * * * * * *
“Business Survival & Competitiveness”
@ Productivity Ratio