Embed Size (px)
Citation preview
Report on the State of Financial
Inclusion in the Philippines
2016
Bangko Sentral ng Pilipinas
SES FinInc Form No. 02-001 * Version 0 * Updated 29 Jun 2017
Report on the State of Financial Inclusion
in the Philippines
About the Cover
The cover is a reproduction of the artwork entitled “Partnerships against Poverty” by Mr. Bret Faustino R.
Manalo III from the Far Eastern University. The artwork was one of the entries during the Microfinance Art
Competition conducted by the Bangko Sentral ng Pilipinas in 2013. In Mr. Manalo’s words, the painting depicts:
“In this artwork, I intended to emphasize the intensity of colors, you may notice that the lower part of the artwork
is composed of dark colors. It is to show that the laborers at the bottom need to work hard for a brighter
tomorrow (the brighter tomorrow is shown at the top, I used light colors and the element of light). For the
composition elements, I used machine to represent microfinance councils together with the Bangko Sentral ng
Pilipinas. Machines are invented to help people and make things easier, but still hard work is needed. In my
artwork, the machine served as the source of energy for every worker, but still, drive to succeed is needed.”
SES FinInc Form No. 02-001 * Version 0 * Updated 29 Jun 2017
Background
In the Bangko Sentral ng Pilipinas (BSP), we recognize that “a strong and stable
macroeconomic and financial environment, to be truly meaningful, needs to be inclusive, to
create jobs, and to improve welfare. This is why the BSP has been passionate in its pursuit of
its financial inclusion advocacy.”1
Aside from crafting inclusive policies, implementing financial education and consumer
protection campaigns, and conducting advocacy activities, maintaining a comprehensive and
robust data framework is an important aspect of our financial inclusion work.
The Report on the State of Financial Inclusion in the Philippines2 is part of the stock-taking
process of the BSP to assess the levels and trends in financial inclusion in the country. The
report, which is the sixth edition since the maiden release in 2011, serves as an inventory of
the progress made in the past six years (2011-2016) and includes latest available information
as of first half of 2017. It embodies the key characteristics that we believe are important for
financial inclusion data to be useful in evidence-based policymaking:
Disaggregated Broken down into meaningful classification
Accurate Precise and validated
Timely Updated and relevant
Accessible Available to all
The report is structured as follows: Section I describes the financial access situation by
discussing the reach of banks and other financial service access points at the national and
subnational level. Section II covers usage of formal financial products and services, using
available information on deposits, loans, microfinance, microinsurance, and electronic
money. The supporting annexes contain additional information on the different financial
inclusion indicators.
1 BSP Governor Nestor A. Espenilla, Jr. in his inaugural speech as BSP Governor, 3 July 2017 2 Previous reports can be accessed at http://www.bsp.gov.ph/about/advocacies_reports.asp
SES FinInc Form No. 02-001 * Version 0 * Updated 29 Jun 2017
List of Abbreviations and Acronyms
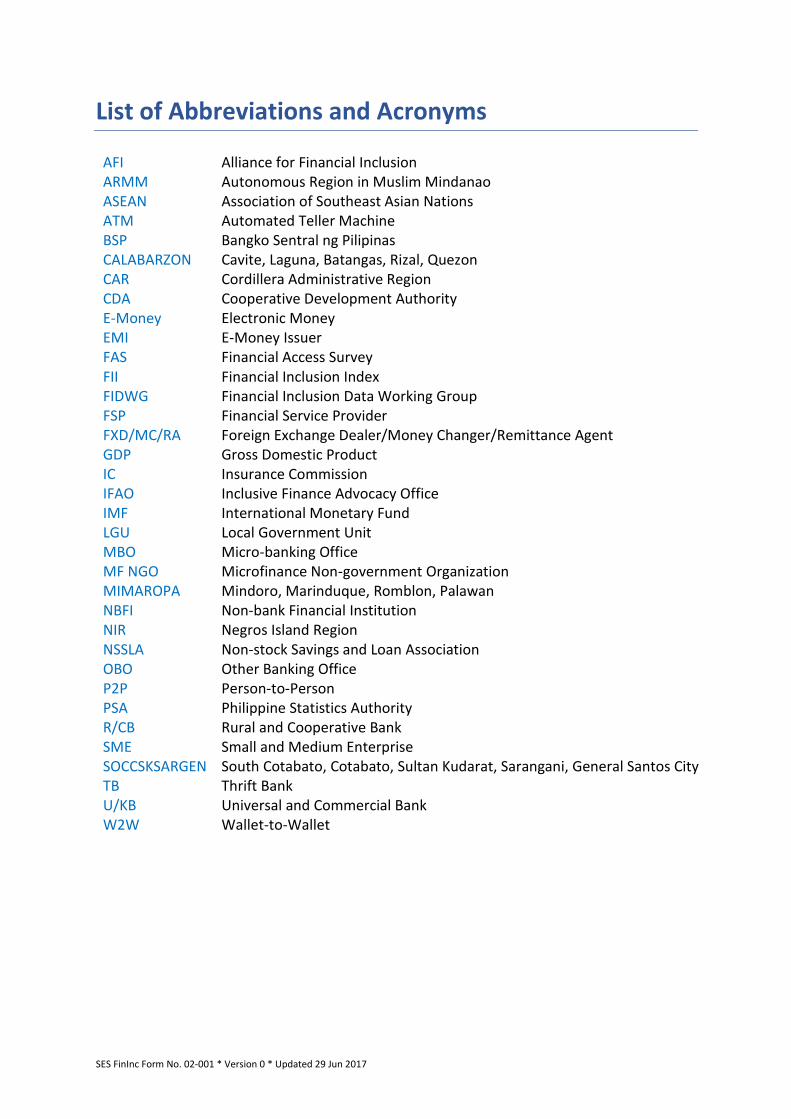
AFI Alliance for Financial Inclusion ARMM Autonomous Region in Muslim Mindanao ASEAN Association of Southeast Asian Nations ATM Automated Teller Machine BSP Bangko Sentral ng Pilipinas CALABARZON Cavite, Laguna, Batangas, Rizal, Quezon CAR Cordillera Administrative Region CDA Cooperative Development Authority E-Money Electronic Money EMI E-Money Issuer FAS Financial Access Survey FII Financial Inclusion Index FIDWG Financial Inclusion Data Working Group FSP Financial Service Provider FXD/MC/RA Foreign Exchange Dealer/Money Changer/Remittance Agent GDP Gross Domestic Product IC Insurance Commission IFAO Inclusive Finance Advocacy Office IMF International Monetary Fund LGU Local Government Unit MBO Micro-banking Office MF NGO Microfinance Non-government Organization MIMAROPA Mindoro, Marinduque, Romblon, Palawan NBFI Non-bank Financial Institution NIR Negros Island Region NSSLA Non-stock Savings and Loan Association OBO Other Banking Office P2P Person-to-Person PSA Philippine Statistics Authority R/CB Rural and Cooperative Bank SME Small and Medium Enterprise SOCCSKSARGEN South Cotabato, Cotabato, Sultan Kudarat, Sarangani, General Santos City TB Thrift Bank U/KB Universal and Commercial Bank W2W Wallet-to-Wallet
The Philippines: An Overview
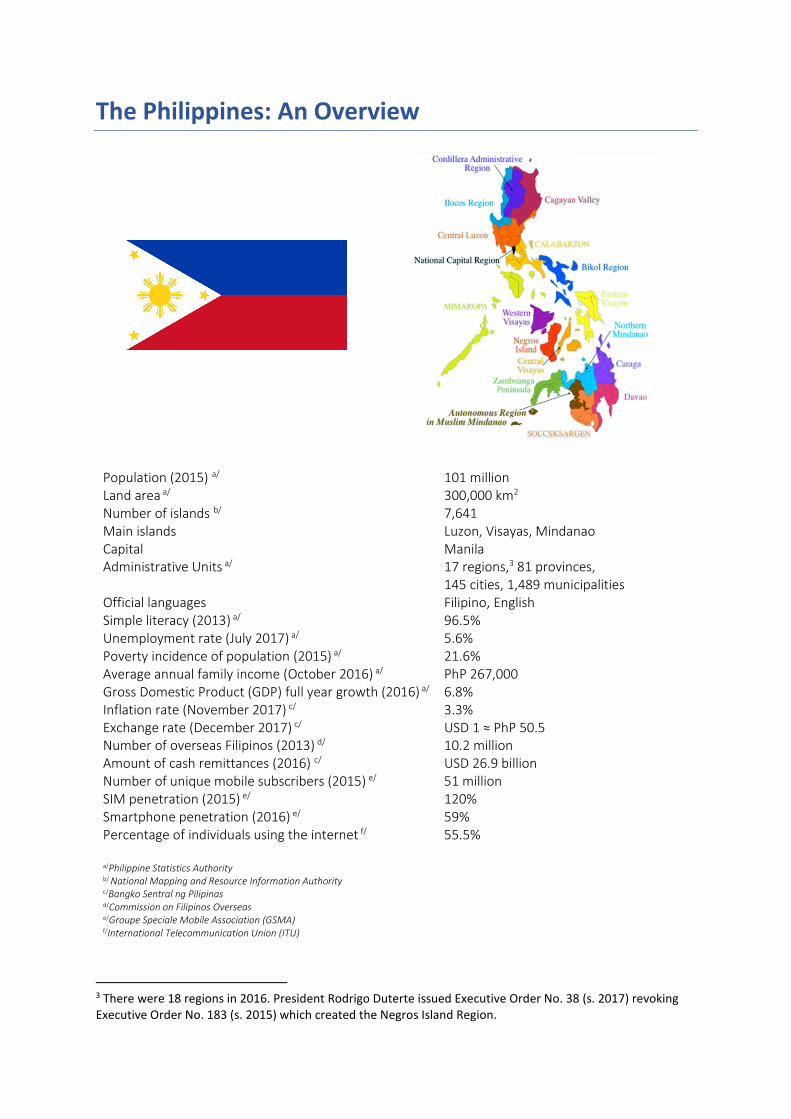
Population (2015) a/ 101 million Land area a/ 300,000 km2 Number of islands b/ 7,641 Main islands Luzon, Visayas, Mindanao Capital Manila Administrative Units a/ 17 regions,3 81 provinces,
145 cities, 1,489 municipalities Official languages Filipino, English Simple literacy (2013) a/ 96.5% Unemployment rate (July 2017) a/ 5.6% Poverty incidence of population (2015) a/ 21.6% Average annual family income (October 2016) a/ PhP 267,000 Gross Domestic Product (GDP) full year growth (2016) a/ 6.8% Inflation rate (November 2017) c/ 3.3% Exchange rate (December 2017) c/ USD 1 ≈ PhP 50.5 Number of overseas Filipinos (2013) d/ 10.2 million Amount of cash remittances (2016) c/ USD 26.9 billion Number of unique mobile subscribers (2015) e/ 51 million SIM penetration (2015) e/ 120% Smartphone penetration (2016) e/ 59% Percentage of individuals using the internet f/ 55.5% a/Philippine Statistics Authority b/ National Mapping and Resource Information Authority c/Bangko Sentral ng Pilipinas d/Commission on Filipinos Overseas e/Groupe Speciale Mobile Association (GSMA) f/International Telecommunication Union (ITU)
3 There were 18 regions in 2016. President Rodrigo Duterte issued Executive Order No. 38 (s. 2017) revoking Executive Order No. 183 (s. 2015) which created the Negros Island Region.
1
Financial Access
Number of banking offices and ATMs
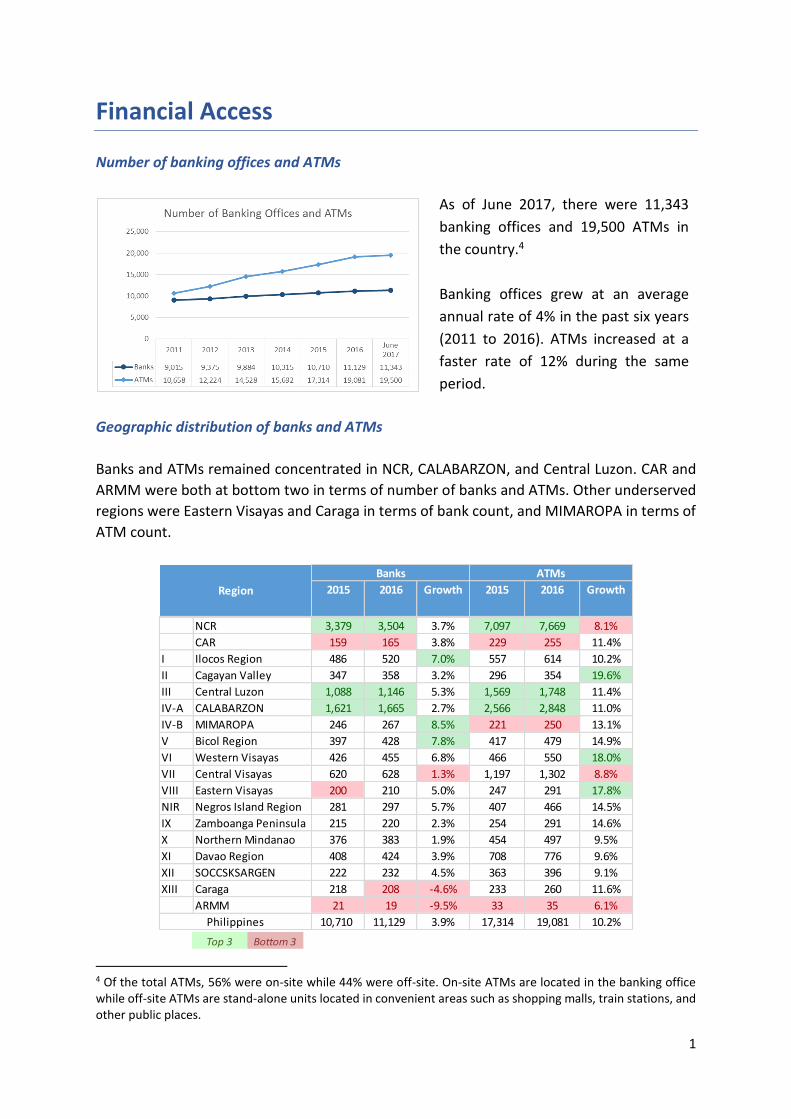
As of June 2017, there were 11,343
banking offices and 19,500 ATMs in
the country.4
Banking offices grew at an average
annual rate of 4% in the past six years
(2011 to 2016). ATMs increased at a
faster rate of 12% during the same
period.
Geographic distribution of banks and ATMs
Banks and ATMs remained concentrated in NCR, CALABARZON, and Central Luzon. CAR and
ARMM were both at bottom two in terms of number of banks and ATMs. Other underserved
regions were Eastern Visayas and Caraga in terms of bank count, and MIMAROPA in terms of
ATM count.
4 Of the total ATMs, 56% were on-site while 44% were off-site. On-site ATMs are located in the banking office while off-site ATMs are stand-alone units located in convenient areas such as shopping malls, train stations, and other public places.
2015 2016 Growth 2015 2016 Growth
NCR 3,379 3,504 3.7% 7,097 7,669 8.1%
CAR 159 165 3.8% 229 255 11.4%
I Ilocos Region 486 520 7.0% 557 614 10.2%
II Cagayan Valley 347 358 3.2% 296 354 19.6%
III Central Luzon 1,088 1,146 5.3% 1,569 1,748 11.4%
IV-A CALABARZON 1,621 1,665 2.7% 2,566 2,848 11.0%
IV-B MIMAROPA 246 267 8.5% 221 250 13.1%
V Bicol Region 397 428 7.8% 417 479 14.9%
VI Western Visayas 426 455 6.8% 466 550 18.0%
VII Central Visayas 620 628 1.3% 1,197 1,302 8.8%
VIII Eastern Visayas 200 210 5.0% 247 291 17.8%
NIR Negros Island Region 281 297 5.7% 407 466 14.5%
IX Zamboanga Peninsula 215 220 2.3% 254 291 14.6%
X Northern Mindanao 376 383 1.9% 454 497 9.5%
XI Davao Region 408 424 3.9% 708 776 9.6%
XII SOCCSKSARGEN 222 232 4.5% 363 396 9.1%
XIII Caraga 218 208 -4.6% 233 260 11.6%
ARMM 21 19 -9.5% 33 35 6.1%
10,710 11,129 3.9% 17,314 19,081 10.2%
Region
Philippines
Banks ATMs
Top 3 Bottom 3
2
The number of banks increased in all regions except Caraga and ARMM where bank count
declined. The number of ATMs grew in all regions, with some regions experiencing higher
growth than the top three.
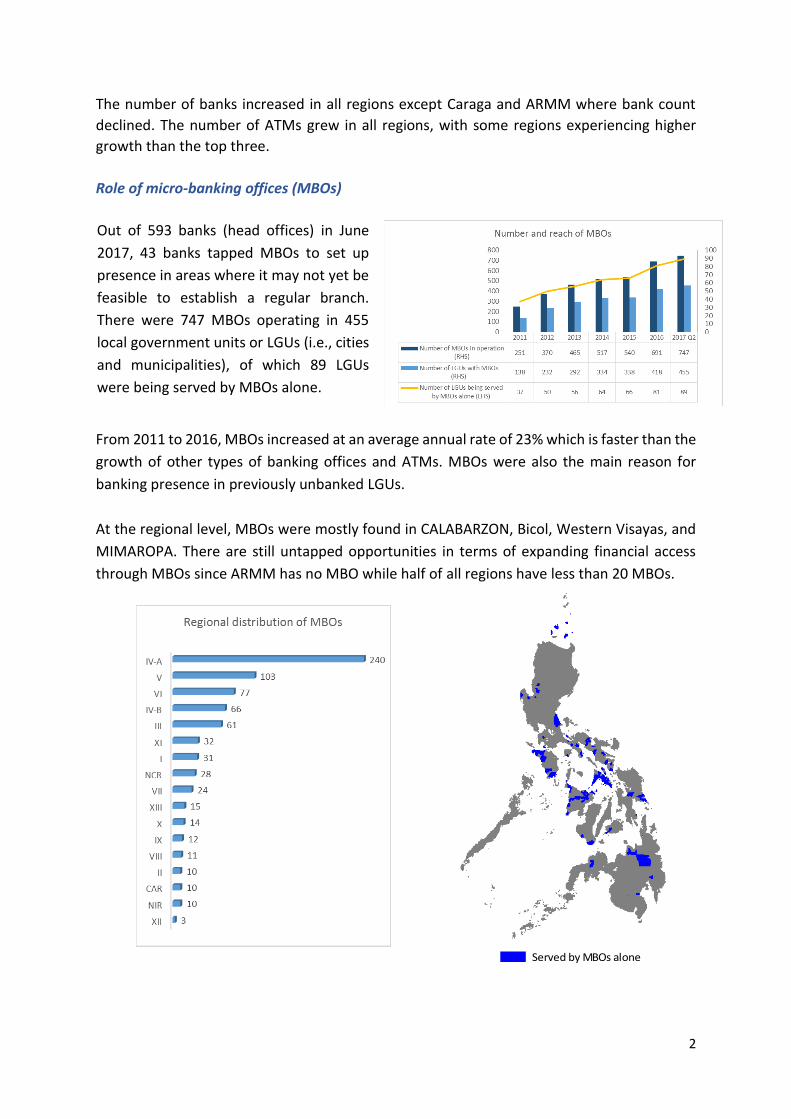
Role of micro-banking offices (MBOs)
Out of 593 banks (head offices) in June
2017, 43 banks tapped MBOs to set up
presence in areas where it may not yet be
feasible to establish a regular branch.
There were 747 MBOs operating in 455
local government units or LGUs (i.e., cities
and municipalities), of which 89 LGUs
were being served by MBOs alone.
From 2011 to 2016, MBOs increased at an average annual rate of 23% which is faster than the
growth of other types of banking offices and ATMs. MBOs were also the main reason for
banking presence in previously unbanked LGUs.
At the regional level, MBOs were mostly found in CALABARZON, Bicol, Western Visayas, and
MIMAROPA. There are still untapped opportunities in terms of expanding financial access
through MBOs since ARMM has no MBO while half of all regions have less than 20 MBOs.
Served by MBOs alone
3
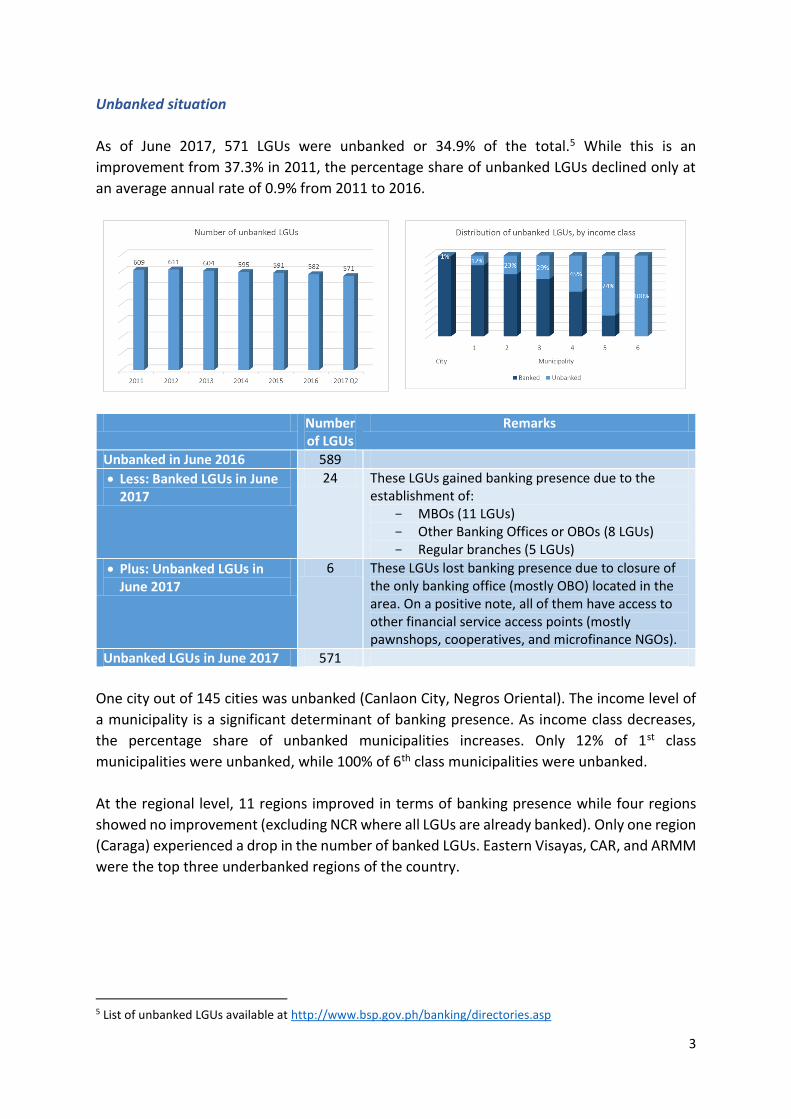
Unbanked situation
As of June 2017, 571 LGUs were unbanked or 34.9% of the total.5 While this is an
improvement from 37.3% in 2011, the percentage share of unbanked LGUs declined only at
an average annual rate of 0.9% from 2011 to 2016.
Number of LGUs
Remarks
Unbanked in June 2016 589
Less: Banked LGUs in June 2017
24 These LGUs gained banking presence due to the establishment of:
- MBOs (11 LGUs) - Other Banking Offices or OBOs (8 LGUs) - Regular branches (5 LGUs)
Plus: Unbanked LGUs in June 2017
6 These LGUs lost banking presence due to closure of the only banking office (mostly OBO) located in the area. On a positive note, all of them have access to other financial service access points (mostly pawnshops, cooperatives, and microfinance NGOs).
Unbanked LGUs in June 2017 571
One city out of 145 cities was unbanked (Canlaon City, Negros Oriental). The income level of
a municipality is a significant determinant of banking presence. As income class decreases,
the percentage share of unbanked municipalities increases. Only 12% of 1st class
municipalities were unbanked, while 100% of 6th class municipalities were unbanked.
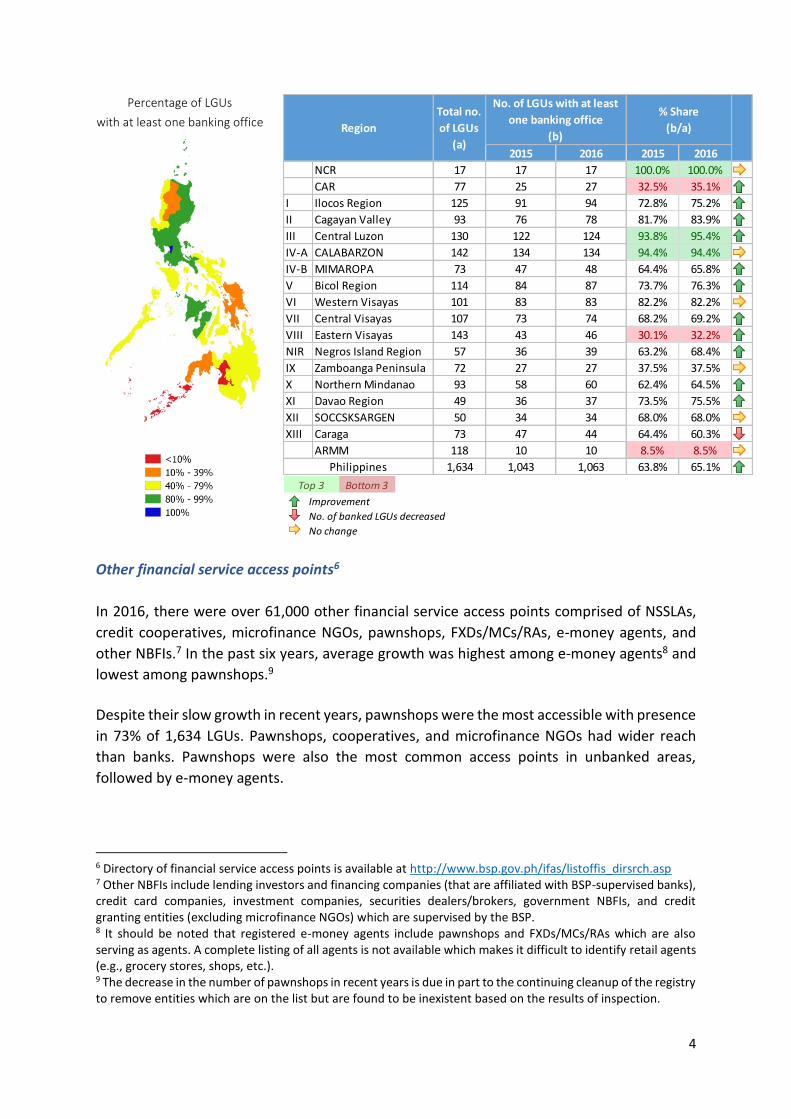
At the regional level, 11 regions improved in terms of banking presence while four regions
showed no improvement (excluding NCR where all LGUs are already banked). Only one region
(Caraga) experienced a drop in the number of banked LGUs. Eastern Visayas, CAR, and ARMM
were the top three underbanked regions of the country.
5 List of unbanked LGUs available at http://www.bsp.gov.ph/banking/directories.asp
4
Percentage of LGUs
with at least one banking office
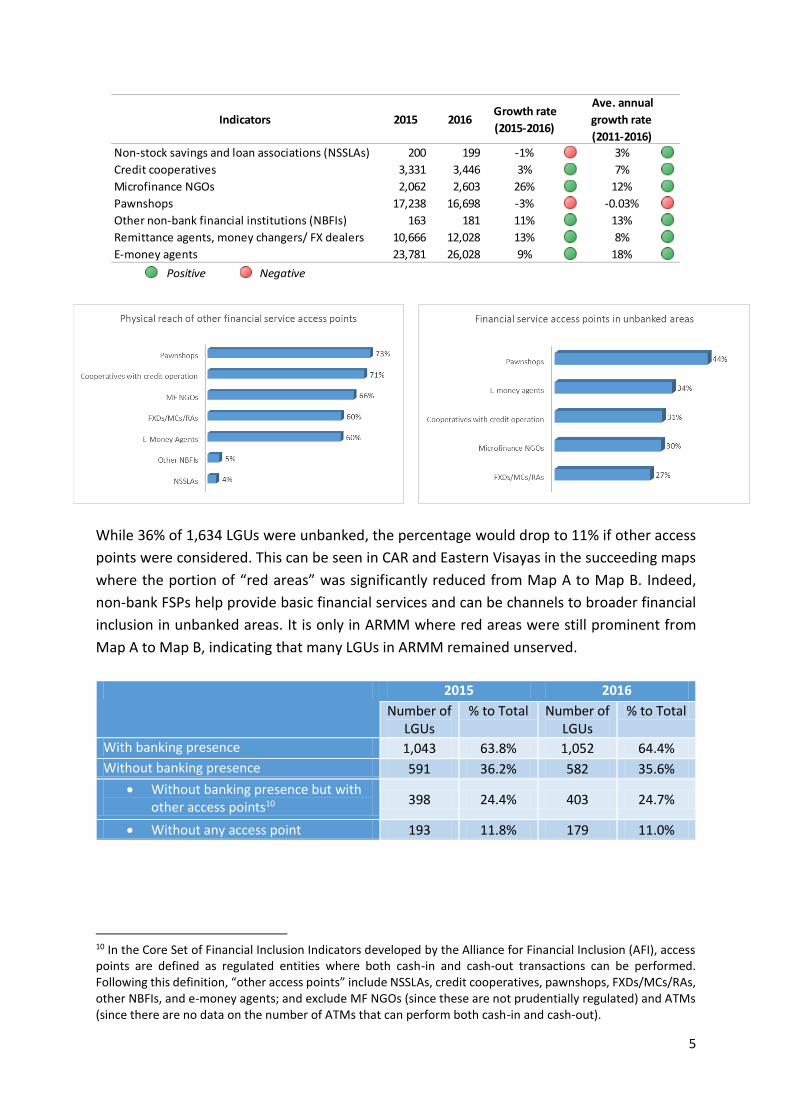
Other financial service access points6
In 2016, there were over 61,000 other financial service access points comprised of NSSLAs,
credit cooperatives, microfinance NGOs, pawnshops, FXDs/MCs/RAs, e-money agents, and
other NBFIs.7 In the past six years, average growth was highest among e-money agents8 and
lowest among pawnshops.9
Despite their slow growth in recent years, pawnshops were the most accessible with presence
in 73% of 1,634 LGUs. Pawnshops, cooperatives, and microfinance NGOs had wider reach
than banks. Pawnshops were also the most common access points in unbanked areas,
followed by e-money agents.
6 Directory of financial service access points is available at http://www.bsp.gov.ph/ifas/listoffis_dirsrch.asp 7 Other NBFIs include lending investors and financing companies (that are affiliated with BSP-supervised banks), credit card companies, investment companies, securities dealers/brokers, government NBFIs, and credit granting entities (excluding microfinance NGOs) which are supervised by the BSP. 8 It should be noted that registered e-money agents include pawnshops and FXDs/MCs/RAs which are also serving as agents. A complete listing of all agents is not available which makes it difficult to identify retail agents (e.g., grocery stores, shops, etc.). 9 The decrease in the number of pawnshops in recent years is due in part to the continuing cleanup of the registry to remove entities which are on the list but are found to be inexistent based on the results of inspection.
2015 2016 2015 2016
NCR 17 17 17 100.0% 100.0%
CAR 77 25 27 32.5% 35.1%
I Ilocos Region 125 91 94 72.8% 75.2%
II Cagayan Valley 93 76 78 81.7% 83.9%
III Central Luzon 130 122 124 93.8% 95.4%
IV-A CALABARZON 142 134 134 94.4% 94.4%
IV-B MIMAROPA 73 47 48 64.4% 65.8%
V Bicol Region 114 84 87 73.7% 76.3%
VI Western Visayas 101 83 83 82.2% 82.2%
VII Central Visayas 107 73 74 68.2% 69.2%
VIII Eastern Visayas 143 43 46 30.1% 32.2%
NIR Negros Island Region 57 36 39 63.2% 68.4%
IX Zamboanga Peninsula 72 27 27 37.5% 37.5%
X Northern Mindanao 93 58 60 62.4% 64.5%
XI Davao Region 49 36 37 73.5% 75.5%
XII SOCCSKSARGEN 50 34 34 68.0% 68.0%
XIII Caraga 73 47 44 64.4% 60.3%
ARMM 118 10 10 8.5% 8.5%
1,634 1,043 1,063 63.8% 65.1%
% Share
(b/a)
Philippines
Total no.
of LGUs
(a)
Region
No. of LGUs with at least
one banking office
(b)
Top 3 Bottom 3
Improvement
No. of banked LGUs decreased
No change
5
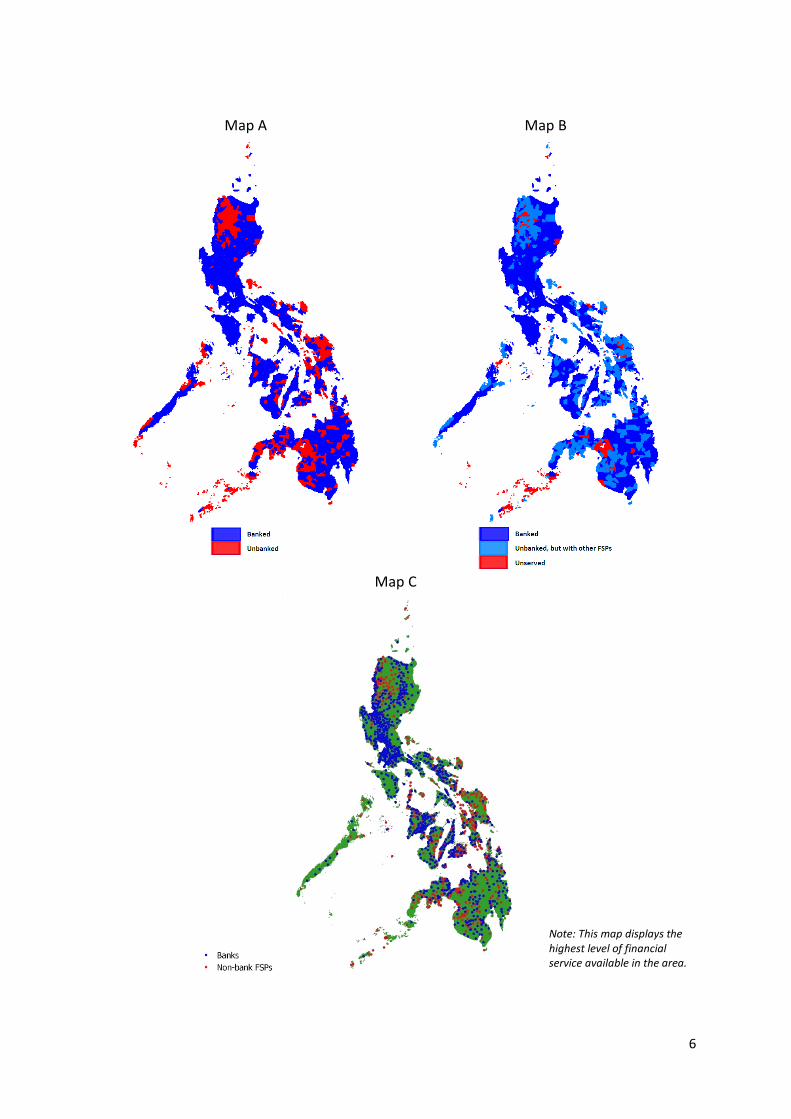
While 36% of 1,634 LGUs were unbanked, the percentage would drop to 11% if other access
points were considered. This can be seen in CAR and Eastern Visayas in the succeeding maps
where the portion of “red areas” was significantly reduced from Map A to Map B. Indeed,
non-bank FSPs help provide basic financial services and can be channels to broader financial
inclusion in unbanked areas. It is only in ARMM where red areas were still prominent from
Map A to Map B, indicating that many LGUs in ARMM remained unserved.
2015 2016
Number of LGUs
% to Total Number of LGUs
% to Total
With banking presence 1,043 63.8% 1,052 64.4%
Without banking presence 591 36.2% 582 35.6%
Without banking presence but with other access points10
398 24.4% 403 24.7%
Without any access point 193 11.8% 179 11.0%
10 In the Core Set of Financial Inclusion Indicators developed by the Alliance for Financial Inclusion (AFI), access points are defined as regulated entities where both cash-in and cash-out transactions can be performed. Following this definition, “other access points” include NSSLAs, credit cooperatives, pawnshops, FXDs/MCs/RAs, other NBFIs, and e-money agents; and exclude MF NGOs (since these are not prudentially regulated) and ATMs (since there are no data on the number of ATMs that can perform both cash-in and cash-out).
Indicators 2015 2016 Growth rate
(2015-2016)
Ave. annual
growth rate
(2011-2016)
Non-stock savings and loan associations (NSSLAs) 200 199 -1% 3%
Credit cooperatives 3,331 3,446 3% 7%
Microfinance NGOs 2,062 2,603 26% 12%
Pawnshops 17,238 16,698 -3% -0.03%
Other non-bank financial institutions (NBFIs) 163 181 11% 13%
Remittance agents, money changers/ FX dealers 10,666 12,028 13% 8%
E-money agents 23,781 26,028 9% 18%
Positive Negative
6
Map A Map B
Map C
Note: This map displays the highest level of financial service available in the area.

7
Usage of Financial Products and Services
Deposits in banks
As of June 2017, there were 55.3 million
deposit accounts from 44.4 million
depositors with outstanding balance of
P11 trillion.
From 2011 to 2016, the number of deposit
accounts and depositors in banks
increased at an average annual rate of 4%
and 6%, respectively. The total amount of
deposits grew at an average rate of 15%
during the same period.
The number of accounts is 10.9 million more than the number of depositors which indicates
ownership of more than one account for some depositors.11
Of the total, 99.7% of accounts (55.175 million) and 99.8% of outstanding balance (P10.998
trillion) are held in the Philippines.
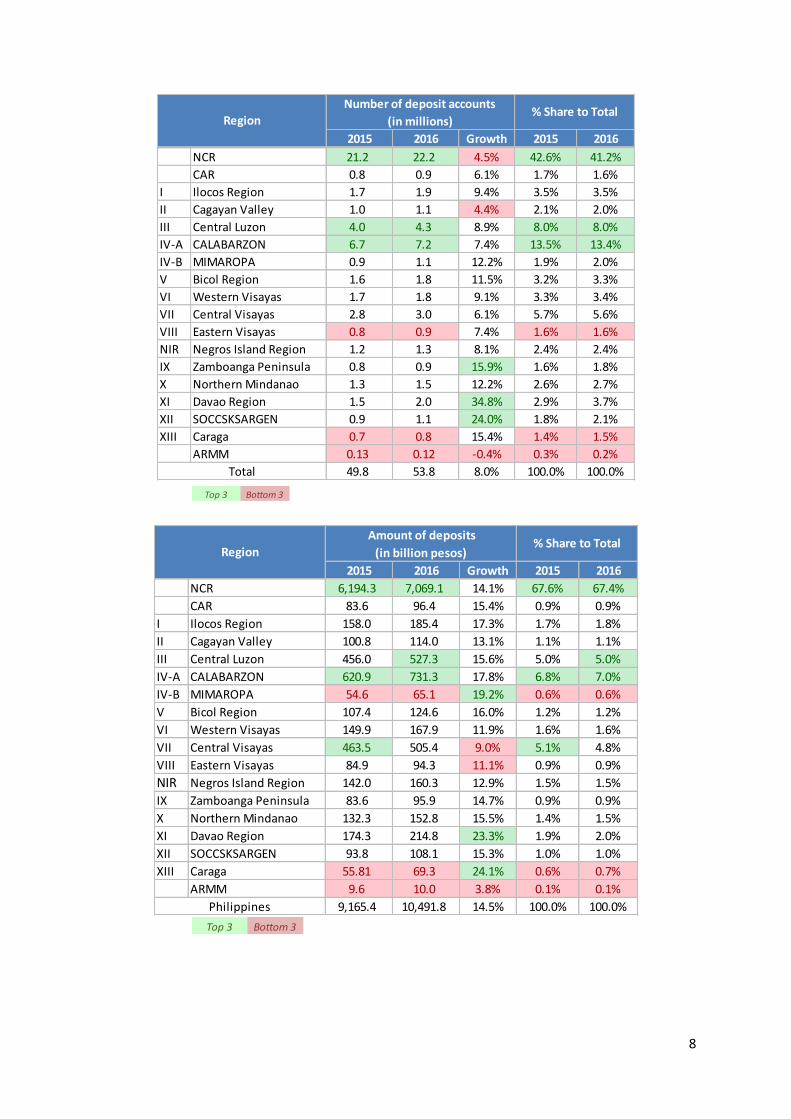
Geographic distribution of bank deposits
NCR held more than 40% of the total number of deposit accounts, followed by CALABARZON
and Central Luzon although the percentage shares of these two regions were already way
lower than NCR. The bottom three regions were Eastern Visayas, Caraga, and ARMM. It is
encouraging that growth was highest in regions outside the top three such as Davao,
SOCCSKSARGEN, and Zamboanga Peninsula.
In terms of amount, deposits were heavily concentrated in NCR which accounted for more
than two-thirds of the total. Caraga and ARMM were again at the bottom. MIMAROPA was
also in the bottom three but it was one of the regions with the highest year-on-year growth
rate.
11 Deposit data is subject to multiple counting because a person may have two or more accounts in a bank or in several banks.
8
2015 2016 Growth 2015 2016
NCR 21.2 22.2 4.5% 42.6% 41.2%
CAR 0.8 0.9 6.1% 1.7% 1.6%
I Ilocos Region 1.7 1.9 9.4% 3.5% 3.5%
II Cagayan Valley 1.0 1.1 4.4% 2.1% 2.0%
III Central Luzon 4.0 4.3 8.9% 8.0% 8.0%
IV-A CALABARZON 6.7 7.2 7.4% 13.5% 13.4%
IV-B MIMAROPA 0.9 1.1 12.2% 1.9% 2.0%
V Bicol Region 1.6 1.8 11.5% 3.2% 3.3%
VI Western Visayas 1.7 1.8 9.1% 3.3% 3.4%
VII Central Visayas 2.8 3.0 6.1% 5.7% 5.6%
VIII Eastern Visayas 0.8 0.9 7.4% 1.6% 1.6%
NIR Negros Island Region 1.2 1.3 8.1% 2.4% 2.4%
IX Zamboanga Peninsula 0.8 0.9 15.9% 1.6% 1.8%
X Northern Mindanao 1.3 1.5 12.2% 2.6% 2.7%
XI Davao Region 1.5 2.0 34.8% 2.9% 3.7%
XII SOCCSKSARGEN 0.9 1.1 24.0% 1.8% 2.1%
XIII Caraga 0.7 0.8 15.4% 1.4% 1.5%
ARMM 0.13 0.12 -0.4% 0.3% 0.2%
49.8 53.8 8.0% 100.0% 100.0%
Region
Total
Number of deposit accounts
(in millions)% Share to Total
Top 3 Bottom 3
2015 2016 Growth 2015 2016
NCR 6,194.3 7,069.1 14.1% 67.6% 67.4%
CAR 83.6 96.4 15.4% 0.9% 0.9%
I Ilocos Region 158.0 185.4 17.3% 1.7% 1.8%
II Cagayan Valley 100.8 114.0 13.1% 1.1% 1.1%
III Central Luzon 456.0 527.3 15.6% 5.0% 5.0%
IV-A CALABARZON 620.9 731.3 17.8% 6.8% 7.0%
IV-B MIMAROPA 54.6 65.1 19.2% 0.6% 0.6%
V Bicol Region 107.4 124.6 16.0% 1.2% 1.2%
VI Western Visayas 149.9 167.9 11.9% 1.6% 1.6%
VII Central Visayas 463.5 505.4 9.0% 5.1% 4.8%
VIII Eastern Visayas 84.9 94.3 11.1% 0.9% 0.9%
NIR Negros Island Region 142.0 160.3 12.9% 1.5% 1.5%
IX Zamboanga Peninsula 83.6 95.9 14.7% 0.9% 0.9%
X Northern Mindanao 132.3 152.8 15.5% 1.4% 1.5%
XI Davao Region 174.3 214.8 23.3% 1.9% 2.0%
XII SOCCSKSARGEN 93.8 108.1 15.3% 1.0% 1.0%
XIII Caraga 55.81 69.3 24.1% 0.6% 0.7%
ARMM 9.6 10.0 3.8% 0.1% 0.1%
9,165.4 10,491.8 14.5% 100.0% 100.0%Philippines
Region
Amount of deposits
(in billion pesos)% Share to Total
Top 3 Bottom 3
9
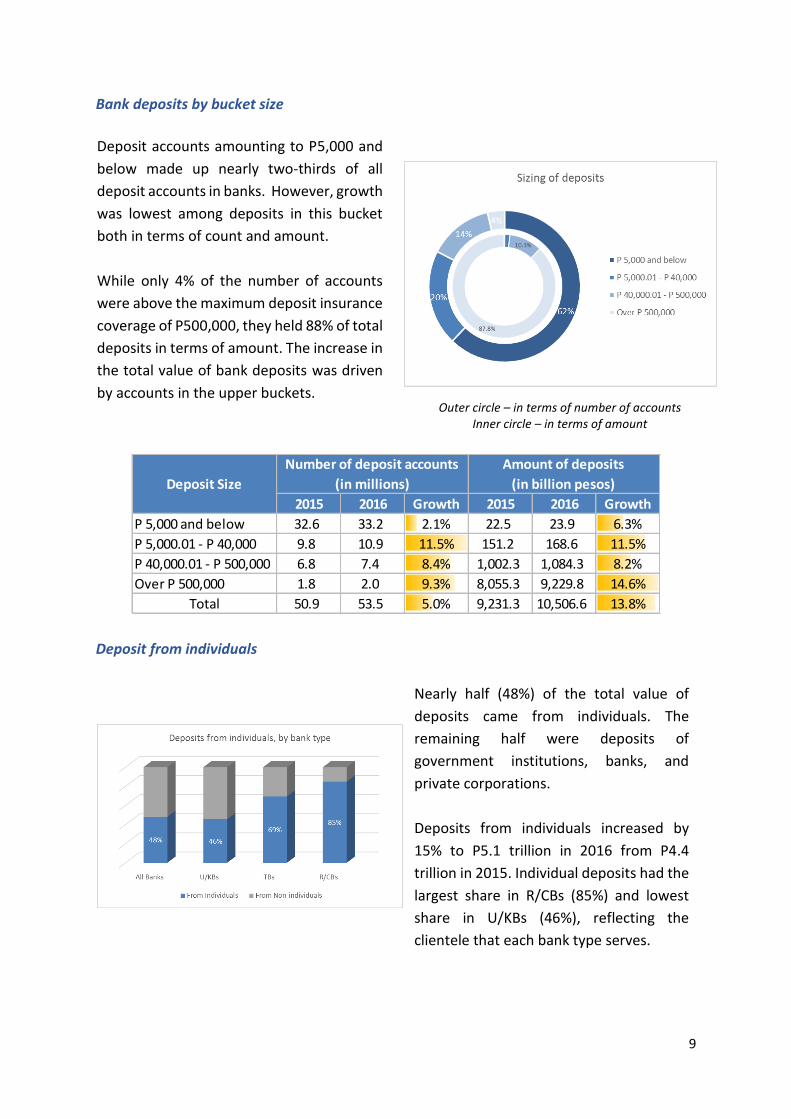
Bank deposits by bucket size
Deposit accounts amounting to P5,000 and
below made up nearly two-thirds of all
deposit accounts in banks. However, growth
was lowest among deposits in this bucket
both in terms of count and amount.
While only 4% of the number of accounts
were above the maximum deposit insurance
coverage of P500,000, they held 88% of total
deposits in terms of amount. The increase in
the total value of bank deposits was driven
by accounts in the upper buckets.
Outer circle – in terms of number of accounts Inner circle – in terms of amount
Deposit from individuals
Nearly half (48%) of the total value of
deposits came from individuals. The
remaining half were deposits of
government institutions, banks, and
private corporations.
Deposits from individuals increased by
15% to P5.1 trillion in 2016 from P4.4
trillion in 2015. Individual deposits had the
largest share in R/CBs (85%) and lowest
share in U/KBs (46%), reflecting the
clientele that each bank type serves.
2015 2016 Growth 2015 2016 Growth
P 5,000 and below 32.6 33.2 2.1% 22.5 23.9 6.3%
P 5,000.01 - P 40,000 9.8 10.9 11.5% 151.2 168.6 11.5%
P 40,000.01 - P 500,000 6.8 7.4 8.4% 1,002.3 1,084.3 8.2%
Over P 500,000 1.8 2.0 9.3% 8,055.3 9,229.8 14.6%
Total 50.9 53.5 5.0% 9,231.3 10,506.6 13.8%
Deposit Size
Number of deposit accounts
(in millions)
Amount of deposits
(in billion pesos)
10
Dormant accounts
While the amount of dormant accounts increased by 25% to P92.1 billion in 2016 from P73.6
billion in 2015, they only made up less than 1% of the total amount of deposits. Dormant
accounts amounted to P89.1 billion or 0.8% of the total value of deposits in June 2017.
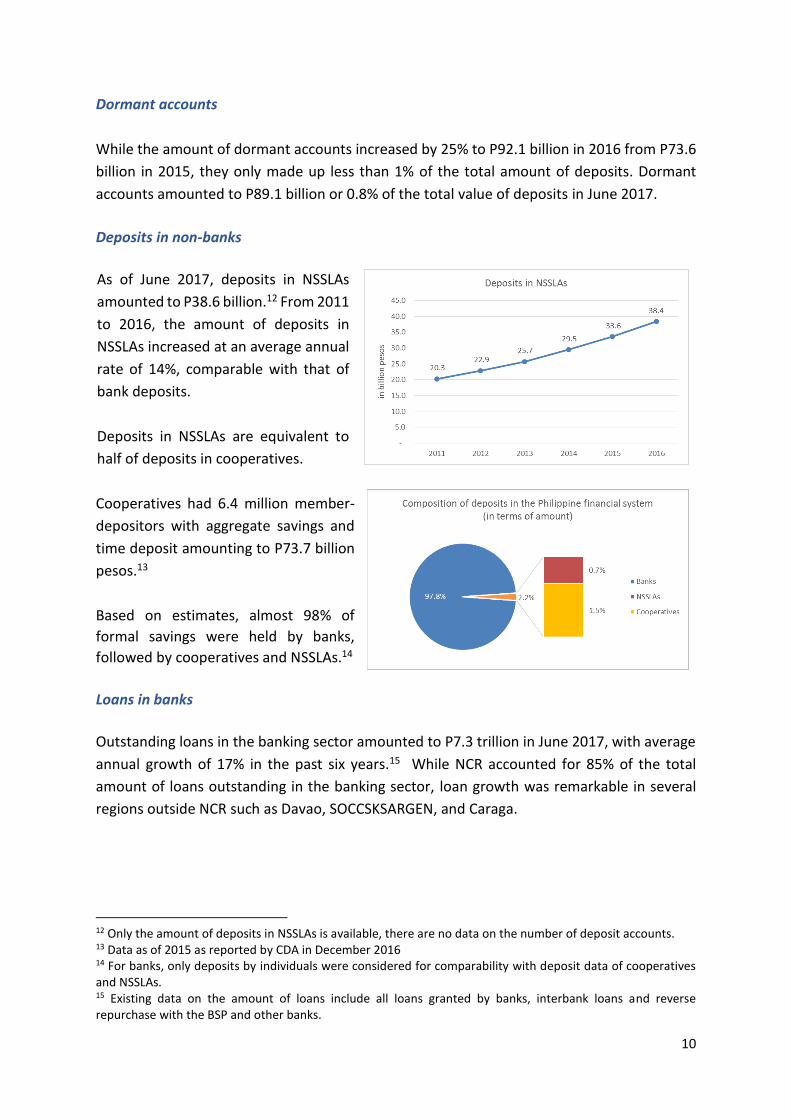
Deposits in non-banks
As of June 2017, deposits in NSSLAs
amounted to P38.6 billion.12 From 2011
to 2016, the amount of deposits in
NSSLAs increased at an average annual
rate of 14%, comparable with that of
bank deposits.
Deposits in NSSLAs are equivalent to
half of deposits in cooperatives.
Cooperatives had 6.4 million member-
depositors with aggregate savings and
time deposit amounting to P73.7 billion
pesos.13
Based on estimates, almost 98% of
formal savings were held by banks,
followed by cooperatives and NSSLAs.14
Loans in banks
Outstanding loans in the banking sector amounted to P7.3 trillion in June 2017, with average
annual growth of 17% in the past six years.15 While NCR accounted for 85% of the total
amount of loans outstanding in the banking sector, loan growth was remarkable in several
regions outside NCR such as Davao, SOCCSKSARGEN, and Caraga.
12 Only the amount of deposits in NSSLAs is available, there are no data on the number of deposit accounts. 13 Data as of 2015 as reported by CDA in December 2016 14 For banks, only deposits by individuals were considered for comparability with deposit data of cooperatives and NSSLAs. 15 Existing data on the amount of loans include all loans granted by banks, interbank loans and reverse repurchase with the BSP and other banks.
11
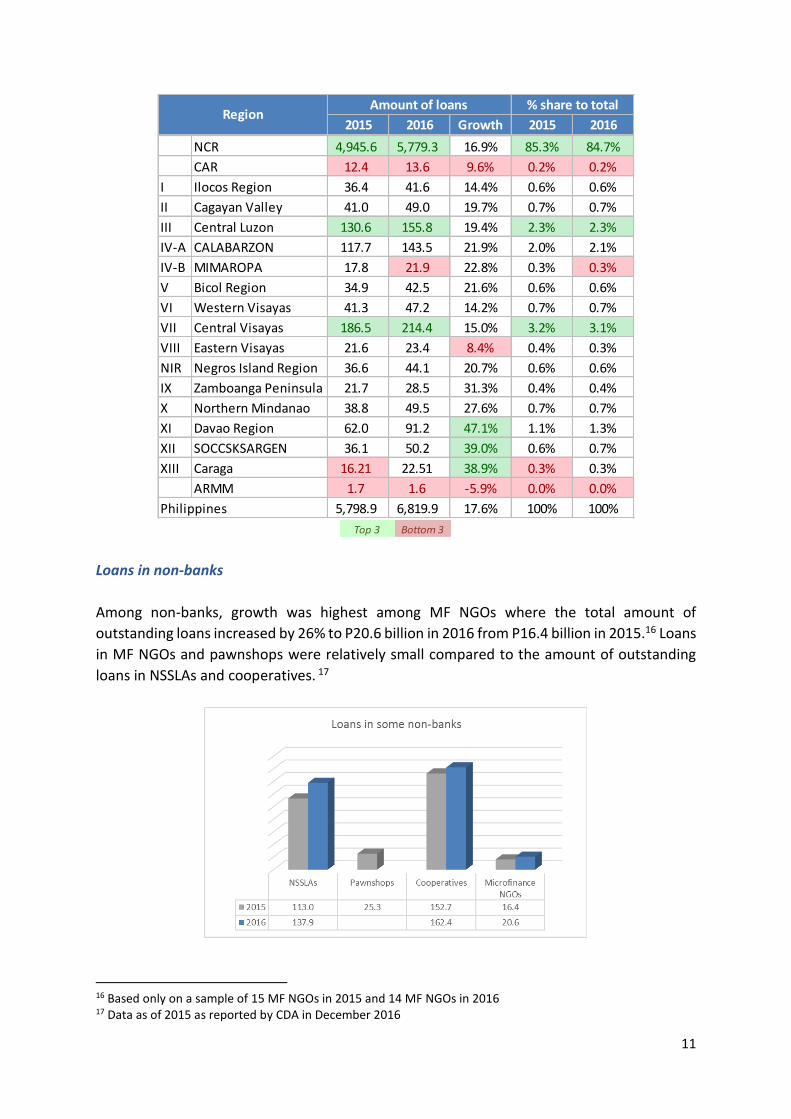
Loans in non-banks
Among non-banks, growth was highest among MF NGOs where the total amount of
outstanding loans increased by 26% to P20.6 billion in 2016 from P16.4 billion in 2015.16 Loans
in MF NGOs and pawnshops were relatively small compared to the amount of outstanding
loans in NSSLAs and cooperatives. 17
16 Based only on a sample of 15 MF NGOs in 2015 and 14 MF NGOs in 2016 17 Data as of 2015 as reported by CDA in December 2016
2015 2016 Growth 2015 2016
NCR 4,945.6 5,779.3 16.9% 85.3% 84.7%
CAR 12.4 13.6 9.6% 0.2% 0.2%
I Ilocos Region 36.4 41.6 14.4% 0.6% 0.6%
II Cagayan Valley 41.0 49.0 19.7% 0.7% 0.7%
III Central Luzon 130.6 155.8 19.4% 2.3% 2.3%
IV-A CALABARZON 117.7 143.5 21.9% 2.0% 2.1%
IV-B MIMAROPA 17.8 21.9 22.8% 0.3% 0.3%
V Bicol Region 34.9 42.5 21.6% 0.6% 0.6%
VI Western Visayas 41.3 47.2 14.2% 0.7% 0.7%
VII Central Visayas 186.5 214.4 15.0% 3.2% 3.1%
VIII Eastern Visayas 21.6 23.4 8.4% 0.4% 0.3%
NIR Negros Island Region 36.6 44.1 20.7% 0.6% 0.6%
IX Zamboanga Peninsula 21.7 28.5 31.3% 0.4% 0.4%
X Northern Mindanao 38.8 49.5 27.6% 0.7% 0.7%
XI Davao Region 62.0 91.2 47.1% 1.1% 1.3%
XII SOCCSKSARGEN 36.1 50.2 39.0% 0.6% 0.7%
XIII Caraga 16.21 22.51 38.9% 0.3% 0.3%
ARMM 1.7 1.6 -5.9% 0.0% 0.0%
Philippines 5,798.9 6,819.9 17.6% 100% 100%
Amount of loans % share to totalRegion
Top 3 Bottom 3
12
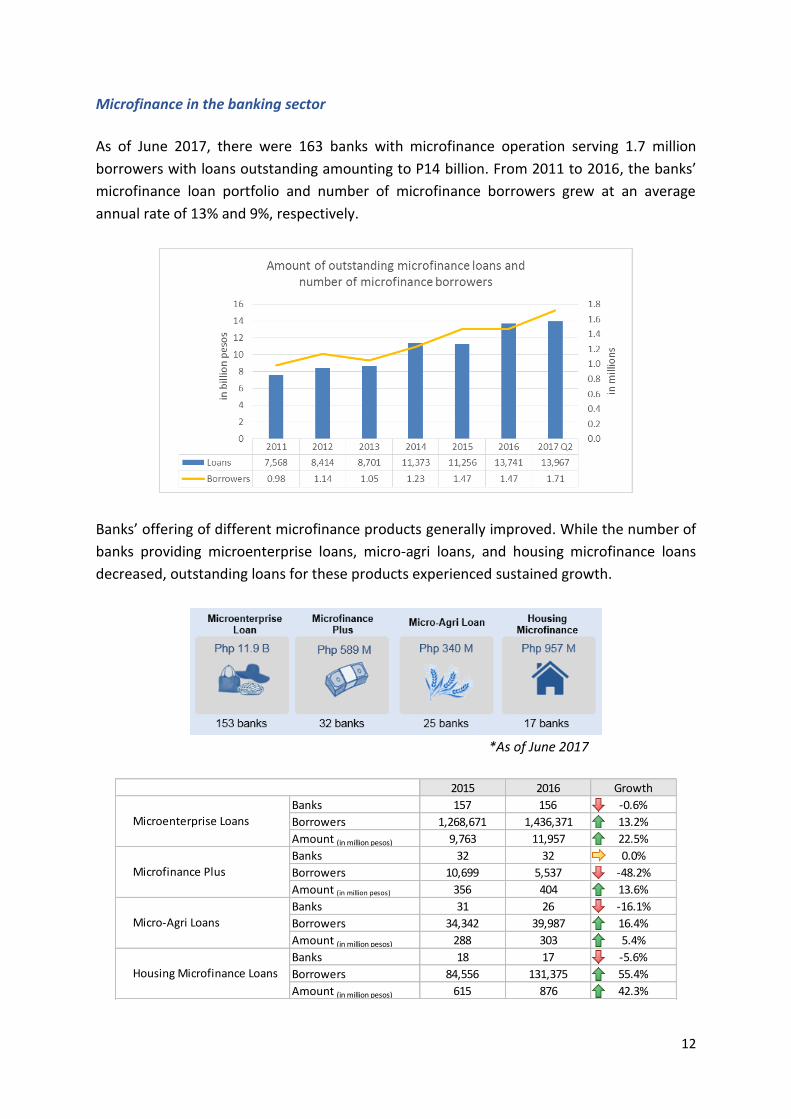
Microfinance in the banking sector
As of June 2017, there were 163 banks with microfinance operation serving 1.7 million
borrowers with loans outstanding amounting to P14 billion. From 2011 to 2016, the banks’
microfinance loan portfolio and number of microfinance borrowers grew at an average
annual rate of 13% and 9%, respectively.
Banks’ offering of different microfinance products generally improved. While the number of
banks providing microenterprise loans, micro-agri loans, and housing microfinance loans
decreased, outstanding loans for these products experienced sustained growth.
*As of June 2017
2015 2016 Growth
Banks 157 156 -0.6%
Borrowers 1,268,671 1,436,371 13.2%
Amount (in million pesos) 9,763 11,957 22.5%
Banks 32 32 0.0%
Borrowers 10,699 5,537 -48.2%
Amount (in million pesos) 356 404 13.6%
Banks 31 26 -16.1%
Borrowers 34,342 39,987 16.4%
Amount (in million pesos) 288 303 5.4%
Banks 18 17 -5.6%
Borrowers 84,556 131,375 55.4%
Amount (in million pesos) 615 876 42.3%
Microfinance Plus
Micro-Agri Loans
Housing Microfinance Loans
Microenterprise Loans
13
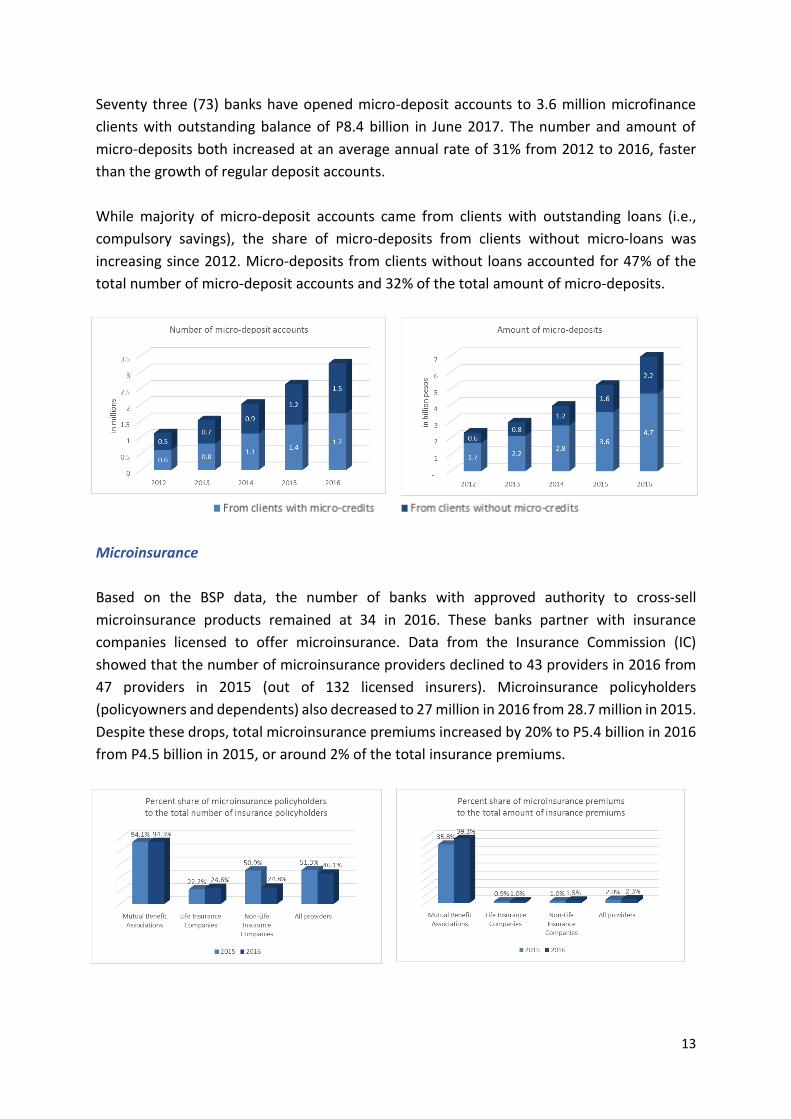
Seventy three (73) banks have opened micro-deposit accounts to 3.6 million microfinance
clients with outstanding balance of P8.4 billion in June 2017. The number and amount of
micro-deposits both increased at an average annual rate of 31% from 2012 to 2016, faster
than the growth of regular deposit accounts.
While majority of micro-deposit accounts came from clients with outstanding loans (i.e.,
compulsory savings), the share of micro-deposits from clients without micro-loans was
increasing since 2012. Micro-deposits from clients without loans accounted for 47% of the
total number of micro-deposit accounts and 32% of the total amount of micro-deposits.
Microinsurance
Based on the BSP data, the number of banks with approved authority to cross-sell
microinsurance products remained at 34 in 2016. These banks partner with insurance
companies licensed to offer microinsurance. Data from the Insurance Commission (IC)
showed that the number of microinsurance providers declined to 43 providers in 2016 from
47 providers in 2015 (out of 132 licensed insurers). Microinsurance policyholders
(policyowners and dependents) also decreased to 27 million in 2016 from 28.7 million in 2015.
Despite these drops, total microinsurance premiums increased by 20% to P5.4 billion in 2016
from P4.5 billion in 2015, or around 2% of the total insurance premiums.
14
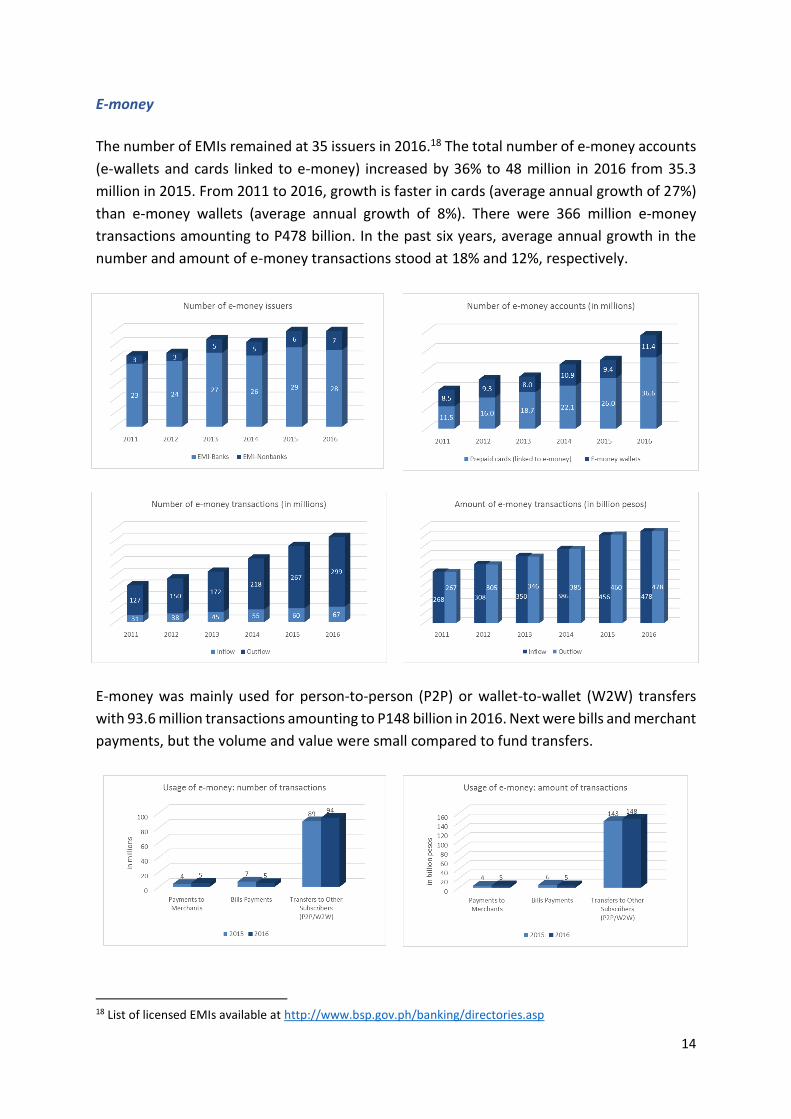
E-money
The number of EMIs remained at 35 issuers in 2016.18 The total number of e-money accounts
(e-wallets and cards linked to e-money) increased by 36% to 48 million in 2016 from 35.3
million in 2015. From 2011 to 2016, growth is faster in cards (average annual growth of 27%)
than e-money wallets (average annual growth of 8%). There were 366 million e-money
transactions amounting to P478 billion. In the past six years, average annual growth in the
number and amount of e-money transactions stood at 18% and 12%, respectively.
E-money was mainly used for person-to-person (P2P) or wallet-to-wallet (W2W) transfers
with 93.6 million transactions amounting to P148 billion in 2016. Next were bills and merchant
payments, but the volume and value were small compared to fund transfers.
18 List of licensed EMIs available at http://www.bsp.gov.ph/banking/directories.asp
15
Annexes
Annex A. Cross-country comparison
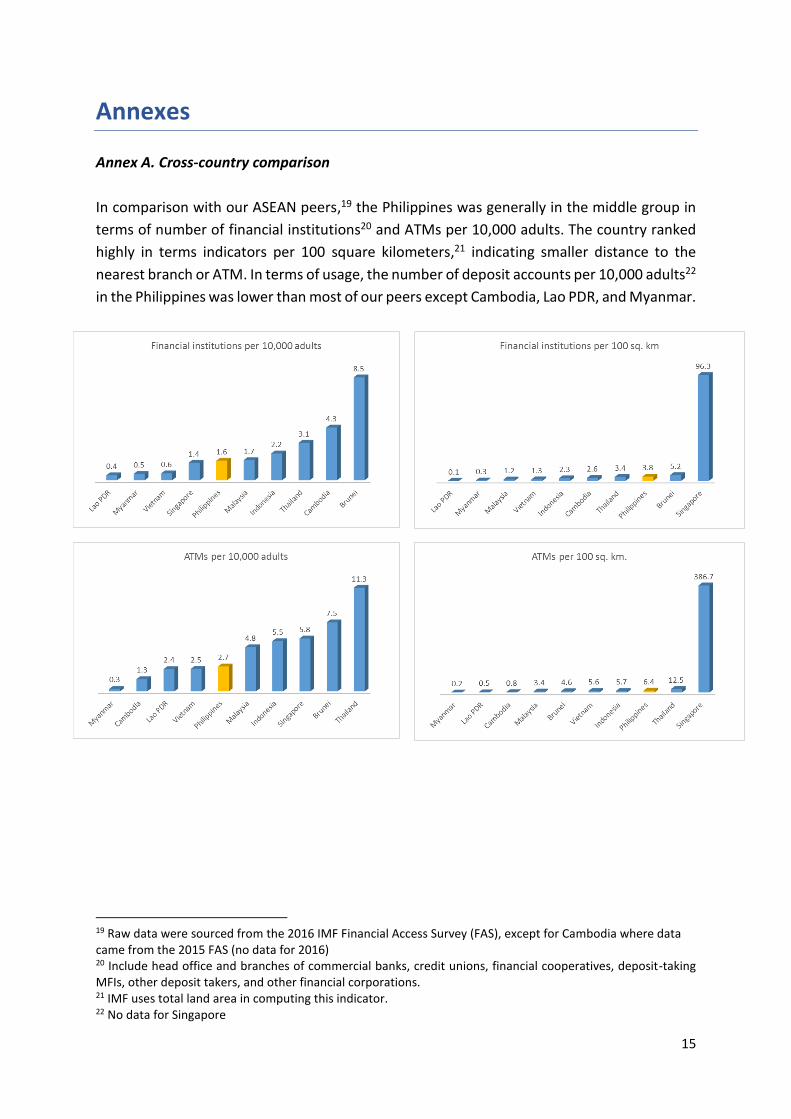
In comparison with our ASEAN peers,19 the Philippines was generally in the middle group in
terms of number of financial institutions20 and ATMs per 10,000 adults. The country ranked
highly in terms indicators per 100 square kilometers,21 indicating smaller distance to the
nearest branch or ATM. In terms of usage, the number of deposit accounts per 10,000 adults22
in the Philippines was lower than most of our peers except Cambodia, Lao PDR, and Myanmar.
19 Raw data were sourced from the 2016 IMF Financial Access Survey (FAS), except for Cambodia where data came from the 2015 FAS (no data for 2016) 20 Include head office and branches of commercial banks, credit unions, financial cooperatives, deposit-taking MFIs, other deposit takers, and other financial corporations. 21 IMF uses total land area in computing this indicator. 22 No data for Singapore
16
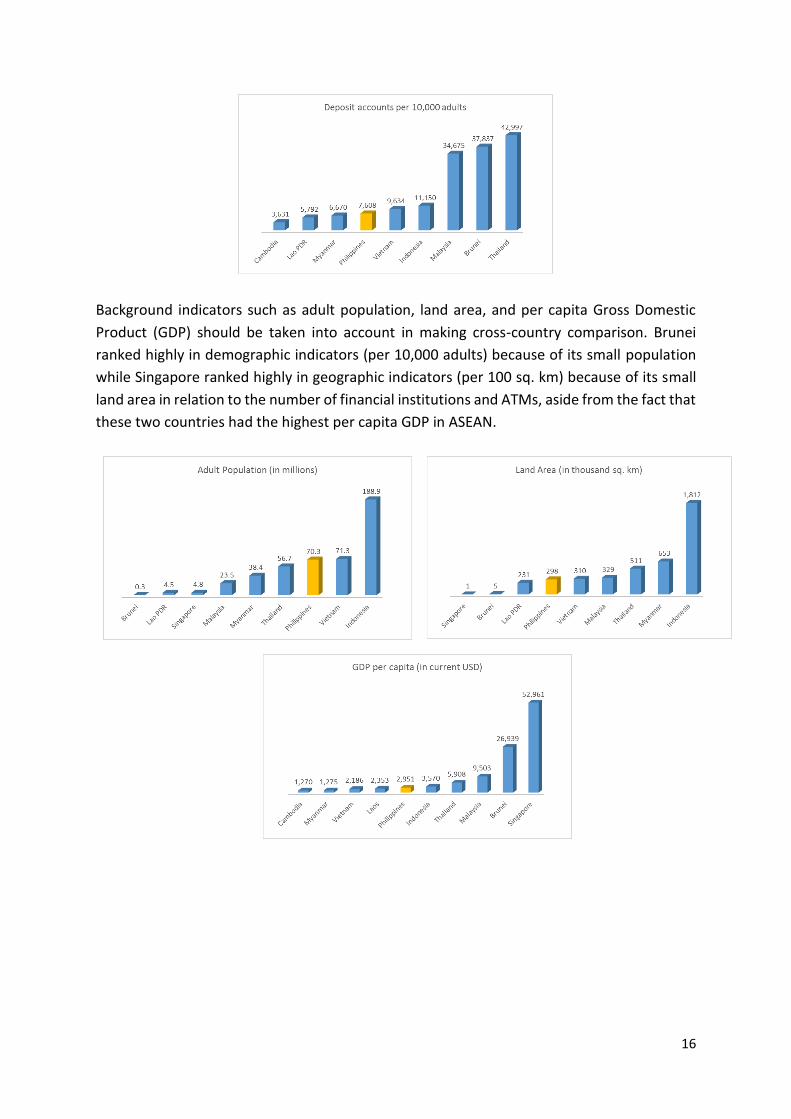
Background indicators such as adult population, land area, and per capita Gross Domestic
Product (GDP) should be taken into account in making cross-country comparison. Brunei
ranked highly in demographic indicators (per 10,000 adults) because of its small population
while Singapore ranked highly in geographic indicators (per 100 sq. km) because of its small
land area in relation to the number of financial institutions and ATMs, aside from the fact that
these two countries had the highest per capita GDP in ASEAN.
17
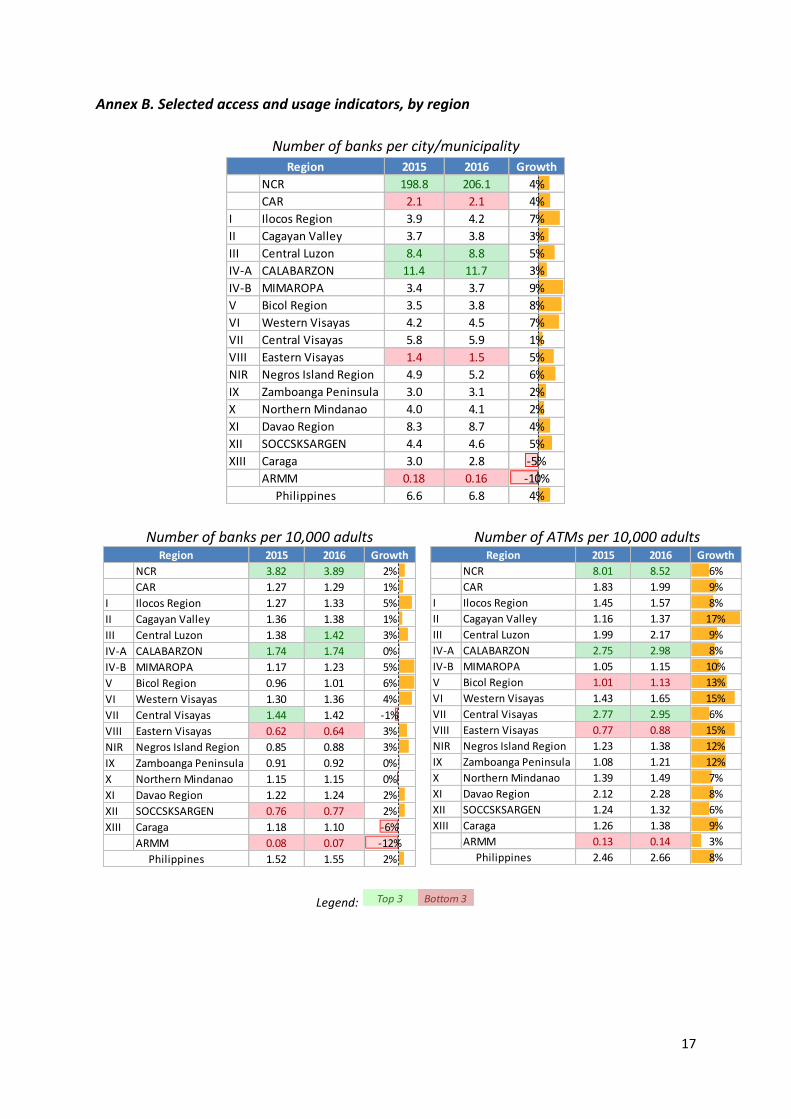
Annex B. Selected access and usage indicators, by region
Number of banks per city/municipality
Number of banks per 10,000 adults Number of ATMs per 10,000 adults
Legend:
2015 2016 Growth
NCR 198.8 206.1 4%
CAR 2.1 2.1 4%
I Ilocos Region 3.9 4.2 7%
II Cagayan Valley 3.7 3.8 3%
III Central Luzon 8.4 8.8 5%
IV-A CALABARZON 11.4 11.7 3%
IV-B MIMAROPA 3.4 3.7 9%
V Bicol Region 3.5 3.8 8%
VI Western Visayas 4.2 4.5 7%
VII Central Visayas 5.8 5.9 1%
VIII Eastern Visayas 1.4 1.5 5%
NIR Negros Island Region 4.9 5.2 6%
IX Zamboanga Peninsula 3.0 3.1 2%
X Northern Mindanao 4.0 4.1 2%
XI Davao Region 8.3 8.7 4%
XII SOCCSKSARGEN 4.4 4.6 5%
XIII Caraga 3.0 2.8 -5%
ARMM 0.18 0.16 -10%
6.6 6.8 4%
Region
Philippines
2015 2016 Growth
NCR 3.82 3.89 2%
CAR 1.27 1.29 1%
I Ilocos Region 1.27 1.33 5%
II Cagayan Valley 1.36 1.38 1%
III Central Luzon 1.38 1.42 3%
IV-A CALABARZON 1.74 1.74 0%
IV-B MIMAROPA 1.17 1.23 5%
V Bicol Region 0.96 1.01 6%
VI Western Visayas 1.30 1.36 4%
VII Central Visayas 1.44 1.42 -1%
VIII Eastern Visayas 0.62 0.64 3%
NIR Negros Island Region 0.85 0.88 3%
IX Zamboanga Peninsula 0.91 0.92 0%
X Northern Mindanao 1.15 1.15 0%
XI Davao Region 1.22 1.24 2%
XII SOCCSKSARGEN 0.76 0.77 2%
XIII Caraga 1.18 1.10 -6%
ARMM 0.08 0.07 -12%
1.52 1.55 2%
Region
Philippines
2015 2016 Growth
NCR 8.01 8.52 6%
CAR 1.83 1.99 9%
I Ilocos Region 1.45 1.57 8%
II Cagayan Valley 1.16 1.37 17%
III Central Luzon 1.99 2.17 9%
IV-A CALABARZON 2.75 2.98 8%
IV-B MIMAROPA 1.05 1.15 10%
V Bicol Region 1.01 1.13 13%
VI Western Visayas 1.43 1.65 15%
VII Central Visayas 2.77 2.95 6%
VIII Eastern Visayas 0.77 0.88 15%
NIR Negros Island Region 1.23 1.38 12%
IX Zamboanga Peninsula 1.08 1.21 12%
X Northern Mindanao 1.39 1.49 7%
XI Davao Region 2.12 2.28 8%
XII SOCCSKSARGEN 1.24 1.32 6%
XIII Caraga 1.26 1.38 9%
ARMM 0.13 0.14 3%
2.46 2.66 8%
Region
Philippines
Top 3 Bottom 3
18
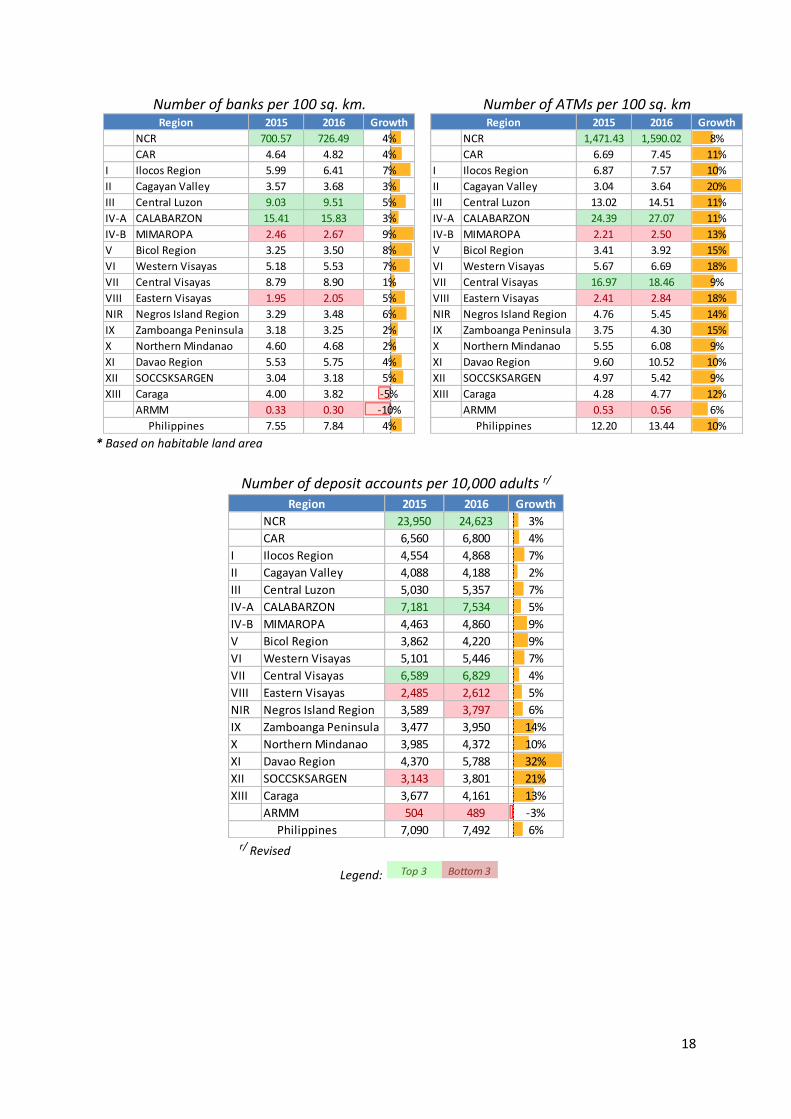
Number of banks per 100 sq. km. Number of ATMs per 100 sq. km
* Based on habitable land area
Number of deposit accounts per 10,000 adults r/
r/ Revised
Legend:
2015 2016 Growth
NCR 700.57 726.49 4%
CAR 4.64 4.82 4%
I Ilocos Region 5.99 6.41 7%
II Cagayan Valley 3.57 3.68 3%
III Central Luzon 9.03 9.51 5%
IV-A CALABARZON 15.41 15.83 3%
IV-B MIMAROPA 2.46 2.67 9%
V Bicol Region 3.25 3.50 8%
VI Western Visayas 5.18 5.53 7%
VII Central Visayas 8.79 8.90 1%
VIII Eastern Visayas 1.95 2.05 5%
NIR Negros Island Region 3.29 3.48 6%
IX Zamboanga Peninsula 3.18 3.25 2%
X Northern Mindanao 4.60 4.68 2%
XI Davao Region 5.53 5.75 4%
XII SOCCSKSARGEN 3.04 3.18 5%
XIII Caraga 4.00 3.82 -5%
ARMM 0.33 0.30 -10%
7.55 7.84 4%
Region
Philippines
2015 2016 Growth
NCR 1,471.43 1,590.02 8%
CAR 6.69 7.45 11%
I Ilocos Region 6.87 7.57 10%
II Cagayan Valley 3.04 3.64 20%
III Central Luzon 13.02 14.51 11%
IV-A CALABARZON 24.39 27.07 11%
IV-B MIMAROPA 2.21 2.50 13%
V Bicol Region 3.41 3.92 15%
VI Western Visayas 5.67 6.69 18%
VII Central Visayas 16.97 18.46 9%
VIII Eastern Visayas 2.41 2.84 18%
NIR Negros Island Region 4.76 5.45 14%
IX Zamboanga Peninsula 3.75 4.30 15%
X Northern Mindanao 5.55 6.08 9%
XI Davao Region 9.60 10.52 10%
XII SOCCSKSARGEN 4.97 5.42 9%
XIII Caraga 4.28 4.77 12%
ARMM 0.53 0.56 6%
12.20 13.44 10%
Region
Philippines
2015 2016 Growth
NCR 23,950 24,623 3%
CAR 6,560 6,800 4%
I Ilocos Region 4,554 4,868 7%
II Cagayan Valley 4,088 4,188 2%
III Central Luzon 5,030 5,357 7%
IV-A CALABARZON 7,181 7,534 5%
IV-B MIMAROPA 4,463 4,860 9%
V Bicol Region 3,862 4,220 9%
VI Western Visayas 5,101 5,446 7%
VII Central Visayas 6,589 6,829 4%
VIII Eastern Visayas 2,485 2,612 5%
NIR Negros Island Region 3,589 3,797 6%
IX Zamboanga Peninsula 3,477 3,950 14%
X Northern Mindanao 3,985 4,372 10%
XI Davao Region 4,370 5,788 32%
XII SOCCSKSARGEN 3,143 3,801 21%
XIII Caraga 3,677 4,161 13%
ARMM 504 489 -3%
7,090 7,492 6%
Region
Philippines
Top 3 Bottom 3
19
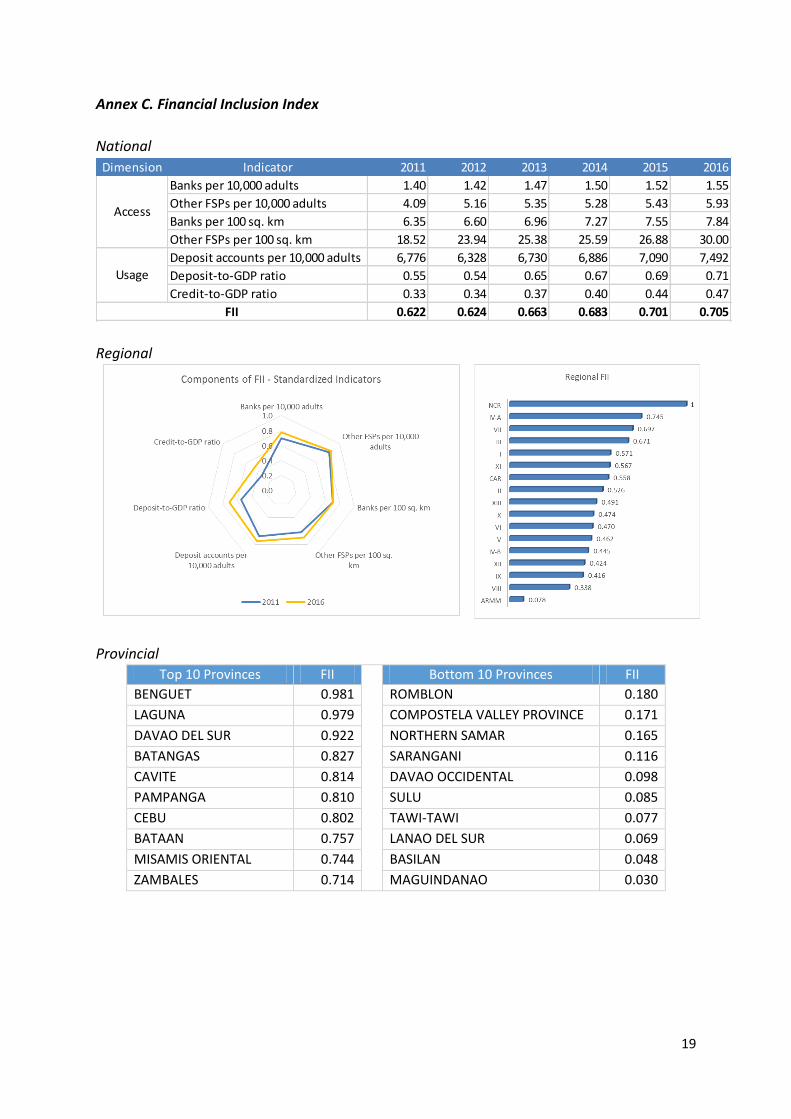
Annex C. Financial Inclusion Index
National
Regional
Provincial
Top 10 Provinces FII Bottom 10 Provinces FII
BENGUET 0.981 ROMBLON 0.180
LAGUNA 0.979 COMPOSTELA VALLEY PROVINCE 0.171
DAVAO DEL SUR 0.922 NORTHERN SAMAR 0.165
BATANGAS 0.827 SARANGANI 0.116
CAVITE 0.814 DAVAO OCCIDENTAL 0.098
PAMPANGA 0.810 SULU 0.085
CEBU 0.802 TAWI-TAWI 0.077
BATAAN 0.757 LANAO DEL SUR 0.069
MISAMIS ORIENTAL 0.744 BASILAN 0.048
ZAMBALES 0.714 MAGUINDANAO 0.030
Dimension Indicator 2011 2012 2013 2014 2015 2016
Banks per 10,000 adults 1.40 1.42 1.47 1.50 1.52 1.55
Other FSPs per 10,000 adults 4.09 5.16 5.35 5.28 5.43 5.93
Banks per 100 sq. km 6.35 6.60 6.96 7.27 7.55 7.84
Other FSPs per 100 sq. km 18.52 23.94 25.38 25.59 26.88 30.00
Deposit accounts per 10,000 adults 6,776 6,328 6,730 6,886 7,090 7,492
Deposit-to-GDP ratio 0.55 0.54 0.65 0.67 0.69 0.71
Credit-to-GDP ratio 0.33 0.34 0.37 0.40 0.44 0.47
0.622 0.624 0.663 0.683 0.701 0.705
Access
Usage
FII
20
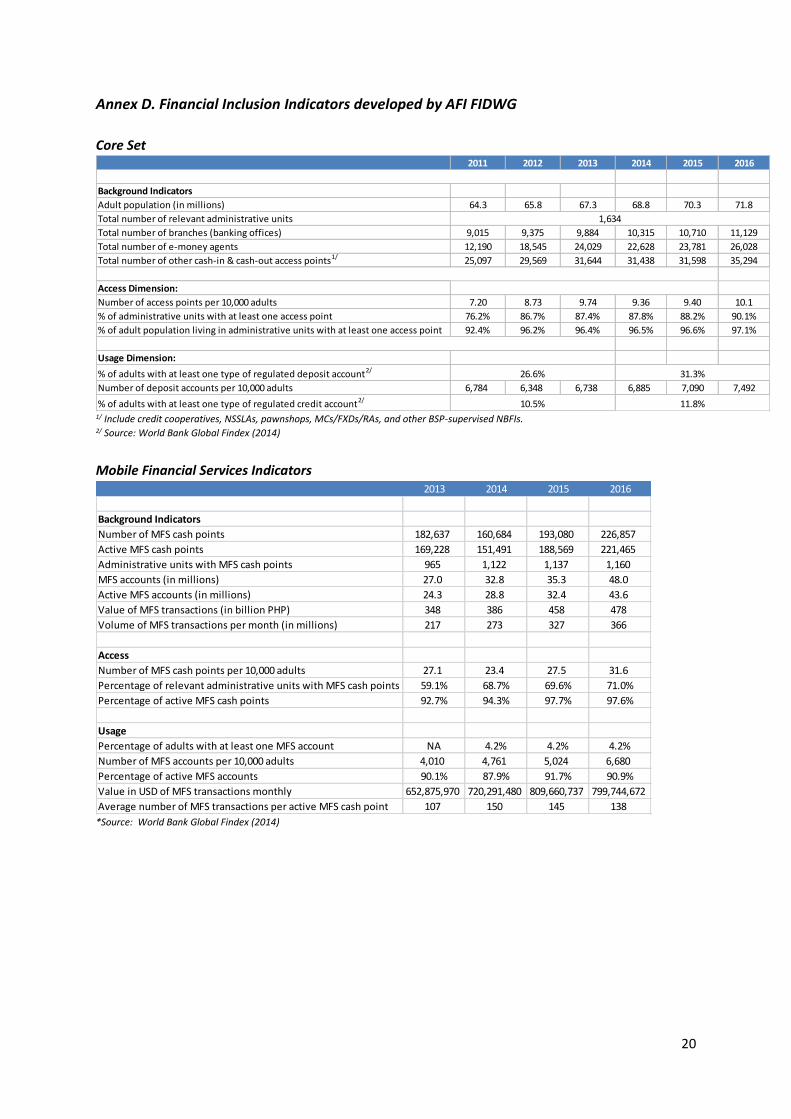
Annex D. Financial Inclusion Indicators developed by AFI FIDWG
Core Set
1/ Include credit cooperatives, NSSLAs, pawnshops, MCs/FXDs/RAs, and other BSP-supervised NBFIs. 2/ Source: World Bank Global Findex (2014)
Mobile Financial Services Indicators
*Source: World Bank Global Findex (2014)
2011 2012 2013 2014 2015 2016
Background Indicators
Adult population (in millions) 64.3 65.8 67.3 68.8 70.3 71.8
Total number of relevant administrative units
Total number of branches (banking offices) 9,015 9,375 9,884 10,315 10,710 11,129
Total number of e-money agents 12,190 18,545 24,029 22,628 23,781 26,028
Total number of other cash-in & cash-out access points1/ 25,097 29,569 31,644 31,438 31,598 35,294
Access Dimension:
Number of access points per 10,000 adults 7.20 8.73 9.74 9.36 9.40 10.1
% of administrative units with at least one access point 76.2% 86.7% 87.4% 87.8% 88.2% 90.1%
% of adult population living in administrative units with at least one access point 92.4% 96.2% 96.4% 96.5% 96.6% 97.1%
Usage Dimension:
% of adults with at least one type of regulated deposit account2/
Number of deposit accounts per 10,000 adults 6,784 6,348 6,738 6,885 7,090 7,492
% of adults with at least one type of regulated credit account2/
26.6%
10.5%
1,634
31.3%
11.8%
2013 2014 2015 2016
Background Indicators
Number of MFS cash points 182,637 160,684 193,080 226,857
Active MFS cash points 169,228 151,491 188,569 221,465
Administrative units with MFS cash points 965 1,122 1,137 1,160
MFS accounts (in millions) 27.0 32.8 35.3 48.0
Active MFS accounts (in millions) 24.3 28.8 32.4 43.6
Value of MFS transactions (in billion PHP) 348 386 458 478
Volume of MFS transactions per month (in millions) 217 273 327 366
Access
Number of MFS cash points per 10,000 adults 27.1 23.4 27.5 31.6
Percentage of relevant administrative units with MFS cash points 59.1% 68.7% 69.6% 71.0%
Percentage of active MFS cash points 92.7% 94.3% 97.7% 97.6%
Usage
Percentage of adults with at least one MFS account NA 4.2% 4.2% 4.2%
Number of MFS accounts per 10,000 adults 4,010 4,761 5,024 6,680
Percentage of active MFS accounts 90.1% 87.9% 91.7% 90.9%
Value in USD of MFS transactions monthly 652,875,970 720,291,480 809,660,737 799,744,672
Average number of MFS transactions per active MFS cash point 107 150 145 138
21
About IFAO IFAO designs, coordinates and implements key elements of the BSP financial inclusion agenda. These elements cover the areas of (a) financial inclusion policy research and formulation; (b) financial inclusion data and measurement; (c) financial learning sessions for targeted unbanked sectors; (d) advocacy activities. IFAO is also the technical secretariat of the inter-agency Financial Inclusion Steering Committee of the National Strategy for Financial Inclusion.
Inclusive Finance Advocacy Office (IFAO) 10th Floor, Multi-Storey Building, BSP Complex, A. Mabini St., Malate, Manila 1004, Philippines
[email protected] t +632-7087482 f +632-7087481