Embed Size (px)
Citation preview
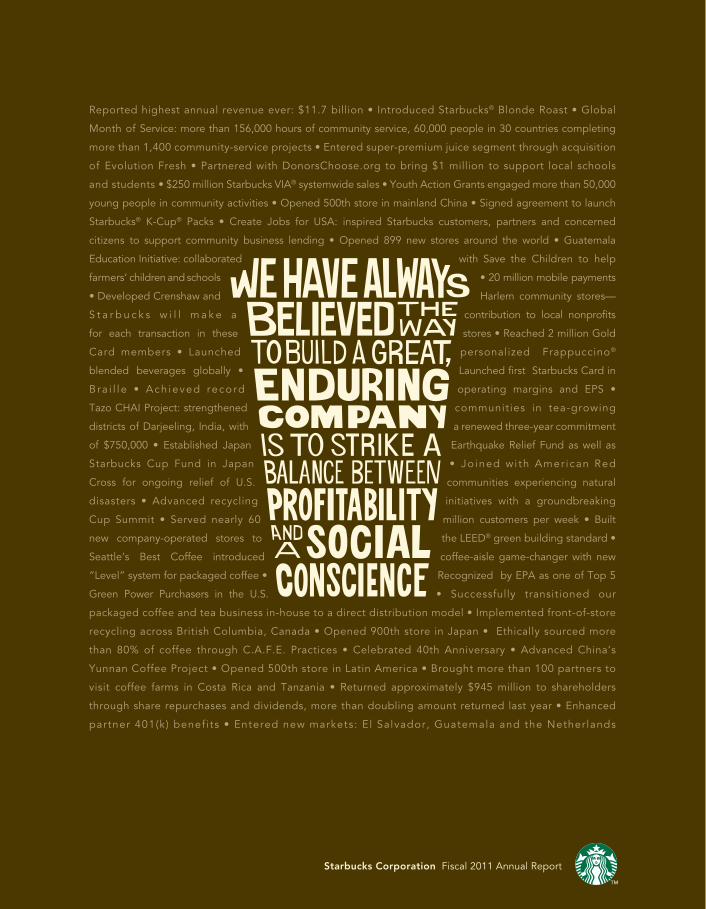
Reported highest annual revenue ever: $11.7 billion • Introduced Starbucks® Blonde Roast • Global
Month of Service: more than 156,000 hours of community service, 60,000 people in 30 countries completing
more than 1,400 community-service projects • Entered super-premium juice segment through acquisition
of Evolution Fresh • Partnered with DonorsChoose.org to bring $1 million to support local schools
and students • $250 million Starbucks VIA® systemwide sales • Youth Action Grants engaged more than 50,000
young people in community activities • Opened 500th store in mainland China • Signed agreement to launch
Starbucks® K-Cup® Packs • Create Jobs for USA: inspired Starbucks customers, partners and concerned
citizens to support community business lending • Opened 899 new stores around the world • Guatemala
Education Initiative: collaborated with Save the Children to help
farmers‘ children and schools • 20 million mobile payments
• Developed Crenshaw and Harlem community stores—
S t a r b u c k s w i l l m a k e a contribution to local nonprofi ts
for each transaction in these stores • Reached 2 million Gold
Card members • Launched personalized Frappuccino®
blended beverages globally • Launched fi rst Starbucks Card in
B ra i l l e • Ach ieved reco rd operating margins and EPS •
Tazo CHAI Project: strengthened communities in tea-growing
districts of Darjeeling, India, with a renewed three-year commitment
of $750,000 • Established Japan Earthquake Relief Fund as well as
Starbucks Cup Fund in Japan • Jo ined wi th Amer ican Red
Cross for ongoing relief of U.S. communities experiencing natural
disasters • Advanced recycling initiatives with a groundbreaking
Cup Summit • Served nearly 60 million customers per week • Built
new company-operated stores to the LEED® green building standard •
Seattle’s Best Coffee introduced coffee-aisle game-changer with new
“Level” system for packaged coffee • Recognized by EPA as one of Top 5
Green Power Purchasers in the U.S. • Successfully transitioned our
packaged coffee and tea business in-house to a direct distribution model • Implemented front-of-store
recycling across British Columbia, Canada • Opened 900th store in Japan • Ethically sourced more
than 80% of coffee through C.A.F.E. Practices • Celebrated 40th Anniversary • Advanced China’s
Yunnan Coffee Project • Opened 500th store in Latin America • Brought more than 100 partners to
visit coffee farms in Costa Rica and Tanzania • Returned approximately $945 million to shareholders
through share repurchases and dividends, more than doubling amount returned last year • Enhanced
partner 401(k) benef i ts • Entered new markets: El Salvador, Guatemala and the Netherlands
Starbucks Corporation Fiscal 2011 Annual Report
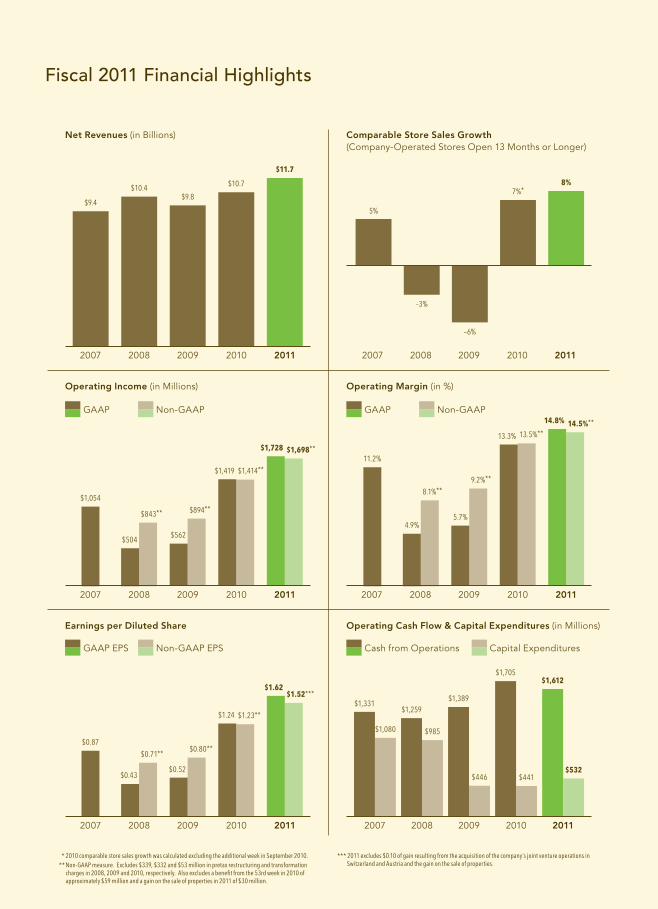
$1,612
$532
$1,705
$441
$1,259
$985
$1,389
$446
$1,331
$1,080
Operating Income (in Millions) Operating Margin (in %)
Earnings per Diluted Share
* 2010 comparable store sales growth was calculated excluding the additional week in September 2010.** Non-GAAP measure. Excludes $339, $332 and $53 million in pretax restructuring and transformation
charges in 2008, 2009 and 2010, respectively. Also excludes a benefi t from the 53rd week in 2010 of approximately $59 million and a gain on the sale of properties in 2011 of $30 million.
*** 2011 excludes $0.10 of gain resulting from the acquisition of the company’s joint venture operations inSwitzerland and Austria and the gain on the sale of properties.
Fiscal 2011 Financial Highlights
2007 2008 2009 2010 2011 2007 2008 2009 2010 2011
2007 2008 2009 2010 2011
2007 2008 2009 2010 2011 2007 2008 2009 2010 2011
$9.4
Net Revenues (in Billions) Comparable Store Sales Growth(Company-Operated Stores Open 13 Months or Longer)
$10.4
–3%
5%
8%
$9.8
–6%
$10.7
$11.7
7%*
Operating Cash Flow & Capital Expenditures (in Millions)
$1,728
$1.62
14.8%
$1,419
$1.24
13.3%
$504
$0.43
4.9%$562
$0.52
5.7%
2007 2008 2009 2010 2011
$1,698**
$1.52***
14.5%**
$1,414**
$1.23**
13.5%**
$843**
$0.71**
8.1%**$1,054
$0.87
11.2%
$894**
$0.80**
9.2%**
GAAP EPS
GAAP GAAP
Cash from OperationsNon-GAAP EPS
Non-GAAP Non-GAAP
Capital Expenditures
Dear Shareholders,
On almost every level, fi scal 2011 was a remarkable year for Starbucks. Our global business delivered the highest levels of service to our customers, a truly rewarding experience to our partners (employees), and a record-level performance to shareholders. As of the end of calendar 2011, Starbucks stock price had increased 43 percent from a year earlier.
What’s more, we achieved this success without losing sight of our core values. I cannot think of a more authentic way to have honored our 40th Anniversary than by living up to our long-held mission of balancing profi tability with a social conscience. This is such a powerful coupling, and I say with confi dence that Starbucks has never been so well positioned for profi table growth.
Last year, I wrote to you that the company’s improved operational foundation, invigorated innovative muscle,and heightened customer relevance presented us with an opportunity to build a different kind of organization.One that would leverage and extend our strengths both inside and outside our stores. I am pleased to report that in fi scal 2011 we delivered.
During the past year global revenues reached a record $11.7 billion, an 11 percent increase on a comparable 52-week basis. That revenue growth was driven by an 8 percent rise in global comparable store sales as Starbucks stores welcomed more visitors than ever before—approximately 60 million each week—and by growth in CPG revenues.By leveraging effi ciencies and tightly managing spend, we fl owed sales increases through to the bottom line,setting new records for operating income of $1.7 billion, up 22 percent, as well as for consolidated operating margin, which was 14.8 percent, up 150 basis points from last year.
We ended fi scal 2011 with record earnings per share of $1.62, up 31 percent from last year’s $1.24 per share.Through share repurchases and dividends, we returned approximately $945 million to shareholders, more thandoubling the amount returned in fi scal 2010.
It is signifi cant that we achieved these results against the backdrop of stubbornly higher commodity costs and adiffi cult global economy. Our momentum is also worth noting, as fourth-quarter global same-store sales grew ata rate not seen since 2006.
This strong performance is attributable to our unique business model, which continues to leverage our emotional connection to consumers, our global retail footprint, our diversifi ed CPG channel distribution capabilities and ongoing innovation across all areas.
Breakout, Relevant Innovation in Coffee, CPG and the Customer Experience
In 2011, we continued to evolve into a truly dynamic global organization, offering a portfolio of products to serve customers in our retail stores, at home, at work, on the go and online. Coffee remains our core and continues to driveour global business, and last year we launched fantastic new products while dramatically improving the ways in which those products reach customers.
Our evolving channel-development strategy continues to extend our portfolio of branded products. Among our most signifi cant moves in 2011 was transitioning our packaged coffee business in-house to a direct distribution model, allowing us to take control of our powerful relationship with grocery, drugstore, club and other sales channels. In addition, our continued growth of Starbucks VIA® Ready Brew and fi scal 2012 launch of K-Cup® packs position usto lead in the multibillion-dollar single-cup category. By the end of December, more than 103 million Starbucks® K-Cup® packs had already been shipped to U.S. food, drug, mass, club and specialty retailers. Meanwhile, Starbucks VIA® continued its acceleration, with an expanded platform of Starbucks VIA® branded products at 70,000 points of distribution generating $250 million in systemwide sales in fi scal 2011, a remarkable achievement for a product lessthan two years old.
In these ways and more, fi scal 2011 was a breakout year for CPG, which remains on track to one day rival the profi tability of our retail business.
In our stores, new products continued to generate excitement as well as sales. Personalized Frappuccino® blended beverages launched across the globe, and we just introduced Starbucks® Blonde Roast in the United States, providing a light roast coffee that—along with K-Cup® packs and Starbucks VIA®—each represents another $1 billion opportunity for the company. In food, we answered consumers’ desire for more choices with wholesome ingredients by introducing our Bistro Box platform, and response has been strong.
Our loyalty program also continues to distinguish us from competitors, with participation in My Starbucks Rewards™ now reaching more than 3.6 million active members. The 20 million mobile payments made at Starbucks stores in fi scal 2011—plus another six million by December’s end—were fueled by our hugely popular Starbucks Card Apps for the Android™ and iPhone,® once again refl ecting our ability to respond to the constantly changing marketplace in ways that strengthen our connections with customers.
Among our most exciting moves in 2011 was our November entrance into the $1.6 billion super-premium juice segment through the acquisition of Evolution Fresh, Inc., which also represents our intentions to more fully enter the $50 billion Health and Wellness sector.
I have always believed that effective innovation is about responding to, predicting and creating customers’ needs while staying true to our core values. In this regard, Starbucks performed exceptionally well in 2011.
Growth on a Global Scale
Around the world, our brand continues to resonate and business continues to grow. We ended fi scal 2011 with more than17,000 stores in 55 countries.
Our U.S. Retail segment delivered against all operating and performance metrics, and outside North America the number of transactions in our stores continued to accelerate, with disciplined execution enabling us to leverage that growth into higher profi ts. Looking ahead, China remains on track to become Starbucks second home market, where we currently operate morethan 500 stores across 44 Chinese cities and plan to open approximately 150 net new stores in 2012.
Globally, we plan to open 800 net new stores in 2012—including our desire to open our fi rst Starbucks store in India. Additionally, approximately 1,700 existing stores in the United States will be remodeled, and I encourage you to visit our new Times Square fl agship store, which is a terrifi c example of our ongoing retail innovation.
Finally, our global performance is already being enhanced by our new three-region leadership structure, which applies more focused leadership at the helm of each of the Americas, China and Asia Pacifi c, and EMEA regions, enabling our partners around the world to drive results more effectively to further our worldwide momentum.
Using Scale for Good
One way to measure our incredible success this year is certainly the shareholder value we have built. Our balance sheet has never been stronger and our profi ts never higher. However, I strongly believe that today’s times require that companies be evaluated by more well-rounded measures.
I still believe that shareholder value must be linked to creating value for a company’s people, value for its customers and—perhaps now more than ever—value for the communities it serves. Balancing profi tability and social conscience is as much apart of Starbucks core as coffee. As we continually ask ourselves how we might use our scale for good, we have answered by proactively addressing environmental issues and supporting our partners’ volunteer efforts, among many other things.
Most recently we have focused on the high unemployment plaguing the United States, and I am proud that, as an organization, Starbucks is doing its part while appropriately supporting our business. We added approximately 3,700 net new jobs last year,and plan another 12,500 globally for 2012. But we can do more. That is why, in association with the Opportunity Finance Network, we launched Create Jobs for USA through which our customers can donate toward restarting the nation’s jobs engine through loans to community businesses. In addition to $5 million seeded by The Starbucks Foundation, approximately $2 million has been raised in the fi rst two months and loans have begun fl owing to small companies and community businesses across the country.Like Starbucks ethical sourcing, environmental and volunteer efforts, the Create Jobs for USA initiative is right for Starbucks because it authentically refl ects the times we live in while being relevant to our brand.
Thank You
Fiscal 2011 was a remarkable year for Starbucks. We powerfully asserted our coffee authority across multiple channels while creatively enhancing the food and beverage experience for our customers, further differentiating ourselves from competitors. These feats are, as always, due to the incredible talent of our nearly 200,000 partners, and I thank them for their dedication to
bringing value to our customers every day in more ways than ever before.
I also thank you, our shareholders, for yet another year of believingin us. Starbucks future has never been brighter. Our foundation never more solid. We are remarkably well positioned to pursueour diversifi ed, multichannel, multibrand business model in theyear ahead.
Warm regards,
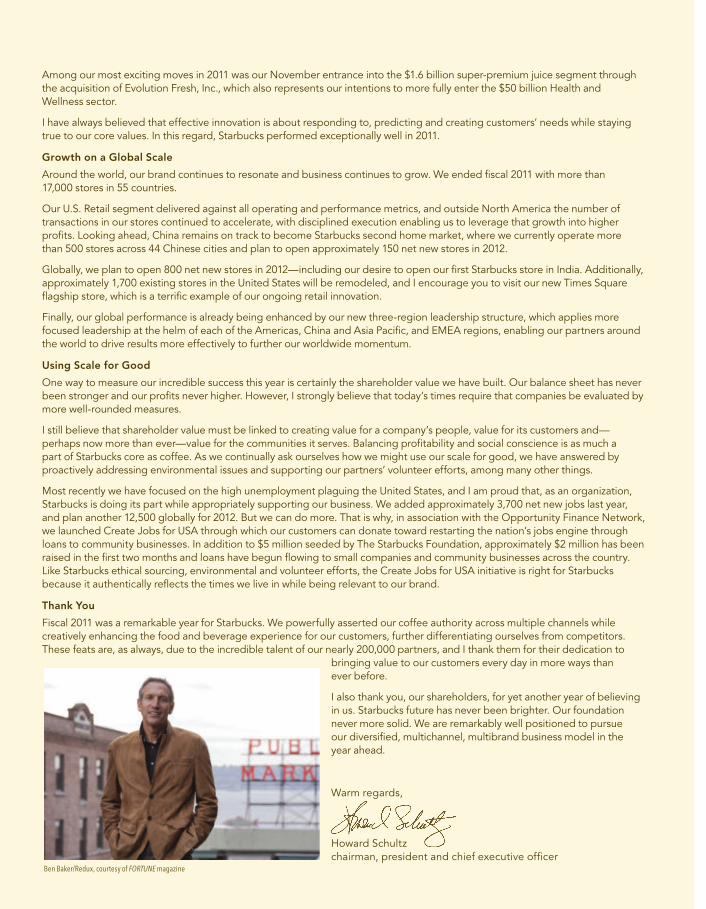
Howard Schultzchairman, president and chief executive offi cer
Ben Baker/Redux, courtesy of FORTUNE magazine
UNITED STATES SECURITIES AND EXCHANGE COMMISSIONWashington, DC 20549
Form 10-KÍ ANNUAL REPORT PURSUANT TO SECTION 13 OR 15(d)
OF THE SECURITIES EXCHANGE ACT OF 1934For the fiscal year ended October 2, 2011
or‘ TRANSITION REPORT PURSUANT TO SECTION 13 OR 15(d)
OF THE SECURITIES EXCHANGE ACT OF 1934For the transition period from to .
Commission File Number: 0-20322
Starbucks Corporation(Exact Name of Registrant as Specified in Its Charter)
Washington 91-1325671(State of Incorporation) (IRS Employer ID)
2401 Utah Avenue SouthSeattle, Washington 98134
(206) 447-1575(Address of principal executive offices, zip code, telephone number)
Securities Registered Pursuant to Section 12(b) of the Act:Title of Each Class Name of Each Exchange on Which Registered
Common Stock, $0.001 par value per share Nasdaq Global Select MarketSecurities Registered Pursuant to Section 12(g) of the Act: None
Indicate by check mark if the registrant is a well-known seasoned issuer, as defined in Rule 405 of the SecuritiesAct. Yes Í No ‘Indicate by check mark if the registrant is not required to file reports pursuant to Section 13 or Section 15(d) of theAct. Yes ‘ No ÍIndicate by check mark whether the registrant: (1) has filed all reports required to be filed by Section 13 or 15(d) of theSecurities Exchange Act of 1934 during the preceding 12 months (or for such shorter period that the registrant was required tofile such reports), and (2) has been subject to such filing requirements for the past 90 days. Yes Í No ‘Indicate by check mark whether the registrant has submitted electronically and posted on its corporate Web site, if any, everyInteractive Data File required to be submitted and posted pursuant to Rule 405 of Regulation S-T (§ 232.405 of this chapter)during the preceding 12 months (or for such shorter period that the registrant was required to submit and post suchfiles). Yes Í No ‘Indicate by check mark if disclosure of delinquent filers pursuant to Item 405 of Regulation of S-K is not contained herein, andwill not be contained, to the best of the registrant’s knowledge, in definitive proxy or information statements incorporated byreference in Part III of this Form 10-K or any amendment to this Form 10-K. ‘Indicate by check mark whether the registrant is a large accelerated filer, an accelerated filer, a non-accelerated filer, or asmaller reporting company. See the definitions of “large accelerated filer,” “accelerated filer” and “smaller reporting company”in Rule 12b-2 of the Exchange Act. (Check one):Large accelerated filer Í Accelerated filer ‘ Non-accelerated filer ‘ Smaller reporting company ‘
(Do not check if a smaller reporting company)Indicate by check mark whether the registrant is a shell company (as defined in Rule 12b-2 of the ExchangeAct). Yes ‘ No ÍThe aggregate market value of the voting stock held by non-affiliates of the registrant as of the last business day of theregistrant’s most recently completed second fiscal quarter, based upon the closing sale price of the registrant’s common stock onApril 1, 2011 as reported on the NASDAQ Global Select Market was $27 billion. As of November 11, 2011, there were 745.4million shares of the registrant’s Common Stock outstanding.
DOCUMENTS INCORPORATED BY REFERENCEPortions of the definitive Proxy Statement for the registrant’s Annual Meeting of Shareholders to be held on March 21, 2012have been incorporated by reference into Part III of this Annual Report on Form 10-K.
STARBUCKS CORPORATION
Form 10-K
For the Fiscal Year Ended October 2, 2011
TABLE OF CONTENTS
PART I
Item 1 Business . . . . . . . . . . . . . . . . . . . . . . . . . . . . . . . . . . . . . . . . . . . . . . . . . . . . . . . . . . . . . . . . . . . . . . . . 2
Item 1A Risk Factors . . . . . . . . . . . . . . . . . . . . . . . . . . . . . . . . . . . . . . . . . . . . . . . . . . . . . . . . . . . . . . . . . . . . . 9
Item 1B Unresolved Staff Comments . . . . . . . . . . . . . . . . . . . . . . . . . . . . . . . . . . . . . . . . . . . . . . . . . . . . . . . . 16
Item 2 Properties . . . . . . . . . . . . . . . . . . . . . . . . . . . . . . . . . . . . . . . . . . . . . . . . . . . . . . . . . . . . . . . . . . . . . . . 16
Item 3 Legal Proceedings . . . . . . . . . . . . . . . . . . . . . . . . . . . . . . . . . . . . . . . . . . . . . . . . . . . . . . . . . . . . . . . . 16
Item 4 (Removed and Reserved) . . . . . . . . . . . . . . . . . . . . . . . . . . . . . . . . . . . . . . . . . . . . . . . . . . . . . . . . . . . 17
PART II
Item 5 Market for the Registrant’s Common Equity, Related Shareholder Matters and Issuer Purchases ofEquity Securities . . . . . . . . . . . . . . . . . . . . . . . . . . . . . . . . . . . . . . . . . . . . . . . . . . . . . . . . . . . . . . . . . 18
Item 6 Selected Financial Data . . . . . . . . . . . . . . . . . . . . . . . . . . . . . . . . . . . . . . . . . . . . . . . . . . . . . . . . . . . . 20
Item 7 Management’s Discussion and Analysis of Financial Condition and Results of Operations . . . . . . . . 22
Item 7A Quantitative and Qualitative Disclosures About Market Risk . . . . . . . . . . . . . . . . . . . . . . . . . . . . . . . 42
Item 8 Financial Statements and Supplementary Data . . . . . . . . . . . . . . . . . . . . . . . . . . . . . . . . . . . . . . . . . . 43
Report of Independent Registered Public Accounting Firm . . . . . . . . . . . . . . . . . . . . . . . . . . . . . . . . . 77
Item 9 Changes in and Disagreements with Accountants on Accounting and Financial Disclosure . . . . . . . . 78
Item 9A Controls and Procedures . . . . . . . . . . . . . . . . . . . . . . . . . . . . . . . . . . . . . . . . . . . . . . . . . . . . . . . . . . . 78
Item 9B Other Information . . . . . . . . . . . . . . . . . . . . . . . . . . . . . . . . . . . . . . . . . . . . . . . . . . . . . . . . . . . . . . . . 81
PART III
Item 10 Directors, Executive Officers and Corporate Governance . . . . . . . . . . . . . . . . . . . . . . . . . . . . . . . . . . 82
Item 11 Executive Compensation . . . . . . . . . . . . . . . . . . . . . . . . . . . . . . . . . . . . . . . . . . . . . . . . . . . . . . . . . . . 82
Item 12 Security Ownership of Certain Beneficial Owners and Management and Related ShareholderMatters . . . . . . . . . . . . . . . . . . . . . . . . . . . . . . . . . . . . . . . . . . . . . . . . . . . . . . . . . . . . . . . . . . . . . . . . . 82
Item 13 Certain Relationships and Related Transactions, and Director Independence . . . . . . . . . . . . . . . . . . . 82
Item 14 Principal Accountant Fees and Services . . . . . . . . . . . . . . . . . . . . . . . . . . . . . . . . . . . . . . . . . . . . . . . . 82
PART IV
Item 15 Exhibits and Financial Statement Schedules . . . . . . . . . . . . . . . . . . . . . . . . . . . . . . . . . . . . . . . . . . . . 83
SIGNATURES . . . . . . . . . . . . . . . . . . . . . . . . . . . . . . . . . . . . . . . . . . . . . . . . . . . . . . . . . . . . . . . . . . . . . . . . . . 84
INDEX TO EXHIBITS . . . . . . . . . . . . . . . . . . . . . . . . . . . . . . . . . . . . . . . . . . . . . . . . . . . . . . . . . . . . . . . . . . . . 86
CAUTIONARY NOTE REGARDING FORWARD-LOOKING STATEMENTS
This Annual Report on Form 10-K includes “forward-looking” statements within the meaning of the PrivateSecurities Litigation Reform Act of 1995. Forward-looking statements can be identified by the fact that they do notrelate strictly to historical or current facts. They often include words such as “believes,” “expects,” “anticipates,”“estimates,” “intends,” “plans,” “seeks” or words of similar meaning, or future or conditional verbs, such as “will,”“should,” “could,” “may,” “aims,” “intends,” or “projects.” A forward-looking statement is neither a prediction nor aguarantee of future events or circumstances, and those future events or circumstances may not occur. You should notplace undue reliance on forward-looking statements, which speak only as of the date of this Annual Report on Form10-K. These forward-looking statements are all based on currently available operating, financial and competitiveinformation and are subject to various risks and uncertainties. Our actual future results and trends may differmaterially depending on a variety of factors, including, but not limited to, the risks and uncertainties discussed under“Risk Factors” and “Management’s Discussion and Analysis of Financial Condition and Results of Operations”.Given these risks and uncertainties, you should not rely on forward-looking statements as a prediction of actualresults. Any or all of the forward-looking statements contained in this Annual Report on Form 10-K and any otherpublic statement made by us, including by our management, may turn out to be incorrect. We are including thiscautionary note to make applicable and take advantage of the safe harbor provisions of the Private SecuritiesLitigation Reform Act of 1995 for forward-looking statements. We expressly disclaim any obligation to update orrevise any forward-looking statements, whether as a result of new information, future events or otherwise.
1
PART I
Item 1. Business
General
Starbucks is the premier roaster, marketer and retailer of specialty coffee in the world, operating in more than 50countries. Formed in 1985, Starbucks Corporation’s common stock trades on the NASDAQ Global Select Market(“NASDAQ”) under the symbol “SBUX.” We purchase and roast high-quality whole bean coffees that we sell,along with handcrafted coffee and tea beverages and a variety of fresh food items, through company-operated stores.We also sell a variety of coffee and tea products and license our trademarks through other channels such as licensedstores, grocery and national foodservice accounts. In addition to our flagship Starbucks brand, our portfolio alsoincludes Tazo® Tea, Seattle’s Best Coffee®, and Starbucks VIA® Ready Brew.
Our objective is to maintain Starbucks standing as one of the most recognized and respected brands in the world. Toachieve this goal, we are continuing the disciplined expansion of our store base, primarily focused on growth incountries outside of the US. In addition, by leveraging the experience gained through our traditional store model, wecontinue to offer consumers new coffee products in multiple forms, across new categories, and through diversechannels. Starbucks Global Responsibility strategy and commitments related to coffee and the communities we dobusiness in, as well as our focus on being an employer of choice, are also key complements to our businessstrategies.
In this Annual Report on Form 10-K (“10-K” or “Report”) for the fiscal year ended October 2, 2011 (“fiscal 2011”),Starbucks Corporation (together with its subsidiaries) is referred to as “Starbucks,” the “Company,” “we,” “us” or“our”.
Segment Financial Information
Starbucks has three reportable operating segments: United States (“US”), International, and Global ConsumerProducts Group (“CPG”). Our Seattle’s Best Coffee operating segment is reported in “Other” with our DigitalVentures business and unallocated corporate expenses that pertain to corporate administrative functions that supportour operating segments but are not specifically attributable to or managed by any segment and are not included inthe reported financial results of the operating segments. Segment revenues as a percentage of total net revenues forfiscal year 2011 were as follows: US (69%), International (22%), and CPG (7%). The Other category comprised 2%of total net revenues.
The US and International segments both include company-operated stores and licensed stores. The Internationalsegment also includes foodservice accounts primarily in Canada and the United Kingdom (“UK”). Our Internationalsegment’s largest markets, based on number of company-operated and licensed stores, are Canada, Japan and theUK. The CPG segment includes packaged coffee and tea, Starbucks VIA® Ready Brew and other branded productssold worldwide through channels such as grocery stores, warehouse clubs and convenience stores, and USfoodservice accounts.
Financial information for Starbucks reportable operating segments and Other is included in Note 18 to theconsolidated financial statements included in Item 8 of this 10-K.
Revenue Components
We generate our revenues through company-operated stores, licensed stores, consumer packaged goods andfoodservice operations. Our consumer packaged goods and foodservice operations include packaged coffee and teasold in grocery and warehouse club stores, licensing arrangements with business partners to use our brands onvarious products, and arrangements with foodservice companies that support a variety of locations outside our retailstore footprint.
2
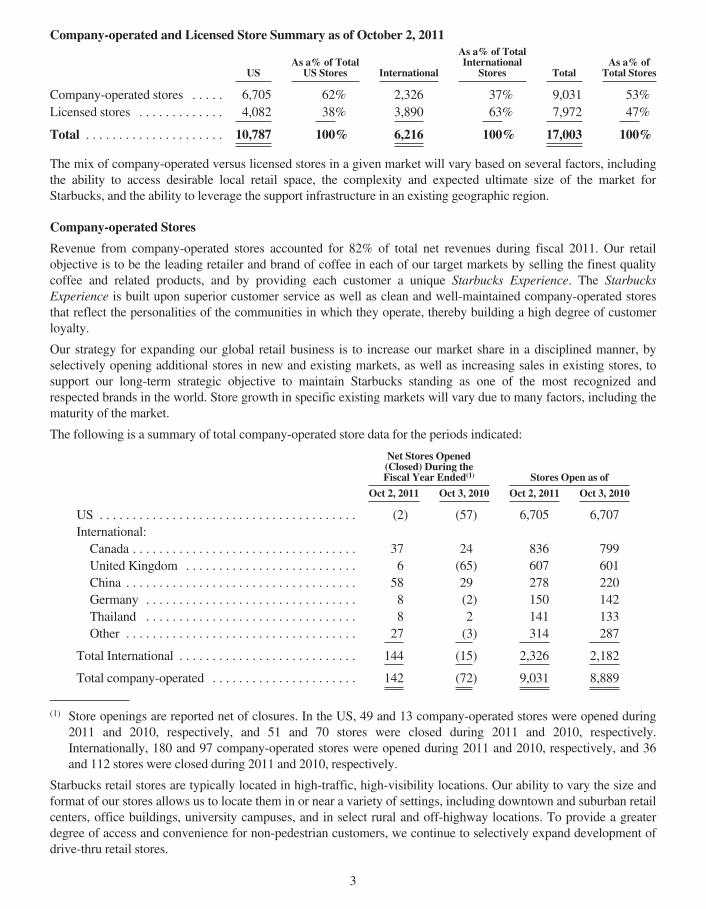
Company-operated and Licensed Store Summary as of October 2, 2011
USAs a% of Total
US Stores International
As a% of TotalInternational
Stores TotalAs a% of
Total Stores
Company-operated stores . . . . . 6,705 62% 2,326 37% 9,031 53%Licensed stores . . . . . . . . . . . . . 4,082 38% 3,890 63% 7,972 47%
Total . . . . . . . . . . . . . . . . . . . . . 10,787 100% 6,216 100% 17,003 100%
The mix of company-operated versus licensed stores in a given market will vary based on several factors, includingthe ability to access desirable local retail space, the complexity and expected ultimate size of the market forStarbucks, and the ability to leverage the support infrastructure in an existing geographic region.
Company-operated Stores
Revenue from company-operated stores accounted for 82% of total net revenues during fiscal 2011. Our retailobjective is to be the leading retailer and brand of coffee in each of our target markets by selling the finest qualitycoffee and related products, and by providing each customer a unique Starbucks Experience. The StarbucksExperience is built upon superior customer service as well as clean and well-maintained company-operated storesthat reflect the personalities of the communities in which they operate, thereby building a high degree of customerloyalty.
Our strategy for expanding our global retail business is to increase our market share in a disciplined manner, byselectively opening additional stores in new and existing markets, as well as increasing sales in existing stores, tosupport our long-term strategic objective to maintain Starbucks standing as one of the most recognized andrespected brands in the world. Store growth in specific existing markets will vary due to many factors, including thematurity of the market.
The following is a summary of total company-operated store data for the periods indicated:
Net Stores Opened(Closed) During theFiscal Year Ended(1) Stores Open as of
Oct 2, 2011 Oct 3, 2010 Oct 2, 2011 Oct 3, 2010
US . . . . . . . . . . . . . . . . . . . . . . . . . . . . . . . . . . . . . . . (2) (57) 6,705 6,707International:Canada . . . . . . . . . . . . . . . . . . . . . . . . . . . . . . . . . . 37 24 836 799United Kingdom . . . . . . . . . . . . . . . . . . . . . . . . . . 6 (65) 607 601China . . . . . . . . . . . . . . . . . . . . . . . . . . . . . . . . . . . 58 29 278 220Germany . . . . . . . . . . . . . . . . . . . . . . . . . . . . . . . . 8 (2) 150 142Thailand . . . . . . . . . . . . . . . . . . . . . . . . . . . . . . . . 8 2 141 133Other . . . . . . . . . . . . . . . . . . . . . . . . . . . . . . . . . . . 27 (3) 314 287
Total International . . . . . . . . . . . . . . . . . . . . . . . . . . . 144 (15) 2,326 2,182
Total company-operated . . . . . . . . . . . . . . . . . . . . . . 142 (72) 9,031 8,889
(1) Store openings are reported net of closures. In the US, 49 and 13 company-operated stores were opened during2011 and 2010, respectively, and 51 and 70 stores were closed during 2011 and 2010, respectively.Internationally, 180 and 97 company-operated stores were opened during 2011 and 2010, respectively, and 36and 112 stores were closed during 2011 and 2010, respectively.
Starbucks retail stores are typically located in high-traffic, high-visibility locations. Our ability to vary the size andformat of our stores allows us to locate them in or near a variety of settings, including downtown and suburban retailcenters, office buildings, university campuses, and in select rural and off-highway locations. To provide a greaterdegree of access and convenience for non-pedestrian customers, we continue to selectively expand development ofdrive-thru retail stores.
3
Starbucks stores offer a choice of regular and decaffeinated coffee beverages, a broad selection of Italian-styleespresso beverages, cold blended beverages, iced shaken refreshment beverages, a selection of premium teas,distinctively packaged roasted whole bean coffees, and a variety of Starbucks VIA® Ready Brew soluble coffees.Starbucks stores also offer a variety of fresh food items, including selections focusing on high-quality ingredients,nutritional value and great flavor. Food items include pastries, prepared breakfast and lunch sandwiches, oatmealand salads, as well as juices and bottled water. In addition to being offered in our US and Canada stores, duringfiscal 2011, we expanded our food warming program into our stores in China, with over 90% of the stores in thesemarkets providing warm food items as of the end of fiscal 2011. A focused selection of beverage-making equipmentand accessories are also sold in the stores. Each Starbucks store varies its product mix depending upon the size of thestore and its location. To compliment the in-store experience, in company-operated Starbucks stores in the US, wealso provide customers free access to wireless internet.
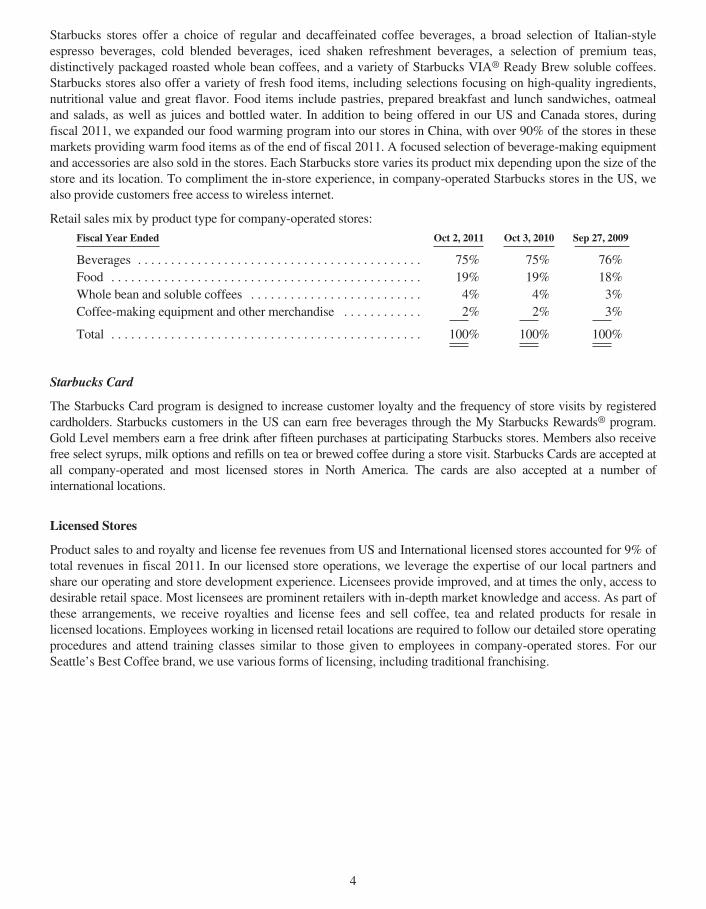
Retail sales mix by product type for company-operated stores:
Fiscal Year Ended Oct 2, 2011 Oct 3, 2010 Sep 27, 2009
Beverages . . . . . . . . . . . . . . . . . . . . . . . . . . . . . . . . . . . . . . . . . . . 75% 75% 76%Food . . . . . . . . . . . . . . . . . . . . . . . . . . . . . . . . . . . . . . . . . . . . . . . 19% 19% 18%Whole bean and soluble coffees . . . . . . . . . . . . . . . . . . . . . . . . . . 4% 4% 3%Coffee-making equipment and other merchandise . . . . . . . . . . . . 2% 2% 3%
Total . . . . . . . . . . . . . . . . . . . . . . . . . . . . . . . . . . . . . . . . . . . . . . . 100% 100% 100%
Starbucks Card
The Starbucks Card program is designed to increase customer loyalty and the frequency of store visits by registeredcardholders. Starbucks customers in the US can earn free beverages through the My Starbucks Rewards® program.Gold Level members earn a free drink after fifteen purchases at participating Starbucks stores. Members also receivefree select syrups, milk options and refills on tea or brewed coffee during a store visit. Starbucks Cards are accepted atall company-operated and most licensed stores in North America. The cards are also accepted at a number ofinternational locations.
Licensed Stores
Product sales to and royalty and license fee revenues from US and International licensed stores accounted for 9% oftotal revenues in fiscal 2011. In our licensed store operations, we leverage the expertise of our local partners andshare our operating and store development experience. Licensees provide improved, and at times the only, access todesirable retail space. Most licensees are prominent retailers with in-depth market knowledge and access. As part ofthese arrangements, we receive royalties and license fees and sell coffee, tea and related products for resale inlicensed locations. Employees working in licensed retail locations are required to follow our detailed store operatingprocedures and attend training classes similar to those given to employees in company-operated stores. For ourSeattle’s Best Coffee brand, we use various forms of licensing, including traditional franchising.
4
Starbucks total licensed stores by region and country as of October 2, 2011 are as follows:Asia Pacific Europe/Middle East/Africa Americas
Japan . . . . . . . . . . . . . . . 935 Turkey . . . . . . . . . . . . . . . . 153 US . . . . . . . . . . . . . . . . . . . 4,082South Korea . . . . . . . . . . 367 UK . . . . . . . . . . . . . . . . . . . 128 Mexico . . . . . . . . . . . . . . . . 318Taiwan . . . . . . . . . . . . . . 249 United Arab Emirates . . . . . 94 Canada . . . . . . . . . . . . . . . . 284China . . . . . . . . . . . . . . . 218 Spain . . . . . . . . . . . . . . . . . . 75 Other . . . . . . . . . . . . . . . . . . 92Philippines . . . . . . . . . . . 183 Kuwait . . . . . . . . . . . . . . . . 67Malaysia . . . . . . . . . . . . . 121 Saudi Arabia . . . . . . . . . . . . 65Hong Kong . . . . . . . . . . . 117 Greece . . . . . . . . . . . . . . . . 59Indonesia . . . . . . . . . . . . 109 Russia . . . . . . . . . . . . . . . . . 52New Zealand . . . . . . . . . 35 Other . . . . . . . . . . . . . . . . . . 169
Total . . . . . . . . . . . . . . . . 2,334 Total . . . . . . . . . . . . . . . . . . 862 Total . . . . . . . . . . . . . . . . . . 4,776
In the US, 215 and 166 licensed stores were opened during 2011 and 2010, respectively, and 557 and 106 licensedstores were closed during 2011 and 2010, respectively. The 557 licensed stores that were closed in the US duringfiscal 2011 include 475 Seattle’s Best Coffee locations in Borders Bookstores. Internationally, 455 and 335 licensedstores were opened during 2011 and 2010, respectively, and 110 and 100 licensed stores were closed during 2011and 2010, respectively.
Consumer Packaged Goods
Consumer packaged goods includes both domestic and international sales of packaged coffee and tea to grocery andwarehouse club stores. It also includes revenues from product sales to and licensing revenues from manufacturersthat produce and market Starbucks and Seattle’s Best Coffee branded products through licensing agreements.Revenues from sales of packaged coffee and tea comprised 4% of total net revenues in fiscal 2011. In prior yearsthrough the first several months of fiscal 2011, we sold a selection of Starbucks and Seattle’s Best Coffee brandedpackaged coffees and Tazo® teas in grocery and warehouse club stores throughout the US and to grocery stores inCanada, the UK and other European countries through a distribution arrangement with Kraft Foods Global, Inc.Kraft managed the distribution, marketing, advertising and promotion of these products as a part of thatarrangement. During fiscal 2011, we successfully transitioned these businesses, including the marketing,advertising, and promotion of these products, from our previous distribution arrangement with Kraft and beganselling these products directly to the grocery and warehouse club stores. We also sell packaged coffee and teadirectly to warehouse club stores in international markets.
Revenues from licensing our branded products accounted for 1% of total net revenues in fiscal 2011. We license therights to produce and market Starbucks and Seattle’s Best Coffee branded products through several partnershipsboth domestically and internationally. We also sell ingredients to these licensees to manufacturer our brandedproducts. Significant licensing agreements include:
• The North American Coffee Partnership, a joint venture with the Pepsi-Cola Company in which Starbucks isa 50% equity investor, manufactures and markets ready-to-drink beverages, including bottled Frappuccino®
beverages and Starbucks DoubleShot® espresso drink and Seattle’s Best Coffee® ready-to-drink espressobeverages in the US and Canada;
• licensing agreements with Arla, Suntory, and Dong Suh Foods for the manufacturing, marketing anddistribution of Starbucks Discoveries®, a ready-to-drink chilled cup coffee beverage, in Europe, Japan andSouth Korea, respectively;
• a licensing agreement with a partnership formed by Unilever and Pepsi-Cola Company for themanufacturing, marketing and distribution of Starbucks super-premium Tazo® Tea beverages in the US; and
• a licensing agreement with Unilever for the manufacturing, marketing and distribution of Starbucks® super-premium ice cream products in the US.
5
Foodservice
Revenues from foodservice accounts comprised 4% of total net revenues in fiscal 2011. We sell Starbucks® andSeattle’s Best Coffee® whole bean and ground coffees, a selection of premium Tazo® teas, Starbucks VIA® ReadyBrew, and other related products to institutional foodservice companies that service business and industry,education, healthcare, office coffee distributors, hotels, restaurants, airlines and other retailers. We also sell ourSeattle’s Best Coffee® through arrangements with national accounts. The majority of the sales in this channel comethrough national broadline distribution networks with SYSCO Corporation, US FoodserviceTM, and otherdistributors.
Product Supply
Starbucks is committed to selling only the finest whole bean coffees and coffee beverages. To ensure compliancewith our rigorous coffee standards, we control coffee purchasing, roasting and packaging, and the global distributionof coffee used in our operations. We purchase green coffee beans from multiple coffee-producing regions around theworld and custom roast them to our exacting standards, for our many blends and single origin coffees.
The price of coffee is subject to significant volatility. Although most coffee trades in the commodity market, high-altitude arabica coffee of the quality sought by Starbucks tends to trade on a negotiated basis at a premium above the“C” coffee commodity coffee price. Both the premium and the commodity price depend upon the supply anddemand at the time of purchase. Supply and price can be affected by multiple factors in the producing countries,including weather, political and economic conditions. Price is also impacted by trading activities in the arabicacoffee futures market, including hedge funds and commodity index funds. In addition, green coffee prices have beenaffected in the past, and may be affected in the future, by the actions of certain organizations and associations thathave historically attempted to influence prices of green coffee through agreements establishing export quotas or byrestricting coffee supplies.
We buy coffee using fixed-price and price-to-be-fixed purchase commitments, depending on market conditions, tosecure an adequate supply of quality green coffee. Price-to-be-fixed contracts are purchase commitments wherebythe quality, quantity, delivery period, and other negotiated terms are agreed upon, but the date at which the base “C”coffee commodity price component will be fixed has not yet been established. For these types of contracts, eitherStarbucks or the seller has the option to select a date on which to “fix” the base “C” coffee commodity price prior tothe delivery date. Until prices are fixed, we estimate the total cost of these purchase commitments. As of October 2,2011, we had a total of $1.0 billion in purchase commitments, of which $193 million represented the estimated costof price-to-be-fixed contracts. All price-to-be-fixed contracts as of October 2, 2011 were at the Company’s option tofix the base “C” coffee commodity price component. Total purchase commitments, together with existing inventory,are expected to provide an adequate supply of green coffee through fiscal 2012.
We depend upon our relationships with coffee producers, outside trading companies and exporters for our supply ofgreen coffee. We believe, based on relationships established with our suppliers, the risk of non-delivery on suchpurchase commitments is remote.
To help ensure sustainability and future supply of high-quality green coffees and to reinforce our leadership role inthe coffee industry, Starbucks operates Farmer Support Centers in Costa Rica and Rwanda, among other locations.The Farmer Support Centers are staffed with agronomists and sustainability experts who work with coffee farmingcommunities to promote best practices in coffee production designed to improve both coffee quality and yields.
In addition to coffee, we also purchase significant amounts of dairy products, particularly fluid milk, to support theneeds of our company-operated retail stores. Our highest volumes of dairy purchases are in the US, Canada and theUK. For these markets, we purchase substantially all of our fluid milk requirements from seven dairy suppliers. Webelieve, based on relationships established with these suppliers, that the risk of non-delivery of sufficient fluid milkto support these retail businesses is remote.
Products other than whole bean coffees and coffee beverages sold in Starbucks stores are obtained through a numberof different channels. Beverage ingredients other than coffee and milk, including leaf teas as well as our selection of
6
ready-to-drink beverages, are purchased from several specialty suppliers, usually under long-term supply contracts.Food products, such as fresh pastries, breakfast sandwiches and lunch items, are purchased from national, regionaland local sources. We also purchase a broad range of paper and plastic products, such as cups and cutlery, fromseveral companies to support the needs of our retail stores as well as our manufacturing and distribution operations.We believe, based on relationships established with these suppliers and manufacturers, that the risk of non-deliveryis remote.
Competition
Our primary competitors for coffee beverage sales are quick-service restaurants and specialty coffee shops. Inalmost all markets in which we do business, there are numerous competitors in the specialty coffee beveragebusiness. We believe that our customers choose among specialty coffee retailers primarily on the basis of productquality, service and convenience, as well as price. We continue to experience direct competition from largecompetitors in the US quick-service restaurant sector and continue to face competition from well-establishedcompanies in many international markets and in the US ready-to-drink coffee beverage market.
Our whole bean coffees, ground packaged coffees, Tazo® teas, and Starbucks VIA® Ready Brew compete directlyagainst specialty coffees and teas sold through supermarkets, club stores and specialty retailers. Our whole beancoffees, coffee beverages, and Starbucks VIA® Ready Brew compete indirectly against all other coffees on themarket. Starbucks also faces competition from both restaurants and other specialty retailers for prime retail locationsand qualified personnel to operate both new and existing stores.
Patents, Trademarks, Copyrights and Domain Names
Starbucks owns and has applied to register numerous trademarks and service marks in the US and in manyadditional countries throughout the world. Some of our trademarks, including Starbucks, the Starbucks logo,Seattle’s Best Coffee, Frappuccino, Starbucks VIA and Tazo are of material importance. The duration of trademarkregistrations varies from country to country. However, trademarks are generally valid and may be renewedindefinitely as long as they are in use and/or their registrations are properly maintained.
We own numerous copyrights for items such as product packaging, promotional materials, in-store graphics andtraining materials. We also hold patents on certain products, systems and designs. In addition, Starbucks hasregistered and maintains numerous Internet domain names, including “Starbucks.com”, “Starbucks.net”, and“Seattlesbest.com.”
Research and Development
Our research and development teams are responsible for the technical development of food and beverage productsand new equipment. We spent approximately $15 million, $9 million and $7 million during fiscal 2011, 2010 and2009, respectively, on technical research and development activities, in addition to customary product testing andproduct and process improvements in all areas of our business.
Seasonality and Quarterly Results
Our business is subject to seasonal fluctuations, including fluctuations resulting from the holiday season. Cash flowsfrom operations are considerably higher in the first fiscal quarter than the remainder of the year. This is largelydriven by cash received as Starbucks Cards are purchased and loaded during the holiday season. Since revenuesfrom the Starbucks Cards are recognized upon redemption and not when purchased, seasonal fluctuations on theconsolidated statements of earnings are much less pronounced. Quarterly results can also be affected by the timingof the opening of new stores and the closing of existing stores. For these reasons, results for any quarter are notnecessarily indicative of the results that may be achieved for the full fiscal year.
7
Employees
Starbucks employed approximately 149,000 people worldwide as of October 2, 2011. In the US, Starbucksemployed approximately 112,000 people, with 106,000 in company-operated stores and the remainder in supportfacilities, store development, and roasting and warehousing operations. Approximately 37,000 employees wereemployed outside of the US, with 35,000 in company-operated stores and the remainder in regional support facilitiesand roasting and warehousing operations. The number of Starbucks employees represented by unions is notsignificant. We believe our current relations with our employees are good.
Executive officers of the registrantName Age Position
Howard Schultz . . . . . . . . . . . . . . . . . . . 58 chairman, president and chief executive officerCliff Burrows . . . . . . . . . . . . . . . . . . . . . 52 president, Starbucks Coffee Americas and USJohn Culver . . . . . . . . . . . . . . . . . . . . . . 51 president, Starbucks Coffee China and Asia PacificJeff Hansberry . . . . . . . . . . . . . . . . . . . . 47 president, Channel Development and president,
Seattle’s Best CoffeeMichelle Gass . . . . . . . . . . . . . . . . . . . . 43 president, Starbucks Coffee EMEATroy Alstead . . . . . . . . . . . . . . . . . . . . . 48 chief financial officer and chief administrative officerPaula E. Boggs . . . . . . . . . . . . . . . . . . . . 52 executive vice president, general counsel and
secretary
Howard Schultz is the founder of Starbucks and serves as the chairman, president and chief executive officer.Mr. Schultz has served as chairman of the board since Starbucks inception in 1985 and he resumed his role aspresident and chief executive officer in January 2008. From June 2000 to February 2005, Mr. Schultz held the titleof chief global strategist. From November 1985 to June 2000, he served as chief executive officer. From November1985 to June 1994, Mr. Schultz also served as president.
Cliff Burrows joined Starbucks in April 2001 and has served as president, Starbucks Coffee Americas and US sinceOctober 2011. From March 2008 to October 2011, Mr. Burrows served as president, Starbucks Coffee US. Heserved as president, Europe, Middle East and Africa (EMEA) from April 2006 to March 2008. He served as vicepresident and managing director, UK prior to April 2006. Prior to joining Starbucks, Mr. Burrows served in variousmanagement positions with Habitat Designs Limited, a furniture and house wares retailer.
John Culver joined Starbucks in August 2002 and has served as president, Starbucks Coffee China and Asia Pacificsince October 2011. From December 2009 to October 2011, he served as president, Starbucks Coffee International.Mr. Culver served as executive vice president; president, Global Consumer Products, Foodservice and Seattle’s BestCoffee from February 2009 to September 2009, and then as president, Global Consumer Products and Foodservicefrom October 2009 to November 2009. He previously served as senior vice president; president, Starbucks CoffeeAsia Pacific from January 2007 to February 2009, and vice president; general manager, Foodservice from August2002 to January 2007.
Jeff Hansberry joined Starbucks in June 2010 and has served as president, Channel Development, which includesCPG, and president, Seattle’s Best Coffee since October 2011. From June 2010 to October 2011, he served aspresident, Global Consumer Products and Foodservice. Prior to joining Starbucks, Mr. Hansberry served as vicepresident and general manager, Popular BU for E. & J. Gallo Winery, a family-owned winery, from November 2008to May 2010. From September 2007 to November 2008, Mr. Hansberry served as vice president and generalmanager, Value BU, and from April 2005 to August 2007, he served as vice president and general manager Asia, forE. & J. Gallo Winery. Prior to E. & J. Gallo, Mr. Hansberry held various positions with Procter & Gamble.
Michelle Gass joined Starbucks in 1996 and has served as president, Starbucks Coffee EMEA since October 2011.From September 2009 to October 2011, she served as president, Seattle’s Best Coffee. Ms. Gass served as seniorvice president, Marketing and Category from July 2008 to November 2008, and then as executive vice president,Marketing and Category from December 2008 to September 2009. Ms. Gass previously served as senior vicepresident, Global Strategy, Office of the ceo from January 2008 to July 2008, senior vice president, Global Product
8

and Brand from August 2007 to January 2008, senior vice president, and U.S. Category Management from May2004 to August 2007. Ms. Gass served in a number of other positions with Starbucks prior to 2004.
Troy Alstead joined Starbucks in 1992 and has served as chief financial officer and chief administrative officer sinceNovember 2008. Mr. Alstead previously served as chief operating officer, Starbucks Greater China from April 2008to October 2008, senior vice president, Global Finance and Business Operations from August 2007 to April 2008,and senior vice president, Corporate Finance from September 2004 to August 2007. Mr. Alstead served in a numberof other senior positions with Starbucks prior to 2004.
Paula E. Boggs joined Starbucks in September 2002 as executive vice president, general counsel and secretary. Priorto joining Starbucks, Ms. Boggs served as vice president, legal, for products, operations and information technologyat Dell Computer Corporation from 1997 to 2002. From 1995 to 1997, Ms. Boggs was a partner with the law firm ofPreston Gates & Ellis (now K&L Gates). Ms. Boggs served in several roles at the Pentagon, White House and USDepartment of Justice between 1984 and 1995.
There are no family relationships among any of our directors or executive officers.
Global Responsibility
We are committed to being a deeply responsible company in the communities where we do business around theworld. Our focus is on ethically sourcing high-quality coffee, reducing our environmental impacts and contributingpositively to communities. Starbucks Global Responsibility strategy and commitments are integral to our overallbusiness strategy. As a result, we believe we deliver benefits to our stakeholders, including employees, businesspartners, customers, suppliers, shareholders, community members and others. For an overview of Starbucks GlobalResponsibility strategy and commitments, please visit www.starbucks.com.
Available Information
Starbucks 10-K reports, along with all other reports and amendments filed with or furnished to the Securities andExchange Commission (“SEC”), are publicly available free of charge on the Investor Relations section of ourwebsite at http://investor.starbucks.com or at www.sec.gov as soon as reasonably practicable after these materialsare filed with or furnished to the SEC. Our corporate governance policies, code of ethics and Board committeecharters and policies are also posted on the Investor Relations section of Starbucks website athttp://investor.starbucks.com. The information on our website is not part of this or any other report Starbucks fileswith, or furnishes to, the SEC.
Item 1A. Risk Factors
You should carefully consider the risks described below. If any of the risks and uncertainties described in thecautionary factors described below actually occurs, our business, financial condition and results of operations couldbe materially and adversely affected. The risks and factors listed below, however, are not exhaustive. Other sectionsof this 10-K include additional factors that could materially and adversely impact our business, financial conditionand results of operations. Moreover, we operate in a very competitive and rapidly changing environment. Newfactors emerge from time to time and it is not possible to predict the impact of all these factors on our business,financial condition or results of operation.
• Our financial condition and results of operations are sensitive to, and may be adversely affected by, a numberof factors, many of which are largely outside our control.
Our operating results have been in the past and will continue to be subject to a number of factors, many of which arelargely outside our control. Any one or more of the factors set forth below could adversely impact our business,financial condition and/or results of operations:
• lower customer traffic or average value per transaction, which negatively impacts comparable store sales, netrevenues, operating income, operating margins and earnings per share, due to:
• the impact of initiatives by competitors and increased competition generally;
9
• customers trading down to lower priced products within Starbucks, and/or shifting to competitors withlower priced products;
• lack of customer acceptance of new products or price increases necessary to cover costs of new productsand/or higher input costs;
• unfavorable general economic conditions in the markets in which we operate that adversely affectconsumer spending;
• declines in general consumer demand for specialty coffee products; or
• adverse impacts resulting from negative publicity regarding our business practices or the health effects ofconsuming our products;
• cost increases that are either wholly or partially beyond our control, such as:
• commodity costs for commodities that can only be partially hedged, such as fluid milk, and high qualityarabica coffee;
• labor costs such as increased health care costs, general market wage levels and workers’ compensationinsurance costs;
• adverse outcomes of current or future litigation; or
• construction costs associated with new store openings;
• any material interruption in our supply chain beyond our control, such as material interruption of roastedcoffee supply due to the casualty loss of any of our roasting plants or the failures of third-party suppliers, orinterruptions in service by common carriers that ship goods within our distribution channels, or traderestrictions, such as increased tariffs or quotas, embargoes or customs restrictions;
• delays in store openings for reasons beyond our control, or a lack of desirable real estate locations availablefor lease at reasonable rates, either of which could keep us from meeting annual store opening targets and, inturn, negatively impact net revenues, operating income and earnings per share;
• the degree to which we enter into, maintain, develop, and are able to negotiate appropriate terms andconditions, and enforce, commercial and other agreements;
• the impact on our business due to labor discord, war, terrorism (including incidents targeting us), politicalinstability and natural disasters; and
• deterioration in our credit ratings, which could limit the availability of additional financing and increase thecost of obtaining financing.
• Economic conditions in the US and certain International markets could adversely affect our business andfinancial results.
As a retailer that is dependent upon consumer discretionary spending, our results of operations are sensitive tochanges in macro-economic conditions. Our customers may have less money for discretionary purchases as a resultof job losses, foreclosures, bankruptcies, increased fuel and energy costs, higher interest rates, higher taxes, reducedaccess to credit and lower home prices. Any resulting decreases in customer traffic and/or average value pertransaction will negatively impact our financial performance as reduced revenues result in sales de-leveraging whichcreates downward pressure on margins. There is also a risk that if negative economic conditions persist for a longperiod of time or worsen, consumers may make long-lasting changes to their discretionary purchasing behavior,including less frequent discretionary purchases on a more permanent basis.
10
• We may not be successful in implementing important strategic initiatives, which may have an adverse impacton our business and financial results.
There is no assurance that we will be able to implement important strategic initiatives in accordance with ourexpectations, which may result in an adverse impact on our business and financial results. These strategic initiativesare designed to improve our results of operations and drive long-term shareholder value, and include:
• successfully leveraging Starbucks brand portfolio outside the company-operated store base, including ourincreased focus on international licensed stores, Starbucks- and Tazo-branded Keurig® K-Cup® portionpacks coffees and teas, Starbucks VIA® Ready Brew, and the Seattle’s Best Coffee brand;
• focusing on relevant product innovation and profitable new growth platforms;
• accelerating the growth of our global consumer products business now that we have transitioned from ourdistribution arrangement with Kraft Foods Global, Inc.;
• balancing disciplined global store growth while meeting target store-level unit economics in a givenmarket; and
• executing a multi-channel advertising and marketing campaign to effectively communicate our messagedirectly to Starbucks consumers and employees.
• We face intense competition in each of our channels and markets, which could lead to reduced profitability.
The specialty coffee market is intensely competitive, including with respect to product quality, service, convenience,and price, and we face significant competition in each of our channels and markets. Accordingly, we do not haveleadership positions in all channels and markets. In the US, the ongoing focus by large competitors in the quick-service restaurant sector on selling high-quality specialty coffee beverages could adversely affect our sales andresults of operations. Similarly, continued competition from well-established competitors in our internationalmarkets could hinder growth and adversely affect our sales and results of operations in those markets. Increasedcompetition in the US packaged coffee and tea and ready-to-drink coffee beverage markets could adversely affectthe profitability of the CPG segment.
• We are highly dependent on the financial performance of our US operating segment.
Our financial performance is highly dependent on our US operating segment, as it comprised approximately twothirds of consolidated total net revenues in fiscal 2011. If revenue trends slow or decline our business and financialresults could be adversely affected, and because the US segment is relatively mature and produces the large majorityof our operating cash flows, could result in reduced cash flows for funding the expansion of our internationalbusiness and for returning cash to shareholders.
• We are increasingly dependent on the success of our international operations in order to achieve our growthtargets.
Our future growth increasingly depends on the growth and sustained profitability of our international operations.Some or all of our international market business units (“MBUs”), which we generally define by the countries inwhich they operate, may not be successful in their operations or in achieving expected growth, which ultimatelyrequires achieving consistent, stable net revenues and earnings. The performance of our international operations maybe adversely affected by economic downturns in one or more of our large MBUs. In particular, our Canada, Japan,UK, and China MBUs account for a significant portion of the net revenue and earnings of our internationaloperations and a decline in the performance of any of these MBUs could have a material adverse impact on theresults of our international operations.
Additionally, some factors that will be critical to the success of international MBUs are different than those affectingour US stores and licensees. Tastes naturally vary by region, and consumers in some international markets may not
11
embrace our products to the same extent as consumers in our US market or other international markets. Occupancycosts and store operating expenses can be higher internationally than in the US due to higher rents for prime storelocations or costs of compliance with country-specific regulatory requirements. Because many of our internationaloperations are in an early phase of development, operating expenses as a percentage of related revenues are oftenhigher compared to US operations. Additionally, our international joint venture partners or licensees may facecapital constraints or other factors that may limit the speed at which they are able to expand and develop in a certainmarket.
Our international operations are also subject to additional inherent risks of conducting business abroad, such as:
• foreign currency exchange rate fluctuations;
• changes or uncertainties in economic, legal, regulatory, social and political conditions in our markets;
• interpretation and application of laws and regulations;
• restrictive actions of foreign or US governmental authorities affecting trade and foreign investment,including protective measures such as export and customs duties and tariffs, government interventionfavoring local competitors, and restrictions on the level of foreign ownership;
• import or other business licensing requirements;
• the enforceability of intellectual property and contract rights;
• limitations on the repatriation of funds and foreign currency exchange restrictions due to current or new USand international regulations;
• in developing economies, the growth rate in the portion of the population achieving targeted levels ofdisposable income may not be as fast as we forecast;
• difficulty in staffing, developing and managing foreign operations and supply chain logistics, includingensuring the consistency of product quality and service, due to distance, language and cultural differences;
• local laws that make it more expensive and complex to negotiate with, retain or terminate employees; and
• delays in store openings for reasons beyond our control, competition with locally relevant competitors or alack of desirable real estate locations available for lease at reasonable rates, any of which could keep us frommeeting annual store opening targets and, in turn, negatively impact net revenues, operating income andearnings per share.
Moreover, many of the foregoing risks are particularly acute in developing countries, which are important to ourlong-term growth prospects.
• Increases in the cost of high-quality arabica coffee beans or other commodities or decreases in the availabilityof high quality arabica coffee beans or other commodities could have an adverse impact on our business andfinancial results.
We purchase, roast, and sell high-quality whole bean arabica coffee beans and related coffee products. The price ofcoffee is subject to significant volatility and, over the last two years, the base “C” coffee commodity price hasincreased markedly. The high-quality arabica coffee of the quality we seek tends to trade on a negotiated basis at apremium above the “C” price. This premium depends upon the supply and demand at the time of purchase and theamount of the premium can vary significantly. Increases in the “C” coffee commodity price do increase the price ofhigh-quality arabica coffee and also impact our ability to enter into fixed-price purchase commitments. The supplyand price of coffee we purchase can also be affected by multiple factors in the producing countries, includingweather, natural disasters and political and economic conditions, as well as the actions of certain organizations andassociations that have historically attempted to influence prices of green coffee through agreements establishingexport quotas or by restricting coffee supplies. Speculative trading in coffee commodities can also influence coffeeprices. Because of the significance of coffee beans to our operations, combined with our ability to only partially
12
mitigate future price risk through purchasing practices and hedging activities, increases in the cost of high-qualityarabica coffee beans could have an adverse impact on our profitability. In addition, if we are not able to purchasesufficient quantities of green coffee due to any of the above factors or to a worldwide or regional shortage, we maynot be able to fulfill the demand for our coffee, which could have an adverse impact on our profitability.
In addition to coffee, we also purchase significant amounts of dairy products, particularly fluid milk, to support theneeds of our company-operated retail stores. Although less material to our operations than coffee or dairy, othercommodities including but not limited to those related to food inputs and energy, are important to our operations.Increases in the cost of dairy products and other commodities could have an adverse impact on our profitability.
• Our success depends substantially on the value of our brands.
We believe we have built an excellent reputation globally for the quality of our products, for delivery of aconsistently positive consumer experience and for our corporate social responsibility programs. The Starbucks brandhas been highly rated in several global brand value studies. To be successful in the future, particularly outside of US,where the Starbucks brand and our other brands are less well-known, we believe we must preserve, grow andleverage the value of our brands across all sales channels. Brand value is based in part on consumer perceptions on avariety of subjective qualities. Even isolated business incidents that erode consumer trust, such as contaminated foodor privacy breaches particularly if the incidents receive considerable publicity or result in litigation, can significantlyreduce brand value. Consumer demand for our products and our brand equity could diminish significantly if we orour licensees fail to preserve the quality of our products, are perceived to act in an unethical or socially irresponsiblemanner or fail to deliver a consistently positive consumer experience in each of our markets.
• Our business depends in large part on the success of our business partners and suppliers, and our brand andreputation may be harmed by actions taken by third parties that are outside of our control.
Our business strategy, including our plans for new stores, foodservice, branded products and other initiatives, reliessignificantly on a variety of business partners, and licensee and partnership relationships, particularly in ourinternational markets. Licensees are often authorized to use our logos and provide branded beverages, food and otherproducts directly to customers. We provide training and support to, and monitor the operations of, these businesspartners, but the product quality and service they deliver may be diminished by any number of factors beyond ourcontrol, including financial pressures. We believe customers expect the same quality of products and service fromour licensees as they do from us and we strive to ensure customers have the same experience whether they visit acompany-operated or licensed store. Any shortcoming of a Starbucks business partner, particularly an issue affectingthe quality of the service experience,the safety of beverages or food or compliance with laws and regulations, maybe attributed by customers to us, thus damaging our reputation and brand value and potentially affecting our resultsof operations.
Our food and beverage products, are sourced from a wide variety of domestic and international business partners inour supply chain operations. We rely on these suppliers and vendors to provide high quality products and to complywith applicable laws. Our ability to find qualified suppliers and vendors who meet our standards and supply productsin a timely and efficient manner is a significant challenge, especially with respect to goods sourced from outside theUS. A vendor or supplier’s failure to meet our standards, provide products in a timely and efficient manner, andcomply with applicable laws is beyond our control. These issues could negatively impact our business andprofitability.
• Failure to meet market expectations for our financial performance will likely adversely affect the market priceand volatility of our stock.
Failure to meet market expectations going forward, particularly with respect to operating margins, earnings pershare, comparable store sales, operating cash flows, and net revenues, will likely result in a decline and/or increasedvolatility in the market price of our stock. In addition, price and volume fluctuations in the stock market as a wholemay affect the market price of our stock in ways that may be unrelated to our financial performance.
13
• The loss of key personnel or difficulties recruiting and retaining qualified personnel could adversely impact ourbusiness and financial results.
Much of our future success depends on the continued availability and service of senior management personnel. Theloss of any of our executive officers or other key senior management personnel could harm our business. We mustcontinue to recruit, retain and motivate management and other employees sufficient both to maintain our currentbusiness and to execute our strategic initiatives, some of which involve ongoing expansion in business channelsoutside of our traditional company-operated store model. Our success also depends substantially on the contributionsand abilities of our retail store employees who we rely on to give customers a superior in-store experience.Accordingly, our performance depends on our ability to recruit and retain high quality employees to work in andmanage our stores. If we are unable to recruit, retain and motivate employees sufficient to maintain our currentbusiness and support our projected growth, our business and financial performance may be adversely affected.
• Adverse public or medical opinions about the health effects of consuming our products, as well as reports ofincidents involving food-borne illnesses, food tampering or food contamination, whether or not accurate, couldharm our business.
Some of our products contain caffeine, dairy products, sugar and other active compounds, the health effects of whichare the subject of public scrutiny, including the suggestion that excessive consumption of caffeine, dairy products,sugar and other active compounds can lead to a variety of adverse health effects. Particularly in the US, there isincreasing consumer awareness of health risks, including obesity, due in part to increased publicity and attentionfrom health organizations, as well as increased consumer litigation based on alleged adverse health impacts ofconsumption of various food products. While we have a variety of beverage and food items, including items that arecoffee-free and have reduced calories, an unfavorable report on the health effects of caffeine or other compoundspresent in our products, or negative publicity or litigation arising from certain health risks could significantly reducethe demand for our beverages and food products.
Similarly, instances or reports, whether true or not, of unclean water supply, food-borne illnesses, food tamperingand food contamination, either during manufacturing, packaging or preparation, have in the past severely injured thereputations of companies in the food processing, grocery and quick-service restaurant sectors and could affect us aswell. Any report linking us to the use of unclean water, food-borne illnesses, food tampering or food contaminationcould damage our brand value and severely hurt sales of our beverages and food products, and possibly lead toproduct liability claims, litigation (including class actions) or damages. Clean water is critical to the preparation ofcoffee and tea beverages and our ability to ensure a clean water supply to our stores can be limited, particularly insome international locations. If customers become ill from food-borne illnesses, tampering or contamination, wecould also be forced to temporarily close some stores. In addition, instances of food-borne illnesses, food tamperingor food contamination, even those occurring solely at the restaurants or stores of competitors, could, by resulting innegative publicity about the foodservice industry, adversely affect our sales on a regional or global basis. A decreasein customer traffic as a result of these health concerns or negative publicity, or as a result of a temporary closure ofany of our stores, as well adverse results of claims or litigation, could materially harm our business and results ofoperations.
• A regional or global health pandemic could severely affect our business.
A health pandemic is a disease outbreak that spreads rapidly and widely by infection and affects many individuals inan area or population at the same time. If a regional or global health pandemic were to occur, depending upon itsduration and severity, our business could be severely affected. Customers might avoid public gathering places, suchas our stores, in the event of a health pandemic, and governments might limit or ban public gatherings to halt ordelay the spread of disease. There is also a risk of customer contamination from being served food or beverage by anemployee who has been infected with the disease. A regional or global health pandemic might also adversely impactour business by disrupting or delaying production and delivery of materials and products in the supply chain and bycausing staffing shortages in our stores. The impact of a health pandemic on us might be disproportionately greaterthan on other companies that depend less on the gathering of people together for the sale, use or license of theirproducts and services.
14
• Effectively managing growth both in our retail store business and our global consumer products business ischallenging and places significant strain on our management and employees and our operational, financial,and other resources.
Effectively managing growth can be challenging, particularly as we continue to expand into new channels outsidethe retail store model, increase our focus on our global consumer products business, and expand into new marketsinternationally where we must balance the need for flexibility and a degree of autonomy for local managementagainst the need for consistency with our goals, philosophy and standards. Growth can make it increasingly difficultto ensure a consistent supply of high quality raw materials, to locate and hire sufficient numbers of key employees,to maintain an effective system of internal controls for a globally dispersed enterprise and to train employeesworldwide to deliver a consistently high quality product and customer experience.
• If we pursue strategic acquisitions, divestitures or joint ventures, we may not be able to successfullyconsummate favorable transactions or successfully integrate acquired businesses.
From time to time we may evaluate potential acquisitions, divestitures, or joint ventures with third parties. Thesetransactions create risks such as:
• disruption of our ongoing business, including loss of management focus on existing businesses;
• problems retaining key personnel;
• operating losses and expenses of the businesses we acquire or in which we invest;
• the potential impairment of tangible assets, intangible assets and goodwill acquired in the acquisitions;
• the difficulty of incorporating an acquired business into our business and unanticipated expenses related tosuch integration; and
• potential unknown liabilities associated with a business we acquire or in which we invest
In the event of any future acquisitions, we might need to issue additional equity securities, spend our cash, incurdebt, or take on contingent liabilities, any of which could reduce our profitability and harm our business.
• We rely heavily on information technology in our operations, and any material failure, inadequacy,interruption or security failure of that technology could harm our ability to effectively operate our business.
We rely heavily on information technology systems across our operations, including for management of our supplychain, point-of-sale processing in our stores, Starbucks Cards, online business and various other processes andtransactions. Our ability to effectively manage our business and coordinate the production, distribution and sale ofour products depends significantly on the reliability and capacity of these systems. The failure of these systems tooperate effectively, problems with transitioning to upgraded or replacement systems, or a breach in security of thesesystems could cause delays in product sales and reduced efficiency of our operations, and significant capitalinvestments could be required to remediate the problem. Security breaches of our employees or customer privatedata could also adversely impact our reputation, and could result in litigation against us or the imposition ofpenalties,
• Failure to comply with applicable laws and regulations could harm our business and financial results.
Our policies and procedures are designed to comply with all applicable laws, accounting and reporting requirements,regulations and tax requirements, including those imposed by the SEC, NASDAQ, and foreign countries, as well asapplicable trade, labor, privacy, food, anti-bribery and corruption and merchandise laws. The complexity of theregulatory environment in which we operate and the related cost of compliance are both increasing due to additionallegal and regulatory requirements, our ongoing expansion into new markets and new channels, together with the factthat foreign laws occasionally conflict with domestic laws. Failure to comply with the various laws and regulationsas well as changes in laws and regulations or the manner in which they are interpreted or applied, may result indamage to our reputation, civil and criminal liability, damages, fines and penalties, increased cost of regulatorycompliance and restatements of our financial statements.
15
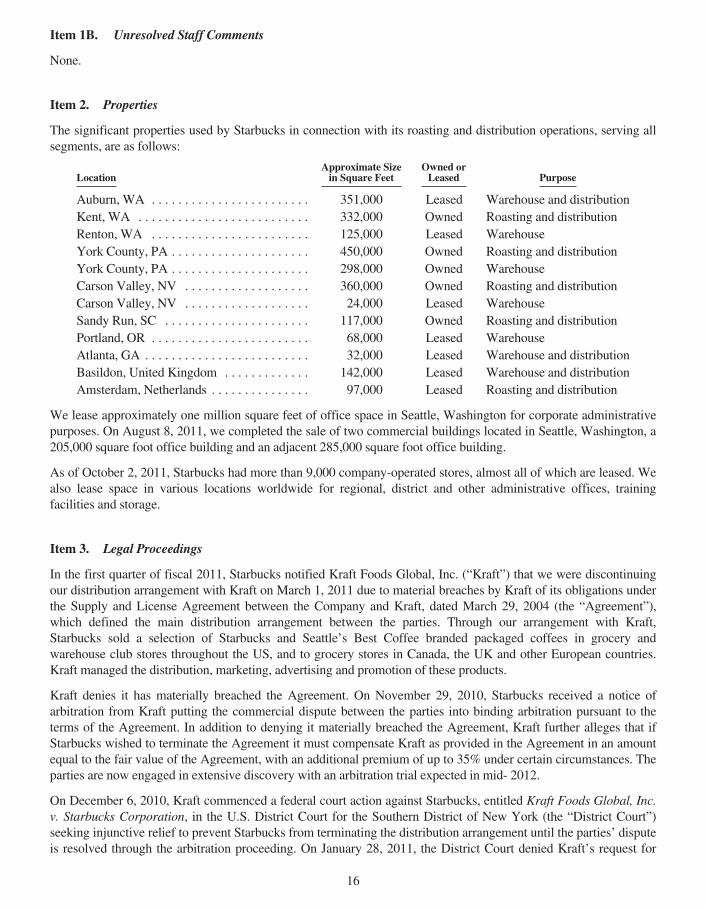
Item 1B. Unresolved Staff Comments
None.
Item 2. Properties
The significant properties used by Starbucks in connection with its roasting and distribution operations, serving allsegments, are as follows:
LocationApproximate Sizein Square Feet
Owned orLeased Purpose
Auburn, WA . . . . . . . . . . . . . . . . . . . . . . . . 351,000 Leased Warehouse and distributionKent, WA . . . . . . . . . . . . . . . . . . . . . . . . . . 332,000 Owned Roasting and distributionRenton, WA . . . . . . . . . . . . . . . . . . . . . . . . 125,000 Leased WarehouseYork County, PA . . . . . . . . . . . . . . . . . . . . . 450,000 Owned Roasting and distributionYork County, PA . . . . . . . . . . . . . . . . . . . . . 298,000 Owned WarehouseCarson Valley, NV . . . . . . . . . . . . . . . . . . . 360,000 Owned Roasting and distributionCarson Valley, NV . . . . . . . . . . . . . . . . . . . 24,000 Leased WarehouseSandy Run, SC . . . . . . . . . . . . . . . . . . . . . . 117,000 Owned Roasting and distributionPortland, OR . . . . . . . . . . . . . . . . . . . . . . . . 68,000 Leased WarehouseAtlanta, GA . . . . . . . . . . . . . . . . . . . . . . . . . 32,000 Leased Warehouse and distributionBasildon, United Kingdom . . . . . . . . . . . . . 142,000 Leased Warehouse and distributionAmsterdam, Netherlands . . . . . . . . . . . . . . . 97,000 Leased Roasting and distribution
We lease approximately one million square feet of office space in Seattle, Washington for corporate administrativepurposes. On August 8, 2011, we completed the sale of two commercial buildings located in Seattle, Washington, a205,000 square foot office building and an adjacent 285,000 square foot office building.
As of October 2, 2011, Starbucks had more than 9,000 company-operated stores, almost all of which are leased. Wealso lease space in various locations worldwide for regional, district and other administrative offices, trainingfacilities and storage.
Item 3. Legal Proceedings
In the first quarter of fiscal 2011, Starbucks notified Kraft Foods Global, Inc. (“Kraft”) that we were discontinuingour distribution arrangement with Kraft on March 1, 2011 due to material breaches by Kraft of its obligations underthe Supply and License Agreement between the Company and Kraft, dated March 29, 2004 (the “Agreement”),which defined the main distribution arrangement between the parties. Through our arrangement with Kraft,Starbucks sold a selection of Starbucks and Seattle’s Best Coffee branded packaged coffees in grocery andwarehouse club stores throughout the US, and to grocery stores in Canada, the UK and other European countries.Kraft managed the distribution, marketing, advertising and promotion of these products.
Kraft denies it has materially breached the Agreement. On November 29, 2010, Starbucks received a notice ofarbitration from Kraft putting the commercial dispute between the parties into binding arbitration pursuant to theterms of the Agreement. In addition to denying it materially breached the Agreement, Kraft further alleges that ifStarbucks wished to terminate the Agreement it must compensate Kraft as provided in the Agreement in an amountequal to the fair value of the Agreement, with an additional premium of up to 35% under certain circumstances. Theparties are now engaged in extensive discovery with an arbitration trial expected in mid- 2012.
On December 6, 2010, Kraft commenced a federal court action against Starbucks, entitled Kraft Foods Global, Inc.v. Starbucks Corporation, in the U.S. District Court for the Southern District of New York (the “District Court”)seeking injunctive relief to prevent Starbucks from terminating the distribution arrangement until the parties’ disputeis resolved through the arbitration proceeding. On January 28, 2011, the District Court denied Kraft’s request for
16
injunctive relief. Kraft appealed the District Court’s decision to the Second Circuit Court of Appeals. OnFebruary 25, 2011, the Second Circuit Court of Appeals affirmed the District Court’s decision. As a result,Starbucks is in full control of our packaged coffee business as of March 1, 2011.
While Starbucks believes we have valid claims of material breach by Kraft under the Agreement that allowed us toterminate the Agreement and certain other relationships with Kraft without compensation to Kraft, there exists thepossibility of material adverse outcomes to Starbucks in the arbitration or to resolve the matter. At this time, theCompany is unable to estimate the range of possible outcomes with respect to the arbitration as we have not receivedany statement or articulation of damages from Kraft nor have we estimated the damages to Starbucks caused byKraft’s breaches. Information in this regard will be provided during the discovery process and is currently expectedto be available in late March or early April 2012. And, although Kraft disclosed to the press and in federal courtfilings a $750 million offer Starbucks made to Kraft in August 2010 to avoid litigation and ensure a smoothtransition of the business, the figure is not a proper basis upon which to estimate a possible outcome of thearbitration but was based upon facts and circumstances at the time. Kraft rejected the offer immediately and did notprovide a counter-offer, effectively ending the discussions between the parties with regard to any payment.Moreover, the offer was made prior to our investigation of Kraft’s breaches and without consideration of Kraft’scontinuing failure to comply with material terms of the agreements.
Starbucks is party to various other legal proceedings arising in the ordinary course of business, including certainemployment litigation cases that have been certified as class or collective actions, but, except as noted above, is notcurrently a party to any legal proceeding that management believes could have a material adverse effect on ourconsolidated financial position, results of operations or cash flows.
Item 4. (Removed and Reserved)
17
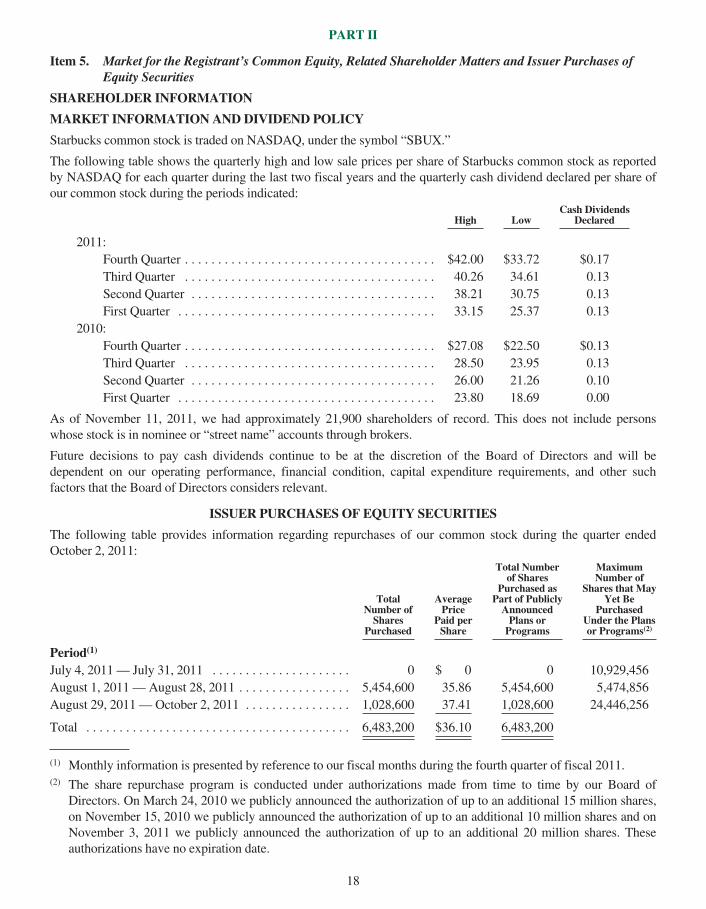
PART II
Item 5. Market for the Registrant’s Common Equity, Related Shareholder Matters and Issuer Purchases ofEquity Securities
SHAREHOLDER INFORMATION
MARKET INFORMATION AND DIVIDEND POLICY
Starbucks common stock is traded on NASDAQ, under the symbol “SBUX.”
The following table shows the quarterly high and low sale prices per share of Starbucks common stock as reportedby NASDAQ for each quarter during the last two fiscal years and the quarterly cash dividend declared per share ofour common stock during the periods indicated:
High LowCash Dividends
Declared
2011:Fourth Quarter . . . . . . . . . . . . . . . . . . . . . . . . . . . . . . . . . . . . . . $42.00 $33.72 $0.17Third Quarter . . . . . . . . . . . . . . . . . . . . . . . . . . . . . . . . . . . . . . 40.26 34.61 0.13Second Quarter . . . . . . . . . . . . . . . . . . . . . . . . . . . . . . . . . . . . . 38.21 30.75 0.13First Quarter . . . . . . . . . . . . . . . . . . . . . . . . . . . . . . . . . . . . . . . 33.15 25.37 0.13
2010:Fourth Quarter . . . . . . . . . . . . . . . . . . . . . . . . . . . . . . . . . . . . . . $27.08 $22.50 $0.13Third Quarter . . . . . . . . . . . . . . . . . . . . . . . . . . . . . . . . . . . . . . 28.50 23.95 0.13Second Quarter . . . . . . . . . . . . . . . . . . . . . . . . . . . . . . . . . . . . . 26.00 21.26 0.10First Quarter . . . . . . . . . . . . . . . . . . . . . . . . . . . . . . . . . . . . . . . 23.80 18.69 0.00
As of November 11, 2011, we had approximately 21,900 shareholders of record. This does not include personswhose stock is in nominee or “street name” accounts through brokers.
Future decisions to pay cash dividends continue to be at the discretion of the Board of Directors and will bedependent on our operating performance, financial condition, capital expenditure requirements, and other suchfactors that the Board of Directors considers relevant.
ISSUER PURCHASES OF EQUITY SECURITIES
The following table provides information regarding repurchases of our common stock during the quarter endedOctober 2, 2011:
TotalNumber ofShares
Purchased
AveragePrice
Paid perShare
Total Numberof Shares
Purchased asPart of PubliclyAnnouncedPlans orPrograms
MaximumNumber of
Shares that MayYet Be
PurchasedUnder the Plansor Programs(2)
Period(1)
July 4, 2011— July 31, 2011 . . . . . . . . . . . . . . . . . . . . . 0 $ 0 0 10,929,456August 1, 2011—August 28, 2011 . . . . . . . . . . . . . . . . . 5,454,600 35.86 5,454,600 5,474,856August 29, 2011—October 2, 2011 . . . . . . . . . . . . . . . . 1,028,600 37.41 1,028,600 24,446,256
Total . . . . . . . . . . . . . . . . . . . . . . . . . . . . . . . . . . . . . . . . 6,483,200 $36.10 6,483,200
(1) Monthly information is presented by reference to our fiscal months during the fourth quarter of fiscal 2011.(2) The share repurchase program is conducted under authorizations made from time to time by our Board of
Directors. On March 24, 2010 we publicly announced the authorization of up to an additional 15 million shares,on November 15, 2010 we publicly announced the authorization of up to an additional 10 million shares and onNovember 3, 2011 we publicly announced the authorization of up to an additional 20 million shares. Theseauthorizations have no expiration date.
18
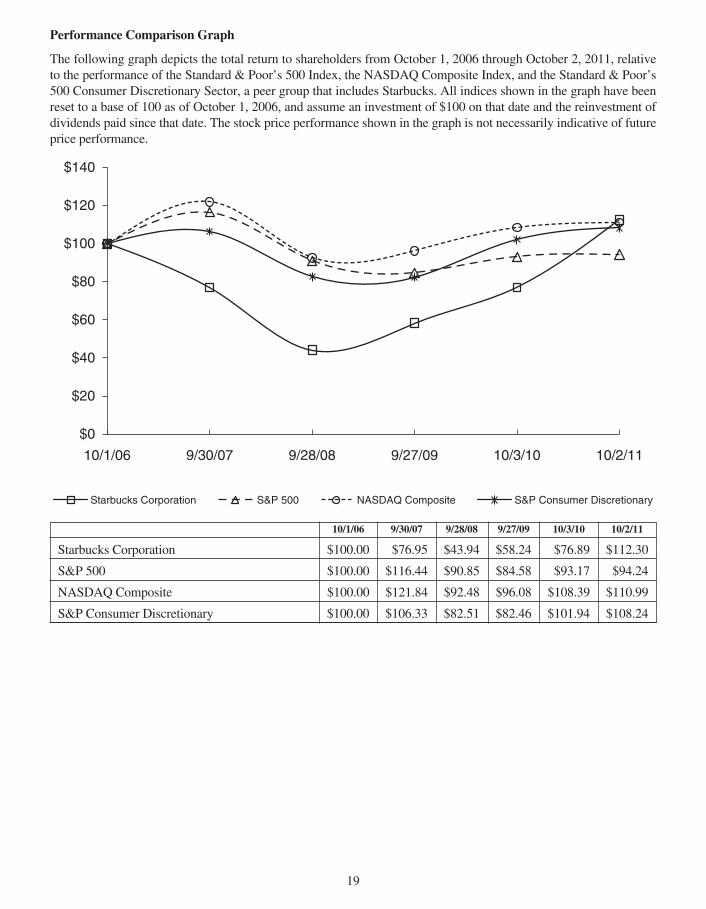
Performance Comparison Graph
The following graph depicts the total return to shareholders from October 1, 2006 through October 2, 2011, relativeto the performance of the Standard & Poor’s 500 Index, the NASDAQ Composite Index, and the Standard & Poor’s500 Consumer Discretionary Sector, a peer group that includes Starbucks. All indices shown in the graph have beenreset to a base of 100 as of October 1, 2006, and assume an investment of $100 on that date and the reinvestment ofdividends paid since that date. The stock price performance shown in the graph is not necessarily indicative of futureprice performance.
10/1/06 9/30/07 9/28/08 9/27/09 10/3/10 10/2/11
$0
$40
$80
$20
$60
$100
$120
$140
Starbucks Corporation S&P 500 NASDAQ Composite S&P Consumer Discretionary
10/1/06 9/30/07 9/28/08 9/27/09 10/3/10 10/2/11
Starbucks Corporation $100.00 $76.95 $43.94 $58.24 $76.89 $112.30
S&P 500 $100.00 $116.44 $90.85 $84.58 $93.17 $94.24
NASDAQ Composite $100.00 $121.84 $92.48 $96.08 $108.39 $110.99
S&P Consumer Discretionary $100.00 $106.33 $82.51 $82.46 $101.94 $108.24
19
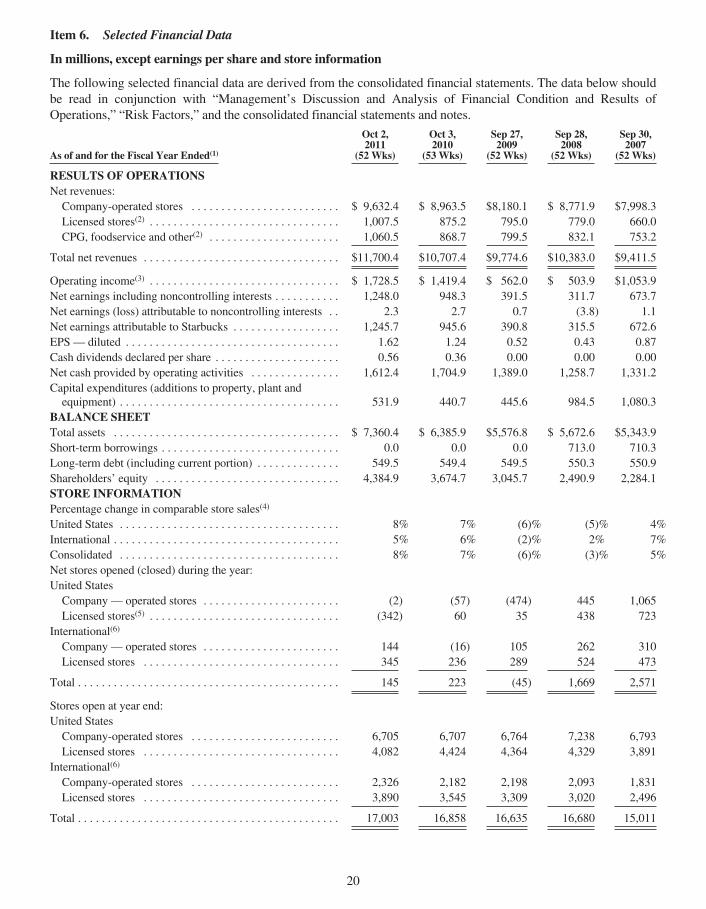
Item 6. Selected Financial Data
In millions, except earnings per share and store information
The following selected financial data are derived from the consolidated financial statements. The data below shouldbe read in conjunction with “Management’s Discussion and Analysis of Financial Condition and Results ofOperations,” “Risk Factors,” and the consolidated financial statements and notes.
As of and for the Fiscal Year Ended(1)
Oct 2,2011
(52 Wks)
Oct 3,2010
(53 Wks)
Sep 27,2009
(52 Wks)
Sep 28,2008
(52 Wks)
Sep 30,2007
(52 Wks)
RESULTS OF OPERATIONSNet revenues:Company-operated stores . . . . . . . . . . . . . . . . . . . . . . . . . $ 9,632.4 $ 8,963.5 $8,180.1 $ 8,771.9 $7,998.3Licensed stores(2) . . . . . . . . . . . . . . . . . . . . . . . . . . . . . . . . 1,007.5 875.2 795.0 779.0 660.0CPG, foodservice and other(2) . . . . . . . . . . . . . . . . . . . . . . 1,060.5 868.7 799.5 832.1 753.2
Total net revenues . . . . . . . . . . . . . . . . . . . . . . . . . . . . . . . . . $11,700.4 $10,707.4 $9,774.6 $10,383.0 $9,411.5
Operating income(3) . . . . . . . . . . . . . . . . . . . . . . . . . . . . . . . . $ 1,728.5 $ 1,419.4 $ 562.0 $ 503.9 $1,053.9Net earnings including noncontrolling interests . . . . . . . . . . . 1,248.0 948.3 391.5 311.7 673.7Net earnings (loss) attributable to noncontrolling interests . . 2.3 2.7 0.7 (3.8) 1.1Net earnings attributable to Starbucks . . . . . . . . . . . . . . . . . . 1,245.7 945.6 390.8 315.5 672.6EPS — diluted . . . . . . . . . . . . . . . . . . . . . . . . . . . . . . . . . . . . 1.62 1.24 0.52 0.43 0.87Cash dividends declared per share . . . . . . . . . . . . . . . . . . . . . 0.56 0.36 0.00 0.00 0.00Net cash provided by operating activities . . . . . . . . . . . . . . . 1,612.4 1,704.9 1,389.0 1,258.7 1,331.2Capital expenditures (additions to property, plant andequipment) . . . . . . . . . . . . . . . . . . . . . . . . . . . . . . . . . . . . . 531.9 440.7 445.6 984.5 1,080.3
BALANCE SHEETTotal assets . . . . . . . . . . . . . . . . . . . . . . . . . . . . . . . . . . . . . . $ 7,360.4 $ 6,385.9 $5,576.8 $ 5,672.6 $5,343.9Short-term borrowings . . . . . . . . . . . . . . . . . . . . . . . . . . . . . . 0.0 0.0 0.0 713.0 710.3Long-term debt (including current portion) . . . . . . . . . . . . . . 549.5 549.4 549.5 550.3 550.9Shareholders’ equity . . . . . . . . . . . . . . . . . . . . . . . . . . . . . . . 4,384.9 3,674.7 3,045.7 2,490.9 2,284.1STORE INFORMATIONPercentage change in comparable store sales(4)
United States . . . . . . . . . . . . . . . . . . . . . . . . . . . . . . . . . . . . . 8% 7% (6)% (5)% 4%International . . . . . . . . . . . . . . . . . . . . . . . . . . . . . . . . . . . . . . 5% 6% (2)% 2% 7%Consolidated . . . . . . . . . . . . . . . . . . . . . . . . . . . . . . . . . . . . . 8% 7% (6)% (3)% 5%Net stores opened (closed) during the year:United StatesCompany — operated stores . . . . . . . . . . . . . . . . . . . . . . . (2) (57) (474) 445 1,065Licensed stores(5) . . . . . . . . . . . . . . . . . . . . . . . . . . . . . . . . (342) 60 35 438 723
International(6)
Company — operated stores . . . . . . . . . . . . . . . . . . . . . . . 144 (16) 105 262 310Licensed stores . . . . . . . . . . . . . . . . . . . . . . . . . . . . . . . . . 345 236 289 524 473
Total . . . . . . . . . . . . . . . . . . . . . . . . . . . . . . . . . . . . . . . . . . . . 145 223 (45) 1,669 2,571
Stores open at year end:United StatesCompany-operated stores . . . . . . . . . . . . . . . . . . . . . . . . . 6,705 6,707 6,764 7,238 6,793Licensed stores . . . . . . . . . . . . . . . . . . . . . . . . . . . . . . . . . 4,082 4,424 4,364 4,329 3,891
International(6)
Company-operated stores . . . . . . . . . . . . . . . . . . . . . . . . . 2,326 2,182 2,198 2,093 1,831Licensed stores . . . . . . . . . . . . . . . . . . . . . . . . . . . . . . . . . 3,890 3,545 3,309 3,020 2,496
Total . . . . . . . . . . . . . . . . . . . . . . . . . . . . . . . . . . . . . . . . . . . . 17,003 16,858 16,635 16,680 15,011
20
(1) Our fiscal year ends on the Sunday closest to September 30. The fiscal year ended on October 3, 2010 included 53 weekswith the 53rd week falling in our fourth fiscal quarter.
(2) Includes the revenue reclassification described in Note 1. For fiscal years 2010, 2009, 2008, and 2007, we reclassified$465.7 million, $427.3 million, $392.6 million, and $366.3 million, respectively, from the previously named “Licensing”revenue to “CPG, foodservice and other” revenue.
(3) Fiscal 2010, 2009, and 2008 results include pretax restructuring charges of $53.0 million, $332.4 million, and$266.9 million, respectively.
(4) Includes only Starbucks company-operated stores open 13 months or longer. For fiscal year 2010, comparable store salespercentages were calculated excluding the 53rd week. Comparable store sales attributable to our International segmentexclude the effect of fluctuations in foreign currency exchange rates.
(5) Includes the closure of 475 licensed Seattle’s Best Coffee locations in Borders Bookstores during fiscal 2011.(6) International store data has been adjusted for the acquisition of store locations in Austria and Switzerland in Q4 fiscal 2011
by reclassifying historical information from licensed stores to company-operated stores.
21
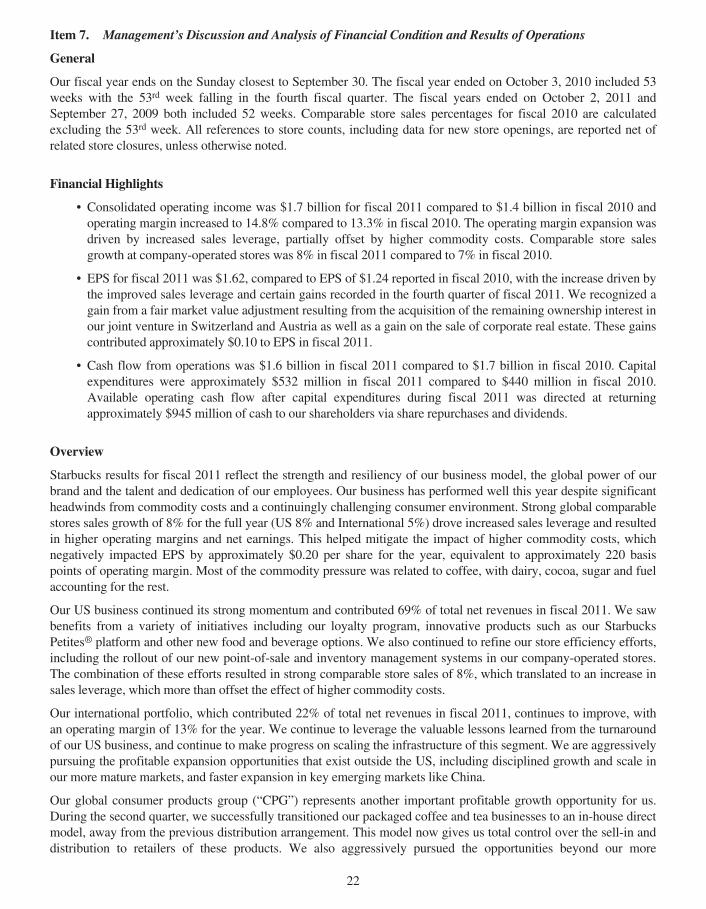
Item 7. Management’s Discussion and Analysis of Financial Condition and Results of Operations
General
Our fiscal year ends on the Sunday closest to September 30. The fiscal year ended on October 3, 2010 included 53weeks with the 53rd week falling in the fourth fiscal quarter. The fiscal years ended on October 2, 2011 andSeptember 27, 2009 both included 52 weeks. Comparable store sales percentages for fiscal 2010 are calculatedexcluding the 53rd week. All references to store counts, including data for new store openings, are reported net ofrelated store closures, unless otherwise noted.
Financial Highlights
• Consolidated operating income was $1.7 billion for fiscal 2011 compared to $1.4 billion in fiscal 2010 andoperating margin increased to 14.8% compared to 13.3% in fiscal 2010. The operating margin expansion wasdriven by increased sales leverage, partially offset by higher commodity costs. Comparable store salesgrowth at company-operated stores was 8% in fiscal 2011 compared to 7% in fiscal 2010.
• EPS for fiscal 2011 was $1.62, compared to EPS of $1.24 reported in fiscal 2010, with the increase driven bythe improved sales leverage and certain gains recorded in the fourth quarter of fiscal 2011. We recognized again from a fair market value adjustment resulting from the acquisition of the remaining ownership interest inour joint venture in Switzerland and Austria as well as a gain on the sale of corporate real estate. These gainscontributed approximately $0.10 to EPS in fiscal 2011.
• Cash flow from operations was $1.6 billion in fiscal 2011 compared to $1.7 billion in fiscal 2010. Capitalexpenditures were approximately $532 million in fiscal 2011 compared to $440 million in fiscal 2010.Available operating cash flow after capital expenditures during fiscal 2011 was directed at returningapproximately $945 million of cash to our shareholders via share repurchases and dividends.
Overview
Starbucks results for fiscal 2011 reflect the strength and resiliency of our business model, the global power of ourbrand and the talent and dedication of our employees. Our business has performed well this year despite significantheadwinds from commodity costs and a continuingly challenging consumer environment. Strong global comparablestores sales growth of 8% for the full year (US 8% and International 5%) drove increased sales leverage and resultedin higher operating margins and net earnings. This helped mitigate the impact of higher commodity costs, whichnegatively impacted EPS by approximately $0.20 per share for the year, equivalent to approximately 220 basispoints of operating margin. Most of the commodity pressure was related to coffee, with dairy, cocoa, sugar and fuelaccounting for the rest.
Our US business continued its strong momentum and contributed 69% of total net revenues in fiscal 2011. We sawbenefits from a variety of initiatives including our loyalty program, innovative products such as our StarbucksPetites® platform and other new food and beverage options. We also continued to refine our store efficiency efforts,including the rollout of our new point-of-sale and inventory management systems in our company-operated stores.The combination of these efforts resulted in strong comparable store sales of 8%, which translated to an increase insales leverage, which more than offset the effect of higher commodity costs.
Our international portfolio, which contributed 22% of total net revenues in fiscal 2011, continues to improve, withan operating margin of 13% for the year. We continue to leverage the valuable lessons learned from the turnaroundof our US business, and continue to make progress on scaling the infrastructure of this segment. We are aggressivelypursuing the profitable expansion opportunities that exist outside the US, including disciplined growth and scale inour more mature markets, and faster expansion in key emerging markets like China.
Our global consumer products group (“CPG”) represents another important profitable growth opportunity for us.During the second quarter, we successfully transitioned our packaged coffee and tea businesses to an in-house directmodel, away from the previous distribution arrangement. This model now gives us total control over the sell-in anddistribution to retailers of these products. We also aggressively pursued the opportunities beyond our more
22
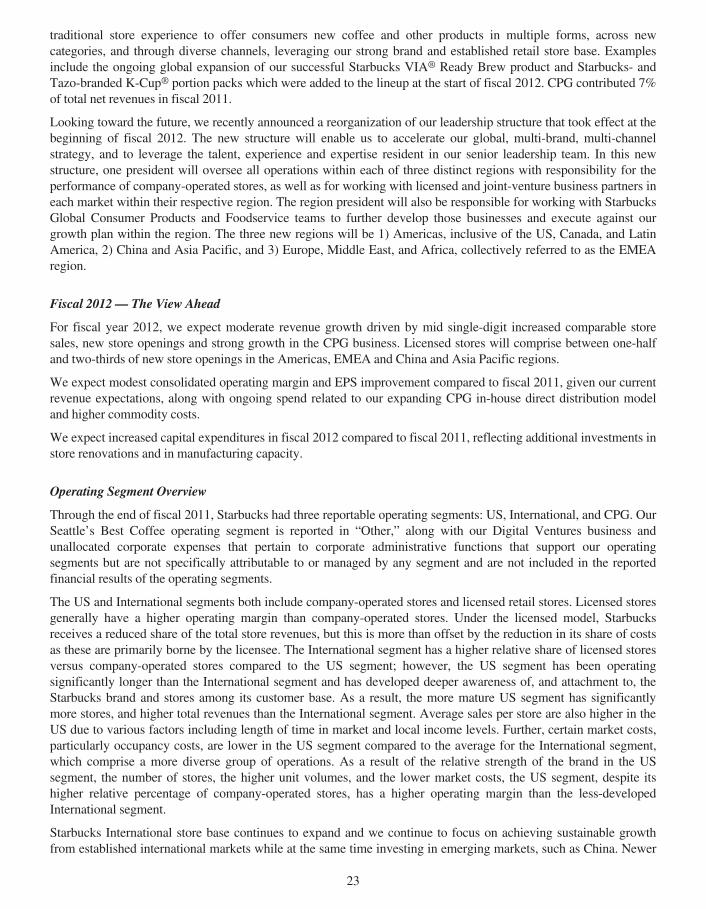
traditional store experience to offer consumers new coffee and other products in multiple forms, across newcategories, and through diverse channels, leveraging our strong brand and established retail store base. Examplesinclude the ongoing global expansion of our successful Starbucks VIA® Ready Brew product and Starbucks- andTazo-branded K-Cup® portion packs which were added to the lineup at the start of fiscal 2012. CPG contributed 7%of total net revenues in fiscal 2011.
Looking toward the future, we recently announced a reorganization of our leadership structure that took effect at thebeginning of fiscal 2012. The new structure will enable us to accelerate our global, multi-brand, multi-channelstrategy, and to leverage the talent, experience and expertise resident in our senior leadership team. In this newstructure, one president will oversee all operations within each of three distinct regions with responsibility for theperformance of company-operated stores, as well as for working with licensed and joint-venture business partners ineach market within their respective region. The region president will also be responsible for working with StarbucksGlobal Consumer Products and Foodservice teams to further develop those businesses and execute against ourgrowth plan within the region. The three new regions will be 1) Americas, inclusive of the US, Canada, and LatinAmerica, 2) China and Asia Pacific, and 3) Europe, Middle East, and Africa, collectively referred to as the EMEAregion.
Fiscal 2012— The View Ahead
For fiscal year 2012, we expect moderate revenue growth driven by mid single-digit increased comparable storesales, new store openings and strong growth in the CPG business. Licensed stores will comprise between one-halfand two-thirds of new store openings in the Americas, EMEA and China and Asia Pacific regions.
We expect modest consolidated operating margin and EPS improvement compared to fiscal 2011, given our currentrevenue expectations, along with ongoing spend related to our expanding CPG in-house direct distribution modeland higher commodity costs.
We expect increased capital expenditures in fiscal 2012 compared to fiscal 2011, reflecting additional investments instore renovations and in manufacturing capacity.
Operating Segment Overview
Through the end of fiscal 2011, Starbucks had three reportable operating segments: US, International, and CPG. OurSeattle’s Best Coffee operating segment is reported in “Other,” along with our Digital Ventures business andunallocated corporate expenses that pertain to corporate administrative functions that support our operatingsegments but are not specifically attributable to or managed by any segment and are not included in the reportedfinancial results of the operating segments.
The US and International segments both include company-operated stores and licensed retail stores. Licensed storesgenerally have a higher operating margin than company-operated stores. Under the licensed model, Starbucksreceives a reduced share of the total store revenues, but this is more than offset by the reduction in its share of costsas these are primarily borne by the licensee. The International segment has a higher relative share of licensed storesversus company-operated stores compared to the US segment; however, the US segment has been operatingsignificantly longer than the International segment and has developed deeper awareness of, and attachment to, theStarbucks brand and stores among its customer base. As a result, the more mature US segment has significantlymore stores, and higher total revenues than the International segment. Average sales per store are also higher in theUS due to various factors including length of time in market and local income levels. Further, certain market costs,particularly occupancy costs, are lower in the US segment compared to the average for the International segment,which comprise a more diverse group of operations. As a result of the relative strength of the brand in the USsegment, the number of stores, the higher unit volumes, and the lower market costs, the US segment, despite itshigher relative percentage of company-operated stores, has a higher operating margin than the less-developedInternational segment.
Starbucks International store base continues to expand and we continue to focus on achieving sustainable growthfrom established international markets while at the same time investing in emerging markets, such as China. Newer
23
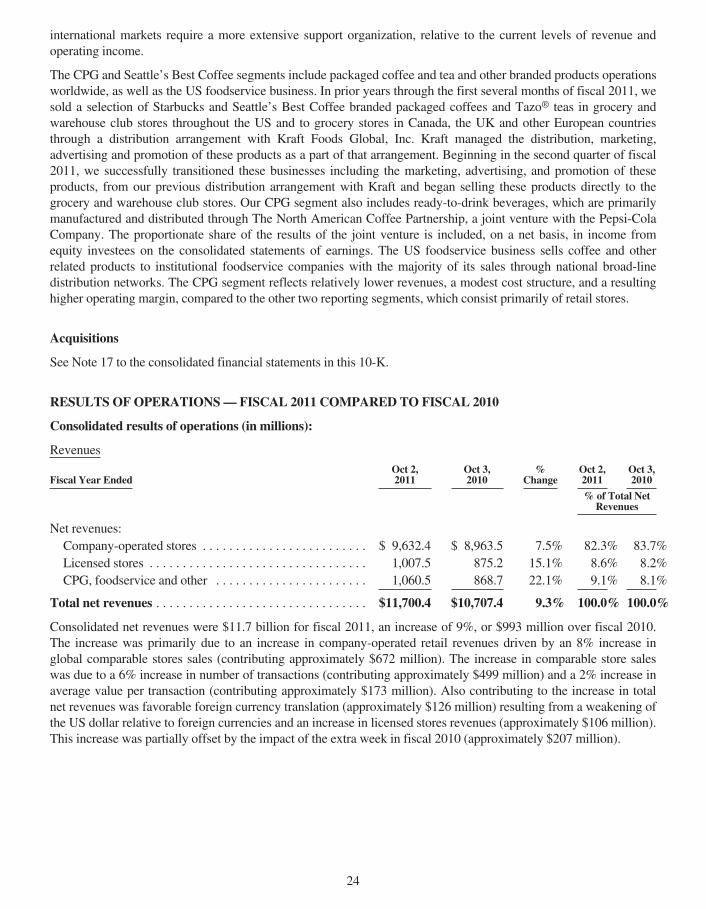
international markets require a more extensive support organization, relative to the current levels of revenue andoperating income.
The CPG and Seattle’s Best Coffee segments include packaged coffee and tea and other branded products operationsworldwide, as well as the US foodservice business. In prior years through the first several months of fiscal 2011, wesold a selection of Starbucks and Seattle’s Best Coffee branded packaged coffees and Tazo® teas in grocery andwarehouse club stores throughout the US and to grocery stores in Canada, the UK and other European countriesthrough a distribution arrangement with Kraft Foods Global, Inc. Kraft managed the distribution, marketing,advertising and promotion of these products as a part of that arrangement. Beginning in the second quarter of fiscal2011, we successfully transitioned these businesses including the marketing, advertising, and promotion of theseproducts, from our previous distribution arrangement with Kraft and began selling these products directly to thegrocery and warehouse club stores. Our CPG segment also includes ready-to-drink beverages, which are primarilymanufactured and distributed through The North American Coffee Partnership, a joint venture with the Pepsi-ColaCompany. The proportionate share of the results of the joint venture is included, on a net basis, in income fromequity investees on the consolidated statements of earnings. The US foodservice business sells coffee and otherrelated products to institutional foodservice companies with the majority of its sales through national broad-linedistribution networks. The CPG segment reflects relatively lower revenues, a modest cost structure, and a resultinghigher operating margin, compared to the other two reporting segments, which consist primarily of retail stores.
Acquisitions
See Note 17 to the consolidated financial statements in this 10-K.
RESULTS OF OPERATIONS— FISCAL 2011 COMPARED TO FISCAL 2010
Consolidated results of operations (in millions):
Revenues
Fiscal Year EndedOct 2,2011
Oct 3,2010
%Change
Oct 2,2011
Oct 3,2010
% of Total NetRevenues
Net revenues:Company-operated stores . . . . . . . . . . . . . . . . . . . . . . . . . $ 9,632.4 $ 8,963.5 7.5% 82.3% 83.7%Licensed stores . . . . . . . . . . . . . . . . . . . . . . . . . . . . . . . . . 1,007.5 875.2 15.1% 8.6% 8.2%CPG, foodservice and other . . . . . . . . . . . . . . . . . . . . . . . 1,060.5 868.7 22.1% 9.1% 8.1%
Total net revenues . . . . . . . . . . . . . . . . . . . . . . . . . . . . . . . . $11,700.4 $10,707.4 9.3% 100.0% 100.0%
Consolidated net revenues were $11.7 billion for fiscal 2011, an increase of 9%, or $993 million over fiscal 2010.The increase was primarily due to an increase in company-operated retail revenues driven by an 8% increase inglobal comparable stores sales (contributing approximately $672 million). The increase in comparable store saleswas due to a 6% increase in number of transactions (contributing approximately $499 million) and a 2% increase inaverage value per transaction (contributing approximately $173 million). Also contributing to the increase in totalnet revenues was favorable foreign currency translation (approximately $126 million) resulting from a weakening ofthe US dollar relative to foreign currencies and an increase in licensed stores revenues (approximately $106 million).This increase was partially offset by the impact of the extra week in fiscal 2010 (approximately $207 million).
24
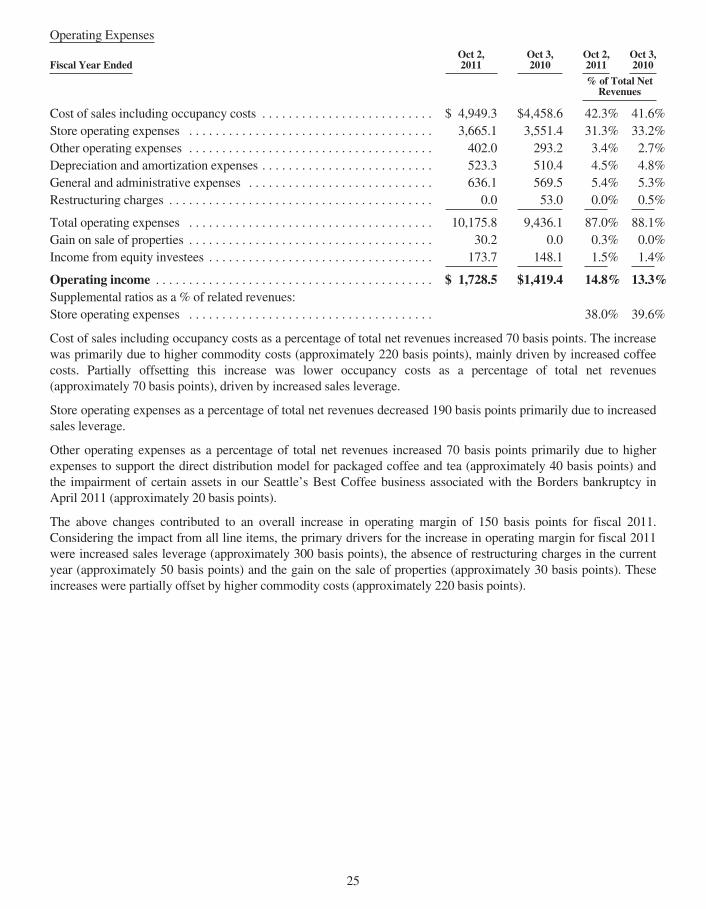
Operating Expenses
Fiscal Year EndedOct 2,2011
Oct 3,2010
Oct 2,2011
Oct 3,2010
% of Total NetRevenues
Cost of sales including occupancy costs . . . . . . . . . . . . . . . . . . . . . . . . . . $ 4,949.3 $4,458.6 42.3% 41.6%Store operating expenses . . . . . . . . . . . . . . . . . . . . . . . . . . . . . . . . . . . . . 3,665.1 3,551.4 31.3% 33.2%Other operating expenses . . . . . . . . . . . . . . . . . . . . . . . . . . . . . . . . . . . . . 402.0 293.2 3.4% 2.7%Depreciation and amortization expenses . . . . . . . . . . . . . . . . . . . . . . . . . . 523.3 510.4 4.5% 4.8%General and administrative expenses . . . . . . . . . . . . . . . . . . . . . . . . . . . . 636.1 569.5 5.4% 5.3%Restructuring charges . . . . . . . . . . . . . . . . . . . . . . . . . . . . . . . . . . . . . . . . 0.0 53.0 0.0% 0.5%
Total operating expenses . . . . . . . . . . . . . . . . . . . . . . . . . . . . . . . . . . . . . 10,175.8 9,436.1 87.0% 88.1%Gain on sale of properties . . . . . . . . . . . . . . . . . . . . . . . . . . . . . . . . . . . . . 30.2 0.0 0.3% 0.0%Income from equity investees . . . . . . . . . . . . . . . . . . . . . . . . . . . . . . . . . . 173.7 148.1 1.5% 1.4%
Operating income . . . . . . . . . . . . . . . . . . . . . . . . . . . . . . . . . . . . . . . . . . $ 1,728.5 $1,419.4 14.8% 13.3%Supplemental ratios as a % of related revenues:Store operating expenses . . . . . . . . . . . . . . . . . . . . . . . . . . . . . . . . . . . . . 38.0% 39.6%
Cost of sales including occupancy costs as a percentage of total net revenues increased 70 basis points. The increasewas primarily due to higher commodity costs (approximately 220 basis points), mainly driven by increased coffeecosts. Partially offsetting this increase was lower occupancy costs as a percentage of total net revenues(approximately 70 basis points), driven by increased sales leverage.
Store operating expenses as a percentage of total net revenues decreased 190 basis points primarily due to increasedsales leverage.
Other operating expenses as a percentage of total net revenues increased 70 basis points primarily due to higherexpenses to support the direct distribution model for packaged coffee and tea (approximately 40 basis points) andthe impairment of certain assets in our Seattle’s Best Coffee business associated with the Borders bankruptcy inApril 2011 (approximately 20 basis points).
The above changes contributed to an overall increase in operating margin of 150 basis points for fiscal 2011.Considering the impact from all line items, the primary drivers for the increase in operating margin for fiscal 2011were increased sales leverage (approximately 300 basis points), the absence of restructuring charges in the currentyear (approximately 50 basis points) and the gain on the sale of properties (approximately 30 basis points). Theseincreases were partially offset by higher commodity costs (approximately 220 basis points).
25
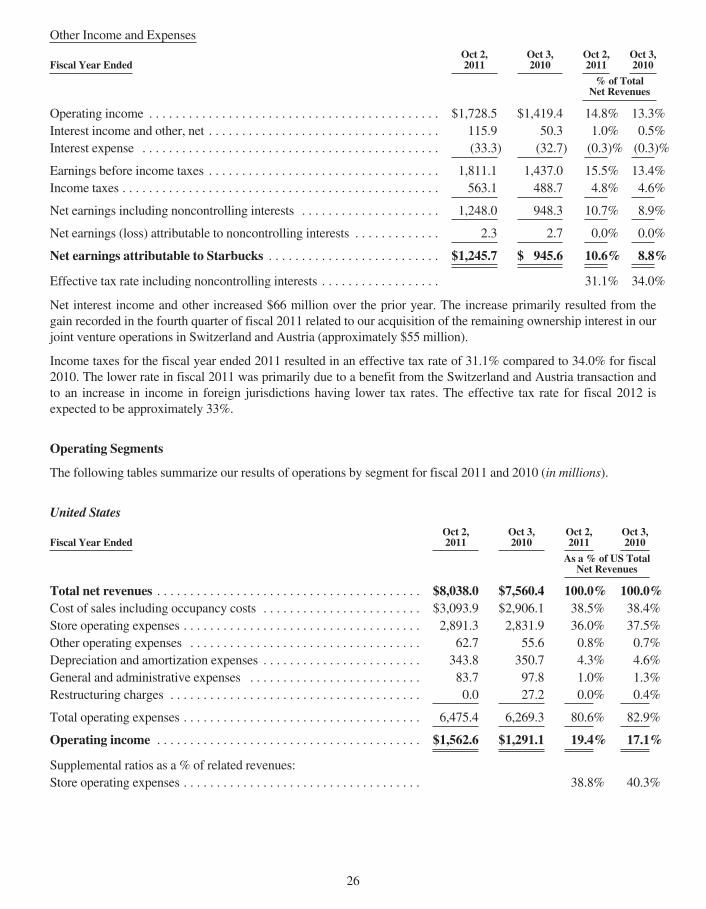
Other Income and Expenses
Fiscal Year EndedOct 2,2011
Oct 3,2010
Oct 2,2011
Oct 3,2010
% of TotalNet Revenues
Operating income . . . . . . . . . . . . . . . . . . . . . . . . . . . . . . . . . . . . . . . . . . . . $1,728.5 $1,419.4 14.8% 13.3%Interest income and other, net . . . . . . . . . . . . . . . . . . . . . . . . . . . . . . . . . . . 115.9 50.3 1.0% 0.5%Interest expense . . . . . . . . . . . . . . . . . . . . . . . . . . . . . . . . . . . . . . . . . . . . . (33.3) (32.7) (0.3)% (0.3)%
Earnings before income taxes . . . . . . . . . . . . . . . . . . . . . . . . . . . . . . . . . . . 1,811.1 1,437.0 15.5% 13.4%Income taxes . . . . . . . . . . . . . . . . . . . . . . . . . . . . . . . . . . . . . . . . . . . . . . . . 563.1 488.7 4.8% 4.6%
Net earnings including noncontrolling interests . . . . . . . . . . . . . . . . . . . . . 1,248.0 948.3 10.7% 8.9%
Net earnings (loss) attributable to noncontrolling interests . . . . . . . . . . . . . 2.3 2.7 0.0% 0.0%
Net earnings attributable to Starbucks . . . . . . . . . . . . . . . . . . . . . . . . . . $1,245.7 $ 945.6 10.6% 8.8%
Effective tax rate including noncontrolling interests . . . . . . . . . . . . . . . . . . 31.1% 34.0%
Net interest income and other increased $66 million over the prior year. The increase primarily resulted from thegain recorded in the fourth quarter of fiscal 2011 related to our acquisition of the remaining ownership interest in ourjoint venture operations in Switzerland and Austria (approximately $55 million).
Income taxes for the fiscal year ended 2011 resulted in an effective tax rate of 31.1% compared to 34.0% for fiscal2010. The lower rate in fiscal 2011 was primarily due to a benefit from the Switzerland and Austria transaction andto an increase in income in foreign jurisdictions having lower tax rates. The effective tax rate for fiscal 2012 isexpected to be approximately 33%.
Operating Segments
The following tables summarize our results of operations by segment for fiscal 2011 and 2010 (in millions).
United States
Fiscal Year EndedOct 2,2011
Oct 3,2010
Oct 2,2011
Oct 3,2010
As a % of US TotalNet Revenues
Total net revenues . . . . . . . . . . . . . . . . . . . . . . . . . . . . . . . . . . . . . . . . $8,038.0 $7,560.4 100.0% 100.0%Cost of sales including occupancy costs . . . . . . . . . . . . . . . . . . . . . . . . $3,093.9 $2,906.1 38.5% 38.4%Store operating expenses . . . . . . . . . . . . . . . . . . . . . . . . . . . . . . . . . . . . 2,891.3 2,831.9 36.0% 37.5%Other operating expenses . . . . . . . . . . . . . . . . . . . . . . . . . . . . . . . . . . . 62.7 55.6 0.8% 0.7%Depreciation and amortization expenses . . . . . . . . . . . . . . . . . . . . . . . . 343.8 350.7 4.3% 4.6%General and administrative expenses . . . . . . . . . . . . . . . . . . . . . . . . . . 83.7 97.8 1.0% 1.3%Restructuring charges . . . . . . . . . . . . . . . . . . . . . . . . . . . . . . . . . . . . . . 0.0 27.2 0.0% 0.4%
Total operating expenses . . . . . . . . . . . . . . . . . . . . . . . . . . . . . . . . . . . . 6,475.4 6,269.3 80.6% 82.9%
Operating income . . . . . . . . . . . . . . . . . . . . . . . . . . . . . . . . . . . . . . . . $1,562.6 $1,291.1 19.4% 17.1%
Supplemental ratios as a % of related revenues:Store operating expenses . . . . . . . . . . . . . . . . . . . . . . . . . . . . . . . . . . . . 38.8% 40.3%
26
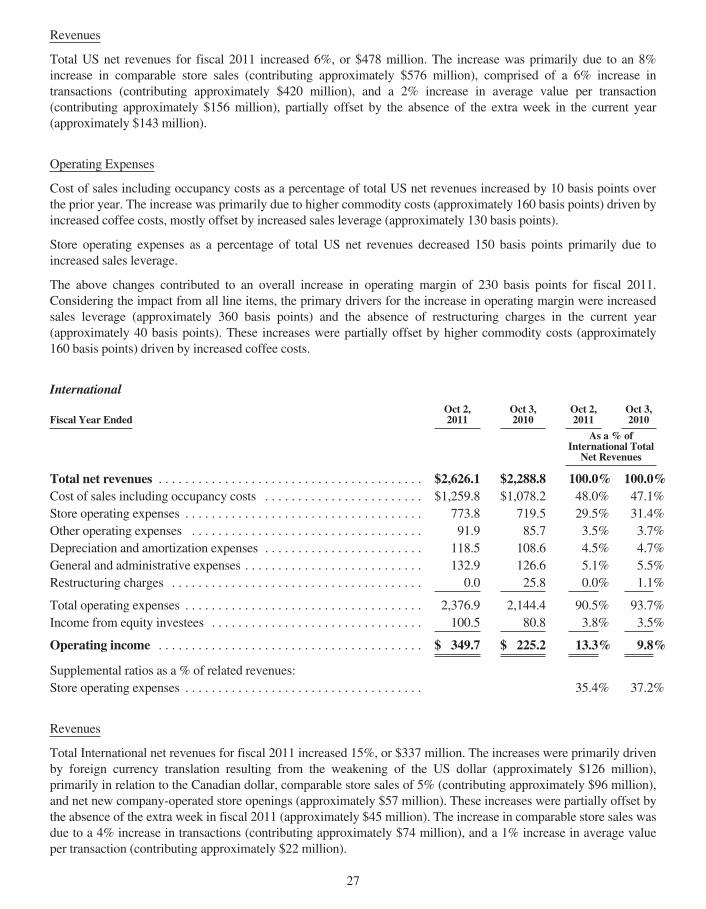
Revenues
Total US net revenues for fiscal 2011 increased 6%, or $478 million. The increase was primarily due to an 8%increase in comparable store sales (contributing approximately $576 million), comprised of a 6% increase intransactions (contributing approximately $420 million), and a 2% increase in average value per transaction(contributing approximately $156 million), partially offset by the absence of the extra week in the current year(approximately $143 million).
Operating Expenses
Cost of sales including occupancy costs as a percentage of total US net revenues increased by 10 basis points overthe prior year. The increase was primarily due to higher commodity costs (approximately 160 basis points) driven byincreased coffee costs, mostly offset by increased sales leverage (approximately 130 basis points).
Store operating expenses as a percentage of total US net revenues decreased 150 basis points primarily due toincreased sales leverage.
The above changes contributed to an overall increase in operating margin of 230 basis points for fiscal 2011.Considering the impact from all line items, the primary drivers for the increase in operating margin were increasedsales leverage (approximately 360 basis points) and the absence of restructuring charges in the current year(approximately 40 basis points). These increases were partially offset by higher commodity costs (approximately160 basis points) driven by increased coffee costs.
International
Fiscal Year EndedOct 2,2011
Oct 3,2010
Oct 2,2011
Oct 3,2010
As a % ofInternational Total
Net Revenues
Total net revenues . . . . . . . . . . . . . . . . . . . . . . . . . . . . . . . . . . . . . . . . $2,626.1 $2,288.8 100.0% 100.0%Cost of sales including occupancy costs . . . . . . . . . . . . . . . . . . . . . . . . $1,259.8 $1,078.2 48.0% 47.1%Store operating expenses . . . . . . . . . . . . . . . . . . . . . . . . . . . . . . . . . . . . 773.8 719.5 29.5% 31.4%Other operating expenses . . . . . . . . . . . . . . . . . . . . . . . . . . . . . . . . . . . 91.9 85.7 3.5% 3.7%Depreciation and amortization expenses . . . . . . . . . . . . . . . . . . . . . . . . 118.5 108.6 4.5% 4.7%General and administrative expenses . . . . . . . . . . . . . . . . . . . . . . . . . . . 132.9 126.6 5.1% 5.5%Restructuring charges . . . . . . . . . . . . . . . . . . . . . . . . . . . . . . . . . . . . . . 0.0 25.8 0.0% 1.1%
Total operating expenses . . . . . . . . . . . . . . . . . . . . . . . . . . . . . . . . . . . . 2,376.9 2,144.4 90.5% 93.7%Income from equity investees . . . . . . . . . . . . . . . . . . . . . . . . . . . . . . . . 100.5 80.8 3.8% 3.5%
Operating income . . . . . . . . . . . . . . . . . . . . . . . . . . . . . . . . . . . . . . . . $ 349.7 $ 225.2 13.3% 9.8%
Supplemental ratios as a % of related revenues:Store operating expenses . . . . . . . . . . . . . . . . . . . . . . . . . . . . . . . . . . . . 35.4% 37.2%
Revenues
Total International net revenues for fiscal 2011 increased 15%, or $337 million. The increases were primarily drivenby foreign currency translation resulting from the weakening of the US dollar (approximately $126 million),primarily in relation to the Canadian dollar, comparable store sales of 5% (contributing approximately $96 million),and net new company-operated store openings (approximately $57 million). These increases were partially offset bythe absence of the extra week in fiscal 2011 (approximately $45 million). The increase in comparable store sales wasdue to a 4% increase in transactions (contributing approximately $74 million), and a 1% increase in average valueper transaction (contributing approximately $22 million).
27
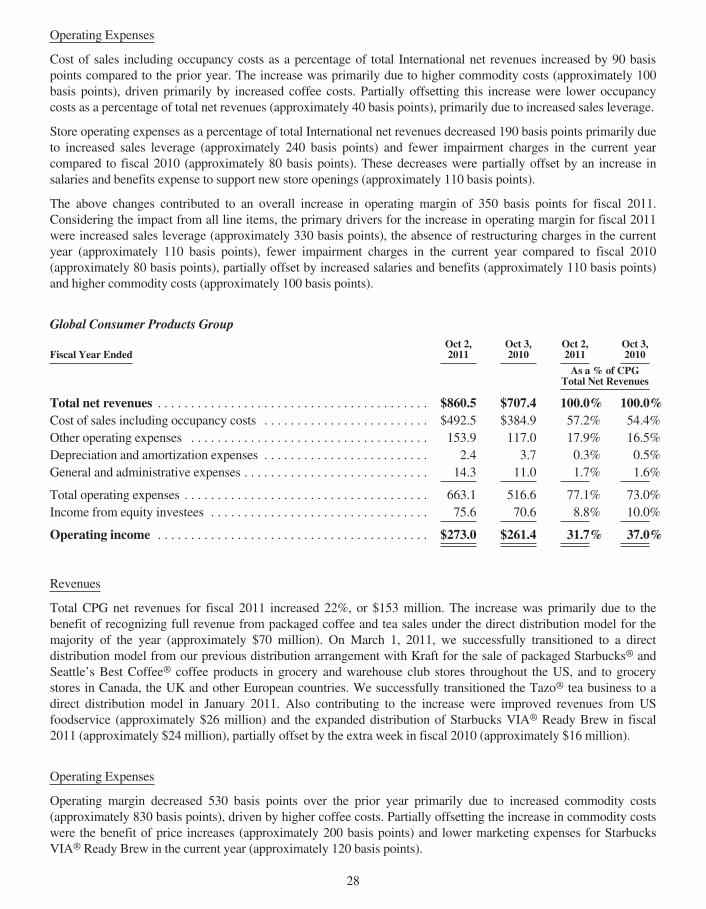
Operating Expenses
Cost of sales including occupancy costs as a percentage of total International net revenues increased by 90 basispoints compared to the prior year. The increase was primarily due to higher commodity costs (approximately 100basis points), driven primarily by increased coffee costs. Partially offsetting this increase were lower occupancycosts as a percentage of total net revenues (approximately 40 basis points), primarily due to increased sales leverage.
Store operating expenses as a percentage of total International net revenues decreased 190 basis points primarily dueto increased sales leverage (approximately 240 basis points) and fewer impairment charges in the current yearcompared to fiscal 2010 (approximately 80 basis points). These decreases were partially offset by an increase insalaries and benefits expense to support new store openings (approximately 110 basis points).
The above changes contributed to an overall increase in operating margin of 350 basis points for fiscal 2011.Considering the impact from all line items, the primary drivers for the increase in operating margin for fiscal 2011were increased sales leverage (approximately 330 basis points), the absence of restructuring charges in the currentyear (approximately 110 basis points), fewer impairment charges in the current year compared to fiscal 2010(approximately 80 basis points), partially offset by increased salaries and benefits (approximately 110 basis points)and higher commodity costs (approximately 100 basis points).
Global Consumer Products Group
Fiscal Year EndedOct 2,2011
Oct 3,2010
Oct 2,2011
Oct 3,2010
As a % of CPGTotal Net Revenues
Total net revenues . . . . . . . . . . . . . . . . . . . . . . . . . . . . . . . . . . . . . . . . . $860.5 $707.4 100.0% 100.0%Cost of sales including occupancy costs . . . . . . . . . . . . . . . . . . . . . . . . . $492.5 $384.9 57.2% 54.4%Other operating expenses . . . . . . . . . . . . . . . . . . . . . . . . . . . . . . . . . . . . 153.9 117.0 17.9% 16.5%Depreciation and amortization expenses . . . . . . . . . . . . . . . . . . . . . . . . . 2.4 3.7 0.3% 0.5%General and administrative expenses . . . . . . . . . . . . . . . . . . . . . . . . . . . . 14.3 11.0 1.7% 1.6%
Total operating expenses . . . . . . . . . . . . . . . . . . . . . . . . . . . . . . . . . . . . . 663.1 516.6 77.1% 73.0%Income from equity investees . . . . . . . . . . . . . . . . . . . . . . . . . . . . . . . . . 75.6 70.6 8.8% 10.0%
Operating income . . . . . . . . . . . . . . . . . . . . . . . . . . . . . . . . . . . . . . . . . $273.0 $261.4 31.7% 37.0%
Revenues
Total CPG net revenues for fiscal 2011 increased 22%, or $153 million. The increase was primarily due to thebenefit of recognizing full revenue from packaged coffee and tea sales under the direct distribution model for themajority of the year (approximately $70 million). On March 1, 2011, we successfully transitioned to a directdistribution model from our previous distribution arrangement with Kraft for the sale of packaged Starbucks® andSeattle’s Best Coffee® coffee products in grocery and warehouse club stores throughout the US, and to grocerystores in Canada, the UK and other European countries. We successfully transitioned the Tazo® tea business to adirect distribution model in January 2011. Also contributing to the increase were improved revenues from USfoodservice (approximately $26 million) and the expanded distribution of Starbucks VIA® Ready Brew in fiscal2011 (approximately $24 million), partially offset by the extra week in fiscal 2010 (approximately $16 million).
Operating Expenses
Operating margin decreased 530 basis points over the prior year primarily due to increased commodity costs(approximately 830 basis points), driven by higher coffee costs. Partially offsetting the increase in commodity costswere the benefit of price increases (approximately 200 basis points) and lower marketing expenses for StarbucksVIA® Ready Brew in the current year (approximately 120 basis points).
28
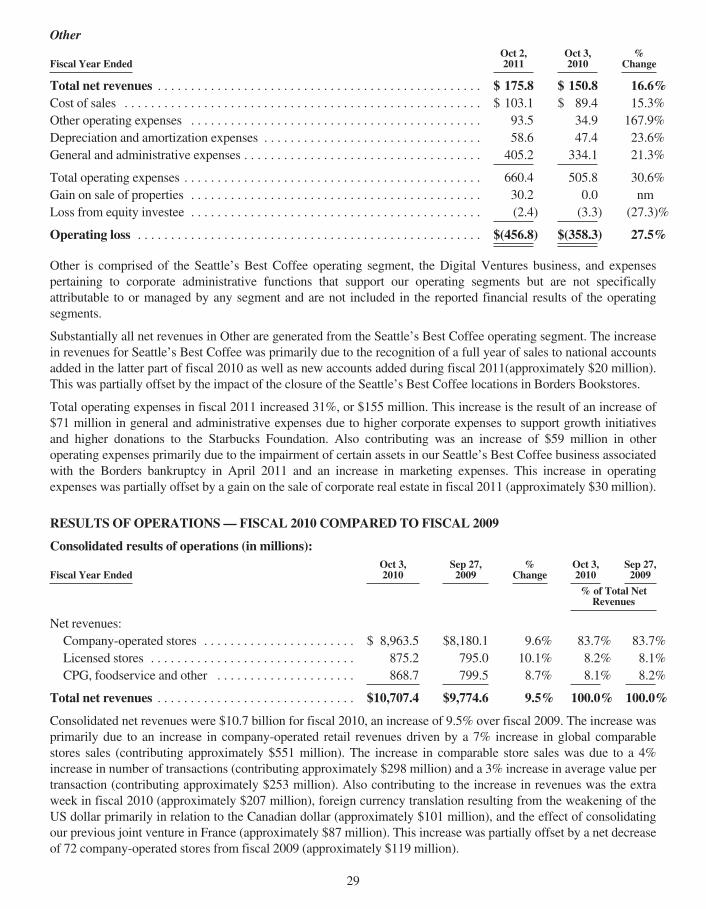
Other
Fiscal Year EndedOct 2,2011
Oct 3,2010
%Change
Total net revenues . . . . . . . . . . . . . . . . . . . . . . . . . . . . . . . . . . . . . . . . . . . . . . . . . $ 175.8 $ 150.8 16.6%Cost of sales . . . . . . . . . . . . . . . . . . . . . . . . . . . . . . . . . . . . . . . . . . . . . . . . . . . . . . $ 103.1 $ 89.4 15.3%Other operating expenses . . . . . . . . . . . . . . . . . . . . . . . . . . . . . . . . . . . . . . . . . . . . 93.5 34.9 167.9%Depreciation and amortization expenses . . . . . . . . . . . . . . . . . . . . . . . . . . . . . . . . . 58.6 47.4 23.6%General and administrative expenses . . . . . . . . . . . . . . . . . . . . . . . . . . . . . . . . . . . . 405.2 334.1 21.3%
Total operating expenses . . . . . . . . . . . . . . . . . . . . . . . . . . . . . . . . . . . . . . . . . . . . . 660.4 505.8 30.6%Gain on sale of properties . . . . . . . . . . . . . . . . . . . . . . . . . . . . . . . . . . . . . . . . . . . . 30.2 0.0 nmLoss from equity investee . . . . . . . . . . . . . . . . . . . . . . . . . . . . . . . . . . . . . . . . . . . . (2.4) (3.3) (27.3)%
Operating loss . . . . . . . . . . . . . . . . . . . . . . . . . . . . . . . . . . . . . . . . . . . . . . . . . . . . $(456.8) $(358.3) 27.5%
Other is comprised of the Seattle’s Best Coffee operating segment, the Digital Ventures business, and expensespertaining to corporate administrative functions that support our operating segments but are not specificallyattributable to or managed by any segment and are not included in the reported financial results of the operatingsegments.
Substantially all net revenues in Other are generated from the Seattle’s Best Coffee operating segment. The increasein revenues for Seattle’s Best Coffee was primarily due to the recognition of a full year of sales to national accountsadded in the latter part of fiscal 2010 as well as new accounts added during fiscal 2011(approximately $20 million).This was partially offset by the impact of the closure of the Seattle’s Best Coffee locations in Borders Bookstores.
Total operating expenses in fiscal 2011 increased 31%, or $155 million. This increase is the result of an increase of$71 million in general and administrative expenses due to higher corporate expenses to support growth initiativesand higher donations to the Starbucks Foundation. Also contributing was an increase of $59 million in otheroperating expenses primarily due to the impairment of certain assets in our Seattle’s Best Coffee business associatedwith the Borders bankruptcy in April 2011 and an increase in marketing expenses. This increase in operatingexpenses was partially offset by a gain on the sale of corporate real estate in fiscal 2011 (approximately $30 million).
RESULTS OF OPERATIONS— FISCAL 2010 COMPARED TO FISCAL 2009
Consolidated results of operations (in millions):
Fiscal Year EndedOct 3,2010
Sep 27,2009
%Change
Oct 3,2010
Sep 27,2009
% of Total NetRevenues
Net revenues:Company-operated stores . . . . . . . . . . . . . . . . . . . . . . . $ 8,963.5 $8,180.1 9.6% 83.7% 83.7%Licensed stores . . . . . . . . . . . . . . . . . . . . . . . . . . . . . . . 875.2 795.0 10.1% 8.2% 8.1%CPG, foodservice and other . . . . . . . . . . . . . . . . . . . . . 868.7 799.5 8.7% 8.1% 8.2%
Total net revenues . . . . . . . . . . . . . . . . . . . . . . . . . . . . . . $10,707.4 $9,774.6 9.5% 100.0% 100.0%
Consolidated net revenues were $10.7 billion for fiscal 2010, an increase of 9.5% over fiscal 2009. The increase wasprimarily due to an increase in company-operated retail revenues driven by a 7% increase in global comparablestores sales (contributing approximately $551 million). The increase in comparable store sales was due to a 4%increase in number of transactions (contributing approximately $298 million) and a 3% increase in average value pertransaction (contributing approximately $253 million). Also contributing to the increase in revenues was the extraweek in fiscal 2010 (approximately $207 million), foreign currency translation resulting from the weakening of theUS dollar primarily in relation to the Canadian dollar (approximately $101 million), and the effect of consolidatingour previous joint venture in France (approximately $87 million). This increase was partially offset by a net decreaseof 72 company-operated stores from fiscal 2009 (approximately $119 million).
29
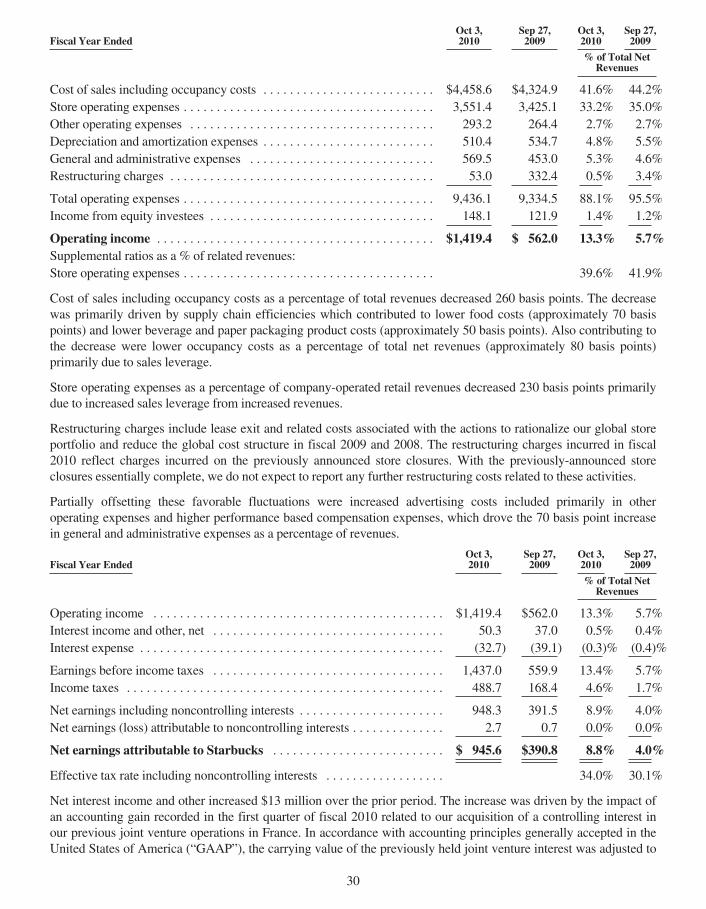
Fiscal Year EndedOct 3,2010
Sep 27,2009
Oct 3,2010
Sep 27,2009
% of Total NetRevenues
Cost of sales including occupancy costs . . . . . . . . . . . . . . . . . . . . . . . . . . $4,458.6 $4,324.9 41.6% 44.2%Store operating expenses . . . . . . . . . . . . . . . . . . . . . . . . . . . . . . . . . . . . . . 3,551.4 3,425.1 33.2% 35.0%Other operating expenses . . . . . . . . . . . . . . . . . . . . . . . . . . . . . . . . . . . . . 293.2 264.4 2.7% 2.7%Depreciation and amortization expenses . . . . . . . . . . . . . . . . . . . . . . . . . . 510.4 534.7 4.8% 5.5%General and administrative expenses . . . . . . . . . . . . . . . . . . . . . . . . . . . . 569.5 453.0 5.3% 4.6%Restructuring charges . . . . . . . . . . . . . . . . . . . . . . . . . . . . . . . . . . . . . . . . 53.0 332.4 0.5% 3.4%
Total operating expenses . . . . . . . . . . . . . . . . . . . . . . . . . . . . . . . . . . . . . . 9,436.1 9,334.5 88.1% 95.5%Income from equity investees . . . . . . . . . . . . . . . . . . . . . . . . . . . . . . . . . . 148.1 121.9 1.4% 1.2%
Operating income . . . . . . . . . . . . . . . . . . . . . . . . . . . . . . . . . . . . . . . . . . $1,419.4 $ 562.0 13.3% 5.7%Supplemental ratios as a % of related revenues:Store operating expenses . . . . . . . . . . . . . . . . . . . . . . . . . . . . . . . . . . . . . . 39.6% 41.9%
Cost of sales including occupancy costs as a percentage of total revenues decreased 260 basis points. The decreasewas primarily driven by supply chain efficiencies which contributed to lower food costs (approximately 70 basispoints) and lower beverage and paper packaging product costs (approximately 50 basis points). Also contributing tothe decrease were lower occupancy costs as a percentage of total net revenues (approximately 80 basis points)primarily due to sales leverage.
Store operating expenses as a percentage of company-operated retail revenues decreased 230 basis points primarilydue to increased sales leverage from increased revenues.
Restructuring charges include lease exit and related costs associated with the actions to rationalize our global storeportfolio and reduce the global cost structure in fiscal 2009 and 2008. The restructuring charges incurred in fiscal2010 reflect charges incurred on the previously announced store closures. With the previously-announced storeclosures essentially complete, we do not expect to report any further restructuring costs related to these activities.
Partially offsetting these favorable fluctuations were increased advertising costs included primarily in otheroperating expenses and higher performance based compensation expenses, which drove the 70 basis point increasein general and administrative expenses as a percentage of revenues.
Fiscal Year EndedOct 3,2010
Sep 27,2009
Oct 3,2010
Sep 27,2009
% of Total NetRevenues
Operating income . . . . . . . . . . . . . . . . . . . . . . . . . . . . . . . . . . . . . . . . . . . . $1,419.4 $562.0 13.3% 5.7%Interest income and other, net . . . . . . . . . . . . . . . . . . . . . . . . . . . . . . . . . . . 50.3 37.0 0.5% 0.4%Interest expense . . . . . . . . . . . . . . . . . . . . . . . . . . . . . . . . . . . . . . . . . . . . . . (32.7) (39.1) (0.3)% (0.4)%
Earnings before income taxes . . . . . . . . . . . . . . . . . . . . . . . . . . . . . . . . . . . 1,437.0 559.9 13.4% 5.7%Income taxes . . . . . . . . . . . . . . . . . . . . . . . . . . . . . . . . . . . . . . . . . . . . . . . . 488.7 168.4 4.6% 1.7%
Net earnings including noncontrolling interests . . . . . . . . . . . . . . . . . . . . . . 948.3 391.5 8.9% 4.0%Net earnings (loss) attributable to noncontrolling interests . . . . . . . . . . . . . . 2.7 0.7 0.0% 0.0%
Net earnings attributable to Starbucks . . . . . . . . . . . . . . . . . . . . . . . . . . $ 945.6 $390.8 8.8% 4.0%
Effective tax rate including noncontrolling interests . . . . . . . . . . . . . . . . . . 34.0% 30.1%
Net interest income and other increased $13 million over the prior period. The increase was driven by the impact ofan accounting gain recorded in the first quarter of fiscal 2010 related to our acquisition of a controlling interest inour previous joint venture operations in France. In accordance with accounting principles generally accepted in theUnited States of America (“GAAP”), the carrying value of the previously held joint venture interest was adjusted to
30
fair value upon the acquisition of the controlling interest. Also contributing to the increase were favorablefluctuations in unrealized holding gains on our trading securities portfolio of approximately $10 million. Thisfavorability was partially offset by unfavorable foreign currency fluctuations (approximately $11 million), whichrelated primarily to the revaluation of certain trade payables and receivables.
Income taxes for the fiscal year ended 2010 resulted in an effective tax rate of 34.0% compared to 30.1% for fiscal2009. The lower rate in fiscal 2009 was primarily due to the benefits recognized for retroactive tax credits and anaudit settlement.
United States
Fiscal Year EndedOct 3,2010
Sep 27,2009
Oct 3,2010
Sep 27,2009
As a % of US TotalNet Revenues
Total net revenues . . . . . . . . . . . . . . . . . . . . . . . . . . . . . . . . . . . . . . . . . $7,560.4 $7,061.7 100.0% 100.0%Cost of sales including occupancy costs . . . . . . . . . . . . . . . . . . . . . . . . . $2,906.1 $2,941.4 38.4% 41.7%Store operating expenses . . . . . . . . . . . . . . . . . . . . . . . . . . . . . . . . . . . . . 2,831.9 2,815.1 37.5% 39.9%Other operating expenses . . . . . . . . . . . . . . . . . . . . . . . . . . . . . . . . . . . . 55.6 66.6 0.7% 0.9%Depreciation and amortization expenses . . . . . . . . . . . . . . . . . . . . . . . . . 350.7 377.9 4.6% 5.4%General and administrative expenses . . . . . . . . . . . . . . . . . . . . . . . . . . . . 97.8 84.8 1.3% 1.2%Restructuring charges . . . . . . . . . . . . . . . . . . . . . . . . . . . . . . . . . . . . . . . 27.2 246.3 0.4% 3.5%
Total operating expenses . . . . . . . . . . . . . . . . . . . . . . . . . . . . . . . . . . . . . 6,269.3 6,532.1 82.9% 92.5%Income from equity investees . . . . . . . . . . . . . . . . . . . . . . . . . . . . . . . . . 0.0 0.5 0.0% 0.0%
Operating income . . . . . . . . . . . . . . . . . . . . . . . . . . . . . . . . . . . . . . . . . $1,291.1 $ 530.1 17.1% 7.5%
Supplemental ratios as a % of related revenues:Store operating expenses . . . . . . . . . . . . . . . . . . . . . . . . . . . . . . . . . . . . . 40.3% 42.8%
US net revenues increased primarily due to an increase in company-operated retail revenues of 7%. This increase isprimarily due to a 7% increase in comparable store sales (contributing approximately $452 million), comprised of a3% increase in transactions (contributing approximately $222 million), and a 4% increase in average value pertransaction (contributing approximately $230 million). Also contributing to the increase in total net revenues was theextra week in fiscal 2010 (approximately $143 million), partially offset by a net decrease of 57 company-operatedstores from fiscal 2009 (approximately $125 million).
Cost of sales including occupancy costs as a percentage of total revenues decreased by 330 basis points over theprior year. The decrease was primarily driven by supply chain efficiencies which contributed to lower food costs(approximately 90 basis points) and lower beverage and paper packaging product costs (approximately 60 basispoints). Also contributing to the decrease were lower occupancy costs as a percentage of total net revenues(approximately 100 basis points) primarily due to sales leverage.
Store operating expenses as a percent of related retail revenues decreased 250 basis points primarily due to increasedsales leverage.
Restructuring charges include lease exit and related costs associated with the actions to rationalize our global storeportfolio. Restructuring charges in fiscal 2010 decreased $219 million from 2009 due to the completion of ourrestructuring efforts in the US during fiscal 2010.
31
International
Fiscal Year EndedOct 3,2010
Sep 27,2009
Oct 3,2010
Sep 27,2009
As a % ofInternational Total
Net Revenues
Total net revenues . . . . . . . . . . . . . . . . . . . . . . . . . . . . . . . . . . . . . . . . . $2,288.8 $1,914.3 100.0% 100.0%Cost of sales including occupancy costs . . . . . . . . . . . . . . . . . . . . . . . . . $1,078.2 $ 961.3 47.1% 50.2%Store operating expenses . . . . . . . . . . . . . . . . . . . . . . . . . . . . . . . . . . . . . 719.5 610.0 31.4% 31.9%Other operating expenses . . . . . . . . . . . . . . . . . . . . . . . . . . . . . . . . . . . . . 85.7 71.2 3.7% 3.7%Depreciation and amortization expenses . . . . . . . . . . . . . . . . . . . . . . . . . 108.6 102.2 4.7% 5.3%General and administrative expenses . . . . . . . . . . . . . . . . . . . . . . . . . . . . 126.6 105.0 5.5% 5.5%Restructuring charges . . . . . . . . . . . . . . . . . . . . . . . . . . . . . . . . . . . . . . . 25.8 27.0 1.1% 1.4%
Total operating expenses . . . . . . . . . . . . . . . . . . . . . . . . . . . . . . . . . . . . . 2,144.4 1,876.7 93.7% 98.0%Income from equity investees . . . . . . . . . . . . . . . . . . . . . . . . . . . . . . . . . 80.8 53.6 3.5% 2.8%
Operating income . . . . . . . . . . . . . . . . . . . . . . . . . . . . . . . . . . . . . . . . . $ 225.2 $ 91.2 9.8% 4.8%
Supplemental ratios as a % of related revenues:Store operating expenses . . . . . . . . . . . . . . . . . . . . . . . . . . . . . . . . . . . . . 37.2% 37.9%
International net revenues increased due to foreign currency translation resulting from the weakening of the USdollar primarily in relation to the Canadian dollar (approximately $101 million), comparable store sales of 6%(contributing approximately $99 million), the effect of consolidating our previous joint venture in France(approximately $87 million), and the extra week in fiscal 2010 (approximately $45 million). The increase incomparable store sales was due to a 5% increase in transactions (contributing approximately $78 million), and a 1%increase in average value per transaction (contributing approximately $21 million).
Cost of sales including occupancy costs as a percentage of total revenues decreased by 310 basis points compared tothe prior year. The decrease was primarily driven by lower costs for food and beverage components resulting fromsupply chain efficiencies (approximately 120 basis points). Also contributing to the decrease were lower occupancycosts as a percentage of total net revenues (approximately 120 basis points) primarily due to sales leverage.
Store operating expenses as a percent of related retail revenues decreased 70 basis points primarily due to reducedimpairments in fiscal 2010 compared to fiscal 2009.
Restructuring charges include lease exit and related costs associated with the actions to rationalize our global storeportfolio. Restructuring charges in fiscal 2010 decreased slightly from 2009 due to the completion of ourrestructuring efforts internationally by the end of fiscal 2010.
32
Global Consumer Products Group
Fiscal Year EndedOct 3,2010
Sep 27,2009
Oct 3,2010
Sep 27,2009
As a % of CPGTotal Net Revenues
Total net revenues . . . . . . . . . . . . . . . . . . . . . . . . . . . . . . . . . . . . . . . . . $707.4 $674.4 100.0% 100.0%Cost of sales including occupancy costs . . . . . . . . . . . . . . . . . . . . . . . . . $384.9 $350.5 54.4% 52.0%Other operating expenses . . . . . . . . . . . . . . . . . . . . . . . . . . . . . . . . . . . . . 117.0 95.3 16.5% 14.1%Depreciation and amortization expenses . . . . . . . . . . . . . . . . . . . . . . . . . 3.7 4.8 0.5% 0.7%General and administrative expenses . . . . . . . . . . . . . . . . . . . . . . . . . . . . 11.0 8.8 1.6% 1.3%Restructuring charges . . . . . . . . . . . . . . . . . . . . . . . . . . . . . . . . . . . . . . . 0.0 1.0 0.0% 0.1%
Total operating expenses . . . . . . . . . . . . . . . . . . . . . . . . . . . . . . . . . . . . . 516.6 460.4 73.0% 68.3%Income from equity investees . . . . . . . . . . . . . . . . . . . . . . . . . . . . . . . . . 70.6 67.8 10.0% 10.1%
Operating income . . . . . . . . . . . . . . . . . . . . . . . . . . . . . . . . . . . . . . . . . $261.4 $281.8 37.0% 41.8%
CPG net revenues increased primarily due to the launch of Starbucks VIA® Ready Brew (approximately $22million) and the extra week in fiscal 2010 (approximately $16 million).
Operating margin decreased 480 basis points over the prior year due primarily to increased Starbucks VIA® ReadyBrew launch expenses.
Other
Fiscal Year EndedOct 3,2010
Sep 27,2009
%Change
Total net revenues . . . . . . . . . . . . . . . . . . . . . . . . . . . . . . . . . . . . . . . . . . . . . . . . . . $ 150.8 $ 124.2 21.4%Cost of sales . . . . . . . . . . . . . . . . . . . . . . . . . . . . . . . . . . . . . . . . . . . . . . . . . . . . . . . $ 89.4 $ 71.7 24.7%Other operating expenses . . . . . . . . . . . . . . . . . . . . . . . . . . . . . . . . . . . . . . . . . . . . . . 34.9 31.3 11.5%Depreciation and amortization expenses . . . . . . . . . . . . . . . . . . . . . . . . . . . . . . . . . . 47.4 49.8 (4.8)%General and administrative expenses . . . . . . . . . . . . . . . . . . . . . . . . . . . . . . . . . . . . . 334.1 254.4 31.3%Restructuring charges . . . . . . . . . . . . . . . . . . . . . . . . . . . . . . . . . . . . . . . . . . . . . . . . 0.0 58.1 (100.0)%
Total operating expenses . . . . . . . . . . . . . . . . . . . . . . . . . . . . . . . . . . . . . . . . . . . . . . 505.8 465.3 8.7%Loss from equity investee . . . . . . . . . . . . . . . . . . . . . . . . . . . . . . . . . . . . . . . . . . . . . (3.3) 0.0 nm
Operating loss . . . . . . . . . . . . . . . . . . . . . . . . . . . . . . . . . . . . . . . . . . . . . . . . . . . . . $(358.3) $(341.1) 5.0%
Substantially all of net revenues in Other are generated from the Seattle’s Best Coffee operating segment. Theincrease in revenues for Seattle’s Best Coffee was primarily due to sales to new national accounts (contributingapproximately $13 million).
Operating expenses included in Other relate to Seattle’s Best Coffee and Digital Ventures as well as expensespertaining to corporate administrative functions that support our operating segments but are not specificallyattributable to or managed by any segment and are not included in the reported financial results of the operatingsegments. Total operating expenses increased $40.5 million primarily as a result of increased general andadministrative expenses ($80 million) primarily due to higher performance-based compensation in 2010. Thisincrease was partially offset by a decrease of $58 million in restructuring charges due to the completion of ourrestructuring activities within the non-store support organization.
33
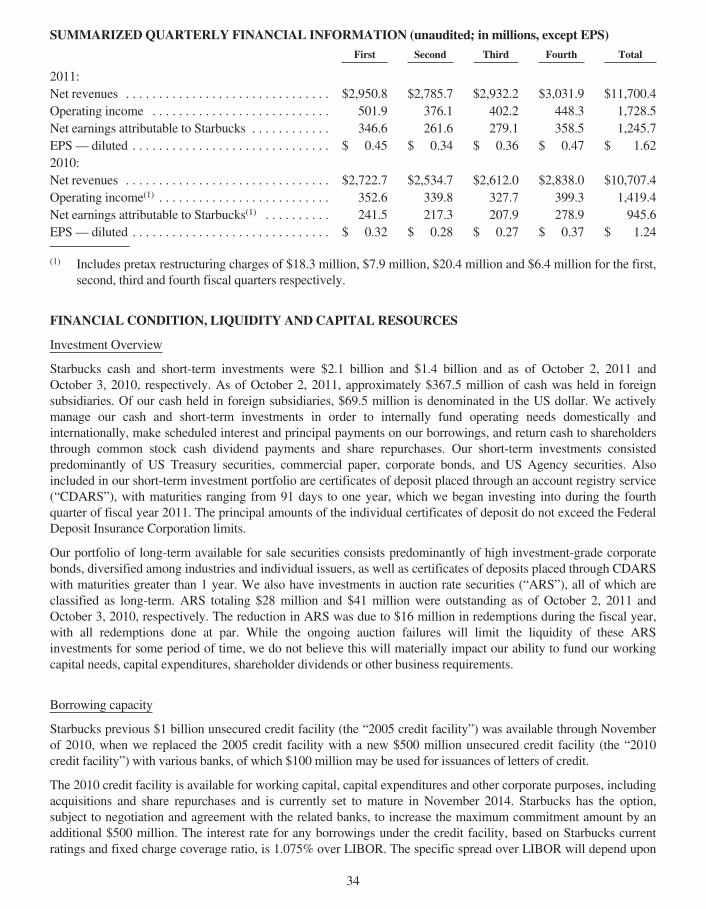
SUMMARIZEDQUARTERLY FINANCIAL INFORMATION (unaudited; in millions, except EPS)First Second Third Fourth Total
2011:Net revenues . . . . . . . . . . . . . . . . . . . . . . . . . . . . . . . $2,950.8 $2,785.7 $2,932.2 $3,031.9 $11,700.4Operating income . . . . . . . . . . . . . . . . . . . . . . . . . . . 501.9 376.1 402.2 448.3 1,728.5Net earnings attributable to Starbucks . . . . . . . . . . . . 346.6 261.6 279.1 358.5 1,245.7EPS— diluted . . . . . . . . . . . . . . . . . . . . . . . . . . . . . . $ 0.45 $ 0.34 $ 0.36 $ 0.47 $ 1.622010:Net revenues . . . . . . . . . . . . . . . . . . . . . . . . . . . . . . . $2,722.7 $2,534.7 $2,612.0 $2,838.0 $10,707.4Operating income(1) . . . . . . . . . . . . . . . . . . . . . . . . . . 352.6 339.8 327.7 399.3 1,419.4Net earnings attributable to Starbucks(1) . . . . . . . . . . 241.5 217.3 207.9 278.9 945.6EPS— diluted . . . . . . . . . . . . . . . . . . . . . . . . . . . . . . $ 0.32 $ 0.28 $ 0.27 $ 0.37 $ 1.24
(1) Includes pretax restructuring charges of $18.3 million, $7.9 million, $20.4 million and $6.4 million for the first,second, third and fourth fiscal quarters respectively.
FINANCIAL CONDITION, LIQUIDITY AND CAPITAL RESOURCES
Investment Overview
Starbucks cash and short-term investments were $2.1 billion and $1.4 billion and as of October 2, 2011 andOctober 3, 2010, respectively. As of October 2, 2011, approximately $367.5 million of cash was held in foreignsubsidiaries. Of our cash held in foreign subsidiaries, $69.5 million is denominated in the US dollar. We activelymanage our cash and short-term investments in order to internally fund operating needs domestically andinternationally, make scheduled interest and principal payments on our borrowings, and return cash to shareholdersthrough common stock cash dividend payments and share repurchases. Our short-term investments consistedpredominantly of US Treasury securities, commercial paper, corporate bonds, and US Agency securities. Alsoincluded in our short-term investment portfolio are certificates of deposit placed through an account registry service(“CDARS”), with maturities ranging from 91 days to one year, which we began investing into during the fourthquarter of fiscal year 2011. The principal amounts of the individual certificates of deposit do not exceed the FederalDeposit Insurance Corporation limits.
Our portfolio of long-term available for sale securities consists predominantly of high investment-grade corporatebonds, diversified among industries and individual issuers, as well as certificates of deposits placed through CDARSwith maturities greater than 1 year. We also have investments in auction rate securities (“ARS”), all of which areclassified as long-term. ARS totaling $28 million and $41 million were outstanding as of October 2, 2011 andOctober 3, 2010, respectively. The reduction in ARS was due to $16 million in redemptions during the fiscal year,with all redemptions done at par. While the ongoing auction failures will limit the liquidity of these ARSinvestments for some period of time, we do not believe this will materially impact our ability to fund our workingcapital needs, capital expenditures, shareholder dividends or other business requirements.
Borrowing capacity
Starbucks previous $1 billion unsecured credit facility (the “2005 credit facility”) was available through Novemberof 2010, when we replaced the 2005 credit facility with a new $500 million unsecured credit facility (the “2010credit facility”) with various banks, of which $100 million may be used for issuances of letters of credit.
The 2010 credit facility is available for working capital, capital expenditures and other corporate purposes, includingacquisitions and share repurchases and is currently set to mature in November 2014. Starbucks has the option,subject to negotiation and agreement with the related banks, to increase the maximum commitment amount by anadditional $500 million. The interest rate for any borrowings under the credit facility, based on Starbucks currentratings and fixed charge coverage ratio, is 1.075% over LIBOR. The specific spread over LIBOR will depend upon
34
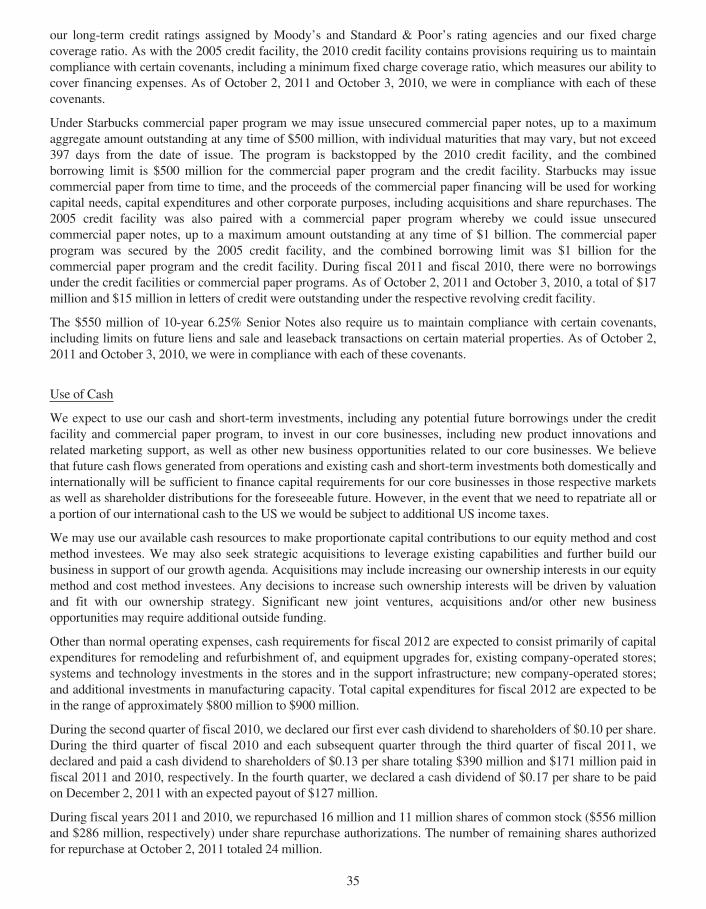
our long-term credit ratings assigned by Moody’s and Standard & Poor’s rating agencies and our fixed chargecoverage ratio. As with the 2005 credit facility, the 2010 credit facility contains provisions requiring us to maintaincompliance with certain covenants, including a minimum fixed charge coverage ratio, which measures our ability tocover financing expenses. As of October 2, 2011 and October 3, 2010, we were in compliance with each of thesecovenants.
Under Starbucks commercial paper program we may issue unsecured commercial paper notes, up to a maximumaggregate amount outstanding at any time of $500 million, with individual maturities that may vary, but not exceed397 days from the date of issue. The program is backstopped by the 2010 credit facility, and the combinedborrowing limit is $500 million for the commercial paper program and the credit facility. Starbucks may issuecommercial paper from time to time, and the proceeds of the commercial paper financing will be used for workingcapital needs, capital expenditures and other corporate purposes, including acquisitions and share repurchases. The2005 credit facility was also paired with a commercial paper program whereby we could issue unsecuredcommercial paper notes, up to a maximum amount outstanding at any time of $1 billion. The commercial paperprogram was secured by the 2005 credit facility, and the combined borrowing limit was $1 billion for thecommercial paper program and the credit facility. During fiscal 2011 and fiscal 2010, there were no borrowingsunder the credit facilities or commercial paper programs. As of October 2, 2011 and October 3, 2010, a total of $17million and $15 million in letters of credit were outstanding under the respective revolving credit facility.
The $550 million of 10-year 6.25% Senior Notes also require us to maintain compliance with certain covenants,including limits on future liens and sale and leaseback transactions on certain material properties. As of October 2,2011 and October 3, 2010, we were in compliance with each of these covenants.
Use of Cash
We expect to use our cash and short-term investments, including any potential future borrowings under the creditfacility and commercial paper program, to invest in our core businesses, including new product innovations andrelated marketing support, as well as other new business opportunities related to our core businesses. We believethat future cash flows generated from operations and existing cash and short-term investments both domestically andinternationally will be sufficient to finance capital requirements for our core businesses in those respective marketsas well as shareholder distributions for the foreseeable future. However, in the event that we need to repatriate all ora portion of our international cash to the US we would be subject to additional US income taxes.
We may use our available cash resources to make proportionate capital contributions to our equity method and costmethod investees. We may also seek strategic acquisitions to leverage existing capabilities and further build ourbusiness in support of our growth agenda. Acquisitions may include increasing our ownership interests in our equitymethod and cost method investees. Any decisions to increase such ownership interests will be driven by valuationand fit with our ownership strategy. Significant new joint ventures, acquisitions and/or other new businessopportunities may require additional outside funding.
Other than normal operating expenses, cash requirements for fiscal 2012 are expected to consist primarily of capitalexpenditures for remodeling and refurbishment of, and equipment upgrades for, existing company-operated stores;systems and technology investments in the stores and in the support infrastructure; new company-operated stores;and additional investments in manufacturing capacity. Total capital expenditures for fiscal 2012 are expected to bein the range of approximately $800 million to $900 million.
During the second quarter of fiscal 2010, we declared our first ever cash dividend to shareholders of $0.10 per share.During the third quarter of fiscal 2010 and each subsequent quarter through the third quarter of fiscal 2011, wedeclared and paid a cash dividend to shareholders of $0.13 per share totaling $390 million and $171 million paid infiscal 2011 and 2010, respectively. In the fourth quarter, we declared a cash dividend of $0.17 per share to be paidon December 2, 2011 with an expected payout of $127 million.
During fiscal years 2011 and 2010, we repurchased 16 million and 11 million shares of common stock ($556 millionand $286 million, respectively) under share repurchase authorizations. The number of remaining shares authorizedfor repurchase at October 2, 2011 totaled 24 million.
35
Cash Flows
Cash provided by operating activities was $1.6 billion for fiscal year 2011, compared to $1.7 billion for fiscal year2010. The slight decrease was primarily attributable to an increase in inventories, resulting in part from higher coffeeprices, partially offset by higher net earnings for the period and an increase in payables, primarily related to greencoffee purchases.
Cash used by investing activities for fiscal year 2011 totaled $1.0 billion, compared to $790 million for fiscal year2010. The increase was primarily due to increased purchases of available-for-sale securities and increased capitalexpenditures for remodeling and renovating existing company-operated stores, opening new retail stores andinvestments in information technology systems. The increase was partially offset by increased maturities and calls ofavailable-for-sale securities and cash proceeds from the sale of corporate real estate during the year.
Cash used by financing activities for fiscal year 2011 totaled $608 million, compared to $346 million for fiscal year2010. The increase was primarily due to an increase in cash returned to shareholders through dividend payments andcommon share repurchases in fiscal 2011. The increase was partially offset by increased proceeds from the exerciseof stock options and the related excess tax benefits, resulting from more stock option exercises during the period.
The following table summarizes our contractual obligations and borrowings as of October 2, 2011, and the timingand effect that such commitments are expected to have on our liquidity and capital requirements in future periods (inmillions):
Payments Due by Period
Less than 1 1 - 3 3 - 5 More thanContractual Obligations(1) Total Year Years Years 5 Years
Operating lease obligations(2) . . . . . . . . . . . . . . . . . . $4,057.9 $ 751.2 $1,330.6 $ 988.1 $ 988.0Purchase obligations(3) . . . . . . . . . . . . . . . . . . . . . . . . 1,099.5 1,018.9 74.6 6.0 0.0Debt obligations(4) . . . . . . . . . . . . . . . . . . . . . . . . . . . 756.3 34.4 68.8 68.8 584.3Other obligations(5) . . . . . . . . . . . . . . . . . . . . . . . . . . 125.1 22.3 19.7 11.4 71.7
Total . . . . . . . . . . . . . . . . . . . . . . . . . . . . . . . . . . . . . $6,038.8 $1,826.8 $1,493.7 $1,074.3 $1,644.0
(1) Income tax liabilities for uncertain tax positions were excluded as we are not able to make a reasonably reliableestimate of the amount and period of related future payments. As of October 2, 2011, we had $52.9 million ofgross unrecognized tax benefits for uncertain tax positions.
(2) Amounts include the direct lease obligations, excluding any taxes, insurance and other related expenses.(3) Purchase obligations include agreements to purchase goods or services that are enforceable and legally binding
on Starbucks and that specify all significant terms. Green coffee purchase commitments comprise 94% of totalpurchase obligations.
(4) Debt amounts include principal maturities and scheduled interest payments on our long-term debt.(5) Other obligations include other long-term liabilities primarily consisting of asset retirement obligations, capital
lease obligations and hedging instruments.
Starbucks currently expects to fund these commitments with operating cash flows generated in the normal course ofbusiness.
Off-Balance Sheet Arrangement
Off-balance sheet arrangements relate to certain guarantees and are detailed in Note 15 to the consolidated financialstatements in this 10-K.
36
COMMODITY PRICES, AVAILABILITY ANDGENERAL RISK CONDITIONS
Commodity price risk represents Starbucks primary market risk, generated by our purchases of green coffee anddairy products, among other things. We purchase, roast and sell high-quality whole bean arabica coffee and relatedproducts and risk arises from the price volatility of green coffee. In addition to coffee, we also purchase significantamounts of dairy products to support the needs of our company-operated stores. The price and availability of thesecommodities directly impacts our results of operations and can be expected to impact our future results ofoperations. For additional details see Product Supply in Item 1, as well as Risk Factors in Item 1A of this 10-K.
FINANCIAL RISKMANAGEMENT
Market risk is defined as the risk of losses due to changes in commodity prices, foreign currency exchange rates,equity security prices, and interest rates. We manage our exposure to various market-based risks according to anumbrella risk management policy. Under this policy, market-based risks are quantified and evaluated for potentialmitigation strategies, such as entering into hedging transactions. The umbrella risk management policy governs thehedging instruments the business may use and limits the risk to net earnings. We also monitor and limit the amountof associated counterparty credit risk. Additionally, this policy restricts, among other things, the amount of market-based risk we will tolerate before implementing approved hedging strategies and prohibits speculative tradingactivity. In general, hedging instruments do not have maturities in excess of five years.
The sensitivity analyses disclosed below provide only a limited, point-in-time view of the market risk of thefinancial instruments discussed. The actual impact of the respective underlying rates and price changes on thefinancial instruments may differ significantly from those shown in the sensitivity analyses.
Commodity Price Risk
We purchase commodity inputs, including coffee, dairy products and diesel that are used in our operations and aresubject to price fluctuations that impact our financial results. In addition to fixed-price and price-to-be-fixedcontracts for coffee purchases, we have entered into commodity hedges to manage commodity price risk usingfinancial derivative instruments. We performed a sensitivity analysis based on a 10% change in the underlyingcommodity prices of our commodity hedges, as of October 2, 2011, and determined that such a change would nothave a significant impact on the fair value of these instruments.
Foreign Currency Exchange Risk
The majority of our revenue, expense and capital purchasing activities are transacted in US dollars. However,because a portion of our operations consists of activities outside of the US, we have transactions in other currencies,primarily the Canadian dollar, British pound, euro, and Japanese yen. As a result, we may engage in transactionsinvolving various derivative instruments to hedge revenues, inventory purchases, assets, and liabilities denominatedin foreign currencies.
As of October 2, 2011, we had forward foreign exchange contracts that hedge portions of anticipated internationalrevenue streams and inventory purchases. In addition, we had forward foreign exchange contracts that qualify asaccounting hedges of our net investment in Starbucks Japan to minimize foreign currency exposure.
Starbucks also had forward foreign exchange contracts that are not designated as hedging instruments for accountingpurposes (free standing derivatives), but which largely offset the financial impact of translating certain foreigncurrency denominated payables and receivables. Increases or decreases in the fair value of these derivatives aregenerally offset by corresponding decreases or increases in the US dollar value of our foreign currency denominatedpayables and receivables (i.e. “hedged items”) that would occur within the period.
37
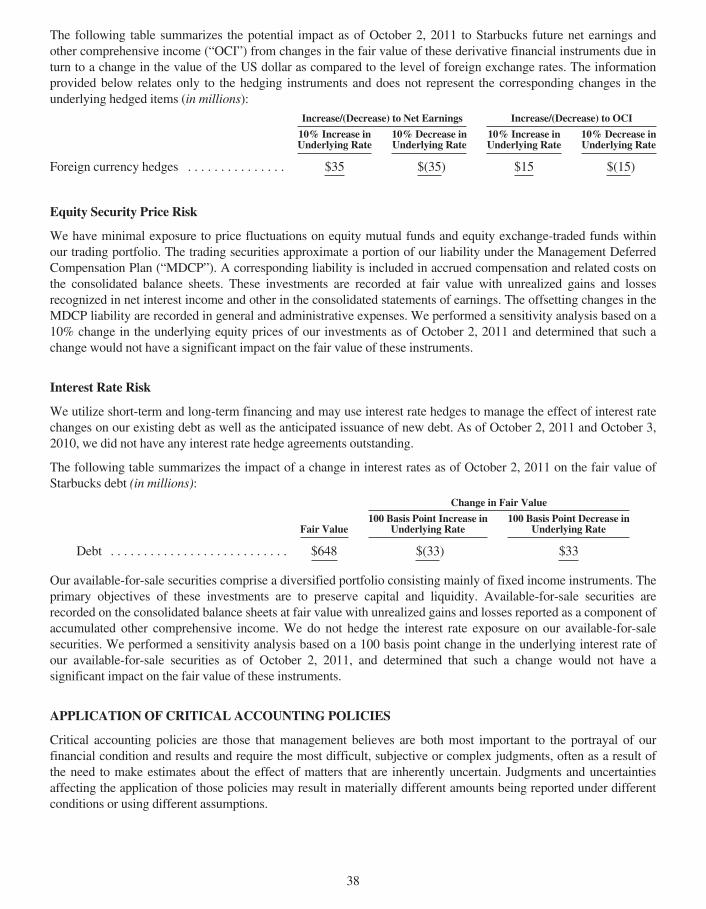
The following table summarizes the potential impact as of October 2, 2011 to Starbucks future net earnings andother comprehensive income (“OCI”) from changes in the fair value of these derivative financial instruments due inturn to a change in the value of the US dollar as compared to the level of foreign exchange rates. The informationprovided below relates only to the hedging instruments and does not represent the corresponding changes in theunderlying hedged items (in millions):
Increase/(Decrease) to Net Earnings Increase/(Decrease) to OCI
10% Increase inUnderlying Rate
10% Decrease inUnderlying Rate
10% Increase inUnderlying Rate
10% Decrease inUnderlying Rate
Foreign currency hedges . . . . . . . . . . . . . . . $35 $(35) $15 $(15)
Equity Security Price Risk
We have minimal exposure to price fluctuations on equity mutual funds and equity exchange-traded funds withinour trading portfolio. The trading securities approximate a portion of our liability under the Management DeferredCompensation Plan (“MDCP”). A corresponding liability is included in accrued compensation and related costs onthe consolidated balance sheets. These investments are recorded at fair value with unrealized gains and lossesrecognized in net interest income and other in the consolidated statements of earnings. The offsetting changes in theMDCP liability are recorded in general and administrative expenses. We performed a sensitivity analysis based on a10% change in the underlying equity prices of our investments as of October 2, 2011 and determined that such achange would not have a significant impact on the fair value of these instruments.
Interest Rate Risk
We utilize short-term and long-term financing and may use interest rate hedges to manage the effect of interest ratechanges on our existing debt as well as the anticipated issuance of new debt. As of October 2, 2011 and October 3,2010, we did not have any interest rate hedge agreements outstanding.
The following table summarizes the impact of a change in interest rates as of October 2, 2011 on the fair value ofStarbucks debt (in millions):
Change in Fair Value
Fair Value100 Basis Point Increase in
Underlying Rate100 Basis Point Decrease in
Underlying Rate
Debt . . . . . . . . . . . . . . . . . . . . . . . . . . . $648 $(33) $33
Our available-for-sale securities comprise a diversified portfolio consisting mainly of fixed income instruments. Theprimary objectives of these investments are to preserve capital and liquidity. Available-for-sale securities arerecorded on the consolidated balance sheets at fair value with unrealized gains and losses reported as a component ofaccumulated other comprehensive income. We do not hedge the interest rate exposure on our available-for-salesecurities. We performed a sensitivity analysis based on a 100 basis point change in the underlying interest rate ofour available-for-sale securities as of October 2, 2011, and determined that such a change would not have asignificant impact on the fair value of these instruments.
APPLICATIONOF CRITICAL ACCOUNTING POLICIES
Critical accounting policies are those that management believes are both most important to the portrayal of ourfinancial condition and results and require the most difficult, subjective or complex judgments, often as a result ofthe need to make estimates about the effect of matters that are inherently uncertain. Judgments and uncertaintiesaffecting the application of those policies may result in materially different amounts being reported under differentconditions or using different assumptions.
38
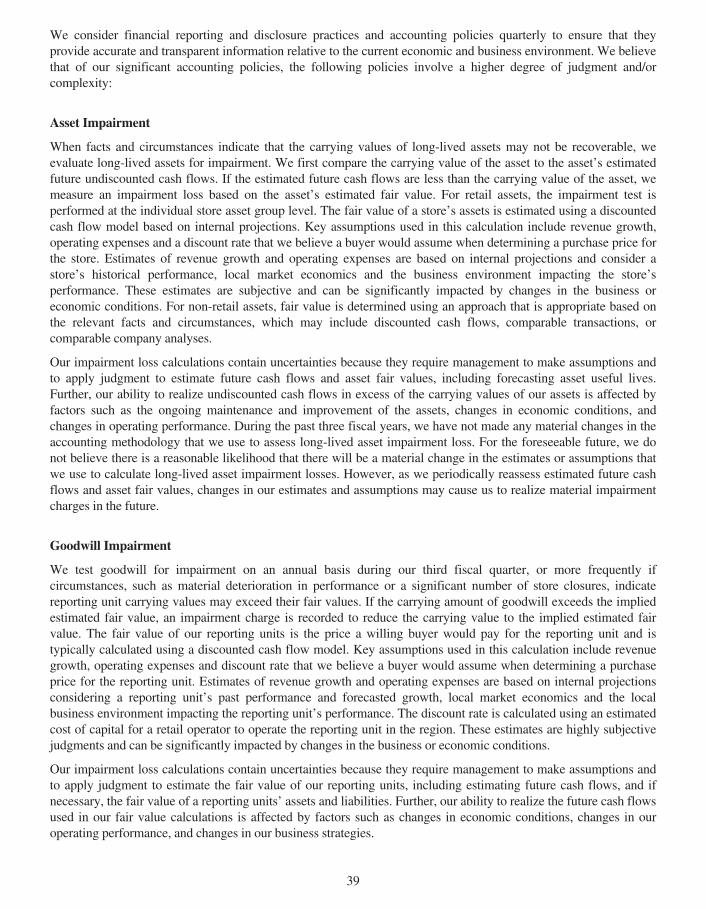
We consider financial reporting and disclosure practices and accounting policies quarterly to ensure that theyprovide accurate and transparent information relative to the current economic and business environment. We believethat of our significant accounting policies, the following policies involve a higher degree of judgment and/orcomplexity:
Asset Impairment
When facts and circumstances indicate that the carrying values of long-lived assets may not be recoverable, weevaluate long-lived assets for impairment. We first compare the carrying value of the asset to the asset’s estimatedfuture undiscounted cash flows. If the estimated future cash flows are less than the carrying value of the asset, wemeasure an impairment loss based on the asset’s estimated fair value. For retail assets, the impairment test isperformed at the individual store asset group level. The fair value of a store’s assets is estimated using a discountedcash flow model based on internal projections. Key assumptions used in this calculation include revenue growth,operating expenses and a discount rate that we believe a buyer would assume when determining a purchase price forthe store. Estimates of revenue growth and operating expenses are based on internal projections and consider astore’s historical performance, local market economics and the business environment impacting the store’sperformance. These estimates are subjective and can be significantly impacted by changes in the business oreconomic conditions. For non-retail assets, fair value is determined using an approach that is appropriate based onthe relevant facts and circumstances, which may include discounted cash flows, comparable transactions, orcomparable company analyses.
Our impairment loss calculations contain uncertainties because they require management to make assumptions andto apply judgment to estimate future cash flows and asset fair values, including forecasting asset useful lives.Further, our ability to realize undiscounted cash flows in excess of the carrying values of our assets is affected byfactors such as the ongoing maintenance and improvement of the assets, changes in economic conditions, andchanges in operating performance. During the past three fiscal years, we have not made any material changes in theaccounting methodology that we use to assess long-lived asset impairment loss. For the foreseeable future, we donot believe there is a reasonable likelihood that there will be a material change in the estimates or assumptions thatwe use to calculate long-lived asset impairment losses. However, as we periodically reassess estimated future cashflows and asset fair values, changes in our estimates and assumptions may cause us to realize material impairmentcharges in the future.
Goodwill Impairment
We test goodwill for impairment on an annual basis during our third fiscal quarter, or more frequently ifcircumstances, such as material deterioration in performance or a significant number of store closures, indicatereporting unit carrying values may exceed their fair values. If the carrying amount of goodwill exceeds the impliedestimated fair value, an impairment charge is recorded to reduce the carrying value to the implied estimated fairvalue. The fair value of our reporting units is the price a willing buyer would pay for the reporting unit and istypically calculated using a discounted cash flow model. Key assumptions used in this calculation include revenuegrowth, operating expenses and discount rate that we believe a buyer would assume when determining a purchaseprice for the reporting unit. Estimates of revenue growth and operating expenses are based on internal projectionsconsidering a reporting unit’s past performance and forecasted growth, local market economics and the localbusiness environment impacting the reporting unit’s performance. The discount rate is calculated using an estimatedcost of capital for a retail operator to operate the reporting unit in the region. These estimates are highly subjectivejudgments and can be significantly impacted by changes in the business or economic conditions.
Our impairment loss calculations contain uncertainties because they require management to make assumptions andto apply judgment to estimate the fair value of our reporting units, including estimating future cash flows, and ifnecessary, the fair value of a reporting units’ assets and liabilities. Further, our ability to realize the future cash flowsused in our fair value calculations is affected by factors such as changes in economic conditions, changes in ouroperating performance, and changes in our business strategies.
39
As a part of our ongoing operations, we may close certain stores within a reporting unit containing goodwill due tounderperformance of the store or inability to renew our lease, among other reasons. We abandon certain assetsassociated with a closed store including leasehold improvements and other non-transferrable assets. Under GAAP,when a portion of a reporting unit that constitutes a business is to be disposed of, goodwill associated with thebusiness is included in the carrying amount of the business in determining any loss on disposal. Our evaluation ofwhether the portion of a reporting unit being disposed of constitutes a business occurs on the date of abandonment.Although an operating store meets the accounting definition of a business prior to abandonment, it does notconstitute a business on the closure date because the remaining assets on that date do not constitute an integrated setof assets that are capable of being conducted and managed for the purpose of providing a return to investors. As aresult, when closing individual stores, we do not include goodwill in the calculation of any loss on disposal of therelated assets. As noted above, if store closures are indicative of potential impairment of goodwill at the reportingunit level, we perform an evaluation of our reporting unit goodwill when such closures occur.
During the past three fiscal years, we have not made any material changes in the accounting methodology that weuse to assess goodwill impairment loss. For fiscal 2011, we determined the fair value of our reporting units wassubstantially in excess of their carrying values. Accordingly, we did not recognize any goodwill impairments duringthe current fiscal year. We do not believe there is a reasonable likelihood that there will be a material change in theestimates or assumptions that we use to test for impairment losses on goodwill in the foreseeable future. However, aswe periodically reassess our fair value calculations, including estimated future cash flows, changes in our estimatesand assumptions may cause us to realize material impairment charges in the future.
Stock-based Compensation
We measure the fair value of stock awards at the grant date based on the fair value of the award and recognize theexpense over the related service period. For stock option awards we use the Black-Scholes-Merton option pricingmodel which requires the input of subjective assumptions. These assumptions include estimating the length of timeemployees will retain their stock options before exercising them (“expected term”), the estimated volatility of ourcommon stock price over the expected term and the expected dividend yield. In addition, we are required to estimatethe expected forfeiture rate and only recognize expense for those stock awards expected to vest. We estimate theforfeiture rate based on historical experience. Changes in our assumptions could materially affect the estimate of fairvalue of stock-based compensation.
We do not believe there is a reasonable likelihood that there will be a material change in the estimates orassumptions that we use to calculate stock-based compensation expense for the foreseeable future. However, ifactual results are not consistent with our estimates or assumptions, we may be exposed to changes in stock-basedcompensation expense that could be material in the future. For fiscal 2011, a 10% change in our criticalassumptions, including volatility and expected term, would have changed stock-based compensation expense byapproximately $15 million for fiscal 2011.
Operating Leases
We lease retail stores, roasting and distribution facilities and office space under operating leases. We provide for anestimate of our asset retirement obligation (“ARO”) at the lease inception date for operating leases withrequirements to remove leasehold improvements at the end of the lease term. Our estimates of AROs involveassumptions regarding both the amount and timing of actual future retirement costs. The initial ARO asset andliability represent the present value of the estimated future costs to complete the required work. The ARO asset isdepreciated over the same timeframe as the associate leasehold improvements, and the liability is accreted over time.Future actual costs could differ significantly from amounts initially estimated.
We occasionally vacate stores and other locations prior to the expiration of the related lease. For vacated locationswith remaining lease commitments, we record an expense for the difference between the present value of our futurelease payments and related costs (e.g., real estate taxes and common area maintenance) from the date of closurethrough the end of the remaining lease term, net of expected future sublease rental income. Key assumptions in our
40
estimate of future cash flows include estimated sublease income and lease termination costs. These estimates arebased on historical experience; our analysis of the specific real estate market, including input from independent realestate firms; and economic conditions that can be difficult to predict. Cash flows are discounted using a rate thatcoincides with the remaining lease term.
The liability recorded for location closures contains uncertainties because management is required to makeassumptions and to apply judgment to estimate the duration of future vacancy periods, the amount and timing offuture settlement payments, and the amount and timing of potential sublease rental income.
During the past three fiscal years, we have not made any material changes in the accounting methodology that weuse to calculate our lease abandonment accrual. For the foreseeable future, we do not believe there is a reasonablelikelihood that there will be a material change in the estimates or assumptions that we use to calculate our leaseabandonment accrual. However, if actual results are not consistent with our estimates or assumptions, we may beexposed to losses or gains that could be material.
A 10% change in our key assumptions for our lease abandonment accrual at October 2, 2011, would not have had asignificant impact on net earnings for fiscal 2011.
Self Insurance Reserves
We use a combination of insurance and self-insurance mechanisms, including a wholly owned captive insuranceentity and participation in a reinsurance treaty, to provide for the potential liabilities for certain risks, includingworkers’ compensation, healthcare benefits, general liability, property insurance, and director and officers’ liabilityinsurance. Key assumptions used in the estimate of our self insurance reserves include the amount of claims incurredbut not reported at the balance sheet date. These liabilities, which are associated with the risks that are retained byStarbucks are not discounted and are estimated, in part, by considering historical claims experience, demographic,exposure and severity factors, and other actuarial assumptions. The estimated accruals for these liabilities could besignificantly affected if future occurrences and claims differ from these assumptions and historical trends.
Our self-insured liabilities contain uncertainties because management is required to make assumptions and to applyjudgment to estimate the ultimate cost to settle reported claims and claims incurred but not reported at the balancesheet date. Periodically, we review our assumptions to determine the adequacy of our self-insured liabilities.
During the past three fiscal years, we have not made any material changes in the accounting methodology that weuse to calculate our self-insurance liabilities. We do not believe there is a reasonable likelihood that there will be amaterial change in the estimates or assumptions that we use to calculate our self-insurance liabilities for theforeseeable future. However, if actual results are not consistent with our estimates or assumptions, we may beexposed to losses or gains that could be material.
A 10% change in our self-insurance reserves at October 2, 2011 would have affected net earnings by approximately$13 million in fiscal 2011.
Income Taxes
We recognize deferred tax assets and liabilities based on the differences between the financial statement carryingamounts and the respective tax bases of our assets and liabilities. Deferred tax assets and liabilities are measuredusing current enacted tax rates expected to apply to taxable income in the years in which we expect the temporarydifferences to reverse. We routinely evaluate the likelihood of realizing the benefit of our deferred tax assets andmay record a valuation allowance if, based on all available evidence, we determine that some portion of the taxbenefit will not be realized.
In addition, our income tax returns are periodically audited by domestic and foreign tax authorities. These auditsinclude questions regarding our tax filing positions, including the timing and amount of deductions taken and theallocation of income among various tax jurisdictions. We evaluate our exposures associated with our various taxfiling positions and record a related liability. We adjust our liability for unrecognized tax benefits and income taxprovision in the period in which an uncertain tax position is effectively settled, the statute of limitations expires forthe relevant taxing authority to examine the tax position, or when more information becomes available.
41
Deferred tax asset valuation allowances and our liability for unrecognized tax benefits require significantmanagement judgment regarding applicable statutes and their related interpretation, the status of various income taxaudits, and our particular facts and circumstances. Although we believe that the judgments and estimates discussedherein are reasonable, actual results could differ, and we may be exposed to losses or gains that could be material.To the extent we prevail in matters for which a liability has been established, or are required to pay amounts inexcess of our established liability, our effective income tax rate in a given financial statement period could bematerially affected.
Litigation Accruals
We are involved in various claims and legal actions that arise in the ordinary course of business. Legal and othercontingency reserves and related disclosures are based on our assessment of the likelihood of a potential loss and ourability to estimate the loss or range of loss, which includes consultation with outside legal counsel and advisors. Werecord reserves related to legal matters when it is probable that a loss has been incurred and the range of such losscan be reasonably estimated. Such assessments are reviewed each period and revised, based on current facts andcircumstances and historical experience with similar claims, as necessary.
Our disclosures of and accruals for litigation claims, if any, contain uncertainties because management is required touse judgment to estimate the probability of a loss and a range of possible losses related to each claim. Footnote 15 tothe consolidated financial statements describes the Company’s legal and other contingent liability matters.
As we periodically review our assessments of litigation accruals, we may change our assumptions with respect toloss probabilities and ranges of potential losses. Any changes in these assumptions could have a material impact onour future results of operations.
RECENT ACCOUNTING PRONOUNCEMENTS
See Note 1 to the consolidated financial statements in this 10-K for a detailed description of recent accountingpronouncements. We do not expect these recently issued accounting pronouncements to have a material impact onour results of operations, financial condition, or liquidity in future periods.
Item 7A. Quantitative and Qualitative Disclosures About Market Risk
The information required by this item is incorporated by reference to the section entitled “Management’s Discussionand Analysis of Financial Condition and Results of Operations — Commodity Prices, Availability and General RiskConditions” and “Management’s Discussion and Analysis of Financial Condition and Results of Operations —Financial Risk Management” in Item 7 of this Report.
42
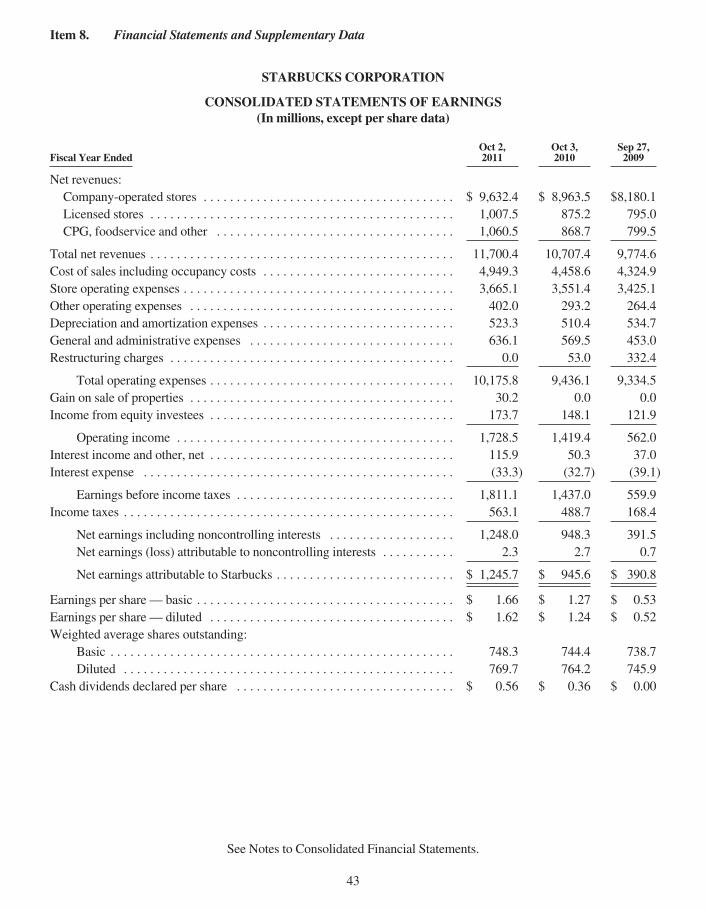
Item 8. Financial Statements and Supplementary Data
STARBUCKS CORPORATION
CONSOLIDATED STATEMENTS OF EARNINGS(In millions, except per share data)
Fiscal Year EndedOct 2,2011
Oct 3,2010
Sep 27,2009
Net revenues:Company-operated stores . . . . . . . . . . . . . . . . . . . . . . . . . . . . . . . . . . . . . . $ 9,632.4 $ 8,963.5 $8,180.1Licensed stores . . . . . . . . . . . . . . . . . . . . . . . . . . . . . . . . . . . . . . . . . . . . . . 1,007.5 875.2 795.0CPG, foodservice and other . . . . . . . . . . . . . . . . . . . . . . . . . . . . . . . . . . . . 1,060.5 868.7 799.5
Total net revenues . . . . . . . . . . . . . . . . . . . . . . . . . . . . . . . . . . . . . . . . . . . . . . 11,700.4 10,707.4 9,774.6Cost of sales including occupancy costs . . . . . . . . . . . . . . . . . . . . . . . . . . . . . 4,949.3 4,458.6 4,324.9Store operating expenses . . . . . . . . . . . . . . . . . . . . . . . . . . . . . . . . . . . . . . . . . 3,665.1 3,551.4 3,425.1Other operating expenses . . . . . . . . . . . . . . . . . . . . . . . . . . . . . . . . . . . . . . . . 402.0 293.2 264.4Depreciation and amortization expenses . . . . . . . . . . . . . . . . . . . . . . . . . . . . . 523.3 510.4 534.7General and administrative expenses . . . . . . . . . . . . . . . . . . . . . . . . . . . . . . . 636.1 569.5 453.0Restructuring charges . . . . . . . . . . . . . . . . . . . . . . . . . . . . . . . . . . . . . . . . . . . 0.0 53.0 332.4
Total operating expenses . . . . . . . . . . . . . . . . . . . . . . . . . . . . . . . . . . . . . 10,175.8 9,436.1 9,334.5Gain on sale of properties . . . . . . . . . . . . . . . . . . . . . . . . . . . . . . . . . . . . . . . . 30.2 0.0 0.0Income from equity investees . . . . . . . . . . . . . . . . . . . . . . . . . . . . . . . . . . . . . 173.7 148.1 121.9
Operating income . . . . . . . . . . . . . . . . . . . . . . . . . . . . . . . . . . . . . . . . . . 1,728.5 1,419.4 562.0Interest income and other, net . . . . . . . . . . . . . . . . . . . . . . . . . . . . . . . . . . . . . 115.9 50.3 37.0Interest expense . . . . . . . . . . . . . . . . . . . . . . . . . . . . . . . . . . . . . . . . . . . . . . . (33.3) (32.7) (39.1)
Earnings before income taxes . . . . . . . . . . . . . . . . . . . . . . . . . . . . . . . . . 1,811.1 1,437.0 559.9Income taxes . . . . . . . . . . . . . . . . . . . . . . . . . . . . . . . . . . . . . . . . . . . . . . . . . . 563.1 488.7 168.4
Net earnings including noncontrolling interests . . . . . . . . . . . . . . . . . . . 1,248.0 948.3 391.5Net earnings (loss) attributable to noncontrolling interests . . . . . . . . . . . 2.3 2.7 0.7
Net earnings attributable to Starbucks . . . . . . . . . . . . . . . . . . . . . . . . . . . $ 1,245.7 $ 945.6 $ 390.8
Earnings per share — basic . . . . . . . . . . . . . . . . . . . . . . . . . . . . . . . . . . . . . . . $ 1.66 $ 1.27 $ 0.53Earnings per share — diluted . . . . . . . . . . . . . . . . . . . . . . . . . . . . . . . . . . . . . $ 1.62 $ 1.24 $ 0.52Weighted average shares outstanding:
Basic . . . . . . . . . . . . . . . . . . . . . . . . . . . . . . . . . . . . . . . . . . . . . . . . . . . . 748.3 744.4 738.7Diluted . . . . . . . . . . . . . . . . . . . . . . . . . . . . . . . . . . . . . . . . . . . . . . . . . . 769.7 764.2 745.9
Cash dividends declared per share . . . . . . . . . . . . . . . . . . . . . . . . . . . . . . . . . $ 0.56 $ 0.36 $ 0.00
See Notes to Consolidated Financial Statements.
43
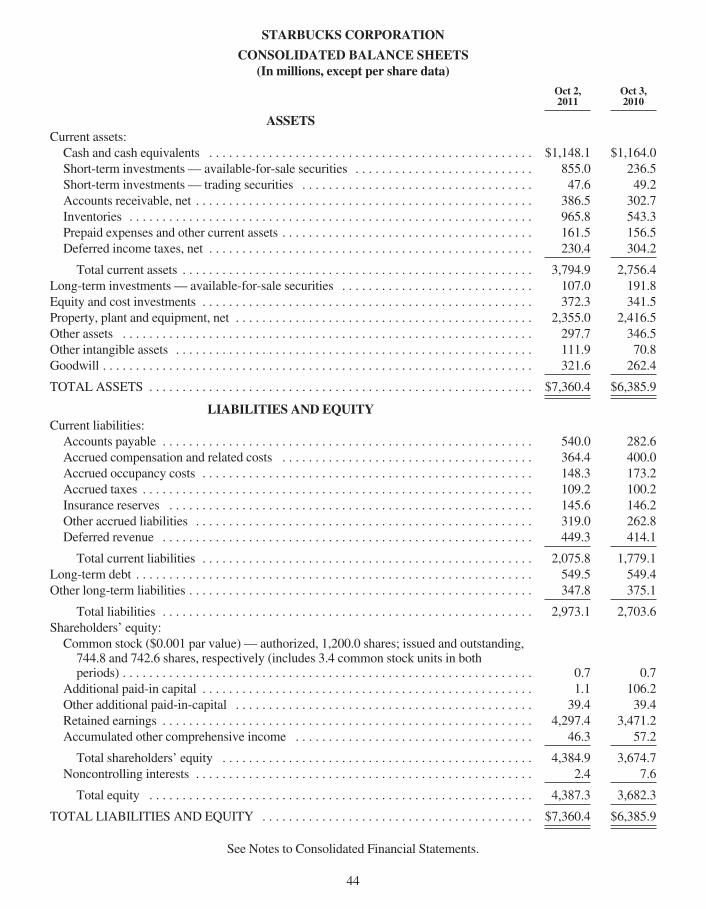
STARBUCKS CORPORATION
CONSOLIDATED BALANCE SHEETS(In millions, except per share data)
Oct 2,2011
Oct 3,2010
ASSETSCurrent assets:Cash and cash equivalents . . . . . . . . . . . . . . . . . . . . . . . . . . . . . . . . . . . . . . . . . . . . . . . . . $1,148.1 $1,164.0Short-term investments — available-for-sale securities . . . . . . . . . . . . . . . . . . . . . . . . . . . 855.0 236.5Short-term investments — trading securities . . . . . . . . . . . . . . . . . . . . . . . . . . . . . . . . . . . 47.6 49.2Accounts receivable, net . . . . . . . . . . . . . . . . . . . . . . . . . . . . . . . . . . . . . . . . . . . . . . . . . . . 386.5 302.7Inventories . . . . . . . . . . . . . . . . . . . . . . . . . . . . . . . . . . . . . . . . . . . . . . . . . . . . . . . . . . . . . 965.8 543.3Prepaid expenses and other current assets . . . . . . . . . . . . . . . . . . . . . . . . . . . . . . . . . . . . . . 161.5 156.5Deferred income taxes, net . . . . . . . . . . . . . . . . . . . . . . . . . . . . . . . . . . . . . . . . . . . . . . . . . 230.4 304.2
Total current assets . . . . . . . . . . . . . . . . . . . . . . . . . . . . . . . . . . . . . . . . . . . . . . . . . . . . . 3,794.9 2,756.4Long-term investments — available-for-sale securities . . . . . . . . . . . . . . . . . . . . . . . . . . . . . 107.0 191.8Equity and cost investments . . . . . . . . . . . . . . . . . . . . . . . . . . . . . . . . . . . . . . . . . . . . . . . . . . 372.3 341.5Property, plant and equipment, net . . . . . . . . . . . . . . . . . . . . . . . . . . . . . . . . . . . . . . . . . . . . . 2,355.0 2,416.5Other assets . . . . . . . . . . . . . . . . . . . . . . . . . . . . . . . . . . . . . . . . . . . . . . . . . . . . . . . . . . . . . . 297.7 346.5Other intangible assets . . . . . . . . . . . . . . . . . . . . . . . . . . . . . . . . . . . . . . . . . . . . . . . . . . . . . . 111.9 70.8Goodwill . . . . . . . . . . . . . . . . . . . . . . . . . . . . . . . . . . . . . . . . . . . . . . . . . . . . . . . . . . . . . . . . . 321.6 262.4
TOTAL ASSETS . . . . . . . . . . . . . . . . . . . . . . . . . . . . . . . . . . . . . . . . . . . . . . . . . . . . . . . . . . $7,360.4 $6,385.9
LIABILITIES AND EQUITYCurrent liabilities:Accounts payable . . . . . . . . . . . . . . . . . . . . . . . . . . . . . . . . . . . . . . . . . . . . . . . . . . . . . . . . 540.0 282.6Accrued compensation and related costs . . . . . . . . . . . . . . . . . . . . . . . . . . . . . . . . . . . . . . 364.4 400.0Accrued occupancy costs . . . . . . . . . . . . . . . . . . . . . . . . . . . . . . . . . . . . . . . . . . . . . . . . . . 148.3 173.2Accrued taxes . . . . . . . . . . . . . . . . . . . . . . . . . . . . . . . . . . . . . . . . . . . . . . . . . . . . . . . . . . . 109.2 100.2Insurance reserves . . . . . . . . . . . . . . . . . . . . . . . . . . . . . . . . . . . . . . . . . . . . . . . . . . . . . . . 145.6 146.2Other accrued liabilities . . . . . . . . . . . . . . . . . . . . . . . . . . . . . . . . . . . . . . . . . . . . . . . . . . . 319.0 262.8Deferred revenue . . . . . . . . . . . . . . . . . . . . . . . . . . . . . . . . . . . . . . . . . . . . . . . . . . . . . . . . 449.3 414.1
Total current liabilities . . . . . . . . . . . . . . . . . . . . . . . . . . . . . . . . . . . . . . . . . . . . . . . . . . 2,075.8 1,779.1Long-term debt . . . . . . . . . . . . . . . . . . . . . . . . . . . . . . . . . . . . . . . . . . . . . . . . . . . . . . . . . . . . 549.5 549.4Other long-term liabilities . . . . . . . . . . . . . . . . . . . . . . . . . . . . . . . . . . . . . . . . . . . . . . . . . . . . 347.8 375.1
Total liabilities . . . . . . . . . . . . . . . . . . . . . . . . . . . . . . . . . . . . . . . . . . . . . . . . . . . . . . . . 2,973.1 2,703.6Shareholders’ equity:Common stock ($0.001 par value) — authorized, 1,200.0 shares; issued and outstanding,744.8 and 742.6 shares, respectively (includes 3.4 common stock units in bothperiods) . . . . . . . . . . . . . . . . . . . . . . . . . . . . . . . . . . . . . . . . . . . . . . . . . . . . . . . . . . . . . . 0.7 0.7
Additional paid-in capital . . . . . . . . . . . . . . . . . . . . . . . . . . . . . . . . . . . . . . . . . . . . . . . . . . 1.1 106.2Other additional paid-in-capital . . . . . . . . . . . . . . . . . . . . . . . . . . . . . . . . . . . . . . . . . . . . . 39.4 39.4Retained earnings . . . . . . . . . . . . . . . . . . . . . . . . . . . . . . . . . . . . . . . . . . . . . . . . . . . . . . . . 4,297.4 3,471.2Accumulated other comprehensive income . . . . . . . . . . . . . . . . . . . . . . . . . . . . . . . . . . . . 46.3 57.2
Total shareholders’ equity . . . . . . . . . . . . . . . . . . . . . . . . . . . . . . . . . . . . . . . . . . . . . . . 4,384.9 3,674.7Noncontrolling interests . . . . . . . . . . . . . . . . . . . . . . . . . . . . . . . . . . . . . . . . . . . . . . . . . . . 2.4 7.6
Total equity . . . . . . . . . . . . . . . . . . . . . . . . . . . . . . . . . . . . . . . . . . . . . . . . . . . . . . . . . . 4,387.3 3,682.3
TOTAL LIABILITIES AND EQUITY . . . . . . . . . . . . . . . . . . . . . . . . . . . . . . . . . . . . . . . . . $7,360.4 $6,385.9
See Notes to Consolidated Financial Statements.
44
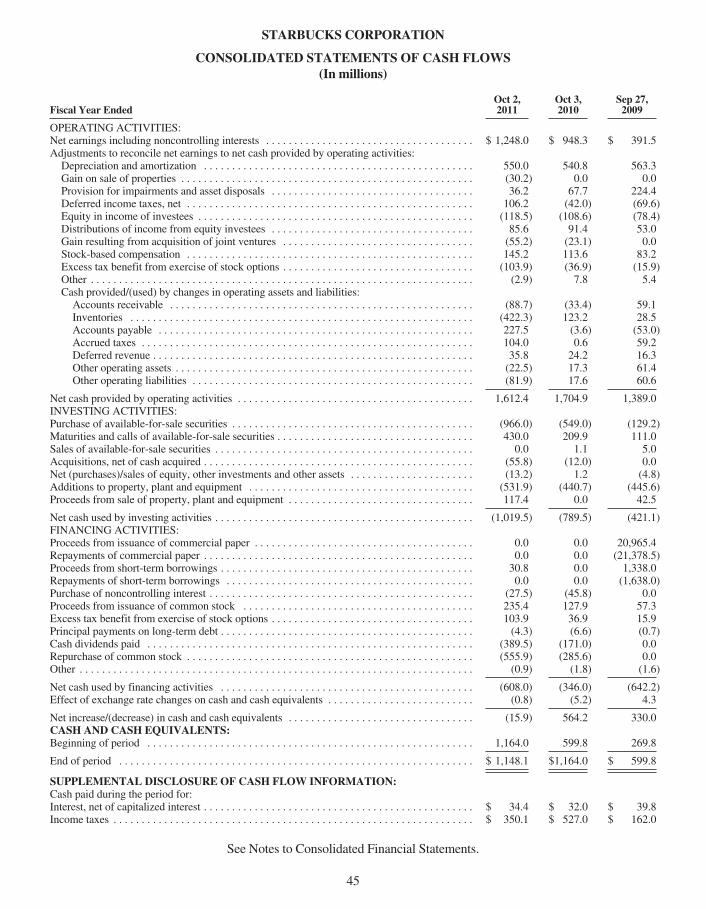
STARBUCKS CORPORATION
CONSOLIDATED STATEMENTS OF CASH FLOWS(In millions)
Fiscal Year EndedOct 2,2011
Oct 3,2010
Sep 27,2009
OPERATING ACTIVITIES:Net earnings including noncontrolling interests . . . . . . . . . . . . . . . . . . . . . . . . . . . . . . . . . . . . . $ 1,248.0 $ 948.3 $ 391.5Adjustments to reconcile net earnings to net cash provided by operating activities:Depreciation and amortization . . . . . . . . . . . . . . . . . . . . . . . . . . . . . . . . . . . . . . . . . . . . . . . . 550.0 540.8 563.3Gain on sale of properties . . . . . . . . . . . . . . . . . . . . . . . . . . . . . . . . . . . . . . . . . . . . . . . . . . . . (30.2) 0.0 0.0Provision for impairments and asset disposals . . . . . . . . . . . . . . . . . . . . . . . . . . . . . . . . . . . . 36.2 67.7 224.4Deferred income taxes, net . . . . . . . . . . . . . . . . . . . . . . . . . . . . . . . . . . . . . . . . . . . . . . . . . . . 106.2 (42.0) (69.6)Equity in income of investees . . . . . . . . . . . . . . . . . . . . . . . . . . . . . . . . . . . . . . . . . . . . . . . . . (118.5) (108.6) (78.4)Distributions of income from equity investees . . . . . . . . . . . . . . . . . . . . . . . . . . . . . . . . . . . . 85.6 91.4 53.0Gain resulting from acquisition of joint ventures . . . . . . . . . . . . . . . . . . . . . . . . . . . . . . . . . . (55.2) (23.1) 0.0Stock-based compensation . . . . . . . . . . . . . . . . . . . . . . . . . . . . . . . . . . . . . . . . . . . . . . . . . . . 145.2 113.6 83.2Excess tax benefit from exercise of stock options . . . . . . . . . . . . . . . . . . . . . . . . . . . . . . . . . . (103.9) (36.9) (15.9)Other . . . . . . . . . . . . . . . . . . . . . . . . . . . . . . . . . . . . . . . . . . . . . . . . . . . . . . . . . . . . . . . . . . . . (2.9) 7.8 5.4Cash provided/(used) by changes in operating assets and liabilities:Accounts receivable . . . . . . . . . . . . . . . . . . . . . . . . . . . . . . . . . . . . . . . . . . . . . . . . . . . . . . (88.7) (33.4) 59.1Inventories . . . . . . . . . . . . . . . . . . . . . . . . . . . . . . . . . . . . . . . . . . . . . . . . . . . . . . . . . . . . . (422.3) 123.2 28.5Accounts payable . . . . . . . . . . . . . . . . . . . . . . . . . . . . . . . . . . . . . . . . . . . . . . . . . . . . . . . . 227.5 (3.6) (53.0)Accrued taxes . . . . . . . . . . . . . . . . . . . . . . . . . . . . . . . . . . . . . . . . . . . . . . . . . . . . . . . . . . . 104.0 0.6 59.2Deferred revenue . . . . . . . . . . . . . . . . . . . . . . . . . . . . . . . . . . . . . . . . . . . . . . . . . . . . . . . . . 35.8 24.2 16.3Other operating assets . . . . . . . . . . . . . . . . . . . . . . . . . . . . . . . . . . . . . . . . . . . . . . . . . . . . . (22.5) 17.3 61.4Other operating liabilities . . . . . . . . . . . . . . . . . . . . . . . . . . . . . . . . . . . . . . . . . . . . . . . . . . (81.9) 17.6 60.6
Net cash provided by operating activities . . . . . . . . . . . . . . . . . . . . . . . . . . . . . . . . . . . . . . . . . . 1,612.4 1,704.9 1,389.0INVESTING ACTIVITIES:Purchase of available-for-sale securities . . . . . . . . . . . . . . . . . . . . . . . . . . . . . . . . . . . . . . . . . . . (966.0) (549.0) (129.2)Maturities and calls of available-for-sale securities . . . . . . . . . . . . . . . . . . . . . . . . . . . . . . . . . . . 430.0 209.9 111.0Sales of available-for-sale securities . . . . . . . . . . . . . . . . . . . . . . . . . . . . . . . . . . . . . . . . . . . . . . 0.0 1.1 5.0Acquisitions, net of cash acquired . . . . . . . . . . . . . . . . . . . . . . . . . . . . . . . . . . . . . . . . . . . . . . . . (55.8) (12.0) 0.0Net (purchases)/sales of equity, other investments and other assets . . . . . . . . . . . . . . . . . . . . . . (13.2) 1.2 (4.8)Additions to property, plant and equipment . . . . . . . . . . . . . . . . . . . . . . . . . . . . . . . . . . . . . . . . (531.9) (440.7) (445.6)Proceeds from sale of property, plant and equipment . . . . . . . . . . . . . . . . . . . . . . . . . . . . . . . . . 117.4 0.0 42.5
Net cash used by investing activities . . . . . . . . . . . . . . . . . . . . . . . . . . . . . . . . . . . . . . . . . . . . . . (1,019.5) (789.5) (421.1)FINANCING ACTIVITIES:Proceeds from issuance of commercial paper . . . . . . . . . . . . . . . . . . . . . . . . . . . . . . . . . . . . . . . 0.0 0.0 20,965.4Repayments of commercial paper . . . . . . . . . . . . . . . . . . . . . . . . . . . . . . . . . . . . . . . . . . . . . . . . 0.0 0.0 (21,378.5)Proceeds from short-term borrowings . . . . . . . . . . . . . . . . . . . . . . . . . . . . . . . . . . . . . . . . . . . . . 30.8 0.0 1,338.0Repayments of short-term borrowings . . . . . . . . . . . . . . . . . . . . . . . . . . . . . . . . . . . . . . . . . . . . 0.0 0.0 (1,638.0)Purchase of noncontrolling interest . . . . . . . . . . . . . . . . . . . . . . . . . . . . . . . . . . . . . . . . . . . . . . . (27.5) (45.8) 0.0Proceeds from issuance of common stock . . . . . . . . . . . . . . . . . . . . . . . . . . . . . . . . . . . . . . . . . 235.4 127.9 57.3Excess tax benefit from exercise of stock options . . . . . . . . . . . . . . . . . . . . . . . . . . . . . . . . . . . . 103.9 36.9 15.9Principal payments on long-term debt . . . . . . . . . . . . . . . . . . . . . . . . . . . . . . . . . . . . . . . . . . . . . (4.3) (6.6) (0.7)Cash dividends paid . . . . . . . . . . . . . . . . . . . . . . . . . . . . . . . . . . . . . . . . . . . . . . . . . . . . . . . . . . (389.5) (171.0) 0.0Repurchase of common stock . . . . . . . . . . . . . . . . . . . . . . . . . . . . . . . . . . . . . . . . . . . . . . . . . . . (555.9) (285.6) 0.0Other . . . . . . . . . . . . . . . . . . . . . . . . . . . . . . . . . . . . . . . . . . . . . . . . . . . . . . . . . . . . . . . . . . . . . . (0.9) (1.8) (1.6)
Net cash used by financing activities . . . . . . . . . . . . . . . . . . . . . . . . . . . . . . . . . . . . . . . . . . . . . (608.0) (346.0) (642.2)Effect of exchange rate changes on cash and cash equivalents . . . . . . . . . . . . . . . . . . . . . . . . . . (0.8) (5.2) 4.3
Net increase/(decrease) in cash and cash equivalents . . . . . . . . . . . . . . . . . . . . . . . . . . . . . . . . . (15.9) 564.2 330.0CASH AND CASH EQUIVALENTS:Beginning of period . . . . . . . . . . . . . . . . . . . . . . . . . . . . . . . . . . . . . . . . . . . . . . . . . . . . . . . . . . 1,164.0 599.8 269.8
End of period . . . . . . . . . . . . . . . . . . . . . . . . . . . . . . . . . . . . . . . . . . . . . . . . . . . . . . . . . . . . . . . $ 1,148.1 $1,164.0 $ 599.8
SUPPLEMENTAL DISCLOSURE OF CASH FLOW INFORMATION:Cash paid during the period for:Interest, net of capitalized interest . . . . . . . . . . . . . . . . . . . . . . . . . . . . . . . . . . . . . . . . . . . . . . . . $ 34.4 $ 32.0 $ 39.8Income taxes . . . . . . . . . . . . . . . . . . . . . . . . . . . . . . . . . . . . . . . . . . . . . . . . . . . . . . . . . . . . . . . . $ 350.1 $ 527.0 $ 162.0
See Notes to Consolidated Financial Statements.
45
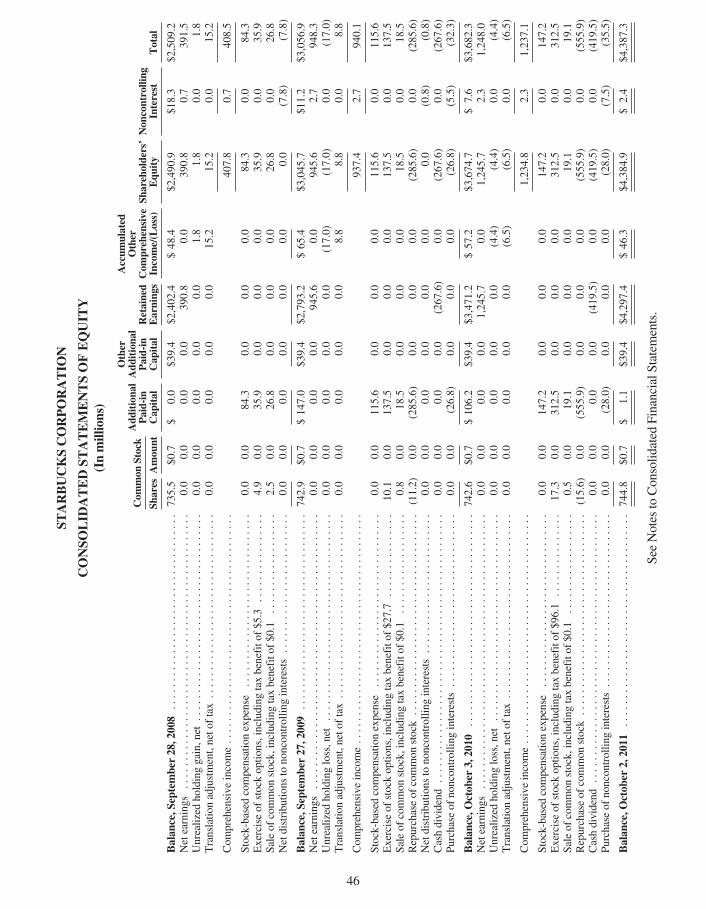
STARBUCKSCORPORATIO
N
CONSO
LID
ATEDST
ATEMENTSOFEQUIT
Y(Inmillions)
Com
mon
Stock
Add
itiona
lPaid-in
Cap
ital
Other
Add
itiona
lPaid-in
Cap
ital
Retained
Earning
s
Accum
ulated
Other
Com
prehensive
Income/(Loss)
Shareholders’
Equ
ity
Non
controlling
Interest
Total
Shares
Amou
nt
Balan
ce,S
eptember28,2008
...................................735.5
$0.7
$0.0
$39.4
$2,402.4
$48.4
$2,490.9
$18.3
$2,509.2
Netearnings
.................................................
0.0
0.0
0.0
0.0
390.8
0.0
390.8
0.7
391.5
Unrealized
holdinggain,net
.....................................
0.0
0.0
0.0
0.0
0.0
1.8
1.8
0.0
1.8
Translatio
nadjustment,neto
ftax.................................
0.0
0.0
0.0
0.0
0.0
15.2
15.2
0.0
15.2
Com
prehensive
income.........................................
407.8
0.7
408.5
Stock-basedcompensationexpense
...............................
0.0
0.0
84.3
0.0
0.0
0.0
84.3
0.0
84.3
Exerciseof
stockoptio
ns,including
taxbenefito
f$5.3
................
4.9
0.0
35.9
0.0
0.0
0.0
35.9
0.0
35.9
Saleof
common
stock,includingtaxbenefito
f$0.1
..................
2.5
0.0
26.8
0.0
0.0
0.0
26.8
0.0
26.8
Netdistributio
nsto
noncontrollin
ginterests.........................
0.0
0.0
0.0
0.0
0.0
0.0
0.0
(7.8)
(7.8)
Balan
ce,S
eptember27,2009
...................................742.9
$0.7
$147.0
$39.4
$2,793.2
$65.4
$3,045.7
$11.2
$3,056.9
Netearnings
.................................................
0.0
0.0
0.0
0.0
945.6
0.0
945.6
2.7
948.3
Unrealized
holdingloss,net
............................
.........
0.0
0.0
0.0
0.0
0.0
(17.0)
(17.0)
0.0
(17.0)
Translatio
nadjustment,neto
ftax.................................
0.0
0.0
0.0
0.0
0.0
8.8
8.8
0.0
8.8
Com
prehensive
income.........................................
937.4
2.7
940.1
Stock-basedcompensationexpense
...............................
0.0
0.0
115.6
0.0
0.0
0.0
115.6
0.0
115.6
Exerciseof
stockoptio
ns,including
taxbenefito
f$27.7
...............
10.1
0.0
137.5
0.0
0.0
0.0
137.5
0.0
137.5
Saleof
common
stock,includingtaxbenefito
f$0.1
..................
0.8
0.0
18.5
0.0
0.0
0.0
18.5
0.0
18.5
Repurchaseof
common
stock....................................
(11.2)
0.0
(285.6)
0.0
0.0
0.0
(285.6)
0.0
(285.6)
Netdistributio
nsto
noncontrollin
ginterests.........................
0.0
0.0
0.0
0.0
0.0
0.0
0.0
(0.8)
(0.8)
Cashdividend
................................................
0.0
0.0
0.0
0.0
(267.6)
0.0
(267.6)
0.0
(267.6)
Purchase
ofnoncontrollin
ginterests...............................
0.0
0.0
(26.8)
0.0
0.0
0.0
(26.8)
(5.5)
(32.3)
Balan
ce,O
ctob
er3,2010
......................................
742.6
$0.7
$106.2
$39.4
$3,471.2
$57.2
$3,674.7
$7.6
$3,682.3
Netearnings
.................................................
0.0
0.0
0.0
0.0
1,245.7
0.0
1,245.7
2.3
1,248.0
Unrealized
holdingloss,net
............................
.........
0.0
0.0
0.0
0.0
0.0
(4.4)
(4.4)
0.0
(4.4)
Translatio
nadjustment,neto
ftax.................................
0.0
0.0
0.0
0.0
0.0
(6.5)
(6.5)
0.0
(6.5)
Com
prehensive
income.........................................
1,234.8
2.3
1,237.1
Stock-basedcompensationexpense
...............................
0.0
0.0
147.2
0.0
0.0
0.0
147.2
0.0
147.2
Exerciseof
stockoptio
ns,including
taxbenefito
f$96.1
...............
17.3
0.0
312.5
0.0
0.0
0.0
312.5
0.0
312.5
Saleof
common
stock,includingtaxbenefito
f$0.1
..................
0.5
0.0
19.1
0.0
0.0
0.0
19.1
0.0
19.1
Repurchaseof
common
stock....................................
(15.6)
0.0
(555.9)
0.0
0.0
0.0
(555.9)
0.0
(555.9)
Cashdividend
................................................
0.0
0.0
0.0
0.0
(419.5)
0.0
(419.5)
0.0
(419.5)
Purchase
ofnoncontrollin
ginterests...............................
0.0
0.0
(28.0)
0.0
0.0
0.0
(28.0)
(7.5)
(35.5)
Balan
ce,O
ctob
er2,2011
......................................
744.8
$0.7
$1.1
$39.4
$4,297.4
$46.3
$4,384.9
$2.4
$4,387.3
SeeNotes
toConsolid
ated
FinancialS
tatements.
46
STARBUCKS CORPORATION
NOTES TO CONSOLIDATED FINANCIAL STATEMENTSFiscal Years ended October 2, 2011, October 3, 2010 and September 27, 2009
Note 1: Summary of Significant Accounting Policies
Description of Business
We purchase and roast high-quality whole bean coffees that we sell, along with handcrafted coffee and tea beveragesand a variety of fresh food items, through our company-operated stores. We also sell a variety of coffee and teaproducts and license our trademarks through other channels such as licensed stores, grocery and national foodserviceaccounts. Additional details on the nature of our business are in Item 1 of this 10-K.
In this 10-K, Starbucks Corporation (together with its subsidiaries) is referred to as “Starbucks,” the “Company,”“we,” “us” or “our.”
We have three reportable operating segments: United States (“US”), International, and Global Consumer ProductsGroup (“CPG”).
Principles of Consolidation
The consolidated financial statements reflect the financial position and operating results of Starbucks, includingwholly owned subsidiaries and investees controlled by us. Investments in entities that we do not control, but havethe ability to exercise significant influence over operating and financial policies, are accounted for under the equitymethod. Investments in entities in which we do not have the ability to exercise significant influence are accountedfor under the cost method. Intercompany transactions and balances have been eliminated.
Fiscal Year End
Our fiscal year ends on the Sunday closest to September 30. Fiscal years 2011 and 2009 included 52 weeks. Fiscalyear 2010 included 53 weeks, with the 53rd week falling in the fourth fiscal quarter.
Estimates and Assumptions
Preparing financial statements in conformity with accounting principles generally accepted in the United States ofAmerica (“GAAP”) requires management to make estimates and assumptions that affect the reported amounts ofassets, liabilities, revenues and expenses. Examples include, but are not limited to, estimates for asset and goodwillimpairments, stock-based compensation forfeiture rates, and future asset retirement obligations; assumptionsunderlying self-insurance reserves; and the potential outcome of future tax consequences of events that have beenrecognized in the financial statements. Actual results and outcomes may differ from these estimates andassumptions.
Cash and Cash Equivalents
We consider all highly liquid instruments with a maturity of three months or less at the time of purchase to be cashequivalents. Cash and cash equivalents are valued using active markets for identical assets (Level 1 of the fair valuehierarchy). We maintain cash and cash equivalent balances with financial institutions that exceed federally insuredlimits. We have not experienced any losses related to these balances, and we believe credit risk to be minimal.
Cash Management
Our cash management system provides for the funding of all major bank disbursement accounts on a daily basis aschecks are presented for payment. Under this system, outstanding checks are in excess of the cash balances at certainbanks, which creates book overdrafts. Book overdrafts are presented as a current liability in accounts payable on theconsolidated balance sheets.
47
Short-term and Long-term Investments
Our short-term and long-term investments consist primarily of investment grade debt securities, including someauction rate securities, all of which are classified as available-for-sale. Also included in our available-for-saleinvestment portfolio are certificates of deposit placed through an account registry service. Available-for-salesecurities are recorded at fair value, and unrealized holding gains and losses are recorded, net of tax, as a componentof accumulated other comprehensive income. Available-for-sale securities with remaining maturities of less thanone year and those identified by management at the time of purchase to be used to fund operations within one yearare classified as short term. All other available-for-sale securities, including all of our auction rate securities, areclassified as long term. Unrealized losses are charged against net earnings when a decline in fair value is determinedto be other than temporary. We review several factors to determine whether a loss is other than temporary, such asthe length and extent of the fair value decline, the financial condition and near term prospects of the issuer, andwhether we have the intent to sell or will likely be required to sell before the securities anticipated recovery, whichmay be at maturity. Realized gains and losses are accounted for using the specific identification method. Purchasesand sales are recorded on a trade date basis.
We also have a trading securities portfolio, which is comprised of marketable equity mutual funds and equityexchange-traded funds. Trading securities are recorded at fair value with unrealized holding gains and lossesincluded in net earnings.
Fair Value
Fair value is the price we would receive to sell an asset or pay to transfer a liability (exit price) in an orderlytransaction between market participants. For financial instruments and investments that we record or disclose at fairvalue, we determine fair value based upon the quoted market price as of the last day of the fiscal period, ifavailable. If a quoted market price is not available for identical assets, we determine fair value based upon thequoted market price of similar assets or using a variety of other valuation methodologies. We determine fair value ofour auction rate securities using an internally developed valuation model, using inputs that include interest ratecurves, credit and liquidity spreads, and effective maturity.
The carrying value of cash and cash equivalents approximates fair value because of the short-term nature of theseinstruments. The fair value of our long-term debt is estimated based on the quoted market prices for the same orsimilar issues or on the current rates offered to us for debt of the same remaining maturities.
We measure our equity and cost method investments at fair value on a nonrecurring basis when they are determinedto be other-than temporarily impaired. Fair values are determined using available quoted market prices or discountedcash flows.
Derivative Instruments
We manage our exposure to various risks within the consolidated financial statements according to an umbrella riskmanagement policy. Under this policy, we may engage in transactions involving various derivative instruments,with maturities generally not longer than five years, to hedge interest rates, commodity prices and foreign currencydenominated revenues, purchases, assets and liabilities.
We record all derivatives on the balance sheets at fair value. For a cash flow hedge, the effective portion of thederivative’s gain or loss is initially reported as a component of other comprehensive income (“OCI”) andsubsequently reclassified into net earnings when the hedged exposure affects net earnings. For a net investmenthedge, the effective portion of the derivative’s gain or loss is reported as a component of OCI.
Cash flow hedges related to anticipated transactions are designated and documented at the inception of each hedgeby matching the terms of the contract to the underlying transaction. We classify the cash flows from hedgingtransactions in the same categories as the cash flows from the respective hedged items. Once established, cash flowhedges are generally not removed until maturity unless an anticipated transaction is no longer likely to occur. Fordiscontinued or dedesignated cash flow hedges, the related accumulated derivative gains or losses are recognized innet interest income and other on the consolidated statements of earnings.
48
Forward contract effectiveness for cash flow hedges is calculated by comparing the fair value of the contract to thechange in value of the anticipated transaction using forward rates on a monthly basis. For net investment hedges, thespot-to-spot method is used to calculate effectiveness. Under this method, the change in fair value of the forwardcontract attributable to the changes in spot exchange rates (the effective portion) is reported as a component of OCI.The remaining change in fair value of the forward contract (the ineffective portion) is reclassified into net earnings.Any ineffectiveness is recognized immediately in net interest income and other on the consolidated statements ofearnings.
We also enter into certain foreign currency forward contracts, commodity swap contracts, and futures contracts thatare not designated as hedging instruments for accounting purposes. These contracts are recorded at fair value, withthe changes in fair value recognized in net interest income and other on the consolidated statements of earnings.
Allowance for Doubtful Accounts
Allowance for doubtful accounts is calculated based on historical experience, customer credit risk and application ofthe specific identification method. As of October 2, 2011, October 3, 2010, and September 27, 2009, the allowancefor doubtful accounts was $3.3 million, $3.3 million, and $5.0 million respectively.
Inventories
Inventories are stated at the lower of cost (primarily moving average cost) or market. We record inventory reservesfor obsolete and slow-moving inventory and for estimated shrinkage between physical inventory counts. Inventoryreserves are based on inventory turnover trends, historical experience and application of the specific identificationmethod. As of October 2, 2011, October 3, 2010, and September 27, 2009, inventory reserves were $19.5 million,$18.1 million, and $21.1 million, respectively.
Property, Plant and Equipment
Property, plant and equipment are carried at cost less accumulated depreciation. Depreciation of property, plant andequipment, which includes assets under capital leases, is provided on the straight-line method over estimated usefullives, generally ranging from two to 15 years for equipment and 30 to 40 years for buildings. Leaseholdimprovements are amortized over the shorter of their estimated useful lives or the related lease life, generally10 years. For leases with renewal periods at our option, we generally use the original lease term, excluding renewaloption periods, to determine estimated useful lives. If failure to exercise a renewal option imposes an economicpenalty to us, we may determine at the inception of the lease that renewal is reasonably assured and include therenewal option period in the determination of appropriate estimated useful lives. The portion of depreciationexpense related to production and distribution facilities is included in cost of sales including occupancy costs on theconsolidated statements of earnings. The costs of repairs and maintenance are expensed when incurred, whileexpenditures for refurbishments and improvements that significantly add to the productive capacity or extend theuseful life of an asset are capitalized. When assets are retired or sold, the asset cost and related accumulateddepreciation are eliminated with any remaining gain or loss recognized in net earnings.
Goodwill
We test goodwill for impairment on an annual basis during our third fiscal quarter, or more frequently ifcircumstances, such as material deterioration in performance or a significant number of store closures, indicatereporting unit carrying values may exceed their fair values. If the carrying amount of goodwill exceeds the impliedestimated fair value, an impairment charge to current operations is recorded to reduce the carrying value to theimplied estimated fair value.
As a part of our ongoing operations, we may close certain stores within a reporting unit containing goodwill due tounderperformance of the store or inability to renew our lease, among other reasons. We abandon certain assetsassociated with a closed store including leasehold improvements and other non-transferrable assets. Under GAAP,
49
when a portion of a reporting unit that constitutes a business is to be disposed of, goodwill associated with thebusiness is included in the carrying amount of the business in determining any loss on disposal. Our evaluation ofwhether the portion of a reporting unit being disposed of constitutes a business occurs on the date of abandonment.Although an operating store meets the accounting definition of a business prior to abandonment, it does notconstitute a business on the closure date because the remaining assets on that date do not constitute an integrated setof assets that are capable of being conducted and managed for the purpose of providing a return to investors. As aresult, when closing individual stores, we do not include goodwill in the calculation of any loss on disposal of therelated assets. As noted above, if store closures are indicative of potential impairment of goodwill at the reportingunit level, we perform an evaluation of our reporting unit goodwill when such closures occur. During Fiscal 2011 werecorded no impairment charges and recorded $1.6 million in fiscal 2010 and $7.0 million in fiscal 2009.
Other Intangible Assets
Other intangible assets consist primarily of trademarks with indefinite lives, which are tested for impairmentannually or more frequently if events or changes in circumstances indicate that the asset might be impaired.Definite-lived intangible assets, which mainly consist of contract-based patents and copyrights, are amortized overtheir estimated useful lives, and are tested for impairment when facts and circumstances indicate that the carryingvalues may not be recoverable. Based on the impairment tests performed, there was no impairment of otherintangible assets in fiscal 2011, 2010, and 2009.
Long-lived Assets
When facts and circumstances indicate that the carrying values of long-lived assets may not be recoverable, weevaluate long-lived assets for impairment. We first compare the carrying value of the asset to the asset’s estimatedfuture cash flows (undiscounted). If the estimated future cash flows are less than the carrying value of the asset, wecalculate an impairment loss based on the asset’s estimated fair value. The fair value of the assets is estimated usinga discounted cash flow model based on forecasted future revenues and operating costs, using internal projections.Property, plant and equipment assets are grouped at the lowest level for which there are identifiable cash flows whenassessing impairment. Cash flows for company-operated store assets are identified at the individual store level.Long-lived assets to be disposed of are reported at the lower of their carrying amount, or fair value less estimatedcosts to sell.
We recognized net impairment and disposition losses of $36.2 million, $67.7 million, and $224.4 million in fiscal2011, 2010, and 2009, respectively, primarily due to underperforming company-operated stores. The net losses infiscal 2009 include $129.2 million of asset impairments related primarily to the US and International store closuresthat occurred as part of our store portfolio rationalization which began in fiscal 2008. Depending on the underlyingasset that is impaired, these losses may be recorded in any one of the operating expense lines on the consolidatedstatements of earnings: for retail operations, the net impairment and disposition losses are recorded in restructuringcharges and store operating expenses and for all other operations, these losses are recorded in cost of sales includingoccupancy costs, other operating expenses, general and administrative expenses, or restructuring charges.
Insurance Reserves
We use a combination of insurance and self-insurance mechanisms, including a wholly owned captive insuranceentity and participation in a reinsurance treaty, to provide for the potential liabilities for certain risks, includingworkers’ compensation, healthcare benefits, general liability, property insurance, and director and officers’ liabilityinsurance. Liabilities associated with the risks that are retained by us are not discounted and are estimated, in part, byconsidering historical claims experience, demographic, exposure and severity factors, and other actuarialassumptions.
50
Revenue Recognition
Consolidated revenues are presented net of intercompany eliminations for wholly owned subsidiaries and investeescontrolled by us and for licensees accounted for under the equity method, based on our percentage ownership.Additionally, consolidated revenues are recognized net of any discounts, returns, allowances and sales incentives,including coupon redemptions and rebates.
Any revenue arrangements involving multiple elements and deliverables as well as upfront fees are individuallyevaluated for revenue recognition. Cash payments received in advance of product or service delivery are recorded indeferred revenue until earned.
Company-operated Stores Revenues
Company-operated store revenues are recognized when payment is tendered at the point of sale. Retail storerevenues are reported net of sales, use or other transaction taxes that are collected from customers and remitted totaxing authorities.
Stored Value Cards
Revenues from our stored value cards, primarily Starbucks Cards, are recognized when redeemed, or when werecognize breakage income. We recognize breakage income when the likelihood of redemption, based on historicalexperience, is deemed to be remote. Outstanding customer balances are included in deferred revenue on theconsolidated balance sheets. There are no expiration dates on our stored value cards, and we do not charge anyservice fees that cause a decrement to customer balances. While we will continue to honor all stored value cardspresented for payment, management may determine the likelihood of redemption to be remote for certain cards dueto, among other things, long periods of inactivity. In these circumstances, if management also determines there is norequirement for remitting balances to government agencies under unclaimed property laws, card balances may thenbe recognized in the consolidated statements of earnings, in net interest income and other. For the fiscal years endedOctober 2, 2011, October 3, 2010, and September 27, 2009, income recognized on unredeemed stored value cardbalances was $46.9 million, $31.2 million, and $26.0 million, respectively.
Customers in the US who register their Starbucks Card are automatically enrolled in the My Starbucks Reward®
program and earn points (“Stars”) with each purchase. Reward program members receive various benefitsdepending on the number of Stars earned in a 12-month period. Customers at the highest level of the rewardsprogram receive a free beverage coupon after a specified number of purchases. The value of Stars earned by ourprogram members is included in deferred revenue and recorded as a reduction in revenue at the time the Stars areearned, based on the value of Stars that are projected to be redeemed.
Licensed Stores Revenues
Licensed stores revenues consist of product sales to licensed stores, as well as royalties and other fees paid bylicensees to use the Starbucks brand. Sales of coffee, tea and related products are generally recognized uponshipment to licensees, depending on contract terms. Shipping charges billed to licensees are also recognized asrevenue, and the related shipping costs are included in cost of sales including occupancy costs on the consolidatedstatements of earnings.
Initial nonrefundable development fees for licensed stores are recognized upon substantial performance of servicesfor new market business development activities, such as initial business, real estate and store development planning,as well as providing operational materials and functional training courses for opening new licensed retail markets.Additional store licensing fees are recognized when new licensed stores are opened. Royalty revenues based upon apercentage of reported sales and other continuing fees, such as marketing and service fees, are recognized on amonthly basis when earned.
51
CPG, Foodservice and Other Revenues
CPG, foodservice and other revenues primarily consist of packaged coffee and tea sales to grocery and warehouseclub stores, revenues from sales of products to and license revenues from manufacturers that produce and marketStarbucks and Seattle’s Best Coffee branded products through licensing agreements, and sales to our nationalfoodservice accounts. Sales of coffee, tea and related products to grocery and warehouse club stores are generallyrecognized when received by the customer or distributor, depending on contract terms. We maintain a sales returnallowance to reduce packaged goods revenues for estimated future product returns based on historical patterns.Revenues are recorded net of sales discounts given to customers for trade promotions and payments to customers forproduct placement in our customers’ stores.
Revenues from sales of products to manufacturers that produce and market Starbucks and Seattle’s Best Coffeebranded products through licensing agreements are generally recognized when the product is received by themanufacturer or distributor. License revenues from manufacturers are based on a percentage of sales and arerecognized on a monthly basis when earned. National foodservice account revenues are recognized when theproduct is received by the customer or distributor.
Advertising
Our annual marketing expenses include many components, one of which is advertising costs. We expense mostadvertising costs as they are incurred, except for certain production costs that are expensed the first time theadvertising campaign takes place.
Advertising expenses totaled $141.4 million, $176.2 million, and $126.3 million in fiscal 2011, 2010, and 2009,respectively.
Store Preopening Expenses
Costs incurred in connection with the start-up and promotion of new store openings are expensed as incurred.
Operating Leases
We lease retail stores, roasting, distribution and warehouse facilities, and office space under operating leases. Mostlease agreements contain tenant improvement allowances, rent holidays, lease premiums, rent escalation clausesand/or contingent rent provisions. For purposes of recognizing incentives, premiums and minimum rental expenseson a straight-line basis over the terms of the leases, we use the date of initial possession to begin amortization, whichis generally when we enter the space and begin to make improvements in preparation of intended use.
For tenant improvement allowances and rent holidays, we record a deferred rent liability on the consolidated balancesheets and amortize the deferred rent over the terms of the leases as reductions to rent expense on the consolidatedstatements of earnings.
For premiums paid upfront to enter a lease agreement, we record a deferred rent asset on the consolidated balancesheets and then amortize the deferred rent over the terms of the leases as additional rent expense on the consolidatedstatements of earnings.
For scheduled rent escalation clauses during the lease terms or for rental payments commencing at a date other thanthe date of initial occupancy, we record minimum rental expenses on a straight-line basis over the terms of the leaseson the consolidated statements of earnings.
Certain leases provide for contingent rents, which are determined as a percentage of gross sales in excess ofspecified levels. We record a contingent rent liability on the consolidated balance sheets and the corresponding rentexpense when specified levels have been achieved or when we determine that achieving the specified levels duringthe fiscal year is probable.
52
When ceasing operations in company-operated stores under operating leases, in cases where the lease contractspecifies a termination fee due to the landlord, we record such expense at the time written notice is given to thelandlord. In cases where terms, including termination fees, are yet to be negotiated with the landlord, we will recordthe expense upon signing of an agreement with the landlord. In cases where the landlord does not allow us toprematurely exit the lease, but allows for subleasing, we estimate the fair value of any sublease income that can begenerated from the location and expense the present value of the excess of remaining lease payments to the landlordover the projected sublease income at the cease-use date.
Asset Retirement Obligations
We recognize a liability for the fair value of required asset retirement obligations (“ARO”) when such obligationsare incurred. Our AROs are primarily associated with leasehold improvements, which, at the end of a lease, we arecontractually obligated to remove in order to comply with the lease agreement. At the inception of a lease with suchconditions, we record an ARO liability and a corresponding capital asset in an amount equal to the estimated fairvalue of the obligation. The liability is estimated based on a number of assumptions requiring management’sjudgment, including store closing costs, cost inflation rates and discount rates, and is accreted to its projected futurevalue over time. The capitalized asset is depreciated using the same depreciation convention as leaseholdimprovement assets. Upon satisfaction of the ARO conditions, any difference between the recorded ARO liabilityand the actual retirement costs incurred is recognized as an operating gain or loss in the consolidated statements ofearnings. As of October 2, 2011 and October 3, 2010, our net ARO asset included in property, plant and equipmentwas $11.8 million and $13.7 million, respectively, and our net ARO liability included in other long-term liabilitieswas $50.1 million and $47.7 million, respectively.
Stock-based Compensation
We maintain several equity incentive plans under which we may grant non-qualified stock options, incentive stockoptions, restricted stock, restricted stock units (“RSUs”) or stock appreciation rights to employees, non-employeedirectors and consultants. We also have employee stock purchase plans (“ESPP”). RSUs issued by us are equivalentto nonvested shares under the applicable accounting guidance. We record stock-based compensation expenses basedon the fair value of stock awards at the grant date and recognize the expense over the related service periodfollowing a graded vesting expense schedule. For stock option awards we use the Black-Scholes-Merton optionpricing model to measure fair value. For restricted stock units, fair value is calculated using the stock price at thedate of grant.
Foreign Currency Translation
Our international operations generally use their local currency as their functional currency. Assets and liabilities aretranslated at exchange rates in effect at the balance sheet date. Income and expense accounts are translated at theaverage monthly exchange rates during the year. Resulting translation adjustments are recorded as a component ofaccumulated other comprehensive income on the consolidated balance sheets.
Income Taxes
We compute income taxes using the asset and liability method, under which deferred income taxes are provided forthe temporary differences between the financial statement carrying amounts and the tax basis of our assets andliabilities. We routinely evaluate the likelihood of realizing the benefit of our deferred tax assets and may record avaluation allowance if, based on all available evidence, we determine that some portion of the tax benefit will not berealized. We recognize the tax benefit from an uncertain tax position only if it is more likely than not that the taxposition will be sustained on examination by the relevant taxing authorities, based on the technical merits of ourposition. The tax benefits recognized in the financial statements from such a position are measured based on thelargest benefit that has a greater than 50% likelihood of being realized upon ultimate settlement. Starbucksrecognizes interest and penalties related to income tax matters in income tax expense.
53
Earnings per Share
Basic earnings per share is computed based on the weighted average number of shares of common stock outstandingduring the period. Diluted earnings per share is computed based on the weighted average number of shares ofcommon stock and the effect of dilutive potential common shares outstanding during the period, calculated using thetreasury stock method. Dilutive potential common shares include outstanding stock options and RSUs. Performance-based RSUs are considered dilutive when the related performance criterion has been met.
Common Stock Share Repurchases
We may repurchase shares of Starbucks common stock under a program authorized by our Board of Directors,including pursuant to a contract, instruction or written plan meeting the requirements of Rule 10b5-1(c)(1) of theSecurities Exchange Act of 1934. Under applicable Washington State law, shares repurchased are retired and notdisplayed separately as treasury stock on the financial statements. Instead, the par value of repurchased shares isdeducted from common stock and the excess repurchase price over par value is deducted from additional paid-incapital and from retained earnings, once additional paid-in capital is depleted.
Recent Accounting Pronouncements
In September 2011, the FASB issued guidance that revises the requirements around how entities test goodwill forimpairment. The guidance allows companies to perform a qualitative assessment before calculating the fair value ofthe reporting unit. If entities determine, on the basis of qualitative factors, that the fair value of the reporting unit ismore likely than not greater than the carrying amount, a quantitative calculation would not be needed. We plan toearly adopt this guidance effective for our fiscal 2012 annual goodwill impairment test. The adoption of thisguidance will result in a change in how we perform our goodwill impairment assessment; however, it will not have amaterial impact on our financial statements.
In June 2011, the FASB issued guidance that revises the manner in which entities present comprehensive income intheir financial statements. The guidance requires entities to report the components of comprehensive income ineither a single, continuous statement or two separate but consecutive statements. The guidance will become effectivefor us at the beginning of our first quarter of fiscal 2013. The adoption of this new guidance will result in a change inhow we present the components of comprehensive income, which is currently presented within our consolidatedstatements of equity.
In May 2011, the FASB issued guidance to amend the fair value measurement and disclosure requirements. Theguidance requires the disclosure of quantitative information about unobservable inputs used, a description of thevaluation processes used, and a qualitative discussion around the sensitivity of the measurements. The guidance willbecome effective for us at the beginning of our second quarter of fiscal 2012. The adoption of this new guidance willnot have a material impact on our financial statements.
In June 2009, the FASB issued guidance on the consolidation of variable interest entities. We adopted this newguidance effective at the beginning of the first quarter of fiscal 2011, with no impact on our financial statements.
Reclassifications
In the second quarter of fiscal 2011, concurrent with the change in our distribution method for packaged coffee andtea in the US, we revised the presentation of revenues. Non-retail licensing revenues were reclassified on theconsolidated financial statements to the renamed “CPG, foodservice and other” revenue line, which includesrevenues from our direct sale of packaged coffee and tea as well as licensing revenues received under the previousdistribution arrangement. The previous “Licensing” revenue line now includes only licensed store revenue andtherefore has been renamed “Licensed stores.” For fiscal 2010 and 2009, $465.7 million and $427.3 million,respectively, were reclassified from the previously named Licensing revenue to CPG, foodservice and otherrevenue. There was no impact to consolidated or segment total net revenues from this change in presentation.
In addition, certain other reclassifications have been made to prior year amounts to conform to the current yearpresentation.
54
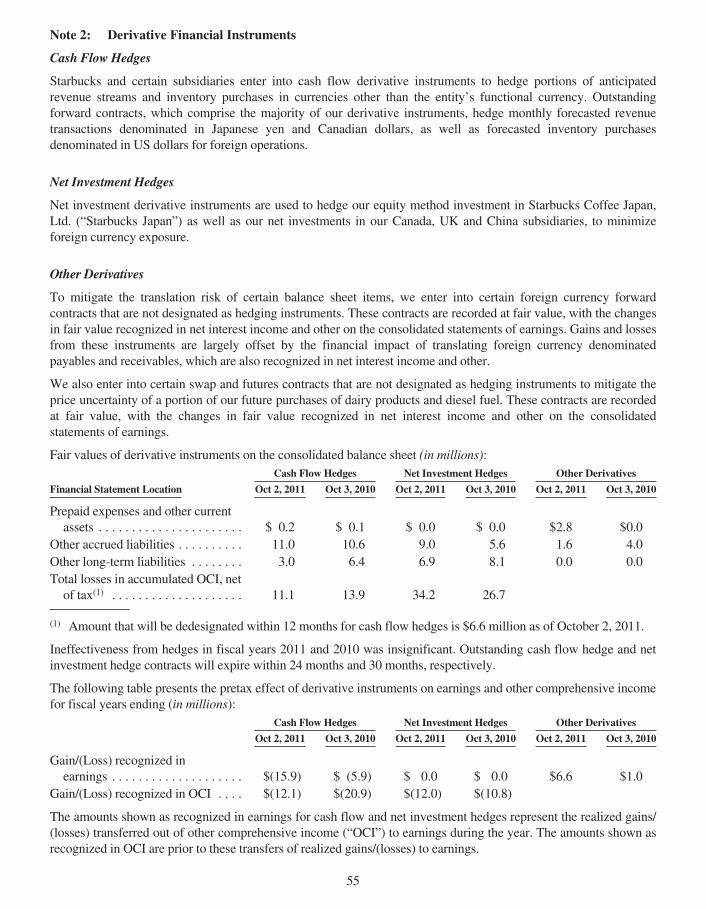
Note 2: Derivative Financial Instruments
Cash Flow Hedges
Starbucks and certain subsidiaries enter into cash flow derivative instruments to hedge portions of anticipatedrevenue streams and inventory purchases in currencies other than the entity’s functional currency. Outstandingforward contracts, which comprise the majority of our derivative instruments, hedge monthly forecasted revenuetransactions denominated in Japanese yen and Canadian dollars, as well as forecasted inventory purchasesdenominated in US dollars for foreign operations.
Net Investment Hedges
Net investment derivative instruments are used to hedge our equity method investment in Starbucks Coffee Japan,Ltd. (“Starbucks Japan”) as well as our net investments in our Canada, UK and China subsidiaries, to minimizeforeign currency exposure.
Other Derivatives
To mitigate the translation risk of certain balance sheet items, we enter into certain foreign currency forwardcontracts that are not designated as hedging instruments. These contracts are recorded at fair value, with the changesin fair value recognized in net interest income and other on the consolidated statements of earnings. Gains and lossesfrom these instruments are largely offset by the financial impact of translating foreign currency denominatedpayables and receivables, which are also recognized in net interest income and other.
We also enter into certain swap and futures contracts that are not designated as hedging instruments to mitigate theprice uncertainty of a portion of our future purchases of dairy products and diesel fuel. These contracts are recordedat fair value, with the changes in fair value recognized in net interest income and other on the consolidatedstatements of earnings.
Fair values of derivative instruments on the consolidated balance sheet (in millions):Cash Flow Hedges Net Investment Hedges Other Derivatives
Financial Statement Location Oct 2, 2011 Oct 3, 2010 Oct 2, 2011 Oct 3, 2010 Oct 2, 2011 Oct 3, 2010
Prepaid expenses and other currentassets . . . . . . . . . . . . . . . . . . . . . . $ 0.2 $ 0.1 $ 0.0 $ 0.0 $2.8 $0.0
Other accrued liabilities . . . . . . . . . . 11.0 10.6 9.0 5.6 1.6 4.0Other long-term liabilities . . . . . . . . 3.0 6.4 6.9 8.1 0.0 0.0Total losses in accumulated OCI, netof tax(1) . . . . . . . . . . . . . . . . . . . . 11.1 13.9 34.2 26.7
(1) Amount that will be dedesignated within 12 months for cash flow hedges is $6.6 million as of October 2, 2011.
Ineffectiveness from hedges in fiscal years 2011 and 2010 was insignificant. Outstanding cash flow hedge and netinvestment hedge contracts will expire within 24 months and 30 months, respectively.
The following table presents the pretax effect of derivative instruments on earnings and other comprehensive incomefor fiscal years ending (in millions):
Cash Flow Hedges Net Investment Hedges Other Derivatives
Oct 2, 2011 Oct 3, 2010 Oct 2, 2011 Oct 3, 2010 Oct 2, 2011 Oct 3, 2010
Gain/(Loss) recognized inearnings . . . . . . . . . . . . . . . . . . . . $(15.9) $ (5.9) $ 0.0 $ 0.0 $6.6 $1.0
Gain/(Loss) recognized in OCI . . . . $(12.1) $(20.9) $(12.0) $(10.8)
The amounts shown as recognized in earnings for cash flow and net investment hedges represent the realized gains/(losses) transferred out of other comprehensive income (“OCI”) to earnings during the year. The amounts shown asrecognized in OCI are prior to these transfers of realized gains/(losses) to earnings.
55
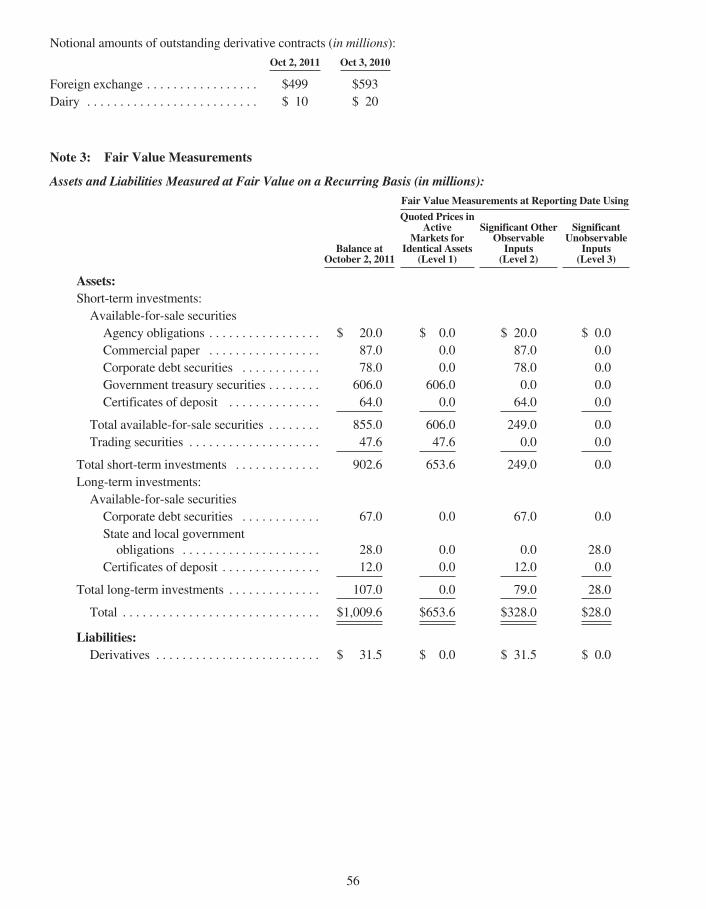
Notional amounts of outstanding derivative contracts (in millions):
Oct 2, 2011 Oct 3, 2010
Foreign exchange . . . . . . . . . . . . . . . . . $499 $593Dairy . . . . . . . . . . . . . . . . . . . . . . . . . . $ 10 $ 20
Note 3: Fair Value Measurements
Assets and Liabilities Measured at Fair Value on a Recurring Basis (in millions):Fair Value Measurements at Reporting Date Using
Balance atOctober 2, 2011
Quoted Prices inActive
Markets forIdentical Assets
(Level 1)
Significant OtherObservable
Inputs(Level 2)
SignificantUnobservable
Inputs(Level 3)
Assets:Short-term investments:Available-for-sale securitiesAgency obligations . . . . . . . . . . . . . . . . . $ 20.0 $ 0.0 $ 20.0 $ 0.0Commercial paper . . . . . . . . . . . . . . . . . 87.0 0.0 87.0 0.0Corporate debt securities . . . . . . . . . . . . 78.0 0.0 78.0 0.0Government treasury securities . . . . . . . . 606.0 606.0 0.0 0.0Certificates of deposit . . . . . . . . . . . . . . 64.0 0.0 64.0 0.0
Total available-for-sale securities . . . . . . . . 855.0 606.0 249.0 0.0Trading securities . . . . . . . . . . . . . . . . . . . . 47.6 47.6 0.0 0.0
Total short-term investments . . . . . . . . . . . . . 902.6 653.6 249.0 0.0Long-term investments:Available-for-sale securitiesCorporate debt securities . . . . . . . . . . . . 67.0 0.0 67.0 0.0State and local governmentobligations . . . . . . . . . . . . . . . . . . . . . 28.0 0.0 0.0 28.0
Certificates of deposit . . . . . . . . . . . . . . . 12.0 0.0 12.0 0.0
Total long-term investments . . . . . . . . . . . . . . 107.0 0.0 79.0 28.0
Total . . . . . . . . . . . . . . . . . . . . . . . . . . . . . . $1,009.6 $653.6 $328.0 $28.0
Liabilities:Derivatives . . . . . . . . . . . . . . . . . . . . . . . . . $ 31.5 $ 0.0 $ 31.5 $ 0.0
56
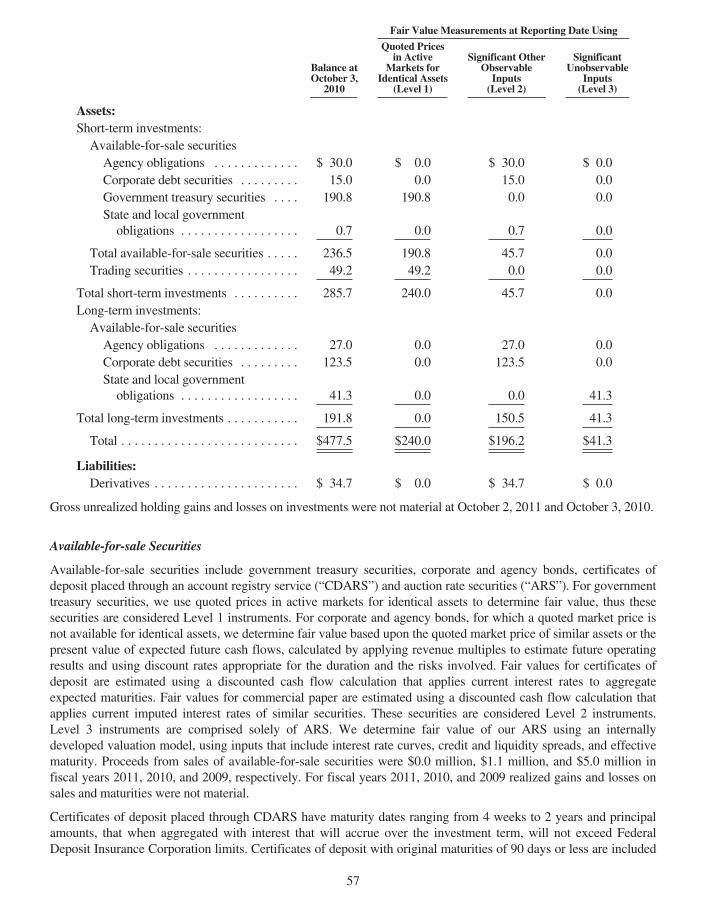
Fair Value Measurements at Reporting Date Using
Balance atOctober 3,
2010
Quoted Pricesin Active
Markets forIdentical Assets
(Level 1)
Significant OtherObservable
Inputs(Level 2)
SignificantUnobservable
Inputs(Level 3)
Assets:Short-term investments:Available-for-sale securitiesAgency obligations . . . . . . . . . . . . . $ 30.0 $ 0.0 $ 30.0 $ 0.0Corporate debt securities . . . . . . . . . 15.0 0.0 15.0 0.0Government treasury securities . . . . 190.8 190.8 0.0 0.0State and local governmentobligations . . . . . . . . . . . . . . . . . . 0.7 0.0 0.7 0.0
Total available-for-sale securities . . . . . 236.5 190.8 45.7 0.0Trading securities . . . . . . . . . . . . . . . . . 49.2 49.2 0.0 0.0
Total short-term investments . . . . . . . . . . 285.7 240.0 45.7 0.0Long-term investments:Available-for-sale securitiesAgency obligations . . . . . . . . . . . . . 27.0 0.0 27.0 0.0Corporate debt securities . . . . . . . . . 123.5 0.0 123.5 0.0State and local governmentobligations . . . . . . . . . . . . . . . . . . 41.3 0.0 0.0 41.3
Total long-term investments . . . . . . . . . . . 191.8 0.0 150.5 41.3
Total . . . . . . . . . . . . . . . . . . . . . . . . . . . $477.5 $240.0 $196.2 $41.3
Liabilities:Derivatives . . . . . . . . . . . . . . . . . . . . . . $ 34.7 $ 0.0 $ 34.7 $ 0.0
Gross unrealized holding gains and losses on investments were not material at October 2, 2011 and October 3, 2010.
Available-for-sale Securities
Available-for-sale securities include government treasury securities, corporate and agency bonds, certificates ofdeposit placed through an account registry service (“CDARS”) and auction rate securities (“ARS”). For governmenttreasury securities, we use quoted prices in active markets for identical assets to determine fair value, thus thesesecurities are considered Level 1 instruments. For corporate and agency bonds, for which a quoted market price isnot available for identical assets, we determine fair value based upon the quoted market price of similar assets or thepresent value of expected future cash flows, calculated by applying revenue multiples to estimate future operatingresults and using discount rates appropriate for the duration and the risks involved. Fair values for certificates ofdeposit are estimated using a discounted cash flow calculation that applies current interest rates to aggregateexpected maturities. Fair values for commercial paper are estimated using a discounted cash flow calculation thatapplies current imputed interest rates of similar securities. These securities are considered Level 2 instruments.Level 3 instruments are comprised solely of ARS. We determine fair value of our ARS using an internallydeveloped valuation model, using inputs that include interest rate curves, credit and liquidity spreads, and effectivematurity. Proceeds from sales of available-for-sale securities were $0.0 million, $1.1 million, and $5.0 million infiscal years 2011, 2010, and 2009, respectively. For fiscal years 2011, 2010, and 2009 realized gains and losses onsales and maturities were not material.
Certificates of deposit placed through CDARS have maturity dates ranging from 4 weeks to 2 years and principalamounts, that when aggregated with interest that will accrue over the investment term, will not exceed FederalDeposit Insurance Corporation limits. Certificates of deposit with original maturities of 90 days or less are included
57
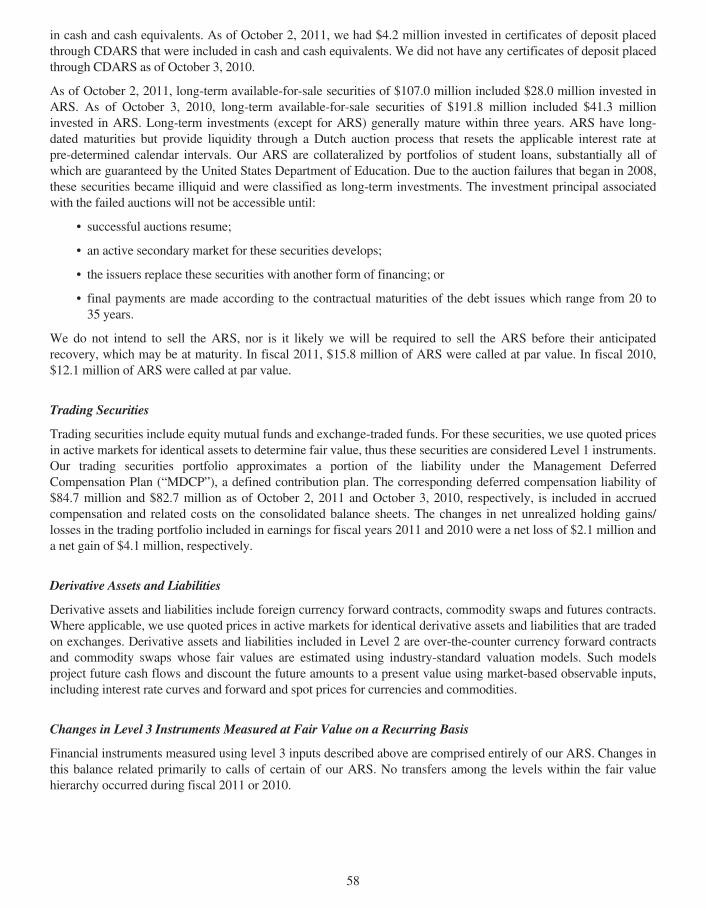
in cash and cash equivalents. As of October 2, 2011, we had $4.2 million invested in certificates of deposit placedthrough CDARS that were included in cash and cash equivalents. We did not have any certificates of deposit placedthrough CDARS as of October 3, 2010.
As of October 2, 2011, long-term available-for-sale securities of $107.0 million included $28.0 million invested inARS. As of October 3, 2010, long-term available-for-sale securities of $191.8 million included $41.3 millioninvested in ARS. Long-term investments (except for ARS) generally mature within three years. ARS have long-dated maturities but provide liquidity through a Dutch auction process that resets the applicable interest rate atpre-determined calendar intervals. Our ARS are collateralized by portfolios of student loans, substantially all ofwhich are guaranteed by the United States Department of Education. Due to the auction failures that began in 2008,these securities became illiquid and were classified as long-term investments. The investment principal associatedwith the failed auctions will not be accessible until:
• successful auctions resume;
• an active secondary market for these securities develops;
• the issuers replace these securities with another form of financing; or
• final payments are made according to the contractual maturities of the debt issues which range from 20 to35 years.
We do not intend to sell the ARS, nor is it likely we will be required to sell the ARS before their anticipatedrecovery, which may be at maturity. In fiscal 2011, $15.8 million of ARS were called at par value. In fiscal 2010,$12.1 million of ARS were called at par value.
Trading Securities
Trading securities include equity mutual funds and exchange-traded funds. For these securities, we use quoted pricesin active markets for identical assets to determine fair value, thus these securities are considered Level 1 instruments.Our trading securities portfolio approximates a portion of the liability under the Management DeferredCompensation Plan (“MDCP”), a defined contribution plan. The corresponding deferred compensation liability of$84.7 million and $82.7 million as of October 2, 2011 and October 3, 2010, respectively, is included in accruedcompensation and related costs on the consolidated balance sheets. The changes in net unrealized holding gains/losses in the trading portfolio included in earnings for fiscal years 2011 and 2010 were a net loss of $2.1 million anda net gain of $4.1 million, respectively.
Derivative Assets and Liabilities
Derivative assets and liabilities include foreign currency forward contracts, commodity swaps and futures contracts.Where applicable, we use quoted prices in active markets for identical derivative assets and liabilities that are tradedon exchanges. Derivative assets and liabilities included in Level 2 are over-the-counter currency forward contractsand commodity swaps whose fair values are estimated using industry-standard valuation models. Such modelsproject future cash flows and discount the future amounts to a present value using market-based observable inputs,including interest rate curves and forward and spot prices for currencies and commodities.
Changes in Level 3 Instruments Measured at Fair Value on a Recurring Basis
Financial instruments measured using level 3 inputs described above are comprised entirely of our ARS. Changes inthis balance related primarily to calls of certain of our ARS. No transfers among the levels within the fair valuehierarchy occurred during fiscal 2011 or 2010.
58
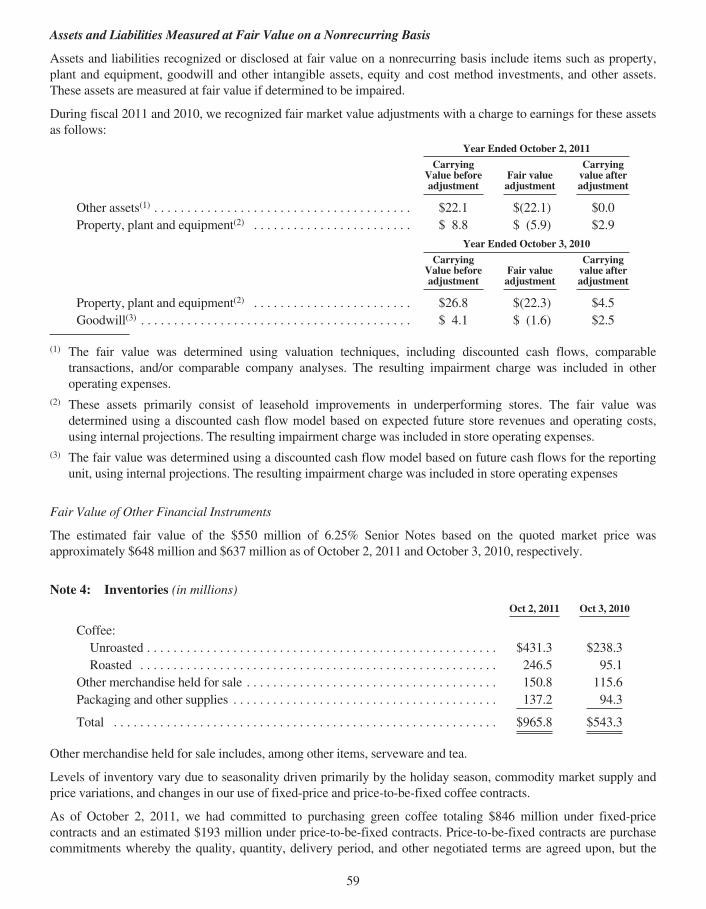
Assets and Liabilities Measured at Fair Value on a Nonrecurring Basis
Assets and liabilities recognized or disclosed at fair value on a nonrecurring basis include items such as property,plant and equipment, goodwill and other intangible assets, equity and cost method investments, and other assets.These assets are measured at fair value if determined to be impaired.
During fiscal 2011 and 2010, we recognized fair market value adjustments with a charge to earnings for these assetsas follows:
Year Ended October 2, 2011
CarryingValue beforeadjustment
Fair valueadjustment
Carryingvalue afteradjustment
Other assets(1) . . . . . . . . . . . . . . . . . . . . . . . . . . . . . . . . . . . . . . . $22.1 $(22.1) $0.0Property, plant and equipment(2) . . . . . . . . . . . . . . . . . . . . . . . . $ 8.8 $ (5.9) $2.9
Year Ended October 3, 2010
CarryingValue beforeadjustment
Fair valueadjustment
Carryingvalue afteradjustment
Property, plant and equipment(2) . . . . . . . . . . . . . . . . . . . . . . . . $26.8 $(22.3) $4.5Goodwill(3) . . . . . . . . . . . . . . . . . . . . . . . . . . . . . . . . . . . . . . . . . $ 4.1 $ (1.6) $2.5
(1) The fair value was determined using valuation techniques, including discounted cash flows, comparabletransactions, and/or comparable company analyses. The resulting impairment charge was included in otheroperating expenses.
(2) These assets primarily consist of leasehold improvements in underperforming stores. The fair value wasdetermined using a discounted cash flow model based on expected future store revenues and operating costs,using internal projections. The resulting impairment charge was included in store operating expenses.
(3) The fair value was determined using a discounted cash flow model based on future cash flows for the reportingunit, using internal projections. The resulting impairment charge was included in store operating expenses
Fair Value of Other Financial Instruments
The estimated fair value of the $550 million of 6.25% Senior Notes based on the quoted market price wasapproximately $648 million and $637 million as of October 2, 2011 and October 3, 2010, respectively.
Note 4: Inventories (in millions)Oct 2, 2011 Oct 3, 2010
Coffee:Unroasted . . . . . . . . . . . . . . . . . . . . . . . . . . . . . . . . . . . . . . . . . . . . . . . . . . . . . $431.3 $238.3Roasted . . . . . . . . . . . . . . . . . . . . . . . . . . . . . . . . . . . . . . . . . . . . . . . . . . . . . . 246.5 95.1
Other merchandise held for sale . . . . . . . . . . . . . . . . . . . . . . . . . . . . . . . . . . . . . . 150.8 115.6Packaging and other supplies . . . . . . . . . . . . . . . . . . . . . . . . . . . . . . . . . . . . . . . . 137.2 94.3
Total . . . . . . . . . . . . . . . . . . . . . . . . . . . . . . . . . . . . . . . . . . . . . . . . . . . . . . . . . . $965.8 $543.3
Other merchandise held for sale includes, among other items, serveware and tea.
Levels of inventory vary due to seasonality driven primarily by the holiday season, commodity market supply andprice variations, and changes in our use of fixed-price and price-to-be-fixed coffee contracts.
As of October 2, 2011, we had committed to purchasing green coffee totaling $846 million under fixed-pricecontracts and an estimated $193 million under price-to-be-fixed contracts. Price-to-be-fixed contracts are purchasecommitments whereby the quality, quantity, delivery period, and other negotiated terms are agreed upon, but the
59
date at which the base “C” coffee commodity price component will be fixed has not yet been established. For thesetypes of contracts, either Starbucks or the seller has the option to “fix” the base “C” coffee commodity price prior tothe delivery date. Until prices are fixed, we estimate the total cost of these purchase commitments. We believe,based on relationships established with our suppliers in the past, the risk of non-delivery on such purchasecommitments is remote.
Note 5: Equity and Cost Investments (in millions)
Oct 2, 2011 Oct 3, 2010
Equity method investments . . . . . . . . . . . . . . . . . . . . . . . . . . . . . . . . . . . . . . . . . $334.4 $308.1Cost method investments . . . . . . . . . . . . . . . . . . . . . . . . . . . . . . . . . . . . . . . . . . . 37.9 33.4
Total . . . . . . . . . . . . . . . . . . . . . . . . . . . . . . . . . . . . . . . . . . . . . . . . . . . . . . . . . . $372.3 $341.5
Equity Method Investments
As of October 2, 2011, we had a 50 percent ownership interest in each of the following international equityinvestees: Starbucks Coffee Korea Co., Ltd.; President Starbucks Coffee Taiwan Ltd.; Shanghai President CoffeeCo.; and Berjaya Starbucks Coffee Company Sdn. Bhd. (Malaysia). In addition, we had a 39.8 percent ownershipinterest in Starbucks Coffee Japan, Ltd. These international entities operate licensed Starbucks retail stores. We alsohave licensed the rights to produce and distribute Starbucks branded products to The North American CoffeePartnership with the Pepsi-Cola Company. We have a 50 percent ownership interest in The North America CoffeePartnership, which develops and distributes bottled Frappuccino® beverages, Starbucks DoubleShot® espressodrinks, and Seattle’s Best Coffee® ready-to-drink espresso beverages.
Our share of income and losses from our equity method investments is included in income from equity investees onthe consolidated statements of earnings. Also included in this line item is our proportionate share of gross marginresulting from coffee and other product sales to, and royalty and license fee revenues generated from, equityinvestees. Revenues generated from these related parties, net of eliminations, were $151.6 million, $125.7 million,and $125.3 million in fiscal years 2011, 2010, and 2009, respectively. Related costs of sales, net of eliminations,were $83.2 million, $65.3 million, and $64.9 million in fiscal years 2011, 2010, and 2009, respectively. As ofOctober 2, 2011 and October 3, 2010, there were $31.9 million and $31.4 million of accounts receivable from equityinvestees, respectively, on our consolidated balance sheets, primarily related to product sales and store license fees.
As of October 2, 2011, the aggregate market value of our investment in Starbucks Japan was approximately$334 million, determined based on its available quoted market price, which exceeds its carrying value of $182million.
Summarized combined financial information of our equity method investees, which represent 100% of theinvestees’ financial information (in millions):
Financial Position as of Oct 2, 2011 Oct 3, 2010
Current assets . . . . . . . . . . . . . . . . . . . . . . . . . . . . . . . . . . . . . . . . . . . . . . . . . . . . $476.9 $390.1Noncurrent assets . . . . . . . . . . . . . . . . . . . . . . . . . . . . . . . . . . . . . . . . . . . . . . . . . 651.4 570.3Current liabilities . . . . . . . . . . . . . . . . . . . . . . . . . . . . . . . . . . . . . . . . . . . . . . . . . 340.1 260.6Noncurrent liabilities . . . . . . . . . . . . . . . . . . . . . . . . . . . . . . . . . . . . . . . . . . . . . . 80.2 70.5
Results of Operations for Fiscal Year Ended Oct 2, 2011 Oct 3, 2010 Sep 27, 2009
Net revenues . . . . . . . . . . . . . . . . . . . . . . . . . . . . . . . . . . . . . . . . . $2,395.1 $2,128.0 $2,100.1Operating income . . . . . . . . . . . . . . . . . . . . . . . . . . . . . . . . . . . . . 277.0 245.3 192.5Net earnings . . . . . . . . . . . . . . . . . . . . . . . . . . . . . . . . . . . . . . . . . 231.1 205.1 155.8
60
Cost Method Investments
As of October 2, 2011, we had a $37.9 million investment of equity interests in entities that develop and operateStarbucks licensed retail stores in several global markets. We have the ability to acquire additional interests in someof these cost method investees at certain intervals. Depending on our total percentage of ownership interest and ourability to exercise significant influence over financial and operating policies, additional investments may require aretroactive application of the equity method of accounting.
Note 6: Property, Plant and Equipment (in millions)
Oct 2, 2011 Oct 3, 2010
Land . . . . . . . . . . . . . . . . . . . . . . . . . . . . . . . . . . . . . . . . . . . . . . . . . . . . . . . . . . . $ 44.8 $ 58.0Buildings . . . . . . . . . . . . . . . . . . . . . . . . . . . . . . . . . . . . . . . . . . . . . . . . . . . . . . . 218.5 265.7Leasehold improvements . . . . . . . . . . . . . . . . . . . . . . . . . . . . . . . . . . . . . . . . . . . 3,617.7 3,435.6Store equipment . . . . . . . . . . . . . . . . . . . . . . . . . . . . . . . . . . . . . . . . . . . . . . . . . . 1,101.8 1,047.7Roasting equipment . . . . . . . . . . . . . . . . . . . . . . . . . . . . . . . . . . . . . . . . . . . . . . . 295.1 290.6Furniture, fixtures and other . . . . . . . . . . . . . . . . . . . . . . . . . . . . . . . . . . . . . . . . . 757.8 617.5Work in progress . . . . . . . . . . . . . . . . . . . . . . . . . . . . . . . . . . . . . . . . . . . . . . . . . 127.4 173.6
Property, plant and equipment, gross . . . . . . . . . . . . . . . . . . . . . . . . . . . . . . . . . . 6,163.1 5,888.7Less accumulated depreciation . . . . . . . . . . . . . . . . . . . . . . . . . . . . . . . . . . . . . . (3,808.1) (3,472.2)
Property, plant and equipment, net . . . . . . . . . . . . . . . . . . . . . . . . . . . . . . . . . . . . $ 2,355.0 $ 2,416.5
On August 8, 2011, we completed the sale of two office buildings for gross consideration of $125 million. As aresult of this sale, we recognized a $30.2 million gain within operating income on the consolidated statements ofearnings.
Note 7: Other Intangible Assets and Goodwill
Other intangible assets (in millions):
Oct 2, 2011 Oct 3, 2010
Indefinite-lived intangibles . . . . . . . . . . . . . . . . . . . . . . . . . . . . . . . . . . . . . . . . . $ 68.6 $63.5
Definite-lived intangibles . . . . . . . . . . . . . . . . . . . . . . . . . . . . . . . . . . . . . . . . . . . 54.2 16.1Accumulated amortization . . . . . . . . . . . . . . . . . . . . . . . . . . . . . . . . . . . . . . . . . . (10.9) (8.8)
Definite-lived intangibles, net . . . . . . . . . . . . . . . . . . . . . . . . . . . . . . . . . . . . . . . 43.3 7.3
Total other intangible assets . . . . . . . . . . . . . . . . . . . . . . . . . . . . . . . . . . . . . . . . . $111.9 $70.8
Definite-lived intangibles approximate remaining weighted average useful lifein years . . . . . . . . . . . . . . . . . . . . . . . . . . . . . . . . . . . . . . . . . . . . . . . . . . . . . . 11 7
Amortization expense for definite-lived intangibles was $2.2 million, $1.2 million, and $1.7 million during fiscal2011, 2010, and 2009, respectively. Amortization expense is estimated to be approximately $4 million each yearfrom fiscal 2012 through fiscal 2016, and a total of approximately $22 million thereafter.
61
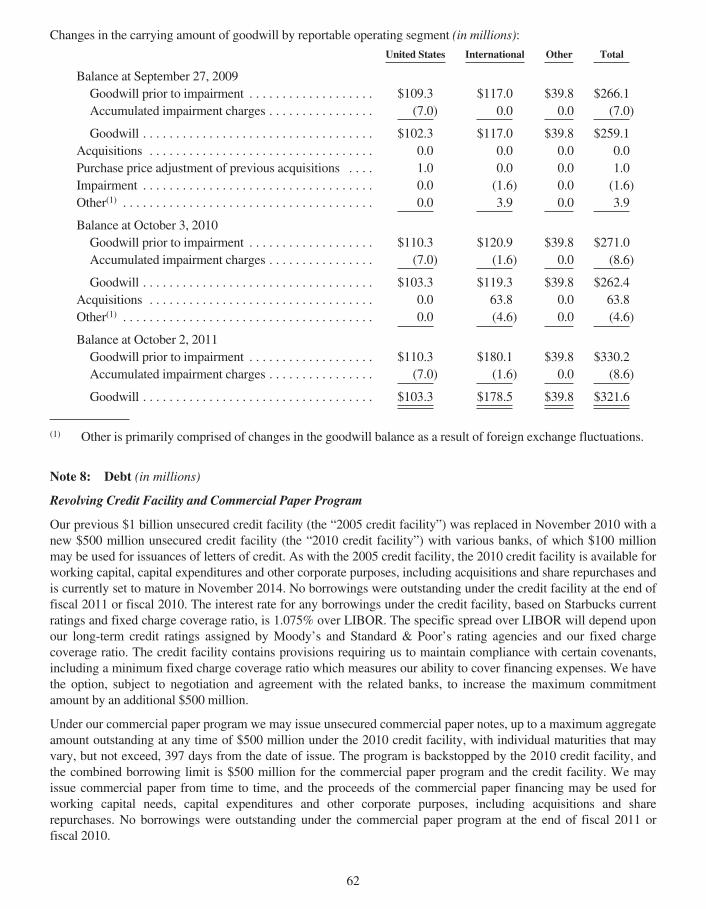
Changes in the carrying amount of goodwill by reportable operating segment (in millions):
United States International Other Total
Balance at September 27, 2009Goodwill prior to impairment . . . . . . . . . . . . . . . . . . . $109.3 $117.0 $39.8 $266.1Accumulated impairment charges . . . . . . . . . . . . . . . . (7.0) 0.0 0.0 (7.0)
Goodwill . . . . . . . . . . . . . . . . . . . . . . . . . . . . . . . . . . . $102.3 $117.0 $39.8 $259.1Acquisitions . . . . . . . . . . . . . . . . . . . . . . . . . . . . . . . . . . 0.0 0.0 0.0 0.0Purchase price adjustment of previous acquisitions . . . . 1.0 0.0 0.0 1.0Impairment . . . . . . . . . . . . . . . . . . . . . . . . . . . . . . . . . . . 0.0 (1.6) 0.0 (1.6)Other(1) . . . . . . . . . . . . . . . . . . . . . . . . . . . . . . . . . . . . . . 0.0 3.9 0.0 3.9
Balance at October 3, 2010Goodwill prior to impairment . . . . . . . . . . . . . . . . . . . $110.3 $120.9 $39.8 $271.0Accumulated impairment charges . . . . . . . . . . . . . . . . (7.0) (1.6) 0.0 (8.6)
Goodwill . . . . . . . . . . . . . . . . . . . . . . . . . . . . . . . . . . . $103.3 $119.3 $39.8 $262.4Acquisitions . . . . . . . . . . . . . . . . . . . . . . . . . . . . . . . . . . 0.0 63.8 0.0 63.8Other(1) . . . . . . . . . . . . . . . . . . . . . . . . . . . . . . . . . . . . . . 0.0 (4.6) 0.0 (4.6)
Balance at October 2, 2011Goodwill prior to impairment . . . . . . . . . . . . . . . . . . . $110.3 $180.1 $39.8 $330.2Accumulated impairment charges . . . . . . . . . . . . . . . . (7.0) (1.6) 0.0 (8.6)
Goodwill . . . . . . . . . . . . . . . . . . . . . . . . . . . . . . . . . . . $103.3 $178.5 $39.8 $321.6
(1) Other is primarily comprised of changes in the goodwill balance as a result of foreign exchange fluctuations.
Note 8: Debt (in millions)
Revolving Credit Facility and Commercial Paper Program
Our previous $1 billion unsecured credit facility (the “2005 credit facility”) was replaced in November 2010 with anew $500 million unsecured credit facility (the “2010 credit facility”) with various banks, of which $100 millionmay be used for issuances of letters of credit. As with the 2005 credit facility, the 2010 credit facility is available forworking capital, capital expenditures and other corporate purposes, including acquisitions and share repurchases andis currently set to mature in November 2014. No borrowings were outstanding under the credit facility at the end offiscal 2011 or fiscal 2010. The interest rate for any borrowings under the credit facility, based on Starbucks currentratings and fixed charge coverage ratio, is 1.075% over LIBOR. The specific spread over LIBOR will depend uponour long-term credit ratings assigned by Moody’s and Standard & Poor’s rating agencies and our fixed chargecoverage ratio. The credit facility contains provisions requiring us to maintain compliance with certain covenants,including a minimum fixed charge coverage ratio which measures our ability to cover financing expenses. We havethe option, subject to negotiation and agreement with the related banks, to increase the maximum commitmentamount by an additional $500 million.
Under our commercial paper program we may issue unsecured commercial paper notes, up to a maximum aggregateamount outstanding at any time of $500 million under the 2010 credit facility, with individual maturities that mayvary, but not exceed, 397 days from the date of issue. The program is backstopped by the 2010 credit facility, andthe combined borrowing limit is $500 million for the commercial paper program and the credit facility. We mayissue commercial paper from time to time, and the proceeds of the commercial paper financing may be used forworking capital needs, capital expenditures and other corporate purposes, including acquisitions and sharerepurchases. No borrowings were outstanding under the commercial paper program at the end of fiscal 2011 orfiscal 2010.
62
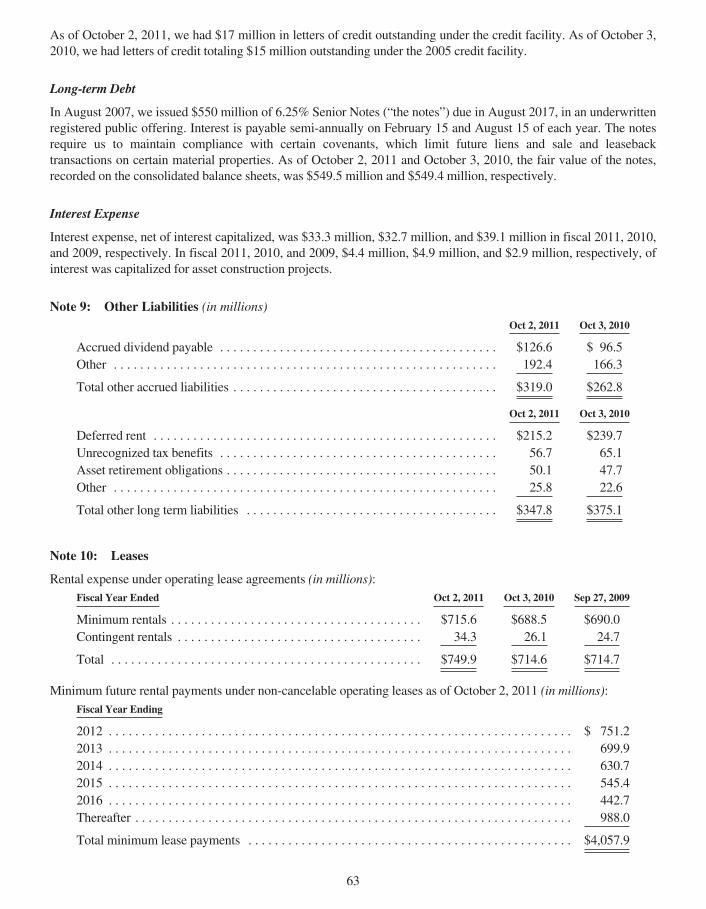
As of October 2, 2011, we had $17 million in letters of credit outstanding under the credit facility. As of October 3,2010, we had letters of credit totaling $15 million outstanding under the 2005 credit facility.
Long-term Debt
In August 2007, we issued $550 million of 6.25% Senior Notes (“the notes”) due in August 2017, in an underwrittenregistered public offering. Interest is payable semi-annually on February 15 and August 15 of each year. The notesrequire us to maintain compliance with certain covenants, which limit future liens and sale and leasebacktransactions on certain material properties. As of October 2, 2011 and October 3, 2010, the fair value of the notes,recorded on the consolidated balance sheets, was $549.5 million and $549.4 million, respectively.
Interest Expense
Interest expense, net of interest capitalized, was $33.3 million, $32.7 million, and $39.1 million in fiscal 2011, 2010,and 2009, respectively. In fiscal 2011, 2010, and 2009, $4.4 million, $4.9 million, and $2.9 million, respectively, ofinterest was capitalized for asset construction projects.
Note 9: Other Liabilities (in millions)Oct 2, 2011 Oct 3, 2010
Accrued dividend payable . . . . . . . . . . . . . . . . . . . . . . . . . . . . . . . . . . . . . . . . . . $126.6 $ 96.5Other . . . . . . . . . . . . . . . . . . . . . . . . . . . . . . . . . . . . . . . . . . . . . . . . . . . . . . . . . . 192.4 166.3
Total other accrued liabilities . . . . . . . . . . . . . . . . . . . . . . . . . . . . . . . . . . . . . . . . $319.0 $262.8
Oct 2, 2011 Oct 3, 2010
Deferred rent . . . . . . . . . . . . . . . . . . . . . . . . . . . . . . . . . . . . . . . . . . . . . . . . . . . . $215.2 $239.7Unrecognized tax benefits . . . . . . . . . . . . . . . . . . . . . . . . . . . . . . . . . . . . . . . . . . 56.7 65.1Asset retirement obligations . . . . . . . . . . . . . . . . . . . . . . . . . . . . . . . . . . . . . . . . . 50.1 47.7Other . . . . . . . . . . . . . . . . . . . . . . . . . . . . . . . . . . . . . . . . . . . . . . . . . . . . . . . . . . 25.8 22.6
Total other long term liabilities . . . . . . . . . . . . . . . . . . . . . . . . . . . . . . . . . . . . . . $347.8 $375.1
Note 10: Leases
Rental expense under operating lease agreements (in millions):Fiscal Year Ended Oct 2, 2011 Oct 3, 2010 Sep 27, 2009
Minimum rentals . . . . . . . . . . . . . . . . . . . . . . . . . . . . . . . . . . . . . . $715.6 $688.5 $690.0Contingent rentals . . . . . . . . . . . . . . . . . . . . . . . . . . . . . . . . . . . . . 34.3 26.1 24.7
Total . . . . . . . . . . . . . . . . . . . . . . . . . . . . . . . . . . . . . . . . . . . . . . . $749.9 $714.6 $714.7
Minimum future rental payments under non-cancelable operating leases as of October 2, 2011 (in millions):Fiscal Year Ending
2012 . . . . . . . . . . . . . . . . . . . . . . . . . . . . . . . . . . . . . . . . . . . . . . . . . . . . . . . . . . . . . . . . . . . . . . $ 751.22013 . . . . . . . . . . . . . . . . . . . . . . . . . . . . . . . . . . . . . . . . . . . . . . . . . . . . . . . . . . . . . . . . . . . . . . 699.92014 . . . . . . . . . . . . . . . . . . . . . . . . . . . . . . . . . . . . . . . . . . . . . . . . . . . . . . . . . . . . . . . . . . . . . . 630.72015 . . . . . . . . . . . . . . . . . . . . . . . . . . . . . . . . . . . . . . . . . . . . . . . . . . . . . . . . . . . . . . . . . . . . . . 545.42016 . . . . . . . . . . . . . . . . . . . . . . . . . . . . . . . . . . . . . . . . . . . . . . . . . . . . . . . . . . . . . . . . . . . . . . 442.7Thereafter . . . . . . . . . . . . . . . . . . . . . . . . . . . . . . . . . . . . . . . . . . . . . . . . . . . . . . . . . . . . . . . . . . 988.0
Total minimum lease payments . . . . . . . . . . . . . . . . . . . . . . . . . . . . . . . . . . . . . . . . . . . . . . . . . $4,057.9
63
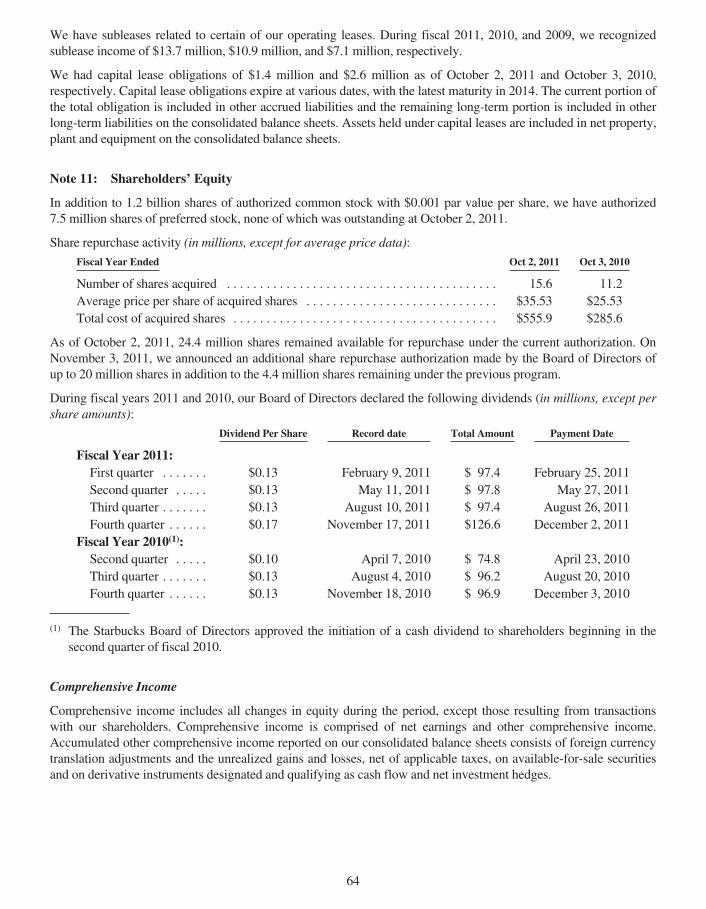
We have subleases related to certain of our operating leases. During fiscal 2011, 2010, and 2009, we recognizedsublease income of $13.7 million, $10.9 million, and $7.1 million, respectively.
We had capital lease obligations of $1.4 million and $2.6 million as of October 2, 2011 and October 3, 2010,respectively. Capital lease obligations expire at various dates, with the latest maturity in 2014. The current portion ofthe total obligation is included in other accrued liabilities and the remaining long-term portion is included in otherlong-term liabilities on the consolidated balance sheets. Assets held under capital leases are included in net property,plant and equipment on the consolidated balance sheets.
Note 11: Shareholders’ Equity
In addition to 1.2 billion shares of authorized common stock with $0.001 par value per share, we have authorized7.5 million shares of preferred stock, none of which was outstanding at October 2, 2011.
Share repurchase activity (in millions, except for average price data):
Fiscal Year Ended Oct 2, 2011 Oct 3, 2010
Number of shares acquired . . . . . . . . . . . . . . . . . . . . . . . . . . . . . . . . . . . . . . . . . 15.6 11.2Average price per share of acquired shares . . . . . . . . . . . . . . . . . . . . . . . . . . . . . $35.53 $25.53Total cost of acquired shares . . . . . . . . . . . . . . . . . . . . . . . . . . . . . . . . . . . . . . . . $555.9 $285.6
As of October 2, 2011, 24.4 million shares remained available for repurchase under the current authorization. OnNovember 3, 2011, we announced an additional share repurchase authorization made by the Board of Directors ofup to 20 million shares in addition to the 4.4 million shares remaining under the previous program.
During fiscal years 2011 and 2010, our Board of Directors declared the following dividends (in millions, except pershare amounts):
Dividend Per Share Record date Total Amount Payment Date
Fiscal Year 2011:First quarter . . . . . . . $0.13 February 9, 2011 $ 97.4 February 25, 2011Second quarter . . . . . $0.13 May 11, 2011 $ 97.8 May 27, 2011Third quarter . . . . . . . $0.13 August 10, 2011 $ 97.4 August 26, 2011Fourth quarter . . . . . . $0.17 November 17, 2011 $126.6 December 2, 2011
Fiscal Year 2010(1):Second quarter . . . . . $0.10 April 7, 2010 $ 74.8 April 23, 2010Third quarter . . . . . . . $0.13 August 4, 2010 $ 96.2 August 20, 2010Fourth quarter . . . . . . $0.13 November 18, 2010 $ 96.9 December 3, 2010
(1) The Starbucks Board of Directors approved the initiation of a cash dividend to shareholders beginning in thesecond quarter of fiscal 2010.
Comprehensive Income
Comprehensive income includes all changes in equity during the period, except those resulting from transactionswith our shareholders. Comprehensive income is comprised of net earnings and other comprehensive income.Accumulated other comprehensive income reported on our consolidated balance sheets consists of foreign currencytranslation adjustments and the unrealized gains and losses, net of applicable taxes, on available-for-sale securitiesand on derivative instruments designated and qualifying as cash flow and net investment hedges.
64
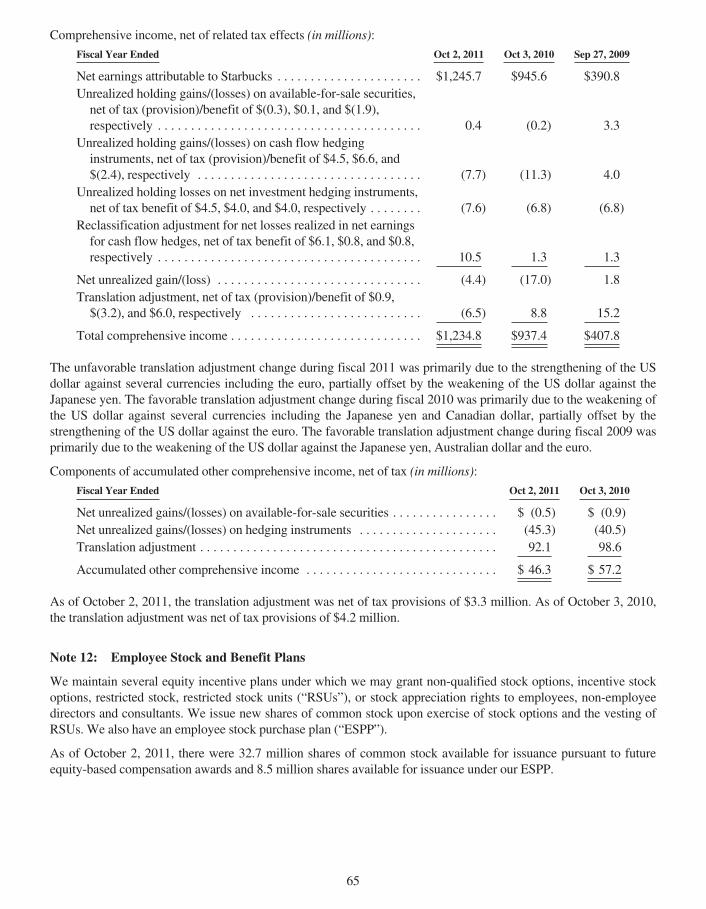
Comprehensive income, net of related tax effects (in millions):
Fiscal Year Ended Oct 2, 2011 Oct 3, 2010 Sep 27, 2009
Net earnings attributable to Starbucks . . . . . . . . . . . . . . . . . . . . . . $1,245.7 $945.6 $390.8Unrealized holding gains/(losses) on available-for-sale securities,net of tax (provision)/benefit of $(0.3), $0.1, and $(1.9),respectively . . . . . . . . . . . . . . . . . . . . . . . . . . . . . . . . . . . . . . . . 0.4 (0.2) 3.3
Unrealized holding gains/(losses) on cash flow hedginginstruments, net of tax (provision)/benefit of $4.5, $6.6, and$(2.4), respectively . . . . . . . . . . . . . . . . . . . . . . . . . . . . . . . . . . (7.7) (11.3) 4.0
Unrealized holding losses on net investment hedging instruments,net of tax benefit of $4.5, $4.0, and $4.0, respectively . . . . . . . . (7.6) (6.8) (6.8)
Reclassification adjustment for net losses realized in net earningsfor cash flow hedges, net of tax benefit of $6.1, $0.8, and $0.8,respectively . . . . . . . . . . . . . . . . . . . . . . . . . . . . . . . . . . . . . . . . 10.5 1.3 1.3
Net unrealized gain/(loss) . . . . . . . . . . . . . . . . . . . . . . . . . . . . . . . (4.4) (17.0) 1.8Translation adjustment, net of tax (provision)/benefit of $0.9,$(3.2), and $6.0, respectively . . . . . . . . . . . . . . . . . . . . . . . . . . (6.5) 8.8 15.2
Total comprehensive income . . . . . . . . . . . . . . . . . . . . . . . . . . . . . $1,234.8 $937.4 $407.8
The unfavorable translation adjustment change during fiscal 2011 was primarily due to the strengthening of the USdollar against several currencies including the euro, partially offset by the weakening of the US dollar against theJapanese yen. The favorable translation adjustment change during fiscal 2010 was primarily due to the weakening ofthe US dollar against several currencies including the Japanese yen and Canadian dollar, partially offset by thestrengthening of the US dollar against the euro. The favorable translation adjustment change during fiscal 2009 wasprimarily due to the weakening of the US dollar against the Japanese yen, Australian dollar and the euro.
Components of accumulated other comprehensive income, net of tax (in millions):
Fiscal Year Ended Oct 2, 2011 Oct 3, 2010
Net unrealized gains/(losses) on available-for-sale securities . . . . . . . . . . . . . . . . $ (0.5) $ (0.9)Net unrealized gains/(losses) on hedging instruments . . . . . . . . . . . . . . . . . . . . . (45.3) (40.5)Translation adjustment . . . . . . . . . . . . . . . . . . . . . . . . . . . . . . . . . . . . . . . . . . . . . 92.1 98.6
Accumulated other comprehensive income . . . . . . . . . . . . . . . . . . . . . . . . . . . . . $ 46.3 $ 57.2
As of October 2, 2011, the translation adjustment was net of tax provisions of $3.3 million. As of October 3, 2010,the translation adjustment was net of tax provisions of $4.2 million.
Note 12: Employee Stock and Benefit Plans
We maintain several equity incentive plans under which we may grant non-qualified stock options, incentive stockoptions, restricted stock, restricted stock units (“RSUs”), or stock appreciation rights to employees, non-employeedirectors and consultants. We issue new shares of common stock upon exercise of stock options and the vesting ofRSUs. We also have an employee stock purchase plan (“ESPP”).
As of October 2, 2011, there were 32.7 million shares of common stock available for issuance pursuant to futureequity-based compensation awards and 8.5 million shares available for issuance under our ESPP.
65
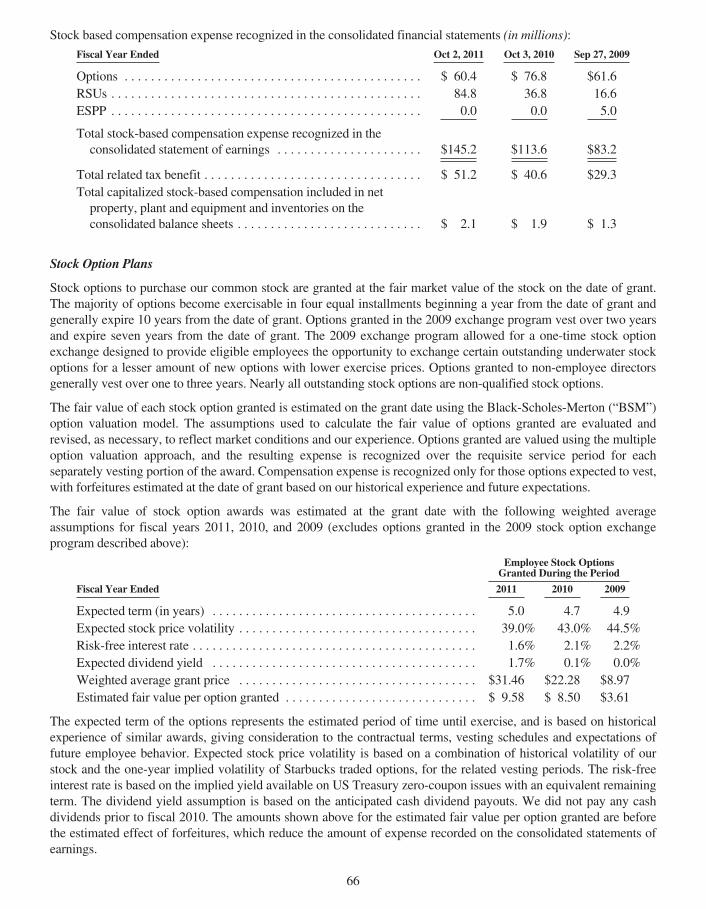
Stock based compensation expense recognized in the consolidated financial statements (in millions):
Fiscal Year Ended Oct 2, 2011 Oct 3, 2010 Sep 27, 2009
Options . . . . . . . . . . . . . . . . . . . . . . . . . . . . . . . . . . . . . . . . . . . . . $ 60.4 $ 76.8 $61.6RSUs . . . . . . . . . . . . . . . . . . . . . . . . . . . . . . . . . . . . . . . . . . . . . . . 84.8 36.8 16.6ESPP . . . . . . . . . . . . . . . . . . . . . . . . . . . . . . . . . . . . . . . . . . . . . . . 0.0 0.0 5.0
Total stock-based compensation expense recognized in theconsolidated statement of earnings . . . . . . . . . . . . . . . . . . . . . . $145.2 $113.6 $83.2
Total related tax benefit . . . . . . . . . . . . . . . . . . . . . . . . . . . . . . . . . $ 51.2 $ 40.6 $29.3Total capitalized stock-based compensation included in netproperty, plant and equipment and inventories on theconsolidated balance sheets . . . . . . . . . . . . . . . . . . . . . . . . . . . . $ 2.1 $ 1.9 $ 1.3
Stock Option Plans
Stock options to purchase our common stock are granted at the fair market value of the stock on the date of grant.The majority of options become exercisable in four equal installments beginning a year from the date of grant andgenerally expire 10 years from the date of grant. Options granted in the 2009 exchange program vest over two yearsand expire seven years from the date of grant. The 2009 exchange program allowed for a one-time stock optionexchange designed to provide eligible employees the opportunity to exchange certain outstanding underwater stockoptions for a lesser amount of new options with lower exercise prices. Options granted to non-employee directorsgenerally vest over one to three years. Nearly all outstanding stock options are non-qualified stock options.
The fair value of each stock option granted is estimated on the grant date using the Black-Scholes-Merton (“BSM”)option valuation model. The assumptions used to calculate the fair value of options granted are evaluated andrevised, as necessary, to reflect market conditions and our experience. Options granted are valued using the multipleoption valuation approach, and the resulting expense is recognized over the requisite service period for eachseparately vesting portion of the award. Compensation expense is recognized only for those options expected to vest,with forfeitures estimated at the date of grant based on our historical experience and future expectations.
The fair value of stock option awards was estimated at the grant date with the following weighted averageassumptions for fiscal years 2011, 2010, and 2009 (excludes options granted in the 2009 stock option exchangeprogram described above):
Employee Stock OptionsGranted During the Period
Fiscal Year Ended 2011 2010 2009
Expected term (in years) . . . . . . . . . . . . . . . . . . . . . . . . . . . . . . . . . . . . . . . . 5.0 4.7 4.9Expected stock price volatility . . . . . . . . . . . . . . . . . . . . . . . . . . . . . . . . . . . . 39.0% 43.0% 44.5%Risk-free interest rate . . . . . . . . . . . . . . . . . . . . . . . . . . . . . . . . . . . . . . . . . . . 1.6% 2.1% 2.2%Expected dividend yield . . . . . . . . . . . . . . . . . . . . . . . . . . . . . . . . . . . . . . . . 1.7% 0.1% 0.0%Weighted average grant price . . . . . . . . . . . . . . . . . . . . . . . . . . . . . . . . . . . . $31.46 $22.28 $8.97Estimated fair value per option granted . . . . . . . . . . . . . . . . . . . . . . . . . . . . . $ 9.58 $ 8.50 $3.61
The expected term of the options represents the estimated period of time until exercise, and is based on historicalexperience of similar awards, giving consideration to the contractual terms, vesting schedules and expectations offuture employee behavior. Expected stock price volatility is based on a combination of historical volatility of ourstock and the one-year implied volatility of Starbucks traded options, for the related vesting periods. The risk-freeinterest rate is based on the implied yield available on US Treasury zero-coupon issues with an equivalent remainingterm. The dividend yield assumption is based on the anticipated cash dividend payouts. We did not pay any cashdividends prior to fiscal 2010. The amounts shown above for the estimated fair value per option granted are beforethe estimated effect of forfeitures, which reduce the amount of expense recorded on the consolidated statements ofearnings.
66
The BSM option valuation model was developed for use in estimating the fair value of traded options, which haveno vesting restrictions and are fully transferable. Our employee stock options have characteristics significantlydifferent from those of traded options, and changes in the subjective input assumptions can materially affect the fairvalue estimate. Because our stock options do not trade on a secondary exchange, employees do not derive a benefitfrom holding stock options unless there is an increase, above the grant price, in the market price of the our stock.Such an increase in stock price would benefit all shareholders commensurately.
Stock option transactions from September 28, 2008, through October 2, 2011 (in millions, except per share andcontractual life amounts):
SharesSubject toOptions
WeightedAverageExercisePrice
per Share
WeightedAverage
RemainingContractualLife (Years)
AggregateIntrinsicValue
Outstanding, September 28, 2008 . . . . . . . . . . . . . . . . . . . . . . . . . 63.0 $20.96 5.7 $115Granted . . . . . . . . . . . . . . . . . . . . . . . . . . . . . . . . . . . . . . . . . . . . . 30.9 8.97Granted under option exchange program . . . . . . . . . . . . . . . . . . . . 4.7 14.92Exercised . . . . . . . . . . . . . . . . . . . . . . . . . . . . . . . . . . . . . . . . . . . (7.2) 7.31Expired/forfeited . . . . . . . . . . . . . . . . . . . . . . . . . . . . . . . . . . . . . . (13.5) 18.99Cancelled under option exchange program . . . . . . . . . . . . . . . . . . (14.3) 29.34
Outstanding, September 27, 2009 . . . . . . . . . . . . . . . . . . . . . . . . . 63.6 14.75 6.7 442Granted . . . . . . . . . . . . . . . . . . . . . . . . . . . . . . . . . . . . . . . . . . . . . 14.9 22.28Exercised . . . . . . . . . . . . . . . . . . . . . . . . . . . . . . . . . . . . . . . . . . . (9.6) 11.94Expired/forfeited . . . . . . . . . . . . . . . . . . . . . . . . . . . . . . . . . . . . . . (8.2) 18.73
Outstanding, October 3, 2010 . . . . . . . . . . . . . . . . . . . . . . . . . . . . 60.7 16.52 6.6 611Granted . . . . . . . . . . . . . . . . . . . . . . . . . . . . . . . . . . . . . . . . . . . . . 4.3 31.46Exercised . . . . . . . . . . . . . . . . . . . . . . . . . . . . . . . . . . . . . . . . . . . (16.1) 14.40Expired/forfeited . . . . . . . . . . . . . . . . . . . . . . . . . . . . . . . . . . . . . . (3.6) 18.06
Outstanding, October 2, 2011 . . . . . . . . . . . . . . . . . . . . . . . . . . . . 45.3 18.57 6.4 848
Exercisable, October 2, 2011 . . . . . . . . . . . . . . . . . . . . . . . . . . . . . 23.2 18.81 5.0 272Vested and expected to vest, October 2, 2011 . . . . . . . . . . . . . . . . 42.9 18.48 6.3 571
The aggregate intrinsic value in the table above is the amount by which the market value of the underlying stockexceeded the exercise price of outstanding options, is before applicable income taxes and represents the amountoptionees would have realized if all in-the-money options had been exercised on the last business day of the periodindicated.
The following is a summary of stock options outstanding at the end of fiscal 2011 (shares in millions):
Options Outstanding Options Exercisable
Range of PricesNumber ofOptions
WeightedAverage
RemainingContractual
Life
WeightedAverageExercisePrice
Number ofOptions
WeightedAverageExercisePrice
Under $10.00 . . . . . . . . . . . . . . . . . . . . . . . . . . . . . . 13.9 7.0 $ 8.65 5.0 $ 8.65$10.01 - $20.00 . . . . . . . . . . . . . . . . . . . . . . . . . . . . . 8.7 3.6 14.14 8.5 14.65$20.01 - $30.00 . . . . . . . . . . . . . . . . . . . . . . . . . . . . . 15.0 7.0 23.09 6.1 24.10Over $30.00 . . . . . . . . . . . . . . . . . . . . . . . . . . . . . . . 7.7 7.0 32.50 3.6 33.62
45.3 6.4 $18.57 23.2 $18.81
67
As of October 2, 2011, total unrecognized stock-based compensation expense, net of estimated forfeitures, related tononvested stock options was approximately $44 million, before income taxes, and is expected to be recognized overa weighted average period of approximately 2.4 years. The total intrinsic value of stock options exercised was $323million, $118 million, and $44 million during fiscal years 2011, 2010, and 2009, respectively. The total fair value ofoptions vested was $126 million, $108 million, and $75 million during fiscal years 2011, 2010, and 2009,respectively.
RSUs
We have both time-vested and performance-based RSUs. Time-vested RSUs are awarded to eligible employees andentitle the grantee to receive shares of common stock at the end of a vesting period, subject solely to the employee’scontinuing employment. Our performance-based RSUs are awarded to eligible employees and entitle the grantee toreceive shares of common stock if we achieve specified performance goals for the full fiscal year in the year ofaward and the grantee remains employed during the subsequent vesting period. The fair value of RSUs is based onthe closing price of Starbucks common stock on the award date. Expense for performance-based RSUs is recognizedwhen it is probable the performance goal will be achieved.
RSU transactions from September 28, 2008 through October 2, 2011 (in millions, except per share and contractuallife amounts):
Numberof
Shares
WeightedAverage
Grant DateFair Valueper Share
WeightedAverage
RemainingContractualLife (Years)
AggregateIntrinsicValue
Nonvested, September 28, 2008 . . . . . . . . . . . . . . . . . . 2.0 $17.36 2.5 $ 31Granted . . . . . . . . . . . . . . . . . . . . . . . . . . . . . . . . . . . . . 3.3 8.78Vested . . . . . . . . . . . . . . . . . . . . . . . . . . . . . . . . . . . . . . 0.0 0.00Forfeited/Cancelled . . . . . . . . . . . . . . . . . . . . . . . . . . . . (0.9) 13.94
Nonvested, September 27, 2009 . . . . . . . . . . . . . . . . . . 4.4 11.55 1.6 88Granted . . . . . . . . . . . . . . . . . . . . . . . . . . . . . . . . . . . . . 2.3 22.27Vested . . . . . . . . . . . . . . . . . . . . . . . . . . . . . . . . . . . . . . (0.7) 16.35Forfeited/Cancelled . . . . . . . . . . . . . . . . . . . . . . . . . . . . (0.6) 12.27
Nonvested, October 3, 2010 . . . . . . . . . . . . . . . . . . . . . 5.4 13.55 1.1 141Granted . . . . . . . . . . . . . . . . . . . . . . . . . . . . . . . . . . . . . 5.4 31.06Vested . . . . . . . . . . . . . . . . . . . . . . . . . . . . . . . . . . . . . . (1.7) 9.40Forfeited/Cancelled . . . . . . . . . . . . . . . . . . . . . . . . . . . . (0.8) 25.68
Nonvested, October 2, 2011 . . . . . . . . . . . . . . . . . . . . . 8.3 23.11 0.8 309
As of October 2, 2011, total unrecognized stock-based compensation expense related to nonvested RSUs, net ofestimated forfeitures, was approximately $71 million, before income taxes, and is expected to be recognized over aweighted average period of approximately 2.2 years.
ESPP
Our ESPP allows eligible employees to contribute up to 10% of their base earnings toward the quarterly purchase ofour common stock, subject to an annual maximum dollar amount. The purchase price is 95% of the fair market valueof the stock on the last business day of the quarterly offering period. The number of shares issued under our ESPPwas 0.5 million in fiscal 2011.
Deferred Stock Plan
We have a deferred stock plan for certain non-employees that enables participants in the plan to defer receipt ofownership of common shares from the exercise of nonqualified stock options. The minimum deferral period is five
68
years. As of October 2, 2011 and October 3, 2010, 3.4 million shares were deferred under the terms of this plan. Therights to receive these shares, represented by common stock units, are included in the calculation of basic and dilutedearnings per share as common stock equivalents. No new initial deferrals are permitted under this plan; the planpermits re-deferrals of previously deferred shares.
Defined Contribution Plans
We maintain voluntary defined contribution plans, both qualified and non-qualified, covering eligible employees asdefined in the plan documents. Participating employees may elect to defer and contribute a portion of their eligiblecompensation to the plans up to limits stated in the plan documents, not to exceed the dollar amounts set byapplicable laws.
Our matching contributions to all US and non-US plans were $45.5 million, $23.5 million, and $19.7 million infiscal years 2011, 2010, and 2009, respectively.
Note 13: Income Taxes
The components of earnings before income taxes were as follows:Fiscal Year Ended Oct 2, 2011 Oct 3, 2010 Sep 27, 2009
United States . . . . . . . . . . . . . . . . . . . . . . . . . . . . . . . . . . . . . . . . . $1,523.4 $1,308.9 $494.6Foreign . . . . . . . . . . . . . . . . . . . . . . . . . . . . . . . . . . . . . . . . . . . . . 287.7 128.1 65.3
Total earnings before income taxes . . . . . . . . . . . . . . . . . . . . . . . . $1,811.1 $1,437.0 $559.9
Provision for income taxes (in millions):Fiscal Year Ended Oct 2, 2011 Oct 3, 2010 Sep 27, 2009
Current taxes:Federal . . . . . . . . . . . . . . . . . . . . . . . . . . . . . . . . . . . . . . . . . . . . . $344.7 $457.5 $165.3State . . . . . . . . . . . . . . . . . . . . . . . . . . . . . . . . . . . . . . . . . . . . . . . 61.2 79.6 35.0Foreign . . . . . . . . . . . . . . . . . . . . . . . . . . . . . . . . . . . . . . . . . . . . . 37.3 38.3 26.3
Total current taxes . . . . . . . . . . . . . . . . . . . . . . . . . . . . . . . . . . . . . 443.2 575.4 226.6Deferred taxes:Federal . . . . . . . . . . . . . . . . . . . . . . . . . . . . . . . . . . . . . . . . . . . . . 111.6 (76.0) (48.3)State . . . . . . . . . . . . . . . . . . . . . . . . . . . . . . . . . . . . . . . . . . . . . . . 8.3 (9.3) (10.7)Foreign . . . . . . . . . . . . . . . . . . . . . . . . . . . . . . . . . . . . . . . . . . . . . 0.0 (1.4) 0.8
Total deferred taxes . . . . . . . . . . . . . . . . . . . . . . . . . . . . . . . . . . . . 119.9 (86.7) (58.2)
Total provision for income taxes . . . . . . . . . . . . . . . . . . . . . . . . . . $563.1 $488.7 $168.4
Reconciliation of the statutory US federal income tax rate with our effective income tax rate:Fiscal Year Ended Oct 2, 2011 Oct 3, 2010 Sep 27, 2009
Statutory rate . . . . . . . . . . . . . . . . . . . . . . . . . . . . . . . . . . . . . . . . . 35.0% 35.0% 35.0%State income taxes, net of federal income tax benefit . . . . . . . . . . 2.5% 2.5% 2.6%Benefits and taxes related to foreign operations . . . . . . . . . . . . . . (3.1)% (2.5)% (2.3)%Domestic production activity deduction . . . . . . . . . . . . . . . . . . . . (0.8)% (0.9)% (2.3)%Credit resulting from employment audit . . . . . . . . . . . . . . . . . . . . 0.0% 0.0% (2.0)%Other, net(1) . . . . . . . . . . . . . . . . . . . . . . . . . . . . . . . . . . . . . . . . . . (2.5)% (0.1)% (0.9)%
Effective tax rate . . . . . . . . . . . . . . . . . . . . . . . . . . . . . . . . . . . . . . 31.1% 34.0% 30.1%
(1) Fiscal 2011 includes a benefit of 0.9% related to the acquisition of the remaining ownership interest inSwitzerland and Austria.
69
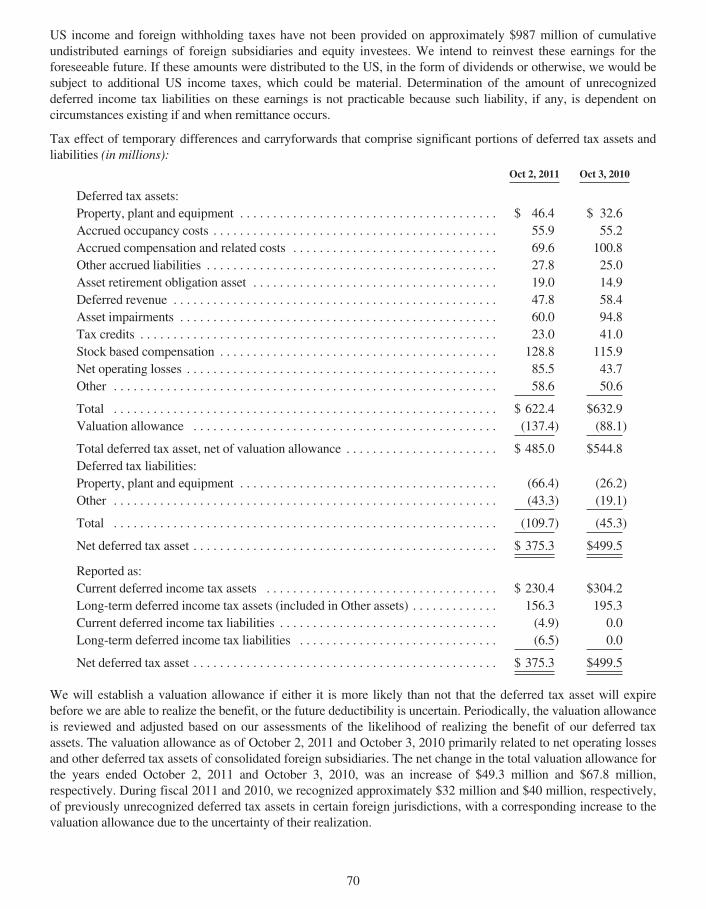
US income and foreign withholding taxes have not been provided on approximately $987 million of cumulativeundistributed earnings of foreign subsidiaries and equity investees. We intend to reinvest these earnings for theforeseeable future. If these amounts were distributed to the US, in the form of dividends or otherwise, we would besubject to additional US income taxes, which could be material. Determination of the amount of unrecognizeddeferred income tax liabilities on these earnings is not practicable because such liability, if any, is dependent oncircumstances existing if and when remittance occurs.
Tax effect of temporary differences and carryforwards that comprise significant portions of deferred tax assets andliabilities (in millions):
Oct 2, 2011 Oct 3, 2010
Deferred tax assets:Property, plant and equipment . . . . . . . . . . . . . . . . . . . . . . . . . . . . . . . . . . . . . . . $ 46.4 $ 32.6Accrued occupancy costs . . . . . . . . . . . . . . . . . . . . . . . . . . . . . . . . . . . . . . . . . . . 55.9 55.2Accrued compensation and related costs . . . . . . . . . . . . . . . . . . . . . . . . . . . . . . . 69.6 100.8Other accrued liabilities . . . . . . . . . . . . . . . . . . . . . . . . . . . . . . . . . . . . . . . . . . . . 27.8 25.0Asset retirement obligation asset . . . . . . . . . . . . . . . . . . . . . . . . . . . . . . . . . . . . . 19.0 14.9Deferred revenue . . . . . . . . . . . . . . . . . . . . . . . . . . . . . . . . . . . . . . . . . . . . . . . . . 47.8 58.4Asset impairments . . . . . . . . . . . . . . . . . . . . . . . . . . . . . . . . . . . . . . . . . . . . . . . . 60.0 94.8Tax credits . . . . . . . . . . . . . . . . . . . . . . . . . . . . . . . . . . . . . . . . . . . . . . . . . . . . . . 23.0 41.0Stock based compensation . . . . . . . . . . . . . . . . . . . . . . . . . . . . . . . . . . . . . . . . . . 128.8 115.9Net operating losses . . . . . . . . . . . . . . . . . . . . . . . . . . . . . . . . . . . . . . . . . . . . . . . 85.5 43.7Other . . . . . . . . . . . . . . . . . . . . . . . . . . . . . . . . . . . . . . . . . . . . . . . . . . . . . . . . . . 58.6 50.6
Total . . . . . . . . . . . . . . . . . . . . . . . . . . . . . . . . . . . . . . . . . . . . . . . . . . . . . . . . . . $ 622.4 $632.9Valuation allowance . . . . . . . . . . . . . . . . . . . . . . . . . . . . . . . . . . . . . . . . . . . . . . (137.4) (88.1)
Total deferred tax asset, net of valuation allowance . . . . . . . . . . . . . . . . . . . . . . . $ 485.0 $544.8Deferred tax liabilities:Property, plant and equipment . . . . . . . . . . . . . . . . . . . . . . . . . . . . . . . . . . . . . . . (66.4) (26.2)Other . . . . . . . . . . . . . . . . . . . . . . . . . . . . . . . . . . . . . . . . . . . . . . . . . . . . . . . . . . (43.3) (19.1)
Total . . . . . . . . . . . . . . . . . . . . . . . . . . . . . . . . . . . . . . . . . . . . . . . . . . . . . . . . . . (109.7) (45.3)
Net deferred tax asset . . . . . . . . . . . . . . . . . . . . . . . . . . . . . . . . . . . . . . . . . . . . . . $ 375.3 $499.5
Reported as:Current deferred income tax assets . . . . . . . . . . . . . . . . . . . . . . . . . . . . . . . . . . . $ 230.4 $304.2Long-term deferred income tax assets (included in Other assets) . . . . . . . . . . . . . 156.3 195.3Current deferred income tax liabilities . . . . . . . . . . . . . . . . . . . . . . . . . . . . . . . . . (4.9) 0.0Long-term deferred income tax liabilities . . . . . . . . . . . . . . . . . . . . . . . . . . . . . . (6.5) 0.0
Net deferred tax asset . . . . . . . . . . . . . . . . . . . . . . . . . . . . . . . . . . . . . . . . . . . . . . $ 375.3 $499.5
We will establish a valuation allowance if either it is more likely than not that the deferred tax asset will expirebefore we are able to realize the benefit, or the future deductibility is uncertain. Periodically, the valuation allowanceis reviewed and adjusted based on our assessments of the likelihood of realizing the benefit of our deferred taxassets. The valuation allowance as of October 2, 2011 and October 3, 2010 primarily related to net operating lossesand other deferred tax assets of consolidated foreign subsidiaries. The net change in the total valuation allowance forthe years ended October 2, 2011 and October 3, 2010, was an increase of $49.3 million and $67.8 million,respectively. During fiscal 2011 and 2010, we recognized approximately $32 million and $40 million, respectively,of previously unrecognized deferred tax assets in certain foreign jurisdictions, with a corresponding increase to thevaluation allowance due to the uncertainty of their realization.
70
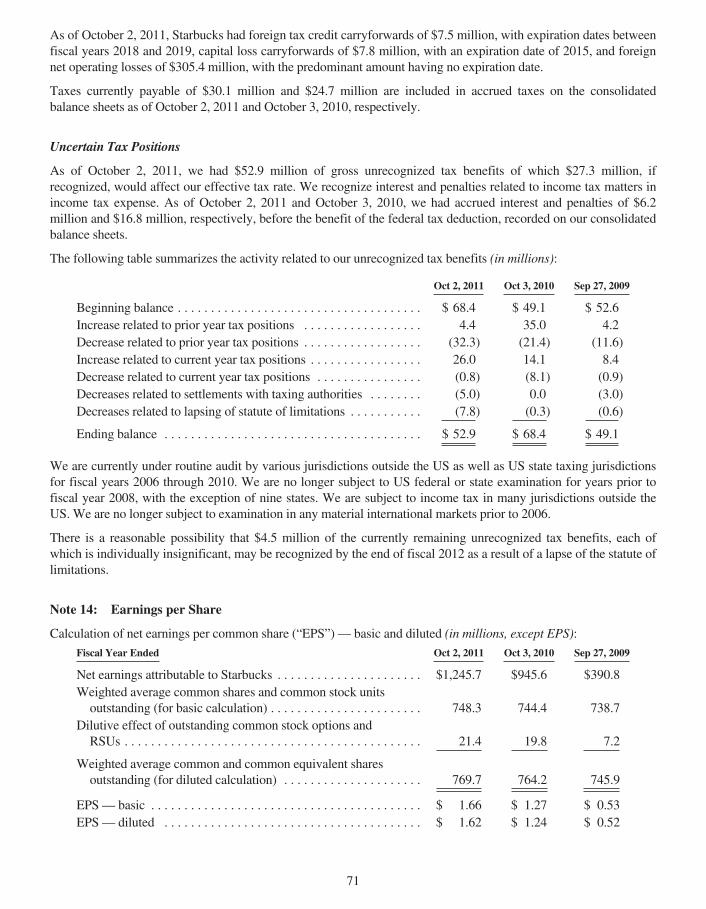
As of October 2, 2011, Starbucks had foreign tax credit carryforwards of $7.5 million, with expiration dates betweenfiscal years 2018 and 2019, capital loss carryforwards of $7.8 million, with an expiration date of 2015, and foreignnet operating losses of $305.4 million, with the predominant amount having no expiration date.
Taxes currently payable of $30.1 million and $24.7 million are included in accrued taxes on the consolidatedbalance sheets as of October 2, 2011 and October 3, 2010, respectively.
Uncertain Tax Positions
As of October 2, 2011, we had $52.9 million of gross unrecognized tax benefits of which $27.3 million, ifrecognized, would affect our effective tax rate. We recognize interest and penalties related to income tax matters inincome tax expense. As of October 2, 2011 and October 3, 2010, we had accrued interest and penalties of $6.2million and $16.8 million, respectively, before the benefit of the federal tax deduction, recorded on our consolidatedbalance sheets.
The following table summarizes the activity related to our unrecognized tax benefits (in millions):
Oct 2, 2011 Oct 3, 2010 Sep 27, 2009
Beginning balance . . . . . . . . . . . . . . . . . . . . . . . . . . . . . . . . . . . . . $ 68.4 $ 49.1 $ 52.6Increase related to prior year tax positions . . . . . . . . . . . . . . . . . . 4.4 35.0 4.2Decrease related to prior year tax positions . . . . . . . . . . . . . . . . . . (32.3) (21.4) (11.6)Increase related to current year tax positions . . . . . . . . . . . . . . . . . 26.0 14.1 8.4Decrease related to current year tax positions . . . . . . . . . . . . . . . . (0.8) (8.1) (0.9)Decreases related to settlements with taxing authorities . . . . . . . . (5.0) 0.0 (3.0)Decreases related to lapsing of statute of limitations . . . . . . . . . . . (7.8) (0.3) (0.6)
Ending balance . . . . . . . . . . . . . . . . . . . . . . . . . . . . . . . . . . . . . . . $ 52.9 $ 68.4 $ 49.1
We are currently under routine audit by various jurisdictions outside the US as well as US state taxing jurisdictionsfor fiscal years 2006 through 2010. We are no longer subject to US federal or state examination for years prior tofiscal year 2008, with the exception of nine states. We are subject to income tax in many jurisdictions outside theUS. We are no longer subject to examination in any material international markets prior to 2006.
There is a reasonable possibility that $4.5 million of the currently remaining unrecognized tax benefits, each ofwhich is individually insignificant, may be recognized by the end of fiscal 2012 as a result of a lapse of the statute oflimitations.
Note 14: Earnings per Share
Calculation of net earnings per common share (“EPS”) — basic and diluted (in millions, except EPS):
Fiscal Year Ended Oct 2, 2011 Oct 3, 2010 Sep 27, 2009
Net earnings attributable to Starbucks . . . . . . . . . . . . . . . . . . . . . . $1,245.7 $945.6 $390.8Weighted average common shares and common stock unitsoutstanding (for basic calculation) . . . . . . . . . . . . . . . . . . . . . . . 748.3 744.4 738.7
Dilutive effect of outstanding common stock options andRSUs . . . . . . . . . . . . . . . . . . . . . . . . . . . . . . . . . . . . . . . . . . . . . 21.4 19.8 7.2
Weighted average common and common equivalent sharesoutstanding (for diluted calculation) . . . . . . . . . . . . . . . . . . . . . 769.7 764.2 745.9
EPS— basic . . . . . . . . . . . . . . . . . . . . . . . . . . . . . . . . . . . . . . . . . $ 1.66 $ 1.27 $ 0.53EPS— diluted . . . . . . . . . . . . . . . . . . . . . . . . . . . . . . . . . . . . . . . $ 1.62 $ 1.24 $ 0.52
71
Potential dilutive shares consist of the incremental common shares issuable upon the exercise of outstanding stockoptions (both vested and non-vested) and unvested RSUs, calculated using the treasury stock method. Thecalculation of dilutive shares outstanding excludes out-of-the-money stock options (i.e., such options’ exerciseprices were greater than the average market price of our common shares for the period) because their inclusionwould have been antidilutive. Out-of-the-money stock options totaled 0.1 million, 7.9 million, and 15.9 million as ofOctober 2, 2011, October 3, 2010, and September 27, 2009, respectively.
Note 15: Commitments and Contingencies
Guarantees
We have unconditionally guaranteed the repayment of certain Japanese yen-denominated bank loans and relatedinterest and fees of an unconsolidated equity investee, Starbucks Japan. The guarantees continue until the loans,including accrued interest and fees, have been paid in full. These guarantees expire in 2014. Our maximum exposureunder this commitment as of October 2, 2011 was $1.0 million and is limited to the sum of unpaid principal andinterest, as well as other related expenses. Since there has been no modification of these loan guarantees subsequentto the adoption of accounting requirements for guarantees, we have applied the disclosure provisions only and havenot recorded the guarantees on our consolidated balance sheets.
Legal Proceedings
In the first quarter of fiscal 2011, Starbucks notified Kraft Foods Global, Inc. (“Kraft”) that we were discontinuingour distribution arrangement with Kraft on March 1, 2011 due to material breaches by Kraft of its obligations underthe Supply and License Agreement between the Company and Kraft, dated March 29, 2004 (the “Agreement”),which defined the main distribution arrangement between the parties. Through our arrangement with Kraft,Starbucks sold a selection of Starbucks and Seattle’s Best Coffee branded packaged coffees in grocery andwarehouse club stores throughout the US, and to grocery stores in Canada, the UK and other European countries.Kraft managed the distribution, marketing, advertising and promotion of these products.
Kraft denies it has materially breached the Agreement. On November 29, 2010, Starbucks received a notice ofarbitration from Kraft putting the commercial dispute between the parties into binding arbitration pursuant to theterms of the Agreement. In addition to denying it materially breached the Agreement, Kraft further alleges that ifStarbucks wished to terminate the Agreement it must compensate Kraft as provided in the Agreement in an amountequal to the fair value of the Agreement, with an additional premium of up to 35% under certain circumstances. Theparties are now engaged in extensive discovery with an arbitration trial expected in mid- 2012.
On December 6, 2010, Kraft commenced a federal court action against Starbucks, entitled Kraft Foods Global, Inc.v. Starbucks Corporation, in the U.S. District Court for the Southern District of New York (the “District Court”)seeking injunctive relief to prevent Starbucks from terminating the distribution arrangement until the parties’ disputeis resolved through the arbitration proceeding. On January 28, 2011, the District Court denied Kraft’s request forinjunctive relief. Kraft appealed the District Court’s decision to the Second Circuit Court of Appeals. OnFebruary 25, 2011, the Second Circuit Court of Appeals affirmed the District Court’s decision. As a result,Starbucks is in full control of our packaged coffee business as of March 1, 2011.
While Starbucks believes we have valid claims of material breach by Kraft under the Agreement that allowed us toterminate the Agreement and certain other relationships with Kraft without compensation to Kraft, there exists thepossibility of material adverse outcomes to Starbucks in the arbitration or to resolve the matter. At this time, theCompany is unable to estimate the range of possible outcomes with respect to the arbitration as we have not receivedany statement or articulation of damages from Kraft nor have we estimated the damages to Starbucks caused byKraft’s breaches. Information in this regard will be provided during the discovery process and is currently expectedto be available in late March or early April 2012. And, although Kraft disclosed to the press and in federal courtfilings a $750 million offer Starbucks made to Kraft in August 2010 to avoid litigation and ensure a smoothtransition of the business, the figure is not a proper basis upon which to estimate a possible outcome of the
72
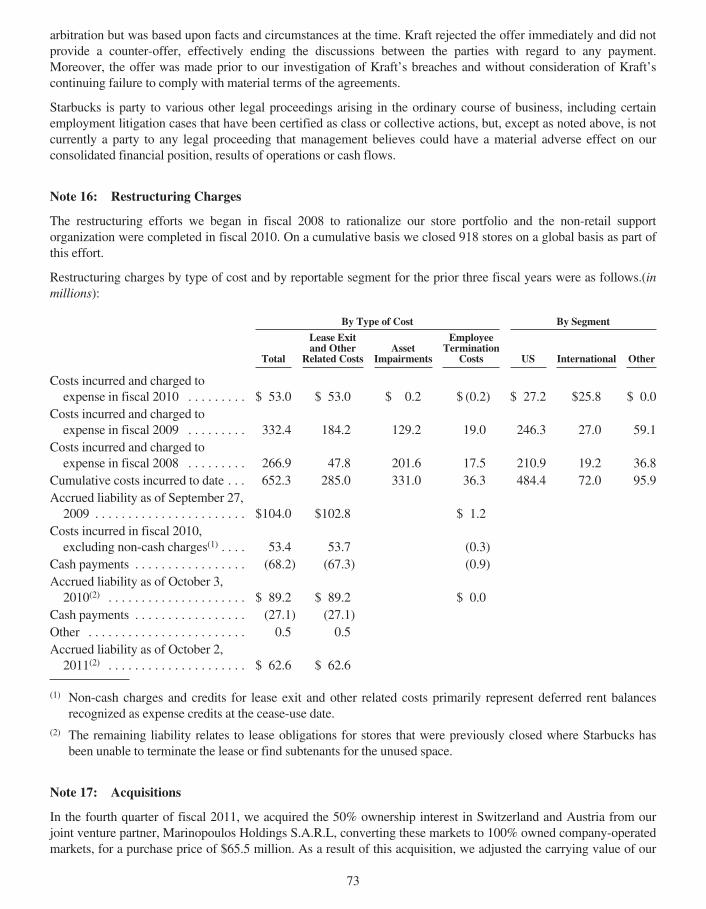
arbitration but was based upon facts and circumstances at the time. Kraft rejected the offer immediately and did notprovide a counter-offer, effectively ending the discussions between the parties with regard to any payment.Moreover, the offer was made prior to our investigation of Kraft’s breaches and without consideration of Kraft’scontinuing failure to comply with material terms of the agreements.
Starbucks is party to various other legal proceedings arising in the ordinary course of business, including certainemployment litigation cases that have been certified as class or collective actions, but, except as noted above, is notcurrently a party to any legal proceeding that management believes could have a material adverse effect on ourconsolidated financial position, results of operations or cash flows.
Note 16: Restructuring Charges
The restructuring efforts we began in fiscal 2008 to rationalize our store portfolio and the non-retail supportorganization were completed in fiscal 2010. On a cumulative basis we closed 918 stores on a global basis as part ofthis effort.
Restructuring charges by type of cost and by reportable segment for the prior three fiscal years were as follows.(inmillions):
By Type of Cost By Segment
Total
Lease Exitand Other
Related CostsAsset
Impairments
EmployeeTermination
Costs US International Other
Costs incurred and charged toexpense in fiscal 2010 . . . . . . . . . $ 53.0 $ 53.0 $ 0.2 $ (0.2) $ 27.2 $25.8 $ 0.0
Costs incurred and charged toexpense in fiscal 2009 . . . . . . . . . 332.4 184.2 129.2 19.0 246.3 27.0 59.1
Costs incurred and charged toexpense in fiscal 2008 . . . . . . . . . 266.9 47.8 201.6 17.5 210.9 19.2 36.8
Cumulative costs incurred to date . . . 652.3 285.0 331.0 36.3 484.4 72.0 95.9Accrued liability as of September 27,2009 . . . . . . . . . . . . . . . . . . . . . . . $104.0 $102.8 $ 1.2
Costs incurred in fiscal 2010,excluding non-cash charges(1) . . . . 53.4 53.7 (0.3)
Cash payments . . . . . . . . . . . . . . . . . (68.2) (67.3) (0.9)Accrued liability as of October 3,2010(2) . . . . . . . . . . . . . . . . . . . . . $ 89.2 $ 89.2 $ 0.0
Cash payments . . . . . . . . . . . . . . . . . (27.1) (27.1)Other . . . . . . . . . . . . . . . . . . . . . . . . 0.5 0.5Accrued liability as of October 2,2011(2) . . . . . . . . . . . . . . . . . . . . . $ 62.6 $ 62.6
(1) Non-cash charges and credits for lease exit and other related costs primarily represent deferred rent balancesrecognized as expense credits at the cease-use date.
(2) The remaining liability relates to lease obligations for stores that were previously closed where Starbucks hasbeen unable to terminate the lease or find subtenants for the unused space.
Note 17: Acquisitions
In the fourth quarter of fiscal 2011, we acquired the 50% ownership interest in Switzerland and Austria from ourjoint venture partner, Marinopoulos Holdings S.A.R.L, converting these markets to 100% owned company-operatedmarkets, for a purchase price of $65.5 million. As a result of this acquisition, we adjusted the carrying value of our
73
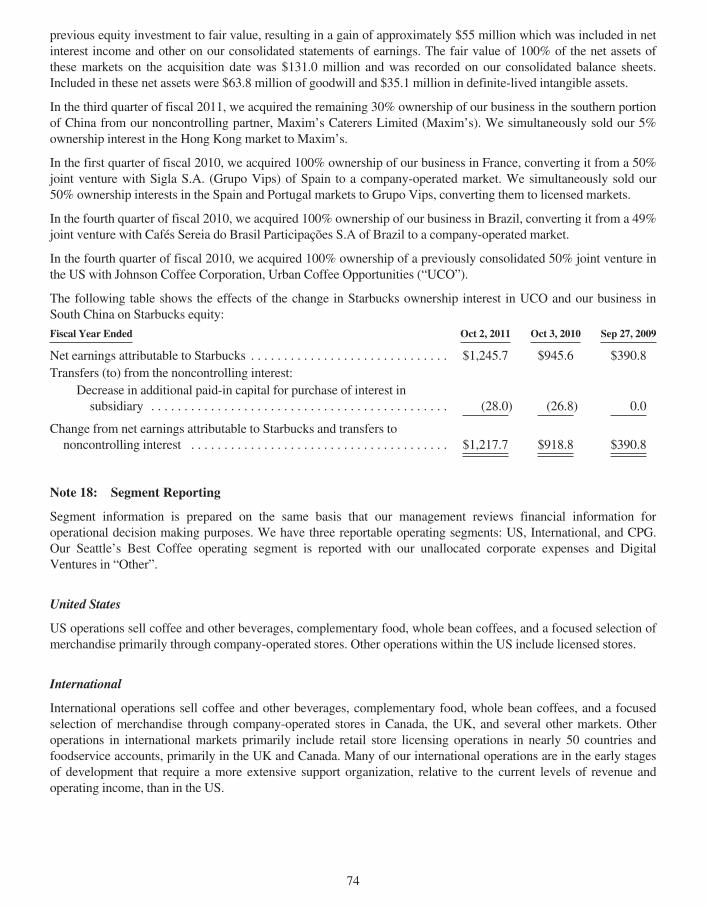
previous equity investment to fair value, resulting in a gain of approximately $55 million which was included in netinterest income and other on our consolidated statements of earnings. The fair value of 100% of the net assets ofthese markets on the acquisition date was $131.0 million and was recorded on our consolidated balance sheets.Included in these net assets were $63.8 million of goodwill and $35.1 million in definite-lived intangible assets.
In the third quarter of fiscal 2011, we acquired the remaining 30% ownership of our business in the southern portionof China from our noncontrolling partner, Maxim’s Caterers Limited (Maxim’s). We simultaneously sold our 5%ownership interest in the Hong Kong market to Maxim’s.
In the first quarter of fiscal 2010, we acquired 100% ownership of our business in France, converting it from a 50%joint venture with Sigla S.A. (Grupo Vips) of Spain to a company-operated market. We simultaneously sold our50% ownership interests in the Spain and Portugal markets to Grupo Vips, converting them to licensed markets.
In the fourth quarter of fiscal 2010, we acquired 100% ownership of our business in Brazil, converting it from a 49%joint venture with Cafés Sereia do Brasil Participações S.A of Brazil to a company-operated market.
In the fourth quarter of fiscal 2010, we acquired 100% ownership of a previously consolidated 50% joint venture inthe US with Johnson Coffee Corporation, Urban Coffee Opportunities (“UCO”).
The following table shows the effects of the change in Starbucks ownership interest in UCO and our business inSouth China on Starbucks equity:
Fiscal Year Ended Oct 2, 2011 Oct 3, 2010 Sep 27, 2009
Net earnings attributable to Starbucks . . . . . . . . . . . . . . . . . . . . . . . . . . . . . . $1,245.7 $945.6 $390.8Transfers (to) from the noncontrolling interest:
Decrease in additional paid-in capital for purchase of interest insubsidiary . . . . . . . . . . . . . . . . . . . . . . . . . . . . . . . . . . . . . . . . . . . . . (28.0) (26.8) 0.0
Change from net earnings attributable to Starbucks and transfers tononcontrolling interest . . . . . . . . . . . . . . . . . . . . . . . . . . . . . . . . . . . . . . . $1,217.7 $918.8 $390.8
Note 18: Segment Reporting
Segment information is prepared on the same basis that our management reviews financial information foroperational decision making purposes. We have three reportable operating segments: US, International, and CPG.Our Seattle’s Best Coffee operating segment is reported with our unallocated corporate expenses and DigitalVentures in “Other”.
United States
US operations sell coffee and other beverages, complementary food, whole bean coffees, and a focused selection ofmerchandise primarily through company-operated stores. Other operations within the US include licensed stores.
International
International operations sell coffee and other beverages, complementary food, whole bean coffees, and a focusedselection of merchandise through company-operated stores in Canada, the UK, and several other markets. Otheroperations in international markets primarily include retail store licensing operations in nearly 50 countries andfoodservice accounts, primarily in the UK and Canada. Many of our international operations are in the early stagesof development that require a more extensive support organization, relative to the current levels of revenue andoperating income, than in the US.
74
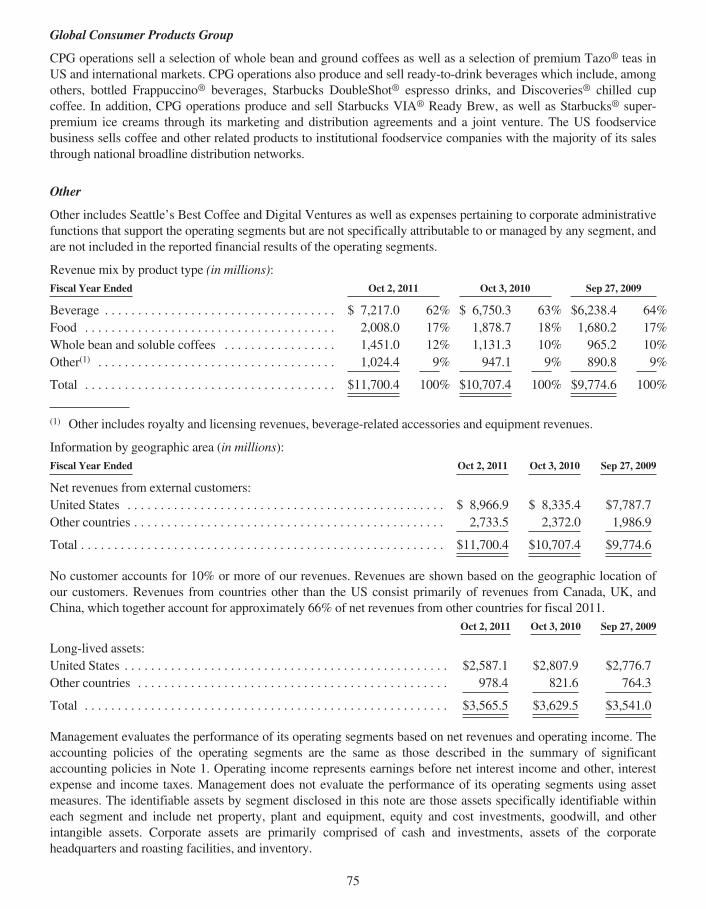
Global Consumer Products Group
CPG operations sell a selection of whole bean and ground coffees as well as a selection of premium Tazo® teas inUS and international markets. CPG operations also produce and sell ready-to-drink beverages which include, amongothers, bottled Frappuccino® beverages, Starbucks DoubleShot® espresso drinks, and Discoveries® chilled cupcoffee. In addition, CPG operations produce and sell Starbucks VIA® Ready Brew, as well as Starbucks® super-premium ice creams through its marketing and distribution agreements and a joint venture. The US foodservicebusiness sells coffee and other related products to institutional foodservice companies with the majority of its salesthrough national broadline distribution networks.
Other
Other includes Seattle’s Best Coffee and Digital Ventures as well as expenses pertaining to corporate administrativefunctions that support the operating segments but are not specifically attributable to or managed by any segment, andare not included in the reported financial results of the operating segments.
Revenue mix by product type (in millions):Fiscal Year Ended Oct 2, 2011 Oct 3, 2010 Sep 27, 2009
Beverage . . . . . . . . . . . . . . . . . . . . . . . . . . . . . . . . . . . $ 7,217.0 62% $ 6,750.3 63% $6,238.4 64%Food . . . . . . . . . . . . . . . . . . . . . . . . . . . . . . . . . . . . . . 2,008.0 17% 1,878.7 18% 1,680.2 17%Whole bean and soluble coffees . . . . . . . . . . . . . . . . . 1,451.0 12% 1,131.3 10% 965.2 10%Other(1) . . . . . . . . . . . . . . . . . . . . . . . . . . . . . . . . . . . . 1,024.4 9% 947.1 9% 890.8 9%
Total . . . . . . . . . . . . . . . . . . . . . . . . . . . . . . . . . . . . . . $11,700.4 100% $10,707.4 100% $9,774.6 100%
(1) Other includes royalty and licensing revenues, beverage-related accessories and equipment revenues.
Information by geographic area (in millions):Fiscal Year Ended Oct 2, 2011 Oct 3, 2010 Sep 27, 2009
Net revenues from external customers:United States . . . . . . . . . . . . . . . . . . . . . . . . . . . . . . . . . . . . . . . . . . . . . . . . $ 8,966.9 $ 8,335.4 $7,787.7Other countries . . . . . . . . . . . . . . . . . . . . . . . . . . . . . . . . . . . . . . . . . . . . . . . 2,733.5 2,372.0 1,986.9
Total . . . . . . . . . . . . . . . . . . . . . . . . . . . . . . . . . . . . . . . . . . . . . . . . . . . . . . . $11,700.4 $10,707.4 $9,774.6
No customer accounts for 10% or more of our revenues. Revenues are shown based on the geographic location ofour customers. Revenues from countries other than the US consist primarily of revenues from Canada, UK, andChina, which together account for approximately 66% of net revenues from other countries for fiscal 2011.
Oct 2, 2011 Oct 3, 2010 Sep 27, 2009
Long-lived assets:United States . . . . . . . . . . . . . . . . . . . . . . . . . . . . . . . . . . . . . . . . . . . . . . . . . $2,587.1 $2,807.9 $2,776.7Other countries . . . . . . . . . . . . . . . . . . . . . . . . . . . . . . . . . . . . . . . . . . . . . . . 978.4 821.6 764.3
Total . . . . . . . . . . . . . . . . . . . . . . . . . . . . . . . . . . . . . . . . . . . . . . . . . . . . . . . $3,565.5 $3,629.5 $3,541.0
Management evaluates the performance of its operating segments based on net revenues and operating income. Theaccounting policies of the operating segments are the same as those described in the summary of significantaccounting policies in Note 1. Operating income represents earnings before net interest income and other, interestexpense and income taxes. Management does not evaluate the performance of its operating segments using assetmeasures. The identifiable assets by segment disclosed in this note are those assets specifically identifiable withineach segment and include net property, plant and equipment, equity and cost investments, goodwill, and otherintangible assets. Corporate assets are primarily comprised of cash and investments, assets of the corporateheadquarters and roasting facilities, and inventory.
75
The table below presents financial information for our reportable operating segments and Other for the fiscal yearsnoted (in millions):
United States International CPG Other Total
Fiscal 2011:Total net revenues . . . . . . . . . . . . . . . . . . . . . . . . $8,038.0 $2,626.1 $860.5 $ 175.8 $11,700.4Depreciation and amortization . . . . . . . . . . . . . . . 343.8 118.5 2.4 58.6 523.3Income from equity investees . . . . . . . . . . . . . . . 0.0 100.5 75.6 (2.4) 173.7Operating income/(loss) . . . . . . . . . . . . . . . . . . . . 1,562.6 349.7 273.0 (456.8) 1,728.5Total assets . . . . . . . . . . . . . . . . . . . . . . . . . . . . . 1,479.4 1,300.7 54.7 4,525.6 7,360.4Fiscal 2010:Total net revenues . . . . . . . . . . . . . . . . . . . . . . . . $7,560.4 $2,288.8 $707.4 $ 150.8 $10,707.4Depreciation and amortization . . . . . . . . . . . . . . . 350.7 108.6 3.7 47.4 510.4Income from equity investees . . . . . . . . . . . . . . . 0.0 80.8 70.6 (3.3) 148.1Operating income/(loss) . . . . . . . . . . . . . . . . . . . . 1,291.1 225.2 261.4 (358.3) 1,419.4Total assets . . . . . . . . . . . . . . . . . . . . . . . . . . . . . 1,482.9 1,272.8 54.1 3,576.1 6,385.9Fiscal 2009:Total net revenues . . . . . . . . . . . . . . . . . . . . . . . . $7,061.7 $1,914.3 $674.4 $ 124.2 $ 9,774.6Depreciation and amortization . . . . . . . . . . . . . . . 377.9 102.2 4.8 49.8 534.7Income from equity investees . . . . . . . . . . . . . . . 0.5 53.6 67.8 0.0 121.9Operating income/(loss) . . . . . . . . . . . . . . . . . . . . 530.1 91.2 281.8 (341.1) 562.0Total assets . . . . . . . . . . . . . . . . . . . . . . . . . . . . . 1,640.8 1,071.3 71.1 2,793.6 5,576.8
The table below reconciles the total of the reportable segments’ operating income and the operating income includedin Other to consolidated earnings before income taxes (in millions):
Fiscal Year Ended Oct 2, 2011 Oct 3, 2010 Sep 27, 2009
Operating income . . . . . . . . . . . . . . . . . . . . . . . . . . . . . . . . . . . . . . . . . . . . . $1,728.5 $1,419.4 $562.0Interest income and other, net . . . . . . . . . . . . . . . . . . . . . . . . . . . . . . . . . . . . 115.9 50.3 37.0Interest expense . . . . . . . . . . . . . . . . . . . . . . . . . . . . . . . . . . . . . . . . . . . . . . . (33.3) (32.7) (39.1)
Earnings before income taxes . . . . . . . . . . . . . . . . . . . . . . . . . . . . . . . . . . . . $1,811.1 $1,437.0 $559.9
Note 19: Subsequent Event
In the first quarter of fiscal 2012, we acquired the outstanding shares of Evolution Fresh, Inc., a specialty juicecompany, to expand our portfolio of product offerings and enter into the super-premium juice market. We acquiredEvolution Fresh for a purchase price of $30 million in cash.
76
REPORTOF INDEPENDENT REGISTERED PUBLIC ACCOUNTING FIRM
To the Board of Directors and Shareholders of Starbucks CorporationSeattle, Washington
We have audited the accompanying consolidated balance sheets of Starbucks Corporation and subsidiaries (the“Company”) as of October 2, 2011 and October 3, 2010, and the related consolidated statements of earnings, equity,and cash flows for each of the three years in the period ended October 2, 2011. These financial statements are theresponsibility of the Company’s management. Our responsibility is to express an opinion on these financialstatements based on our audits.
We conducted our audits in accordance with the standards of the Public Company Accounting Oversight Board(United States). Those standards require that we plan and perform the audit to obtain reasonable assurance aboutwhether the financial statements are free of material misstatement. An audit includes examining, on a test basis,evidence supporting the amounts and disclosures in the financial statements. An audit also includes assessing theaccounting principles used and significant estimates made by management, as well as evaluating the overallfinancial statement presentation. We believe that our audits provide a reasonable basis for our opinion.
In our opinion, such consolidated financial statements present fairly, in all material respects, the financial position ofStarbucks Corporation and subsidiaries as of October 2, 2011 and October 3, 2010, and the results of their operationsand their cash flows for each of the three years in the period ended October 2, 2011, in conformity with accountingprinciples generally accepted in the United States of America.
We have also audited, in accordance with the standards of the Public Company Accounting Oversight Board (UnitedStates), the Company’s internal control over financial reporting as of October 2, 2011, based on criteria establishedin Internal Control — Integrated Framework issued by the Committee of Sponsoring Organizations of theTreadway Commission and our report dated November 18, 2011 expressed an unqualified opinion on theCompany’s internal control over financial reporting.
/s/ Deloitte & Touche LLP
Seattle, WashingtonNovember 18, 2011
77
Item 9. Changes in and Disagreements with Accountants on Accounting and Financial Disclosure
Not applicable.
Item 9A. Controls and Procedures
Disclosure Controls and Procedures
We maintain disclosure controls and procedures that are designed to ensure that material information required to bedisclosed in our periodic reports filed or submitted under the Securities Exchange Act of 1934, as amended (the“Exchange Act”), is recorded, processed, summarized and reported within the time periods specified in the SEC’srules and forms. Our disclosure controls and procedures are also designed to ensure that information required to bedisclosed in the reports we file or submit under the Exchange Act is accumulated and communicated to ourmanagement, including our principal executive officer and principal financial officer as appropriate, to allow timelydecisions regarding required disclosure.
During the fourth quarter of fiscal 2011, we carried out an evaluation, under the supervision and with theparticipation of our management, including our chief executive officer and our chief financial officer, of theeffectiveness of the design and operation of our disclosure controls and procedures, as defined in Rules 13a-15(e)and 15d-15(e) under the Exchange Act. Based upon that evaluation, our chief executive officer and chief financialofficer concluded that our disclosure controls and procedures were effective, as of the end of the period covered bythis report (October 2, 2011).
We are in the process of implementing new and upgraded financial information technology systems. As a part of thiseffort, during the third quarter of fiscal 2011 we implemented an updated version of our existing Oracle accountingsystem. This update has resulted in changes to our business processes and related internal controls over financialreporting, which have continued into the fourth quarter of fiscal 2011. Management has taken the necessary steps toupdate the design and documentation of internal control processes and procedures relating to the system update tosupplement and complement existing internal controls. Management will continue to monitor, evaluate and updatethe related processes and internal controls as necessary during the post implementation period to ensure adequateinternal control over financial reporting.
Other than as described above, during the fourth quarter of fiscal 2011, there were no changes in our internal controlover financial reporting (as defined in Rules 13a-15(f) and 15d-15(f) of the Exchange Act) that materially affectedor are reasonably likely to materially affect internal control over financial reporting.
The certifications required by Section 302 of the Sarbanes-Oxley Act of 2002 are filed as exhibits 31.1 and 31.2,respectively, to this 10-K.
Report of Management on Internal Control over Financial Reporting
Our management is responsible for establishing and maintaining adequate internal control over financial reporting.Internal control over financial reporting is a process to provide reasonable assurance regarding the reliability of ourfinancial reporting for external purposes in accordance with accounting principles generally accepted in the UnitedStates of America. Internal control over financial reporting includes maintaining records that in reasonable detailaccurately and fairly reflect our transactions; providing reasonable assurance that transactions are recorded asnecessary for preparation of our financial statements; providing reasonable assurance that receipts and expendituresare made in accordance with management authorization; and providing reasonable assurance that unauthorizedacquisition, use or disposition of company assets that could have a material effect our financial statements would beprevented or detected on a timely basis. Because of its inherent limitations, internal control over financial reportingis not intended to provide absolute assurance that a misstatement of our financial statements would be prevented ordetected.
Management conducted an evaluation of the effectiveness of our internal control over financial reporting based onthe framework and criteria established in Internal Control — Integrated Framework, issued by the Committee of
78
Sponsoring Organizations of the Treadway Commission. This evaluation included review of the documentation ofcontrols, evaluation of the design effectiveness of controls, testing of the operating effectiveness of controls and aconclusion on this evaluation. Based on this evaluation, management concluded that our internal control overfinancial reporting was effective as of October 2, 2011.
Our internal control over financial reporting as of October 2, 2011, has been audited by Deloitte & Touche LLP, anindependent registered public accounting firm, as stated in their report which is included herein.
79
REPORTOF INDEPENDENT REGISTERED PUBLIC ACCOUNTING FIRM
To the Board of Directors and Shareholders of Starbucks CorporationSeattle, Washington
We have audited the internal control over financial reporting of Starbucks Corporation and subsidiaries (the“Company”) as of October 2, 2011, based on criteria established in Internal Control — Integrated Frameworkissued by the Committee of Sponsoring Organizations of the Treadway Commission. The Company’s managementis responsible for maintaining effective internal control over financial reporting and for its assessment of theeffectiveness of internal control over financial reporting, included in the accompanying Report of Management onInternal Control over Financial Reporting. Our responsibility is to express an opinion on the Company’s internalcontrol over financial reporting based on our audit.
We conducted our audit in accordance with the standards of the Public Company Accounting Oversight Board(United States). Those standards require that we plan and perform the audit to obtain reasonable assurance aboutwhether effective internal control over financial reporting was maintained in all material respects. Our audit includedobtaining an understanding of internal control over financial reporting, assessing the risk that a material weaknessexists, testing and evaluating the design and operating effectiveness of internal control based on the assessed risk,and performing such other procedures as we considered necessary in the circumstances. We believe that our auditprovides a reasonable basis for our opinion.
A company’s internal control over financial reporting is a process designed by, or under the supervision of, thecompany’s principal executive and principal financial officers, or persons performing similar functions, and effectedby the company’s board of directors, management, and other personnel to provide reasonable assurance regardingthe reliability of financial reporting and the preparation of financial statements for external purposes in accordancewith generally accepted accounting principles. A company’s internal control over financial reporting includes thosepolicies and procedures that (1) pertain to the maintenance of records that, in reasonable detail, accurately and fairlyreflect the transactions and dispositions of the assets of the company; (2) provide reasonable assurance thattransactions are recorded as necessary to permit preparation of financial statements in accordance with generallyaccepted accounting principles, and that receipts and expenditures of the company are being made only inaccordance with authorizations of management and directors of the company; and (3) provide reasonable assuranceregarding prevention or timely detection of unauthorized acquisition, use, or disposition of the company’s assets thatcould have a material effect on the financial statements.
Because of the inherent limitations of internal control over financial reporting, including the possibility of collusionor improper management override of controls, material misstatements due to error or fraud may not be prevented ordetected on a timely basis. Also, projections of any evaluation of the effectiveness of the internal control overfinancial reporting to future periods are subject to the risk that the controls may become inadequate because ofchanges in conditions, or that the degree of compliance with the policies or procedures may deteriorate.
In our opinion, the Company maintained, in all material respects, effective internal control over financial reportingas of October 2, 2011, based on the criteria established in Internal Control — Integrated Framework issued by theCommittee of Sponsoring Organizations of the Treadway Commission.
We have also audited, in accordance with the standards of the Public Company Accounting Oversight Board (UnitedStates), the consolidated financial statements as of and for the fiscal year ended October 2, 2011, of the Companyand our report dated November 18, 2011 expressed an unqualified opinion on those financial statements.
/s/ Deloitte & Touche LLP
Seattle, WashingtonNovember 18, 2011
80

Item 9B. Other Information
None.
81
PART III
Item 10. Directors, Executive Officers and Corporate Governance
Information regarding our executive officers is set forth in Item 1 of Part 1 of this Report under the caption“Executive Officers of the Registrant.”
We adopted a code of ethics applicable to our chief executive officer, chief financial officer, controller and otherfinance leaders, which is a “code of ethics” as defined by applicable rules of the SEC. This code is publicly availableon our website at http://www.starbucks.com/about-us/company-information/corporate-governance. If we make anyamendments to this code other than technical, administrative or other non-substantive amendments, or grant anywaivers, including implicit waivers, from a provision of this code to our chief executive officer, chief financialofficer or controller, we will disclose the nature of the amendment or waiver, its effective date and to whom itapplies on our website at http://www.starbucks.com/about-us/company-information/corporate-governance or in areport on Form 8-K filed with the SEC.
The remaining information required by this item is incorporated herein by reference to the sections entitled“Proposal 1 — Election Of Directors” and “Beneficial Ownership of Common Stock — Section 16(a) BeneficialOwnership Reporting Compliance,” “Corporate Governance — Board Committees and Related Matters” and“Corporate Governance — Audit Committee” in our definitive Proxy Statement for the Annual Meeting ofShareholders to be held on March 21, 2012 (the “Proxy Statement”).
Item 11. Executive Compensation
The information required by this item is incorporated by reference to the sections entitled “ExecutiveCompensation,” “Corporate Governance — Compensation of Directors” and “Corporate Governance —Compensation Committee” in the Proxy Statement.
Item 12. Security Ownership of Certain Beneficial Owners and Management and Related ShareholderMatters
The information required by this item is incorporated by reference to the sections entitled “Beneficial Ownership ofCommon Stock” and “Equity Compensation Plan Information” in the Proxy Statement.
Item 13. Certain Relationships and Related Transactions, and Director Independence
The information required by this item is incorporated by reference to the section entitled “Certain Relationships andRelated Transactions” and “Corporate Governance — Affirmative Determinations Regarding DirectorIndependence and Other Matters” in the Proxy Statement.
Item 14. Principal Accounting Fees and Services
The information required by this item is incorporated by reference to the sections entitled “Independent RegisteredPublic Accounting Firm Fees” and “Policy on Audit Committee Pre-Approval of Audit and Permissible Non-AuditServices of the Independent Registered Public Accounting Firm” in the Proxy Statement.
82
PART IV
Item 15. Exhibits and Financial Statement Schedules
(a) The following documents are filed as a part of this 10-K:
1. Financial Statements
The following financial statements are included in Part II, Item 8 of this 10-K:
• Consolidated Statements of Earnings for the fiscal years ended October 2, 2011, October 3, 2010, andSeptember 27, 2009;
• Consolidated Balance Sheets as of October 2, 2011 and October 3, 2010;
• Consolidated Statements of Cash Flows for the fiscal years ended October 2, 2011, October 3,2010, and September 27, 2009;
• Consolidated Statements of Equity for the fiscal years ended October 2, 2011, October 3, 2010, andSeptember 27, 2009;
• Notes to Consolidated Financial Statements; and
• Reports of Independent Registered Public Accounting Firm
2. Financial Statement Schedules
Financial statement schedules are omitted because they are not required or are not applicable, or the requiredinformation is provided in the consolidated financial statements or notes described in Item 15(a)(1) above.
3. Exhibits
The Exhibits listed in the Index to Exhibits, which appears immediately following the signature page and isincorporated herein by reference, are filed as part of this 10-K.
83
SIGNATURES
Pursuant to the requirements of Section 13 or 15(d) of the Securities Exchange Act of 1934, the registrant has dulycaused this report to be signed on its behalf by the undersigned, thereunto duly authorized.
STARBUCKS CORPORATION
By: /s/ Howard Schultz
Howard Schultzchairman, president and chief executive officer
November 18, 2011
POWEROF ATTORNEY
Know all persons by these presents, that each person whose signature appears below constitutes and appointsHoward Schultz and Troy Alstead, and each of them, as such person’s true and lawful attorneys-in-fact and agents,with full power of substitution and resubstitution, for such person and in such person’s name, place and stead, in anyand all capacities, to sign any and all amendments to this Report, and to file the same, with all exhibits thereto, andother documents in connection therewith, with the Securities and Exchange Commission, granting unto saidattorneys-in-fact and agents, and each of them, full power and authority to do and perform each and every act andthing requisite and necessary to be done in connection therewith, as fully to all intents and purposes as such personmight or could do in person, hereby ratifying and confirming all that said attorneys-in-fact and agents, or any ofthem or their or such person’s substitute or substitutes, may lawfully do or cause to be done by virtue thereof.
Pursuant to the requirements of the Securities Exchange Act of 1934, this report has been signed below by thefollowing persons on behalf of the registrant and in the capacities indicated as of November 18, 2011.
Signature Title
By: /s/ Howard Schultz
Howard Schultz
chairman, president and chief executive officer
By: /s/ Troy Alstead
Troy Alstead
chief financial officer and chief administrative officer(principal financial officer and principal
accounting officer)
By: /s/ WilliamW. Bradley
WilliamW. Bradley
director
By: /s/ Mellody Hobson
Mellody Hobson
director
By: /s/ Kevin R. Johnson
Kevin R. Johnson
director
By: /s/ Olden Lee
Olden Lee
director
84
Signature Title
By: /s/ Joshua Cooper Ramo
Joshua Cooper Ramo
director
By: /s/ Sheryl Sandberg
Sheryl Sandberg
director
By: /s/ James G. Shennan, Jr.
James G. Shennan, Jr.
director
By: /s/ Javier G. Teruel
Javier G. Teruel
director
By: /s/ Myron E. Ullman, III
Myron E. Ullman, III
director
By: /s/ Craig E. Weatherup
Craig E. Weatherup
director
85
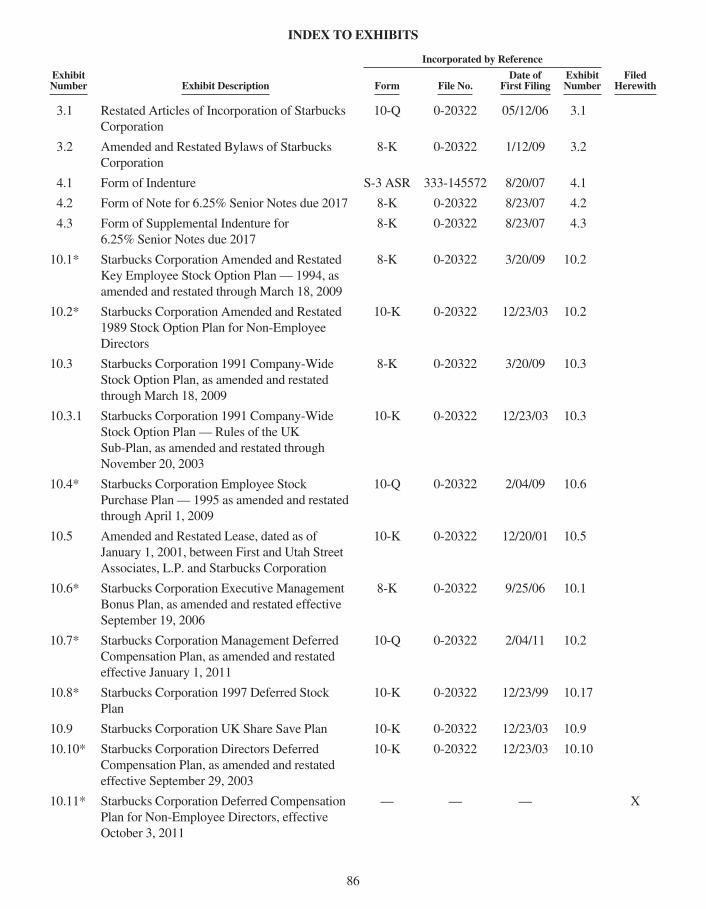
INDEX TO EXHIBITS
Incorporated by Reference
ExhibitNumber Exhibit Description Form File No.
Date ofFirst Filing
ExhibitNumber
FiledHerewith
3.1 Restated Articles of Incorporation of StarbucksCorporation
10-Q 0-20322 05/12/06 3.1
3.2 Amended and Restated Bylaws of StarbucksCorporation
8-K 0-20322 1/12/09 3.2
4.1 Form of Indenture S-3 ASR 333-145572 8/20/07 4.1
4.2 Form of Note for 6.25% Senior Notes due 2017 8-K 0-20322 8/23/07 4.2
4.3 Form of Supplemental Indenture for6.25% Senior Notes due 2017
8-K 0-20322 8/23/07 4.3
10.1* Starbucks Corporation Amended and RestatedKey Employee Stock Option Plan — 1994, asamended and restated through March 18, 2009
8-K 0-20322 3/20/09 10.2
10.2* Starbucks Corporation Amended and Restated1989 Stock Option Plan for Non-EmployeeDirectors
10-K 0-20322 12/23/03 10.2
10.3 Starbucks Corporation 1991 Company-WideStock Option Plan, as amended and restatedthrough March 18, 2009
8-K 0-20322 3/20/09 10.3
10.3.1 Starbucks Corporation 1991 Company-WideStock Option Plan — Rules of the UKSub-Plan, as amended and restated throughNovember 20, 2003
10-K 0-20322 12/23/03 10.3
10.4* Starbucks Corporation Employee StockPurchase Plan — 1995 as amended and restatedthrough April 1, 2009
10-Q 0-20322 2/04/09 10.6
10.5 Amended and Restated Lease, dated as ofJanuary 1, 2001, between First and Utah StreetAssociates, L.P. and Starbucks Corporation
10-K 0-20322 12/20/01 10.5
10.6* Starbucks Corporation Executive ManagementBonus Plan, as amended and restated effectiveSeptember 19, 2006
8-K 0-20322 9/25/06 10.1
10.7* Starbucks Corporation Management DeferredCompensation Plan, as amended and restatedeffective January 1, 2011
10-Q 0-20322 2/04/11 10.2
10.8* Starbucks Corporation 1997 Deferred StockPlan
10-K 0-20322 12/23/99 10.17
10.9 Starbucks Corporation UK Share Save Plan 10-K 0-20322 12/23/03 10.9
10.10* Starbucks Corporation Directors DeferredCompensation Plan, as amended and restatedeffective September 29, 2003
10-K 0-20322 12/23/03 10.10
10.11* Starbucks Corporation Deferred CompensationPlan for Non-Employee Directors, effectiveOctober 3, 2011
— — — X
86
Incorporated by Reference
ExhibitNumber Exhibit Description Form File No.
Date ofFirst Filing
ExhibitNumber
FiledHerewith
10.12* Consulting Agreement dated April 6, 2009between Starbucks Corporation and Olden Lee
10-Q 0-20322 08/05/09 10.1
10.13* Amendment No. 1 to Consulting Agreement,dated as of October 1, 2009, between StarbucksCorporation and Olden Lee
10-Q 0-20322 02/02/10 10.1
10.14 Starbucks Corporation UK Share IncentivePlan, as amended and restated effectiveNovember 14, 2006
10-K 0-20322 12/14/06 10.12
10.15* Starbucks Corporation 2005 Long-Term EquityIncentive Plan, as amended and restatedeffective March 23, 2011
10-Q 0-20322 05/06/11 10.1
10.16* 2005 Key Employee Sub-Plan to the StarbucksCorporation 2005 Long-Term Equity IncentivePlan, as amended and restated effectiveNovember 15, 2005
10-Q 0-20322 02/10/06 10.2
10.17* 2005 Non-Employee Director Sub-Plan to theStarbucks Corporation 2005 Long-Term EquityIncentive Plan, as amended and restatedeffective September 13, 2011
— — — — X
10.18* Stock Option Grant Agreement for Purchase ofStock under the Key Employee Sub-Plan to theStarbucks Corporation 2005 Long-Term EquityIncentive Plan
— — — — X
10.19* Stock Option Grant Agreement for Purchase ofStock under the 2005 Non-Employee DirectorSub-Plan to the Starbucks Corporation 2005Long-Term Equity Incentive Plan
8-K 0-20322 02/10/05 10.5
10.20* Restricted Stock Unit Grant Agreement underthe 2005 Non-Employee Director Sub-Plan tothe Starbucks Corporation 2005 Long-TermEquity Incentive Plan
— — — X
10.21* Letter Agreement dated February 5, 2009between Starbucks Corporation and JohnCulver
10-Q 0-20322 05/06/09 10.4
10.22 2005 Company-Wide Sub-Plan to theStarbucks Corporation 2005 Long-Term EquityIncentive Plan, as amended and restated onSeptember 14, 2010
10-K 0-20322 11/22/10 10.20
10.23 Stock Option Grant Agreement for Purchase ofStock under the 2005 Company-Wide Sub-Planto the Starbucks Corporation 2005 Long-TermEquity Incentive Plan
10-Q 0-20322 08/10/05 10.2
87
Incorporated by Reference
ExhibitNumber Exhibit Description Form File No.
Date ofFirst Filing
ExhibitNumber
FiledHerewith
10.24 Credit Agreement dated November 17, 2010among Starbucks Corporation, Bank ofAmerica, N.A., as Administrative Agent, SwingLine Lender and L/C Issuer, and the otherLenders from time to time a party thereto.
8-K 0-20322 11/19/10 10.1
10.25 Commercial Paper Dealer Agreement betweenStarbucks Corporation and Banc of AmericaSecurities LLC, dated as of March 27, 2007
8-K 0-20322 3/27/07 10.1.1
10.26 Commercial Paper Dealer Agreement betweenStarbucks Corporation and Goldman, Sachs &Co., dated as of March 27, 2007
8-K 0-20322 3/27/07 10.1.2
10.27* Letter Agreement dated February 19, 2008between Starbucks Corporation and ArthurRubinfeld
10-Q 0-20322 05/08/08 10.1
10.28* Letter Agreement dated February 21, 2008between Starbucks Corporation and CliffordBurrows
10-Q 0-20322 05/08/08 10.3
10.29* Letter Agreement dated November 6, 2008between Starbucks Corporation and TroyAlstead
8-K 0-20322 11/12/08 10.1
10.30* Time Vested Restricted Stock Unit Agreement(US) under Starbucks Corporation 2005Long-Term Equity Incentive Plan
— — — — X
10.31* Time Vested Restricted Stock Unit Agreement(International) under Starbucks Corporation2005 Long-Term Equity Incentive Plan
— — — — X
10.32* Performance Based Restricted Stock UnitAgreement under Starbucks Corporation 2005Long-Term Equity Incentive Plan
— — — — X
10.33* Separation Agreement and Release datedNovember 30, 2009 between StarbucksCorporation and Martin Coles
10-Q 0-20322 02/02/10 10.2
10.34* Letter Agreement dated October 8, 2009between Starbucks Corporation and KalenHolmes
10-K 0-20322 11/22/11 10.32
10.35* Letter Agreement dated November 30, 2009between Starbucks Corporation and JohnCulver
10-Q 0-20322 02/02/10 10.3
10.36* Letter Agreement dated September 1, 2009between Starbucks Corporation and AnnieYoung-Scrivner
— — — — X
10.37* Letter Agreement dated May 5, 2010, betweenStarbucks Corporation and Jeff Hansberry
— — — — X
10.38* Letter Agreement dated August 9, 2011between Starbucks Corporation and MichelleGass
— — — — X
88
Incorporated by Reference
ExhibitNumber Exhibit Description Form File No.
Date ofFirst Filing
ExhibitNumber
FiledHerewith
10.39* Letter Agreement dated September 16, 2011between Starbucks Corporation and MichelleGass
— — — — X
12 Computation of Ratio of Earnings to FixedCharges
— — — — X
21 Subsidiaries of Starbucks Corporation — — — — X
23 Consent of Independent Registered PublicAccounting Firm
— — — — X
31.1 Certification of Principal Executive OfficerPursuant to Rule 13a-14 of the SecuritiesExchange Act of 1934, As Adopted Pursuant toSection 302 of the Sarbanes-Oxley Act of 2002
— — — — X
31.2 Certification of Principal Financial OfficerPursuant to Rule 13a-14 of the SecuritiesExchange Act of 1934, As Adopted Pursuant toSection 302 of the Sarbanes-Oxley Act of 2002
— — — — X
32 Certifications of Principal Executive Officerand Principal Financial Officer Pursuant to18 USC. Section 1350, As Adopted Pursuant toSection 906 of the Sarbanes-Oxley Act of 2002
— — — — X
101** The following financial statements from theCompany’s 10-K for the fiscal year endedOctober 2, 2011, formatted in XBRL:(i) Condensed Consolidated Statements ofEarnings, (ii) Condensed Consolidated BalanceSheets, (iii) Condensed ConsolidatedStatements of Cash Flows (iv) ConsolidatedStatements of Equity (v) Notes to CondensedConsolidated Financial Statements
* Denotes a management contract or compensatory plan or arrangement.** Furnished herewith.
89

[THIS PAGE INTENTIONALLY LEFT BLANK]
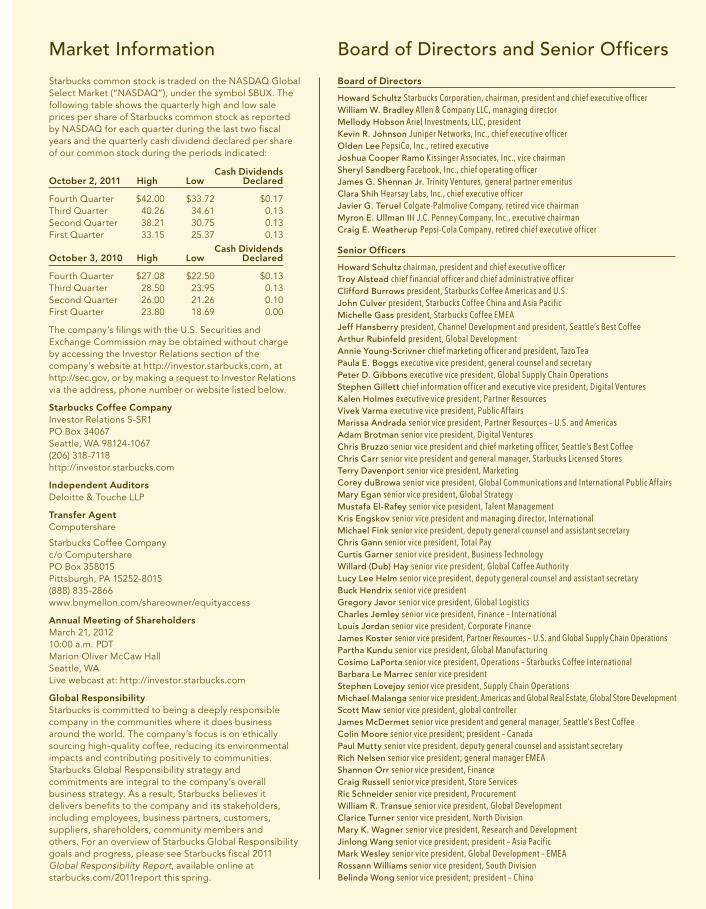
Board of Directors and Senior Offi cers
Starbucks common stock is traded on the NASDAQ Global Select Market (“NASDAQ”), under the symbol SBUX. The following table shows the quarterly high and low sale prices per share of Starbucks common stock as reported by NASDAQ for each quarter during the last two fiscal years and the quarterly cash dividend declared per share of our common stock during the periods indicated:
Cash Dividends October 2, 2011 High Low Declared
Fourth Quarter $42.00 $33.72 $0.17Third Quarter 40.26 34.61 0.13Second Quarter 38.21 30.75 0.13First Quarter 33.15 25.37 0.13 Cash Dividends October 3, 2010 High Low Declared
Fourth Quarter $27.08 $22.50 $0.13Third Quarter 28.50 23.95 0.13Second Quarter 26.00 21.26 0.10First Quarter 23.80 18.69 0.00
The company’s filings with the U.S. Securities and Exchange Commission may be obtained without charge by accessing the Investor Relations section of the company’s website at http://investor.starbucks.com, at http://sec.gov, or by making a request to Investor Relations via the address, phone number or website listed below.
Starbucks Coffee CompanyInvestor Relations S-SR1PO Box 34067Seattle, WA 98124-1067 (206) 318-7118http://investor.starbucks.com
Independent AuditorsDeloitte & Touche LLP
Transfer Agent Computershare
Starbucks Coffee Companyc/o ComputersharePO Box 358015Pittsburgh, PA 15252-8015(888) 835-2866www.bnymellon.com/shareowner/equityaccess
Annual Meeting of ShareholdersMarch 21, 201210:00 a.m. PDTMarion Oliver McCaw HallSeattle, WALive webcast at: http://investor.starbucks.com
Global Responsibility Starbucks is committed to being a deeply responsiblecompany in the communities where it does business around the world. The company’s focus is on ethically sourcing high-quality coffee, reducing its environmental impacts and contributing positively to communities. Starbucks Global Responsibility strategy and commitments are integral to the company’s overall business strategy. As a result, Starbucks believes it delivers benefits to the company and its stakeholders, including employees, business partners, customers, suppliers, shareholders, community members andothers. For an overview of Starbucks Global Responsibility goals and progress, please see Starbucks fiscal 2011 Global Responsibility Report, available online atstarbucks.com/2011report this spring.
Market Information
Board of Directors
Howard Schultz Starbucks Corporation, chairman, president and chief executive officer William W. Bradley Allen & Company LLC, managing directorMellody Hobson Ariel Investments, LLC, president Kevin R. Johnson Juniper Networks, Inc., chief executive officerOlden Lee PepsiCo, Inc., retired executive Joshua Cooper Ramo Kissinger Associates, Inc., vice chairmanSheryl Sandberg Facebook, Inc., chief operating officerJames G. Shennan Jr. Trinity Ventures, general partner emeritusClara Shih Hearsay Labs, Inc., chief executive officerJavier G. Teruel Colgate-Palmolive Company, retired vice chairmanMyron E. Ullman III J.C. Penney Company, Inc., executive chairmanCraig E. Weatherup Pepsi-Cola Company, retired chief executive officer
Senior Officers
Howard Schultz chairman, president and chief executive officerTroy Alstead chief financial officer and chief administrative officerClifford Burrows president, Starbucks Coffee Americas and U.S.John Culver president, Starbucks Coffee China and Asia Pacific Michelle Gass president, Starbucks Coffee EMEA Jeff Hansberry president, Channel Development and president, Seattle’s Best CoffeeArthur Rubinfeld president, Global DevelopmentAnnie Young-Scrivner chief marketing officer and president, Tazo Tea Paula E. Boggs executive vice president, general counsel and secretaryPeter D. Gibbons executive vice president, Global Supply Chain OperationsStephen Gillett chief information officer and executive vice president, Digital VenturesKalen Holmes executive vice president, Partner Resources Vivek Varma executive vice president, Public AffairsMarissa Andrada senior vice president, Partner Resources – U.S. and AmericasAdam Brotman senior vice president, Digital Ventures Chris Bruzzo senior vice president and chief marketing officer, Seattle’s Best Coffee Chris Carr senior vice president and general manager, Starbucks Licensed StoresTerry Davenport senior vice president, MarketingCorey duBrowa senior vice president, Global Communications and International Public Affairs Mary Egan senior vice president, Global StrategyMustafa El-Rafey senior vice president, Talent ManagementKris Engskov senior vice president and managing director, International Michael Fink senior vice president, deputy general counsel and assistant secretaryChris Gann senior vice president, Total PayCurtis Garner senior vice president, Business Technology Willard (Dub) Hay senior vice president, Global Coffee Authority Lucy Lee Helm senior vice president, deputy general counsel and assistant secretaryBuck Hendrix senior vice presidentGregory Javor senior vice president, Global LogisticsCharles Jemley senior vice president, Finance – InternationalLouis Jordan senior vice president, Corporate FinanceJames Koster senior vice president, Partner Resources – U.S. and Global Supply Chain OperationsPartha Kundu senior vice president, Global ManufacturingCosimo LaPorta senior vice president, Operations – Starbucks Coffee InternationalBarbara Le Marrec senior vice presidentStephen Lovejoy senior vice president, Supply Chain Operations Michael Malanga senior vice president, Americas and Global Real Estate, Global Store DevelopmentScott Maw senior vice president, global controllerJames McDermet senior vice president and general manager, Seattle’s Best Coffee Colin Moore senior vice president; president – Canada Paul Mutty senior vice president, deputy general counsel and assistant secretary Rich Nelsen senior vice president; general manager EMEAShannon Orr senior vice president, FinanceCraig Russell senior vice president, Store Services Ric Schneider senior vice president, ProcurementWilliam R. Transue senior vice president, Global Development Clarice Turner senior vice president, North DivisionMary K. Wagner senior vice president, Research and Development Jinlong Wang senior vice president; president – Asia PacificMark Wesley senior vice president, Global Development – EMEA Rossann Williams senior vice president, South Division Belinda Wong senior vice president; president – China
We believe that success is best when shared. The cover refl ects
the innovations and record-breaking achievements of FY11 and
early FY12. This success enabled us to give back to those who help
make our success possible—our partners, our communities and you.
As we look forward, we’re excited by ongoing innovation,
new channels of distribution, expansion into new markets,
and how these opportunit ies wil l al low us to make a
difference in even more communities around the world.
Keurig, the Cup and Star design, Keurig Brewed and K-Cup are registered trademarks of Keurig, Incorporatedused with permission. K-Cup® packs for use in Keurig® Brewing Systems.
© 2012 STARBUCKS CORPORATION. ALL RIGHTS RESERVED. SJBQ412OTH-00801