Embed Size (px)
Citation preview

Reproducible Pharmacometrics
Using Reproducible Research methodologies to improvepharmacometric analyses
Justin J Wilkins E Niclas Jonsson
22nd PAGE meeting
11-14 June, 2013Glasgow, Scotland
2
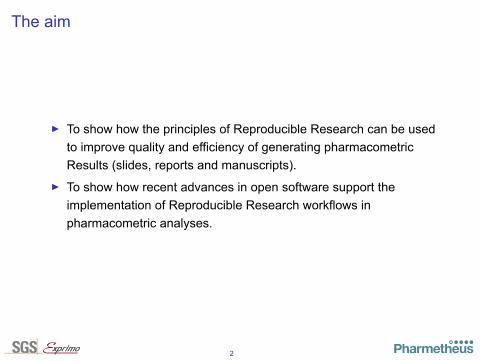
The aim
▶ To show how the principles of Reproducible Research can be usedto improve quality and efficiency of generating pharmacometricResults (slides, reports and manuscripts).
▶ To show how recent advances in open software support theimplementation of Reproducible Research workflows inpharmacometric analyses.
3
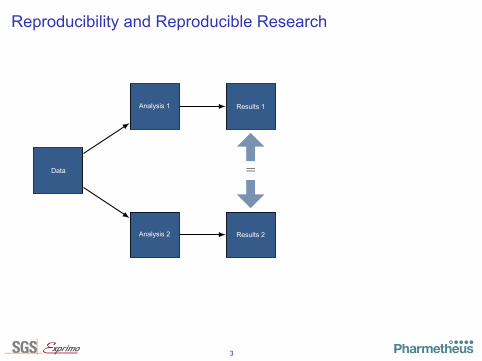
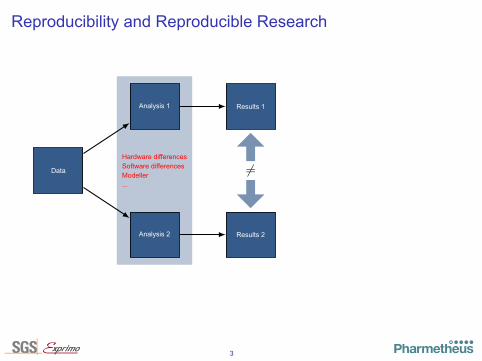
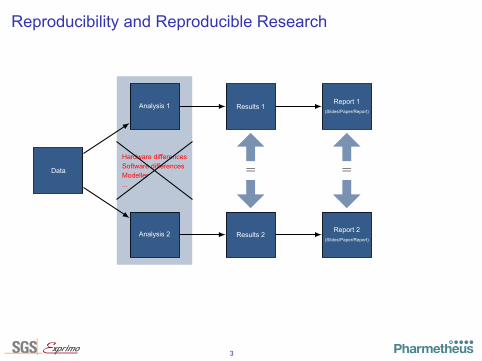
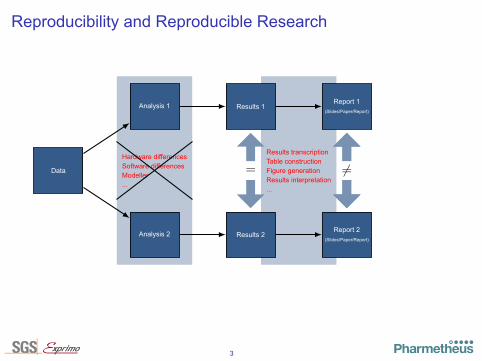
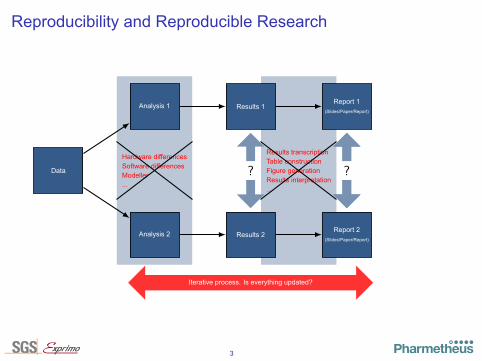
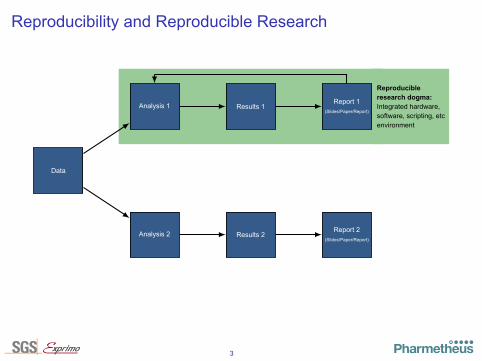
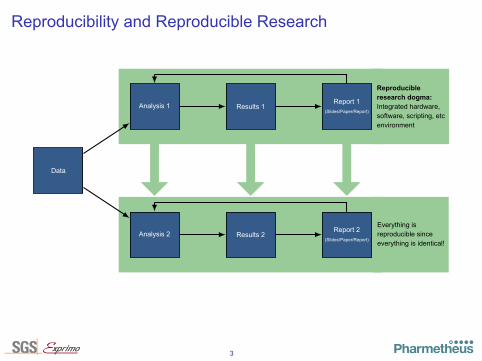
Reproducibility and Reproducible Research
.
..Hardware differencesSoftware differencesModeller...
..Hardware differencesSoftware differencesModeller...
..Results transcriptionTable constructionFigure generationResults interpretation...
..Results transcriptionTable constructionFigure generationResults interpretation...
..
Reproducibleresearch dogma:Integrated hardware,software, scripting, etcenvironment
..
Everything isreproducible sinceeverything is identical!
.Data.
Analysis 1
.
Results 1
.
Analysis 2
.
Results 2
... =
... ̸=... ?.
Report 1(Slides/Paper/Report)
.
Report 2(Slides/Paper/Report)
... =... ̸=... ?
.
Iterative process. Is everything updated?
...
3
Reproducibility and Reproducible Research
...Hardware differencesSoftware differencesModeller...
..Hardware differencesSoftware differencesModeller...
..Results transcriptionTable constructionFigure generationResults interpretation...
..Results transcriptionTable constructionFigure generationResults interpretation...
..
Reproducibleresearch dogma:Integrated hardware,software, scripting, etcenvironment
..
Everything isreproducible sinceeverything is identical!
.Data.
Analysis 1
.
Results 1
.
Analysis 2
.
Results 2
... =
... ̸=
... ?.
Report 1(Slides/Paper/Report)
.
Report 2(Slides/Paper/Report)
... =... ̸=... ?
.
Iterative process. Is everything updated?
...
3
Reproducibility and Reproducible Research
.
..Hardware differencesSoftware differencesModeller...
..Hardware differencesSoftware differencesModeller...
..Results transcriptionTable constructionFigure generationResults interpretation...
..Results transcriptionTable constructionFigure generationResults interpretation...
..
Reproducibleresearch dogma:Integrated hardware,software, scripting, etcenvironment
..
Everything isreproducible sinceeverything is identical!
.Data.
Analysis 1
.
Results 1
.
Analysis 2
.
Results 2
... =
... ̸=... ?
.
Report 1(Slides/Paper/Report)
.
Report 2(Slides/Paper/Report)
... =
... ̸=... ?.
Iterative process. Is everything updated?
...
3
Reproducibility and Reproducible Research
.
..Hardware differencesSoftware differencesModeller...
..Hardware differencesSoftware differencesModeller...
..Results transcriptionTable constructionFigure generationResults interpretation...
..Results transcriptionTable constructionFigure generationResults interpretation...
..
Reproducibleresearch dogma:Integrated hardware,software, scripting, etcenvironment
..
Everything isreproducible sinceeverything is identical!
.Data.
Analysis 1
.
Results 1
.
Analysis 2
.
Results 2
... =
... ̸=... ?
.
Report 1(Slides/Paper/Report)
.
Report 2(Slides/Paper/Report)
... =... ̸=
... ?.
Iterative process. Is everything updated?
...
3
Reproducibility and Reproducible Research
.
..Hardware differencesSoftware differencesModeller...
..Hardware differencesSoftware differencesModeller...
..Results transcriptionTable constructionFigure generationResults interpretation...
..Results transcriptionTable constructionFigure generationResults interpretation...
..
Reproducibleresearch dogma:Integrated hardware,software, scripting, etcenvironment
..
Everything isreproducible sinceeverything is identical!
.Data.
Analysis 1
.
Results 1
.
Analysis 2
.
Results 2
... =... ̸=
... ?.
Report 1(Slides/Paper/Report)
.
Report 2(Slides/Paper/Report)
... =
... ̸=
... ?.
Iterative process. Is everything updated?
...
3
Reproducibility and Reproducible Research
.
..Hardware differencesSoftware differencesModeller...
..Hardware differencesSoftware differencesModeller...
..Results transcriptionTable constructionFigure generationResults interpretation...
..Results transcriptionTable constructionFigure generationResults interpretation...
..
Reproducibleresearch dogma:Integrated hardware,software, scripting, etcenvironment
..
Everything isreproducible sinceeverything is identical!
.Data.
Analysis 1
.
Results 1
.
Analysis 2
.
Results 2
... =... ̸=... ?
.
Report 1(Slides/Paper/Report)
.
Report 2(Slides/Paper/Report)
... =... ̸=... ?.
Iterative process. Is everything updated?
...
4
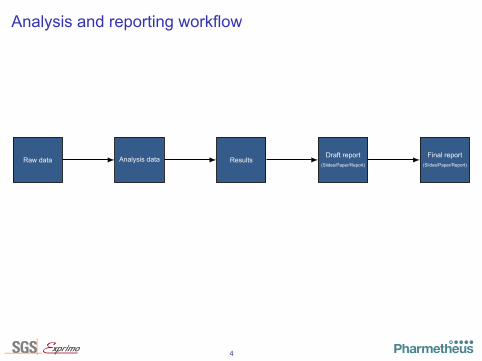
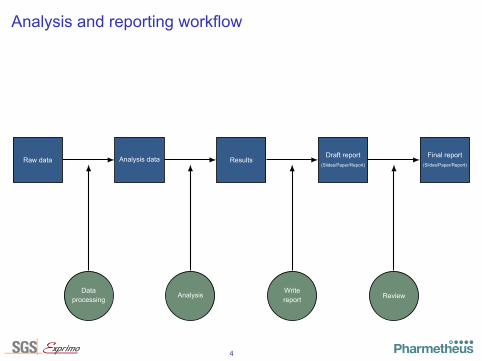
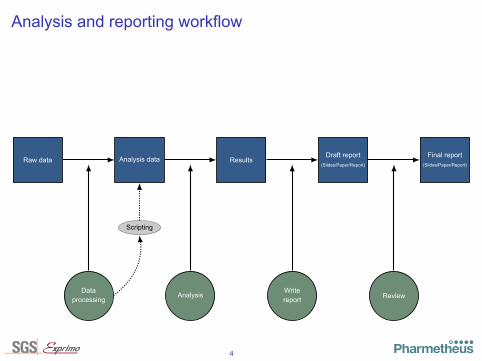
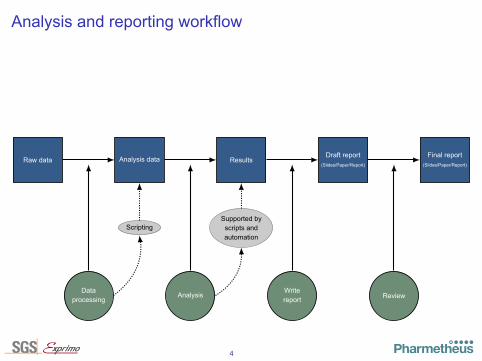
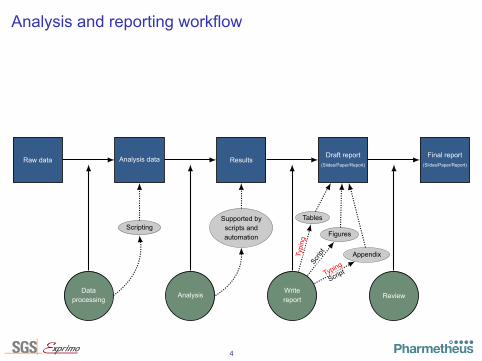
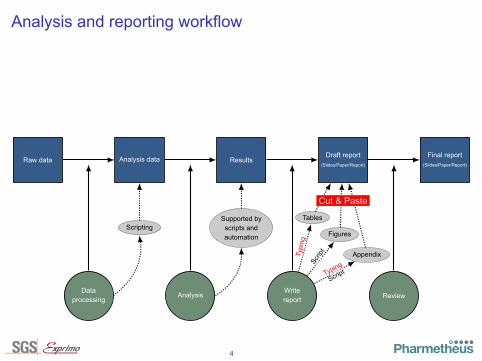
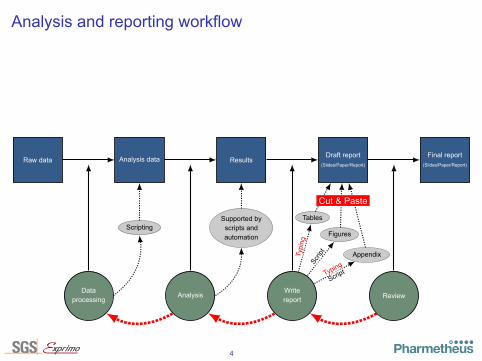
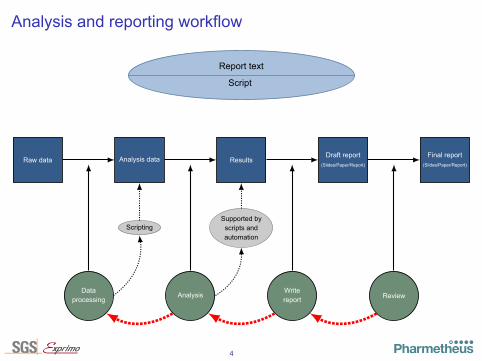
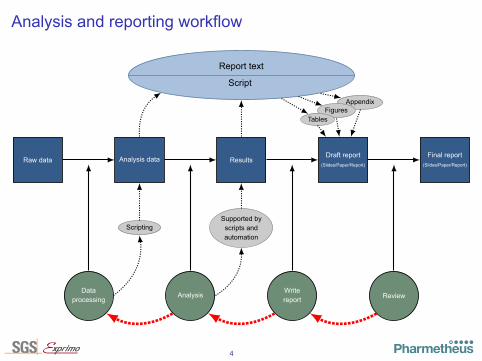
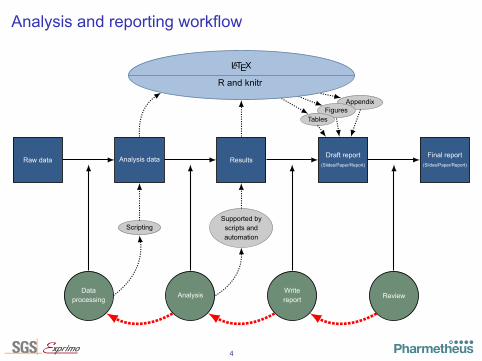
Analysis and reporting workflow
..Raw data.. Analysis data.. Results.. Draft report(Slides/Paper/Report)
.. Final report(Slides/Paper/Report)
.
Dataprocessing
.
Analysis
.
Writereport
.
Review
.
Scripting
.
Supported byscripts andautomation
.
Tables
.
Figures
.
Appendix
.
Typing
.
Script
.
Typing
.
Script
.
Cut & Paste
.
Report text
.
Script
.
Appendix
.
Figures
.
Tables
.
LATEX
.
R and knitr
4
Analysis and reporting workflow
..Raw data.. Analysis data.. Results.. Draft report(Slides/Paper/Report)
.. Final report(Slides/Paper/Report)
.
Dataprocessing
.
Analysis
.
Writereport
.
Review
.
Scripting
.
Supported byscripts andautomation
.
Tables
.
Figures
.
Appendix
.
Typing
.
Script
.
Typing
.
Script
.
Cut & Paste
.
Report text
.
Script
.
Appendix
.
Figures
.
Tables
.
LATEX
.
R and knitr
5
Software for Reproducible Research
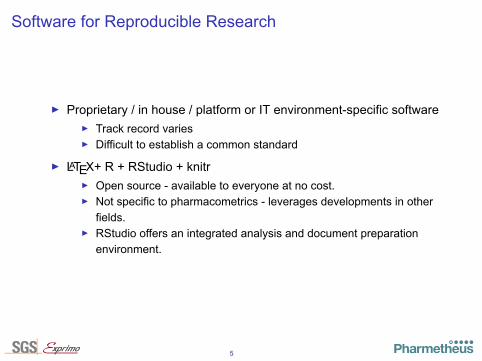
▶ Proprietary / in house / platform or IT environment-specific software▶ Track record varies▶ Difficult to establish a common standard
▶ LATEX+ R + RStudio + knitr▶ Open source - available to everyone at no cost.▶ Not specific to pharmacometrics - leverages developments in other
fields.▶ RStudio offers an integrated analysis and document preparation
environment.
5
Software for Reproducible Research
▶ Proprietary / in house / platform or IT environment-specific software▶ Track record varies▶ Difficult to establish a common standard
▶ LATEX+ R + RStudio + knitr▶ Open source - available to everyone at no cost.▶ Not specific to pharmacometrics - leverages developments in other
fields.▶ RStudio offers an integrated analysis and document preparation
environment.
6
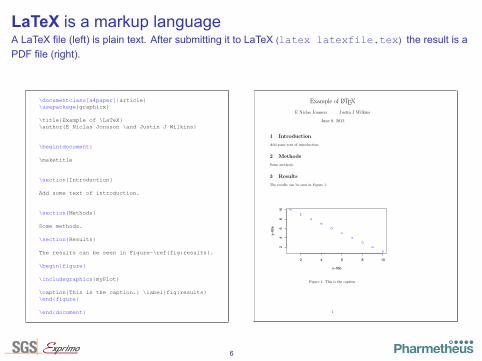
LaTeX is a markup languageA LaTeX file (left) is plain text. After submitting it to LaTeX (latex latexfile.tex) the result is aPDF file (right).
\documentclass[a4paper]{article}\usepackage{graphicx}
\title{Example of \LaTeX}\author{E Niclas Jonsson \and Justin J Wilkins}
\begin{document}
\maketitle
\section{Introduction}
Add some text of introduction.
\section{Methods}
Some methods.
\section{Results}
The results can be seen in Figure~\ref{fig:results}.
\begin{figure}
\includegraphics{myPlot}
\caption{This is the caption.} \label{fig:results}\end{figure}
\end{document}
Example of LATEX
E Niclas Jonsson Justin J Wilkins
June 9, 2013
1 Introduction
Add some text of introduction.
2 Methods
Some methods.
3 Results
The results can be seen in Figure 1.
2 4 6 8 10
24
68
10
x−titley−title
Figure 1: This is the caption.
1
7
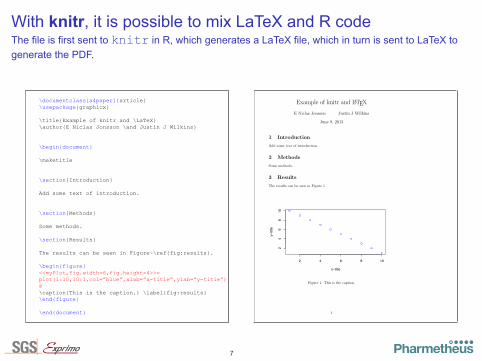
With knitr, it is possible to mix LaTeX and R codeThe file is first sent to knitr in R, which generates a LaTeX file, which in turn is sent to LaTeX togenerate the PDF.
\documentclass[a4paper]{article}\usepackage{graphicx}
\title{Example of knitr and \LaTeX}\author{E Niclas Jonsson \and Justin J Wilkins}
\begin{document}
\maketitle
\section{Introduction}
Add some text of introduction.
\section{Methods}
Some methods.
\section{Results}
The results can be seen in Figure~\ref{fig:results}.
\begin{figure}<<myPlot,fig.width=6,fig.height=4>>=plot(1:10,10:1,col=”blue”,xlab=”x-title”,ylab=”y-title”)@\caption{This is the caption.} \label{fig:results}\end{figure}
\end{document}
Example of knitr and LATEX
E Niclas Jonsson Justin J Wilkins
June 9, 2013
1 Introduction
Add some text of introduction.
2 Methods
Some methods.
3 Results
The results can be seen in Figure 1.
2 4 6 8 10
24
68
10
x−titley−title
Figure 1: This is the caption.
1
8
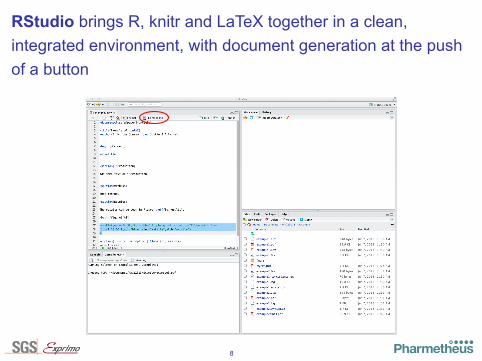
RStudio brings R, knitr and LaTeX together in a clean,integrated environment, with document generation at the pushof a button
...
9
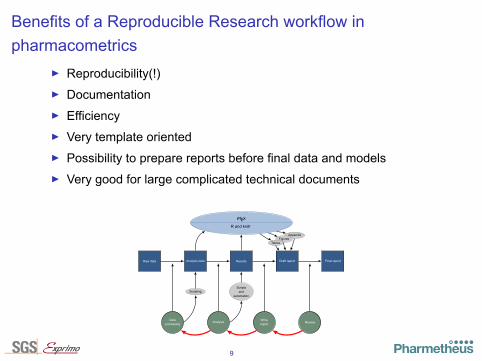
Benefits of a Reproducible Research workflow inpharmacometrics
▶ Reproducibility(!)▶ Documentation▶ Efficiency▶ Very template oriented▶ Possibility to prepare reports before final data and models▶ Very good for large complicated technical documents
$QDO\VLV DQG UHSRUWLQJ ZRUNIORZ
��5DZ GDWD�� $QDO\VLV GDWD�� 5HVXOWV�� 'UDIW UHSRUW�� )LQDO UHSRUW�
'DWDSURFHVVLQJ
�
$QDO\VLV
�
:ULWHUHSRUW
�
5HYLHZ
�
6FULSWLQJ
�
6FULSWVDQG
DXWRPDWLRQ
�
7DEOHV
�
)LJXUHV
�
$SSHQGL[
�
7\SLQJ
�
6FULSW
�
7\SLQJ
�
6FULSW
�
&XW 3DVWH
�
5HSRUW WH[W
�
6FULSW
�
$SSHQGL[
�
)LJXUHV
�
7DEOHV
�
/$7(;
�
5 DQG NQLWU
10
Drawbacks with LATEX and knitr
▶ Steep learning curve▶ Very template oriented▶ Integration into existing IT environments▶ Unfamiliar and archaic interface...
11
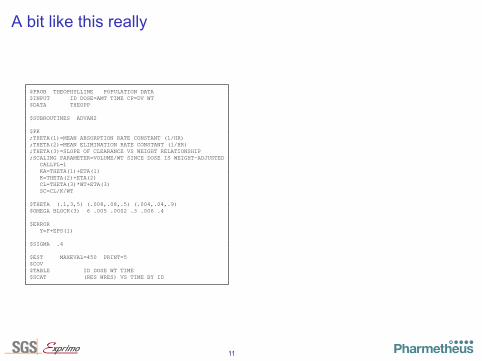
A bit like this really
$PROB THEOPHYLLINE POPULATION DATA$INPUT ID DOSE=AMT TIME CP=DV WT$DATA THEOPP
$SUBROUTINES ADVAN2
$PK;THETA(1)=MEAN ABSORPTION RATE CONSTANT (1/HR);THETA(2)=MEAN ELIMINATION RATE CONSTANT (1/HR);THETA(3)=SLOPE OF CLEARANCE VS WEIGHT RELATIONSHIP;SCALING PARAMETER=VOLUME/WT SINCE DOSE IS WEIGHT-ADJUSTED
CALLFL=1KA=THETA(1)+ETA(1)K=THETA(2)+ETA(2)CL=THETA(3)*WT+ETA(3)SC=CL/K/WT
$THETA (.1,3,5) (.008,.08,.5) (.004,.04,.9)$OMEGA BLOCK(3) 6 .005 .0002 .3 .006 .4
$ERRORY=F+EPS(1)
$SIGMA .4
$EST MAXEVAL=450 PRINT=5$COV$TABLE ID DOSE WT TIME$SCAT (RES WRES) VS TIME BY ID
\documentclass[a4paper]{article}\usepackage{graphicx}
\title{Example of \LaTeX}\author{E. Niclas Jonsson \and Justin J Wilkins}
\begin{document}
\maketitle
\section{Introduction}
Add some text of introduction.
\section{Methods}
Some methods.
\section{Results}
The results can be seen in Figure~\ref{fig:results}.
\begin{figure}
\includegraphics{myPlot}
\caption{This is the caption.} \label{fig:results}\end{figure}
\end{document}
11
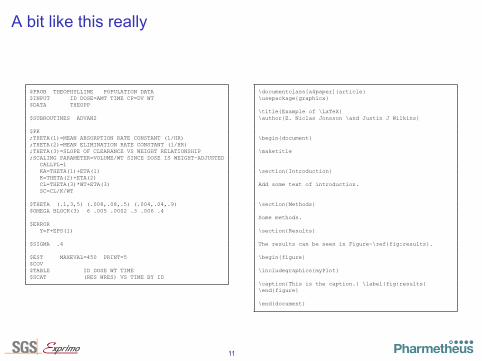
A bit like this really
$PROB THEOPHYLLINE POPULATION DATA$INPUT ID DOSE=AMT TIME CP=DV WT$DATA THEOPP
$SUBROUTINES ADVAN2
$PK;THETA(1)=MEAN ABSORPTION RATE CONSTANT (1/HR);THETA(2)=MEAN ELIMINATION RATE CONSTANT (1/HR);THETA(3)=SLOPE OF CLEARANCE VS WEIGHT RELATIONSHIP;SCALING PARAMETER=VOLUME/WT SINCE DOSE IS WEIGHT-ADJUSTED
CALLFL=1KA=THETA(1)+ETA(1)K=THETA(2)+ETA(2)CL=THETA(3)*WT+ETA(3)SC=CL/K/WT
$THETA (.1,3,5) (.008,.08,.5) (.004,.04,.9)$OMEGA BLOCK(3) 6 .005 .0002 .3 .006 .4
$ERRORY=F+EPS(1)
$SIGMA .4
$EST MAXEVAL=450 PRINT=5$COV$TABLE ID DOSE WT TIME$SCAT (RES WRES) VS TIME BY ID
\documentclass[a4paper]{article}\usepackage{graphicx}
\title{Example of \LaTeX}\author{E. Niclas Jonsson \and Justin J Wilkins}
\begin{document}
\maketitle
\section{Introduction}
Add some text of introduction.
\section{Methods}
Some methods.
\section{Results}
The results can be seen in Figure~\ref{fig:results}.
\begin{figure}
\includegraphics{myPlot}
\caption{This is the caption.} \label{fig:results}\end{figure}
\end{document}
12
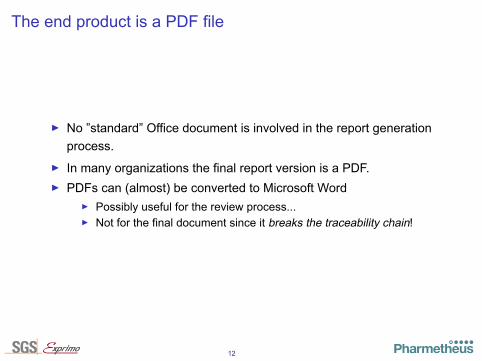
The end product is a PDF file
▶ No ”standard” Office document is involved in the report generationprocess.
▶ In many organizations the final report version is a PDF.▶ PDFs can (almost) be converted to Microsoft Word
▶ Possibly useful for the review process...▶ Not for the final document since it breaks the traceability chain!
13
And now, a live demonstration!Because we know you won’t believe us when
we tell you it’s easy.
14
Conclusions
Reproducible Research methodology:▶ improves consistency and efficiency of pharmacometric analyses
and report generation.▶ is not particularly difficult to implement.▶ enhances both technical and scientific quality.
Come visit us in our booth!


![0 Prepared by (15pt Arial) [Insert name of presenter 15pt Arial Bold] [Insert title] [Insert Hospital name] Month 200X (12pt Arial Bold) Understanding](https://img.pdfslide.net/doc/110x75/56649dab5503460f94a99c22/0-prepared-by-15pt-arial-insert-name-of-presenter-15pt-arial-bold-insert.jpg)


![IFT-6521 [15pt] PROGRAMMATION DYNAMIQUE [25pt] Chapitre 1](https://img.pdfslide.net/doc/110x75/62aad0f2230054385a62c264/ift-6521-15pt-programmation-dynamique-25pt-chapitre-1-.jpg)