Embed Size (px)
Citation preview
Republic of Kiribati Ministry of Education, Youth and Sports Digest of Education Statistics 2005

Digest of Education Statistics 2005
Republic of Kiribati Ministry of Education, Youth and Sports Digest of Education Statistics 2005 A publication of the MEYS Statistics Unit © MEYS 2005
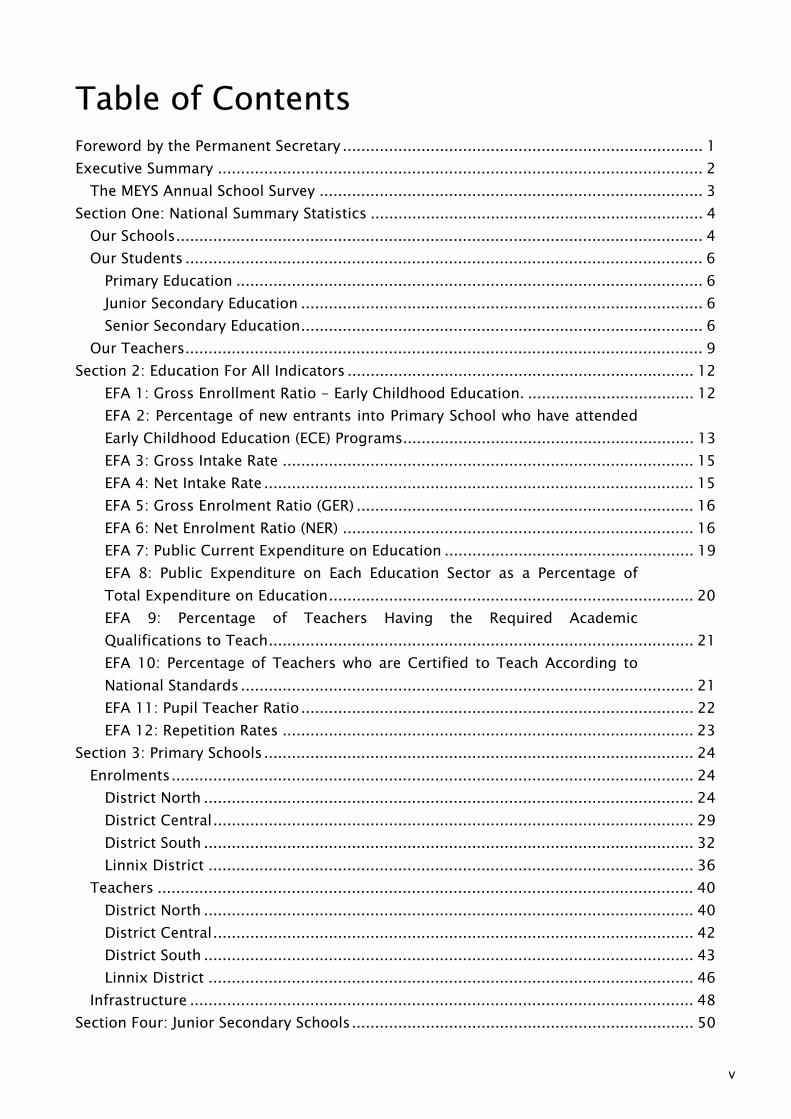
Table of Contents Foreword by the Permanent Secretary .............................................................................. 1 Executive Summary ......................................................................................................... 2
The MEYS Annual School Survey ................................................................................... 3 Section One: National Summary Statistics ........................................................................ 4
Our Schools.................................................................................................................. 4 Our Students ................................................................................................................ 6
Primary Education ..................................................................................................... 6 Junior Secondary Education ....................................................................................... 6 Senior Secondary Education....................................................................................... 6
Our Teachers................................................................................................................ 9 Section 2: Education For All Indicators ........................................................................... 12
EFA 1: Gross Enrollment Ratio - Early Childhood Education. .................................... 12 EFA 2: Percentage of new entrants into Primary School who have attended Early Childhood Education (ECE) Programs............................................................... 13 EFA 3: Gross Intake Rate ......................................................................................... 15 EFA 4: Net Intake Rate ............................................................................................. 15 EFA 5: Gross Enrolment Ratio (GER) ......................................................................... 16 EFA 6: Net Enrolment Ratio (NER) ............................................................................ 16 EFA 7: Public Current Expenditure on Education ...................................................... 19 EFA 8: Public Expenditure on Each Education Sector as a Percentage of Total Expenditure on Education............................................................................... 20 EFA 9: Percentage of Teachers Having the Required Academic Qualifications to Teach............................................................................................ 21 EFA 10: Percentage of Teachers who are Certified to Teach According to National Standards .................................................................................................. 21 EFA 11: Pupil Teacher Ratio..................................................................................... 22 EFA 12: Repetition Rates ......................................................................................... 23
Section 3: Primary Schools............................................................................................. 24 Enrolments................................................................................................................. 24
District North .......................................................................................................... 24 District Central........................................................................................................ 29 District South .......................................................................................................... 32 Linnix District ......................................................................................................... 36
Teachers .................................................................................................................... 40 District North .......................................................................................................... 40 District Central........................................................................................................ 42 District South .......................................................................................................... 43 Linnix District ......................................................................................................... 46
Infrastructure ............................................................................................................. 48 Section Four: Junior Secondary Schools.......................................................................... 50
v
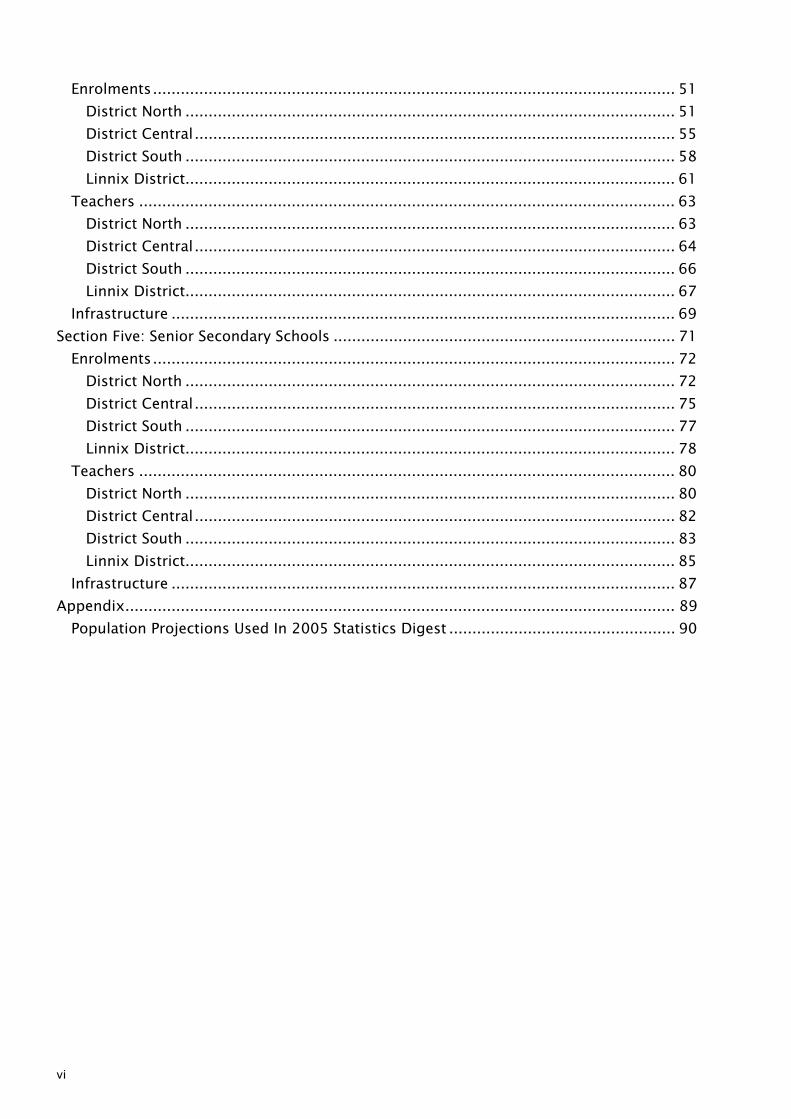
Enrolments................................................................................................................. 51 District North .......................................................................................................... 51 District Central........................................................................................................ 55 District South .......................................................................................................... 58 Linnix District.......................................................................................................... 61
Teachers .................................................................................................................... 63 District North .......................................................................................................... 63 District Central........................................................................................................ 64 District South .......................................................................................................... 66 Linnix District.......................................................................................................... 67
Infrastructure ............................................................................................................. 69 Section Five: Senior Secondary Schools .......................................................................... 71
Enrolments................................................................................................................. 72 District North .......................................................................................................... 72 District Central........................................................................................................ 75 District South .......................................................................................................... 77 Linnix District.......................................................................................................... 78
Teachers .................................................................................................................... 80 District North .......................................................................................................... 80 District Central........................................................................................................ 82 District South .......................................................................................................... 83 Linnix District.......................................................................................................... 85
Infrastructure ............................................................................................................. 87 Appendix....................................................................................................................... 89
Population Projections Used In 2005 Statistics Digest ................................................. 90
vi
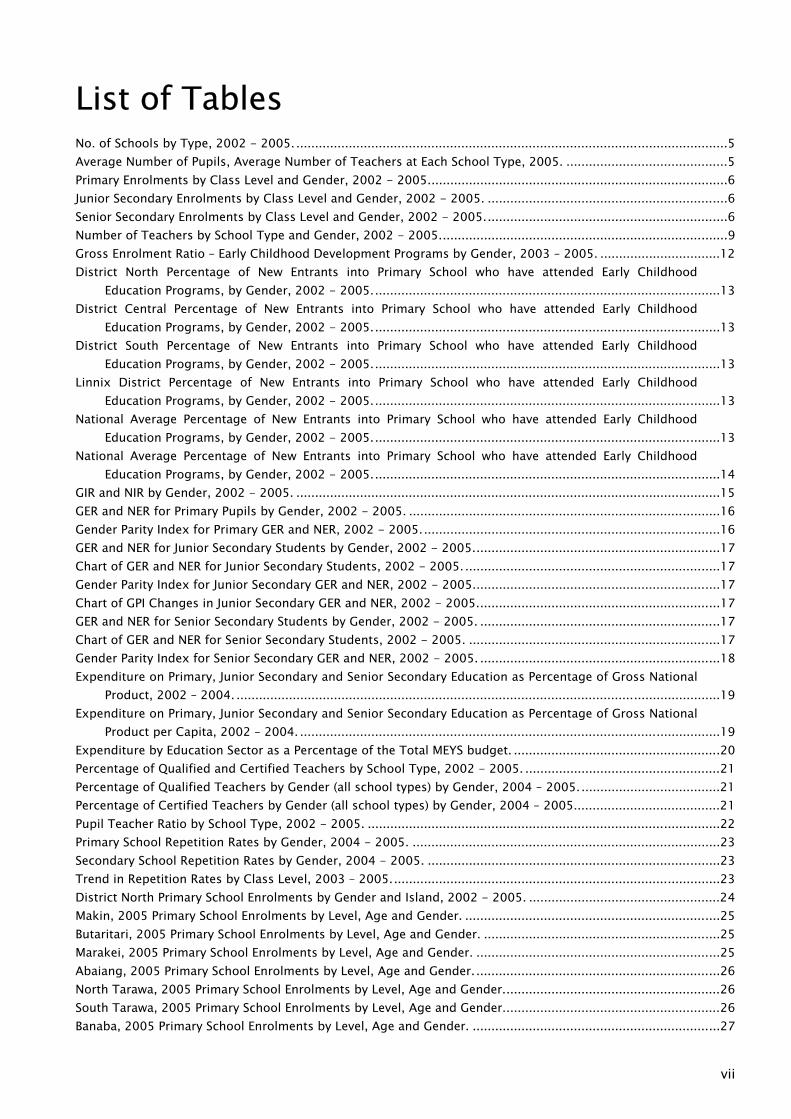
List of Tables No. of Schools by Type, 2002 - 2005. ...................................................................................................................5 Average Number of Pupils, Average Number of Teachers at Each School Type, 2005. ...........................................5 Primary Enrolments by Class Level and Gender, 2002 - 2005................................................................................6 Junior Secondary Enrolments by Class Level and Gender, 2002 - 2005. ................................................................6 Senior Secondary Enrolments by Class Level and Gender, 2002 - 2005.................................................................6 Number of Teachers by School Type and Gender, 2002 - 2005.............................................................................9 Gross Enrolment Ratio – Early Childhood Development Programs by Gender, 2003 – 2005. ................................12 District North Percentage of New Entrants into Primary School who have attended Early Childhood
Education Programs, by Gender, 2002 - 2005.............................................................................................13 District Central Percentage of New Entrants into Primary School who have attended Early Childhood
Education Programs, by Gender, 2002 - 2005.............................................................................................13 District South Percentage of New Entrants into Primary School who have attended Early Childhood
Education Programs, by Gender, 2002 - 2005.............................................................................................13 Linnix District Percentage of New Entrants into Primary School who have attended Early Childhood
Education Programs, by Gender, 2002 - 2005.............................................................................................13 National Average Percentage of New Entrants into Primary School who have attended Early Childhood
Education Programs, by Gender, 2002 - 2005.............................................................................................13 National Average Percentage of New Entrants into Primary School who have attended Early Childhood
Education Programs, by Gender, 2002 - 2005.............................................................................................14 GIR and NIR by Gender, 2002 - 2005. .................................................................................................................15 GER and NER for Primary Pupils by Gender, 2002 - 2005. ...................................................................................16 Gender Parity Index for Primary GER and NER, 2002 - 2005................................................................................16 GER and NER for Junior Secondary Students by Gender, 2002 - 2005..................................................................17 Chart of GER and NER for Junior Secondary Students, 2002 - 2005. ....................................................................17 Gender Parity Index for Junior Secondary GER and NER, 2002 - 2005..................................................................17 Chart of GPI Changes in Junior Secondary GER and NER, 2002 - 2005.................................................................17 GER and NER for Senior Secondary Students by Gender, 2002 - 2005. ................................................................17 Chart of GER and NER for Senior Secondary Students, 2002 - 2005. ...................................................................17 Gender Parity Index for Senior Secondary GER and NER, 2002 - 2005. ................................................................18 Expenditure on Primary, Junior Secondary and Senior Secondary Education as Percentage of Gross National
Product, 2002 – 2004. .................................................................................................................................19 Expenditure on Primary, Junior Secondary and Senior Secondary Education as Percentage of Gross National
Product per Capita, 2002 – 2004. ................................................................................................................19 Expenditure by Education Sector as a Percentage of the Total MEYS budget. .......................................................20 Percentage of Qualified and Certified Teachers by School Type, 2002 - 2005. ....................................................21 Percentage of Qualified Teachers by Gender (all school types) by Gender, 2004 – 2005......................................21 Percentage of Certified Teachers by Gender (all school types) by Gender, 2004 – 2005.......................................21 Pupil Teacher Ratio by School Type, 2002 - 2005. ..............................................................................................22 Primary School Repetition Rates by Gender, 2004 - 2005. ..................................................................................23 Secondary School Repetition Rates by Gender, 2004 - 2005. ..............................................................................23 Trend in Repetition Rates by Class Level, 2003 – 2005........................................................................................23 District North Primary School Enrolments by Gender and Island, 2002 - 2005. ...................................................24 Makin, 2005 Primary School Enrolments by Level, Age and Gender. ....................................................................25 Butaritari, 2005 Primary School Enrolments by Level, Age and Gender. ...............................................................25 Marakei, 2005 Primary School Enrolments by Level, Age and Gender. .................................................................25 Abaiang, 2005 Primary School Enrolments by Level, Age and Gender. .................................................................26 North Tarawa, 2005 Primary School Enrolments by Level, Age and Gender..........................................................26 South Tarawa, 2005 Primary School Enrolments by Level, Age and Gender..........................................................26 Banaba, 2005 Primary School Enrolments by Level, Age and Gender. ..................................................................27
vii
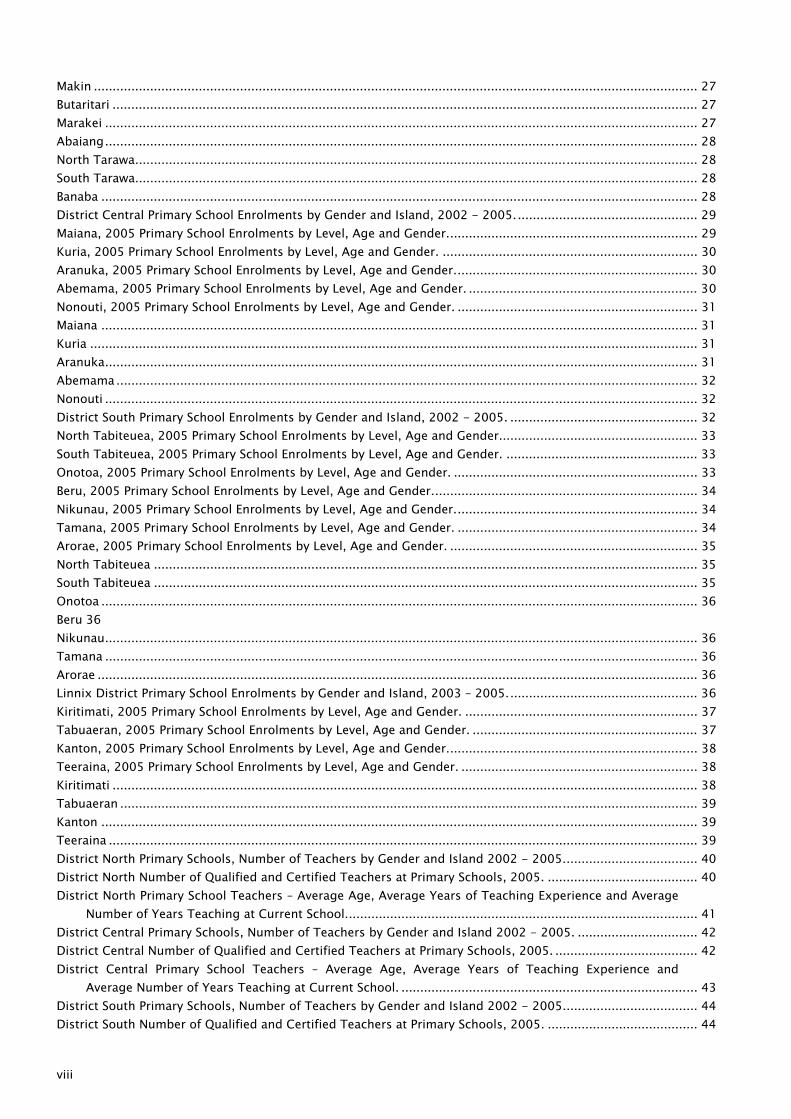
Makin ................................................................................................................................................................. 27 Butaritari ............................................................................................................................................................ 27 Marakei .............................................................................................................................................................. 27 Abaiang.............................................................................................................................................................. 28 North Tarawa...................................................................................................................................................... 28 South Tarawa...................................................................................................................................................... 28 Banaba ............................................................................................................................................................... 28 District Central Primary School Enrolments by Gender and Island, 2002 - 2005................................................. 29 Maiana, 2005 Primary School Enrolments by Level, Age and Gender................................................................... 29 Kuria, 2005 Primary School Enrolments by Level, Age and Gender. .................................................................... 30 Aranuka, 2005 Primary School Enrolments by Level, Age and Gender................................................................. 30 Abemama, 2005 Primary School Enrolments by Level, Age and Gender. ............................................................. 30 Nonouti, 2005 Primary School Enrolments by Level, Age and Gender. ................................................................ 31 Maiana ............................................................................................................................................................... 31 Kuria .................................................................................................................................................................. 31 Aranuka.............................................................................................................................................................. 31 Abemama........................................................................................................................................................... 32 Nonouti .............................................................................................................................................................. 32 District South Primary School Enrolments by Gender and Island, 2002 - 2005. .................................................. 32 North Tabiteuea, 2005 Primary School Enrolments by Level, Age and Gender..................................................... 33 South Tabiteuea, 2005 Primary School Enrolments by Level, Age and Gender. ................................................... 33 Onotoa, 2005 Primary School Enrolments by Level, Age and Gender. ................................................................. 33 Beru, 2005 Primary School Enrolments by Level, Age and Gender....................................................................... 34 Nikunau, 2005 Primary School Enrolments by Level, Age and Gender................................................................. 34 Tamana, 2005 Primary School Enrolments by Level, Age and Gender. ................................................................ 34 Arorae, 2005 Primary School Enrolments by Level, Age and Gender. .................................................................. 35 North Tabiteuea ................................................................................................................................................. 35 South Tabiteuea ................................................................................................................................................. 35 Onotoa ............................................................................................................................................................... 36 Beru 36 Nikunau.............................................................................................................................................................. 36 Tamana .............................................................................................................................................................. 36 Arorae ................................................................................................................................................................ 36 Linnix District Primary School Enrolments by Gender and Island, 2003 – 2005................................................... 36 Kiritimati, 2005 Primary School Enrolments by Level, Age and Gender. .............................................................. 37 Tabuaeran, 2005 Primary School Enrolments by Level, Age and Gender. ............................................................ 37 Kanton, 2005 Primary School Enrolments by Level, Age and Gender................................................................... 38 Teeraina, 2005 Primary School Enrolments by Level, Age and Gender. ............................................................... 38 Kiritimati ............................................................................................................................................................ 38 Tabuaeran .......................................................................................................................................................... 39 Kanton ............................................................................................................................................................... 39 Teeraina ............................................................................................................................................................. 39 District North Primary Schools, Number of Teachers by Gender and Island 2002 - 2005.................................... 40 District North Number of Qualified and Certified Teachers at Primary Schools, 2005. ........................................ 40 District North Primary School Teachers – Average Age, Average Years of Teaching Experience and Average
Number of Years Teaching at Current School.............................................................................................. 41 District Central Primary Schools, Number of Teachers by Gender and Island 2002 - 2005. ................................ 42 District Central Number of Qualified and Certified Teachers at Primary Schools, 2005. ...................................... 42 District Central Primary School Teachers – Average Age, Average Years of Teaching Experience and
Average Number of Years Teaching at Current School. ............................................................................... 43 District South Primary Schools, Number of Teachers by Gender and Island 2002 - 2005.................................... 44 District South Number of Qualified and Certified Teachers at Primary Schools, 2005. ........................................ 44
viii
District South Primary School Teachers – Average Age, Average Years of Teaching Experience and Average Number of Years Teaching at Current School...............................................................................................45
Linnix District Primary Schools, Number of Teachers by Gender and Island 2002 - 2005. ...................................46 Linnix District Number of Qualified and Certified Teachers at Primary Schools, 2005..........................................46 Linnix District Primary School Teachers – Average Age, Average Years of Teaching Experience and Average
Number of Years Teaching at Current School...............................................................................................47 Primary Schools Average Number of Pupils Per Classroom, Average Space per Pupil in the Classroom and
Average Size of Classrooms by District, 2005..............................................................................................48 Primary School Pupil to Toilet Ratios by District, 2005. .......................................................................................48 District North Primary Schools, Percentage of Pupils with Access to Clean and Safe Water, by Island, 2002 -
2005. ..........................................................................................................................................................48 District Central Primary Schools, Percentage of Pupils with Access to Clean and Safe Water, by Island, 2002
- 2005.........................................................................................................................................................48 District South Primary Schools, Percentage of Pupils with Access to Clean and Safe Water, by Island, 2002 -
2005. ..........................................................................................................................................................49 Linnix District Primary Schools, Percentage of Pupils with Access to Clean and Safe Water, by Island, 2002
- 2005.........................................................................................................................................................49 District North Junior Secondary Enrolments by Gender and Island, 2002 - 2005. ................................................51 District North 2005 Junior Secondary Enrolments by Gender, Level and Island ....................................................51 Makin JSS, Makin, Junior Secondary Enrolments by Level, Age and Gender. .........................................................52 Butaritari JSS, Butaritari, Junior Secondary Enrolments by Level, Age and Gender.................................................52 Aontena JSS, Marakei, Junior Secondary Enrolments by Level, Age and Gender. ...................................................52 Ueen Abaiang JSS, Abaiang, Junior Secondary Enrolments by Level, Age and Gender. ..........................................53 Eutantarawaieta JSS, North Tarawa, Junior Secondary Enrolments by Level, Age and Gender................................53 TUC1 JSS, South Tarawa, Junior Secondary Enrolments by Level, Age and Gender................................................53 TUC2 JSS, South Tarawa, Junior Secondary Enrolments by Level, Age and Gender................................................54 Betio JSS, South Tarawa, Junior Secondary Enrolments by Level, Age and Gender. ...............................................54 Moroni High School, South Tarawa, Junior Secondary Enrolments by Level, Age and Gender. ..............................54 Banaba JSS, Banaba, Junior Secondary Enrolments by Level, Age and Gender.......................................................55 District Central Junior Secondary Enrolments by Gender and Island, 2002 - 2005...............................................55 Tewaiwai JSS, Maiana, Junior Secondary Enrolments by Level, Age and Gender. ...................................................56 Nibwan te Waaki JSS, Kuria, Junior Secondary Enrolments by Level, Age and Gender. ..........................................56 Kauake JSS, Aranuka, Junior Secondary Enrolments by Level, Age and Gender. ....................................................56 Boutoka te Baretaiti JSS, Abemama, Junior Secondary Enrolments by Level, Age and Gender. ..............................57 Kauma High School, Abemama, Junior Secondary Enrolments by Level, Age and Gender. ....................................57 Nonouti JSS, Nonouti, Junior Secondary Enrolments by Level, Age and Gender. ...................................................57 District South Junior Secondary Enrolments by Gender and Island, 2002 - 2005. ................................................58 Takoronga JSS, North Tabiteuea, Junior Secondary Enrolments by Level, Age and Gender. ..................................58 Tebouria JSS, South Tabiteuea, Junior Secondary Enrolments by Level, Age and Gender. .....................................59 Tebuoata JSS, Onotoa, Junior Secondary Enrolments by Level, Age and Gender. ..................................................59 JSS Beru, Beru, Junior Secondary Enrolments by Level, Age and Gender. ..............................................................59 JSS Nikunau, Nikunau, Junior Secondary Enrolments by Level, Age and Gender. ..................................................60 Nawai JSS, Tamana, Junior Secondary Enrolments by Level, Age and Gender........................................................60 JSS Arorae, Arorae, Junior Secondary Enrolments by Level, Age and Gender. .......................................................60 Linnix District Junior Secondary Enrolments by Gender and Island, 2002 - 2005. ...............................................61 JSS Teraina, Teraina, Junior Secondary Enrolments by Level, Age and Gender. .....................................................61 JSS/TRW, Kiritimati, Junior Secondary Enrolments by Level, Age and Gender. ......................................................62 Keina Tito JSS, Tabuaeran, Junior Secondary Enrolments by Level, Age and Gender. ............................................62 District North Junior Secondary Schools, Number of Teachers by Gender 2002 - 2005. ......................................63 District North Number of Qualified and Certified Teachers at Junior Secondary Schools. .....................................63 District North Junior Secondary School Teachers – Average Age, Average Years of Teaching Experience and
Average Number of Years Teaching at Current School. ................................................................................64
ix
District Central Junior Secondary Schools, Number of Teachers by Gender 2002 - 2005. ................................... 64 District Central Number of Qualified and Certified Teachers at Junior Secondary Schools................................... 65 District Central Junior Secondary School Teachers – Average Age, Average Years of Teaching Experience
and Average Number of Years Teaching at Current School. ........................................................................ 65 District South Junior Secondary Schools, Number of Teachers by Gender 2002 - 2005. ..................................... 66 District South Number of Qualified and Certified Teachers at Junior Secondary Schools. .................................... 66 District South Junior Secondary School Teachers – Average Age, Average Years of Teaching Experience and
Average Number of Years Teaching at Current School. ............................................................................... 66 Linnix District Junior Secondary Schools, Number of Teachers by Gender 2002 - 2005...................................... 67 Linnix District Number of Qualified and Certified Teachers at Junior Secondary Schools..................................... 67 Linnix District Junior Secondary School Teachers – Average Age, Average Years of Teaching Experience and
Average Number of Years Teaching at Current School. ............................................................................... 68 Junior Secondary Schools Average Number of Pupils Per Classroom, Average Space per Pupil in the
Classroom and Average Size of Classrooms by District, 2005..................................................................... 69 Junior Secondary Schools Pupil to Toilet Ratio by District and Gender, 2005. ..................................................... 69 Junior Secondary Schools Percentage of Pupils with Access to Clean and Safe Water by District, 2002 -
2005........................................................................................................................................................... 69 District North Senior Secondary Enrolments by Gender and Island, 2002 - 2005................................................ 72 District North 2005 Senior Secondary School Enrolments by Gender, Level and Island........................................ 72 St. Joseph’s College, Abaiang, Senior Secondary Enrolments by Level, Age and Gender. ..................................... 72 Stephen Whitmee High School, Abaiang, Senior Secondary Enrolments by Level, Age and Gender, 2005. ........... 73 Immaculate Heart College, North Tarawa, Senior Secondary Enrolments by Level, Age and Gender, 2005. ......... 73 Church of God High School, South Tarawa, Senior Secondary Enrolments by Level, Age and Gender, 2005. ....... 73 King George V & Elaine Bernacchi, South Tarawa, Senior Secondary Enrolments by Level, Age and Gender,
2005........................................................................................................................................................... 74 Moroni High School, South Tarawa, Senior Secondary Enrolments by Level, Age and Gender, 2005.................... 74 Sacred Heart High School, South Tarawa, Senior Secondary Enrolments by Level, Age and Gender, 2005. .......... 74 St. Louis High School, South Tarawa, Senior Secondary Enrolments by Level, Age and Gender, 2005. ................ 75 William Goward Memorial School, South Tarawa, Senior Secondary Enrolments by Level, Age and Gender,
2005........................................................................................................................................................... 75 District Central Senior Secondary School Enrolments by Gender and Island, 2003 – 2005. ................................. 75 Kauma High School, Abemama, Senior Secondary Enrolments by Level, Age and Gender, 2005. ........................ 76 George Eastman High School, Nonouti, Senior Secondary Enrolments by Level, Age and Gender, 2005. ............. 76 District South Senior Secondary School Enrolments by Gender and Island, 2003 – 2005..................................... 77 District South 2005 Senior Secondary School Enrolments by Gender, Level and Island. ...................................... 77 Teabike College, North Tabiteuea, Senior Secondary Enrolments by Level, Age and Gender, 2005. .................... 77 Hiram Bingham High School, Beru, Senior Secondary Enrolments by Level, Age and Gender, 2005..................... 78 Linnix District Senior Secondary School Enrolments by Gender and Island, 2003 – 2005. ................................... 78 St. Francis High School, Kiritimati, Senior Secondary Enrolments by Level, Age and Gender, 2005. .................... 79 Meleangi Tabai High School, Tabuaeran, Senior Secondary Enrolments by Level, Age and Gender, 2005............ 79 Abaiang Senior Secondary Schools, Number of Teachers by Gender 2002 – 2005. ............................................. 80 North Tarawa Senior Secondary Schools, Number of Teachers by Gender 2002 – 2005. ..................................... 80 South Tarawa Senior Secondary Schools, Number of Teachers by Gender 2002 -2005....................................... 80 District North Number of Qualified and Certified Teachers at Senior Secondary Schools..................................... 80 District North Senior Secondary School Teachers – Average Age, Average Years of Teaching Experience and
Average Number of Years Teaching at Current School. ............................................................................... 81 Abemama Senior Secondary School, Number of Teachers by Gender 2002 – 2005. ............................................ 82 Nonouti Senior Secondary School, Number of Teachers by Gender 2002 – 2005. ............................................... 82 District Central Number of Qualified and Certified Teachers at Senior Secondary Schools. ................................. 82 District Central Senior Secondary School Teachers – Average Age, Average Years of Teaching Experience
and Average Number of Years Teaching at Current School. ........................................................................ 83 Beru Senior Secondary School, Number of Teachers by Gender 2002 – 2005...................................................... 83
x
North Tabiteuea Senior Secondary School, Number of Teachers by Gender 2002 – 2005.....................................83 District South Number of Qualified and Certified Teachers at Senior Secondary Schools......................................84 District South Senior Secondary School Teachers – Average Age, Average Years of Teaching Experience and
Average Number of Years Teaching at Current School. ................................................................................84 Kiritimati Senior Secondary School, Number of Teachers by Gender 2002 – 2005. ..............................................85 Tabuaeran Senior Secondary School, Number of Teachers by Gender 2002 – 2005. ............................................85 Linnix District Number of Qualified and Certified Teachers at Senior Secondary Schools. ....................................85 Linnix District Senior Secondary School Teachers – Average Age, Average Years of Teaching Experience
and Average Number of Years Teaching at Current School. .........................................................................86 Combined Secondary Schools Average Number of Pupils Per Classroom, Average Space per Pupil in the
Classroom and Average Size of Classrooms by District, 2005......................................................................87 Senior Secondary Schools Average Number of Pupils Per Classroom, Average Space per Pupil in the
Classroom and Average Size of Classrooms by District, 2005......................................................................87 Combined Secondary Schools Pupil to Toilet Ratio by District and Gender, 2005.................................................87 Senior Secondary Schools Pupil to Toilet Ratio by District and Gender, 2005.......................................................87 Combined Secondary Schools Percentage of Pupils with Access to Clean and Safe Water by District, 2002 -
2005. ..........................................................................................................................................................88 Senior Secondary Schools Percentage of Pupils with Access to Clean and Safe Water by District, 2002 -
2005. ..........................................................................................................................................................88 Secondary Schools (SS and CS) Boarder to Dormitory Ratio by District, 2003 – 2005. ..........................................88 National Projected Population Data for 0-25 Year Olds, 2005 .............................................................................90
xi
List of Figures Chart of Number of JSS, CS and SS Schools, 2002 - 2005......................................................................................5 Chart of Changes in Enrolments by School Sector, 2002 - 2005............................................................................7 Enrolments by Gender at Each School Level, 2005. ................................................................................................7 Chart of Teacher Numbers by School Type, 2002 - 2005. .....................................................................................9 Changes in Proportion of Teachers with Minimum Required Academic Qualifications by School Type, 2002
- 2005........................................................................................................................................................ 10 Changes in the Proportion of Teachers who Have Completed Teacher Training by School Type, 2002 -
2005........................................................................................................................................................... 10 Proportion of Teachers who are Female by School Type, 2005. .......................................................................... 11 Chart of Changes in GER ECD, 2003 – 2005. ...................................................................................................... 12 Chart of GIR and NIR, 2002 - 2005. ................................................................................................................... 15 Gender Parity Index for GIR and NIR, 2002 - 2005. ............................................................................................ 15 Chart of Changes in GPI, 2002 - 2005................................................................................................................ 15 Chart of GER and NER for Primary Pupils, 2002 - 2005. ..................................................................................... 16 Chart of GPI Changes in Primary GER and NER, 2002 - 2005. ............................................................................. 16 Chart of GPI Changes in Junior Secondary GER and NER, 2002 - 2005................................................................ 18 Chart of Expenditure on Primary, Junior Secondary and Senior Secondary Education as Percentage of Gross
National Product, 2002 – 2004. .................................................................................................................. 19 Chart of Expenditure on Primary, Junior Secondary and Senior Secondary Education as Percentage of Gross
National Product per Capita, 2002 – 2004. ................................................................................................. 19 Chart of Expenditure by Education Sector as a Percentage of the Total MEYS Budget.......................................... 20 Chart of Proportion of Teachers who are Certified, by Age Group....................................................................... 21 Chart of Pupil Teacher Ratios by School Type, 2002 - 2005. .............................................................................. 22 Chart of Changes in Primary School Enrolments, District North 2002 - 2005. .................................................... 24 Chart of Changes in Primary School Enrolments, District Central 2002 - 2005................................................... 29 Chart of Changes in Primary School Enrolments, District South 2002 - 2005. .................................................... 32 Chart of Changes in Primary School Enrolments, Linnix District 2002 - 2005. ................................................... 37 Proportion of Qualified and Certified Teachers in Primary Schools of District North, 2005. ................................ 40 Chart of Average Years of Teaching Experience and Average Years Teaching at Current School – District
South Primary Schools. ............................................................................................................................... 41 Proportion of Qualified and Certified Teachers in Primary Schools of District Central, 2005. .............................. 42 Chart of Average Years of Teaching Experience and Average Years Teaching at Current School – District
Central Primary Schools. ............................................................................................................................. 43 Proportion of Qualified and Certified Teachers in Primary Schools of District South, 2005. ................................ 44 Chart of Average Years of Teaching Experience and Average Years Teaching at Current School – District
South Primary Schools. ............................................................................................................................... 45 Proportion of Qualified and Certified Teachers in Primary Schools of Linnix District, 2005................................. 46 Chart of Average Years of Teaching Experience and Average Years Teaching at Current School – Linnix
District Primary Schools. ............................................................................................................................. 47 Chart of Percentage of Primary School Pupils with Access to Clean and Safe Water by District, 2002 - 2005...... 49 Chart of Changes in Junior Secondary Enrolments, District North 2002 - 2005. ................................................. 51 Chart of Changes in Junior Secondary Enrolments, District Central 2002 - 2005................................................ 55 Chart of Changes in Junior Secondary Enrolments, District South 2002 - 2005. ................................................. 58 Chart of Changes in Junior Secondary Enrolments, Linnix District 2002 - 2005 ................................................. 61 Proportion of Qualified and Certified Teachers in Junior Secondary Schools of District North. ............................ 63 Chart of Average Years of Teaching Experience and Average Years Teaching at Current School – District
North Junior Secondary Schools. ................................................................................................................. 64 Proportion of Qualified and Certified Teachers in Junior Secondary Schools of District Central........................... 65
xii
Chart of Average Years of Teaching Experience and Average Years Teaching at Current School – District Central Junior Secondary Schools.................................................................................................................65
Proportion of Qualified and Certified Teachers in Junior Secondary Schools of District South. .............................66 Chart of Average Years of Teaching Experience and Average Years Teaching at Current School – District
South Junior Secondary Schools. ..................................................................................................................67 Proportion of Qualified and Certified Teachers in Junior Secondary Schools of Linnix District. ............................68 Chart of Average Years of Teaching Experience and Average Years Teaching at Current School – District
North Junior Secondary Schools. ..................................................................................................................68 Chart of Percentage of Junior Secondary School Students with Access to Clean and Safe Water, by District,
2002 - 2005................................................................................................................................................70 Chart of Changes in Senior Secondary Enrolments, District North 2002 - 2005...................................................72 Chart of Changes in Senior Secondary Enrolments, District Central 2002 – 2005. ...............................................76 Chart of Changes in Senior Secondary Enrolments, District South 2002 – 2005...................................................77 Chart of Changes in Senior Secondary Enrolments, District South 2002 – 2005...................................................78 Proportion of Qualified and Certified Teachers in Senior Secondary Schools of District North..............................81 Chart of Average Years of Teaching Experience and Average Years Teaching at Current School – District
North Senior Secondary Schools. .................................................................................................................81 Proportion of Qualified and Certified Teachers in Senior Secondary Schools of District Central. ..........................82 Chart of Average Years of Teaching Experience and Average Years Teaching at Current School – District
Central Senior Secondary Schools. ...............................................................................................................83 Proportion of Qualified and Certified Teachers in Senior Secondary Schools of District South..............................84 Chart of Average Years of Teaching Experience and Average Years Teaching at Current School – District
Central Senior Secondary Schools. ...............................................................................................................85 Proportion of Qualified and Certified Teachers in Senior Secondary Schools of Linnix District. ............................86 Chart of Average Years of Teaching Experience and Average Years Teaching at Current School – District
Central Senior Secondary Schools. ...............................................................................................................86
xiii


Foreword by the Permanent Secretary
Foreword by the Permanent Secretary
I would like to start by expressing my gratitude for all Primary Head teachers, Junior Secondary Principals and Senior Secondary Principals for taking the time in providing us with valuable data about their schools. Special thanks go to Ministry of Finance and Economic Development for providing teacher’s payroll data and finance data for Education and to Preschool head teachers in providing data about their preschool through Primary head teachers. Without these data this Digest would never have been completed. The accurate and timely data has provided useful information about the Education system in Kiribati which has assisted greatly in planning for 2006. This information has also been disseminated to a wider audience interested in the development of our Education system. The 2005 Digest was produced under the KEMIS project funded by AusAID and implemented by UNIQUEST. It includes for the first time a full report on Education for All indicators. It also includes finance data about Education as well as other details in a time series in response to the demand by our partners in the development of Education in Kiribati. All the information provided in this Digest and more are available at the Statistics and Project Unit at MEYS. If you need any further details about our Education system do not hesitate to contact MEYS on phone number 28091. Once again I thank everybody for making the publication of data possible and I look forward to your combined cooperation in providing responses to future Annual School Surveys. Thank you, Reina Timau
Digest of Education Statistics 2005 1
Executive Summary
Executive Summary Section One: National Summary Statistics Section One provides an overview of the education system in Kiribati. It presents statistics for each school type at the national level, as well as national summary statistics about Kiribati students and teachers. Section Two: Report on the UNESCO Education For All (EFA) Indicators Kiribati is committed to the UNESCO Education For All (EFA) Framework. Section two provides reports for the current year against the EFA indicators of access, quality and efficiency in education service delivery. Section Three: Primary Schools Report Section three provides further detail about the Primary Schools of Kiribati and their students, teachers and infrastructure. The information in this section is displayed by District, Island and individual school. Section Four: Junior Secondary Schools Report Section four provides further detail about the Junior Secondary Schools of Kiribati and their students, teachers and infrastructure. The information in this section is displayed by District and Island. Section Five: Senior Secondary Schools Report Section five provides further detail about the Senior Secondary Schools of Kiribati and their students, teachers and infrastructure. The information in this section is displayed by District and Island. A Note about the 2005 Statistics Digest Due to data collection problems in the Linnix District accurate survey data for the schools of the District could not be obtained for 2005. Figures for the Linnix District presented in this digest are therefore estimates, based on known data from previous years. A detailed presentation of the estimated figures used appears in Sections Three, Four and Five of the Digest. The figures shown in these sections have also been used wherever national totals are calculated.
2 Republic of Kiribati
Executive Summary
The MEYS Annual School Survey Each year the Ministry of Education, Youth and Sports surveys the schools of Kiribati to gather data about the pupils, teachers, facilities, grounds and resources at each school. Additional data is also collected from the National Statistics Office (population data and projections) and the Ministry of Finance (financial and budget figures). The Ministry of Education, Youth and Sports is grateful to School Head Teachers for providing school data through survey forms completed each year. These data are used by the Ministry of Education for the purposes of planning and monitoring the effectiveness of education sector development programmes, as well as day-to-day operational management of the education sector. School survey data once received at MEYS is collated and analysed using the Kiribati Education Management Information System (KEMIS). KEMIS is a rich database of information about the schools, students and teachers of the Kiribati education system. If you would like more information about the Kiribati education system, or more detailed information about an aspect of the system, please contact the Permanent Secretary’s office at the Ministry of Education, Youth and Sport.
Digest of Education Statistics 2005 3
Section One: National Summary Statistics
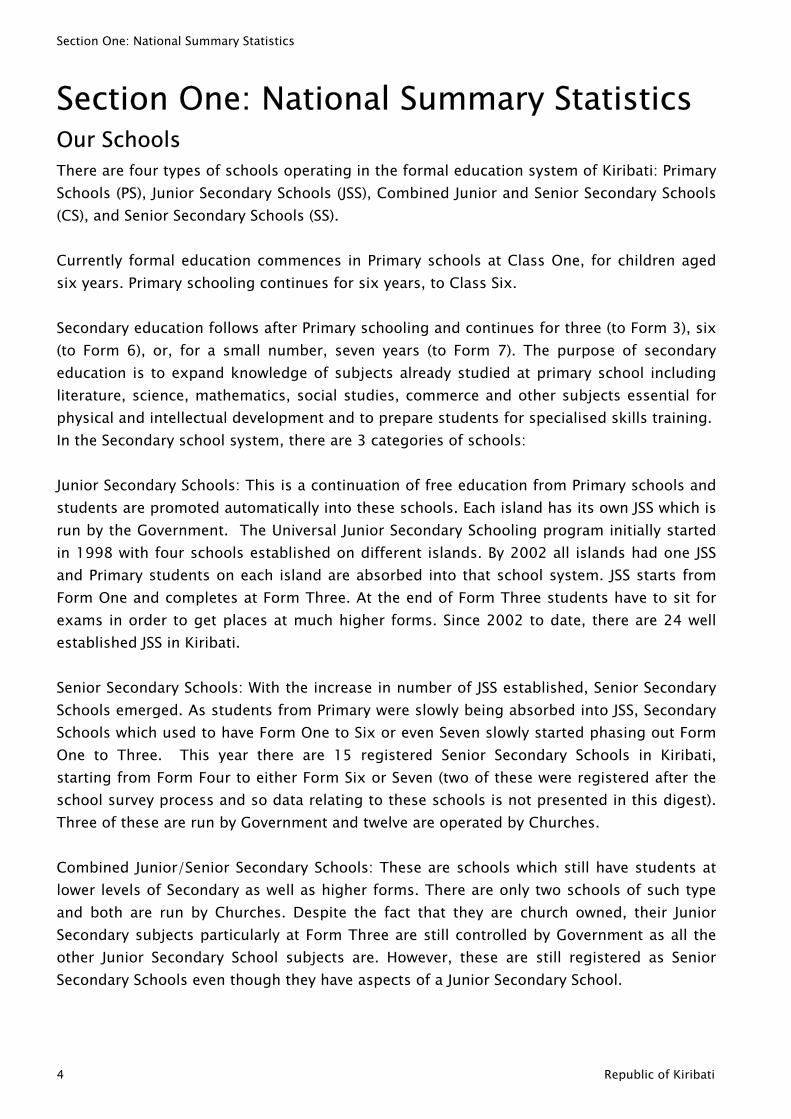
Section One: National Summary Statistics Our Schools There are four types of schools operating in the formal education system of Kiribati: Primary Schools (PS), Junior Secondary Schools (JSS), Combined Junior and Senior Secondary Schools (CS), and Senior Secondary Schools (SS). Currently formal education commences in Primary schools at Class One, for children aged six years. Primary schooling continues for six years, to Class Six. Secondary education follows after Primary schooling and continues for three (to Form 3), six (to Form 6), or, for a small number, seven years (to Form 7). The purpose of secondary education is to expand knowledge of subjects already studied at primary school including literature, science, mathematics, social studies, commerce and other subjects essential for physical and intellectual development and to prepare students for specialised skills training. In the Secondary school system, there are 3 categories of schools: Junior Secondary Schools: This is a continuation of free education from Primary schools and students are promoted automatically into these schools. Each island has its own JSS which is run by the Government. The Universal Junior Secondary Schooling program initially started in 1998 with four schools established on different islands. By 2002 all islands had one JSS and Primary students on each island are absorbed into that school system. JSS starts from Form One and completes at Form Three. At the end of Form Three students have to sit for exams in order to get places at much higher forms. Since 2002 to date, there are 24 well established JSS in Kiribati. Senior Secondary Schools: With the increase in number of JSS established, Senior Secondary Schools emerged. As students from Primary were slowly being absorbed into JSS, Secondary Schools which used to have Form One to Six or even Seven slowly started phasing out Form One to Three. This year there are 15 registered Senior Secondary Schools in Kiribati, starting from Form Four to either Form Six or Seven (two of these were registered after the school survey process and so data relating to these schools is not presented in this digest). Three of these are run by Government and twelve are operated by Churches. Combined Junior/Senior Secondary Schools: These are schools which still have students at lower levels of Secondary as well as higher forms. There are only two schools of such type and both are run by Churches. Despite the fact that they are church owned, their Junior Secondary subjects particularly at Form Three are still controlled by Government as all the other Junior Secondary School subjects are. However, these are still registered as Senior Secondary Schools even though they have aspects of a Junior Secondary School.
4 Republic of Kiribati
Section One: National Summary Statistics
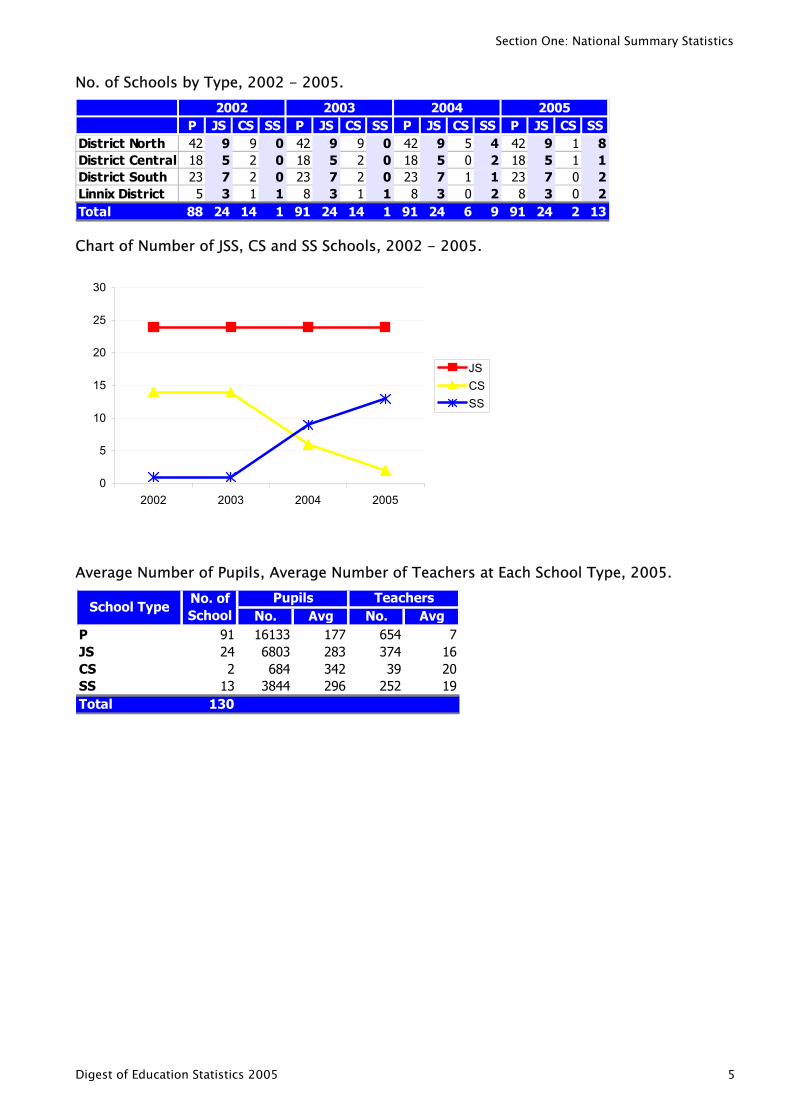
No. of Schools by Type, 2002 - 2005.
P JS CS SS P JS CS SS P JS CS SS P JS CS SSDistrict North 42 9 9 0 42 9 9 0 42 9 5 4 42 9 1 8District Central 18 5 2 0 18 5 2 0 18 5 0 2 18 5 1 1District South 23 7 2 0 23 7 2 0 23 7 1 1 23 7 0 2Linnix District 5 3 1 1 8 3 1 1 8 3 0 2 8 3 0 2Total 88 24 14 1 91 24 14 1 91 24 6 9 91 24 2 13
2002 2003 2004 2005
Chart of Number of JSS, CS and SS Schools, 2002 - 2005.
0
5
10
15
20
25
30
2002 2003 2004 2005
JSCSSS
Average Number of Pupils, Average Number of Teachers at Each School Type, 2005.
PJSCSSSTotal
AvgPupils Teachers
School TypeNo. of School No. Avg No.
91242
13
16133 177 654 76803 283 374 16684 342 39 20
3844 296 252 19130
Digest of Education Statistics 2005 5
Section One: National Summary Statistics
Our Students
Primary Education Primary Enrolments by Class Level and Gender, 2002 - 2005.
Class 1Class 2Class 3Class 4Class 5Class 6TotalTotal F+M
School Level2002
F M F M2003 20052004
F M F M1315 1403 1490 1511 1473 1462 1548 16111254 1257 1204 1272 1304 1338 1362 13531255 1380 1220 1262 1185 1218 1317 13201312 1343 1249 1400 1219 1242 1263 1239
1278 1216 12441225 1294 1269 13551259 1314 1204 1362
7991 7636 81621275 1334 1260 14001283
15611 15798 15611 161337739 7872 7966 81677620
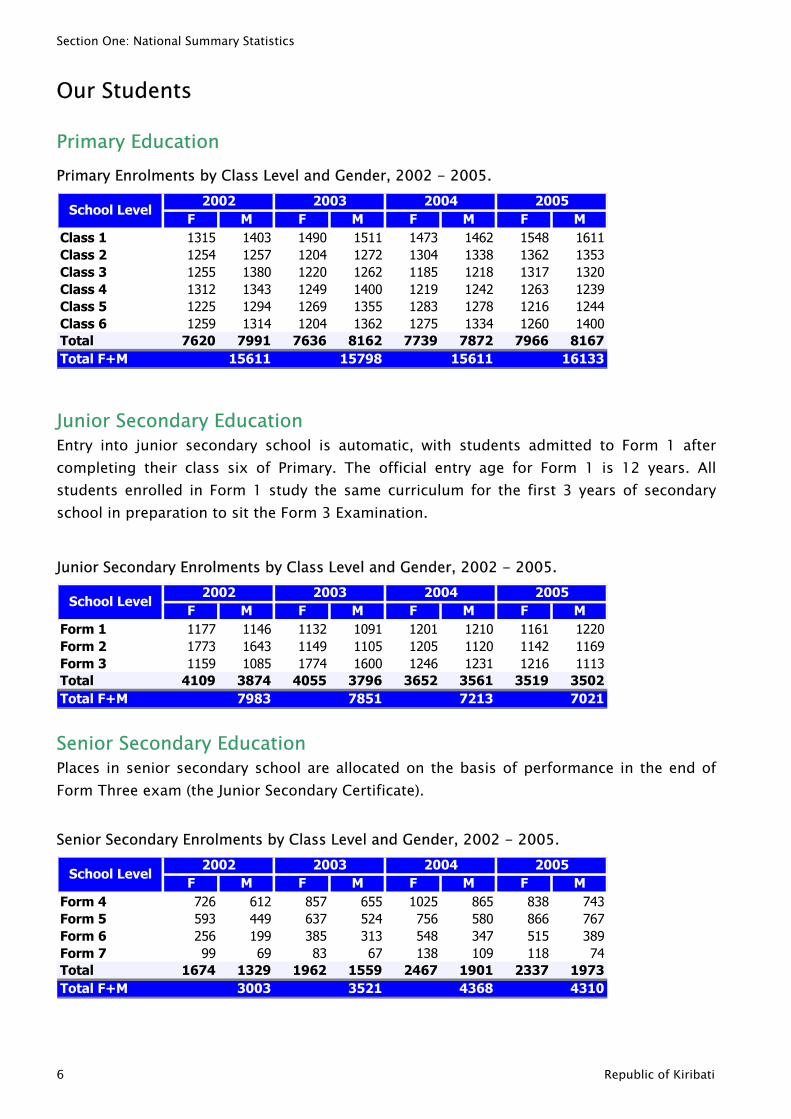
Junior Secondary Education Entry into junior secondary school is automatic, with students admitted to Form 1 after completing their class six of Primary. The official entry age for Form 1 is 12 years. All students enrolled in Form 1 study the same curriculum for the first 3 years of secondary school in preparation to sit the Form 3 Examination.
Junior Secondary Enrolments by Class Level and Gender, 2002 - 2005.
Form 1Form 2Form 3TotalTotal F+M
School Level2002 2003 2004 2005
F M F M F M F M1177 1146 1132 1091 1201 1210 1161 12201773 1643 1149 1105 1205 1120 1142 11691159 1085 1774 1600 1246 1231 1216 1113
4109 3874 4055 3796 3652 3561 3519 35027983 7851 7213 7021
Senior Secondary Education Places in senior secondary school are allocated on the basis of performance in the end of Form Three exam (the Junior Secondary Certificate).
Senior Secondary Enrolments by Class Level and Gender, 2002 - 2005.
Form 4Form 5Form 6Form 7TotalTotal F+M
School Level2002 2003 2004 2005
F M F M F M F M726 612 857 655 1025 865 838 743593 449 637 524 756 580 866 767256 199 385 313 548 347 515 389
1674 1329 1962 1559 2467 1901 2337 19733003 3521 4368 4310
99 69 83 67 138 109 118 74
6 Republic of Kiribati
Section One: National Summary Statistics
Chart of Changes in Enrolments by School Sector, 2002 - 2005.
0
2000
4000
6000
8000
10000
12000
14000
16000
18000
2002 2003 2004 2005
PRIJSSSEC
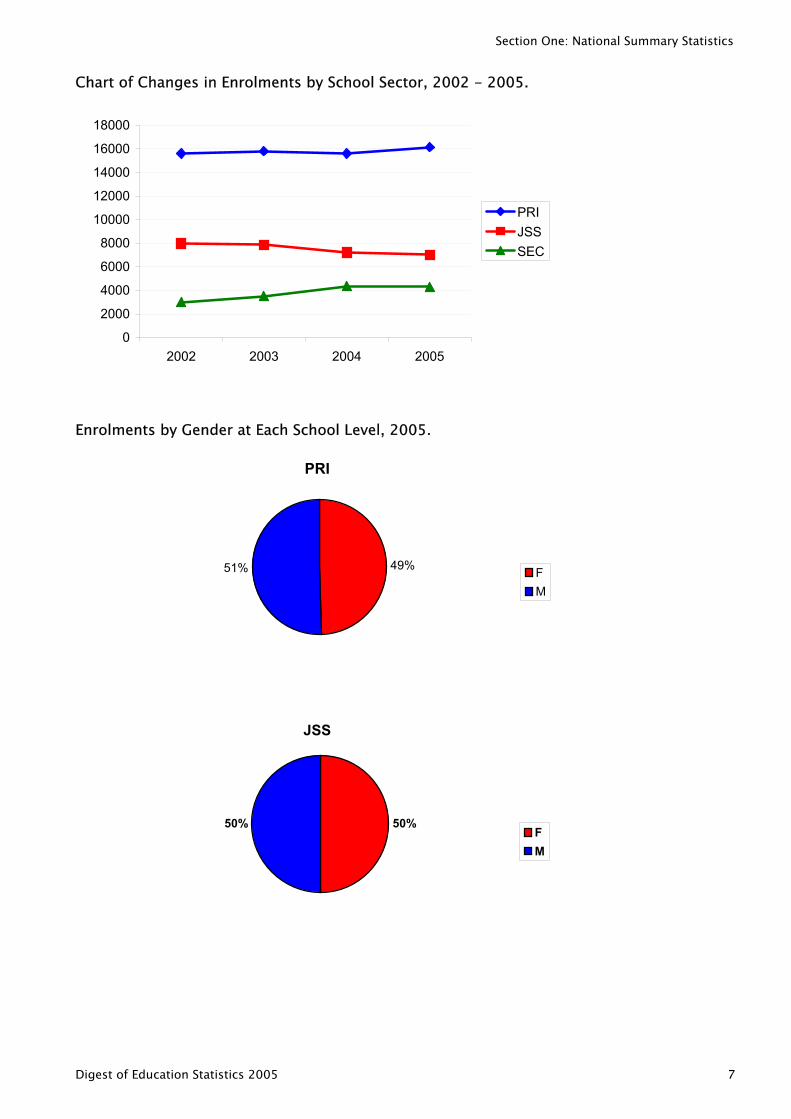
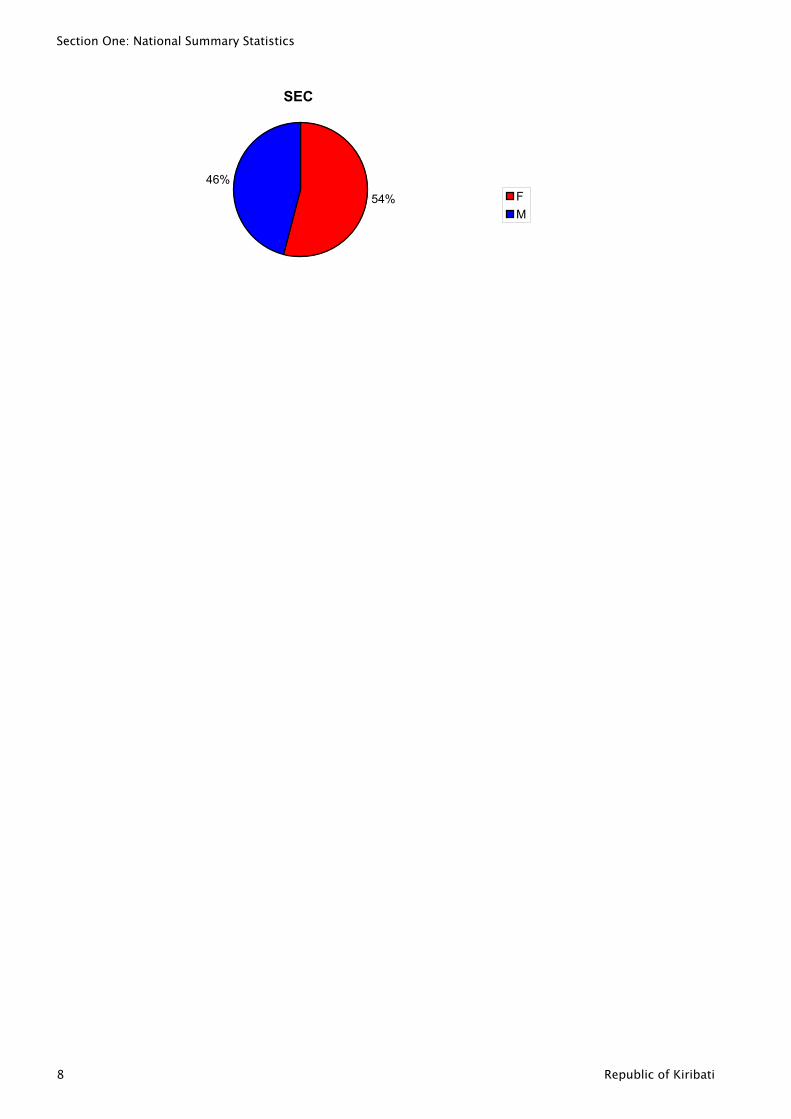
Enrolments by Gender at Each School Level, 2005.
PRI
49%51% FM
JSS
50%50%FM
Digest of Education Statistics 2005 7
Section One: National Summary Statistics
SEC
54%46%
FM
8 Republic of Kiribati
Section One: National Summary Statistics
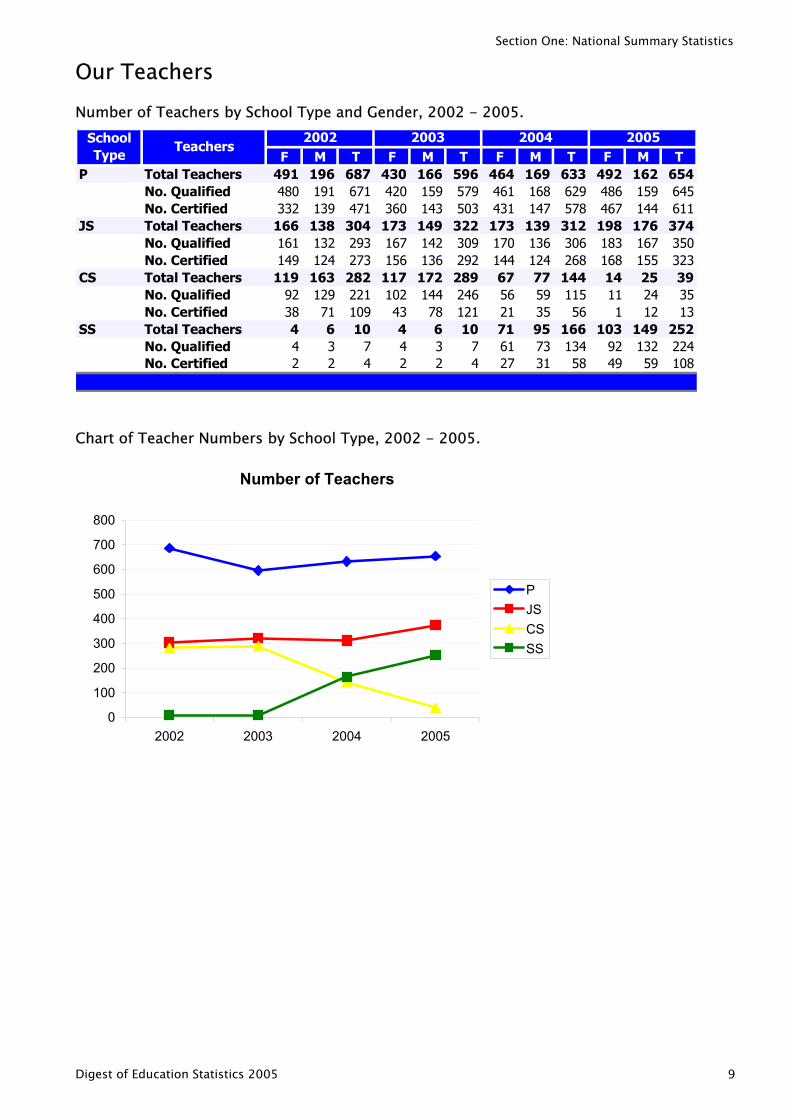
Our Teachers Number of Teachers by School Type and Gender, 2002 - 2005.
F M T F M T F M T F M TP Total Teachers 491 196 687 430 166 596 464 169 633 492 162 654
No. Qualified 480 191 671 420 159 579 461 168 629 486 159 645No. Certified 332 139 471 360 143 503 431 147 578 467 144 611
JS Total Teachers 166 138 304 173 149 322 173 139 312 198 176 374No. Qualified 161 132 293 167 142 309 170 136 306 183 167 350No. Certified 149 124 273 156 136 292 144 124 268 168 155 323
CS Total Teachers 119 163 282 117 172 289 67 77 144 14 25 39No. Qualified 92 129 221 102 144 246 56 59 115 11 24 35No. Certified 38 71 109 43 78 121 21 35 56 1 12 13
SS Total Teachers 4 6 10 4 6 10 71 95 166 103 149 252No. Qualified 4 3 7 4 3 7 61 73 134 92 132 22No. Certified 2 2 4 2 2 4 27 31 58 49 59 10
2005School Type
Teachers2002 2003 2004
48
Chart of Teacher Numbers by School Type, 2002 - 2005.
Number of Teachers
0
100
200
300
400
500
600
700
800
2002 2003 2004 2005
PJSCSSS
Digest of Education Statistics 2005 9
Section One: National Summary Statistics
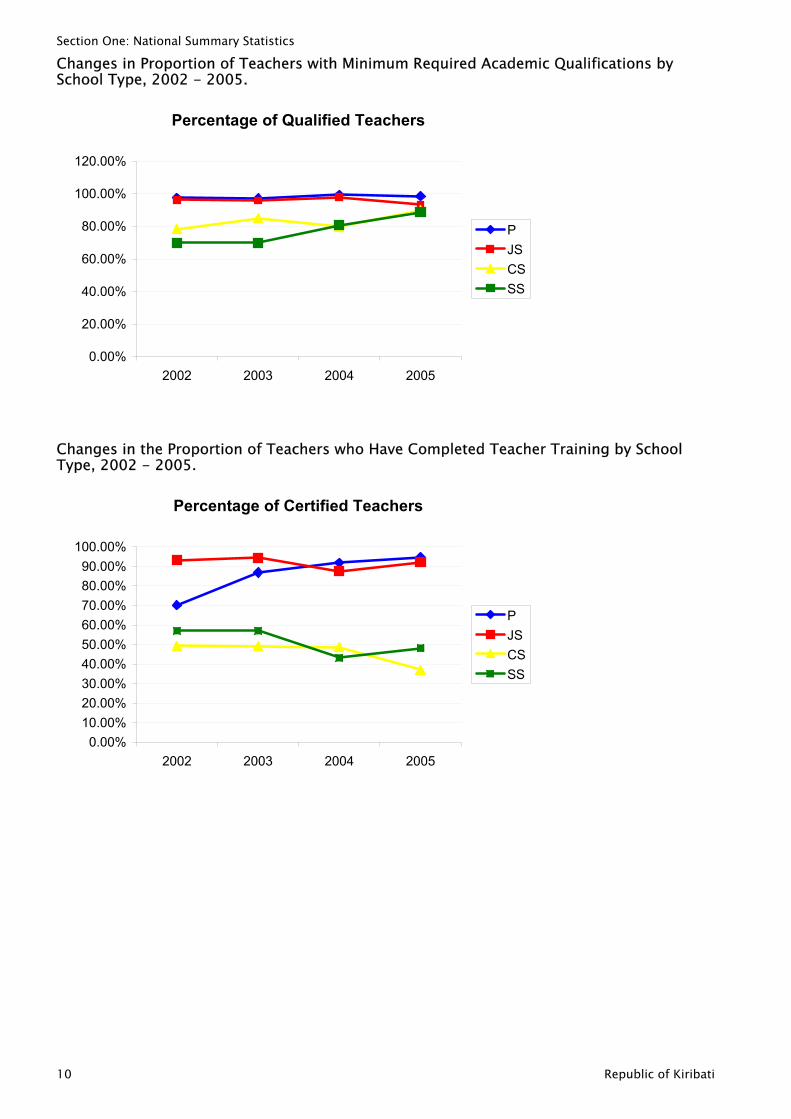
Changes in Proportion of Teachers with Minimum Required Academic Qualifications by School Type, 2002 - 2005.
Percentage of Qualified Teachers
0.00%
20.00%
40.00%
60.00%
80.00%
100.00%
120.00%
2002 2003 2004 2005
PJSCSSS
Changes in the Proportion of Teachers who Have Completed Teacher Training by School Type, 2002 - 2005.
Percentage of Certified Teachers
0.00%10.00%20.00%30.00%40.00%50.00%60.00%70.00%80.00%90.00%
100.00%
2002 2003 2004 2005
PJSCSSS
10 Republic of Kiribati
Section One: National Summary Statistics
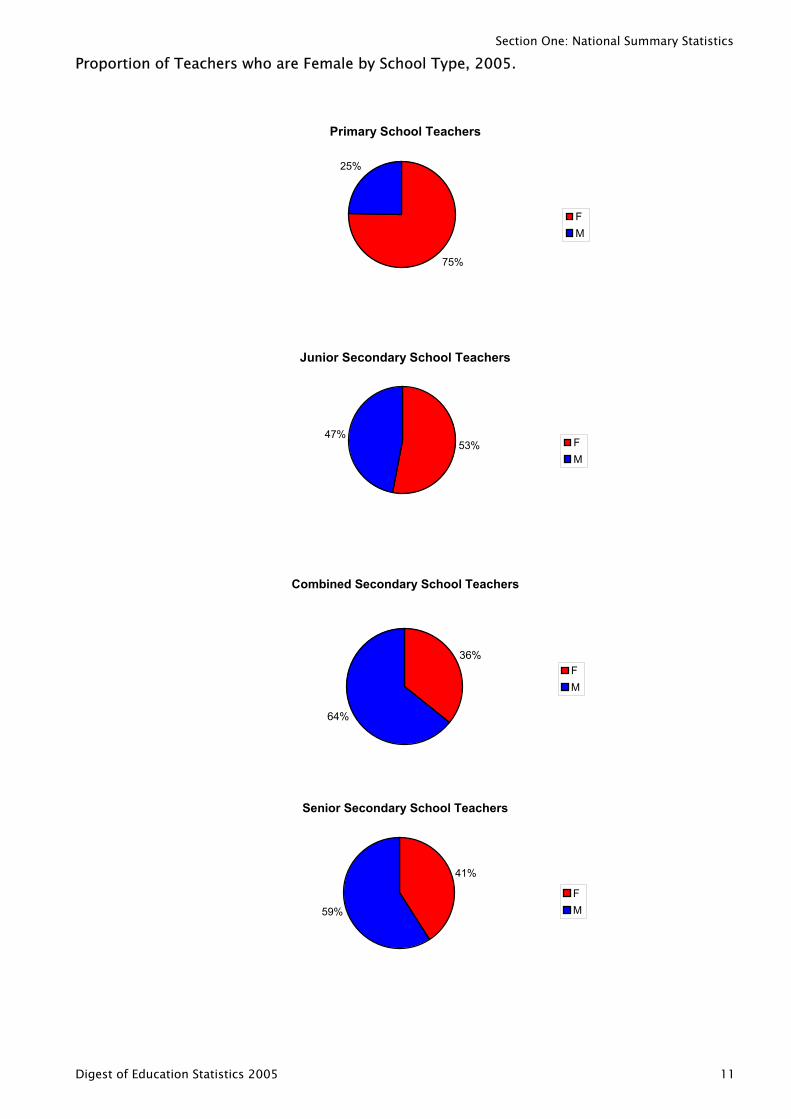
Proportion of Teachers who are Female by School Type, 2005.
Primary School Teachers
75%
25%
FM
Junior Secondary School Teachers
53%47%
FM
Combined Secondary School Teachers
36%
64%
FM
Senior Secondary School Teachers
41%
59%
FM
Digest of Education Statistics 2005 11
Section 2: Education For All Indicators
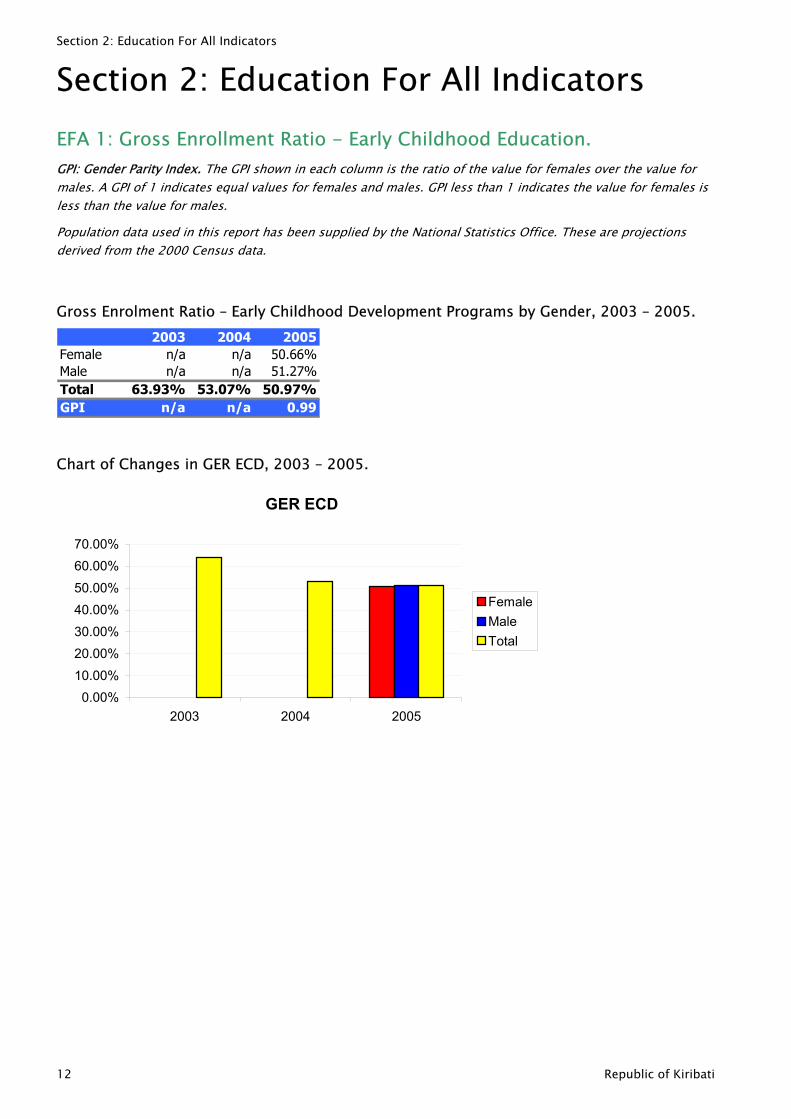
Section 2: Education For All Indicators EFA 1: Gross Enrollment Ratio - Early Childhood Education. GPI: Gende Parity Index. The GPI shown in each column is the ratio of the value for females over the value for males. A GPI of 1 indicates equal values for females and males. GPI less than 1 indicates the value for females is less than the value for males.
r
r cs
Population data used in this report has been supplied by the National Statistics Office. These a e proje tions derived from the 2000 Cen us data.
Gross Enrolment Ratio – Early Childhood Development Programs by Gender, 2003 – 2005. 2003 2004 2005
Female n/a n/a 50.66%Male n/a n/a 51.27%Total 63.93% 53.07% 50.97%GPI n/a n/a 0.99
Chart of Changes in GER ECD, 2003 – 2005.
GER ECD
0.00%10.00%20.00%30.00%40.00%50.00%60.00%70.00%
2003 2004 2005
FemaleMaleTotal
12 Republic of Kiribati
Section 2: Education For All Indicators
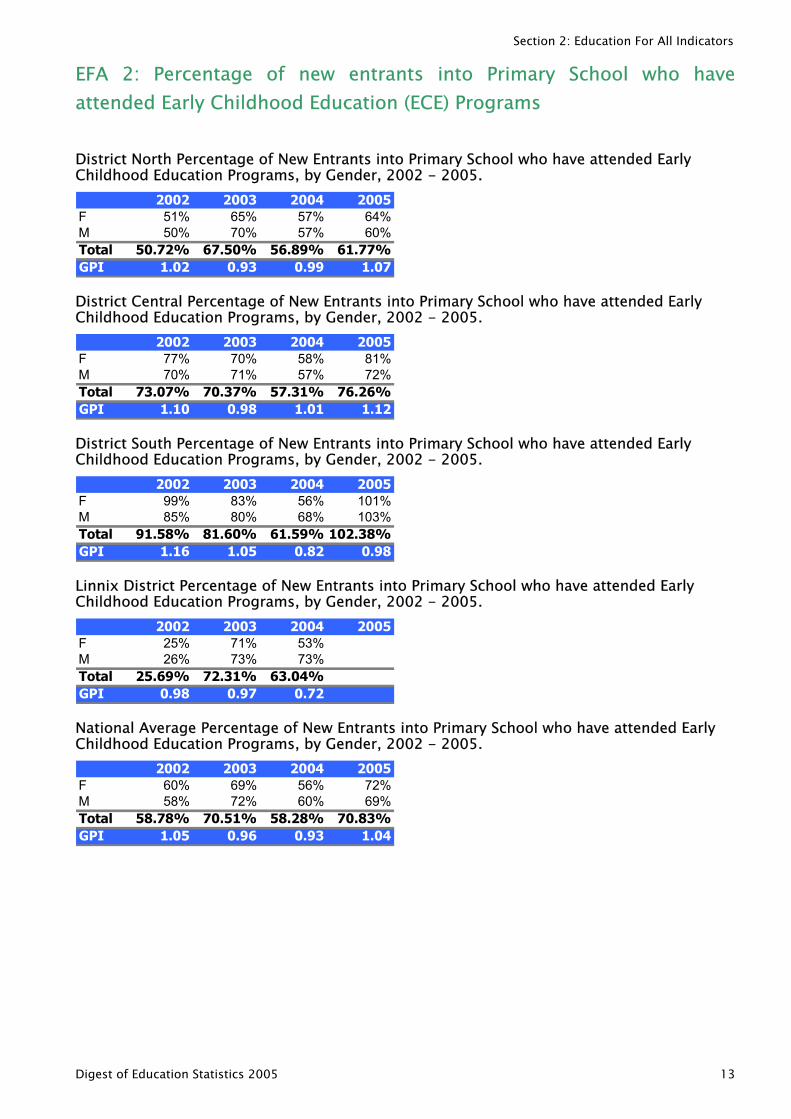
EFA 2: Percentage of new entrants into Primary School who have attended Early Childhood Education (ECE) Programs
District North Percentage of New Entrants into Primary School who have attended Early Childhood Education Programs, by Gender, 2002 - 2005.
2002 2003 2004 2005F 51% 65% 57% 64%M 50% 70% 57% 60%Total 50.72% 67.50% 56.89% 61.77%GPI 1.02 0.93 0.99 1.07
District Central Percentage of New Entrants into Primary School who have attended Early Childhood Education Programs, by Gender, 2002 - 2005.
2002 2003 2004 2005F 77% 70% 58% 81%M 70% 71% 57% 72%Total 73.07% 70.37% 57.31% 76.26%GPI 1.10 0.98 1.01 1.12
District South Percentage of New Entrants into Primary School who have attended Early Childhood Education Programs, by Gender, 2002 - 2005.
2002 2003 2004 2005F 99% 83% 56% 101%M 85% 80% 68% 103%Total 91.58% 81.60% 61.59% 102.38%GPI 1.16 1.05 0.82 0.98
Linnix District Percentage of New Entrants into Primary School who have attended Early Childhood Education Programs, by Gender, 2002 - 2005.
2002 2003 2004 2005F 25% 71% 53%M 26% 73% 73%Total 25.69% 72.31% 63.04%GPI 0.98 0.97 0.72
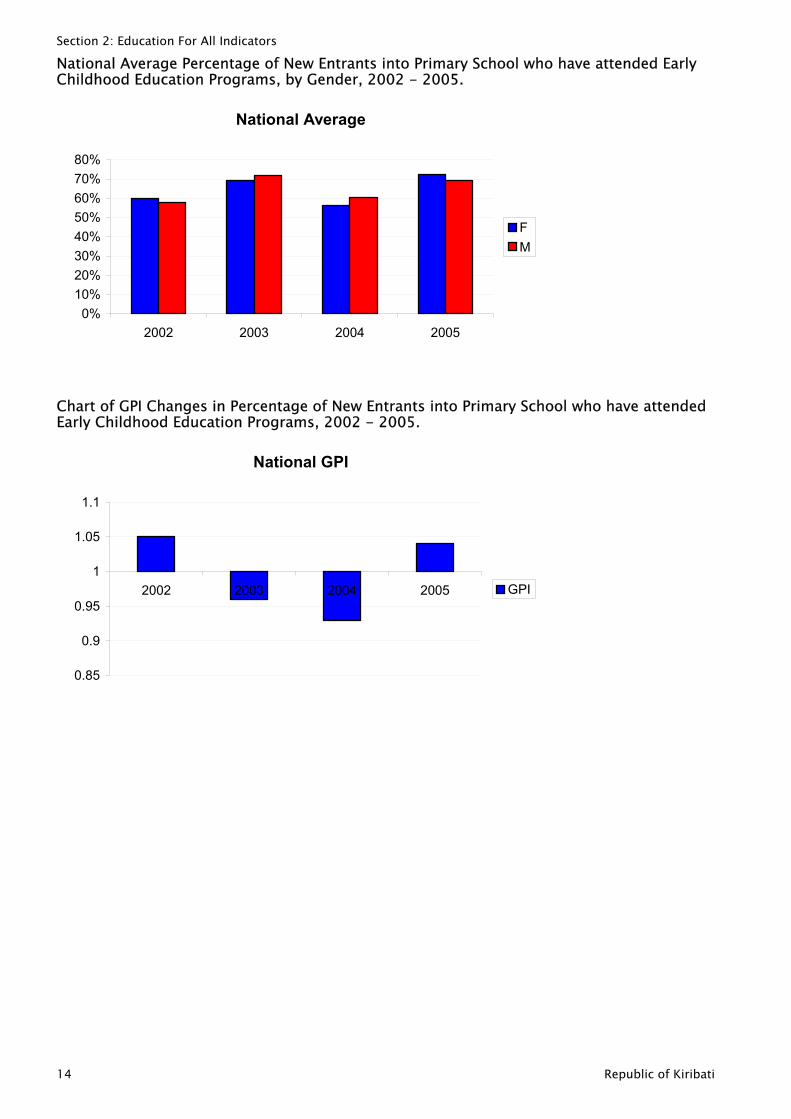
National Average Percentage of New Entrants into Primary School who have attended Early Childhood Education Programs, by Gender, 2002 - 2005.
2002 2003 2004 2005F 60% 69% 56% 72%M 58% 72% 60% 69%Total 58.78% 70.51% 58.28% 70.83%GPI 1.05 0.96 0.93 1.04
Digest of Education Statistics 2005 13
Section 2: Education For All Indicators
National Average Percentage of New Entrants into Primary School who have attended Early Childhood Education Programs, by Gender, 2002 - 2005.
National Average
0%10%20%30%40%50%60%70%80%
2002 2003 2004 2005
FM
Chart of GPI Changes in Percentage of New Entrants into Primary School who have attended Early Childhood Education Programs, 2002 - 2005.
National GPI
0.85
0.9
0.95
1
1.05
1.1
2002 2003 2004 2005 GPI
14 Republic of Kiribati
Section 2: Education For All Indicators
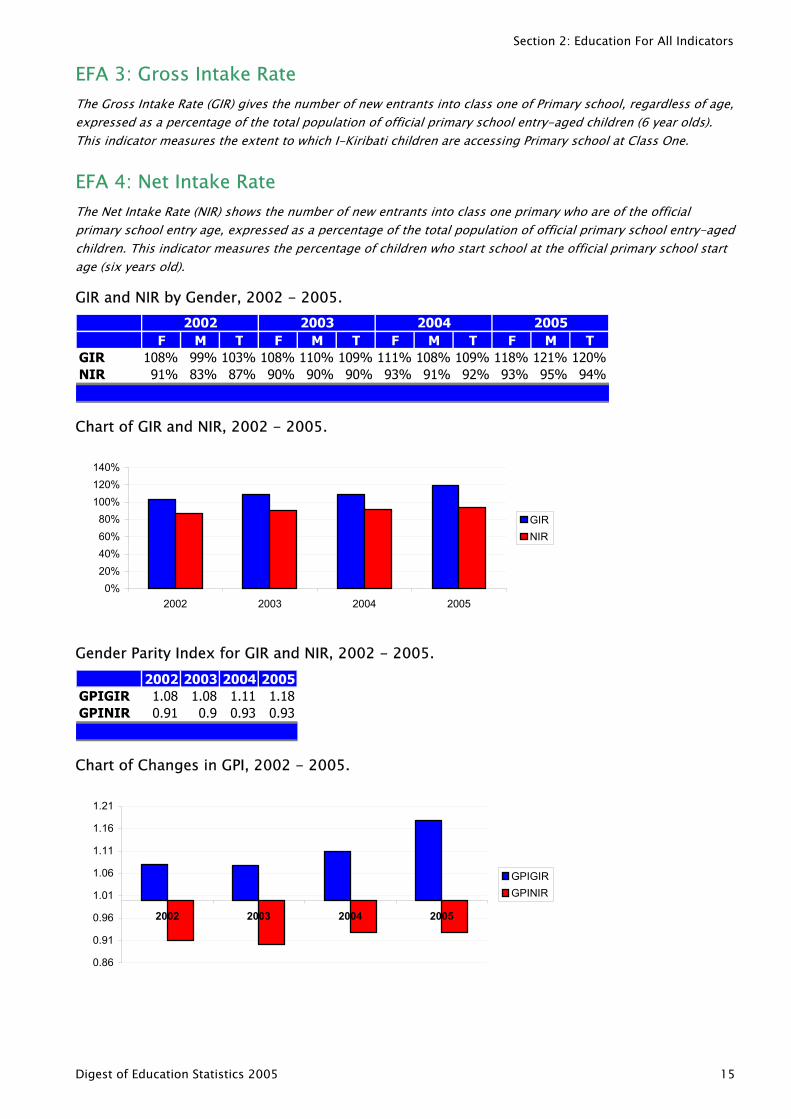
EFA 3: Gross Intake Rate
The Gross Intake Rate (GIR) gi es the numbe of new entrants into class one of P imary school, regardless of age, expressed as a percentage of the total population of official primary school entry-aged children (6 year olds). This indicator measures the extent to which I-Kiribati children are accessing Primary school at Class One.
v r r
rr r r
EFA 4: Net Intake Rate The Net Intake Rate (NIR) shows the number of new entrants into class one primary who a e of the official p imary school entry age, exp essed as a pe centage of the total population of official primary school entry-aged children. This indicator measures the percentage of children who start school at the official primary school start age (six years old).
GIR and NIR by Gender, 2002 - 2005.
F M T F M T F M T F M TGIR 108% 99% 103% 108% 110% 109% 111% 108% 109% 118% 121% 120%NIR 91% 83% 87% 90% 90% 90% 93% 91% 92% 93% 95% 94%
2002 2003 2004 2005
Chart of GIR and NIR, 2002 - 2005.
0%20%40%60%80%
100%120%140%
2002 2003 2004 2005
GIRNIR
Gender Parity Index for GIR and NIR, 2002 - 2005. 2002 2003 2004 2005
GPIGIR 1.08 1.08 1.11 1.18GPINIR 0.91 0.9 0.93 0.93
Chart of Changes in GPI, 2002 - 2005.
0.86
0.91
0.96
1.01
1.06
1.11
1.16
1.21
2002 2003 2004 2005
GPIGIRGPINIR
Digest of Education Statistics 2005 15
Section 2: Education For All Indicators
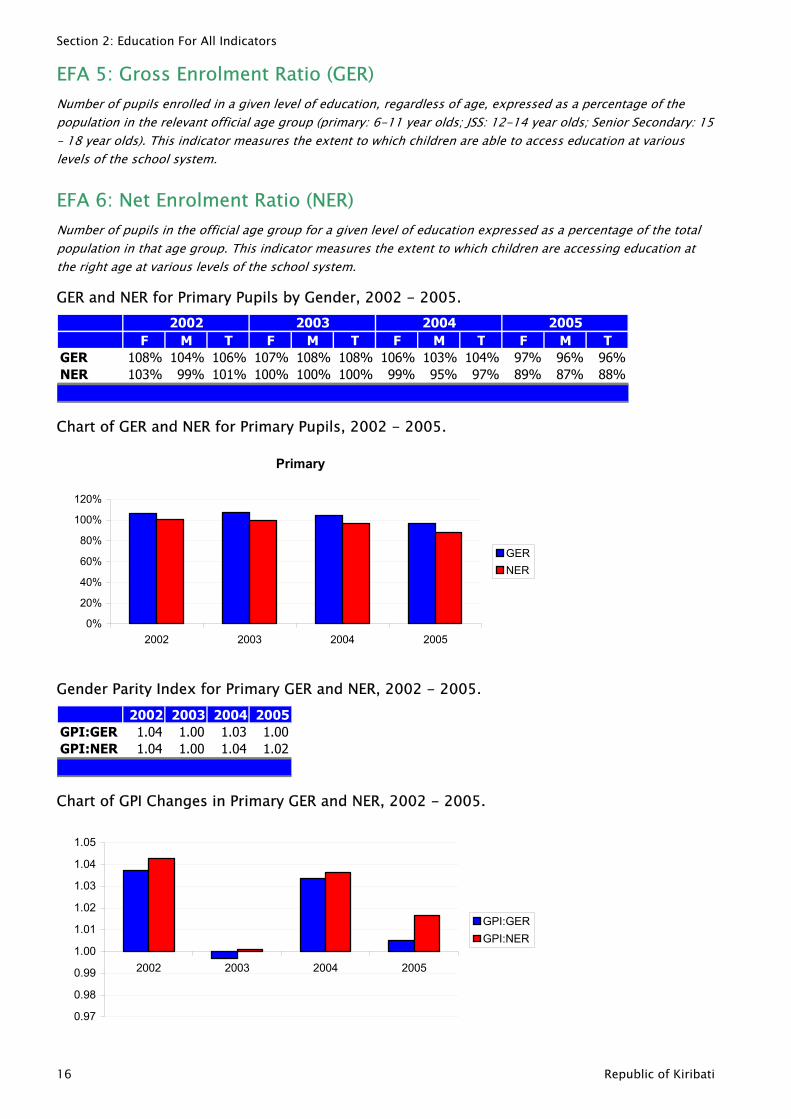
EFA 5: Gross Enrolment Ratio (GER) Numbe of pupils enrolled in a given level of education, regardless of age, exp essed as a pe entage of the population in the relevant official age g oup (primary: 6-11 year olds; JSS: 12-14 year olds; Senior Secondary: 15 – 18 year olds). This indicator measures the extent to which children are able to access education at various levels of the school system.
r r rcr
r r r
v
EFA 6: Net Enrolment Ratio (NER) Numbe of pupils in the official age group for a given level of education exp essed as a pe centage of the total population in that age group. This indicator measures the extent to which children are accessing education at the right age at various le els of the school system.
GER and NER for Primary Pupils by Gender, 2002 - 2005.
F M T F M T F M T F M TGER 108% 104% 106% 107% 108% 108% 106% 103% 104% 97% 96% 96%NER 103% 99% 101% 100% 100% 100% 99% 95% 97% 89% 87% 88%
2002 2003 2004 2005
Chart of GER and NER for Primary Pupils, 2002 - 2005.
Primary
0%
20%
40%
60%
80%
100%
120%
2002 2003 2004 2005
GERNER
Gender Parity Index for Primary GER and NER, 2002 - 2005. 2002 2003 2004 2005
GPI:GER 1.04 1.00 1.03 1.00GPI:NER 1.04 1.00 1.04 1.02
Chart of GPI Changes in Primary GER and NER, 2002 - 2005.
0.97
0.98
0.99
1.00
1.01
1.02
1.03
1.04
1.05
2002 2003 2004 2005
GPI:GERGPI:NER
16 Republic of Kiribati
Section 2: Education For All Indicators
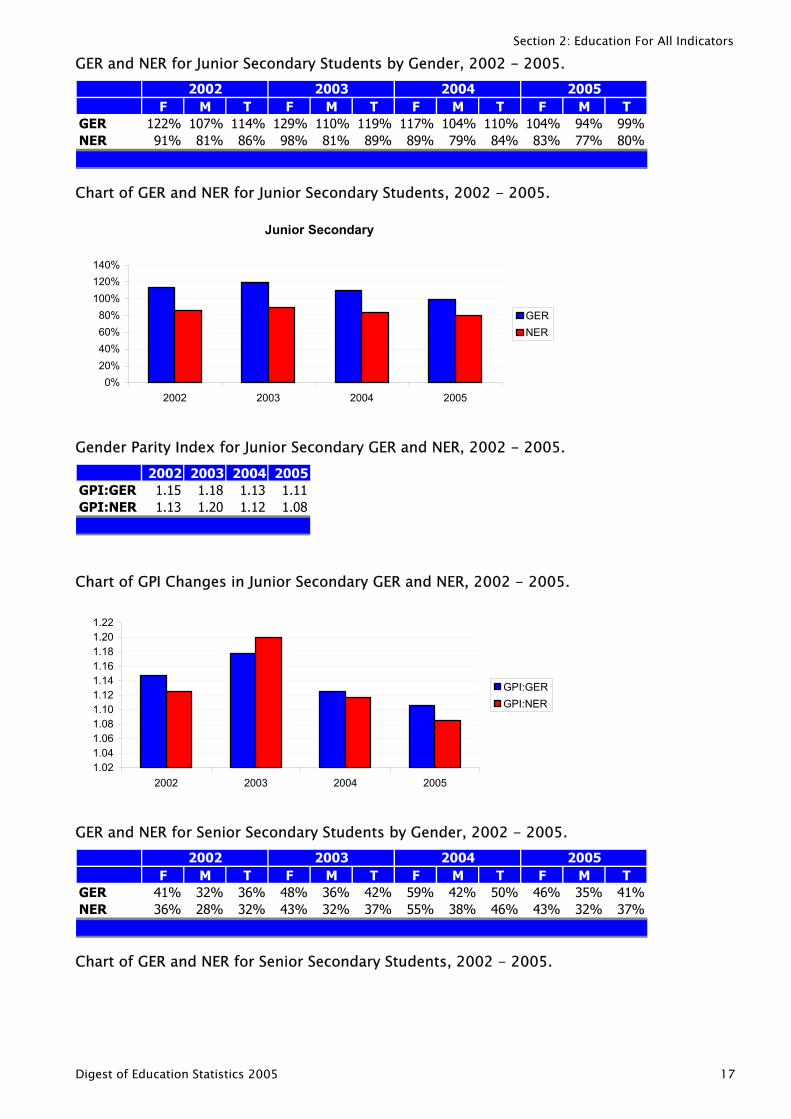
GER and NER for Junior Secondary Students by Gender, 2002 - 2005.
F M T F M T F M T F M TGER 122% 107% 114% 129% 110% 119% 117% 104% 110% 104% 94% 99%NER 91% 81% 86% 98% 81% 89% 89% 79% 84% 83% 77% 80%
2002 2003 2004 2005
Chart of GER and NER for Junior Secondary Students, 2002 - 2005.
Junior Secondary
0%20%40%60%80%
100%120%140%
2002 2003 2004 2005
GERNER
Gender Parity Index for Junior Secondary GER and NER, 2002 - 2005. 2002 2003 2004 2005
GPI:GER 1.15 1.18 1.13 1.11GPI:NER 1.13 1.20 1.12 1.08
Chart of GPI Changes in Junior Secondary GER and NER, 2002 - 2005.
1.021.041.061.081.101.121.141.161.181.201.22
2002 2003 2004 2005
GPI:GERGPI:NER
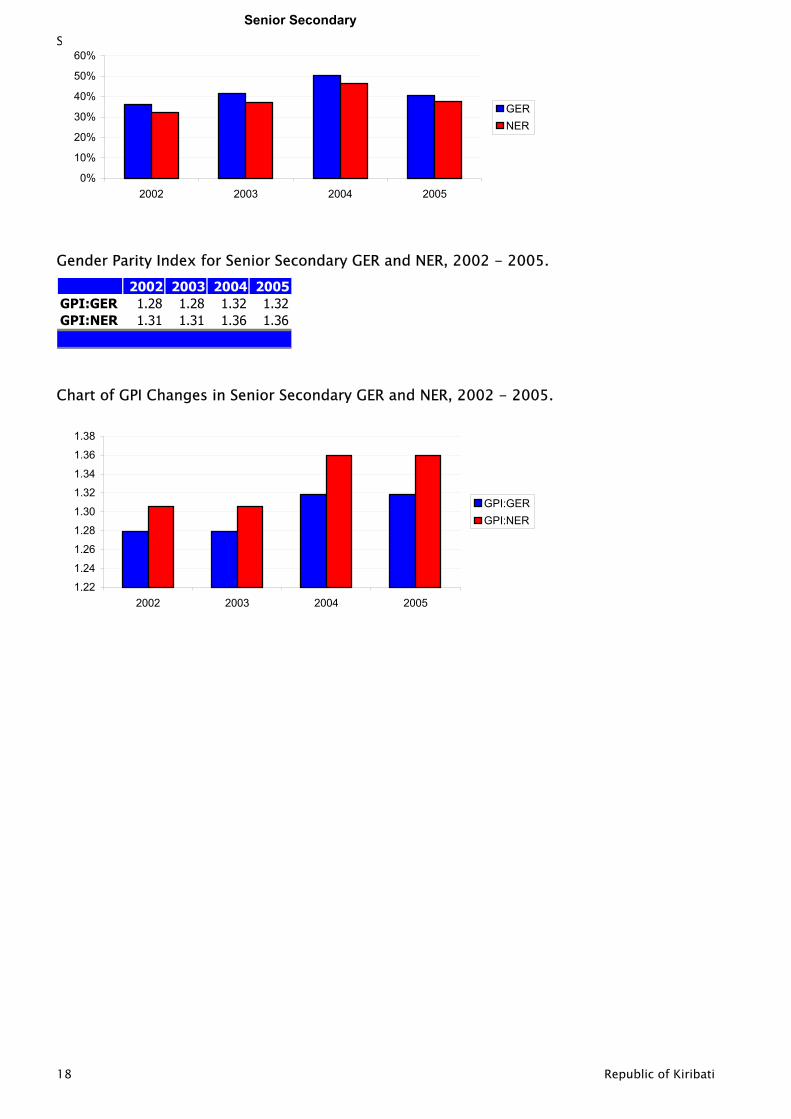
GER and NER for Senior Secondary Students by Gender, 2002 - 2005.
F M T F M T F M T F M TGER 41% 32% 36% 48% 36% 42% 59% 42% 50% 46% 35% 41%NER 36% 28% 32% 43% 32% 37% 55% 38% 46% 43% 32% 37%
2002 2003 2004 2005
Chart of GER and NER for Senior Secondary Students, 2002 - 2005.
Digest of Education Statistics 2005 17
Section 2: Education For All Indicators Senior Secondary
0%
10%
20%
30%
40%
50%
60%
2002 2003 2004 2005
GERNER
Gender Parity Index for Senior Secondary GER and NER, 2002 - 2005. 2002 2003 2004 2005
GPI:GER 1.28 1.28 1.32 1.32GPI:NER 1.31 1.31 1.36 1.36
Chart of GPI Changes in Senior Secondary GER and NER, 2002 - 2005.
1.22
1.24
1.26
1.28
1.30
1.32
1.34
1.36
1.38
2002 2003 2004 2005
GPI:GERGPI:NER
18 Republic of Kiribati
Section 2: Education For All Indicators
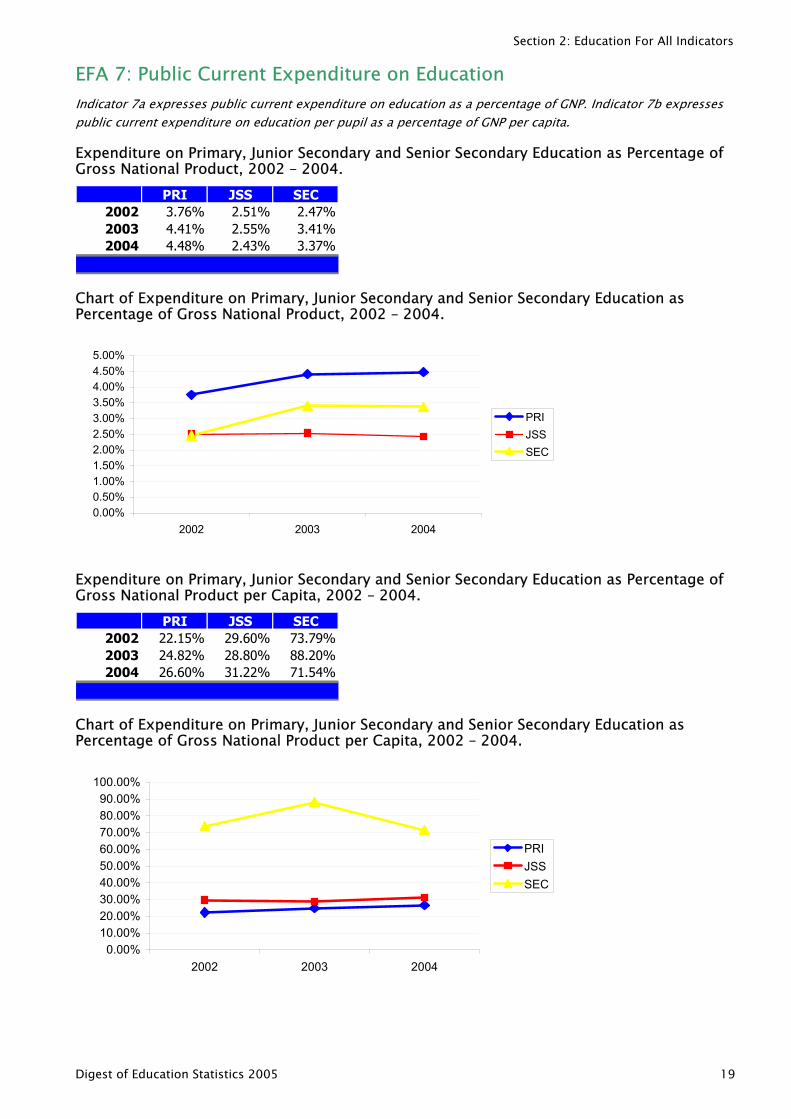
EFA 7: Public Current Expenditure on Education Indicator 7a expresse public current expenditure on education as a percentage of GNP. Indicator 7b expre ses public cur ent expenditure on education per pupil as a percentage of GNP per capita.
s sr
Expenditure on Primary, Junior Secondary and Senior Secondary Education as Percentage of Gross National Product, 2002 – 2004.
PRI JSS SEC2002 3.76% 2.51% 2.47%2003 4.41% 2.55% 3.41%2004 4.48% 2.43% 3.37%
Chart of Expenditure on Primary, Junior Secondary and Senior Secondary Education as Percentage of Gross National Product, 2002 – 2004.
0.00%0.50%1.00%1.50%2.00%2.50%3.00%3.50%4.00%4.50%5.00%
2002 2003 2004
PRIJSSSEC
Expenditure on Primary, Junior Secondary and Senior Secondary Education as Percentage of Gross National Product per Capita, 2002 – 2004.
PRI JSS SEC2002 22.15% 29.60% 73.79%2003 24.82% 28.80% 88.20%2004 26.60% 31.22% 71.54%
Chart of Expenditure on Primary, Junior Secondary and Senior Secondary Education as Percentage of Gross National Product per Capita, 2002 – 2004.
0.00%10.00%20.00%30.00%40.00%50.00%60.00%70.00%80.00%90.00%
100.00%
2002 2003 2004
PRIJSSSEC
Digest of Education Statistics 2005 19
Section 2: Education For All Indicators
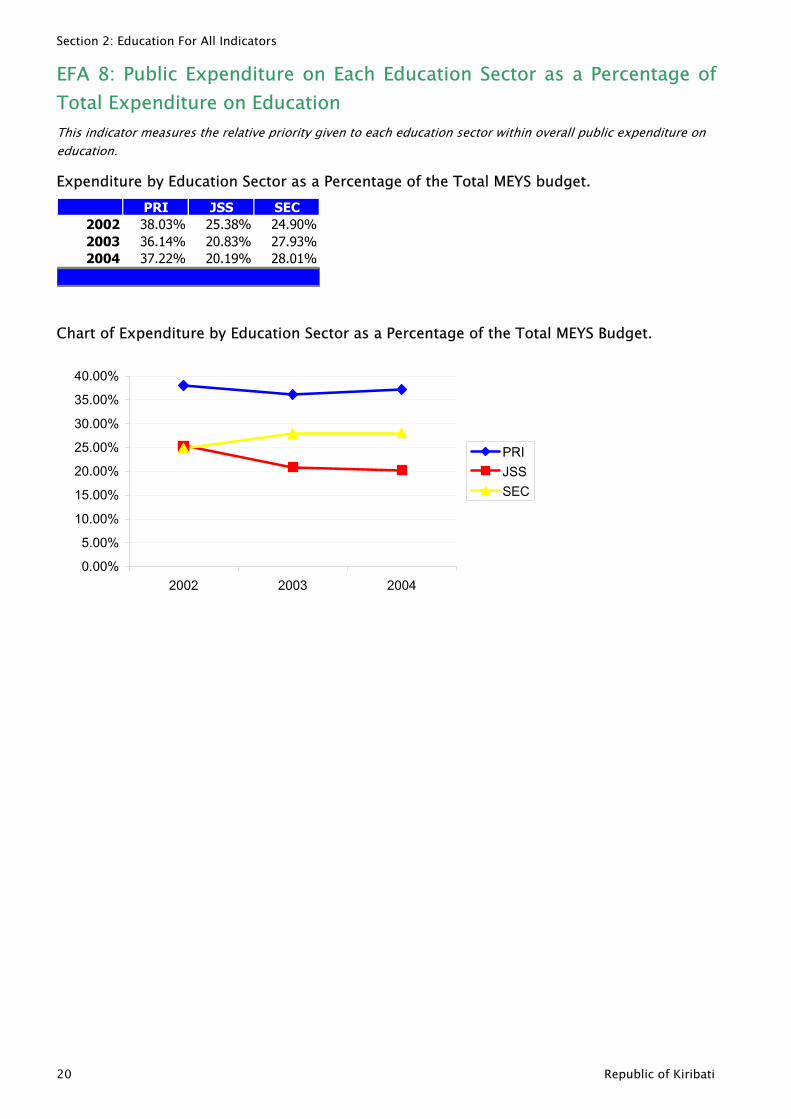
EFA 8: Public Expenditure on Each Education Sector as a Percentage of Total Expenditure on Education
This indicato measure the relative priority given to each education sector within ove all public expenditure on education.
r s r
Expenditure by Education Sector as a Percentage of the Total MEYS budget. PRI JSS SEC
2002 38.03% 25.38% 24.90%2003 36.14% 20.83% 27.93%2004 37.22% 20.19% 28.01%
Chart of Expenditure by Education Sector as a Percentage of the Total MEYS Budget.
0.00%
5.00%
10.00%
15.00%
20.00%
25.00%
30.00%
35.00%
40.00%
2002 2003 2004
PRIJSSSEC
20 Republic of Kiribati
Section 2: Education For All Indicators
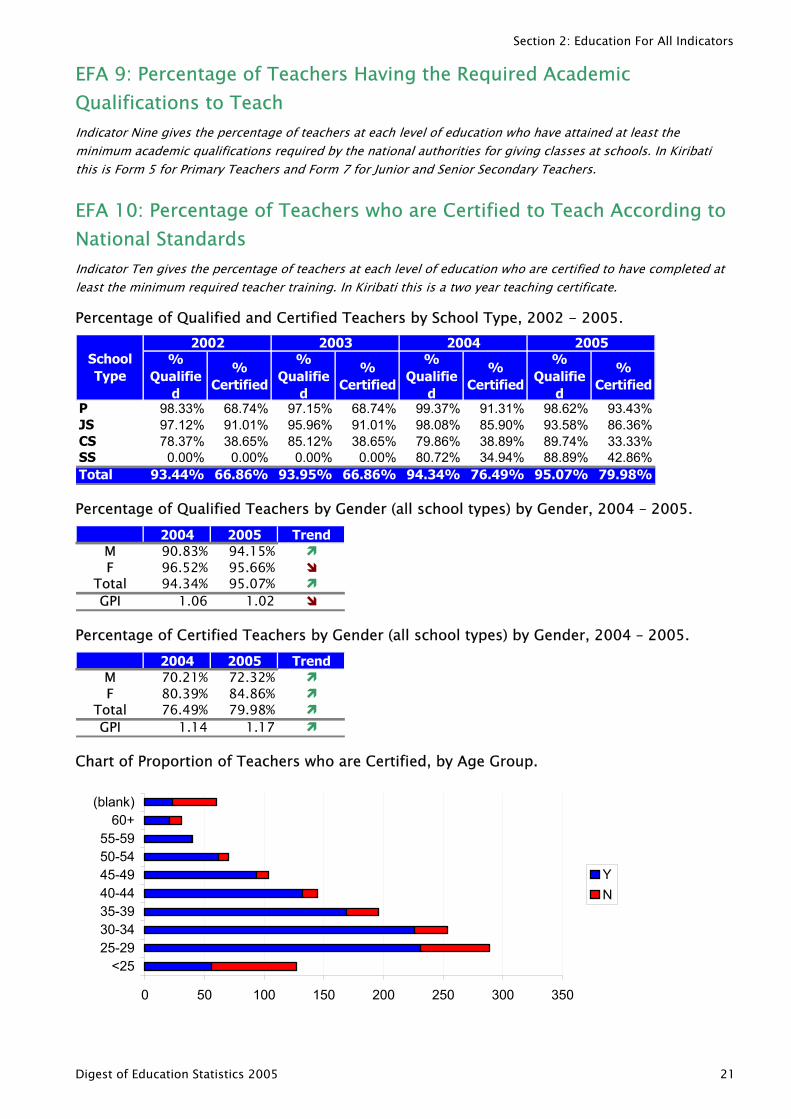
EFA 9: Percentage of Teachers Having the Required Academic Qualifications to Teach Indicator Nine gives the percentage of teachers at each level of education who have attained at least the minimum academic qualifications required b the national authorities for giving classes at schools. In Kiribati this is Form 5 for Primary Teachers and Form 7 for Junior and Senior Secondary Teachers.
y
r
EFA 10: Percentage of Teachers who are Certified to Teach According to National Standards Indicator Ten gives the percentage of teachers at each level of education who a e certified to have completed at least the minimum required teacher training. In Kiribati this is a two year teaching certificate.
Percentage of Qualified and Certified Teachers by School Type, 2002 - 2005.
% Qualifie
d
% Certified
% Qualifie
d
% Certified
% Qualifie
d
% Certified
% Qualifie
d
% Certified
P 98.33% 68.74% 97.15% 68.74% 99.37% 91.31% 98.62% 93.43%JS 97.12% 91.01% 95.96% 91.01% 98.08% 85.90% 93.58% 86.36%CS 78.37% 38.65% 85.12% 38.65% 79.86% 38.89% 89.74% 33.33%SS 0.00% 0.00% 0.00% 0.00% 80.72% 34.94% 88.89% 42.86%Total 93.44% 66.86% 93.95% 66.86% 94.34% 76.49% 95.07% 79.98%
2005School Type
2002 2003 2004
Percentage of Qualified Teachers by Gender (all school types) by Gender, 2004 – 2005. 2004 2005 Trend
M 90.83% 94.15%F 96.52% 95.66%
Total 94.34% 95.07%GPI 1.06 1.02
Percentage of Certified Teachers by Gender (all school types) by Gender, 2004 – 2005. 2004 2005 Trend
M 70.21% 72.32%F 80.39% 84.86%
Total 76.49% 79.98%GPI 1.14 1.17
Chart of Proportion of Teachers who are Certified, by Age Group.
0 50 100 150 200 250 300 350
<2525-2930-3435-3940-4445-4950-5455-59
60+(blank)
YN
Digest of Education Statistics 2005 21
Section 2: Education For All Indicators
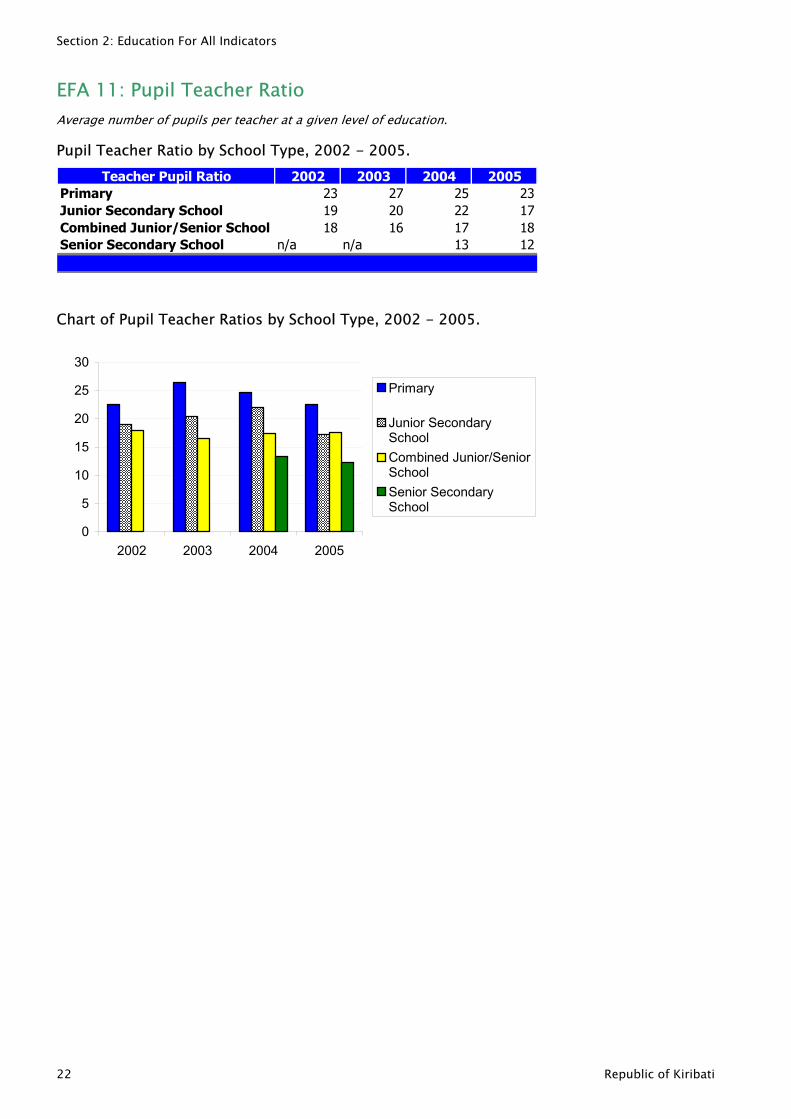
EFA 11: Pupil Teacher Ratio Ave age number of pupils per teache at a given level of education. r r
Pupil Teacher Ratio by School Type, 2002 - 2005. Teacher Pupil Ratio 2002 2003 2004 2005
Primary 23 27 25 23Junior Secondary School 19 20 22 17Combined Junior/Senior School 18 16 17 18Senior Secondary School n/a n/a 13 12
Chart of Pupil Teacher Ratios by School Type, 2002 - 2005.
0
5
10
15
20
25
30
2002 2003 2004 2005
Primary
Junior SecondarySchoolCombined Junior/SeniorSchoolSenior SecondarySchool
22 Republic of Kiribati
Section 2: Education For All Indicators
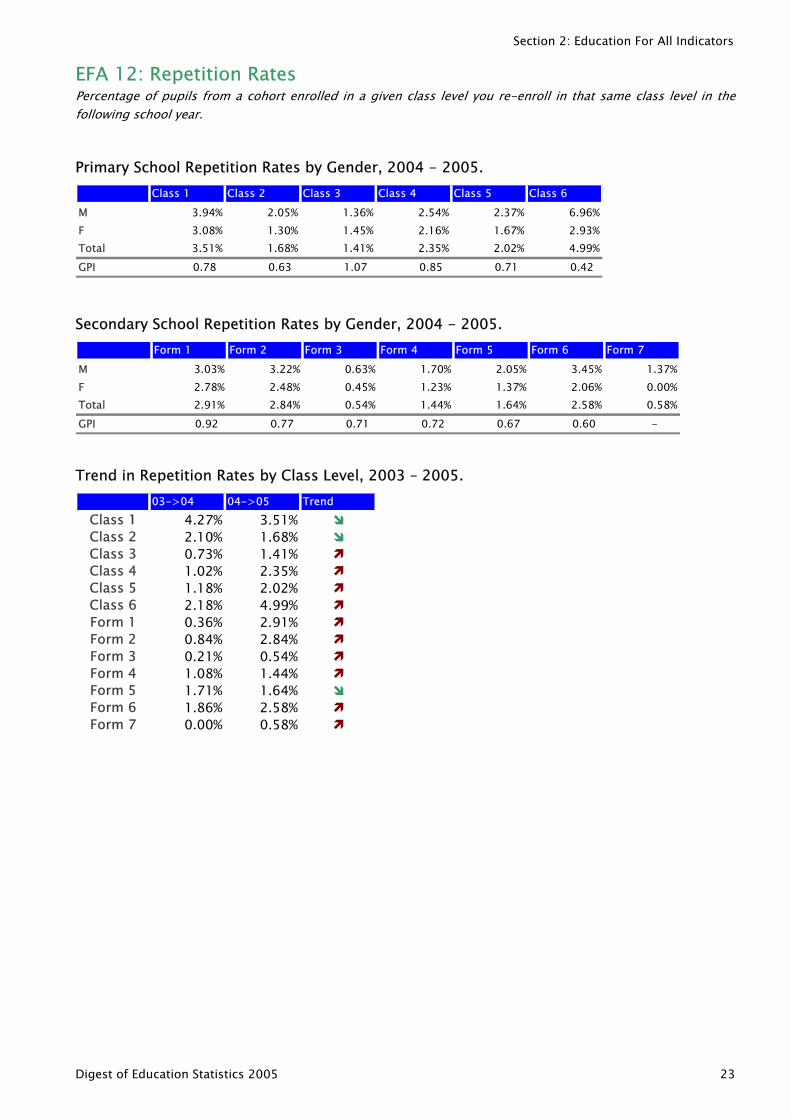
EFA 12: Repetition Rates Percentage of pupils from a cohort enrolled in a given class level you re-enroll in that same class level in thefollowing school year.
Primary School Repetition Rates by Gender, 2004 - 2005. Class 1 Class 2 Class 3 Class 4 Class 5 Class 6
M 3.94% 2.05% 1.36% 2.54% 2.37% 6.96%F 3.08% 1.30% 1.45% 2.16% 1.67% 2.93%Total 3.51% 1.68% 1.41% 2.35% 2.02% 4.99%GPI 0.78 0.63 1.07 0.85 0.71 0.42
Secondary School Repetition Rates by Gender, 2004 - 2005. Form 1 Form 2 Form 3 Form 4 Form 5 Form 6 Form 7
M 3.03% 3.22% 0.63% 1.70% 2.05% 3.45% 1.37%F 2.78% 2.48% 0.45% 1.23% 1.37% 2.06% 0.00%Total 2.91% 2.84% 0.54% 1.44% 1.64% 2.58% 0.58%GPI 0.92 0.77 0.71 0.72 0.67 0.60 -
Trend in Repetition Rates by Class Level, 2003 – 2005. 03->04 04->05 Trend
Class 1 4.27% 3.51%Class 2 2.10% 1.68%Class 3 0.73% 1.41%Class 4 1.02% 2.35%Class 5 1.18% 2.02%Class 6 2.18% 4.99%Form 1 0.36% 2.91%Form 2 0.84% 2.84%Form 3 0.21% 0.54%Form 4 1.08% 1.44%Form 5 1.71% 1.64%Form 6 1.86% 2.58%Form 7 0.00% 0.58%
Digest of Education Statistics 2005 23
Section 3: Primary Schools
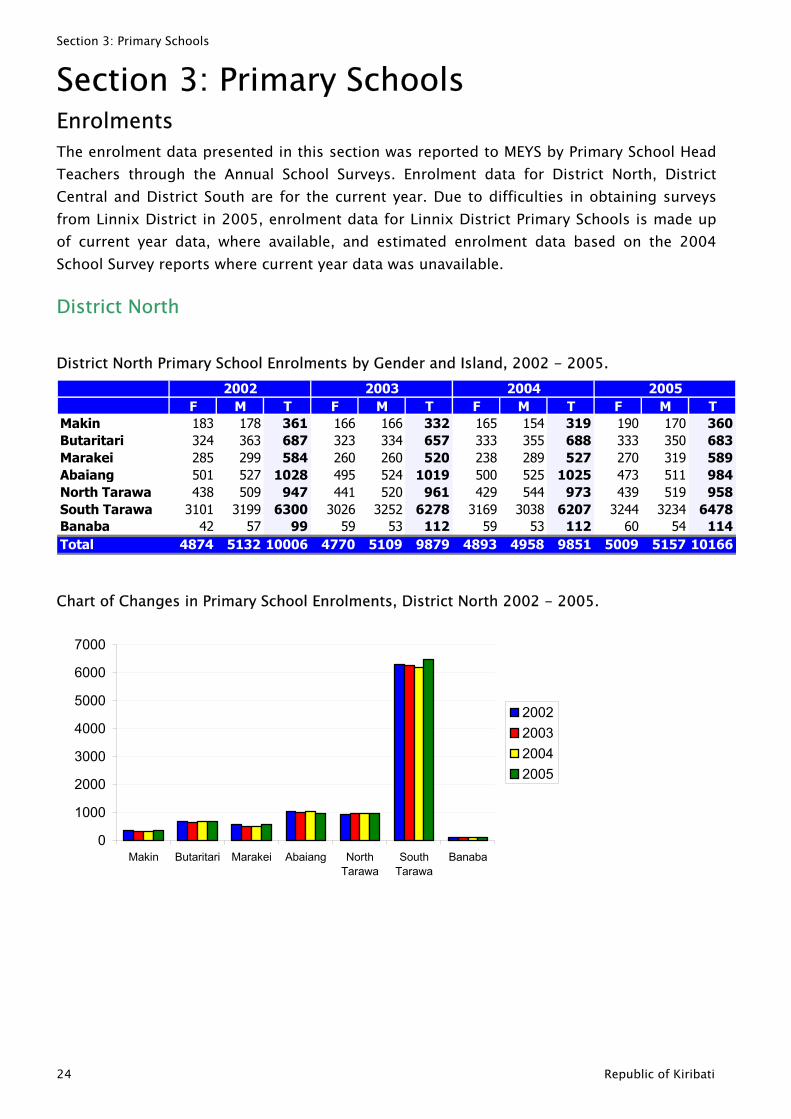
Section 3: Primary Schools Enrolments The enrolment data presented in this section was reported to MEYS by Primary School Head Teachers through the Annual School Surveys. Enrolment data for District North, District Central and District South are for the current year. Due to difficulties in obtaining surveys from Linnix District in 2005, enrolment data for Linnix District Primary Schools is made up of current year data, where available, and estimated enrolment data based on the 2004 School Survey reports where current year data was unavailable.
District North
District North Primary School Enrolments by Gender and Island, 2002 - 2005.
F M T F M T F M T F M TMakin 183 178 361 166 166 332 165 154 319 190 170 360Butaritari 324 363 687 323 334 657 333 355 688 333 350 683Marakei 285 299 584 260 260 520 238 289 527 270 319 589Abaiang 501 527 1028 495 524 1019 500 525 1025 473 511 984North Tarawa 438 509 947 441 520 961 429 544 973 439 519 958South Tarawa 3101 3199 6300 3026 3252 6278 3169 3038 6207 3244 3234 6478Banaba 42 57 99 59 53 112 59 53 112 60 54 114Total 4874 5132 10006 4770 5109 9879 4893 4958 9851 5009 5157 10166
2002 2003 2004 2005
Chart of Changes in Primary School Enrolments, District North 2002 - 2005.
0
1000
2000
3000
4000
5000
6000
7000
Makin Butaritari Marakei Abaiang NorthTarawa
SouthTarawa
Banaba
2002200320042005
24 Republic of Kiribati
Section 3: Primary Schools
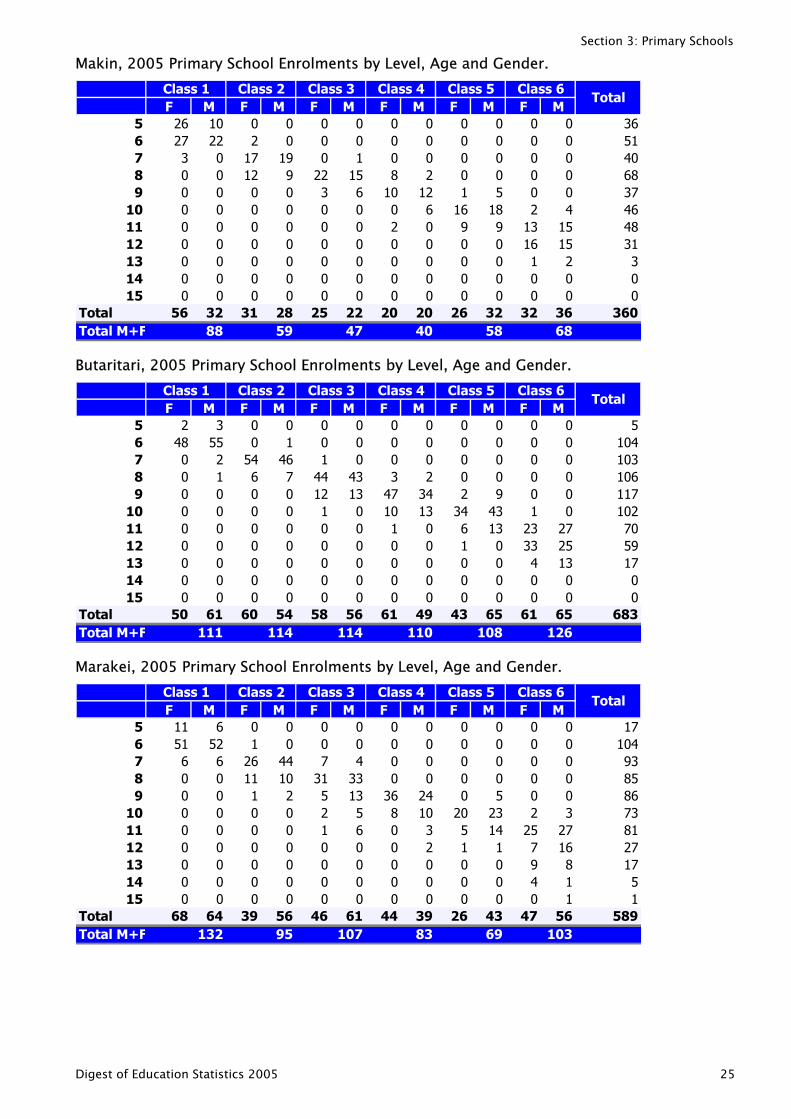
Makin, 2005 Primary School Enrolments by Level, Age and Gender.
F M F M F M F M F M F M5 26 10 0 0 0 0 0 0 0 0 0 0 36 27 22 2 0 0 0 0 0 0 0 0 0 57 3 0 17 19 0 1 0 0 0 0 0 0 48 0 0 12 9 22 15 8 2 0 0 0 0 69 0 0 0 0 3 6 10 12 1 5 0 0 3
10 0 0 0 0 0 0 0 6 16 18 2 4 411 0 0 0 0 0 0 2 0 9 9 13 15 412 0 0 0 0 0 0 0 0 0 0 16 15 313 0 0 0 0 0 0 0 0 0 0 1 214 0 0 0 0 0 0 0 0 0 0 0 015 0 0 0 0 0 0 0 0 0 0 0 0
Total 56 32 31 28 25 22 20 20 26 32 32 36 360Total M+
61087681300
F
Class 5 Class 6
58 68
Class 1 Class 2
88 59 47 40
Class 3 Class 4Total
Butaritari, 2005 Primary School Enrolments by Level, Age and Gender.
F M F M F M F M F M F M5 2 3 0 0 0 0 0 0 0 0 0 06 48 55 0 1 0 0 0 0 0 0 0 0 107 0 2 54 46 1 0 0 0 0 0 0 0 108 0 1 6 7 44 43 3 2 0 0 0 0 109 0 0 0 0 12 13 47 34 2 9 0 0 117
10 0 0 0 0 1 0 10 13 34 43 1 0 1011 0 0 0 0 0 0 1 0 6 13 23 27 712 0 0 0 0 0 0 0 0 1 0 33 25 513 0 0 0 0 0 0 0 0 0 0 4 13 114 0 0 0 0 0 0 0 0 0 0 0 015 0 0 0 0 0 0 0 0 0 0 0 0
Total 50 61 60 54 58 56 61 49 43 65 61 65 683Total M+
5436
209700
F 114 110
Class 1 Class 2 Class 3 Class 4 Class 5 Class 6Total
108 126111 114
Marakei, 2005 Primary School Enrolments by Level, Age and Gender.
F M F M F M F M F M F M5 11 6 0 0 0 0 0 0 0 0 0 0 16 51 52 1 0 0 0 0 0 0 0 0 0 107 6 6 26 44 7 4 0 0 0 0 0 0 98 0 0 11 10 31 33 0 0 0 0 0 0 89 0 0 1 2 5 13 36 24 0 5 0 0 8
10 0 0 0 0 2 5 8 10 20 23 2 3 711 0 0 0 0 1 6 0 3 5 14 25 27 812 0 0 0 0 0 0 0 2 1 1 7 16 213 0 0 0 0 0 0 0 0 0 0 9 8 114 0 0 0 0 0 0 0 0 0 0 4 115 0 0 0 0 0 0 0 0 0 0 0 1
Total 68 64 39 56 46 61 44 39 26 43 47 56 589Total M+
74356317751
F
Class 1 Class 2 Class 3 Class 4 Class 5 Class 6Total
132 95 107 83 69 103
Digest of Education Statistics 2005 25

Section 3: Primary Schools
Abaiang, 2005 Primary School Enrolments by Level, Age and Gender.
F M F M F M F M F M F M5 12 10 0 0 0 0 0 0 0 0 0 0 26 73 81 19 15 0 0 0 0 0 0 0 0 187 7 13 56 71 2 3 0 0 0 0 0 0 158 1 0 3 12 49 44 2 3 0 0 0 0 119 0 0 0 2 20 30 56 54 10 6 0 0 178
10 0 0 0 1 9 4 16 14 43 28 5 7 1211 0 0 0 0 1 3 1 5 15 15 54 63 1512 0 0 0 0 0 0 0 0 4 2 12 21 313 0 0 0 0 0 0 0 0 1 1 2 314 0 0 0 0 0 0 0 0 0 0 0 015 0 0 0 0 0 0 0 0 0 0 0 0
Total 93 104 78 101 81 84 75 76 73 52 73 94 984Total M+
2824
779700
F
Class 6Total
197 179 165 151 125 167
Class 1 Class 2 Class 5Class 3 Class 4
North Tarawa, 2005 Primary School Enrolments by Level, Age and Gender.
F M F M F M F M F M F M5 12 7 0 0 0 0 0 0 0 0 0 0 16 78 84 2 3 0 0 0 0 0 0 0 0 167 23 23 28 52 3 2 0 0 0 0 0 0 138 4 5 13 24 27 28 3 2 0 1 0 0 109 0 1 26 20 10 24 25 23 2 4 0 0 135
10 0 0 0 0 14 22 20 18 24 21 1 3 12311 0 0 0 0 0 0 17 19 13 17 26 34 1212 0 0 0 0 0 0 0 1 27 30 27 24 1013 0 0 0 0 0 0 0 0 0 0 13 25 314 0 0 0 0 0 0 0 0 0 0 1 215 0 0 0 0 0 0 0 0 0 0 0 0
Total 117 120 69 99 54 76 65 63 66 73 68 88 958Total M+
9717
69830
F
Class 3 Class 4 Class 5 Class 6Total
237 168 130 128 139 156
Class 1 Class 2
South Tarawa, 2005 Primary School Enrolments by Level, Age and Gender.
F M F M F M F M F M F M5 43 57 0 0 0 0 0 0 0 0 0 0 106 467 474 40 17 0 0 0 0 0 0 0 0 997 72 82 423 370 16 21 0 0 0 0 0 0 988 5 11 90 116 362 368 33 34 0 0 0 0 10199 2 2 13 7 136 136 344 360 38 35 0 0 1073
10 0 0 0 0 16 17 115 88 318 318 16 19 90711 0 0 0 0 2 0 20 18 139 142 352 308 9812 0 0 0 0 0 0 0 0 13 28 123 142 3013 0 0 0 0 0 0 0 0 3 3 37 55 914 0 0 0 0 0 0 0 0 0 0 6 6 115 0 0 0 0 0 0 0 0 0 0 0 0
Total 589 626 566 510 532 542 512 500 511 526 534 530 6478Total M+
084
16820
F
Class 6Total
1215 1076 1074 1012 1037 1064
Class 1 Class 2 Class 5Class 3 Class 4
26 Republic of Kiribati
Section 3: Primary Schools
Banaba, 2005 Primary School Enrolments by Level, Age and Gender.
F M F M F M F M F M F M5 2 0 0 0 0 0 0 0 0 0 0 06 5 8 0 0 0 0 0 0 0 0 0 0 17 0 0 11 7 0 0 0 0 0 0 0 0 18 0 0 0 0 17 14 0 1 0 0 0 0 39 0 0 0 0 8 0 6 8 0 5 0 0 2
10 0 0 0 0 1 0 2 0 1 2 0 111 0 0 0 0 0 0 0 0 7 1 0 4 112 0 0 0 0 0 0 0 0 0 0 0 313 0 0 0 0 0 0 0 0 0 0 0 014 0 0 0 0 0 0 0 0 0 0 0 015 0 0 0 0 0 0 0 0 0 0 0 0
Total 7 8 11 7 26 14 8 9 8 8 0 8 11Total M+
238277230004
F
Class 3 Class 4 Class 5 Class 6Total
15 18 40 17 16 8
Class 1 Class 2
District North Primary Schools Summary: Number of Pupils and Number of Teachers by School and Gender, 2005.
Makin
MakinF M F M
Nan Teikao Primary School 124 136 260 7 2 9Abaewewe Primary School 66 34 100 1 2 3Total 190 170 360 8 4 12
2005No. of Pupils No. of Teachers
Total2005
Total
Butaritari
ButaritariF M F M
Tikinee Primary School 18 16 34 3 0 3Anderson Primary School 32 33 65 3 0 3Anginibaiatooa Primary School 58 75 133 2 3 5Teraaka Primary School 24 26 50 2 1 3AinenKarawa Primary School 111 120 231 10 2 12Satellite Primary School 10 17 27 1 1 2Teinaura Primary School 80 63 143 4 2 6Total 333 350 683 25 9 34
No. of Teachers2005
Total2005
Total
No. of Pupils
Marakei
MarakeiF M F M
Nikierere Primary School 114 141 255 5 5 10Taiti Primary School 94 101 195 5 2 7Uaabong Primary School 62 77 139 4 2 6Total 270 319 589 14 9 23
No. of Pupils No. of Teachers2005
Total2005
Total
Digest of Education Statistics 2005 27
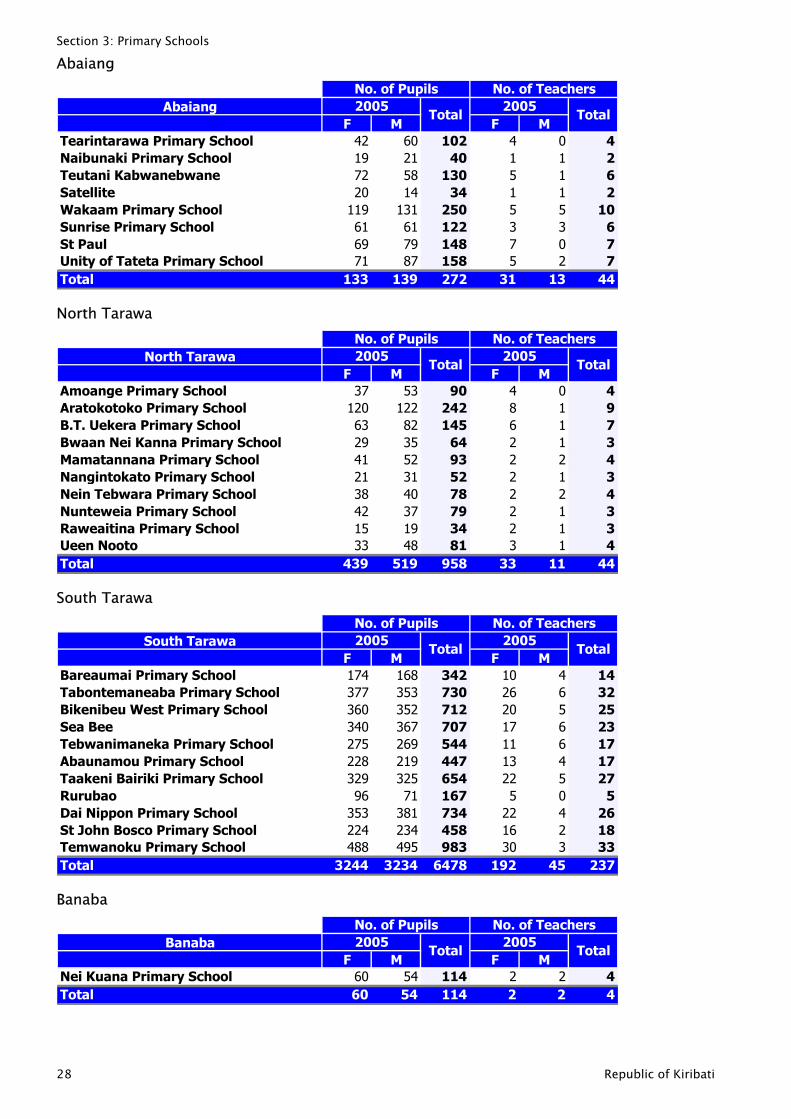
Section 3: Primary Schools
Abaiang
AbaiangF M F M
Tearintarawa Primary School 42 60 102 4 0 4Naibunaki Primary School 19 21 40 1 1 2Teutani Kabwanebwane 72 58 130 5 1 6Satellite 20 14 34 1 1 2Wakaam Primary School 119 131 250 5 5 10Sunrise Primary School 61 61 122 3 3 6St Paul 69 79 148 7 0 7Unity of Tateta Primary School 71 87 158 5 2 7Total 133 139 272 31 13 44
No. of Pupils No. of Teachers2005
Total2005
Total
North Tarawa
North TarawaF M F M
Amoange Primary School 37 53 90 4 0 4Aratokotoko Primary School 120 122 242 8 1 9B.T. Uekera Primary School 63 82 145 6 1 7Bwaan Nei Kanna Primary School 29 35 64 2 1 3Mamatannana Primary School 41 52 93 2 2 4Nangintokato Primary School 21 31 52 2 1 3Nein Tebwara Primary School 38 40 78 2 2 4Nunteweia Primary School 42 37 79 2 1 3Raweaitina Primary School 15 19 34 2 1 3Ueen Nooto 33 48 81 3 1 4Total 439 519 958 33 11 44
2005Total
No. of Teachers2005
Total
No. of Pupils
South Tarawa
South TarawaF M F M
Bareaumai Primary School 174 168 342 10 4 14Tabontemaneaba Primary School 377 353 730 26 6 32Bikenibeu West Primary School 360 352 712 20 5 25Sea Bee 340 367 707 17 6 23Tebwanimaneka Primary School 275 269 544 11 6 17Abaunamou Primary School 228 219 447 13 4 17Taakeni Bairiki Primary School 329 325 654 22 5 27Rurubao 96 71 167 5 0 5Dai Nippon Primary School 353 381 734 22 4 26St John Bosco Primary School 224 234 458 16 2 18Temwanoku Primary School 488 495 983 30 3 33Total 3244 3234 6478 192 45 237
No. of Teachers2005
Total2005
Total
No. of Pupils
Banaba
BanabaF M F M
Nei Kuana Primary School 60 54 114 2 2 4Total 60 54 114 2 2 4
No. of Pupils No. of Teachers2005
Total2005
Total
28 Republic of Kiribati
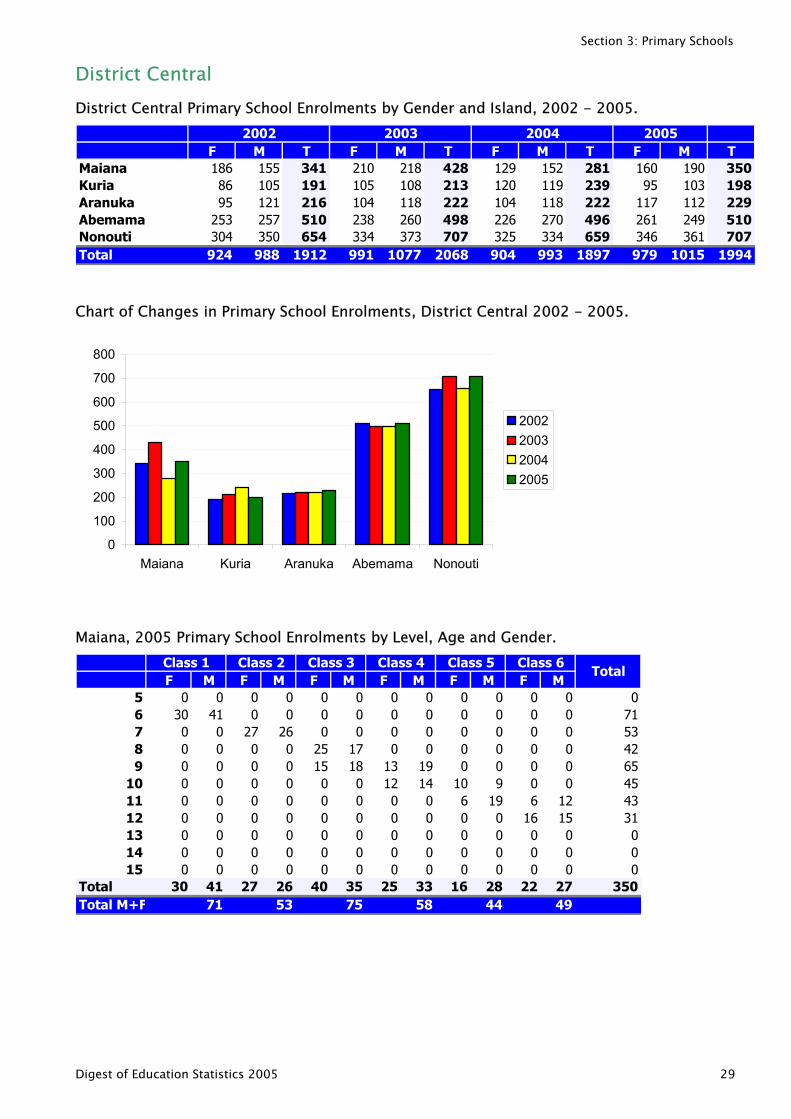
Section 3: Primary Schools
District Central District Central Primary School Enrolments by Gender and Island, 2002 - 2005.
F M T F M T F M T F M TMaiana 186 155 341 210 218 428 129 152 281 160 190 350Kuria 86 105 191 105 108 213 120 119 239 95 103 198Aranuka 95 121 216 104 118 222 104 118 222 117 112 229Abemama 253 257 510 238 260 498 226 270 496 261 249 510Nonouti 304 350 654 334 373 707 325 334 659 346 361 707Total 924 988 1912 991 1077 2068 904 993 1897 979 1015 1994
2002 2003 2004 2005
Chart of Changes in Primary School Enrolments, District Central 2002 - 2005.
0
100
200
300
400
500
600
700
800
Maiana Kuria Aranuka Abemama Nonouti
2002200320042005
Maiana, 2005 Primary School Enrolments by Level, Age and Gender.
F M F M F M F M F M F M5 0 0 0 0 0 0 0 0 0 0 0 06 30 41 0 0 0 0 0 0 0 0 0 0 77 0 0 27 26 0 0 0 0 0 0 0 0 58 0 0 0 0 25 17 0 0 0 0 0 0 49 0 0 0 0 15 18 13 19 0 0 0 0 6
10 0 0 0 0 0 0 12 14 10 9 0 0 411 0 0 0 0 0 0 0 0 6 19 6 12 412 0 0 0 0 0 0 0 0 0 0 16 15 313 0 0 0 0 0 0 0 0 0 0 0 014 0 0 0 0 0 0 0 0 0 0 0 015 0 0 0 0 0 0 0 0 0 0 0 0
Total 30 41 27 26 40 35 25 33 16 28 22 27 350Total M+
01325531000
F
Class 6Total
71 53 75 58 44 49
Class 1 Class 2 Class 5Class 3 Class 4
Digest of Education Statistics 2005 29
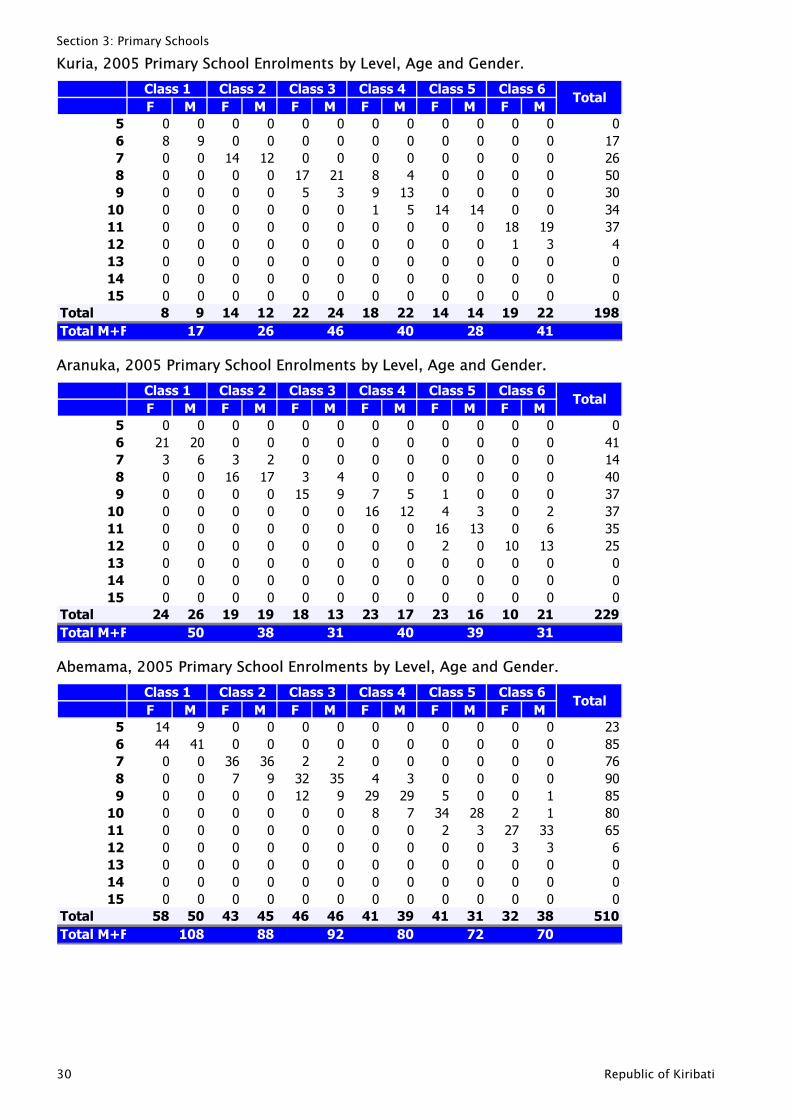
Section 3: Primary Schools
Kuria, 2005 Primary School Enrolments by Level, Age and Gender.
F M F M F M F M F M F M5 0 0 0 0 0 0 0 0 0 0 0 06 8 9 0 0 0 0 0 0 0 0 0 0 17 0 0 14 12 0 0 0 0 0 0 0 0 28 0 0 0 0 17 21 8 4 0 0 0 0 59 0 0 0 0 5 3 9 13 0 0 0 0 3
10 0 0 0 0 0 0 1 5 14 14 0 0 311 0 0 0 0 0 0 0 0 0 0 18 19 312 0 0 0 0 0 0 0 0 0 0 1 313 0 0 0 0 0 0 0 0 0 0 0 014 0 0 0 0 0 0 0 0 0 0 0 015 0 0 0 0 0 0 0 0 0 0 0 0
Total 8 9 14 12 22 24 18 22 14 14 19 22 198Total M+
07600474000
F
Class 3 Class 4 Class 5 Class 6Total
17 26 46 40 28 41
Class 1 Class 2
Aranuka, 2005 Primary School Enrolments by Level, Age and Gender.
F M F M F M F M F M F M5 0 0 0 0 0 0 0 0 0 0 0 06 21 20 0 0 0 0 0 0 0 0 0 0 47 3 6 3 2 0 0 0 0 0 0 0 0 18 0 0 16 17 3 4 0 0 0 0 0 0 49 0 0 0 0 15 9 7 5 1 0 0 0 3
10 0 0 0 0 0 0 16 12 4 3 0 2 311 0 0 0 0 0 0 0 0 16 13 0 6 312 0 0 0 0 0 0 0 0 2 0 10 13 213 0 0 0 0 0 0 0 0 0 0 0 014 0 0 0 0 0 0 0 0 0 0 0 015 0 0 0 0 0 0 0 0 0 0 0 0
Total 24 26 19 19 18 13 23 17 23 16 10 21 229Total M+
01407755000
F
Class 6Total
50 38 31 40 39 31
Class 1 Class 2 Class 5Class 3 Class 4
Abemama, 2005 Primary School Enrolments by Level, Age and Gender.
F M F M F M F M F M F M5 14 9 0 0 0 0 0 0 0 0 0 0 26 44 41 0 0 0 0 0 0 0 0 0 0 87 0 0 36 36 2 2 0 0 0 0 0 0 78 0 0 7 9 32 35 4 3 0 0 0 0 99 0 0 0 0 12 9 29 29 5 0 0 1 8
10 0 0 0 0 0 0 8 7 34 28 2 1 811 0 0 0 0 0 0 0 0 2 3 27 33 612 0 0 0 0 0 0 0 0 0 0 3 313 0 0 0 0 0 0 0 0 0 0 0 014 0 0 0 0 0 0 0 0 0 0 0 015 0 0 0 0 0 0 0 0 0 0 0 0
Total 58 50 43 45 46 46 41 39 41 31 32 38 510Total M+
35605056000
F
Class 3 Class 4 Class 5 Class 6Total
108 88 92 80 72 70
Class 1 Class 2
30 Republic of Kiribati
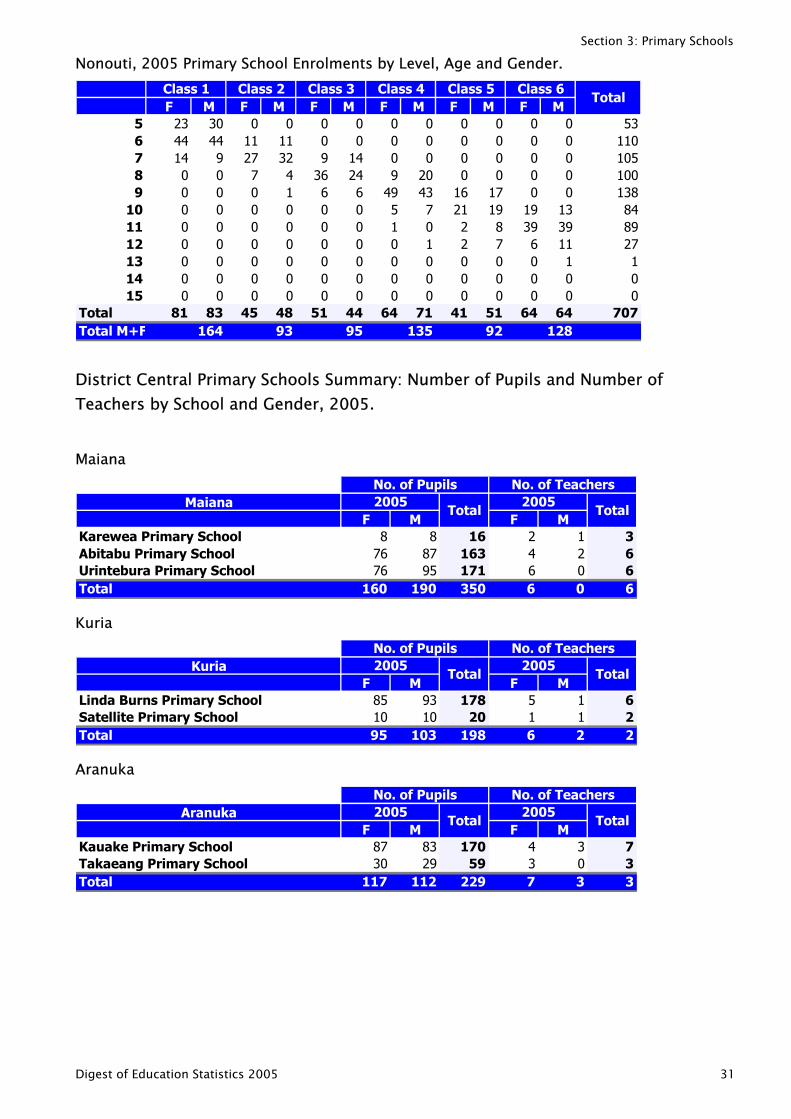
Section 3: Primary Schools
Nonouti, 2005 Primary School Enrolments by Level, Age and Gender.
F M F M F M F M F M F M5 23 30 0 0 0 0 0 0 0 0 0 0 56 44 44 11 11 0 0 0 0 0 0 0 0 117 14 9 27 32 9 14 0 0 0 0 0 0 108 0 0 7 4 36 24 9 20 0 0 0 0 109 0 0 0 1 6 6 49 43 16 17 0 0 13
10 0 0 0 0 0 0 5 7 21 19 19 13 811 0 0 0 0 0 0 1 0 2 8 39 39 812 0 0 0 0 0 0 0 1 2 7 6 11 213 0 0 0 0 0 0 0 0 0 0 0 114 0 0 0 0 0 0 0 0 0 0 0 015 0 0 0 0 0 0 0 0 0 0 0 0
Total 81 83 45 48 51 44 64 71 41 51 64 64 707Total M+
30508497100
F
Class 6Total
164 93 95 135 92 128
Class 1 Class 2 Class 5Class 3 Class 4
District Central Primary Schools Summary: Number of Pupils and Number of Teachers by School and Gender, 2005.
Maiana
MaianaF M F M
Karewea Primary School 8 8 16 2 1 3Abitabu Primary School 76 87 163 4 2 6Urintebura Primary School 76 95 171 6 0 6Total 160 190 350 6 0 6
No. of Pupils No. of Teachers2005
Total2005
Total
Kuria
KuriaF M F M
Linda Burns Primary School 85 93 178 5 1 6Satellite Primary School 10 10 20 1 1 2Total 95 103 198 6 2 2
2005Total
No. of Teachers2005
Total
No. of Pupils
Aranuka
AranukaF M F M
Kauake Primary School 87 83 170 4 3 7Takaeang Primary School 30 29 59 3 0 3Total 117 112 229 7 3 3
No. of Pupils No. of Teachers2005
Total2005
Total
Digest of Education Statistics 2005 31
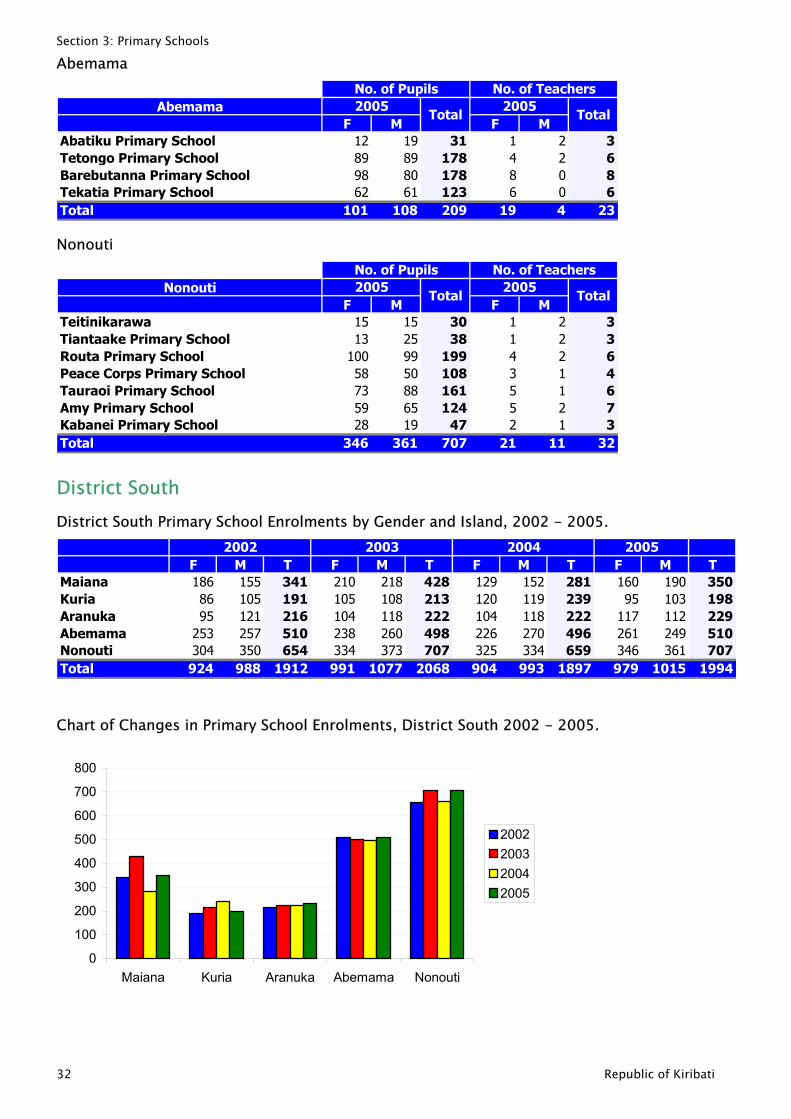
Section 3: Primary Schools
Abemama
AbemamaF M F M
Abatiku Primary School 12 19 31 1 2 3Tetongo Primary School 89 89 178 4 2 6Barebutanna Primary School 98 80 178 8 0 8Tekatia Primary School 62 61 123 6 0 6Total 101 108 209 19 4 23
No. of Pupils No. of Teachers2005
Total2005
Total
Nonouti
NonoutiF M F M
Teitinikarawa 15 15 30 1 2 3Tiantaake Primary School 13 25 38 1 2 3Routa Primary School 100 99 199 4 2 6Peace Corps Primary School 58 50 108 3 1 4Tauraoi Primary School 73 88 161 5 1 6Amy Primary School 59 65 124 5 2 7Kabanei Primary School 28 19 47 2 1 3Total 346 361 707 21 11 32
No. of Teachers2005
Total2005
Total
No. of Pupils
District South District South Primary School Enrolments by Gender and Island, 2002 - 2005.
F M T F M T F M T F M TMaiana 186 155 341 210 218 428 129 152 281 160 190 350Kuria 86 105 191 105 108 213 120 119 239 95 103 198Aranuka 95 121 216 104 118 222 104 118 222 117 112 229Abemama 253 257 510 238 260 498 226 270 496 261 249 510Nonouti 304 350 654 334 373 707 325 334 659 346 361 707Total 924 988 1912 991 1077 2068 904 993 1897 979 1015 1994
2002 2003 2004 2005
Chart of Changes in Primary School Enrolments, District South 2002 - 2005.
0
100
200
300
400
500
600
700
800
Maiana Kuria Aranuka Abemama Nonouti
2002200320042005
32 Republic of Kiribati
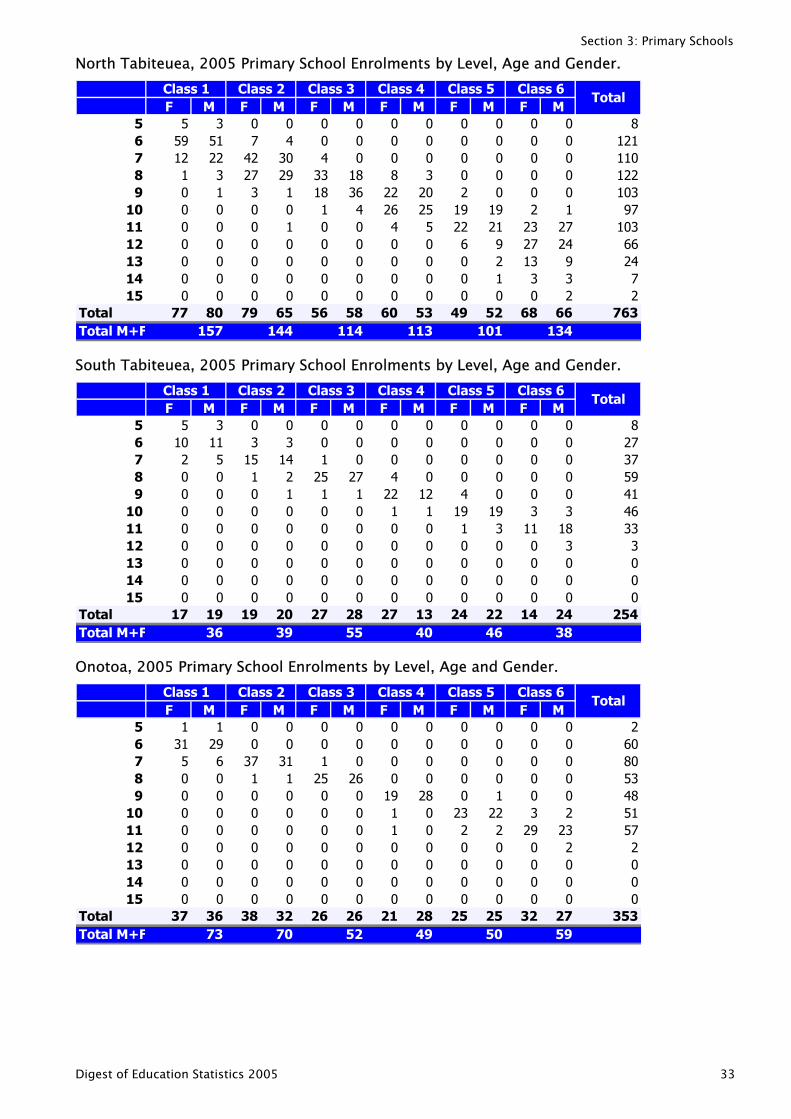
Section 3: Primary Schools
North Tabiteuea, 2005 Primary School Enrolments by Level, Age and Gender.
F M F M F M F M F M F M5 5 3 0 0 0 0 0 0 0 0 0 06 59 51 7 4 0 0 0 0 0 0 0 0 127 12 22 42 30 4 0 0 0 0 0 0 0 118 1 3 27 29 33 18 8 3 0 0 0 0 129 0 1 3 1 18 36 22 20 2 0 0 0 103
10 0 0 0 0 1 4 26 25 19 19 2 1 911 0 0 0 1 0 0 4 5 22 21 23 27 1012 0 0 0 0 0 0 0 0 6 9 27 24 613 0 0 0 0 0 0 0 0 0 2 13 9 214 0 0 0 0 0 0 0 0 0 1 3 315 0 0 0 0 0 0 0 0 0 0 0 2
Total 77 80 79 65 56 58 60 53 49 52 68 66 763Total M+
8102
736472
F
Class 3 Class 4 Class 5 Class 6Total
157 144 114 113 101 134
Class 1 Class 2
South Tabiteuea, 2005 Primary School Enrolments by Level, Age and Gender.
F M F M F M F M F M F M5 5 3 0 0 0 0 0 0 0 0 0 06 10 11 3 3 0 0 0 0 0 0 0 0 27 2 5 15 14 1 0 0 0 0 0 0 0 38 0 0 1 2 25 27 4 0 0 0 0 0 59 0 0 0 1 1 1 22 12 4 0 0 0 4
10 0 0 0 0 0 0 1 1 19 19 3 3 411 0 0 0 0 0 0 0 0 1 3 11 18 312 0 0 0 0 0 0 0 0 0 0 0 313 0 0 0 0 0 0 0 0 0 0 0 014 0 0 0 0 0 0 0 0 0 0 0 015 0 0 0 0 0 0 0 0 0 0 0 0
Total 17 19 19 20 27 28 27 13 24 22 14 24 254Total M+
87791633000
F
Class 6Total
36 39 55 40 46 38
Class 1 Class 2 Class 5Class 3 Class 4
Onotoa, 2005 Primary School Enrolments by Level, Age and Gender.
F M F M F M F M F M F M5 1 1 0 0 0 0 0 0 0 0 0 06 31 29 0 0 0 0 0 0 0 0 0 0 67 5 6 37 31 1 0 0 0 0 0 0 0 88 0 0 1 1 25 26 0 0 0 0 0 0 59 0 0 0 0 0 0 19 28 0 1 0 0 4
10 0 0 0 0 0 0 1 0 23 22 3 2 511 0 0 0 0 0 0 1 0 2 2 29 23 512 0 0 0 0 0 0 0 0 0 0 0 213 0 0 0 0 0 0 0 0 0 0 0 014 0 0 0 0 0 0 0 0 0 0 0 015 0 0 0 0 0 0 0 0 0 0 0 0
Total 37 36 38 32 26 26 21 28 25 25 32 27 353Total M+
20038172000
F
Class 3 Class 4 Class 5 Class 6Total
73 70 52 49 50 59
Class 1 Class 2
Digest of Education Statistics 2005 33
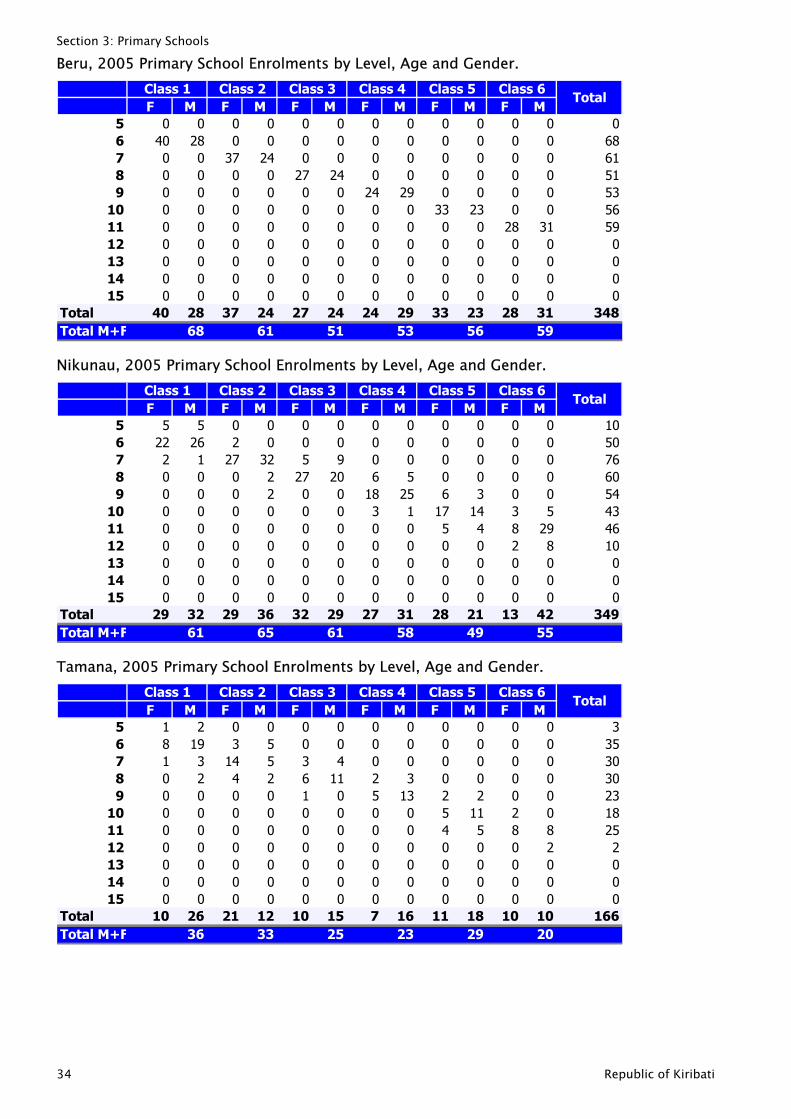
Section 3: Primary Schools
Beru, 2005 Primary School Enrolments by Level, Age and Gender.
F M F M F M F M F M F M5 0 0 0 0 0 0 0 0 0 0 0 06 40 28 0 0 0 0 0 0 0 0 0 0 67 0 0 37 24 0 0 0 0 0 0 0 0 68 0 0 0 0 27 24 0 0 0 0 0 0 59 0 0 0 0 0 0 24 29 0 0 0 0 5
10 0 0 0 0 0 0 0 0 33 23 0 0 511 0 0 0 0 0 0 0 0 0 0 28 31 512 0 0 0 0 0 0 0 0 0 0 0 013 0 0 0 0 0 0 0 0 0 0 0 014 0 0 0 0 0 0 0 0 0 0 0 015 0 0 0 0 0 0 0 0 0 0 0 0
Total 40 28 37 24 27 24 24 29 33 23 28 31 348Total M+
08113690000
F
Class 6Total
68 61 51 53 56 59
Class 1 Class 2 Class 5Class 3 Class 4
Nikunau, 2005 Primary School Enrolments by Level, Age and Gender.
F M F M F M F M F M F M5 5 5 0 0 0 0 0 0 0 0 0 0 16 22 26 2 0 0 0 0 0 0 0 0 0 57 2 1 27 32 5 9 0 0 0 0 0 0 78 0 0 0 2 27 20 6 5 0 0 0 0 69 0 0 0 2 0 0 18 25 6 3 0 0 5
10 0 0 0 0 0 0 3 1 17 14 3 5 411 0 0 0 0 0 0 0 0 5 4 8 29 412 0 0 0 0 0 0 0 0 0 0 2 8 113 0 0 0 0 0 0 0 0 0 0 0 014 0 0 0 0 0 0 0 0 0 0 0 015 0 0 0 0 0 0 0 0 0 0 0 0
Total 29 32 29 36 32 29 27 31 28 21 13 42 349Total M+
00604360000
F
Class 3 Class 4 Class 5 Class 6Total
61 65 61 58 49 55
Class 1 Class 2
Tamana, 2005 Primary School Enrolments by Level, Age and Gender.
F M F M F M F M F M F M5 1 2 0 0 0 0 0 0 0 0 0 06 8 19 3 5 0 0 0 0 0 0 0 0 37 1 3 14 5 3 4 0 0 0 0 0 0 38 0 2 4 2 6 11 2 3 0 0 0 0 39 0 0 0 0 1 0 5 13 2 2 0 0 2
10 0 0 0 0 0 0 0 0 5 11 2 0 111 0 0 0 0 0 0 0 0 4 5 8 8 212 0 0 0 0 0 0 0 0 0 0 0 213 0 0 0 0 0 0 0 0 0 0 0 014 0 0 0 0 0 0 0 0 0 0 0 015 0 0 0 0 0 0 0 0 0 0 0 0
Total 10 26 21 12 10 15 7 16 11 18 10 10 166Total M+
35003852000
F
Class 6Total
36 33 25 23 29 20
Class 1 Class 2 Class 5Class 3 Class 4
34 Republic of Kiribati
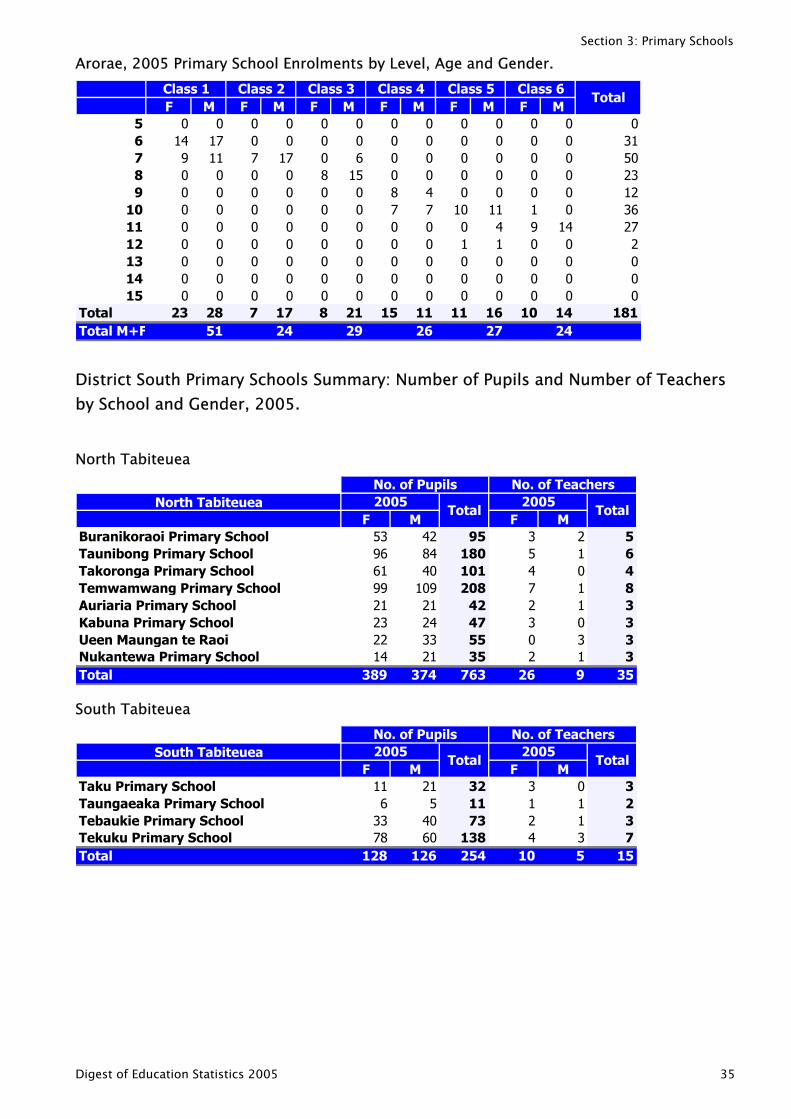
Section 3: Primary Schools
Arorae, 2005 Primary School Enrolments by Level, Age and Gender.
F M F M F M F M F M F M5 0 0 0 0 0 0 0 0 0 0 0 06 14 17 0 0 0 0 0 0 0 0 0 0 37 9 11 7 17 0 6 0 0 0 0 0 0 58 0 0 0 0 8 15 0 0 0 0 0 0 29 0 0 0 0 0 0 8 4 0 0 0 0 1
10 0 0 0 0 0 0 7 7 10 11 1 0 311 0 0 0 0 0 0 0 0 0 4 9 14 212 0 0 0 0 0 0 0 0 1 1 0 013 0 0 0 0 0 0 0 0 0 0 0 014 0 0 0 0 0 0 0 0 0 0 0 015 0 0 0 0 0 0 0 0 0 0 0 0
Total 23 28 7 17 8 21 15 11 11 16 10 14 181Total M+
01032672000
F
Class 3 Class 4 Class 5 Class 6Total
51 24 29 26 27 24
Class 1 Class 2
District South Primary Schools Summary: Number of Pupils and Number of Teachers by School and Gender, 2005.
North Tabiteuea
North TabiteueaF M F M
Buranikoraoi Primary School 53 42 95 3 2 5Taunibong Primary School 96 84 180 5 1 6Takoronga Primary School 61 40 101 4 0 4Temwamwang Primary School 99 109 208 7 1 8Auriaria Primary School 21 21 42 2 1 3Kabuna Primary School 23 24 47 3 0 3Ueen Maungan te Raoi 22 33 55 0 3 3Nukantewa Primary School 14 21 35 2 1 3Total 389 374 763 26 9 35
No. of Pupils No. of Teachers2005
Total2005
Total
South Tabiteuea
South TabiteueaF M F M
Taku Primary School 11 21 32 3 0 3Taungaeaka Primary School 6 5 11 1 1 2Tebaukie Primary School 33 40 73 2 1 3Tekuku Primary School 78 60 138 4 3 7Total 128 126 254 10 5 15
No. of Pupils No. of Teachers2005
Total2005
Total
Digest of Education Statistics 2005 35
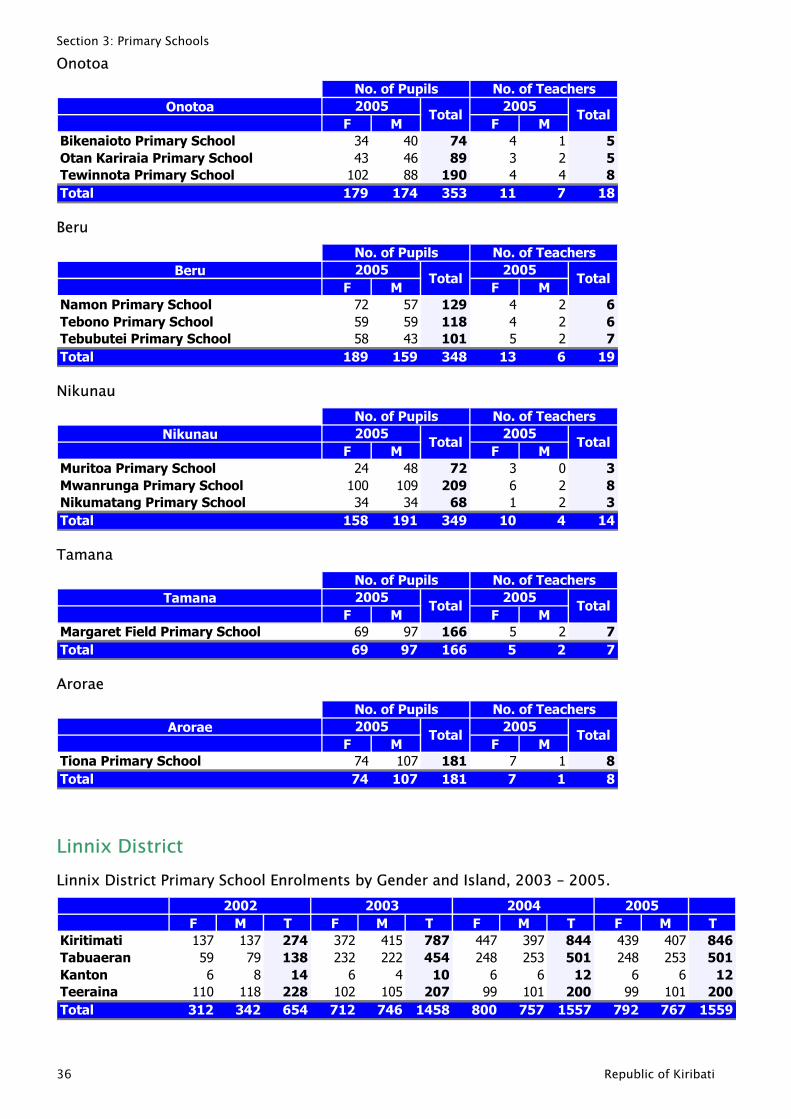
Section 3: Primary Schools
Onotoa
OnotoaF M F M
Bikenaioto Primary School 34 40 74 4 1 5Otan Kariraia Primary School 43 46 89 3 2 5Tewinnota Primary School 102 88 190 4 4 8Total 179 174 353 11 7 18
No. of Pupils No. of Teachers2005
Total2005
Total
Beru
BeruF M F M
Namon Primary School 72 57 129 4 2 6Tebono Primary School 59 59 118 4 2 6Tebubutei Primary School 58 43 101 5 2 7Total 189 159 348 13 6 19
No. of Pupils No. of Teachers2005
Total2005
Total
Nikunau
NikunauF M F M
Muritoa Primary School 24 48 72 3 0 3Mwanrunga Primary School 100 109 209 6 2 8Nikumatang Primary School 34 34 68 1 2 3Total 158 191 349 10 4 14
2005Total
No. of TeachersNo. of Pupils2005
Total
Tamana
TamanaF M F M
Margaret Field Primary School 69 97 166 5 2 7Total 69 97 166 5 2 7
Total2005
Total
No. of Teachers2005
No. of Pupils
Arorae
AroraeF M F M
Tiona Primary School 74 107 181 7 1 8Total 74 107 181 7 1 8
2005Total
No. of Teachers2005
Total
No. of Pupils
Linnix District Linnix District Primary School Enrolments by Gender and Island, 2003 – 2005.
F M T F M T F M T F M TKiritimati 137 137 274 372 415 787 447 397 844 439 407 846Tabuaeran 59 79 138 232 222 454 248 253 501 248 253 501Kanton 6 8 14 6 4 10 6 6 12 6 6 12Teeraina 110 118 228 102 105 207 99 101 200 99 101 200Total 312 342 654 712 746 1458 800 757 1557 792 767 1559
2002 2003 2004 2005
36 Republic of Kiribati
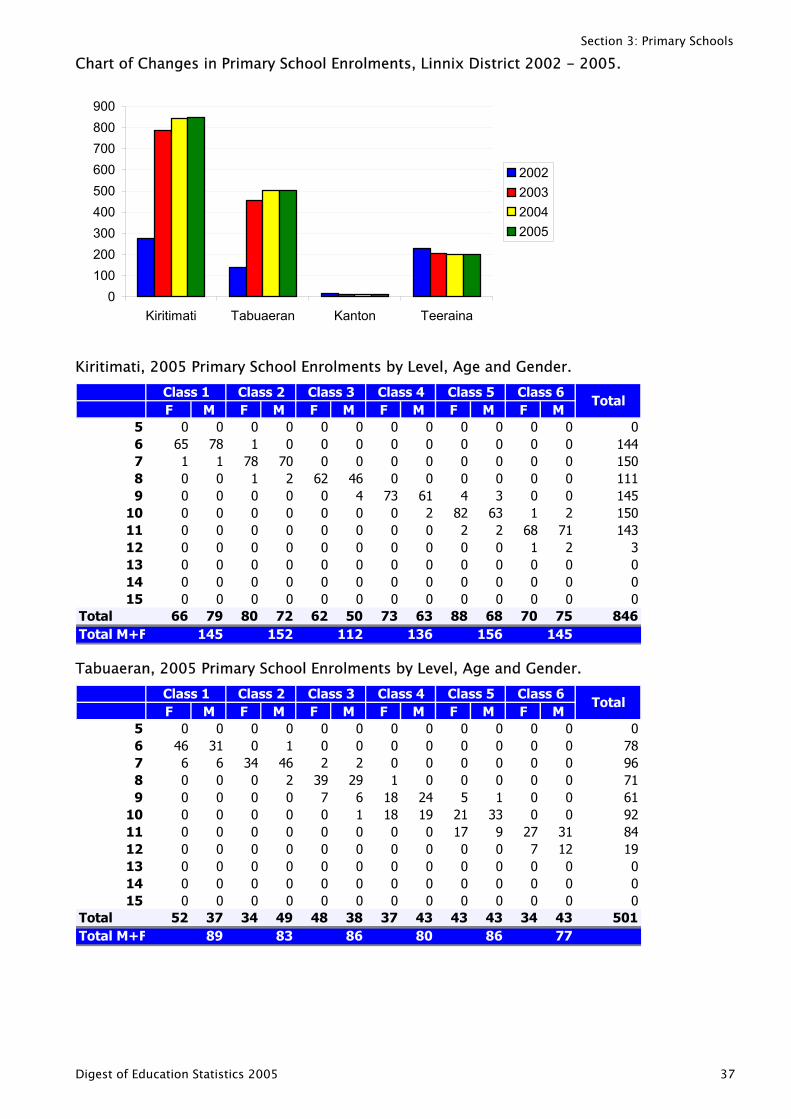
Section 3: Primary Schools
Chart of Changes in Primary School Enrolments, Linnix District 2002 - 2005.
0100200300400500600700800900
Kiritimati Tabuaeran Kanton Teeraina
2002200320042005
Kiritimati, 2005 Primary School Enrolments by Level, Age and Gender.
F M F M F M F M F M F M5 0 0 0 0 0 0 0 0 0 0 0 06 65 78 1 0 0 0 0 0 0 0 0 0 147 1 1 78 70 0 0 0 0 0 0 0 0 158 0 0 1 2 62 46 0 0 0 0 0 0 119 0 0 0 0 0 4 73 61 4 3 0 0 14
10 0 0 0 0 0 0 0 2 82 63 1 2 1511 0 0 0 0 0 0 0 0 2 2 68 71 1412 0 0 0 0 0 0 0 0 0 0 1 213 0 0 0 0 0 0 0 0 0 0 0 014 0 0 0 0 0 0 0 0 0 0 0 015 0 0 0 0 0 0 0 0 0 0 0 0
Total 66 79 80 72 62 50 73 63 88 68 70 75 846Total M+
04015033000
F
Class 6Total
145 152 112 136 156 145
Class 1 Class 2 Class 5Class 3 Class 4
Tabuaeran, 2005 Primary School Enrolments by Level, Age and Gender.
F M F M F M F M F M F M5 0 0 0 0 0 0 0 0 0 0 0 06 46 31 0 1 0 0 0 0 0 0 0 0 77 6 6 34 46 2 2 0 0 0 0 0 0 98 0 0 0 2 39 29 1 0 0 0 0 0 79 0 0 0 0 7 6 18 24 5 1 0 0 6
10 0 0 0 0 0 1 18 19 21 33 0 0 911 0 0 0 0 0 0 0 0 17 9 27 31 812 0 0 0 0 0 0 0 0 0 0 7 12 113 0 0 0 0 0 0 0 0 0 0 0 014 0 0 0 0 0 0 0 0 0 0 0 015 0 0 0 0 0 0 0 0 0 0 0 0
Total 52 37 34 49 48 38 37 43 43 43 34 43 501Total M+
08611249000
F
Class 3 Class 4 Class 5 Class 6Total
89 83 86 80 86 77
Class 1 Class 2
Digest of Education Statistics 2005 37
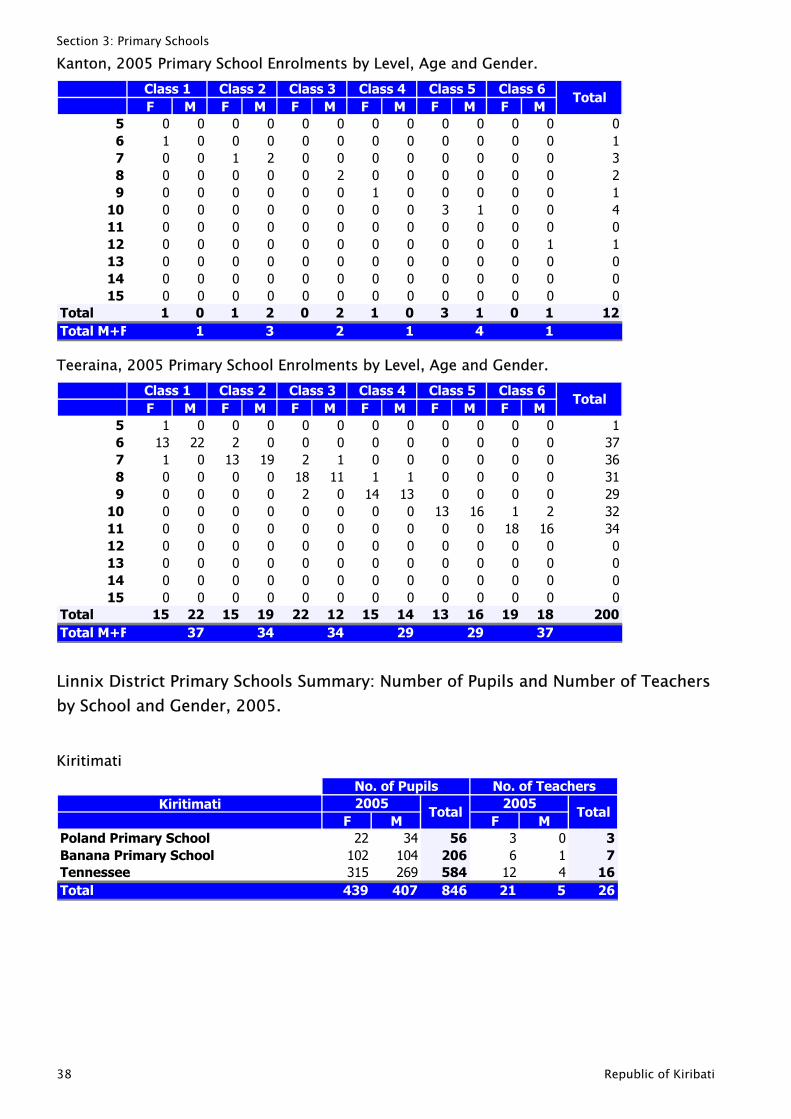
Section 3: Primary Schools
Kanton, 2005 Primary School Enrolments by Level, Age and Gender.
F M F M F M F M F M F M5 0 0 0 0 0 0 0 0 0 0 0 06 1 0 0 0 0 0 0 0 0 0 0 07 0 0 1 2 0 0 0 0 0 0 0 08 0 0 0 0 0 2 0 0 0 0 0 09 0 0 0 0 0 0 1 0 0 0 0 0
10 0 0 0 0 0 0 0 0 3 1 0 011 0 0 0 0 0 0 0 0 0 0 0 012 0 0 0 0 0 0 0 0 0 0 0 113 0 0 0 0 0 0 0 0 0 0 0 014 0 0 0 0 0 0 0 0 0 0 0 015 0 0 0 0 0 0 0 0 0 0 0 0
Total 1 0 1 2 0 2 1 0 3 1 0 1 1Total M+
013214010002
F
Class 6Total
1 3 2 1 4 1
Class 1 Class 2 Class 5Class 3 Class 4
Teeraina, 2005 Primary School Enrolments by Level, Age and Gender.
F M F M F M F M F M F M5 1 0 0 0 0 0 0 0 0 0 0 06 13 22 2 0 0 0 0 0 0 0 0 0 37 1 0 13 19 2 1 0 0 0 0 0 0 38 0 0 0 0 18 11 1 1 0 0 0 0 39 0 0 0 0 2 0 14 13 0 0 0 0 2
10 0 0 0 0 0 0 0 0 13 16 1 2 311 0 0 0 0 0 0 0 0 0 0 18 16 312 0 0 0 0 0 0 0 0 0 0 0 013 0 0 0 0 0 0 0 0 0 0 0 014 0 0 0 0 0 0 0 0 0 0 0 015 0 0 0 0 0 0 0 0 0 0 0 0
Total 15 22 15 19 22 12 15 14 13 16 19 18 200Total M+
17619240000
F
Class 3 Class 4 Class 5 Class 6Total
37 34 34 29 29 37
Class 1 Class 2
Linnix District Primary Schools Summary: Number of Pupils and Number of Teachers by School and Gender, 2005.
Kiritimati
KiritimatiF M F M
Poland Primary School 22 34 56 3 0 3Banana Primary School 102 104 206 6 1 7Tennessee 315 269 584 12 4 16Total 439 407 846 21 5 26
No. of Teachers2005
Total2005
Total
No. of Pupils
38 Republic of Kiribati
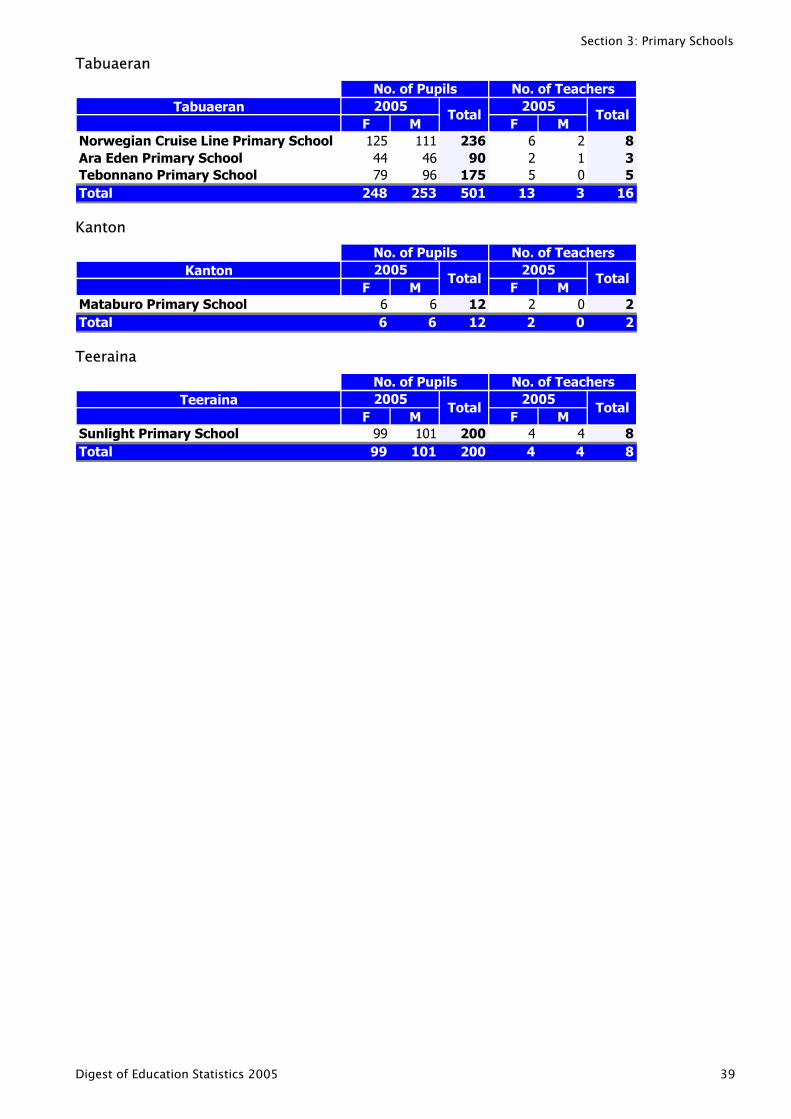
Section 3: Primary Schools
Tabuaeran
TabuaeranF M F M
Norwegian Cruise Line Primary School 125 111 236 6 2 8Ara Eden Primary School 44 46 90 2 1 3Tebonnano Primary School 79 96 175 5 0 5Total 248 253 501 13 3 16
No. of Pupils No. of Teachers2005 2005
TotalTotal
Kanton
KantonF M F M
Mataburo Primary School 6 6 12 2 0 2Total 6 6 12 2 0 2
No. of Pupils No. of Teachers2005
Total2005
Total
Teeraina
TeerainaF M F M
Sunlight Primary School 99 101 200 4 4 8Total 99 101 200 4 4 8
No. of Pupils No. of Teachers2005
Total2005
Total
Digest of Education Statistics 2005 39
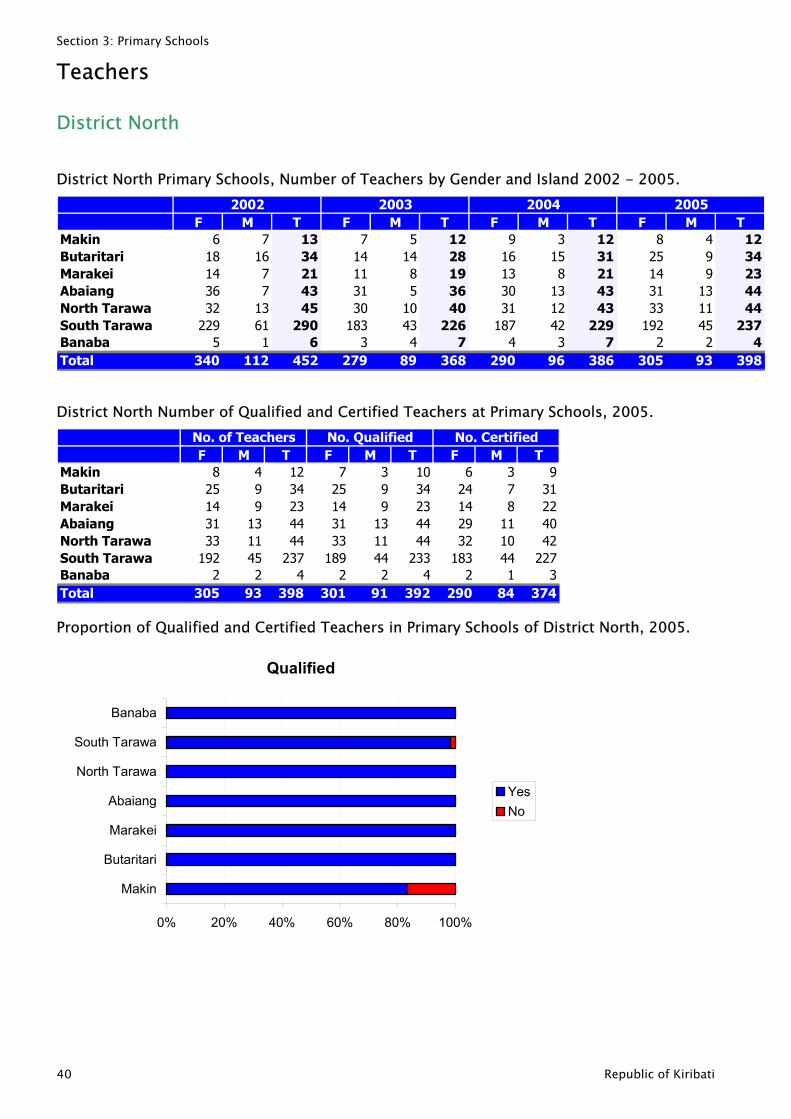
Section 3: Primary Schools
Teachers
District North
District North Primary Schools, Number of Teachers by Gender and Island 2002 - 2005.
F M T F M T F M T F M TMakin 6 7 13 7 5 12 9 3 12 8 4 12Butaritari 18 16 34 14 14 28 16 15 31 25 9 34Marakei 14 7 21 11 8 19 13 8 21 14 9 23Abaiang 36 7 43 31 5 36 30 13 43 31 13 44North Tarawa 32 13 45 30 10 40 31 12 43 33 11 44South Tarawa 229 61 290 183 43 226 187 42 229 192 45 237Banaba 5 1 6 3 4 7 4 3 7 2 2 4Total 340 112 452 279 89 368 290 96 386 305 93 398
2002 2003 2004 2005
District North Number of Qualified and Certified Teachers at Primary Schools, 2005.
F M T F M T F M TMakin 8 4 12 7 3 10 6 3 9Butaritari 25 9 34 25 9 34 24 7 31Marakei 14 9 23 14 9 23 14 8 22Abaiang 31 13 44 31 13 44 29 11 40North Tarawa 33 11 44 33 11 44 32 10 42South Tarawa 192 45 237 189 44 233 183 44 227Banaba 2 2 4 2 2 4 2 1 3Total 305 93 398 301 91 392 290 84 374
No. of Teachers No. Qualified No. Certified
Proportion of Qualified and Certified Teachers in Primary Schools of District North, 2005.
Qualified
0% 20% 40% 60% 80% 100%
Makin
Butaritari
Marakei
Abaiang
North Tarawa
South Tarawa
Banaba
YesNo
40 Republic of Kiribati
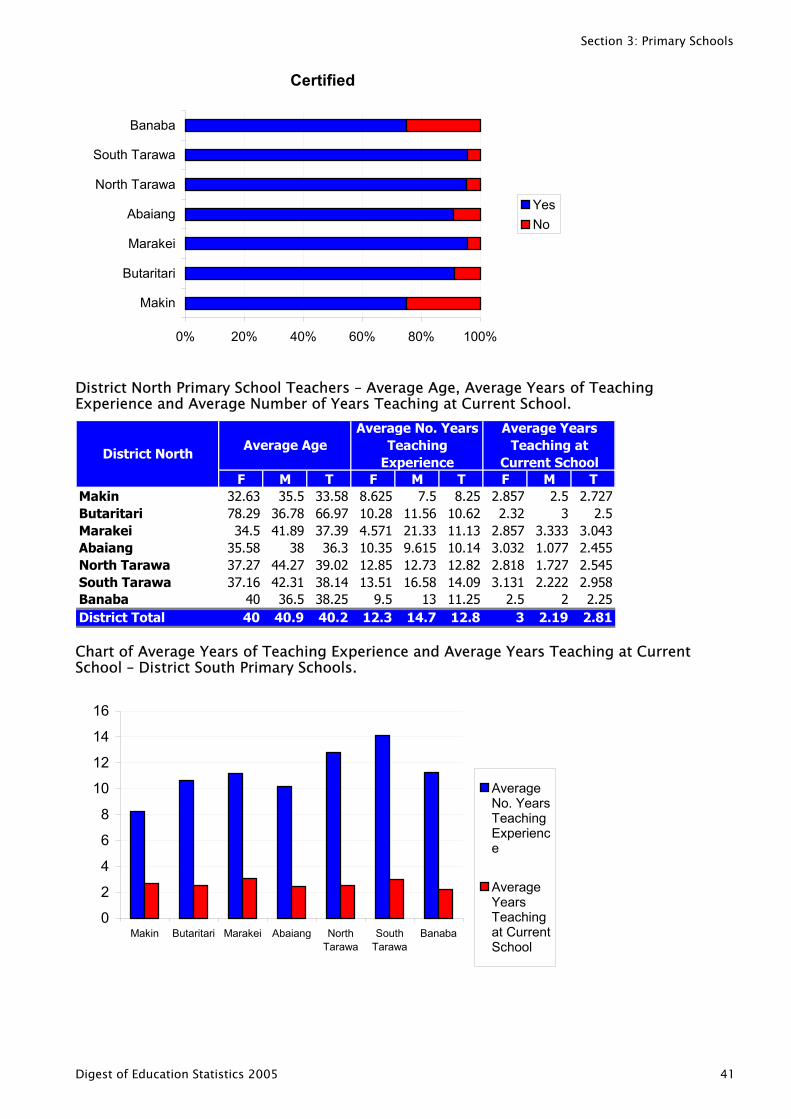
Section 3: Primary Schools
Certified
0% 20% 40% 60% 80% 100%
Makin
Butaritari
Marakei
Abaiang
North Tarawa
South Tarawa
Banaba
YesNo
District North Primary School Teachers – Average Age, Average Years of Teaching Experience and Average Number of Years Teaching at Current School.
F M T F M T F M TMakin 32.63 35.5 33.58 8.625 7.5 8.25 2.857 2.5 2.727Butaritari 78.29 36.78 66.97 10.28 11.56 10.62 2.32 3 2.5Marakei 34.5 41.89 37.39 4.571 21.33 11.13 2.857 3.333 3.043Abaiang 35.58 38 36.3 10.35 9.615 10.14 3.032 1.077 2.455North Tarawa 37.27 44.27 39.02 12.85 12.73 12.82 2.818 1.727 2.545South Tarawa 37.16 42.31 38.14 13.51 16.58 14.09 3.131 2.222 2.958Banaba 40 36.5 38.25 9.5 13 11.25 2.5 2 2.25District Total 40 40.9 40.2 12.3 14.7 12.8 3 2.19 2.81
District NorthAverage Age
Average No. Years Teaching
Experience
Average Years Teaching at
Current School
Chart of Average Years of Teaching Experience and Average Years Teaching at Current School – District South Primary Schools.
0
2
4
6
8
10
12
14
16
Makin Butaritari Marakei Abaiang NorthTarawa
SouthTarawa
Banaba
AverageNo. YearsTeachingExperience
AverageYearsTeachingat CurrentSchool
Digest of Education Statistics 2005 41
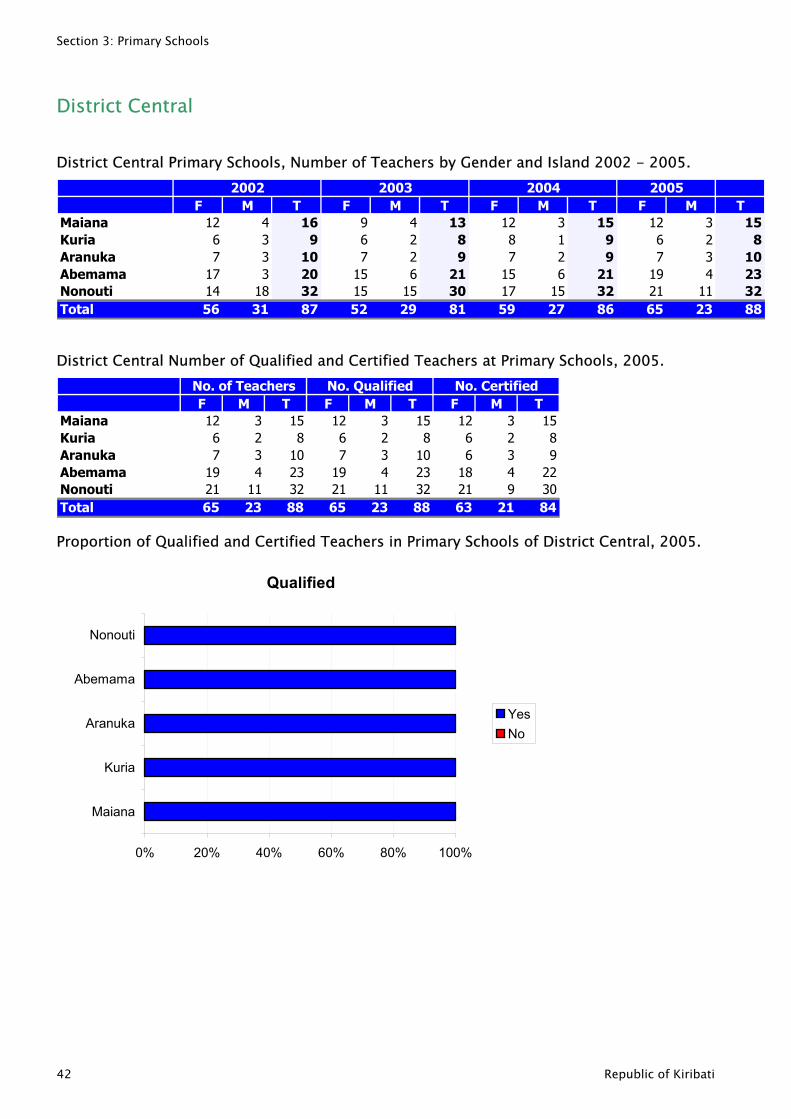
Section 3: Primary Schools
District Central
District Central Primary Schools, Number of Teachers by Gender and Island 2002 - 2005.
F M T F M T F M T F M TMaiana 12 4 16 9 4 13 12 3 15 12 3 15Kuria 6 3 9 6 2 8 8 1 9 6 2 8Aranuka 7 3 10 7 2 9 7 2 9 7 3 10Abemama 17 3 20 15 6 21 15 6 21 19 4 23Nonouti 14 18 32 15 15 30 17 15 32 21 11 32Total 56 31 87 52 29 81 59 27 86 65 23 8
2002 2003 2004 2005
8
District Central Number of Qualified and Certified Teachers at Primary Schools, 2005.
F M T F M T F M TMaiana 12 3 15 12 3 15 12 3 15Kuria 6 2 8 6 2 8 6 2 8Aranuka 7 3 10 7 3 10 6 3 9Abemama 19 4 23 19 4 23 18 4 22Nonouti 21 11 32 21 11 32 21 9 30Total 65 23 88 65 23 88 63 21 8
No. of Teachers No. Qualified No. Certified
4
Proportion of Qualified and Certified Teachers in Primary Schools of District Central, 2005.
Qualified
0% 20% 40% 60% 80% 100%
Maiana
Kuria
Aranuka
Abemama
Nonouti
YesNo
42 Republic of Kiribati
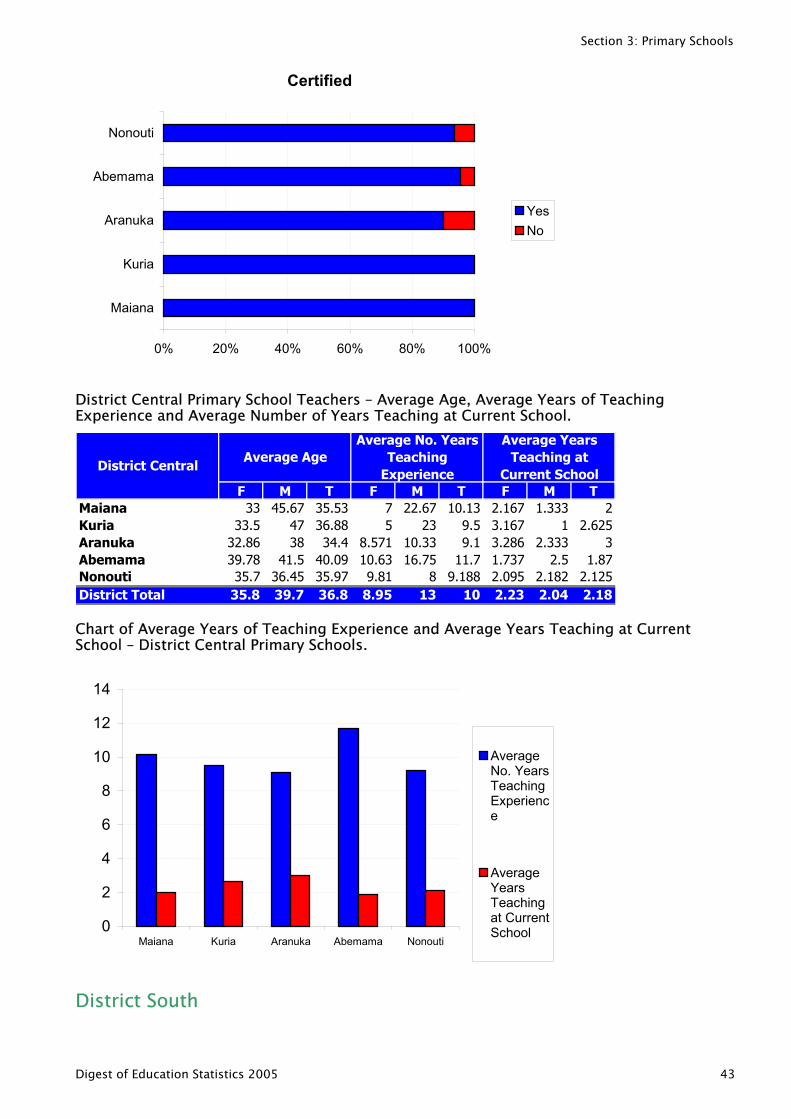
Section 3: Primary Schools
Certified
0% 20% 40% 60% 80% 100%
Maiana
Kuria
Aranuka
Abemama
Nonouti
YesNo
District Central Primary School Teachers – Average Age, Average Years of Teaching Experience and Average Number of Years Teaching at Current School.
F M T F M T F M TMaiana 33 45.67 35.53 7 22.67 10.13 2.167 1.333 2Kuria 33.5 47 36.88 5 23 9.5 3.167 1 2.625Aranuka 32.86 38 34.4 8.571 10.33 9.1 3.286 2.333 3Abemama 39.78 41.5 40.09 10.63 16.75 11.7 1.737 2.5 1.87Nonouti 35.7 36.45 35.97 9.81 8 9.188 2.095 2.182 2.125District Total 35.8 39.7 36.8 8.95 13 10 2.23 2.04 2.18
District CentralAverage Age
Average No. Years Teaching
Experience
Average Years Teaching at
Current School
Chart of Average Years of Teaching Experience and Average Years Teaching at Current School – District Central Primary Schools.
0
2
4
6
8
10
12
14
Maiana Kuria Aranuka Abemama Nonouti
AverageNo. YearsTeachingExperience
AverageYearsTeachingat CurrentSchool
District South
Digest of Education Statistics 2005 43
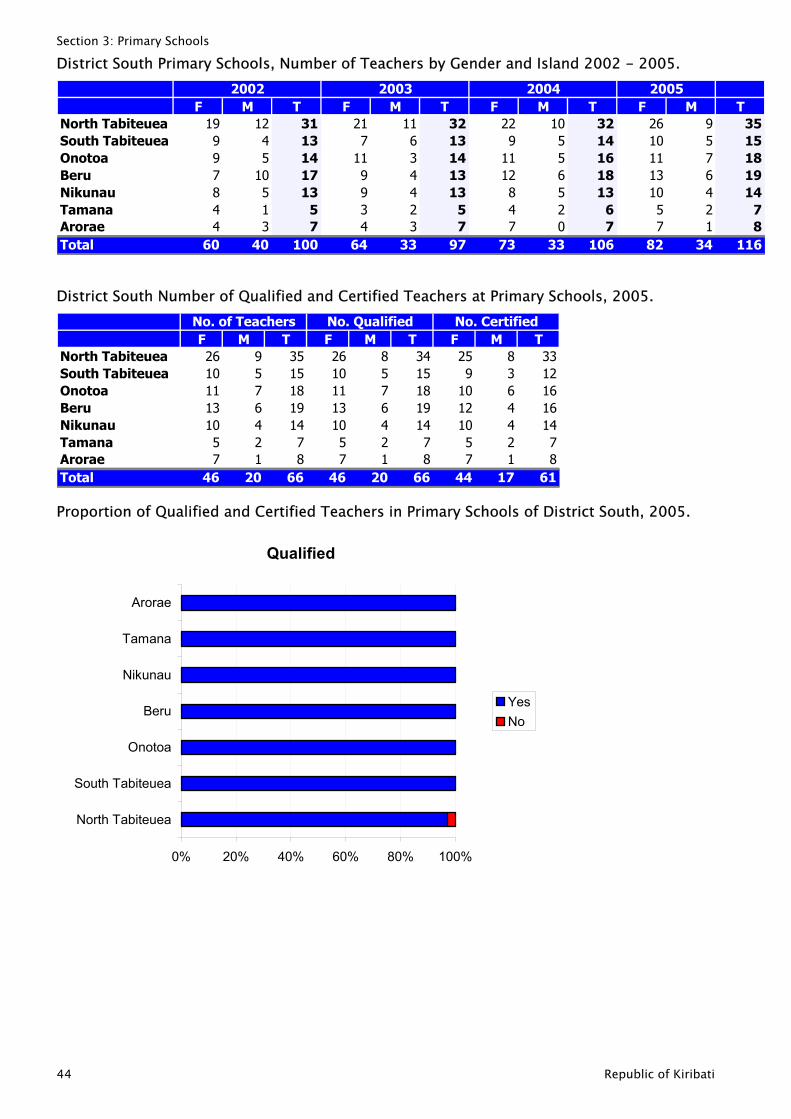
Section 3: Primary Schools
District South Primary Schools, Number of Teachers by Gender and Island 2002 - 2005.
F M T F M T F M T F M TNorth Tabiteuea 19 12 31 21 11 32 22 10 32 26 9 35South Tabiteuea 9 4 13 7 6 13 9 5 14 10 5 15Onotoa 9 5 14 11 3 14 11 5 16 11 7 18Beru 7 10 17 9 4 13 12 6 18 13 6 19Nikunau 8 5 13 9 4 13 8 5 13 10 4 14Tamana 4 1 5 3 2 5 4 2 6 5 2 7Arorae 4 3 7 4 3 7 7 0 7 7 1 8Total 60 40 100 64 33 97 73 33 106 82 34 116
2002 2003 2004 2005
District South Number of Qualified and Certified Teachers at Primary Schools, 2005.
F M T F M T F M TNorth Tabiteuea 26 9 35 26 8 34 25 8 33South Tabiteuea 10 5 15 10 5 15 9 3 12Onotoa 11 7 18 11 7 18 10 6 16Beru 13 6 19 13 6 19 12 4 16Nikunau 10 4 14 10 4 14 10 4 14Tamana 5 2 7 5 2 7 5 2 7Arorae 7 1 8 7 1 8 7 1 8Total 46 20 66 46 20 66 44 17 6
No. of Teachers No. Qualified No. Certified
1
Proportion of Qualified and Certified Teachers in Primary Schools of District South, 2005.
Qualified
0% 20% 40% 60% 80% 100%
North Tabiteuea
South Tabiteuea
Onotoa
Beru
Nikunau
Tamana
Arorae
YesNo
44 Republic of Kiribati
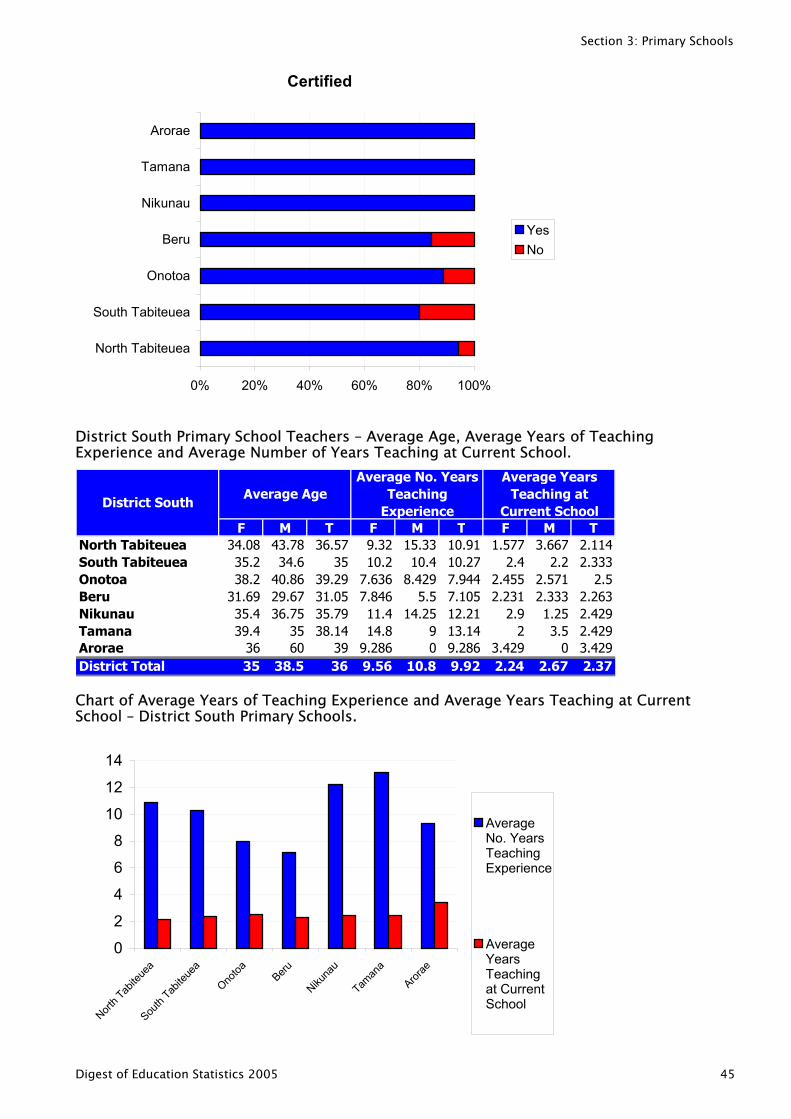
Section 3: Primary Schools
Certified
0% 20% 40% 60% 80% 100%
North Tabiteuea
South Tabiteuea
Onotoa
Beru
Nikunau
Tamana
Arorae
YesNo
District South Primary School Teachers – Average Age, Average Years of Teaching Experience and Average Number of Years Teaching at Current School.
F M T F M T F M TNorth Tabiteuea 34.08 43.78 36.57 9.32 15.33 10.91 1.577 3.667 2.114South Tabiteuea 35.2 34.6 35 10.2 10.4 10.27 2.4 2.2 2.333Onotoa 38.2 40.86 39.29 7.636 8.429 7.944 2.455 2.571 2.5Beru 31.69 29.67 31.05 7.846 5.5 7.105 2.231 2.333 2.263Nikunau 35.4 36.75 35.79 11.4 14.25 12.21 2.9 1.25 2.429Tamana 39.4 35 38.14 14.8 9 13.14 2 3.5 2.429Arorae 36 60 39 9.286 0 9.286 3.429 0 3.429District Total 35 38.5 36 9.56 10.8 9.92 2.24 2.67 2.37
District SouthAverage Age
Average No. Years Teaching
Experience
Average Years Teaching at
Current School
Chart of Average Years of Teaching Experience and Average Years Teaching at Current School – District South Primary Schools.
0
2
4
6
8
10
12
14
North T
abite
uea
South
Tabite
uea
Onotoa Beru
Nikuna
u
Taman
a
Arorae
AverageNo. YearsTeachingExperience
AverageYearsTeachingat CurrentSchool
Digest of Education Statistics 2005 45
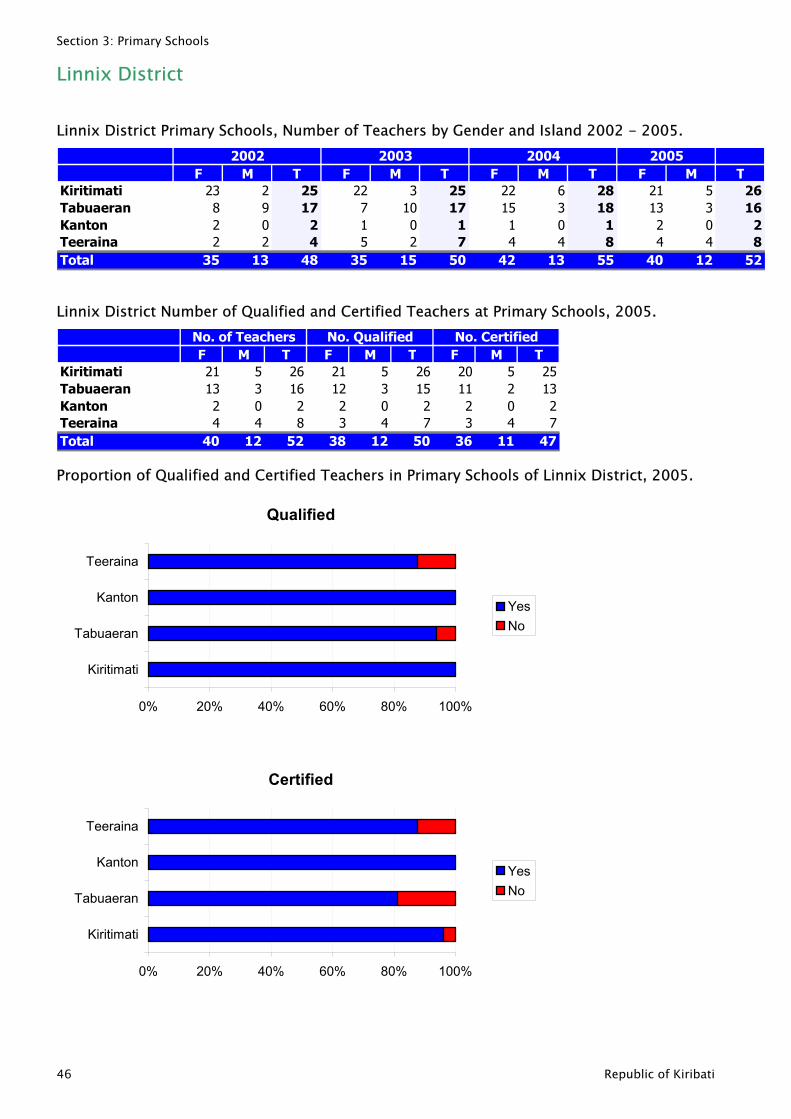
Section 3: Primary Schools
Linnix District
Linnix District Primary Schools, Number of Teachers by Gender and Island 2002 - 2005.
F M T F M T F M T F M TKiritimati 23 2 25 22 3 25 22 6 28 21 5 26Tabuaeran 8 9 17 7 10 17 15 3 18 13 3 16Kanton 2 0 2 1 0 1 1 0 1 2 0 2Teeraina 2 2 4 5 2 7 4 4 8 4 4 8Total 35 13 48 35 15 50 42 13 55 40 12 5
2002 2003 2004 2005
2
Linnix District Number of Qualified and Certified Teachers at Primary Schools, 2005.
F M T F M T F M TKiritimati 21 5 26 21 5 26 20 5 25Tabuaeran 13 3 16 12 3 15 11 2 13Kanton 2 0 2 2 0 2 2 0 2Teeraina 4 4 8 3 4 7 3 4 7Total 40 12 52 38 12 50 36 11 4
No. of Teachers No. Qualified No. Certified
7
Proportion of Qualified and Certified Teachers in Primary Schools of Linnix District, 2005.
Qualified
0% 20% 40% 60% 80% 100%
Kiritimati
Tabuaeran
Kanton
Teeraina
YesNo
Certified
0% 20% 40% 60% 80% 100%
Kiritimati
Tabuaeran
Kanton
Teeraina
YesNo
46 Republic of Kiribati
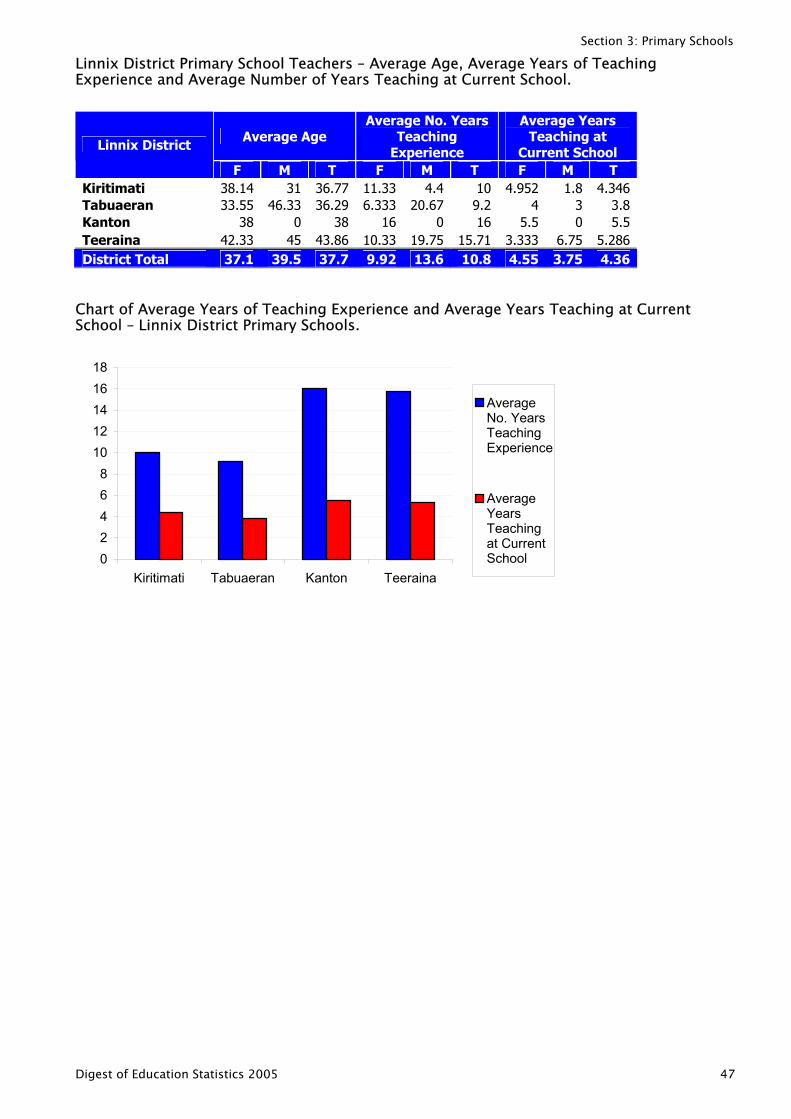
Section 3: Primary Schools
Linnix District Primary School Teachers – Average Age, Average Years of Teaching Experience and Average Number of Years Teaching at Current School.
Average Age Average No. Years
Teaching Experience
Average Years Teaching at
Current School Linnix District
F M T F M T F M T Kiritimati 38.14 31 36.77 11.33 4.4 10 4.952 1.8 4.346 Tabuaeran 33.55 46.33 36.29 6.333 20.67 9.2 4 3 3.8 Kanton 38 0 38 16 0 16 5.5 0 5.5 Teeraina 42.33 45 43.86 10.33 19.75 15.71 3.333 6.75 5.286 District Total 37.1 39.5 37.7 9.92 13.6 10.8 4.55 3.75 4.36
Chart of Average Years of Teaching Experience and Average Years Teaching at Current School – Linnix District Primary Schools.
02468
1012141618
Kiritimati Tabuaeran Kanton Teeraina
AverageNo. YearsTeachingExperience
AverageYearsTeachingat CurrentSchool
Digest of Education Statistics 2005 47
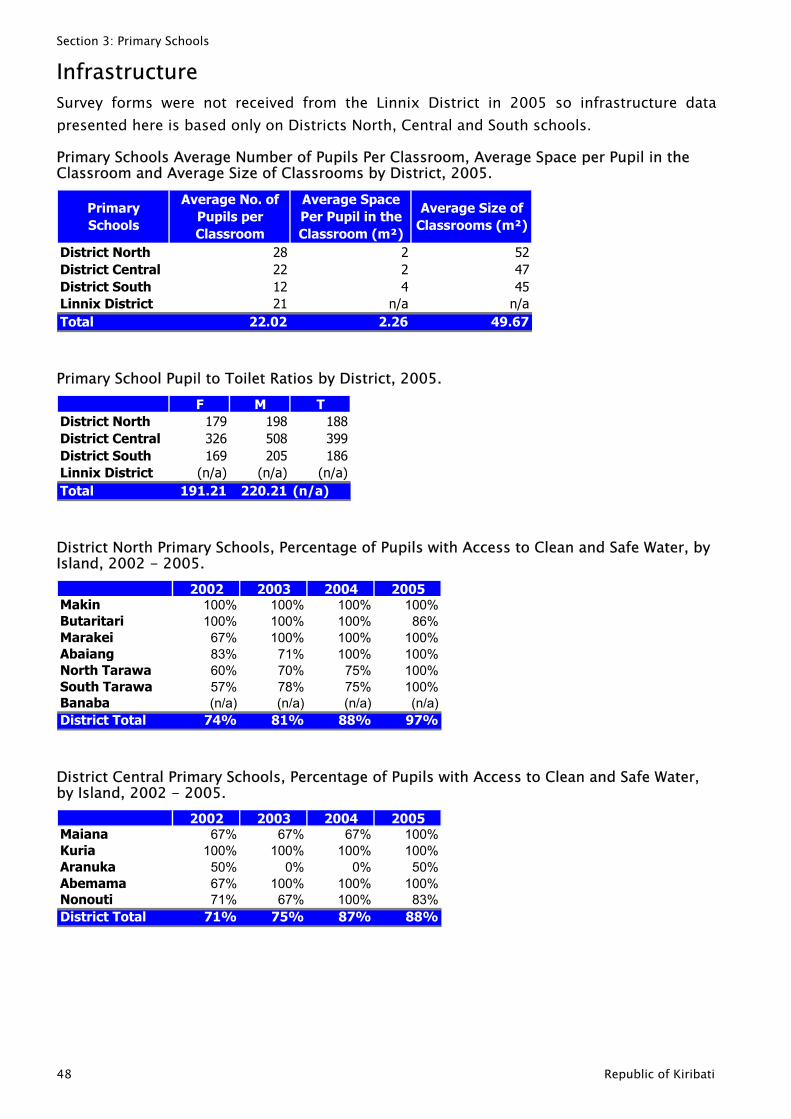
Section 3: Primary Schools
Infrastructure Survey forms were not received from the Linnix District in 2005 so infrastructure data presented here is based only on Districts North, Central and South schools.
Primary Schools Average Number of Pupils Per Classroom, Average Space per Pupil in the Classroom and Average Size of Classrooms by District, 2005.
District NorthDistrict CentralDistrict SouthLinnix DistrictTotal
Average No. of Pupils per Classroom
Average Space Per Pupil in the Classroom (m²)
Average Size of Classrooms (m²)
22.02
224
n/a2.26
28221221
49.67
Primary Schools
524745
n/a
Primary School Pupil to Toilet Ratios by District, 2005. F M T
District North 179 198 188District Central 326 508 399District South 169 205 186Linnix District (n/a) (n/a) (n/a)Total 191.21 220.21 (n/a)
District North Primary Schools, Percentage of Pupils with Access to Clean and Safe Water, by Island, 2002 - 2005.
2002 2003 2004 2005Makin 100% 100% 100% 100%Butaritari 100% 100% 100% 86%Marakei 67% 100% 100% 100%Abaiang 83% 71% 100% 100%North Tarawa 60% 70% 75% 100%South Tarawa 57% 78% 75% 100%Banaba (n/a) (n/a) (n/a) (n/a)District Total 74% 81% 88% 97%
District Central Primary Schools, Percentage of Pupils with Access to Clean and Safe Water, by Island, 2002 - 2005.
2002 2003 2004 2005Maiana 67% 67% 67% 100%Kuria 100% 100% 100% 100%Aranuka 50% 0% 0% 50%Abemama 67% 100% 100% 100%Nonouti 71% 67% 100% 83%District Total 71% 75% 87% 88%
48 Republic of Kiribati
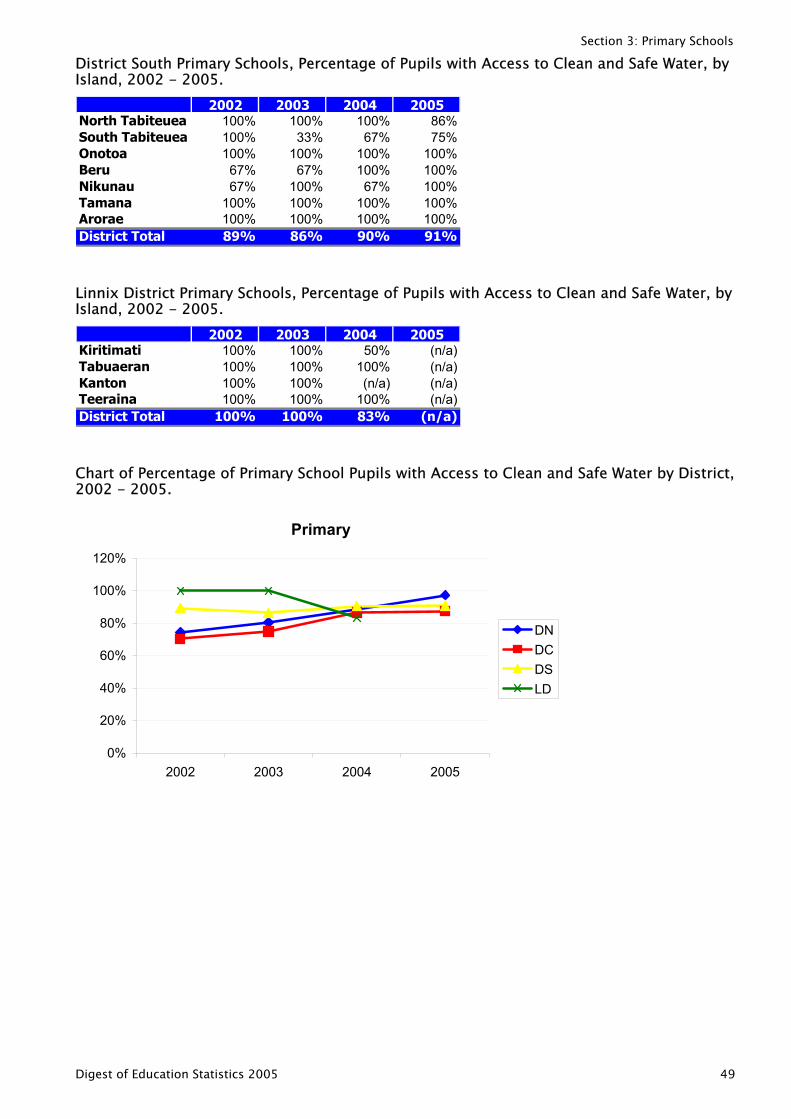
Section 3: Primary Schools
District South Primary Schools, Percentage of Pupils with Access to Clean and Safe Water, by Island, 2002 - 2005.
2002 2003 2004 2005North Tabiteuea 100% 100% 100% 86%South Tabiteuea 100% 33% 67% 75%Onotoa 100% 100% 100% 100%Beru 67% 67% 100% 100%Nikunau 67% 100% 67% 100%Tamana 100% 100% 100% 100%Arorae 100% 100% 100% 100%District Total 89% 86% 90% 91%
Linnix District Primary Schools, Percentage of Pupils with Access to Clean and Safe Water, by Island, 2002 - 2005.
2002 2003 2004 2005Kiritimati 100% 100% 50% (n/a)Tabuaeran 100% 100% 100% (n/a)Kanton 100% 100% (n/a) (n/a)Teeraina 100% 100% 100% (n/a)District Total 100% 100% 83% (n/a)
Chart of Percentage of Primary School Pupils with Access to Clean and Safe Water by District, 2002 - 2005.
Primary
0%
20%
40%
60%
80%
100%
120%
2002 2003 2004 2005
DNDCDSLD
Digest of Education Statistics 2005 49
Section Four: Junior Secondary Schools
Section Four: Junior Secondary Schools
50 Republic of Kiribati
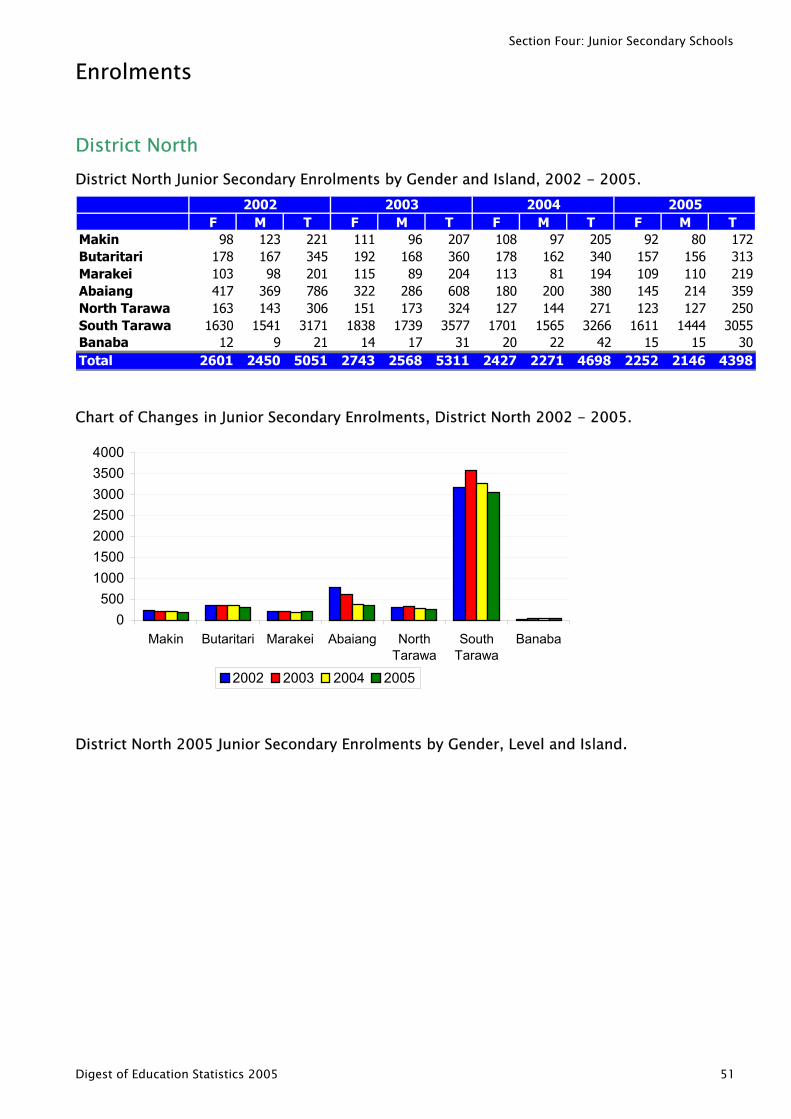
Section Four: Junior Secondary Schools
Enrolments
District North District North Junior Secondary Enrolments by Gender and Island, 2002 - 2005.
F M T F M T F M T F M TMakin 98 123 221 111 96 207 108 97 205 92 80 172Butaritari 178 167 345 192 168 360 178 162 340 157 156 313Marakei 103 98 201 115 89 204 113 81 194 109 110 219Abaiang 417 369 786 322 286 608 180 200 380 145 214 359North Tarawa 163 143 306 151 173 324 127 144 271 123 127 250South Tarawa 1630 1541 3171 1838 1739 3577 1701 1565 3266 1611 1444 3055Banaba 12 9 21 14 17 31 20 22 42 15 15 3Total 2601 2450 5051 2743 2568 5311 2427 2271 4698 2252 2146 4398
2002 2003 2004 2005
0
Chart of Changes in Junior Secondary Enrolments, District North 2002 - 2005.
0500
1000150020002500300035004000
Makin Butaritari Marakei Abaiang NorthTarawa
SouthTarawa
Banaba
2002 2003 2004 2005
District North 2005 Junior Secondary Enrolments by Gender, Level and Island.
Digest of Education Statistics 2005 51
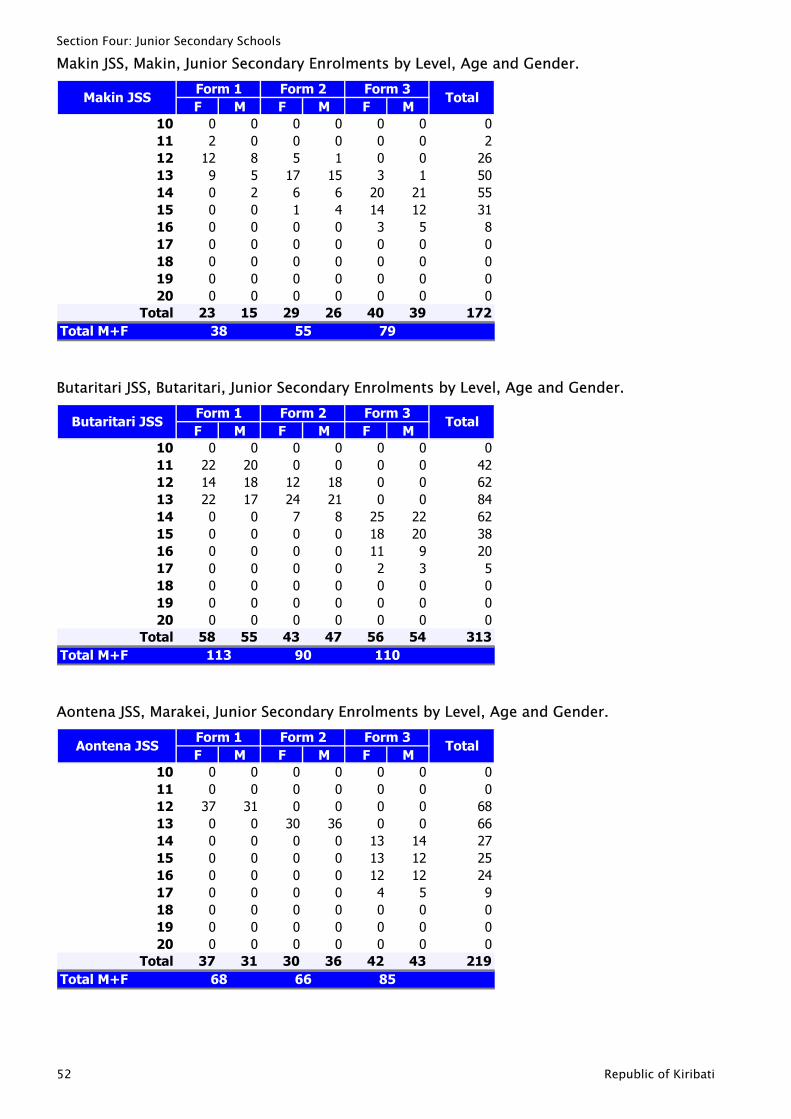
Section Four: Junior Secondary Schools
Makin JSS, Makin, Junior Secondary Enrolments by Level, Age and Gender.
F M F M F M10 0 0 0 0 0 011 2 0 0 0 0 012 12 8 5 1 0 013 9 5 17 15 3 1 5014 0 2 6 6 20 2115 0 0 1 4 14 1216 0 0 0 0 3 517 0 0 0 0 0 018 0 0 0 0 0 019 0 0 0 0 0 020 0 0 0 0 0 0
Total 23 15 29 26 40 39 17Total M+F
Form 1 Form 2 Form 3Total
38 55 79
Makin JSS
02
26
5531800002
Butaritari JSS, Butaritari, Junior Secondary Enrolments by Level, Age and Gender.
F M F M F M10 0 0 0 0 0 011 22 20 0 0 0 012 14 18 12 18 0 0 6213 22 17 24 21 0 0 8414 0 0 7 8 25 2215 0 0 0 0 18 2016 0 0 0 0 11 917 0 0 0 0 2 318 0 0 0 0 0 019 0 0 0 0 0 020 0 0 0 0 0 0
Total 58 55 43 47 56 54 31Total M+F
Form 1 Form 2 Form 3Total
113 90 110
Butaritari JSS
042
62382050003
Aontena JSS, Marakei, Junior Secondary Enrolments by Level, Age and Gender.
F M F M F M10 0 0 0 0 0 011 0 0 0 0 0 012 37 31 0 0 0 013 0 0 30 36 0 0 6614 0 0 0 0 13 1415 0 0 0 0 13 1216 0 0 0 0 12 1217 0 0 0 0 4 518 0 0 0 0 0 019 0 0 0 0 0 020 0 0 0 0 0 0
Total 37 31 30 36 42 43 21Total M+F
Form 1 Form 2 Form 3Total
68 66 85
Aontena JSS
00
68
27252490009
52 Republic of Kiribati
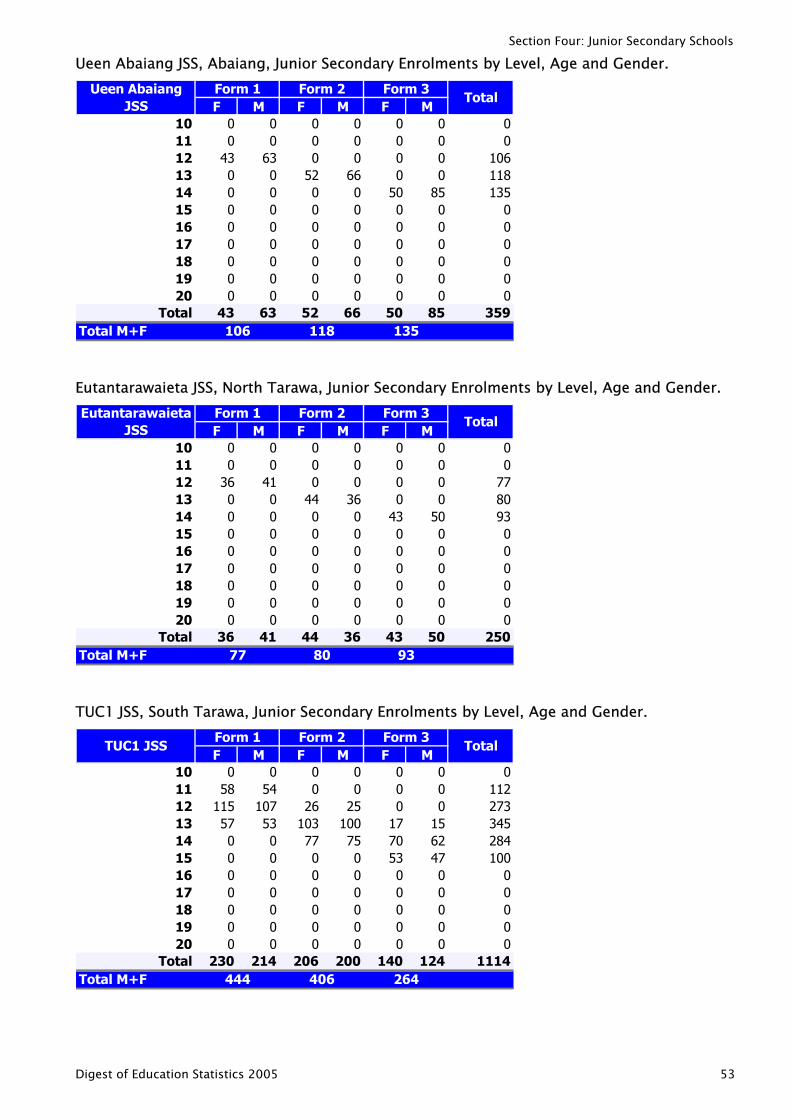
Section Four: Junior Secondary Schools
Ueen Abaiang JSS, Abaiang, Junior Secondary Enrolments by Level, Age and Gender.
F M F M F M10 0 0 0 0 0 011 0 0 0 0 0 012 43 63 0 0 0 0 113 0 0 52 66 0 0 11814 0 0 0 0 50 85 115 0 0 0 0 0 016 0 0 0 0 0 017 0 0 0 0 0 018 0 0 0 0 0 019 0 0 0 0 0 020 0 0 0 0 0 0
Total 43 63 52 66 50 85 35Total M+F
Form 1 Form 2 Form 3Total
106 118 135
Ueen Abaiang JSS
00
06
350000009
Eutantarawaieta JSS, North Tarawa, Junior Secondary Enrolments by Level, Age and Gender.
F M F M F M10 0 0 0 0 0 011 0 0 0 0 0 012 36 41 0 0 0 013 0 0 44 36 0 0 8014 0 0 0 0 43 5015 0 0 0 0 0 016 0 0 0 0 0 017 0 0 0 0 0 018 0 0 0 0 0 019 0 0 0 0 0 020 0 0 0 0 0 0
Total 36 41 44 36 43 50 25Total M+F
Form 1 Form 2 Form 3Total
77 80 93
Eutantarawaieta JSS
00
77
930000000
TUC1 JSS, South Tarawa, Junior Secondary Enrolments by Level, Age and Gender.
F M F M F M10 0 0 0 0 0 011 58 54 0 0 0 0 112 115 107 26 25 0 0 27313 57 53 103 100 17 15 34514 0 0 77 75 70 62 28415 0 0 0 0 53 47 116 0 0 0 0 0 017 0 0 0 0 0 018 0 0 0 0 0 019 0 0 0 0 0 020 0 0 0 0 0 0
Total 230 214 206 200 140 124 1114Total M+F
Form 1 Form 2 Form 3Total
444 406 264
TUC1 JSS
012
0000000
Digest of Education Statistics 2005 53
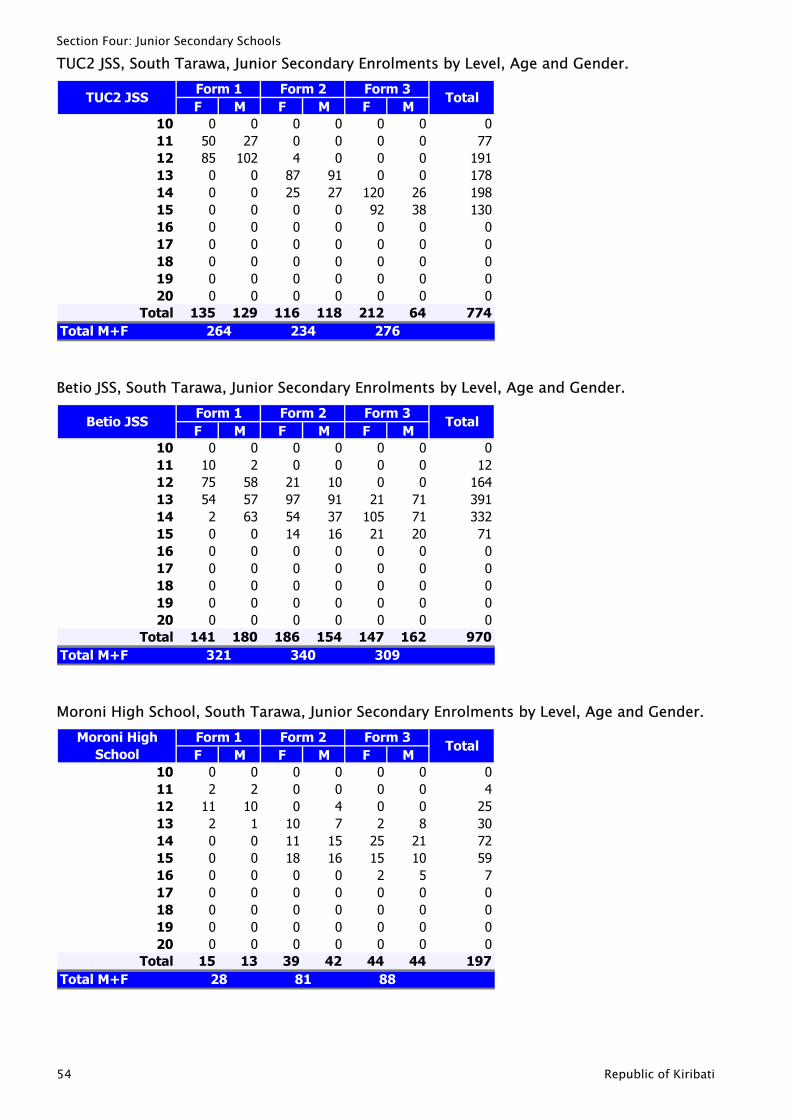
Section Four: Junior Secondary Schools
TUC2 JSS, South Tarawa, Junior Secondary Enrolments by Level, Age and Gender.
F M F M F M10 0 0 0 0 0 011 50 27 0 0 0 012 85 102 4 0 0 0 113 0 0 87 91 0 0 17814 0 0 25 27 120 26 19815 0 0 0 0 92 38 116 0 0 0 0 0 017 0 0 0 0 0 018 0 0 0 0 0 019 0 0 0 0 0 020 0 0 0 0 0 0
Total 135 129 116 118 212 64 774Total M+F
Form 1 Form 2 Form 3Total
264 234 276
TUC2 JSS
07791
3000000
Betio JSS, South Tarawa, Junior Secondary Enrolments by Level, Age and Gender.
F M F M F M10 0 0 0 0 0 011 10 2 0 0 0 012 75 58 21 10 0 0 16413 54 57 97 91 21 71 39114 2 63 54 37 105 71 33215 0 0 14 16 21 20 7116 0 0 0 0 0 017 0 0 0 0 0 018 0 0 0 0 0 019 0 0 0 0 0 020 0 0 0 0 0 0
Total 141 180 186 154 147 162 970Total M+F
Form 1 Form 2 Form 3Total
321 340 309
Betio JSS
012
00000
Moroni High School, South Tarawa, Junior Secondary Enrolments by Level, Age and Gender.
F M F M F M10 0 0 0 0 0 011 2 2 0 0 0 012 11 10 0 4 0 013 2 1 10 7 2 814 0 0 11 15 25 21 7215 0 0 18 16 15 10 5916 0 0 0 0 2 517 0 0 0 0 0 018 0 0 0 0 0 019 0 0 0 0 0 020 0 0 0 0 0 0
Total 15 13 39 42 44 44 19Total M+F 28 81 88
Form 1 Form 2 Form 3Total
Moroni High School
04
2530
700007
54 Republic of Kiribati
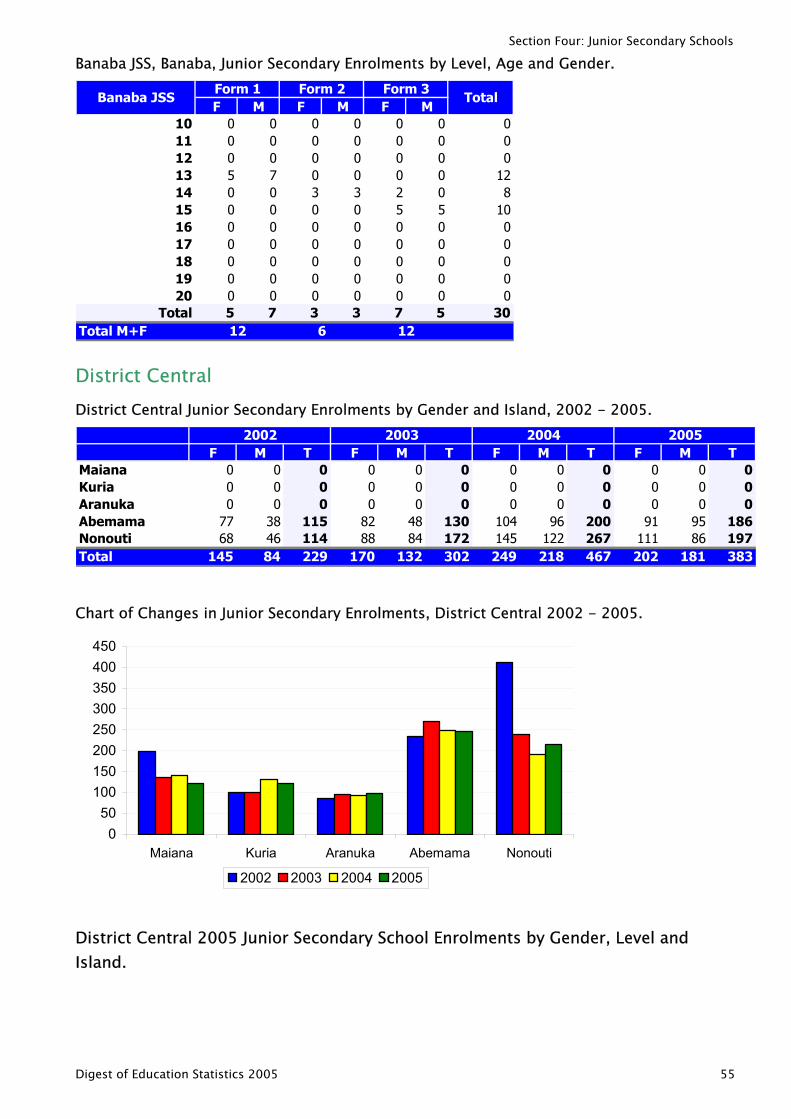
Section Four: Junior Secondary Schools
Banaba JSS, Banaba, Junior Secondary Enrolments by Level, Age and Gender.
F M F M F M10 0 0 0 0 0 011 0 0 0 0 0 012 0 0 0 0 0 013 5 7 0 0 0 014 0 0 3 3 2 015 0 0 0 0 5 516 0 0 0 0 0 017 0 0 0 0 0 018 0 0 0 0 0 019 0 0 0 0 0 020 0 0 0 0 0 0
Total 5 7 3 3 7 5 3Total M+F
Total
12 6 12
Form 1 Form 2 Form 3Banaba JSS
000
128
10000000
District Central District Central Junior Secondary Enrolments by Gender and Island, 2002 - 2005.
F M T F M T F M T F M TMaiana 0 0 0 0 0 0 0 0 0 0 0 0Kuria 0 0 0 0 0 0 0 0 0 0 0 0Aranuka 0 0 0 0 0 0 0 0 0 0 0 0Abemama 77 38 115 82 48 130 104 96 200 91 95 186Nonouti 68 46 114 88 84 172 145 122 267 111 86 197Total 145 84 229 170 132 302 249 218 467 202 181 383
2002 2003 2004 2005
Chart of Changes in Junior Secondary Enrolments, District Central 2002 - 2005.
050
100150200250300350400450
Maiana Kuria Aranuka Abemama Nonouti
2002 2003 2004 2005
District Central 2005 Junior Secondary School Enrolments by Gender, Level and Island.
Digest of Education Statistics 2005 55
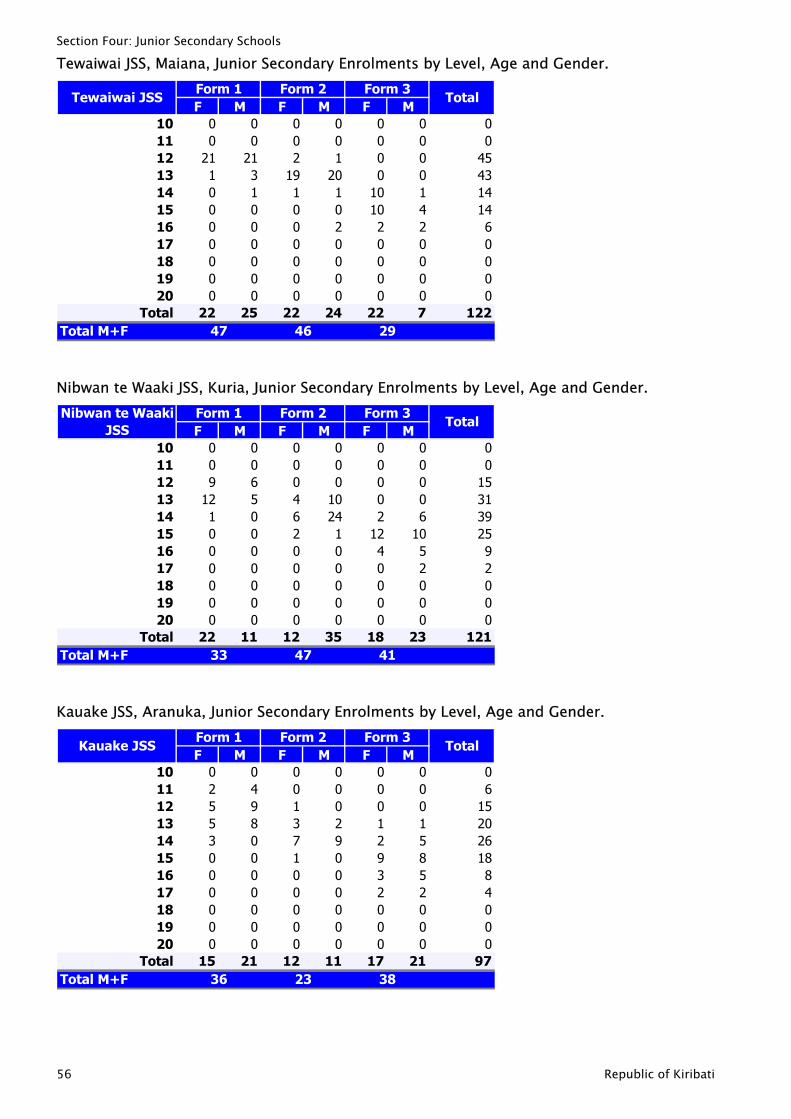
Section Four: Junior Secondary Schools
Tewaiwai JSS, Maiana, Junior Secondary Enrolments by Level, Age and Gender.
F M F M F M10 0 0 0 0 0 011 0 0 0 0 0 012 21 21 2 1 0 013 1 3 19 20 0 0 4314 0 1 1 1 10 115 0 0 0 0 10 416 0 0 0 2 2 217 0 0 0 0 0 018 0 0 0 0 0 019 0 0 0 0 0 020 0 0 0 0 0 0
Total 22 25 22 24 22 7 12Total M+F
Form 1 Form 2 Form 3Total
47 46 29
Tewaiwai JSS
00
45
1414600002
Nibwan te Waaki JSS, Kuria, Junior Secondary Enrolments by Level, Age and Gender.
F M F M F M10 0 0 0 0 0 011 0 0 0 0 0 012 9 6 0 0 0 013 12 5 4 10 0 0 3114 1 0 6 24 2 6 3915 0 0 2 1 12 1016 0 0 0 0 4 517 0 0 0 0 0 218 0 0 0 0 0 019 0 0 0 0 0 020 0 0 0 0 0 0
Total 22 11 12 35 18 23 12Total M+F
Form 1 Form 2 Form 3Total
33 47 41
Nibwan te Waaki JSS
00
15
25920001
Kauake JSS, Aranuka, Junior Secondary Enrolments by Level, Age and Gender.
F M F M F M10 0 0 0 0 0 011 2 4 0 0 0 012 5 9 1 0 0 013 5 8 3 2 1 114 3 0 7 9 2 515 0 0 1 0 9 816 0 0 0 0 3 517 0 0 0 0 2 218 0 0 0 0 0 019 0 0 0 0 0 020 0 0 0 0 0 0
Total 15 21 12 11 17 21 9Total M+F
Form 1 Form 2 Form 3Total
36 23 38
Kauake JSS
06
15202618840007
56 Republic of Kiribati
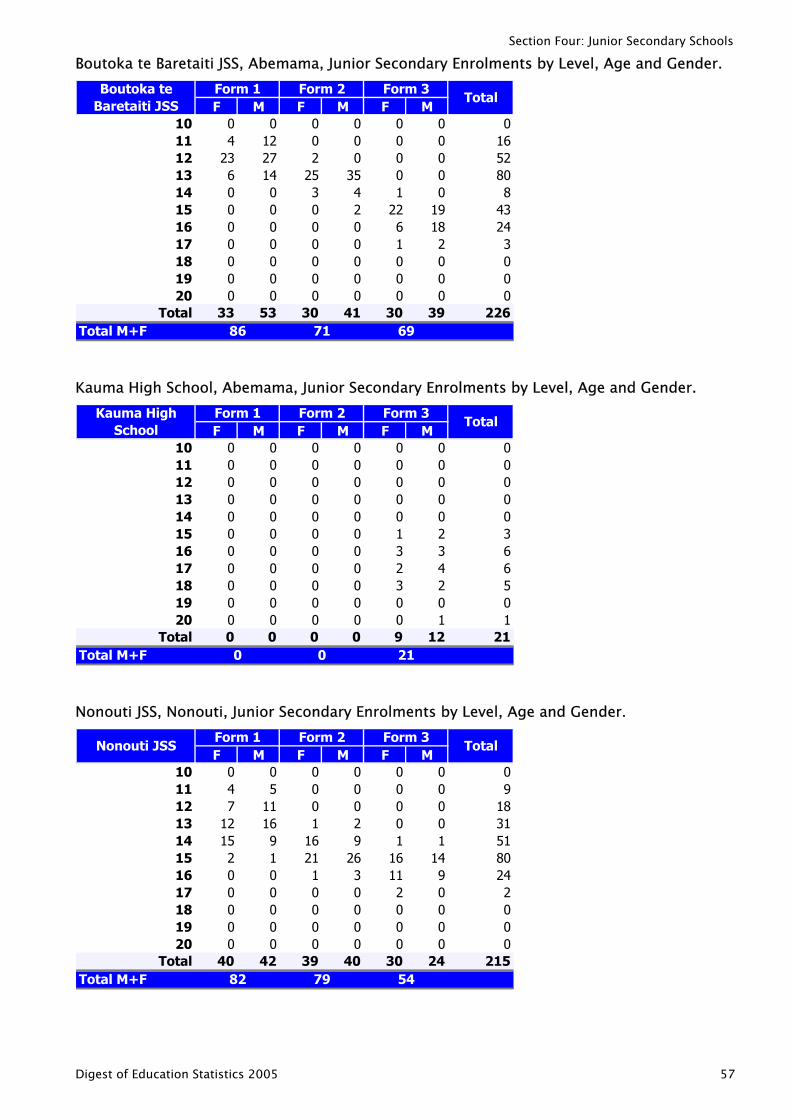
Section Four: Junior Secondary Schools
Boutoka te Baretaiti JSS, Abemama, Junior Secondary Enrolments by Level, Age and Gender.
F M F M F M10 0 0 0 0 0 011 4 12 0 0 0 012 23 27 2 0 0 013 6 14 25 35 0 0 814 0 0 3 4 1 015 0 0 0 2 22 1916 0 0 0 0 6 1817 0 0 0 0 1 218 0 0 0 0 0 019 0 0 0 0 0 020 0 0 0 0 0 0
Total 33 53 30 41 30 39 22Total M+F
Form 1 Form 2 Form 3Total
86 71 69
Boutoka te Baretaiti JSS
0165208
432430006
Kauma High School, Abemama, Junior Secondary Enrolments by Level, Age and Gender.
F M F M F M10 0 0 0 0 0 011 0 0 0 0 0 012 0 0 0 0 0 013 0 0 0 0 0 014 0 0 0 0 0 015 0 0 0 0 1 216 0 0 0 0 3 317 0 0 0 0 2 418 0 0 0 0 3 219 0 0 0 0 0 020 0 0 0 0 0 1
Total 0 0 0 0 9 12 2Total M+F
Form 3Total
0 0 21
Form 1 Form 2Kauma High School
000003665011
Nonouti JSS, Nonouti, Junior Secondary Enrolments by Level, Age and Gender.
F M F M F M10 0 0 0 0 0 011 4 5 0 0 0 012 7 11 0 0 0 013 12 16 1 2 0 014 15 9 16 9 1 115 2 1 21 26 16 14 8016 0 0 1 3 11 917 0 0 0 0 2 018 0 0 0 0 0 019 0 0 0 0 0 020 0 0 0 0 0 0
Total 40 42 39 40 30 24 21Total M+F
TotalForm 1 Form 2 Form 3
82 79 54
Nonouti JSS
09
183151
2420005
Digest of Education Statistics 2005 57
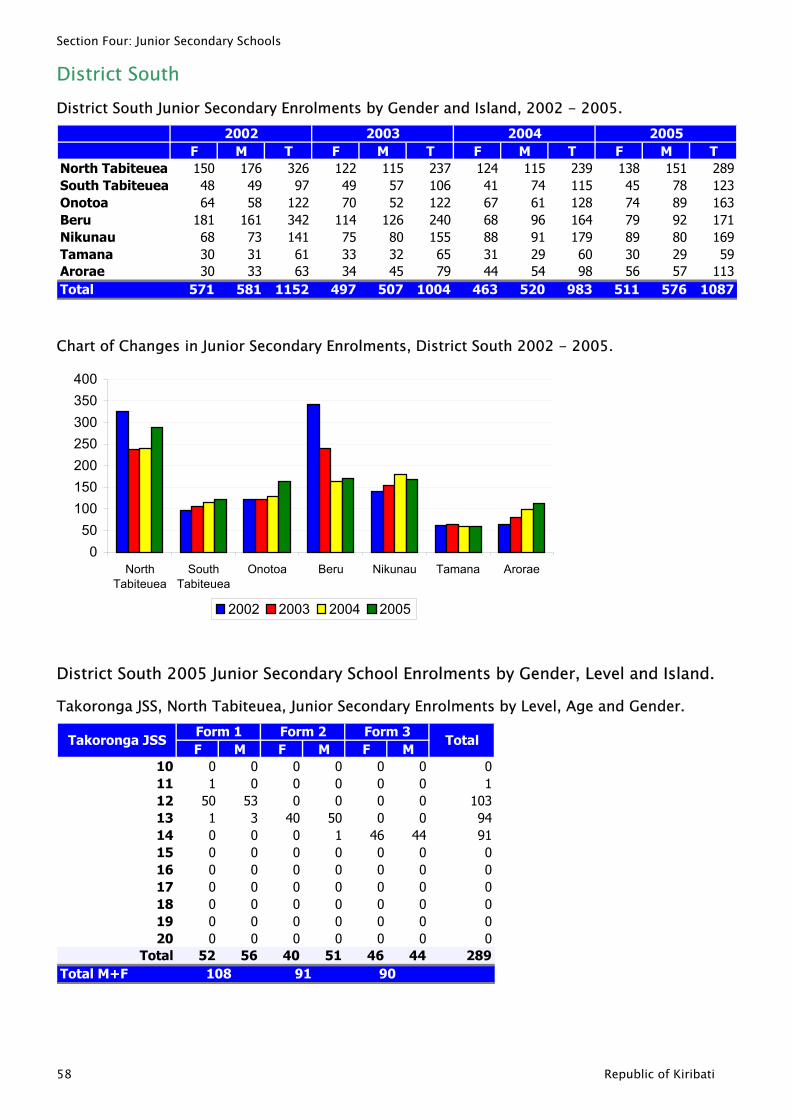
Section Four: Junior Secondary Schools
District South District South Junior Secondary Enrolments by Gender and Island, 2002 - 2005.
F M T F M T F M T F M TNorth Tabiteuea 150 176 326 122 115 237 124 115 239 138 151 289South Tabiteuea 48 49 97 49 57 106 41 74 115 45 78 123Onotoa 64 58 122 70 52 122 67 61 128 74 89 163Beru 181 161 342 114 126 240 68 96 164 79 92 171Nikunau 68 73 141 75 80 155 88 91 179 89 80 169Tamana 30 31 61 33 32 65 31 29 60 30 29 59Arorae 30 33 63 34 45 79 44 54 98 56 57 113Total 571 581 1152 497 507 1004 463 520 983 511 576 1087
2002 2003 2004 2005
Chart of Changes in Junior Secondary Enrolments, District South 2002 - 2005.
050
100150200250300350400
NorthTabiteuea
SouthTabiteuea
Onotoa Beru Nikunau Tamana Arorae
2002 2003 2004 2005
District South 2005 Junior Secondary School Enrolments by Gender, Level and Island.
Takoronga JSS, North Tabiteuea, Junior Secondary Enrolments by Level, Age and Gender.
F M F M F M10 0 0 0 0 0 011 1 0 0 0 0 012 50 53 0 0 0 0 113 1 3 40 50 0 0 9414 0 0 0 1 46 4415 0 0 0 0 0 016 0 0 0 0 0 017 0 0 0 0 0 018 0 0 0 0 0 019 0 0 0 0 0 020 0 0 0 0 0 0
Total 52 56 40 51 46 44 28Total M+F
Total
108 91 90
Form 1 Form 2 Form 3Takoronga JSS
01
03
910000009
58 Republic of Kiribati
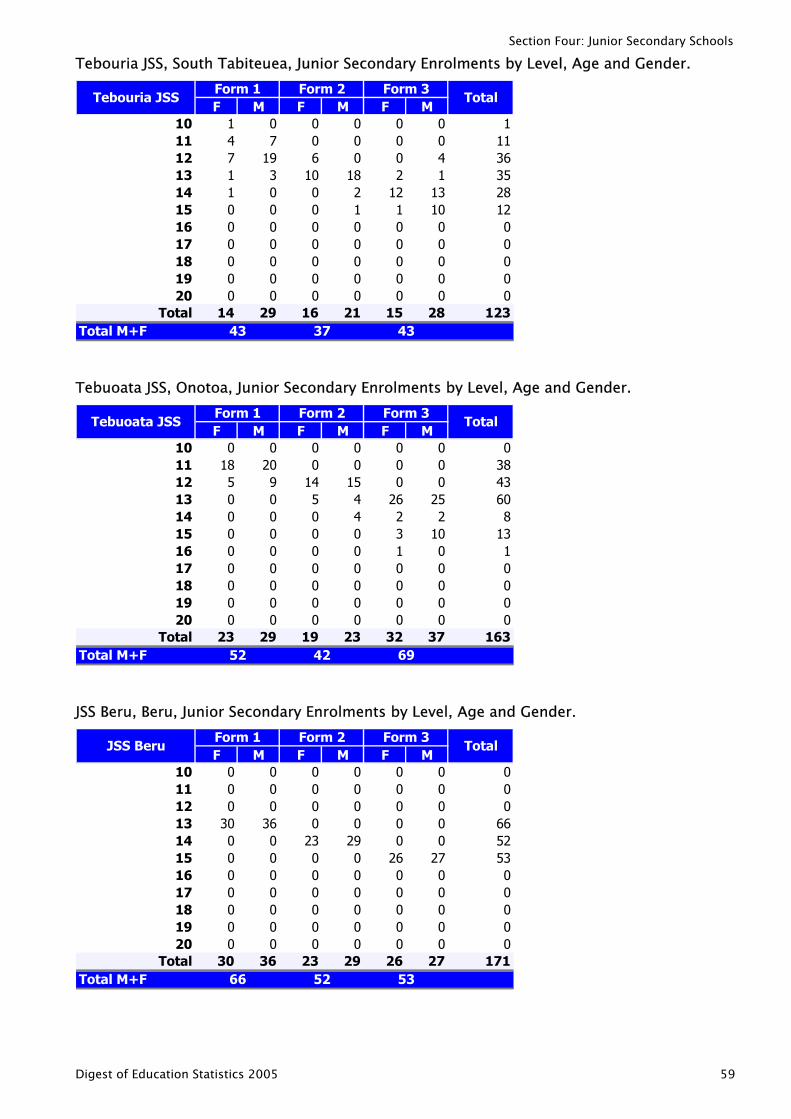
Section Four: Junior Secondary Schools
Tebouria JSS, South Tabiteuea, Junior Secondary Enrolments by Level, Age and Gender.
F M F M F M10 1 0 0 0 0 011 4 7 0 0 0 012 7 19 6 0 0 413 1 3 10 18 2 1 3514 1 0 0 2 12 1315 0 0 0 1 1 1016 0 0 0 0 0 017 0 0 0 0 0 018 0 0 0 0 0 019 0 0 0 0 0 020 0 0 0 0 0 0
Total 14 29 16 21 15 28 12Total M+F
Form 1 Form 2 Form 3Total
43 37 43
Tebouria JSS
11136
2812000003
Tebuoata JSS, Onotoa, Junior Secondary Enrolments by Level, Age and Gender.
F M F M F M10 0 0 0 0 0 011 18 20 0 0 0 012 5 9 14 15 0 0 4313 0 0 5 4 26 2514 0 0 0 4 2 215 0 0 0 0 3 1016 0 0 0 0 1 017 0 0 0 0 0 018 0 0 0 0 0 019 0 0 0 0 0 020 0 0 0 0 0 0
Total 23 29 19 23 32 37 16Total M+F
Form 1 Form 2 Form 3Total
52 42 69
Tebuoata JSS
038
608
13100003
JSS Beru, Beru, Junior Secondary Enrolments by Level, Age and Gender.
F M F M F M10 0 0 0 0 0 011 0 0 0 0 0 012 0 0 0 0 0 013 30 36 0 0 0 014 0 0 23 29 0 0 5215 0 0 0 0 26 2716 0 0 0 0 0 017 0 0 0 0 0 018 0 0 0 0 0 019 0 0 0 0 0 020 0 0 0 0 0 0
Total 30 36 23 29 26 27 17Total M+F
Form 1 Form 2 Form 3Total
66 52 53
JSS Beru
000
66
53000001
Digest of Education Statistics 2005 59
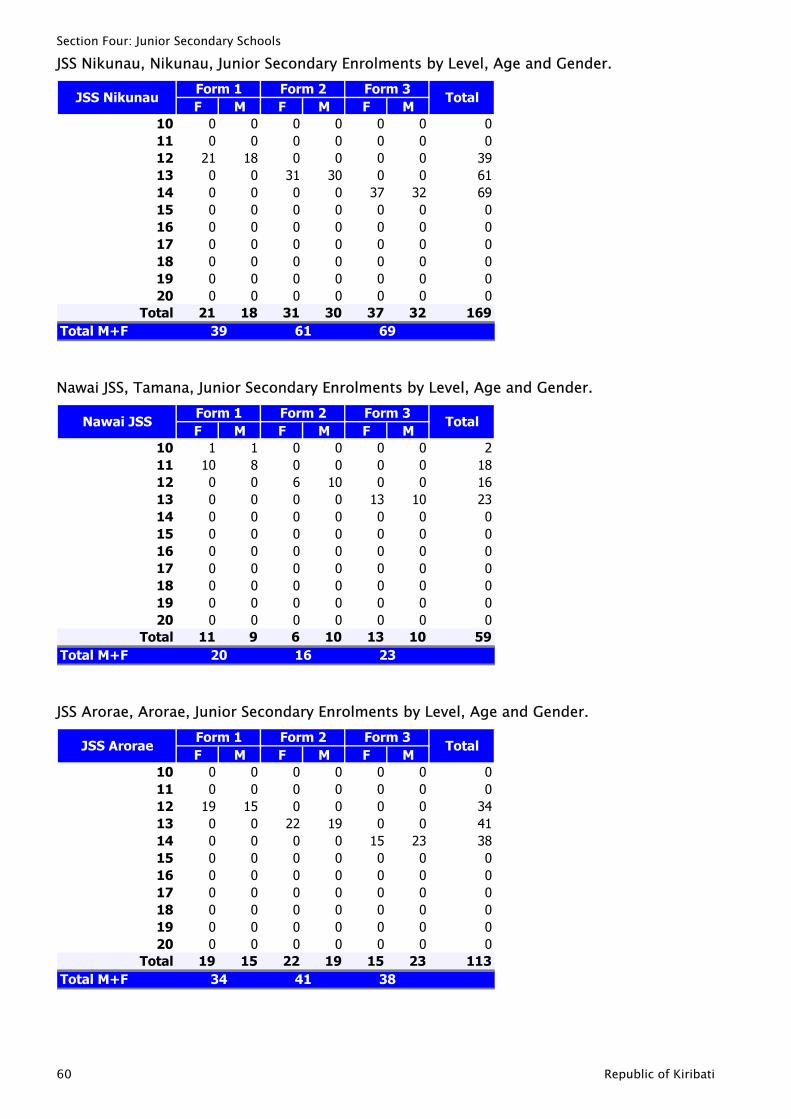
Section Four: Junior Secondary Schools
JSS Nikunau, Nikunau, Junior Secondary Enrolments by Level, Age and Gender.
F M F M F M10 0 0 0 0 0 011 0 0 0 0 0 012 21 18 0 0 0 013 0 0 31 30 0 0 6114 0 0 0 0 37 3215 0 0 0 0 0 016 0 0 0 0 0 017 0 0 0 0 0 018 0 0 0 0 0 019 0 0 0 0 0 020 0 0 0 0 0 0
Total 21 18 31 30 37 32 16Total M+F
Form 1 Form 2 Form 3Total
39 61 69
JSS Nikunau
00
39
690000009
Nawai JSS, Tamana, Junior Secondary Enrolments by Level, Age and Gender.
F M F M F M10 1 1 0 0 0 011 10 8 0 0 0 012 0 0 6 10 0 0 1613 0 0 0 0 13 1014 0 0 0 0 0 015 0 0 0 0 0 016 0 0 0 0 0 017 0 0 0 0 0 018 0 0 0 0 0 019 0 0 0 0 0 020 0 0 0 0 0 0
Total 11 9 6 10 13 10 59Total M+F
Form 1 Form 2 Form 3Total
20 16 23
Nawai JSS
218
230000000
JSS Arorae, Arorae, Junior Secondary Enrolments by Level, Age and Gender.
F M F M F M10 0 0 0 0 0 011 0 0 0 0 0 012 19 15 0 0 0 013 0 0 22 19 0 0 4114 0 0 0 0 15 2315 0 0 0 0 0 016 0 0 0 0 0 017 0 0 0 0 0 018 0 0 0 0 0 019 0 0 0 0 0 020 0 0 0 0 0 0
Total 19 15 22 19 15 23 11Total M+F
Form 1 Form 2 Form 3Total
34 41 38
JSS Arorae
00
34
380000003
60 Republic of Kiribati
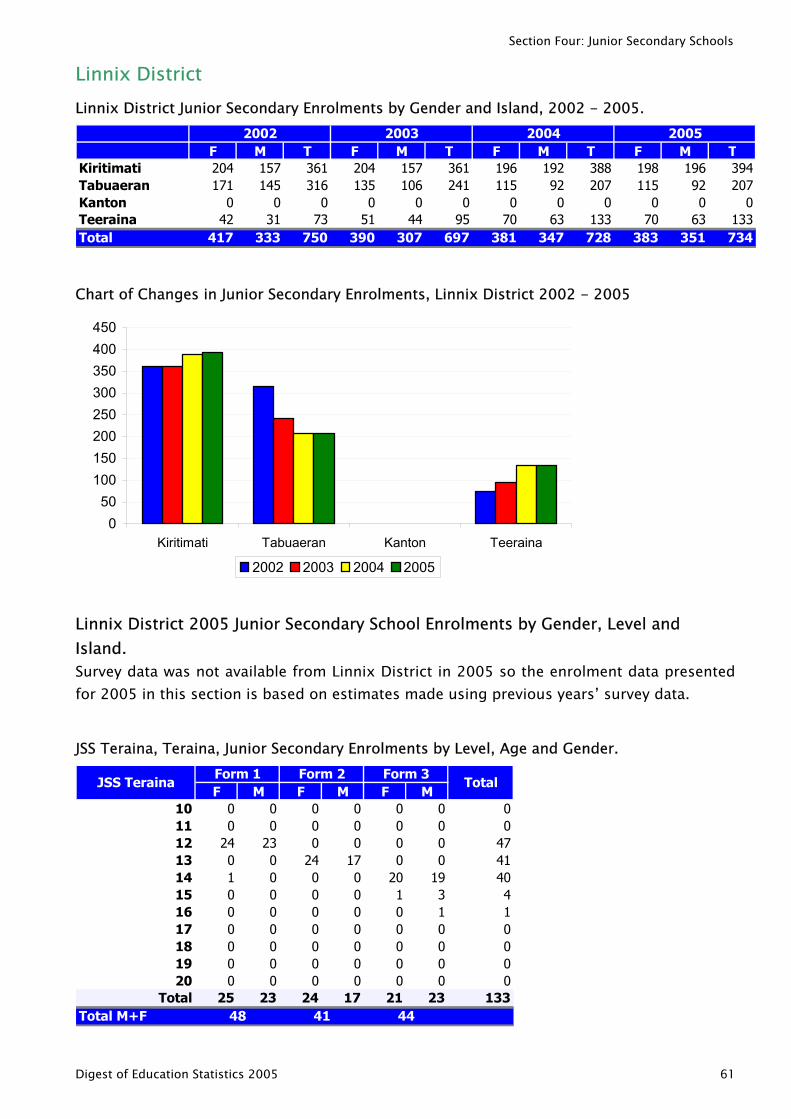
Section Four: Junior Secondary Schools
Linnix District Linnix District Junior Secondary Enrolments by Gender and Island, 2002 - 2005.
F M T F M T F M T F M TKiritimati 204 157 361 204 157 361 196 192 388 198 196 394Tabuaeran 171 145 316 135 106 241 115 92 207 115 92 207Kanton 0 0 0 0 0 0 0 0 0 0 0 0Teeraina 42 31 73 51 44 95 70 63 133 70 63 133Total 417 333 750 390 307 697 381 347 728 383 351 734
2002 2003 2004 2005
Chart of Changes in Junior Secondary Enrolments, Linnix District 2002 - 2005
050
100150200250300350400450
Kiritimati Tabuaeran Kanton Teeraina
2002 2003 2004 2005
Linnix District 2005 Junior Secondary School Enrolments by Gender, Level and Island. Survey data was not available from Linnix District in 2005 so the enrolment data presented for 2005 in this section is based on estimates made using previous years’ survey data.
JSS Teraina, Teraina, Junior Secondary Enrolments by Level, Age and Gender.
F M F M F M10 0 0 0 0 0 011 0 0 0 0 0 012 24 23 0 0 0 013 0 0 24 17 0 0 4114 1 0 0 0 20 1915 0 0 0 0 1 316 0 0 0 0 0 117 0 0 0 0 0 018 0 0 0 0 0 019 0 0 0 0 0 020 0 0 0 0 0 0
Total 25 23 24 17 21 23 13Total M+F
Form 1 Form 2 Form 3Total
48 41 44
JSS Teraina
00
47
404100003
Digest of Education Statistics 2005 61
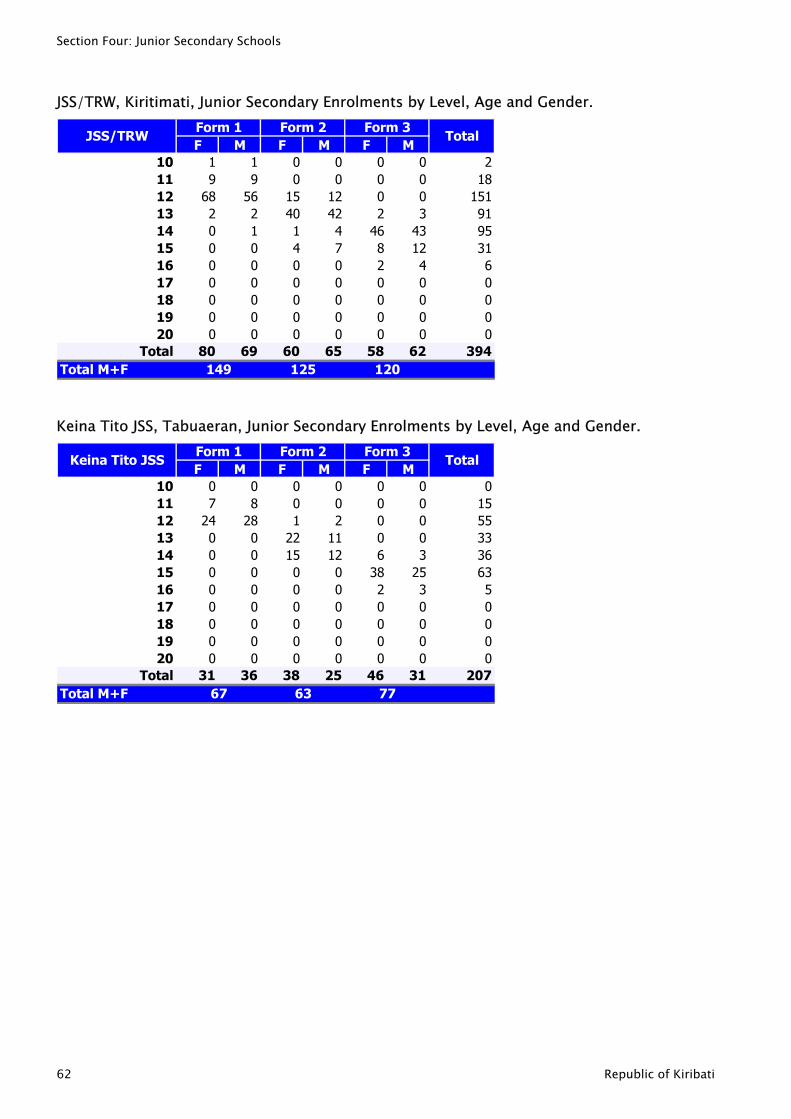
Section Four: Junior Secondary Schools
JSS/TRW, Kiritimati, Junior Secondary Enrolments by Level, Age and Gender.
F M F M F M10 1 1 0 0 0 011 9 9 0 0 0 012 68 56 15 12 0 0 15113 2 2 40 42 2 3 9114 0 1 1 4 46 4315 0 0 4 7 8 1216 0 0 0 0 2 417 0 0 0 0 0 018 0 0 0 0 0 019 0 0 0 0 0 020 0 0 0 0 0 0
Total 80 69 60 65 58 62 39Total M+F
Form 1 Form 2 Form 3Total
149 125 120
JSS/TRW
218
9531600004
Keina Tito JSS, Tabuaeran, Junior Secondary Enrolments by Level, Age and Gender.
F M F M F M10 0 0 0 0 0 011 7 8 0 0 0 012 24 28 1 2 0 013 0 0 22 11 0 0 3314 0 0 15 12 6 3 3615 0 0 0 0 38 2516 0 0 0 0 2 317 0 0 0 0 0 018 0 0 0 0 0 019 0 0 0 0 0 020 0 0 0 0 0 0
Total 31 36 38 25 46 31 20Total M+F
Total
67 63 77
Form 1 Form 2 Form 3Keina Tito JSS
01555
63500007
62 Republic of Kiribati
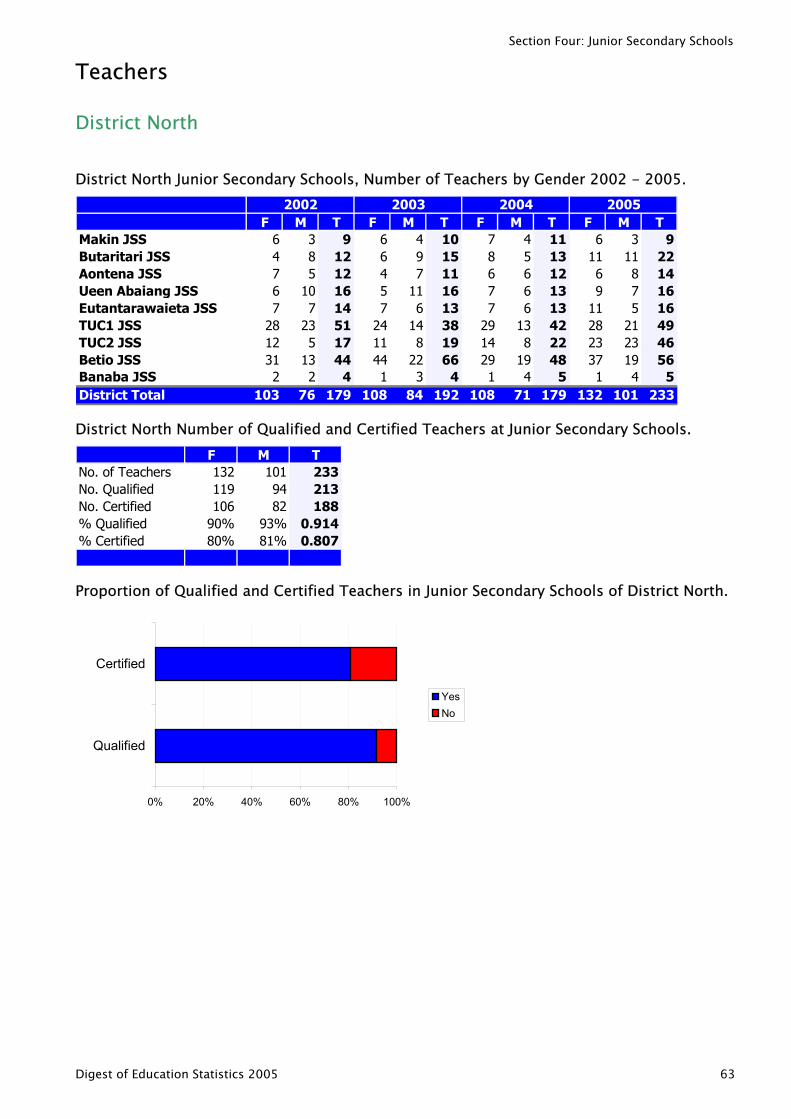
Section Four: Junior Secondary Schools
Teachers
District North
District North Junior Secondary Schools, Number of Teachers by Gender 2002 - 2005.
F M T F M T F M T F M TMakin JSS 6 3 9 6 4 10 7 4 11 6 3 9Butaritari JSS 4 8 12 6 9 15 8 5 13 11 11 22Aontena JSS 7 5 12 4 7 11 6 6 12 6 8 14Ueen Abaiang JSS 6 10 16 5 11 16 7 6 13 9 7 16Eutantarawaieta JSS 7 7 14 7 6 13 7 6 13 11 5 16TUC1 JSS 28 23 51 24 14 38 29 13 42 28 21 49TUC2 JSS 12 5 17 11 8 19 14 8 22 23 23 46Betio JSS 31 13 44 44 22 66 29 19 48 37 19 56Banaba JSS 2 2 4 1 3 4 1 4 5 1 4 5District Total 103 76 179 108 84 192 108 71 179 132 101 233
20052002 2003 2004
District North Number of Qualified and Certified Teachers at Junior Secondary Schools. F M T
No. of Teachers 132 101 233No. Qualified 119 94 213No. Certified 106 82 188% Qualified 90% 93% 0.914% Certified 80% 81% 0.807
Proportion of Qualified and Certified Teachers in Junior Secondary Schools of District North.
0% 20% 40% 60% 80% 100%
Qualified
Certified
YesNo
Digest of Education Statistics 2005 63
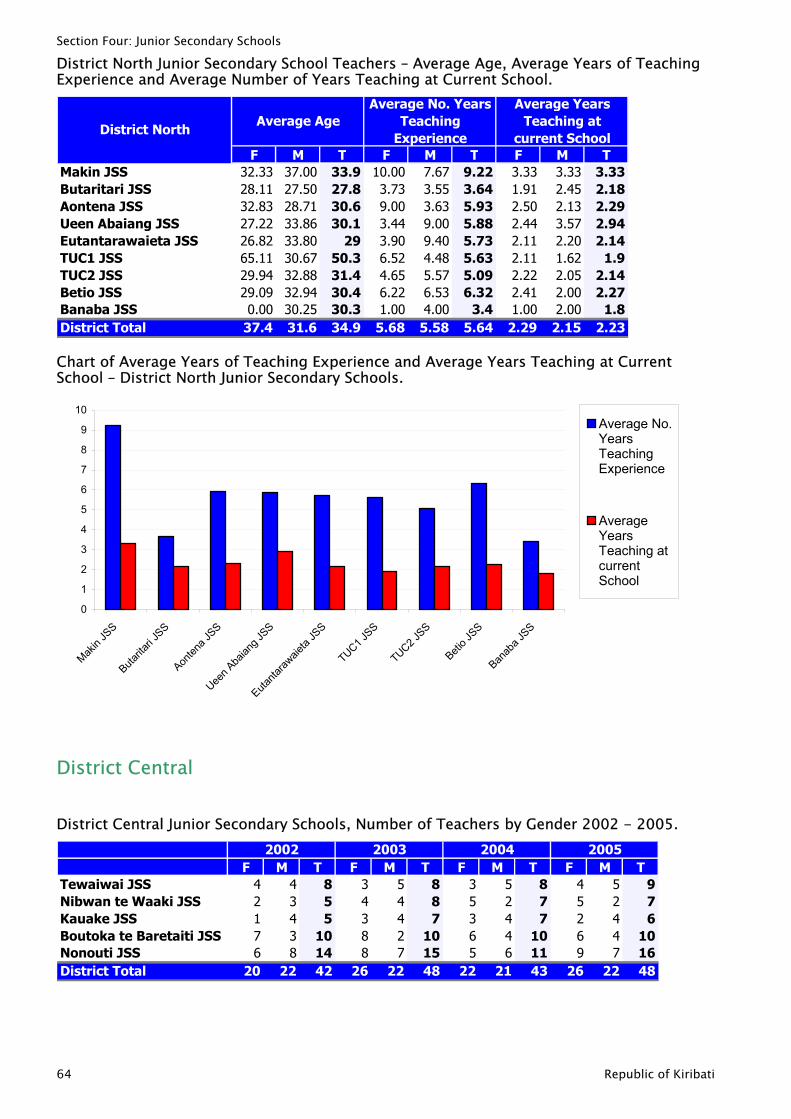
Section Four: Junior Secondary Schools
District North Junior Secondary School Teachers – Average Age, Average Years of Teaching Experience and Average Number of Years Teaching at Current School.
F M T F M T F M TMakin JSS 32.33 37.00 33.9 10.00 7.67 9.22 3.33 3.33 3.33Butaritari JSS 28.11 27.50 27.8 3.73 3.55 3.64 1.91 2.45 2.18Aontena JSS 32.83 28.71 30.6 9.00 3.63 5.93 2.50 2.13 2.29Ueen Abaiang JSS 27.22 33.86 30.1 3.44 9.00 5.88 2.44 3.57 2.94Eutantarawaieta JSS 26.82 33.80 29 3.90 9.40 5.73 2.11 2.20 2.14TUC1 JSS 65.11 30.67 50.3 6.52 4.48 5.63 2.11 1.62 1.9TUC2 JSS 29.94 32.88 31.4 4.65 5.57 5.09 2.22 2.05 2.14Betio JSS 29.09 32.94 30.4 6.22 6.53 6.32 2.41 2.00 2.27Banaba JSS 0.00 30.25 30.3 1.00 4.00 3.4 1.00 2.00 1.8District Total 37.4 31.6 34.9 5.68 5.58 5.64 2.29 2.15 2.23
Average AgeAverage No. Years
Teaching Experience
Average Years Teaching at
current SchoolDistrict North
Chart of Average Years of Teaching Experience and Average Years Teaching at Current School – District North Junior Secondary Schools.
0
1
2
3
4
5
6
7
8
9
10
Makin
JSS
Butarita
ri JSS
Aonten
a JSS
Ueen A
baian
g JSS
Eutanta
rawaie
ta JS
S
TUC1 JSS
TUC2 JSS
Betio J
SS
Banab
a JSS
Average No.YearsTeachingExperience
AverageYearsTeaching atcurrentSchool
District Central
District Central Junior Secondary Schools, Number of Teachers by Gender 2002 - 2005.
F M T F M T F M T F M TTewaiwai JSS 4 4 8 3 5 8 3 5 8 4 5 9Nibwan te Waaki JSS 2 3 5 4 4 8 5 2 7 5 2 7Kauake JSS 1 4 5 3 4 7 3 4 7 2 4 6Boutoka te Baretaiti JSS 7 3 10 8 2 10 6 4 10 6 4 10Nonouti JSS 6 8 14 8 7 15 5 6 11 9 7 16District Total 20 22 42 26 22 48 22 21 43 26 22 48
2002 2003 2004 2005
64 Republic of Kiribati
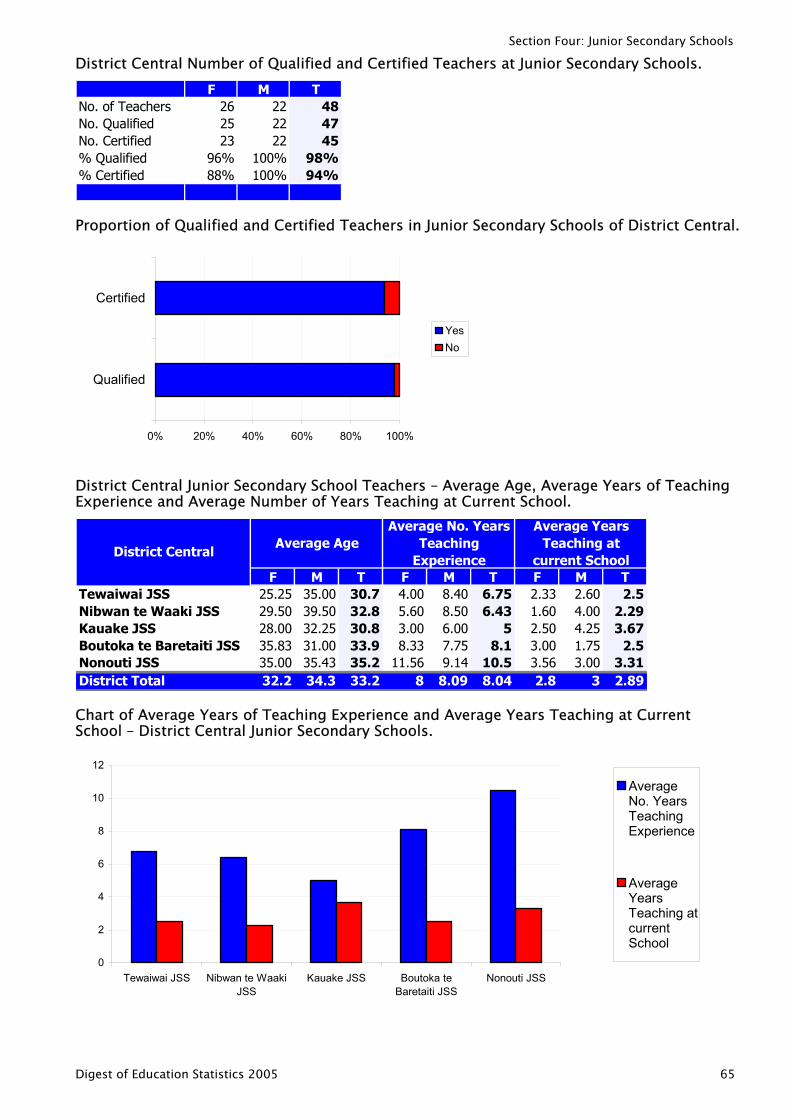
Section Four: Junior Secondary Schools
District Central Number of Qualified and Certified Teachers at Junior Secondary Schools. F M T
No. of Teachers 26 22 48No. Qualified 25 22 47No. Certified 23 22 45% Qualified 96% 100% 98%% Certified 88% 100% 94%
Proportion of Qualified and Certified Teachers in Junior Secondary Schools of District Central.
0% 20% 40% 60% 80% 100%
Qualified
Certified
YesNo
District Central Junior Secondary School Teachers – Average Age, Average Years of Teaching Experience and Average Number of Years Teaching at Current School.
F M T F M T F M TTewaiwai JSS 25.25 35.00 30.7 4.00 8.40 6.75 2.33 2.60 2.5Nibwan te Waaki JSS 29.50 39.50 32.8 5.60 8.50 6.43 1.60 4.00 2.29Kauake JSS 28.00 32.25 30.8 3.00 6.00 5 2.50 4.25 3.67Boutoka te Baretaiti JSS 35.83 31.00 33.9 8.33 7.75 8.1 3.00 1.75 2.5Nonouti JSS 35.00 35.43 35.2 11.56 9.14 10.5 3.56 3.00 3.31District Total 32.2 34.3 33.2 8 8.09 8.04 2.8 3 2.89
District CentralAverage Age
Average No. Years Teaching
Experience
Average Years Teaching at
current School
Chart of Average Years of Teaching Experience and Average Years Teaching at Current School – District Central Junior Secondary Schools.
0
2
4
6
8
10
12
Tewaiwai JSS Nibwan te WaakiJSS
Kauake JSS Boutoka teBaretaiti JSS
Nonouti JSS
AverageNo. YearsTeachingExperience
AverageYearsTeaching atcurrentSchool
Digest of Education Statistics 2005 65
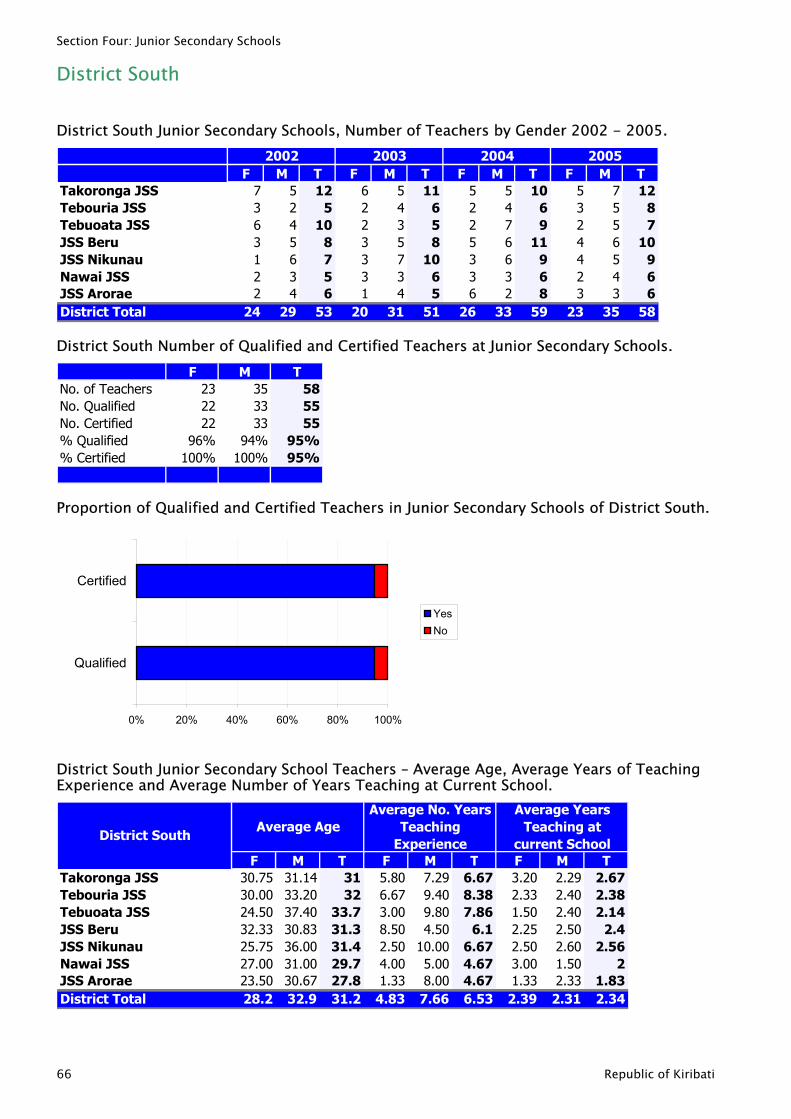
Section Four: Junior Secondary Schools
District South
District South Junior Secondary Schools, Number of Teachers by Gender 2002 - 2005.
F M T F M T F M T F M TTakoronga JSS 7 5 12 6 5 11 5 5 10 5 7 12Tebouria JSS 3 2 5 2 4 6 2 4 6 3 5 8Tebuoata JSS 6 4 10 2 3 5 2 7 9 2 5 7JSS Beru 3 5 8 3 5 8 5 6 11 4 6 10JSS Nikunau 1 6 7 3 7 10 3 6 9 4 5 9Nawai JSS 2 3 5 3 3 6 3 3 6 2 4 6JSS Arorae 2 4 6 1 4 5 6 2 8 3 3 6District Total 24 29 53 20 31 51 26 33 59 23 35 58
2002 2003 2004 2005
District South Number of Qualified and Certified Teachers at Junior Secondary Schools. F M T
No. of Teachers 23 35 58No. Qualified 22 33 55No. Certified 22 33 55% Qualified 96% 94% 95%% Certified 100% 100% 95%
Proportion of Qualified and Certified Teachers in Junior Secondary Schools of District South.
0% 20% 40% 60% 80% 100%
Qualified
Certified
YesNo
District South Junior Secondary School Teachers – Average Age, Average Years of Teaching Experience and Average Number of Years Teaching at Current School.
F M T F M T F M TTakoronga JSS 30.75 31.14 31 5.80 7.29 6.67 3.20 2.29 2.67Tebouria JSS 30.00 33.20 32 6.67 9.40 8.38 2.33 2.40 2.38Tebuoata JSS 24.50 37.40 33.7 3.00 9.80 7.86 1.50 2.40 2.14JSS Beru 32.33 30.83 31.3 8.50 4.50 6.1 2.25 2.50 2.4JSS Nikunau 25.75 36.00 31.4 2.50 10.00 6.67 2.50 2.60 2.56Nawai JSS 27.00 31.00 29.7 4.00 5.00 4.67 3.00 1.50 2JSS Arorae 23.50 30.67 27.8 1.33 8.00 4.67 1.33 2.33 1.83District Total 28.2 32.9 31.2 4.83 7.66 6.53 2.39 2.31 2.34
District SouthAverage Age
Average No. Years Teaching
Experience
Average Years Teaching at
current School
66 Republic of Kiribati
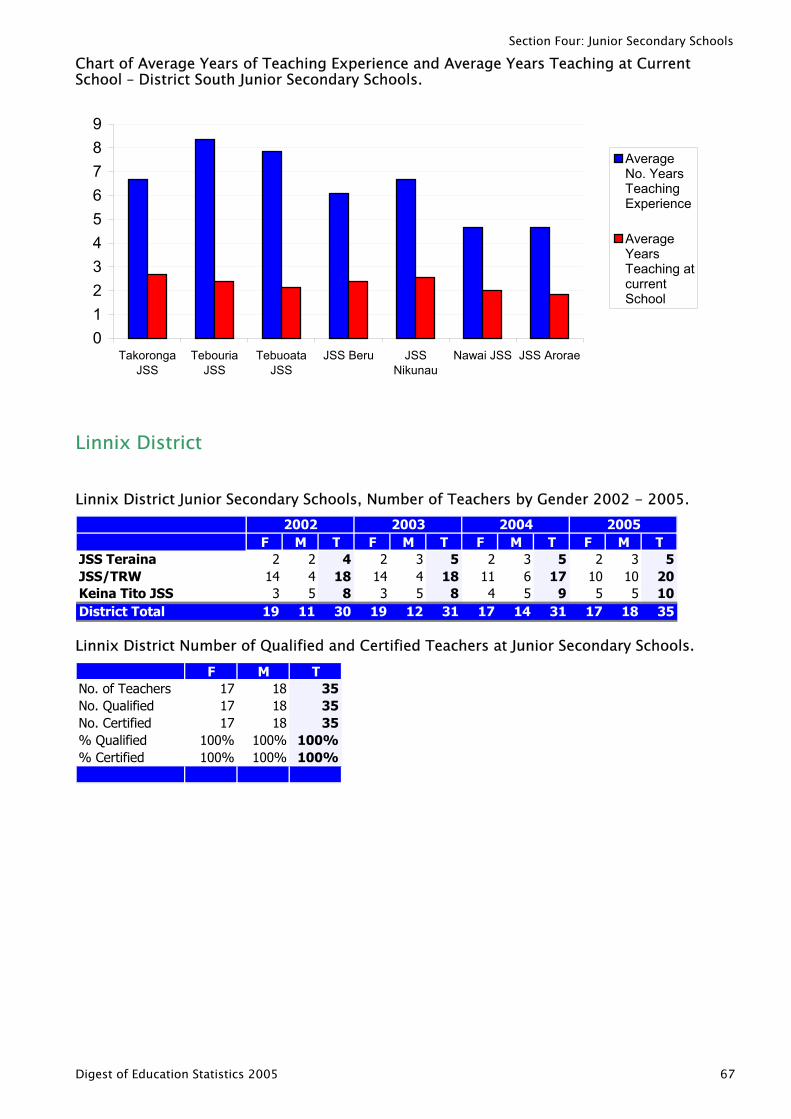
Section Four: Junior Secondary Schools
Chart of Average Years of Teaching Experience and Average Years Teaching at Current School – District South Junior Secondary Schools.
0123456789
TakorongaJSS
TebouriaJSS
TebuoataJSS
JSS Beru JSSNikunau
Nawai JSS JSS Arorae
AverageNo. YearsTeachingExperience
AverageYearsTeaching atcurrentSchool
Linnix District
Linnix District Junior Secondary Schools, Number of Teachers by Gender 2002 - 2005.
F M T F M T F M T F M TJSS Teraina 2 2 4 2 3 5 2 3 5 2 3 5JSS/TRW 14 4 18 14 4 18 11 6 17 10 10 20Keina Tito JSS 3 5 8 3 5 8 4 5 9 5 5 10District Total 19 11 30 19 12 31 17 14 31 17 18 35
2002 2003 2004 2005
Linnix District Number of Qualified and Certified Teachers at Junior Secondary Schools. F M T
No. of Teachers 17 18 35No. Qualified 17 18 35No. Certified 17 18 35% Qualified 100% 100% 100%% Certified 100% 100% 100%
Digest of Education Statistics 2005 67
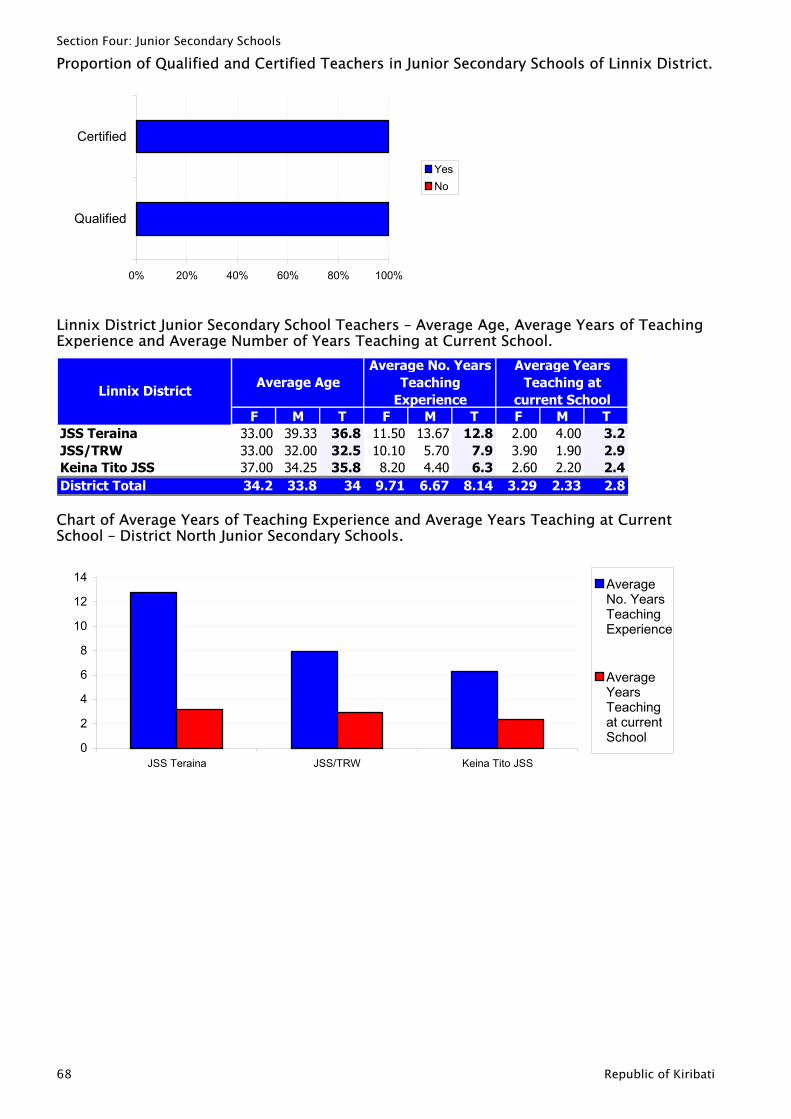
Section Four: Junior Secondary Schools
Proportion of Qualified and Certified Teachers in Junior Secondary Schools of Linnix District.
0% 20% 40% 60% 80% 100%
Qualified
Certified
YesNo
Linnix District Junior Secondary School Teachers – Average Age, Average Years of Teaching Experience and Average Number of Years Teaching at Current School.
F M T F M T F M TJSS Teraina 33.00 39.33 36.8 11.50 13.67 12.8 2.00 4.00 3.2JSS/TRW 33.00 32.00 32.5 10.10 5.70 7.9 3.90 1.90 2.9Keina Tito JSS 37.00 34.25 35.8 8.20 4.40 6.3 2.60 2.20 2.4District Total 34.2 33.8 34 9.71 6.67 8.14 3.29 2.33 2.8
Linnix DistrictAverage Age
Average No. Years Teaching
Experience
Average Years Teaching at
current School
Chart of Average Years of Teaching Experience and Average Years Teaching at Current School – District North Junior Secondary Schools.
0
2
4
6
8
10
12
14
JSS Teraina JSS/TRW Keina Tito JSS
AverageNo. YearsTeachingExperience
AverageYearsTeachingat currentSchool
68 Republic of Kiribati
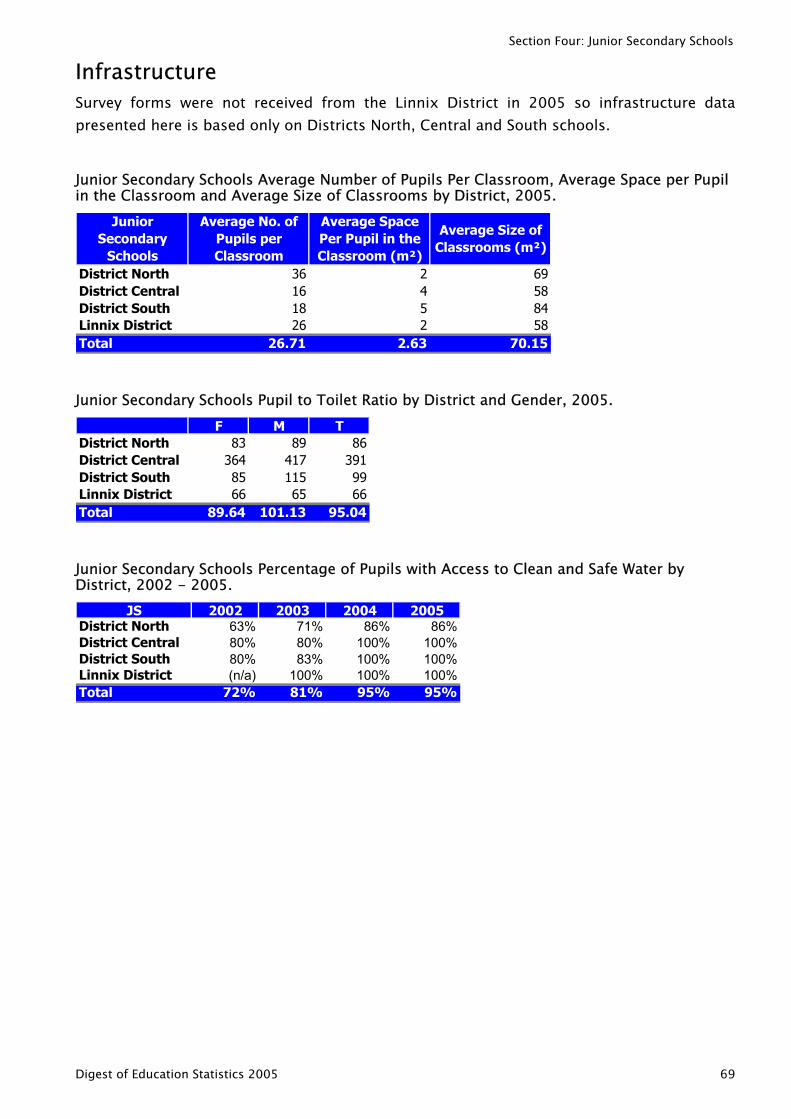
Section Four: Junior Secondary Schools
Infrastructure Survey forms were not received from the Linnix District in 2005 so infrastructure data presented here is based only on Districts North, Central and South schools.
Junior Secondary Schools Average Number of Pupils Per Classroom, Average Space per Pupil in the Classroom and Average Size of Classrooms by District, 2005.
District NorthDistrict CentralDistrict SouthLinnix DistrictTotal
Junior Secondary
Schools
Average No. of Pupils per Classroom
Average Space Per Pupil in the Classroom (m²)
Average Size of Classrooms (m²)
36 2 6916 4 5818 5 8426 2 58
26.71 2.63 70.15
Junior Secondary Schools Pupil to Toilet Ratio by District and Gender, 2005. F M T
District North 83 89 86District Central 364 417 391District South 85 115 99Linnix District 66 65 66Total 89.64 101.13 95.04
Junior Secondary Schools Percentage of Pupils with Access to Clean and Safe Water by District, 2002 - 2005.
JS 2002 2003 2004 2005District North 63% 71% 86% 86%District Central 80% 80% 100% 100%District South 80% 83% 100% 100%Linnix District (n/a) 100% 100% 100%Total 72% 81% 95% 95%
Digest of Education Statistics 2005 69
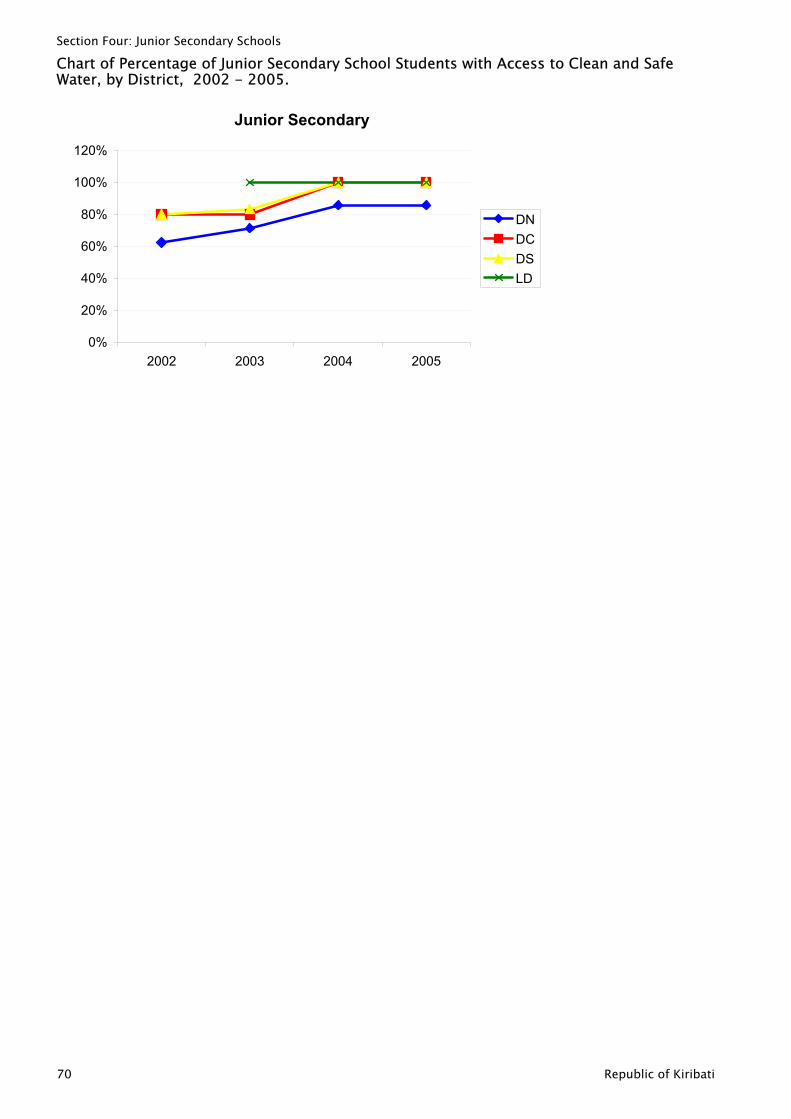
Section Four: Junior Secondary Schools
Chart of Percentage of Junior Secondary School Students with Access to Clean and Safe Water, by District, 2002 - 2005.
Junior Secondary
0%
20%
40%
60%
80%
100%
120%
2002 2003 2004 2005
DNDCDSLD
70 Republic of Kiribati
Section Five: Senior Secondary Schools
Section Five: Senior Secondary Schools
Digest of Education Statistics 2005 71
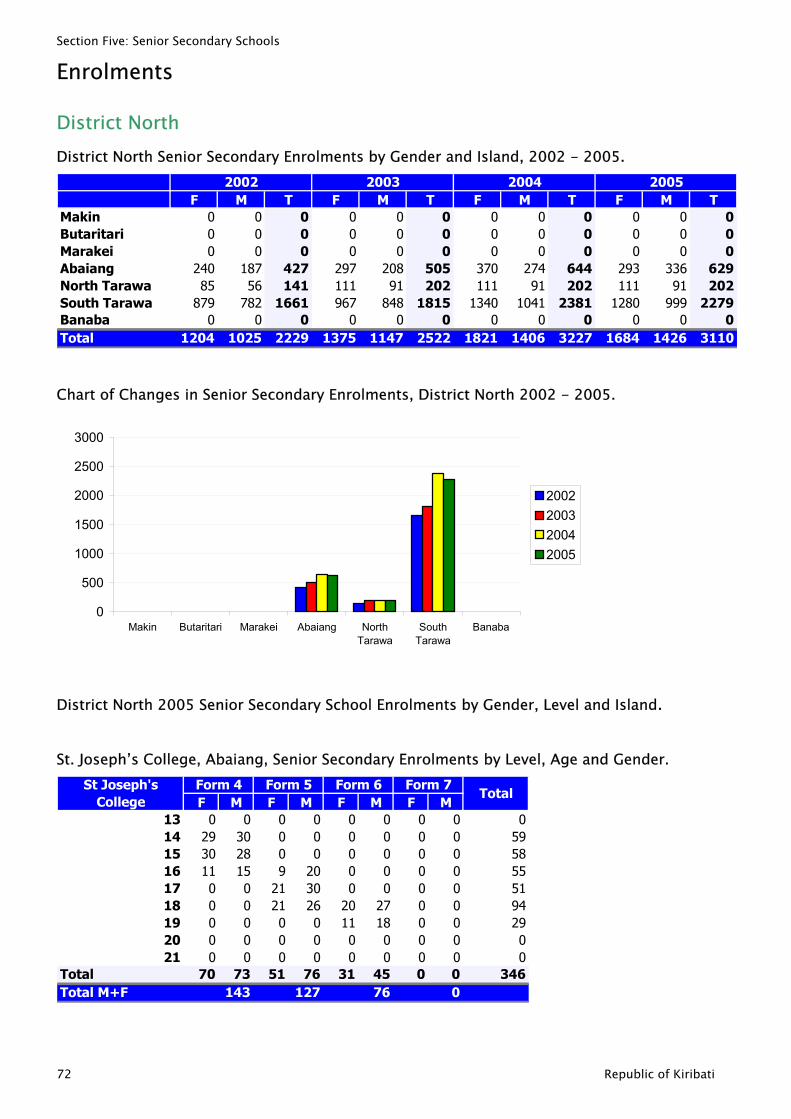
Section Five: Senior Secondary Schools
Enrolments
District North District North Senior Secondary Enrolments by Gender and Island, 2002 - 2005.
F M T F M T F M T F M TMakin 0 0 0 0 0 0 0 0 0 0 0 0Butaritari 0 0 0 0 0 0 0 0 0 0 0 0Marakei 0 0 0 0 0 0 0 0 0 0 0 0Abaiang 240 187 427 297 208 505 370 274 644 293 336 629North Tarawa 85 56 141 111 91 202 111 91 202 111 91 202South Tarawa 879 782 1661 967 848 1815 1340 1041 2381 1280 999 2279Banaba 0 0 0 0 0 0 0 0 0 0 0 0Total 1204 1025 2229 1375 1147 2522 1821 1406 3227 1684 1426 3110
2002 2003 2004 2005
Chart of Changes in Senior Secondary Enrolments, District North 2002 - 2005.
0
500
1000
1500
2000
2500
3000
Makin Butaritari Marakei Abaiang NorthTarawa
SouthTarawa
Banaba
2002200320042005
District North 2005 Senior Secondary School Enrolments by Gender, Level and Island.
St. Joseph’s College, Abaiang, Senior Secondary Enrolments by Level, Age and Gender.
F M F M F M F M13 0 0 0 0 0 0 0 014 29 30 0 0 0 0 0 0 515 30 28 0 0 0 0 0 0 516 11 15 9 20 0 0 0 0 517 0 0 21 30 0 0 0 0 518 0 0 21 26 20 27 0 0 9419 0 0 0 0 11 18 0 0 220 0 0 0 0 0 0 0 021 0 0 0 0 0 0 0 0
Total 70 73 51 76 31 45 0 0 346Total M+F
TotalForm 7
143 127 76 0
Form 4 Form 5 Form 6St Joseph's College
09851
900
72 Republic of Kiribati
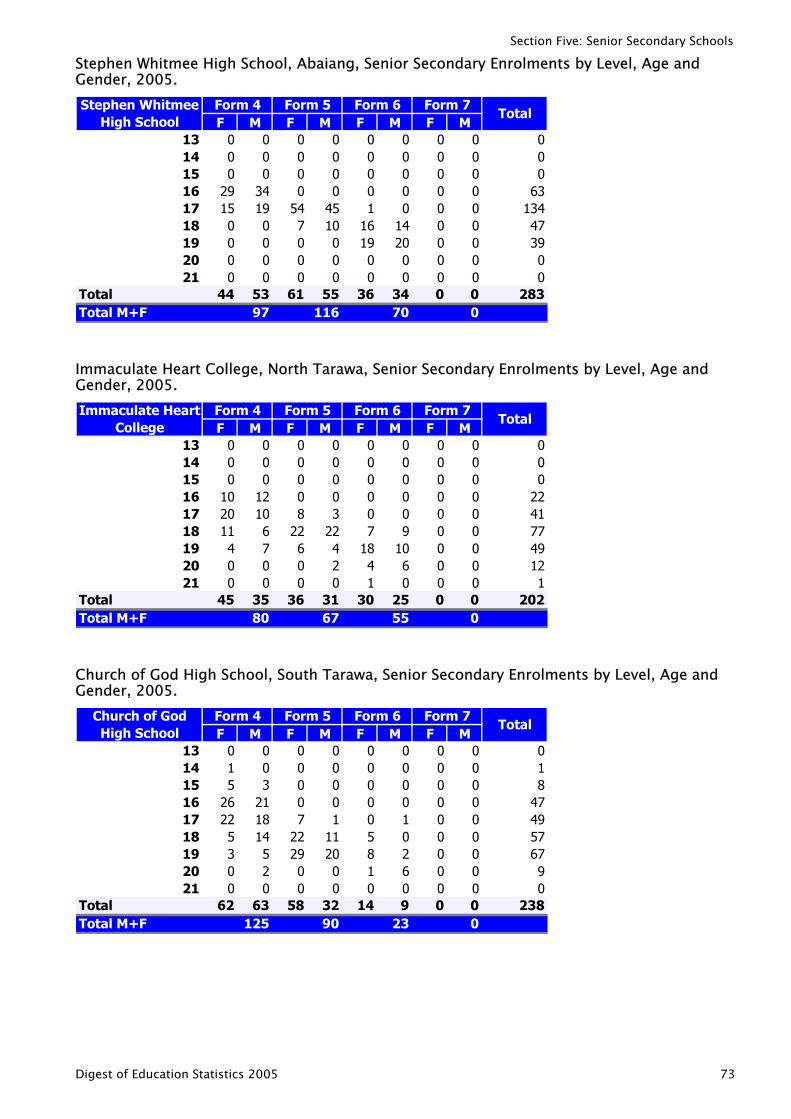
Section Five: Senior Secondary Schools
Stephen Whitmee High School, Abaiang, Senior Secondary Enrolments by Level, Age and Gender, 2005.
F M F M F M F M13 0 0 0 0 0 0 0 014 0 0 0 0 0 0 0 015 0 0 0 0 0 0 0 016 29 34 0 0 0 0 0 0 617 15 19 54 45 1 0 0 0 1318 0 0 7 10 16 14 0 0 4719 0 0 0 0 19 20 0 0 320 0 0 0 0 0 0 0 021 0 0 0 0 0 0 0 0
Total 44 53 61 55 36 34 0 0 283Total M+F 97 116 70 0
Form 4 Form 5 Form 6Total
Form 7Stephen Whitmee High School
00034
900
Immaculate Heart College, North Tarawa, Senior Secondary Enrolments by Level, Age and Gender, 2005.
F M F M F M F M13 0 0 0 0 0 0 0 014 0 0 0 0 0 0 0 015 0 0 0 0 0 0 0 016 10 12 0 0 0 0 0 0 217 20 10 8 3 0 0 0 0 418 11 6 22 22 7 9 0 0 719 4 7 6 4 18 10 0 0 420 0 0 0 2 4 6 0 0 121 0 0 0 0 1 0 0 0
Total 45 35 36 31 30 25 0 0 202Total M+F
TotalForm 7
80 67
Form 4 Form 5 Form 6
55 0
Immaculate Heart College
000217921
Church of God High School, South Tarawa, Senior Secondary Enrolments by Level, Age and Gender, 2005.
F M F M F M F M13 0 0 0 0 0 0 0 014 1 0 0 0 0 0 0 015 5 3 0 0 0 0 0 016 26 21 0 0 0 0 0 0 417 22 18 7 1 0 1 0 0 418 5 14 22 11 5 0 0 0 519 3 5 29 20 8 2 0 0 620 0 2 0 0 1 6 0 021 0 0 0 0 0 0 0 0
Total 62 63 58 32 14 9 0 0 238Total M+F
Form 7
125 90 23 0
TotalForm 4 Form 5 Form 6Church of God
High School018797790
Digest of Education Statistics 2005 73
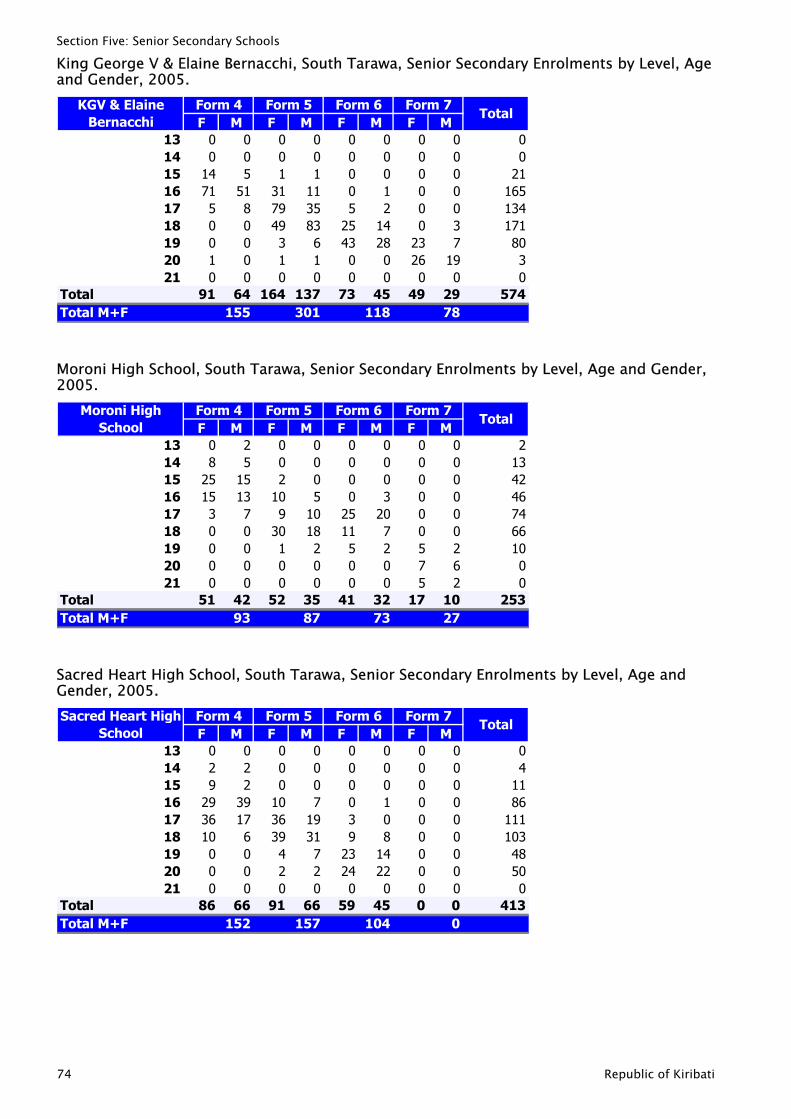
Section Five: Senior Secondary Schools
King George V & Elaine Bernacchi, South Tarawa, Senior Secondary Enrolments by Level, Age and Gender, 2005.
F M F M F M F M13 0 0 0 0 0 0 0 014 0 0 0 0 0 0 0 015 14 5 1 1 0 0 0 0 216 71 51 31 11 0 1 0 0 1617 5 8 79 35 5 2 0 0 1318 0 0 49 83 25 14 0 3 17119 0 0 3 6 43 28 23 7 820 1 0 1 1 0 0 26 1921 0 0 0 0 0 0 0 0
Total 91 64 164 137 73 45 49 29 574Total M+F
Form 7
155 301 118 78
TotalForm 4 Form 5 Form 6KGV & Elaine
Bernacchi00154
030
Moroni High School, South Tarawa, Senior Secondary Enrolments by Level, Age and Gender, 2005.
F M F M F M F M13 0 2 0 0 0 0 0 014 8 5 0 0 0 0 0 0 115 25 15 2 0 0 0 0 0 416 15 13 10 5 0 3 0 0 417 3 7 9 10 25 20 0 0 7418 0 0 30 18 11 7 0 0 6619 0 0 1 2 5 2 5 2 120 0 0 0 0 0 0 7 621 0 0 0 0 0 0 5 2
Total 51 42 52 35 41 32 17 10 253Total M+F
Form 7
93 87 73 27
TotalForm 4 Form 5 Form 6Moroni High
School2326
000
Sacred Heart High School, South Tarawa, Senior Secondary Enrolments by Level, Age and Gender, 2005.
F M F M F M F M13 0 0 0 0 0 0 0 014 2 2 0 0 0 0 0 015 9 2 0 0 0 0 0 0 116 29 39 10 7 0 1 0 0 817 36 17 36 19 3 0 0 0 1118 10 6 39 31 9 8 0 0 1019 0 0 4 7 23 14 0 0 420 0 0 2 2 24 22 0 0 521 0 0 0 0 0 0 0 0
Total 86 66 91 66 59 45 0 0 413Total M+F 152 157 104
TotalForm 7
0
Form 4 Form 5 Form 6Sacred Heart Hi
041613800
gh School
74 Republic of Kiribati
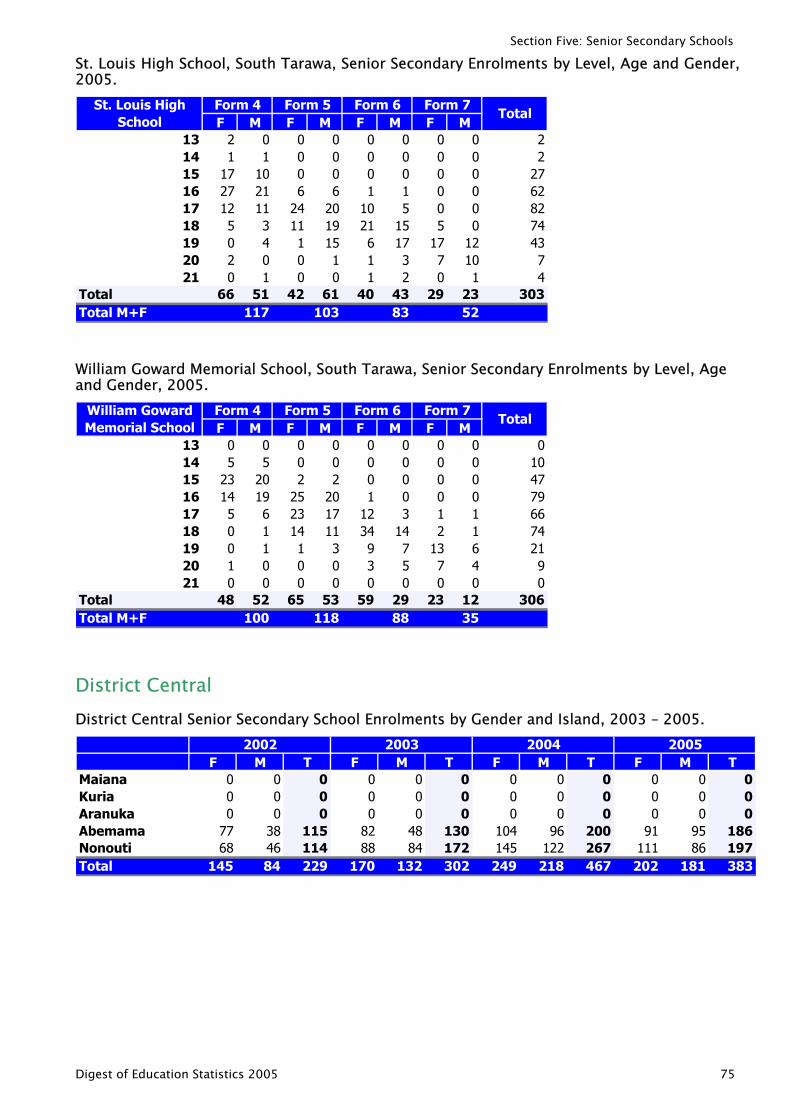
Section Five: Senior Secondary Schools
St. Louis High School, South Tarawa, Senior Secondary Enrolments by Level, Age and Gender, 2005.
F M F M F M F M13 2 0 0 0 0 0 0 014 1 1 0 0 0 0 0 015 17 10 0 0 0 0 0 0 216 27 21 6 6 1 1 0 0 617 12 11 24 20 10 5 0 0 8218 5 3 11 19 21 15 5 0 7419 0 4 1 15 6 17 17 12 4320 2 0 0 1 1 3 7 1021 0 1 0 0 1 2 0 1
Total 66 51 42 61 40 43 29 23 303Total M+F
TotalForm 7Form 4 Form 5 Form 6
117 103 83 52
St. Louis High School
2272
74
William Goward Memorial School, South Tarawa, Senior Secondary Enrolments by Level, Age and Gender, 2005.
F M F M F M F M13 0 0 0 0 0 0 0 014 5 5 0 0 0 0 0 0 115 23 20 2 2 0 0 0 0 416 14 19 25 20 1 0 0 0 717 5 6 23 17 12 3 1 1 6618 0 1 14 11 34 14 2 1 7419 0 1 1 3 9 7 13 6 220 1 0 0 0 3 5 7 421 0 0 0 0 0 0 0 0
Total 48 52 65 53 59 29 23 12 306Total M+F
TotalForm 7
100 118 88 35
Form 4 Form 5 Form 6William Goward Memorial School
0079
190
District Central District Central Senior Secondary School Enrolments by Gender and Island, 2003 – 2005.
F M T F M T F M T F M TMaiana 0 0 0 0 0 0 0 0 0 0 0 0Kuria 0 0 0 0 0 0 0 0 0 0 0 0Aranuka 0 0 0 0 0 0 0 0 0 0 0 0Abemama 77 38 115 82 48 130 104 96 200 91 95 186Nonouti 68 46 114 88 84 172 145 122 267 111 86 197Total 145 84 229 170 132 302 249 218 467 202 181 383
2002 2003 2004 2005
Digest of Education Statistics 2005 75
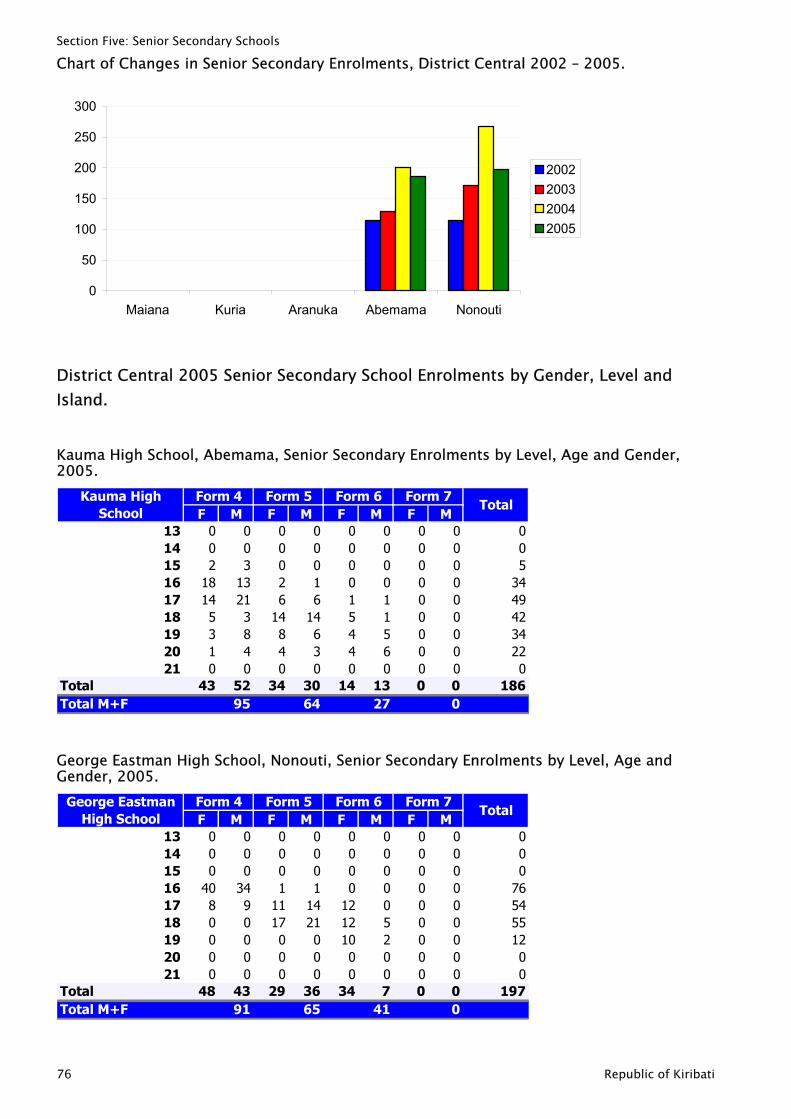
Section Five: Senior Secondary Schools
Chart of Changes in Senior Secondary Enrolments, District Central 2002 – 2005.
0
50
100
150
200
250
300
Maiana Kuria Aranuka Abemama Nonouti
2002200320042005
District Central 2005 Senior Secondary School Enrolments by Gender, Level and Island.
Kauma High School, Abemama, Senior Secondary Enrolments by Level, Age and Gender, 2005.
F M F M F M F M13 0 0 0 0 0 0 0 014 0 0 0 0 0 0 0 015 2 3 0 0 0 0 0 016 18 13 2 1 0 0 0 0 317 14 21 6 6 1 1 0 0 418 5 3 14 14 5 1 0 0 419 3 8 8 6 4 5 0 0 320 1 4 4 3 4 6 0 0 221 0 0 0 0 0 0 0 0
Total 43 52 34 30 14 13 0 0 186Total M+F
Form 7Total
64 27 0
Form 4 Form 5 Form 6
95
Kauma High School
005492420
George Eastman High School, Nonouti, Senior Secondary Enrolments by Level, Age and Gender, 2005.
F M F M F M F M13 0 0 0 0 0 0 0 014 0 0 0 0 0 0 0 015 0 0 0 0 0 0 0 016 40 34 1 1 0 0 0 0 717 8 9 11 14 12 0 0 0 5418 0 0 17 21 12 5 0 0 5519 0 0 0 0 10 2 0 0 120 0 0 0 0 0 0 0 021 0 0 0 0 0 0 0 0
Total 48 43 29 36 34 7 0 0 197Total M+F
Form 4 Form 5 Form 6 Form 7Total
91 65 41 0
George Eastman High School
0006
200
76 Republic of Kiribati
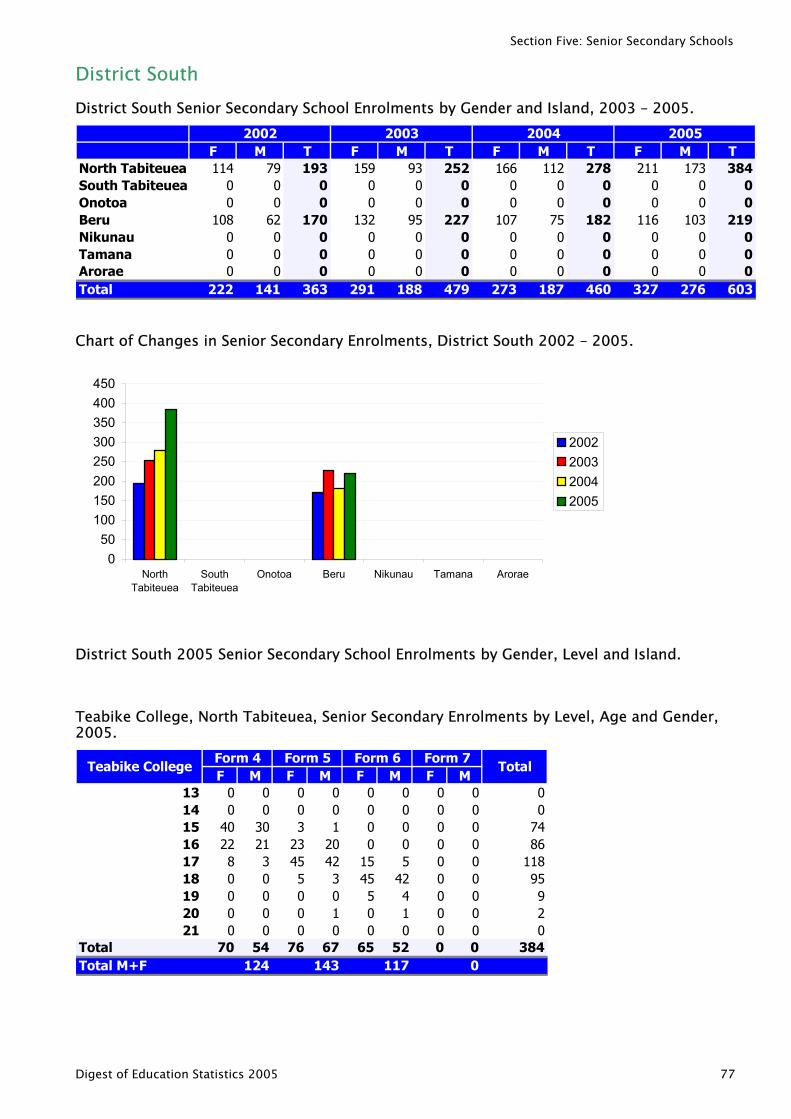
Section Five: Senior Secondary Schools
District South District South Senior Secondary School Enrolments by Gender and Island, 2003 – 2005.
F M T F M T F M T F M TNorth Tabiteuea 114 79 193 159 93 252 166 112 278 211 173 384South Tabiteuea 0 0 0 0 0 0 0 0 0 0 0 0Onotoa 0 0 0 0 0 0 0 0 0 0 0 0Beru 108 62 170 132 95 227 107 75 182 116 103 219Nikunau 0 0 0 0 0 0 0 0 0 0 0 0Tamana 0 0 0 0 0 0 0 0 0 0 0 0Arorae 0 0 0 0 0 0 0 0 0 0 0 0Total 222 141 363 291 188 479 273 187 460 327 276 603
2002 2003 2004 2005
Chart of Changes in Senior Secondary Enrolments, District South 2002 – 2005.
050
100150200250300350400450
NorthTabiteuea
SouthTabiteuea
Onotoa Beru Nikunau Tamana Arorae
2002200320042005
District South 2005 Senior Secondary School Enrolments by Gender, Level and Island.
Teabike College, North Tabiteuea, Senior Secondary Enrolments by Level, Age and Gender, 2005.
F M F M F M F M13 0 0 0 0 0 0 0 014 0 0 0 0 0 0 0 015 40 30 3 1 0 0 0 0 716 22 21 23 20 0 0 0 0 817 8 3 45 42 15 5 0 0 11818 0 0 5 3 45 42 0 0 919 0 0 0 0 5 4 0 020 0 0 0 1 0 1 0 021 0 0 0 0 0 0 0 0
Total 70 54 76 67 65 52 0 0 384Total M+F
Form 7Total
124 143 117 0
Form 4 Form 5 Form 6Teabike College
0046
5920
Digest of Education Statistics 2005 77
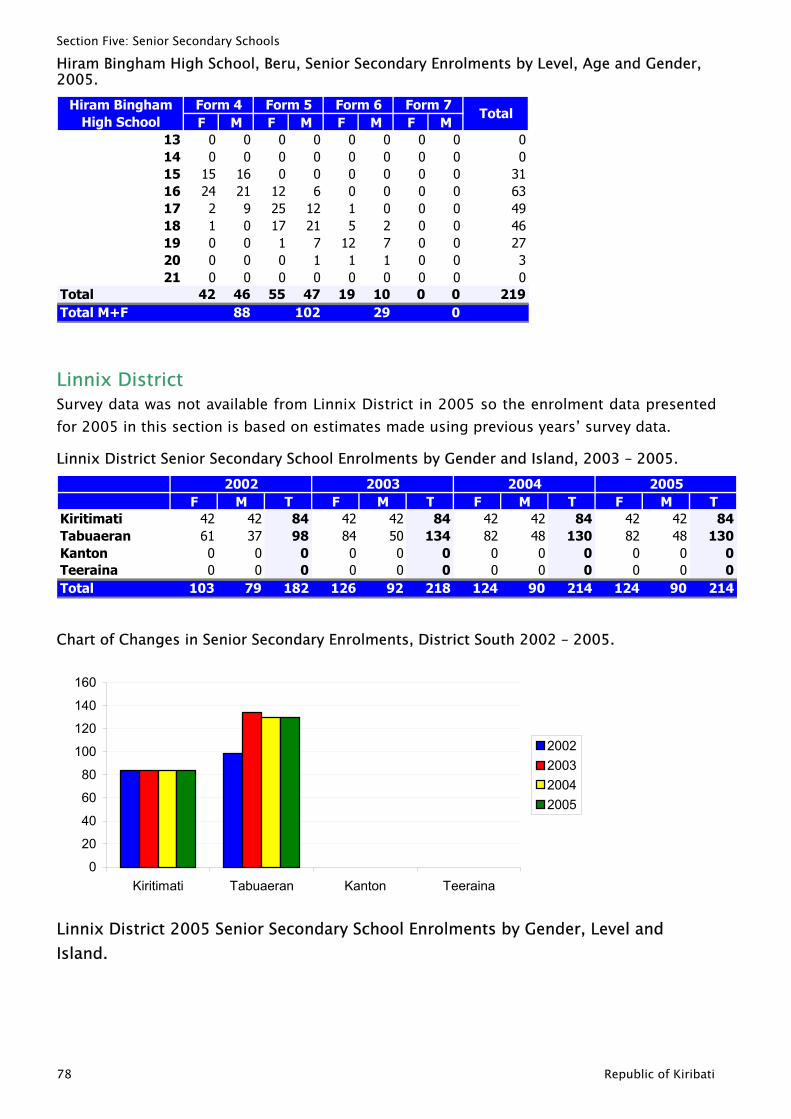
Section Five: Senior Secondary Schools
Hiram Bingham High School, Beru, Senior Secondary Enrolments by Level, Age and Gender, 2005.
F M F M F M F M13 0 0 0 0 0 0 0 014 0 0 0 0 0 0 0 015 15 16 0 0 0 0 0 0 316 24 21 12 6 0 0 0 0 617 2 9 25 12 1 0 0 0 418 1 0 17 21 5 2 0 0 419 0 0 1 7 12 7 0 0 220 0 0 0 1 1 1 0 021 0 0 0 0 0 0 0 0
Total 42 46 55 47 19 10 0 0 219Total M+F
Form 7Total
88 102 29 0
Form 4 Form 5 Form 6Hiram Bingham High School
001396730
Linnix District Survey data was not available from Linnix District in 2005 so the enrolment data presented for 2005 in this section is based on estimates made using previous years’ survey data.
Linnix District Senior Secondary School Enrolments by Gender and Island, 2003 – 2005.
F M T F M T F M T F M TKiritimati 42 42 84 42 42 84 42 42 84 42 42 84Tabuaeran 61 37 98 84 50 134 82 48 130 82 48 130Kanton 0 0 0 0 0 0 0 0 0 0 0 0Teeraina 0 0 0 0 0 0 0 0 0 0 0 0Total 103 79 182 126 92 218 124 90 214 124 90 214
2002 2003 2004 2005
Chart of Changes in Senior Secondary Enrolments, District South 2002 – 2005.
0
20
40
60
80
100
120
140
160
Kiritimati Tabuaeran Kanton Teeraina
2002200320042005
Linnix District 2005 Senior Secondary School Enrolments by Gender, Level and Island.
78 Republic of Kiribati
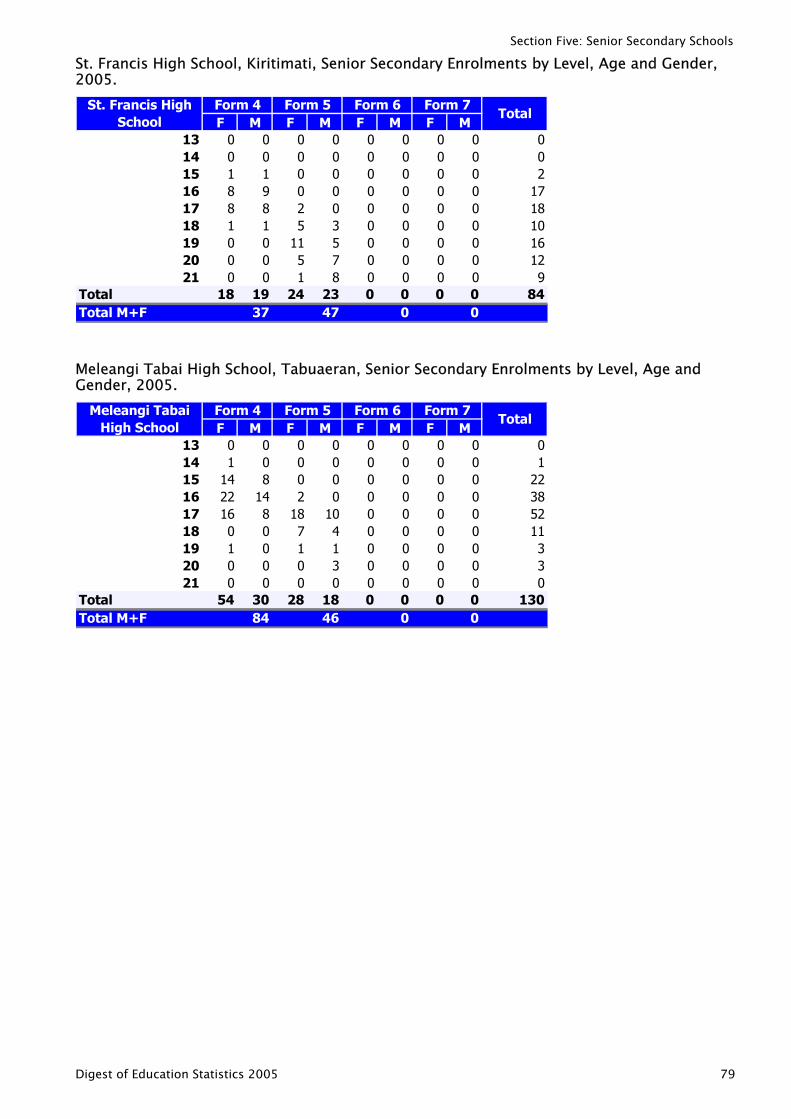
Section Five: Senior Secondary Schools
St. Francis High School, Kiritimati, Senior Secondary Enrolments by Level, Age and Gender, 2005.
F M F M F M F M13 0 0 0 0 0 0 0 014 0 0 0 0 0 0 0 015 1 1 0 0 0 0 0 016 8 9 0 0 0 0 0 0 117 8 8 2 0 0 0 0 0 118 1 1 5 3 0 0 0 0 119 0 0 11 5 0 0 0 0 120 0 0 5 7 0 0 0 0 121 0 0 1 8 0 0 0 0
Total 18 19 24 23 0 0 0 0 8Total M+F
Total
37 47 0 0
Form 4 Form 5 Form 6 Form 7St. Francis High School
0027806294
Meleangi Tabai High School, Tabuaeran, Senior Secondary Enrolments by Level, Age and Gender, 2005.
F M F M F M F M13 0 0 0 0 0 0 0 014 1 0 0 0 0 0 0 015 14 8 0 0 0 0 0 0 216 22 14 2 0 0 0 0 0 317 16 8 18 10 0 0 0 0 518 0 0 7 4 0 0 0 0 119 1 0 1 1 0 0 0 020 0 0 0 3 0 0 0 021 0 0 0 0 0 0 0 0
Total 54 30 28 18 0 0 0 0 13Total M+F
Total
84 46 0 0
Form 4 Form 5 Form 6 Form 7Meleangi Tabai High School
0128213300
Digest of Education Statistics 2005 79
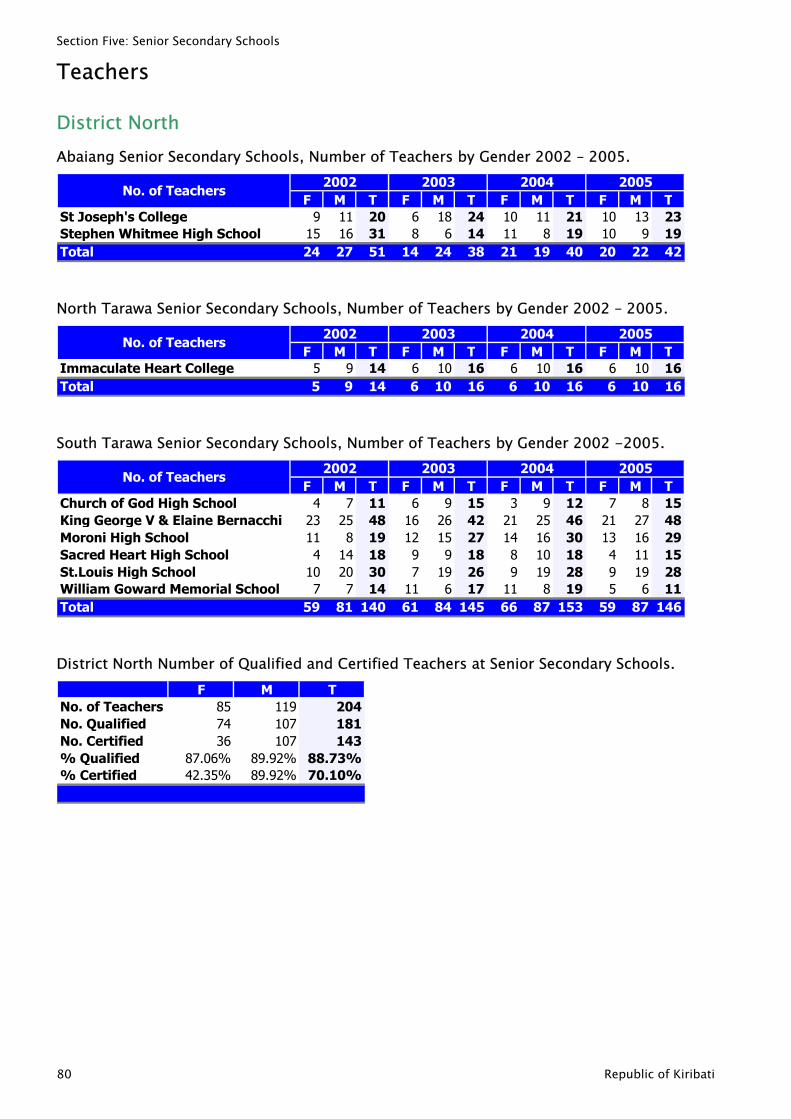
Section Five: Senior Secondary Schools
Teachers
District North Abaiang Senior Secondary Schools, Number of Teachers by Gender 2002 – 2005.
F M T F M T F M T F M TSt Joseph's College 9 11 20 6 18 24 10 11 21 10 13 23Stephen Whitmee High School 15 16 31 8 6 14 11 8 19 10 9 19Total 24 27 51 14 24 38 21 19 40 20 22 42
2003 2004 2005No. of Teachers
2002
North Tarawa Senior Secondary Schools, Number of Teachers by Gender 2002 – 2005.
F M T F M T F M T F M TImmaculate Heart College 5 9 14 6 10 16 6 10 16 6 10 16Total 5 9 14 6 10 16 6 10 16 6 10 16
2003 2004 2005No. of Teachers
2002
South Tarawa Senior Secondary Schools, Number of Teachers by Gender 2002 -2005.
F M T F M T F M T F M TChurch of God High School 4 7 11 6 9 15 3 9 12 7 8 15King George V & Elaine Bernacchi 23 25 48 16 26 42 21 25 46 21 27 48Moroni High School 11 8 19 12 15 27 14 16 30 13 16 29Sacred Heart High School 4 14 18 9 9 18 8 10 18 4 11 15St.Louis High School 10 20 30 7 19 26 9 19 28 9 19 28William Goward Memorial School 7 7 14 11 6 17 11 8 19 5 6 11Total 59 81 140 61 84 145 66 87 153 59 87 146
No. of Teachers2002 2003 2004 2005
District North Number of Qualified and Certified Teachers at Senior Secondary Schools. F M T
No. of Teachers 85 119 204No. Qualified 74 107 181No. Certified 36 107 143% Qualified 87.06% 89.92% 88.73%% Certified 42.35% 89.92% 70.10%
80 Republic of Kiribati
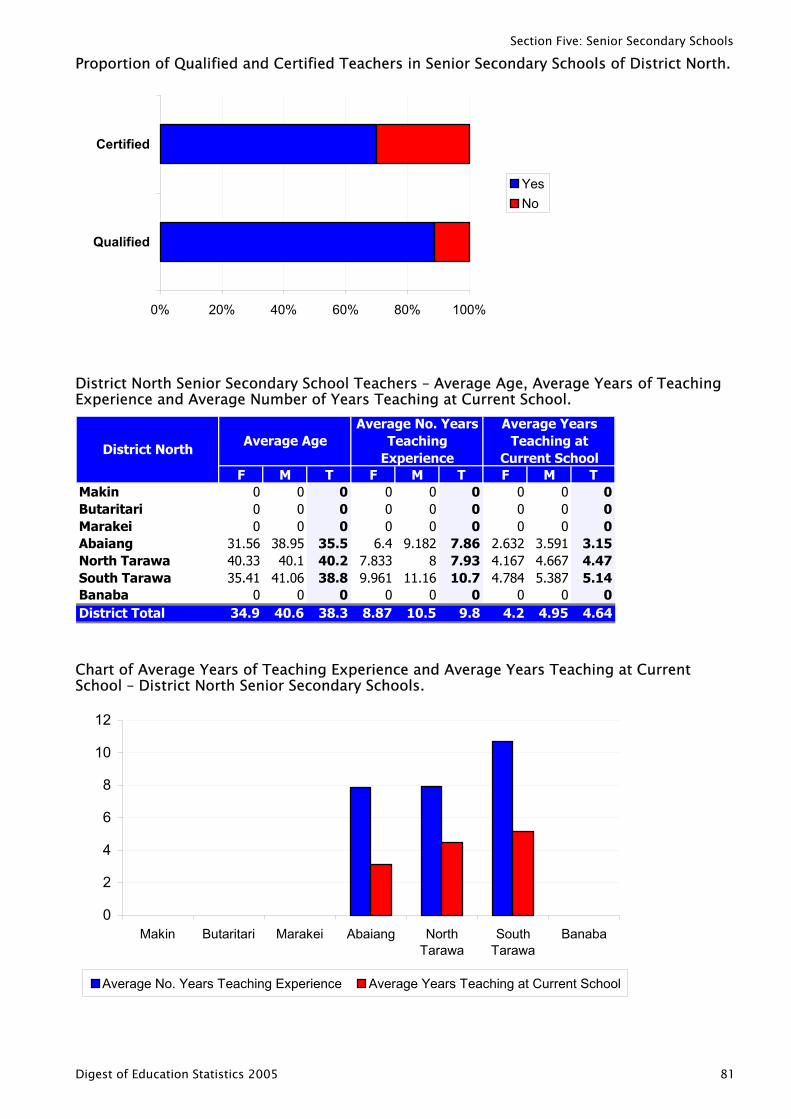
Section Five: Senior Secondary Schools
Proportion of Qualified and Certified Teachers in Senior Secondary Schools of District North.
0% 20% 40% 60% 80% 100%
Qualified
Certified
YesNo
District North Senior Secondary School Teachers – Average Age, Average Years of Teaching Experience and Average Number of Years Teaching at Current School.
F M T F M T F M TMakin 0 0 0 0 0 0 0 0 0Butaritari 0 0 0 0 0 0 0 0 0Marakei 0 0 0 0 0 0 0 0 0Abaiang 31.56 38.95 35.5 6.4 9.182 7.86 2.632 3.591 3.15North Tarawa 40.33 40.1 40.2 7.833 8 7.93 4.167 4.667 4.47South Tarawa 35.41 41.06 38.8 9.961 11.16 10.7 4.784 5.387 5.14Banaba 0 0 0 0 0 0 0 0 0District Total 34.9 40.6 38.3 8.87 10.5 9.8 4.2 4.95 4.64
District NorthAverage Age
Average No. Years Teaching
Experience
Average Years Teaching at
Current School
Chart of Average Years of Teaching Experience and Average Years Teaching at Current School – District North Senior Secondary Schools.
0
2
4
6
8
10
12
Makin Butaritari Marakei Abaiang NorthTarawa
SouthTarawa
Banaba
Average No. Years Teaching Experience Average Years Teaching at Current School
Digest of Education Statistics 2005 81
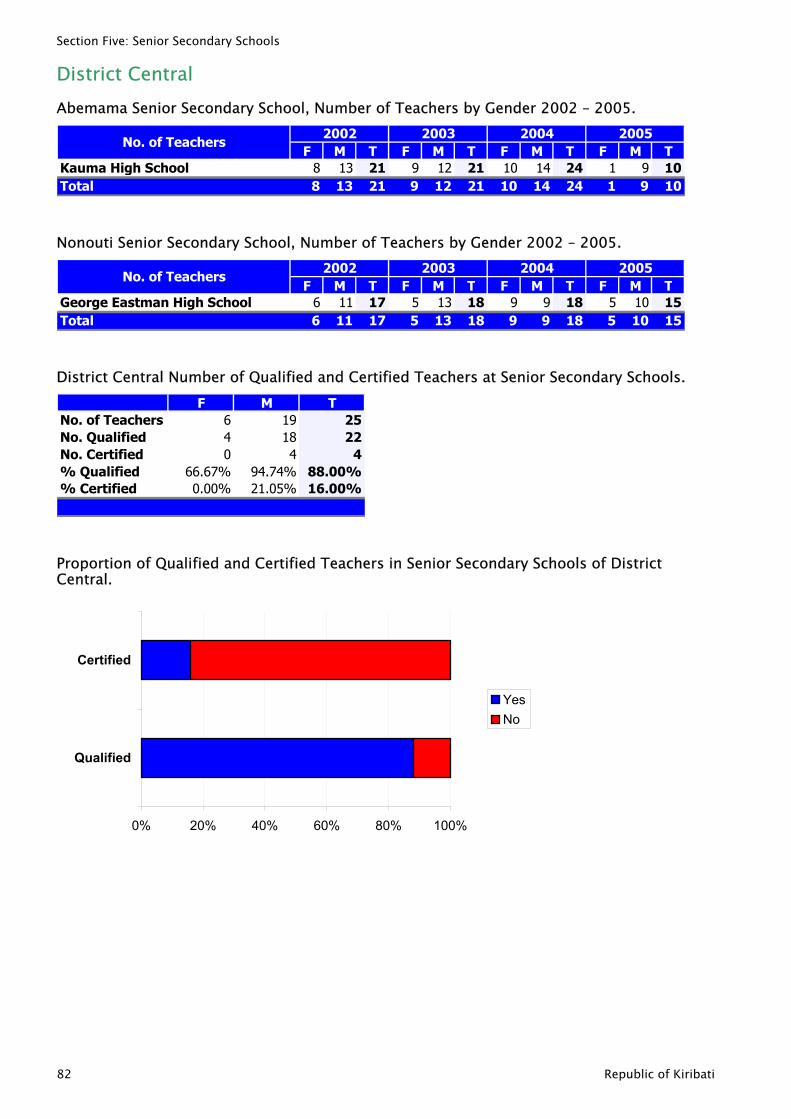
Section Five: Senior Secondary Schools
District Central Abemama Senior Secondary School, Number of Teachers by Gender 2002 – 2005.
F M T F M T F M T F M TKauma High School 8 13 21 9 12 21 10 14 24 1 9 10Total 8 13 21 9 12 21 10 14 24 1 9 10
2005No. of Teachers
2002 2003 2004
Nonouti Senior Secondary School, Number of Teachers by Gender 2002 – 2005.
F M T F M T F M T F M TGeorge Eastman High School 6 11 17 5 13 18 9 9 18 5 10 15Total 6 11 17 5 13 18 9 9 18 5 10 15
No. of Teachers2002 2003 2004 2005
District Central Number of Qualified and Certified Teachers at Senior Secondary Schools. F M T
No. of Teachers 6 19 25No. Qualified 4 18 22No. Certified 0 4 4% Qualified 66.67% 94.74% 88.00%% Certified 0.00% 21.05% 16.00%
Proportion of Qualified and Certified Teachers in Senior Secondary Schools of District Central.
0% 20% 40% 60% 80% 100%
Qualified
Certified
YesNo
82 Republic of Kiribati
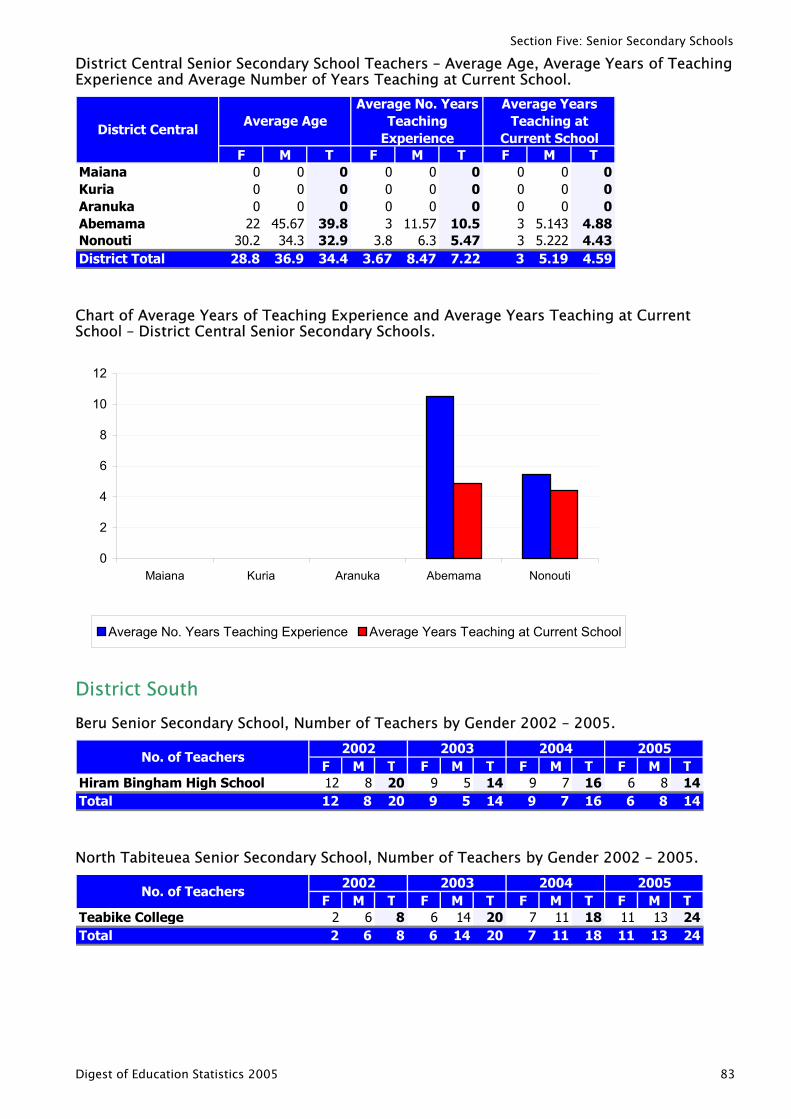
Section Five: Senior Secondary Schools
District Central Senior Secondary School Teachers – Average Age, Average Years of Teaching Experience and Average Number of Years Teaching at Current School.
F M T F M T F M TMaiana 0 0 0 0 0 0 0 0 0Kuria 0 0 0 0 0 0 0 0 0Aranuka 0 0 0 0 0 0 0 0 0Abemama 22 45.67 39.8 3 11.57 10.5 3 5.143 4.88Nonouti 30.2 34.3 32.9 3.8 6.3 5.47 3 5.222 4.43District Total 28.8 36.9 34.4 3.67 8.47 7.22 3 5.19 4.59
District CentralAverage Age
Average No. Years Teaching
Experience
Average Years Teaching at
Current School
Chart of Average Years of Teaching Experience and Average Years Teaching at Current School – District Central Senior Secondary Schools.
0
2
4
6
8
10
12
Maiana Kuria Aranuka Abemama Nonouti
Average No. Years Teaching Experience Average Years Teaching at Current School
District South Beru Senior Secondary School, Number of Teachers by Gender 2002 – 2005.
F M T F M T F M T F M THiram Bingham High School 12 8 20 9 5 14 9 7 16 6 8 14Total 12 8 20 9 5 14 9 7 16 6 8 1
2003 2004 2005No. of Teachers
2002
4
North Tabiteuea Senior Secondary School, Number of Teachers by Gender 2002 – 2005.
F M T F M T F M T F M TTeabike College 2 6 8 6 14 20 7 11 18 11 13 24Total 2 6 8 6 14 20 7 11 18 11 13 2
No. of Teachers2002 2003 2004 2005
4
Digest of Education Statistics 2005 83
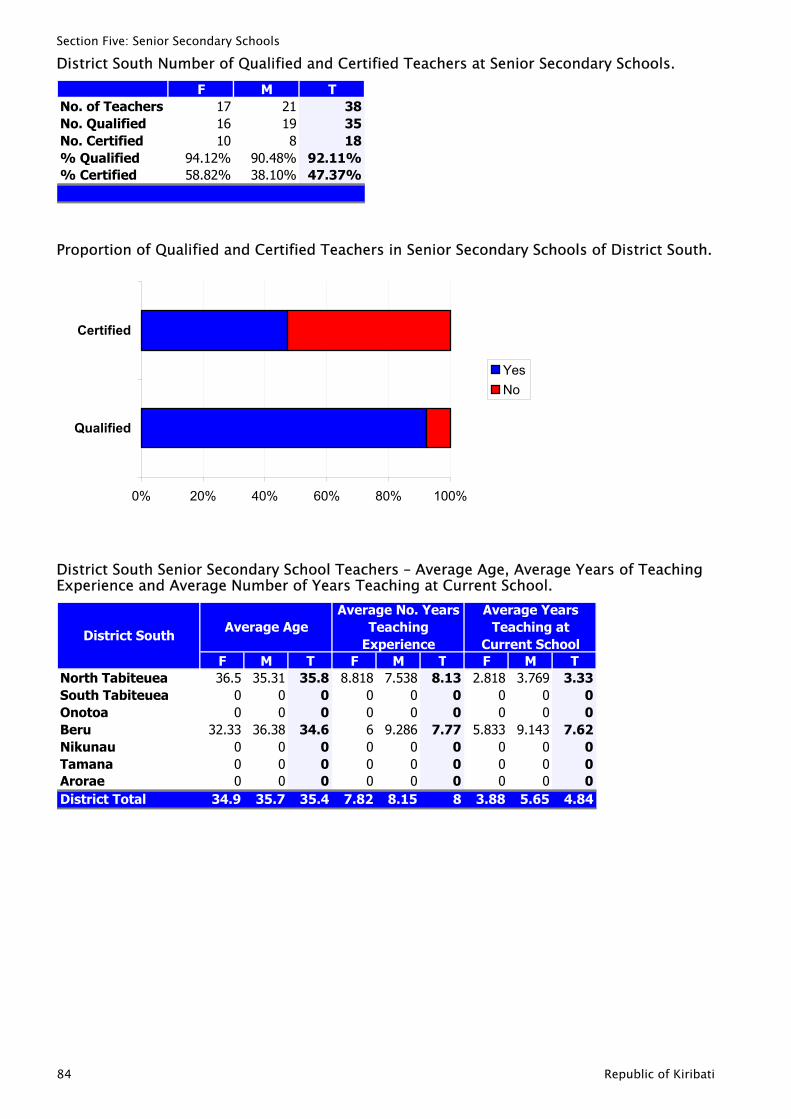
Section Five: Senior Secondary Schools
District South Number of Qualified and Certified Teachers at Senior Secondary Schools. F M T
No. of Teachers 17 21 38No. Qualified 16 19 35No. Certified 10 8 18% Qualified 94.12% 90.48% 92.11%% Certified 58.82% 38.10% 47.37%
Proportion of Qualified and Certified Teachers in Senior Secondary Schools of District South.
0% 20% 40% 60% 80% 100%
Qualified
Certified
YesNo
District South Senior Secondary School Teachers – Average Age, Average Years of Teaching Experience and Average Number of Years Teaching at Current School.
F M T F M T F M TNorth Tabiteuea 36.5 35.31 35.8 8.818 7.538 8.13 2.818 3.769 3.33South Tabiteuea 0 0 0 0 0 0 0 0 0Onotoa 0 0 0 0 0 0 0 0 0Beru 32.33 36.38 34.6 6 9.286 7.77 5.833 9.143 7.62Nikunau 0 0 0 0 0 0 0 0 0Tamana 0 0 0 0 0 0 0 0 0Arorae 0 0 0 0 0 0 0 0 0District Total 34.9 35.7 35.4 7.82 8.15 8 3.88 5.65 4.84
District SouthAverage Age
Average No. Years Teaching
Experience
Average Years Teaching at
Current School
84 Republic of Kiribati
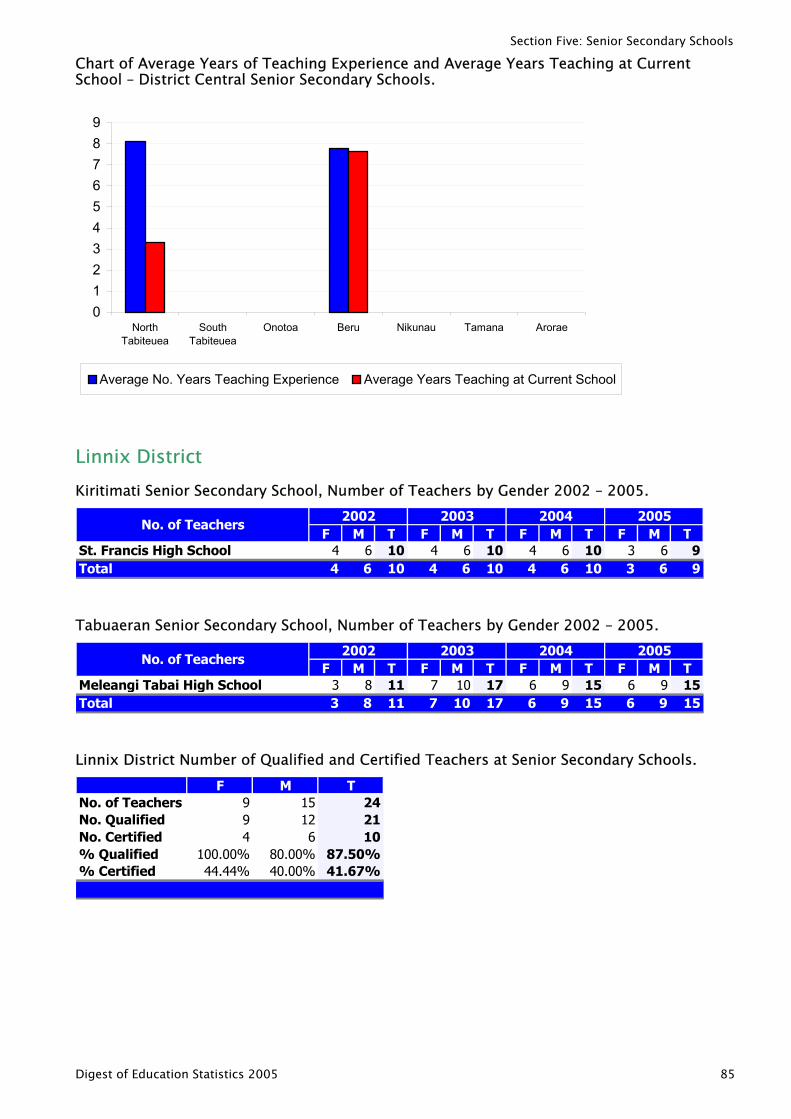
Section Five: Senior Secondary Schools
Chart of Average Years of Teaching Experience and Average Years Teaching at Current School – District Central Senior Secondary Schools.
0123456789
NorthTabiteuea
SouthTabiteuea
Onotoa Beru Nikunau Tamana Arorae
Average No. Years Teaching Experience Average Years Teaching at Current School
Linnix District Kiritimati Senior Secondary School, Number of Teachers by Gender 2002 – 2005.
F M T F M T F M T F M TSt. Francis High School 4 6 10 4 6 10 4 6 10 3 6 9Total 4 6 10 4 6 10 4 6 10 3 6 9
2005No. of Teachers
2002 2003 2004
Tabuaeran Senior Secondary School, Number of Teachers by Gender 2002 – 2005.
F M T F M T F M T F M TMeleangi Tabai High School 3 8 11 7 10 17 6 9 15 6 9 15Total 3 8 11 7 10 17 6 9 15 6 9 15
No. of Teachers2002 2003 2004 2005
Linnix District Number of Qualified and Certified Teachers at Senior Secondary Schools. F M T
No. of Teachers 9 15 24No. Qualified 9 12 21No. Certified 4 6 10% Qualified 100.00% 80.00% 87.50%% Certified 44.44% 40.00% 41.67%
Digest of Education Statistics 2005 85
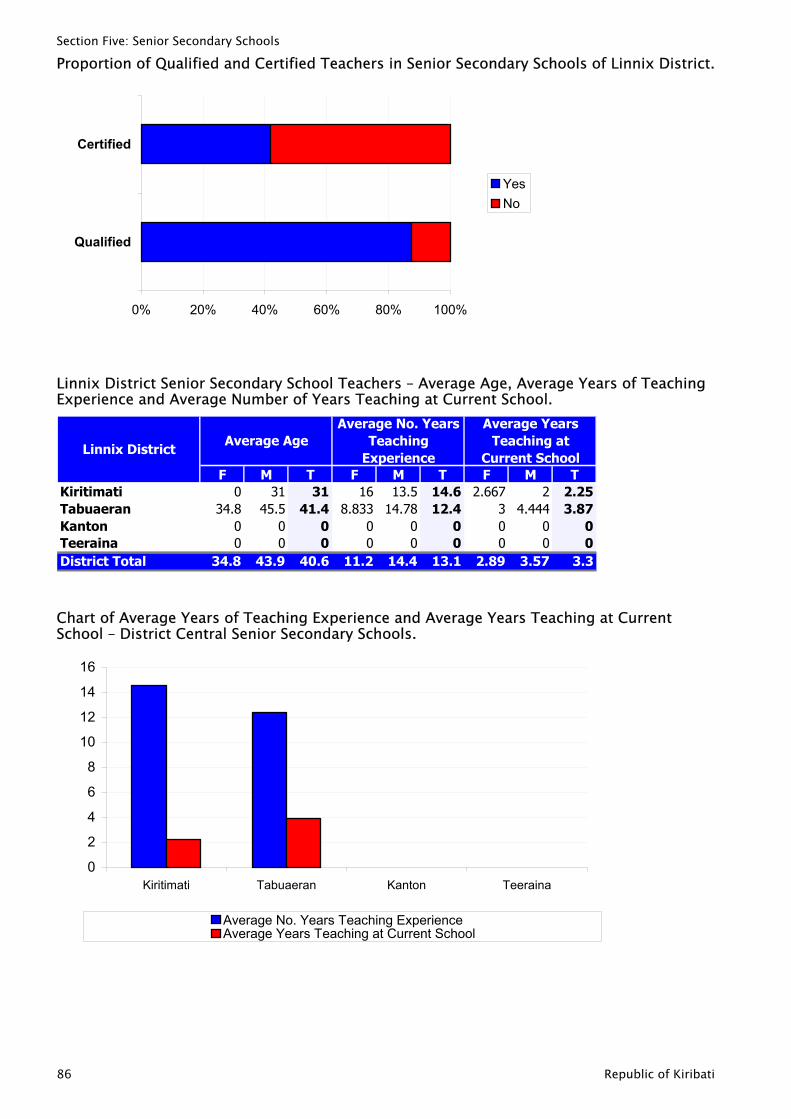
Section Five: Senior Secondary Schools
Proportion of Qualified and Certified Teachers in Senior Secondary Schools of Linnix District.
0% 20% 40% 60% 80% 100%
Qualified
Certified
YesNo
Linnix District Senior Secondary School Teachers – Average Age, Average Years of Teaching Experience and Average Number of Years Teaching at Current School.
F M T F M T F M TKiritimati 0 31 31 16 13.5 14.6 2.667 2 2.25Tabuaeran 34.8 45.5 41.4 8.833 14.78 12.4 3 4.444 3.87Kanton 0 0 0 0 0 0 0 0 0Teeraina 0 0 0 0 0 0 0 0 0District Total 34.8 43.9 40.6 11.2 14.4 13.1 2.89 3.57 3.3
Linnix DistrictAverage Age
Average No. Years Teaching
Experience
Average Years Teaching at
Current School
Chart of Average Years of Teaching Experience and Average Years Teaching at Current School – District Central Senior Secondary Schools.
0
2
4
6
8
10
12
14
16
Kiritimati Tabuaeran Kanton Teeraina
Average No. Years Teaching ExperienceAverage Years Teaching at Current School
86 Republic of Kiribati
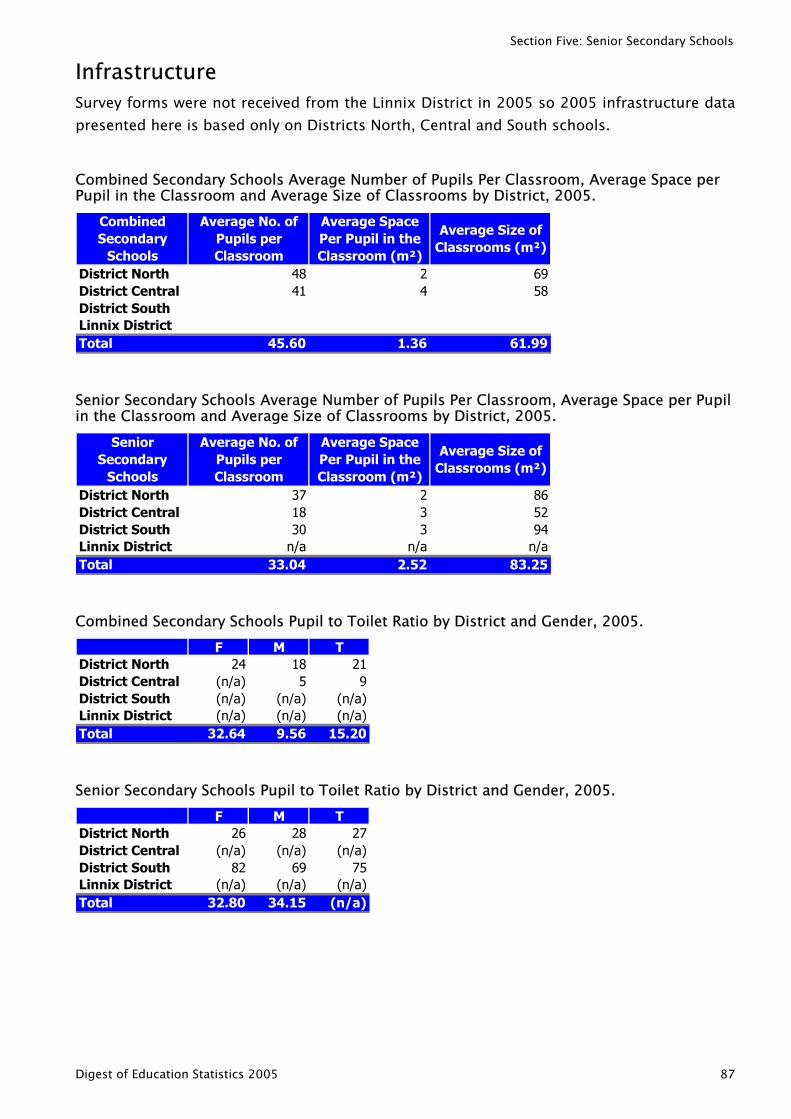
Section Five: Senior Secondary Schools
Infrastructure Survey forms were not received from the Linnix District in 2005 so 2005 infrastructure data presented here is based only on Districts North, Central and South schools.
Combined Secondary Schools Average Number of Pupils Per Classroom, Average Space per Pupil in the Classroom and Average Size of Classrooms by District, 2005.
District NorthDistrict CentralDistrict SouthLinnix DistrictTotal
Combined Secondary
Schools
Average No. of Pupils per Classroom
Average Space Per Pupil in the Classroom (m²)
Average Size of Classrooms (m²)
48 2 6941 4 58
45.60 1.36 61.99
Senior Secondary Schools Average Number of Pupils Per Classroom, Average Space per Pupil in the Classroom and Average Size of Classrooms by District, 2005.
District NorthDistrict CentralDistrict SouthLinnix DistrictTotal
Senior Secondary
Schools
Average No. of Pupils per Classroom
Average Space Per Pupil in the Classroom (m²)
Average Size of Classrooms (m²)
37 2 8618 3 52
33.04 2.52 83.25
30 3 94n/a n/a n/a
Combined Secondary Schools Pupil to Toilet Ratio by District and Gender, 2005. F M T
District North 24 18 21District Central (n/a) 5 9District South (n/a) (n/a) (n/a)Linnix District (n/a) (n/a) (n/a)Total 32.64 9.56 15.20
Senior Secondary Schools Pupil to Toilet Ratio by District and Gender, 2005. F M T
District North 26 28 27District Central (n/a) (n/a) (n/a)District South 82 69 75Linnix District (n/a) (n/a) (n/a)Total 32.80 34.15 (n/a)
Digest of Education Statistics 2005 87
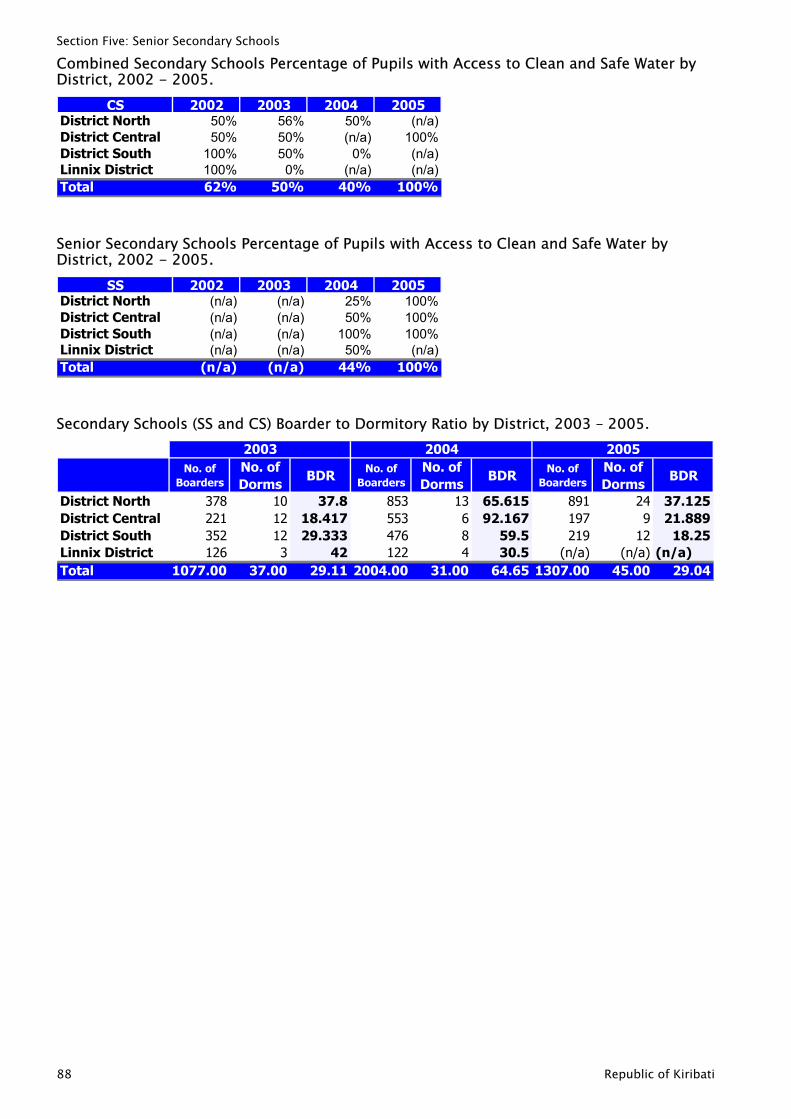
Section Five: Senior Secondary Schools
Combined Secondary Schools Percentage of Pupils with Access to Clean and Safe Water by District, 2002 - 2005.
CS 2002 2003 2004 2005District North 50% 56% 50% (n/a)District Central 50% 50% (n/a) 100%District South 100% 50% 0% (n/a)Linnix District 100% 0% (n/a) (n/a)Total 62% 50% 40% 100%
Senior Secondary Schools Percentage of Pupils with Access to Clean and Safe Water by District, 2002 - 2005.
SS 2002 2003 2004 2005District North (n/a) (n/a) 25% 100%District Central (n/a) (n/a) 50% 100%District South (n/a) (n/a) 100% 100%Linnix District (n/a) (n/a) 50% (n/a)Total (n/a) (n/a) 44% 100%
Secondary Schools (SS and CS) Boarder to Dormitory Ratio by District, 2003 – 2005.
No. of Boarders
No. of Dorms
BDR No. of Boarders
No. of Dorms
BDR No. of Boarders
No. of Dorms
BDR
District North 378 10 37.8 853 13 65.615 891 24 37.125District Central 221 12 18.417 553 6 92.167 197 9 21.889District South 352 12 29.333 476 8 59.5 219 12 18.25Linnix District 126 3 42 122 4 30.5 (n/a) (n/a) (n/a)Total 1077.00 37.00 29.11 2004.00 31.00 64.65 1307.00 45.00 29.04
2003 2004 2005
88 Republic of Kiribati
Appendix
Appendix
Digest of Education Statistics 2005 89
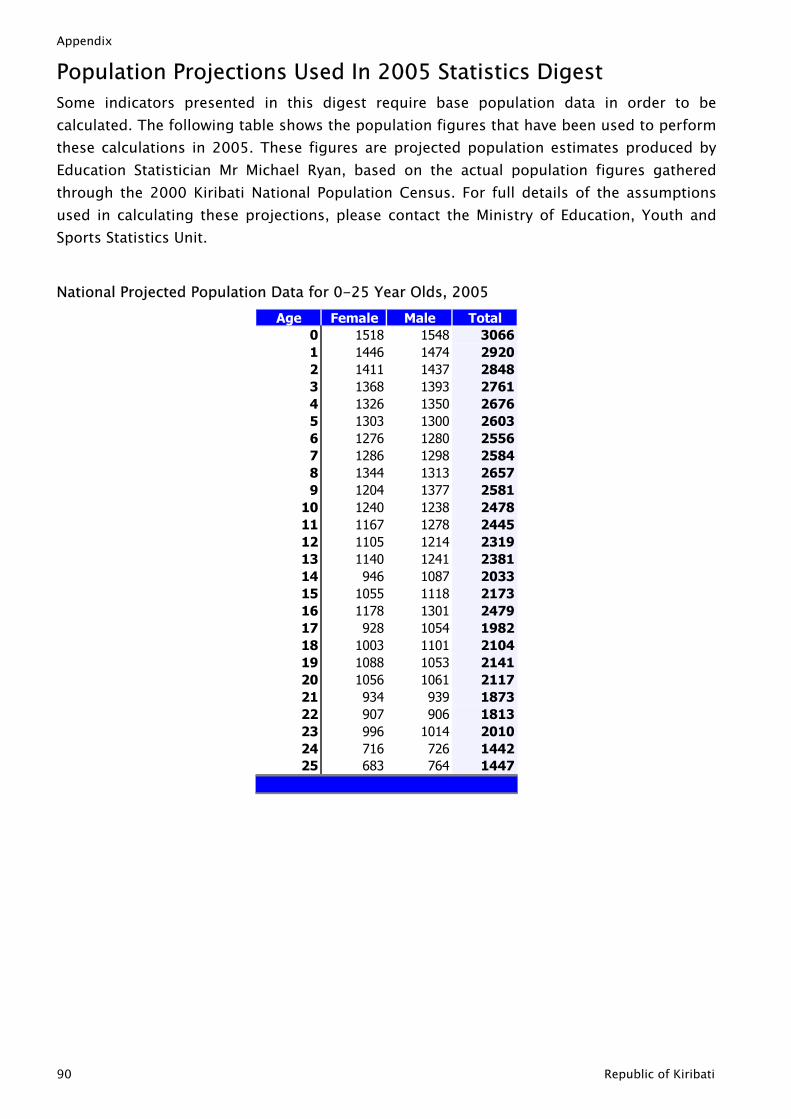
Appendix
90 Republic of Kiribati
Population Projections Used In 2005 Statistics Digest Some indicators presented in this digest require base population data in order to be calculated. The following table shows the population figures that have been used to perform these calculations in 2005. These figures are projected population estimates produced by Education Statistician Mr Michael Ryan, based on the actual population figures gathered through the 2000 Kiribati National Population Census. For full details of the assumptions used in calculating these projections, please contact the Ministry of Education, Youth and Sports Statistics Unit.
National Projected Population Data for 0-25 Year Olds, 2005 Age Female Male Total
0 1518 1548 30661 1446 1474 29202 1411 1437 28483 1368 1393 27614 1326 1350 26765 1303 1300 26036 1276 1280 25567 1286 1298 25848 1344 1313 26579 1204 1377 2581
10 1240 1238 247811 1167 1278 244512 1105 1214 231913 1140 1241 238114 946 1087 203315 1055 1118 217316 1178 1301 247917 928 1054 198218 1003 1101 210419 1088 1053 214120 1056 1061 211721 934 939 187322 907 906 181323 996 1014 201024 716 726 144225 683 764 1447