Embed Size (px)
Citation preview

REPUBLIC OF RWANDA
Ministry of Agriculture and Animal Resources
(MINAGRI)
BUSINESS PLAN OF RUBIRIZI HATCHERY
FINAL DOCUMENT
JULY 2012
CONTENTS
REASONS FOR THE RECOVERY OF THE RUBIRIZI HATCHERY AND IMPLEMENTATION OF DECENTRALIZED MINI-HATCHERIES _________________________________________________ 3
1 ASSUMPTIONS ______________________________________________________________ 4
1.1 Rates for Layers ________________________________________________________________ 5
1.2 Rates of Broilers _______________________________________________________________ 6
1.3 Egg consumption _______________________________________________________________ 8
1.4 Others income _________________________________________________________________ 8
1.5 Production forecast: ____________________________________________________________ 8
2 BUSINESS PLAN ____________________________________________________________ 13
2.1 Resources ___________________________________________________________________ 13
2.2 Rubilizi Share Capital __________________________________________________________ 14
2.3 Focus in Private sector shareholders ______________________________________________ 14
2.4 Depreciation Table ____________________________________________________________ 14
2.5 Debt service __________________________________________________________________ 14
2.6 Salaries (*1000) _______________________________________________________________ 15
2.7 Income Account_______________________________________________________________ 16
2.8 Working capital needs _________________________________________________________ 17
2.9 Accounting results _____________________________________________________________ 18
ANNEX: Business Model of Mini Hatchery ___________________________________________ 21
Page 3/22
REASONS FOR THE RECOVERY OF THE RUBIRIZI HATCHERY AND IMPLEMENTATION OF
DECENTRALIZED MINI-HATCHERIES
Four reasons can be advanced:
- Consistency with the decision of public authorities to make the private sector the lever for the development of livestock in Rwanda
- Responsiveness that requires daily management of a hatchery doesn’t fit well with the administrative burden
- Although not having the hatchery's cost accounting information, we can say without doubt that the current management is in deficit; it couldn’t be otherwise with such low fertility and hatching rates. Thus, the state budget subsidizes an activity that could be profitable in the hands of private operators.
- The immense attraction of potential investors for the privatization of the Rubirizi hatchery: the public authorities should have no difficulty in passing the baton to private investors, as their interest is evident. This should be done in Public Private Partnership, with the government retaining ownership of premises and facilities.
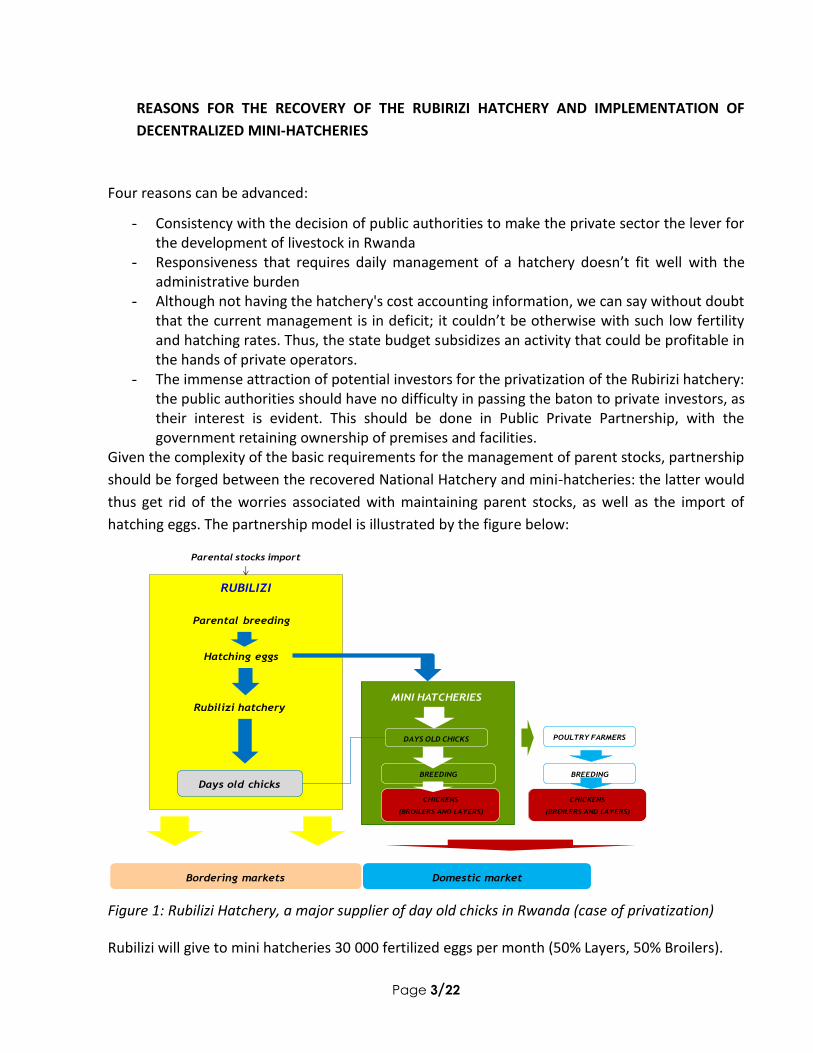
Given the complexity of the basic requirements for the management of parent stocks, partnership
should be forged between the recovered National Hatchery and mini-hatcheries: the latter would
thus get rid of the worries associated with maintaining parent stocks, as well as the import of
hatching eggs. The partnership model is illustrated by the figure below:
Figure 1: Rubilizi Hatchery, a major supplier of day old chicks in Rwanda (case of privatization)
Rubilizi will give to mini hatcheries 30 000 fertilized eggs per month (50% Layers, 50% Broilers).
RUBILIZI
Parental stocks import
Parental breeding
Hatching eggs
Rubilizi hatcheryMINI HATCHERIES
Days old chicks
Domestic marketBordering markets
DAYS OLD CHICKS
BREEDING
CHICKENS
(BROILERS AND LAYERS)
POULTRY FARMERS
BREEDING
CHICKENS
(BROILERS AND LAYERS)
Page 4/22
1 ASSUMPTIONS
Assumptions were developed using data:
Provided by the RAB on the cost structure of production and performance rates at the Rubirizi hatchery (Dr Christine KANYANDEKWE, Dr Alphonse NSHIMIYIMANA and Dr Landry Ndriko MAYIGANE)
Available from the firm AFRIQUE EMERGENCE CONSEIL (data on business plans in the EAC region and WAEMU).
The current hatchery patrimony (buildings and equipment) is estimated at 300 000 000 RWF. With the privatization of Rubirizi hatchery, there will be an opening up of capital to the private sector and the latter will be the majority shareholder with 70% against 30% for the Rwandan government. The contribution of private sector capital will be done in two ways: a fluid intake amounting to 200 million RWF and a bank loan of 487 850 666 RWF. The interest rate used is 15% that is commonly applied in Rwandan banks . Reimbursement will be made over 5 years. There will be a grace period of 2 years.
This amount of money will be a boost to the hatchery enabling an upgrade to:
- The requirements and biosecurity requirements (farm modernization for parent stock breeding, food storage silos, water system and insulation)
- Turn into a profit-oriented company.
Investments scheduled are the compliance of local areas and the extension of the parent stock farming system. Vehicles and motorbikes for the hatchery staff, a water tank with a capacity of 4000L and a new incubator of 60 000 pcs will be purchased.
The hatchery will ensure the supply of 150,000 DOCs per month at the national level (41% of the local market) to substitute for imports from Uganda, Kenya and significantly reduce imports from Belgium. Thus, it is planned to buy a feed mixer to prepare the poultry feed ingredients, waiting for the feed industry to emerge. The hatchery will also have software for the monitoring of all operations.
The hatchery privatized team will consist of:
- A CEO - A DVM, Head of Operations assisted by
o 2 Animal technicians o 6 foremen in charge of conducting process
Page 5/22
o 5 Disinfection and Cleaning Agents - A Finance Manager Accounting - A Head of Maintenance assisted by two Maintenance chiefs - A Marketing Manager assisted by a Sales Agent - 1 Messenger
1 keeper
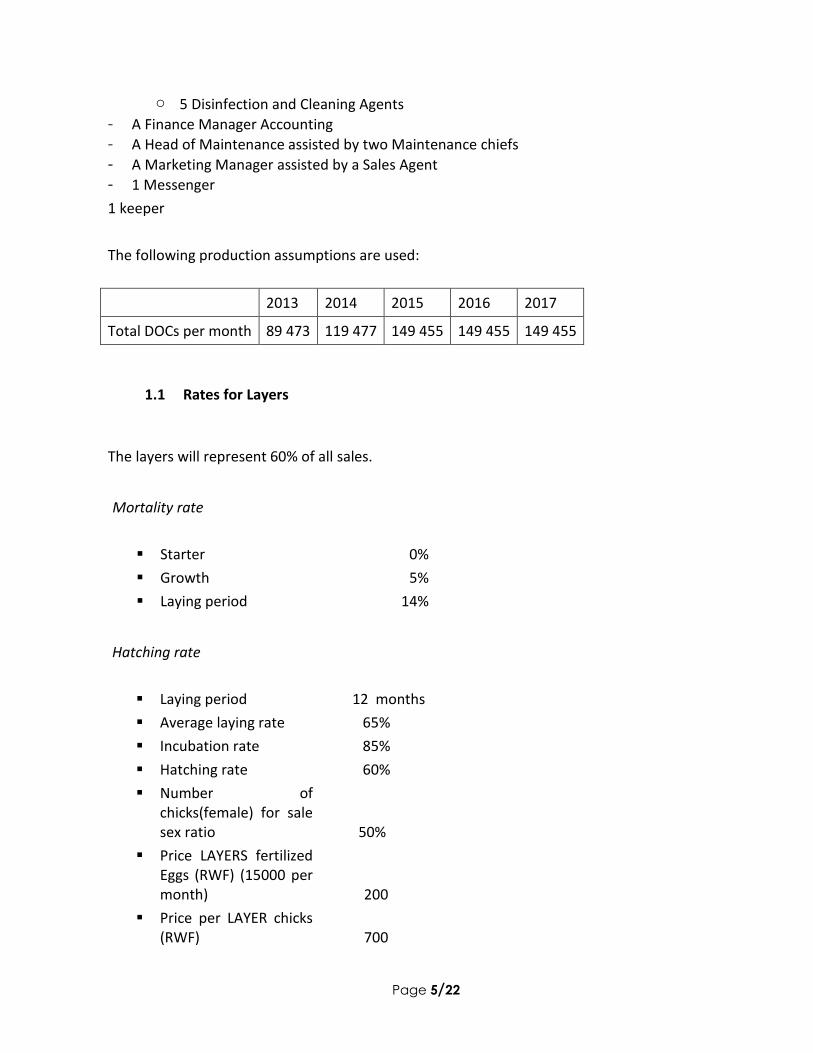
The following production assumptions are used:
2013 2014 2015 2016 2017
Total DOCs per month 89 473 119 477 149 455 149 455 149 455
1.1 Rates for Layers
The layers will represent 60% of all sales.
Mortality rate
Starter 0%
Growth 5%
Laying period 14%
Hatching rate
Laying period 12 months
Average laying rate 65%
Incubation rate 85%
Hatching rate 60%
Number of chicks(female) for sale sex ratio 50%
Price LAYERS fertilized Eggs (RWF) (15000 per month) 200
Price per LAYER chicks (RWF) 700
Page 6/22
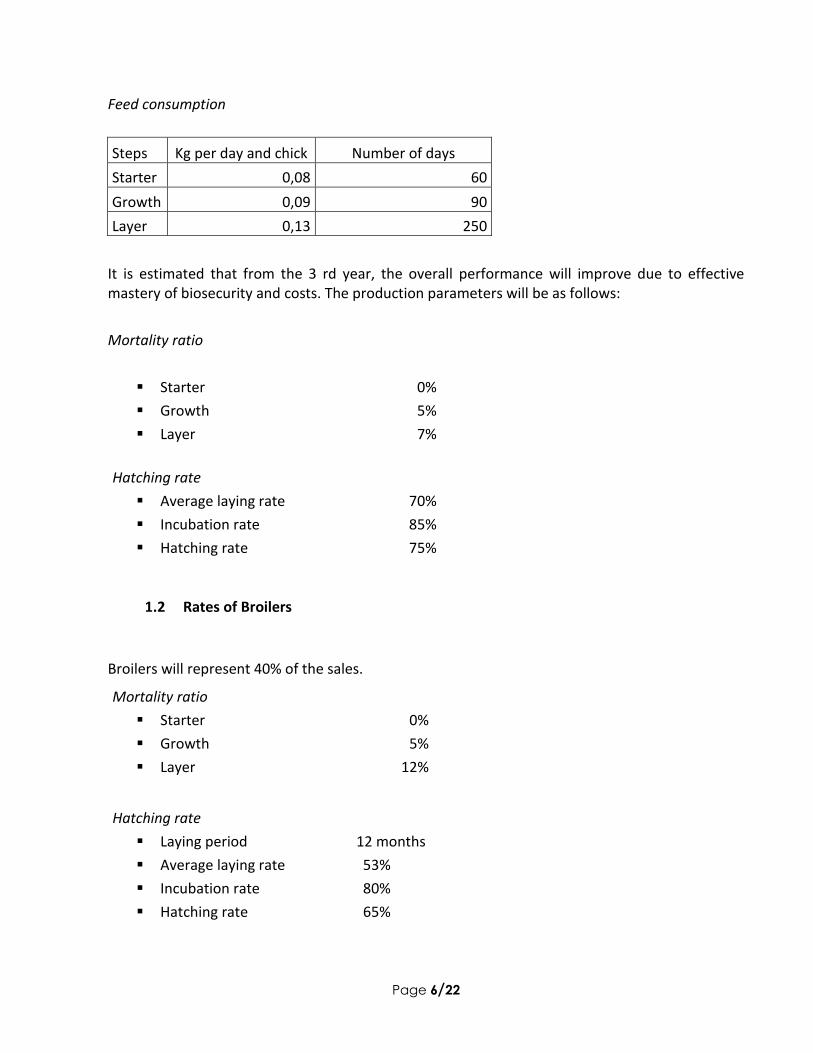
Feed consumption
Steps Kg per day and chick Number of days
Starter 0,08 60
Growth 0,09 90
Layer 0,13 250
It is estimated that from the 3 rd year, the overall performance will improve due to effective mastery of biosecurity and costs. The production parameters will be as follows:
Mortality ratio
Starter 0%
Growth 5%
Layer 7%
Hatching rate
Average laying rate 70%
Incubation rate 85%
Hatching rate 75%
1.2 Rates of Broilers
Broilers will represent 40% of the sales.
Mortality ratio
Starter 0%
Growth 5%
Layer 12%
Hatching rate
Laying period 12 months
Average laying rate 53%
Incubation rate 80%
Hatching rate 65%
Page 7/22
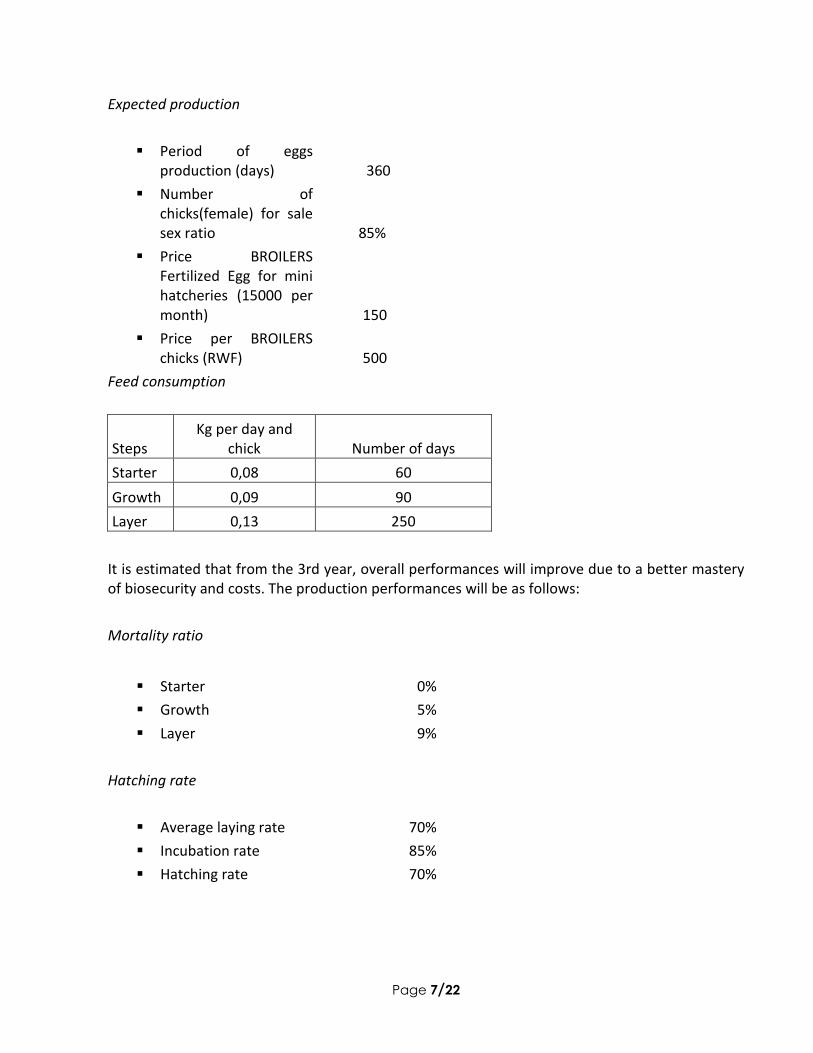
Expected production
Period of eggs production (days) 360
Number of chicks(female) for sale sex ratio 85%
Price BROILERS Fertilized Egg for mini hatcheries (15000 per month) 150
Price per BROILERS chicks (RWF) 500
Feed consumption
Steps Kg per day and
chick Number of days
Starter 0,08 60
Growth 0,09 90
Layer 0,13 250
It is estimated that from the 3rd year, overall performances will improve due to a better mastery of biosecurity and costs. The production performances will be as follows:
Mortality ratio
Starter 0%
Growth 5%
Layer 9%
Hatching rate
Average laying rate 70%
Incubation rate 85%
Hatching rate 70%
Page 8/22
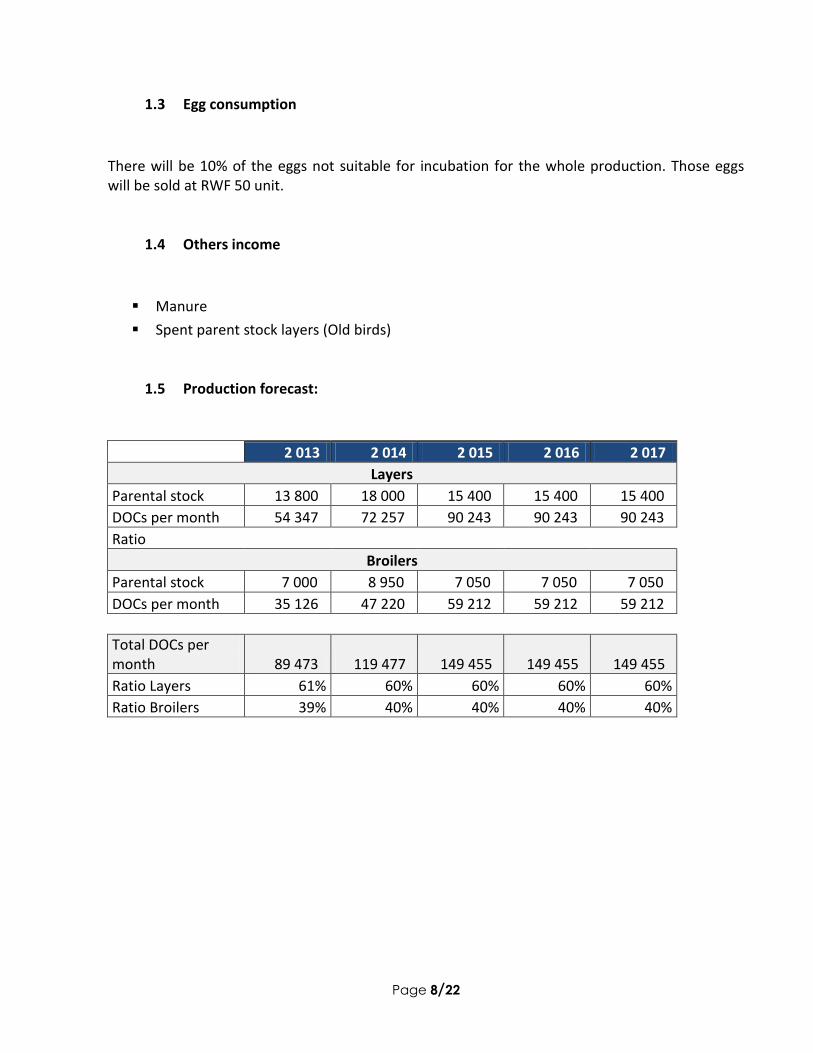
1.3 Egg consumption
There will be 10% of the eggs not suitable for incubation for the whole production. Those eggs will be sold at RWF 50 unit.
1.4 Others income
Manure
Spent parent stock layers (Old birds)
1.5 Production forecast:
2 013 2 014 2 015 2 016 2 017
Layers
Parental stock 13 800 18 000 15 400 15 400 15 400
DOCs per month 54 347 72 257 90 243 90 243 90 243
Ratio
Broilers
Parental stock 7 000 8 950 7 050 7 050 7 050
DOCs per month 35 126 47 220 59 212 59 212 59 212
Total DOCs per month 89 473 119 477 149 455 149 455 149 455
Ratio Layers 61% 60% 60% 60% 60%
Ratio Broilers 39% 40% 40% 40% 40%
Page 9/22
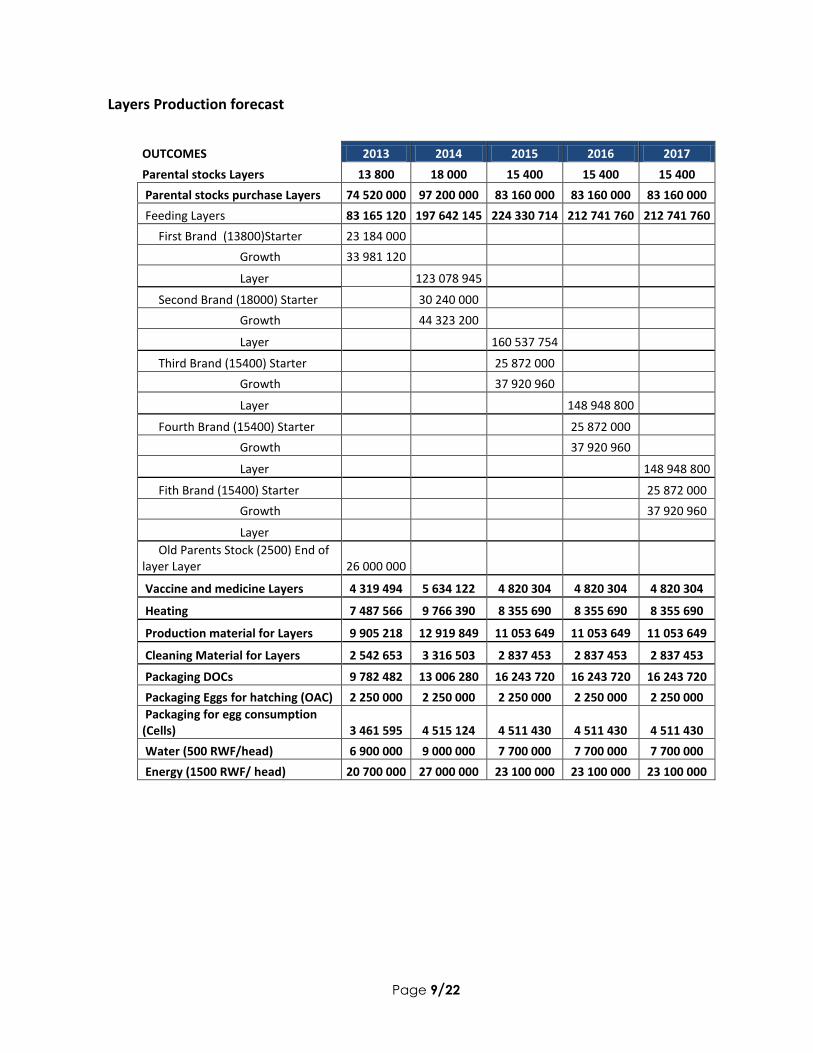
Layers Production forecast
OUTCOMES 2013 2014 2015 2016 2017
Parental stocks Layers 13 800 18 000 15 400 15 400 15 400
Parental stocks purchase Layers 74 520 000 97 200 000 83 160 000 83 160 000 83 160 000
Feeding Layers 83 165 120 197 642 145 224 330 714 212 741 760 212 741 760
First Brand (13800)Starter 23 184 000 Growth 33 981 120 Layer
123 078 945
Second Brand (18000) Starter
30 240 000 Growth
44 323 200
Layer
160 537 754 Third Brand (15400) Starter
25 872 000
Growth
37 920 960 Layer
148 948 800
Fourth Brand (15400) Starter
25 872 000 Growth
37 920 960
Layer
148 948 800
Fith Brand (15400) Starter
25 872 000
Growth
37 920 960
Layer Old Parents Stock (2500) End of
layer Layer 26 000 000 Vaccine and medicine Layers 4 319 494 5 634 122 4 820 304 4 820 304 4 820 304
Heating 7 487 566 9 766 390 8 355 690 8 355 690 8 355 690
Production material for Layers 9 905 218 12 919 849 11 053 649 11 053 649 11 053 649
Cleaning Material for Layers 2 542 653 3 316 503 2 837 453 2 837 453 2 837 453
Packaging DOCs 9 782 482 13 006 280 16 243 720 16 243 720 16 243 720
Packaging Eggs for hatching (OAC) 2 250 000 2 250 000 2 250 000 2 250 000 2 250 000
Packaging for egg consumption (Cells) 3 461 595 4 515 124 4 511 430 4 511 430 4 511 430
Water (500 RWF/head) 6 900 000 9 000 000 7 700 000 7 700 000 7 700 000
Energy (1500 RWF/ head) 20 700 000 27 000 000 23 100 000 23 100 000 23 100 000
Page 10/22
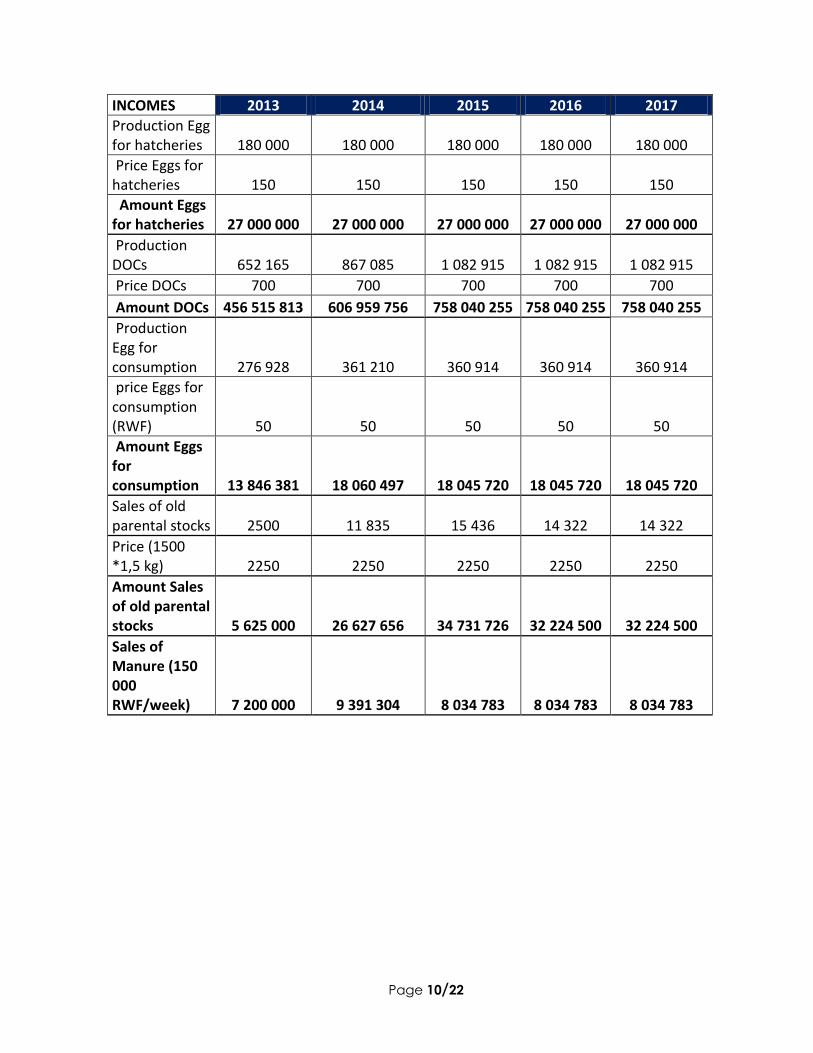
INCOMES 2013 2014 2015 2016 2017
Production Egg for hatcheries 180 000 180 000 180 000 180 000 180 000
Price Eggs for hatcheries 150 150 150 150 150
Amount Eggs for hatcheries 27 000 000 27 000 000 27 000 000 27 000 000 27 000 000
Production DOCs 652 165 867 085 1 082 915 1 082 915 1 082 915
Price DOCs 700 700 700 700 700
Amount DOCs 456 515 813 606 959 756 758 040 255 758 040 255 758 040 255
Production Egg for consumption 276 928 361 210 360 914 360 914 360 914
price Eggs for consumption (RWF) 50 50 50 50 50
Amount Eggs for consumption 13 846 381 18 060 497 18 045 720 18 045 720 18 045 720
Sales of old parental stocks 2500 11 835 15 436 14 322 14 322
Price (1500 *1,5 kg) 2250 2250 2250 2250 2250
Amount Sales of old parental stocks 5 625 000 26 627 656 34 731 726 32 224 500 32 224 500
Sales of Manure (150 000 RWF/week) 7 200 000 9 391 304 8 034 783 8 034 783 8 034 783
Page 11/22
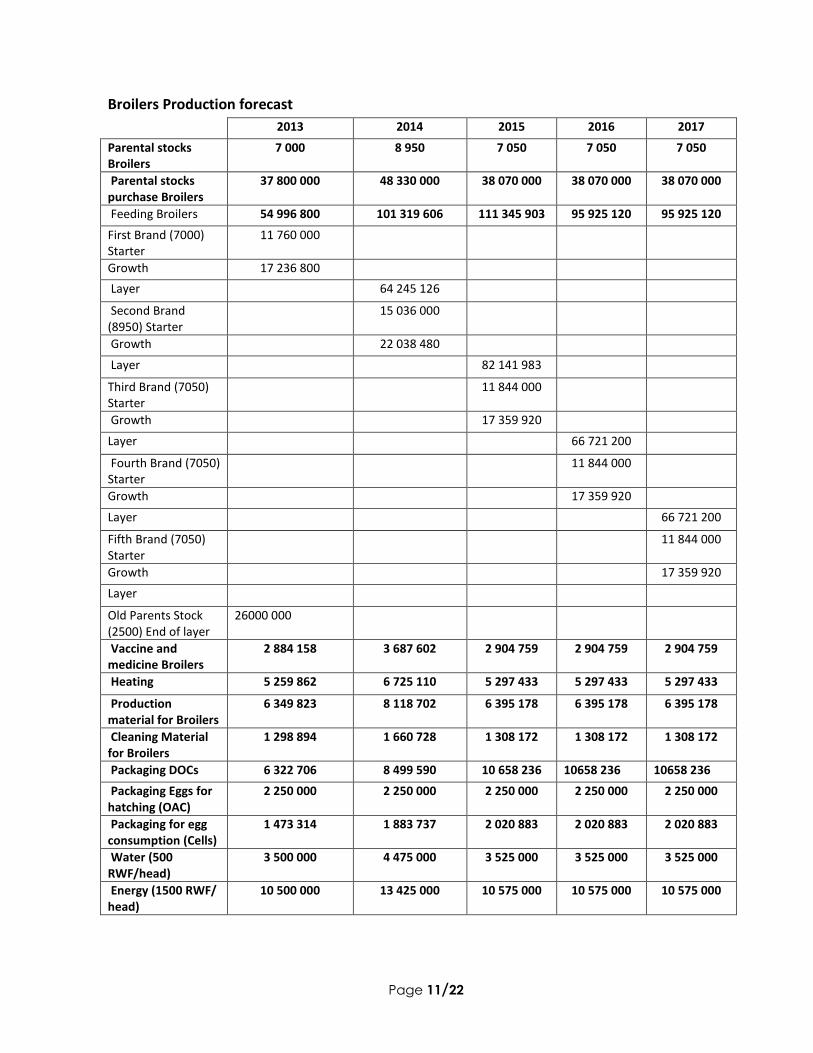
Broilers Production forecast
2013 2014 2015 2016 2017
Parental stocks Broilers
7 000 8 950 7 050 7 050 7 050
Parental stocks purchase Broilers
37 800 000 48 330 000 38 070 000 38 070 000 38 070 000
Feeding Broilers 54 996 800 101 319 606 111 345 903 95 925 120 95 925 120
First Brand (7000) Starter
11 760 000
Growth 17 236 800
Layer 64 245 126
Second Brand (8950) Starter
15 036 000
Growth 22 038 480
Layer 82 141 983
Third Brand (7050) Starter
11 844 000
Growth 17 359 920
Layer 66 721 200
Fourth Brand (7050) Starter
11 844 000
Growth 17 359 920
Layer 66 721 200
Fifth Brand (7050) Starter
11 844 000
Growth 17 359 920
Layer
Old Parents Stock (2500) End of layer
26000 000
Vaccine and medicine Broilers
2 884 158 3 687 602 2 904 759 2 904 759 2 904 759
Heating 5 259 862 6 725 110 5 297 433 5 297 433 5 297 433
Production material for Broilers
6 349 823 8 118 702 6 395 178 6 395 178 6 395 178
Cleaning Material for Broilers
1 298 894 1 660 728 1 308 172 1 308 172 1 308 172
Packaging DOCs 6 322 706 8 499 590 10 658 236 10658 236 10658 236
Packaging Eggs for hatching (OAC)
2 250 000 2 250 000 2 250 000 2 250 000 2 250 000
Packaging for egg consumption (Cells)
1 473 314 1 883 737 2 020 883 2 020 883 2 020 883
Water (500 RWF/head)
3 500 000 4 475 000 3 525 000 3 525 000 3 525 000
Energy (1500 RWF/ head)
10 500 000 13 425 000 10 575 000 10 575 000 10 575 000
Page 12/22
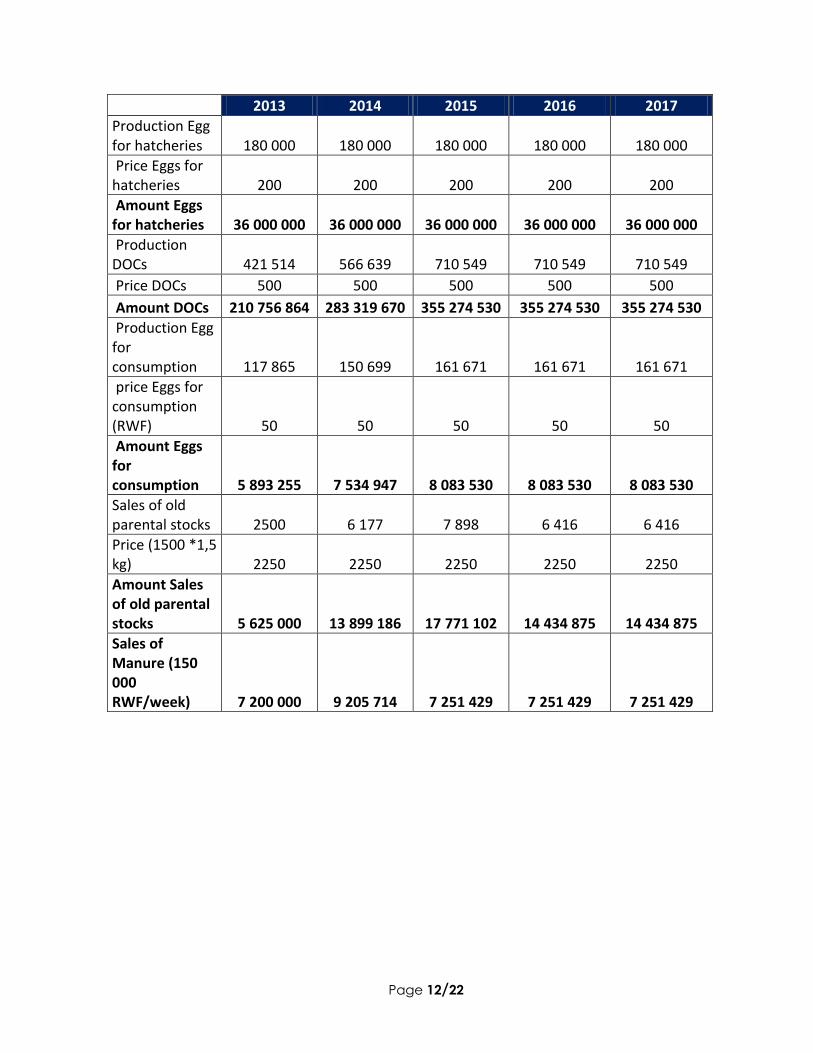
2013 2014 2015 2016 2017
Production Egg for hatcheries 180 000 180 000 180 000 180 000 180 000
Price Eggs for hatcheries 200 200 200 200 200
Amount Eggs for hatcheries 36 000 000 36 000 000 36 000 000 36 000 000 36 000 000
Production DOCs 421 514 566 639 710 549 710 549 710 549
Price DOCs 500 500 500 500 500
Amount DOCs 210 756 864 283 319 670 355 274 530 355 274 530 355 274 530
Production Egg for consumption 117 865 150 699 161 671 161 671 161 671
price Eggs for consumption (RWF) 50 50 50 50 50
Amount Eggs for consumption 5 893 255 7 534 947 8 083 530 8 083 530 8 083 530
Sales of old parental stocks 2500 6 177 7 898 6 416 6 416
Price (1500 *1,5 kg) 2250 2250 2250 2250 2250
Amount Sales of old parental stocks 5 625 000 13 899 186 17 771 102 14 434 875 14 434 875
Sales of Manure (150 000 RWF/week) 7 200 000 9 205 714 7 251 429 7 251 429 7 251 429
Page 13/22
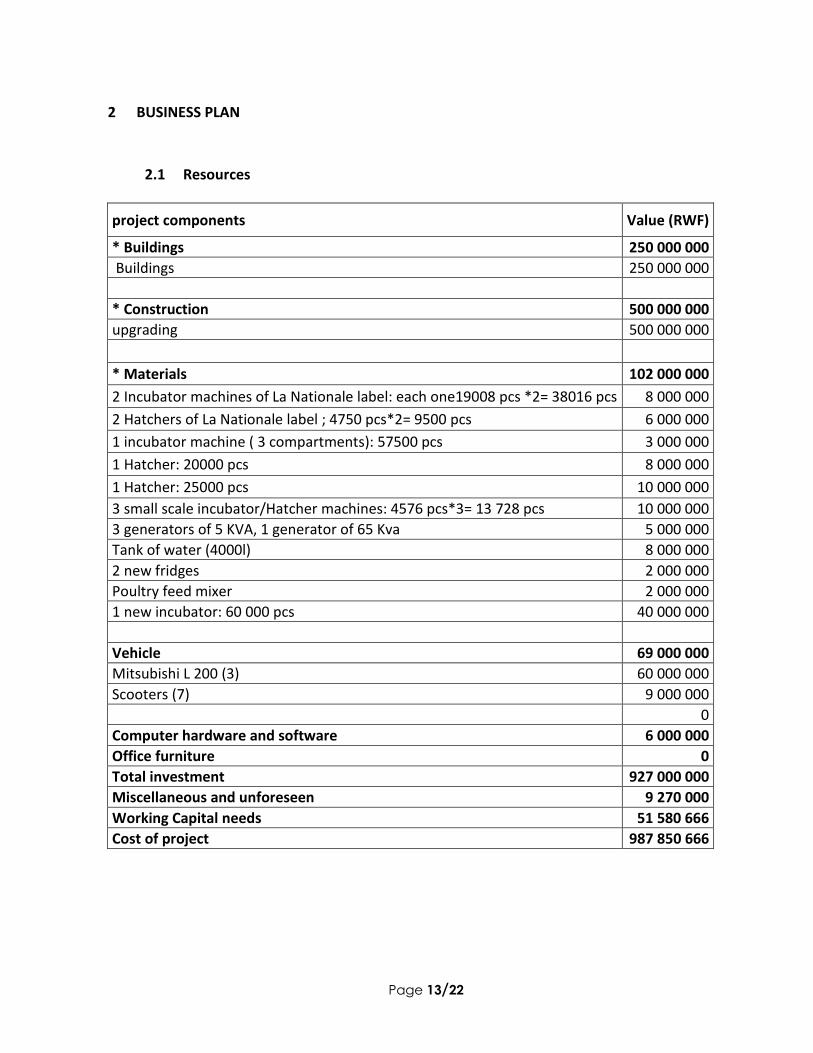
2 BUSINESS PLAN
2.1 Resources
project components Value (RWF)
* Buildings 250 000 000
Buildings 250 000 000
* Construction 500 000 000
upgrading 500 000 000
* Materials 102 000 000
2 Incubator machines of La Nationale label: each one19008 pcs *2= 38016 pcs 8 000 000
2 Hatchers of La Nationale label ; 4750 pcs*2= 9500 pcs 6 000 000
1 incubator machine ( 3 compartments): 57500 pcs 3 000 000
1 Hatcher: 20000 pcs 8 000 000
1 Hatcher: 25000 pcs 10 000 000
3 small scale incubator/Hatcher machines: 4576 pcs*3= 13 728 pcs 10 000 000
3 generators of 5 KVA, 1 generator of 65 Kva 5 000 000
Tank of water (4000l) 8 000 000
2 new fridges 2 000 000
Poultry feed mixer 2 000 000
1 new incubator: 60 000 pcs 40 000 000
Vehicle 69 000 000
Mitsubishi L 200 (3) 60 000 000
Scooters (7) 9 000 000
0
Computer hardware and software 6 000 000
Office furniture 0
Total investment 927 000 000
Miscellaneous and unforeseen 9 270 000
Working Capital needs 51 580 666
Cost of project 987 850 666
Page 14/22
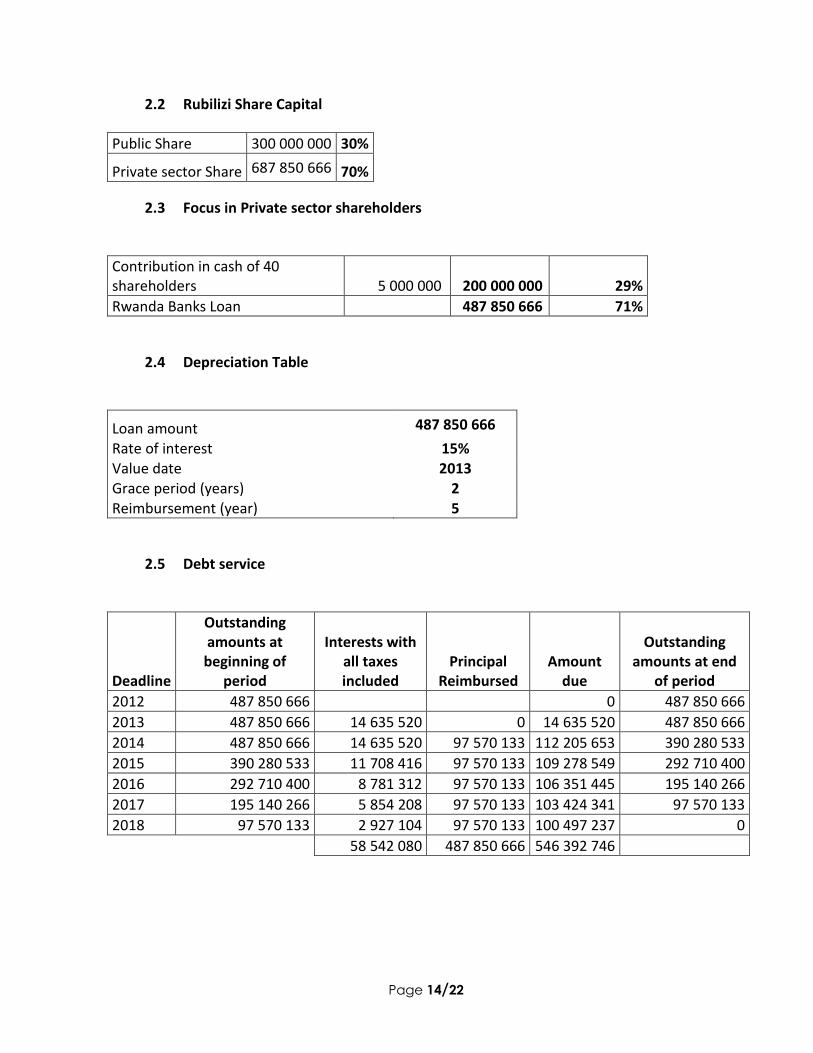
2.2 Rubilizi Share Capital
Public Share 300 000 000 30%
Private sector Share 687 850 666 70%
2.3 Focus in Private sector shareholders
Contribution in cash of 40 shareholders 5 000 000 200 000 000 29%
Rwanda Banks Loan 487 850 666 71%
2.4 Depreciation Table
Loan amount 487 850 666
Rate of interest 15% Value date 2013 Grace period (years) 2 Reimbursement (year) 5
2.5 Debt service
Deadline
Outstanding amounts at beginning of
period
Interests with all taxes included
Principal Reimbursed
Amount due
Outstanding amounts at end
of period
2012 487 850 666 0 487 850 666
2013 487 850 666 14 635 520 0 14 635 520 487 850 666
2014 487 850 666 14 635 520 97 570 133 112 205 653 390 280 533
2015 390 280 533 11 708 416 97 570 133 109 278 549 292 710 400
2016 292 710 400 8 781 312 97 570 133 106 351 445 195 140 266
2017 195 140 266 5 854 208 97 570 133 103 424 341 97 570 133
2018 97 570 133 2 927 104 97 570 133 100 497 237 0
58 542 080 487 850 666 546 392 746
Page 15/22
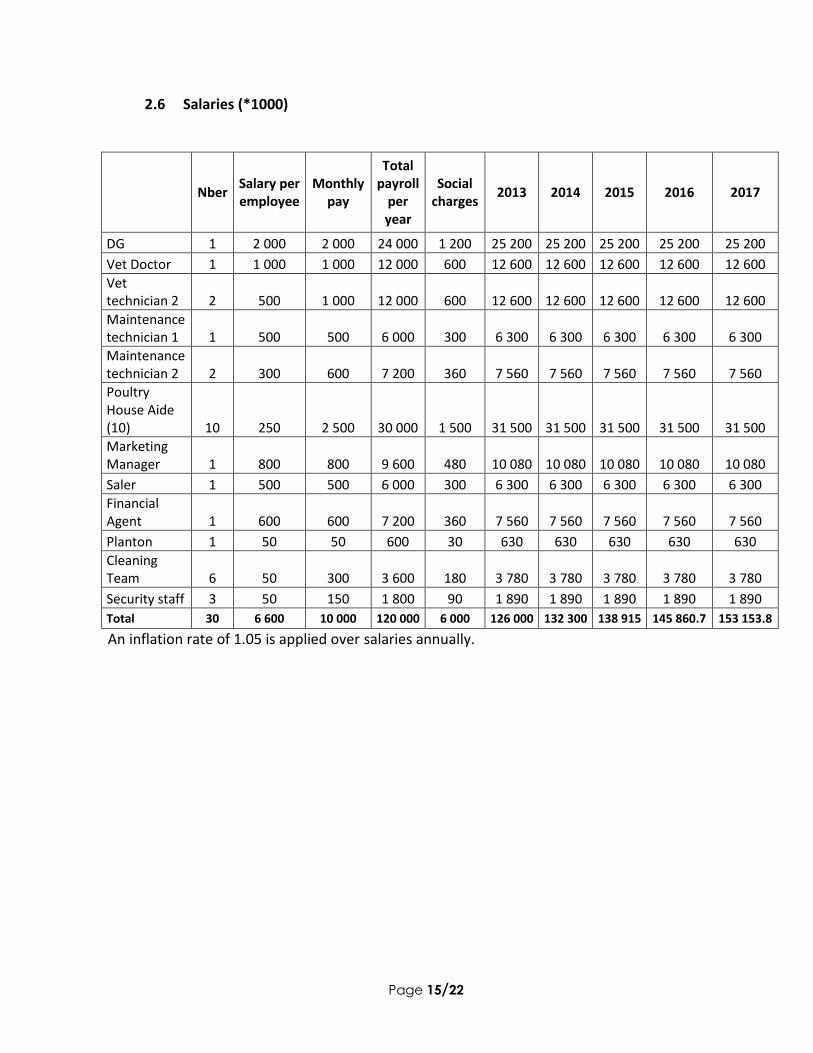
2.6 Salaries (*1000)
Nber Salary per employee
Monthly pay
Total payroll
per year
Social charges
2013 2014 2015 2016 2017
DG 1 2 000 2 000 24 000 1 200 25 200 25 200 25 200 25 200 25 200
Vet Doctor 1 1 000 1 000 12 000 600 12 600 12 600 12 600 12 600 12 600
Vet technician 2 2 500 1 000 12 000 600 12 600 12 600 12 600 12 600 12 600
Maintenance technician 1 1 500 500 6 000 300 6 300 6 300 6 300 6 300 6 300
Maintenance technician 2 2 300 600 7 200 360 7 560 7 560 7 560 7 560 7 560
Poultry House Aide (10) 10 250 2 500 30 000 1 500 31 500 31 500 31 500 31 500 31 500
Marketing Manager 1 800 800 9 600 480 10 080 10 080 10 080 10 080 10 080
Saler 1 500 500 6 000 300 6 300 6 300 6 300 6 300 6 300
Financial Agent 1 600 600 7 200 360 7 560 7 560 7 560 7 560 7 560
Planton 1 50 50 600 30 630 630 630 630 630
Cleaning Team 6 50 300 3 600 180 3 780 3 780 3 780 3 780 3 780
Security staff 3 50 150 1 800 90 1 890 1 890 1 890 1 890 1 890
Total 30 6 600 10 000 120 000 6 000 126 000 132 300 138 915 145 860.7 153 153.8
An inflation rate of 1.05 is applied over salaries annually.
Page 16/22
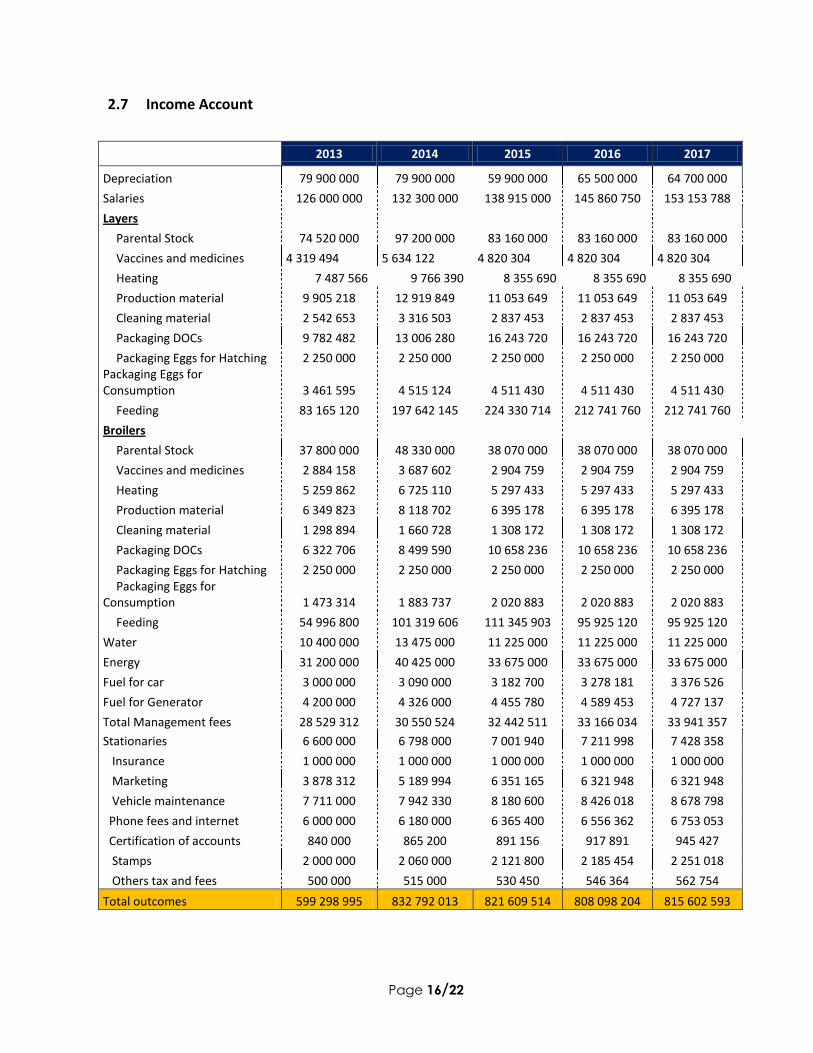
2.7 Income Account
2013 2014 2015 2016 2017
Depreciation 79 900 000 79 900 000 59 900 000 65 500 000 64 700 000
Salaries 126 000 000 132 300 000 138 915 000 145 860 750 153 153 788
Layers
Parental Stock 74 520 000 97 200 000 83 160 000 83 160 000 83 160 000
Vaccines and medicines 4 319 494 5 634 122 4 820 304 4 820 304 4 820 304
Heating 7 487 566 9 766 390 8 355 690 8 355 690 8 355 690
Production material 9 905 218 12 919 849 11 053 649 11 053 649 11 053 649
Cleaning material 2 542 653 3 316 503 2 837 453 2 837 453 2 837 453
Packaging DOCs 9 782 482 13 006 280 16 243 720 16 243 720 16 243 720
Packaging Eggs for Hatching 2 250 000 2 250 000 2 250 000 2 250 000 2 250 000 Packaging Eggs for Consumption 3 461 595 4 515 124 4 511 430 4 511 430 4 511 430
Feeding 83 165 120 197 642 145 224 330 714 212 741 760 212 741 760
Broilers
Parental Stock 37 800 000 48 330 000 38 070 000 38 070 000 38 070 000
Vaccines and medicines 2 884 158 3 687 602 2 904 759 2 904 759 2 904 759
Heating 5 259 862 6 725 110 5 297 433 5 297 433 5 297 433
Production material 6 349 823 8 118 702 6 395 178 6 395 178 6 395 178
Cleaning material 1 298 894 1 660 728 1 308 172 1 308 172 1 308 172
Packaging DOCs 6 322 706 8 499 590 10 658 236 10 658 236 10 658 236
Packaging Eggs for Hatching 2 250 000 2 250 000 2 250 000 2 250 000 2 250 000 Packaging Eggs for
Consumption 1 473 314 1 883 737 2 020 883 2 020 883 2 020 883
Feeding 54 996 800 101 319 606 111 345 903 95 925 120 95 925 120
Water 10 400 000 13 475 000 11 225 000 11 225 000 11 225 000
Energy 31 200 000 40 425 000 33 675 000 33 675 000 33 675 000
Fuel for car 3 000 000 3 090 000 3 182 700 3 278 181 3 376 526
Fuel for Generator 4 200 000 4 326 000 4 455 780 4 589 453 4 727 137
Total Management fees 28 529 312 30 550 524 32 442 511 33 166 034 33 941 357
Stationaries 6 600 000 6 798 000 7 001 940 7 211 998 7 428 358
Insurance 1 000 000 1 000 000 1 000 000 1 000 000 1 000 000
Marketing 3 878 312 5 189 994 6 351 165 6 321 948 6 321 948
Vehicle maintenance 7 711 000 7 942 330 8 180 600 8 426 018 8 678 798
Phone fees and internet 6 000 000 6 180 000 6 365 400 6 556 362 6 753 053
Certification of accounts 840 000 865 200 891 156 917 891 945 427
Stamps 2 000 000 2 060 000 2 121 800 2 185 454 2 251 018
Others tax and fees 500 000 515 000 530 450 546 364 562 754
Total outcomes 599 298 995 832 792 013 821 609 514 808 098 204 815 602 593
Page 17/22
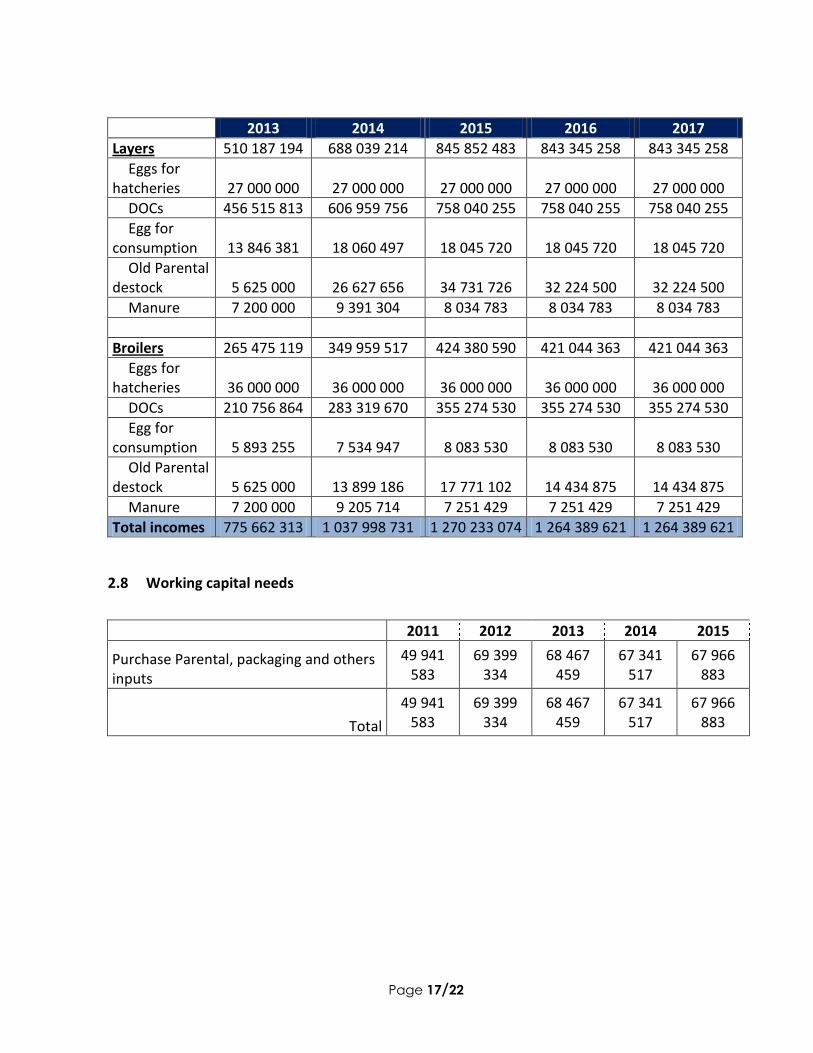
2013 2014 2015 2016 2017
Layers 510 187 194 688 039 214 845 852 483 843 345 258 843 345 258
Eggs for hatcheries 27 000 000 27 000 000 27 000 000 27 000 000 27 000 000
DOCs 456 515 813 606 959 756 758 040 255 758 040 255 758 040 255
Egg for consumption 13 846 381 18 060 497 18 045 720 18 045 720 18 045 720
Old Parental destock 5 625 000 26 627 656 34 731 726 32 224 500 32 224 500
Manure 7 200 000 9 391 304 8 034 783 8 034 783 8 034 783
Broilers 265 475 119 349 959 517 424 380 590 421 044 363 421 044 363
Eggs for hatcheries 36 000 000 36 000 000 36 000 000 36 000 000 36 000 000
DOCs 210 756 864 283 319 670 355 274 530 355 274 530 355 274 530
Egg for consumption 5 893 255 7 534 947 8 083 530 8 083 530 8 083 530
Old Parental destock 5 625 000 13 899 186 17 771 102 14 434 875 14 434 875
Manure 7 200 000 9 205 714 7 251 429 7 251 429 7 251 429
Total incomes 775 662 313 1 037 998 731 1 270 233 074 1 264 389 621 1 264 389 621
2.8 Working capital needs
2011 2012 2013 2014 2015
Purchase Parental, packaging and others inputs
49 941 583
69 399 334
68 467 459
67 341 517
67 966 883
Total
49 941 583
69 399 334
68 467 459
67 341 517
67 966 883
Page 18/22
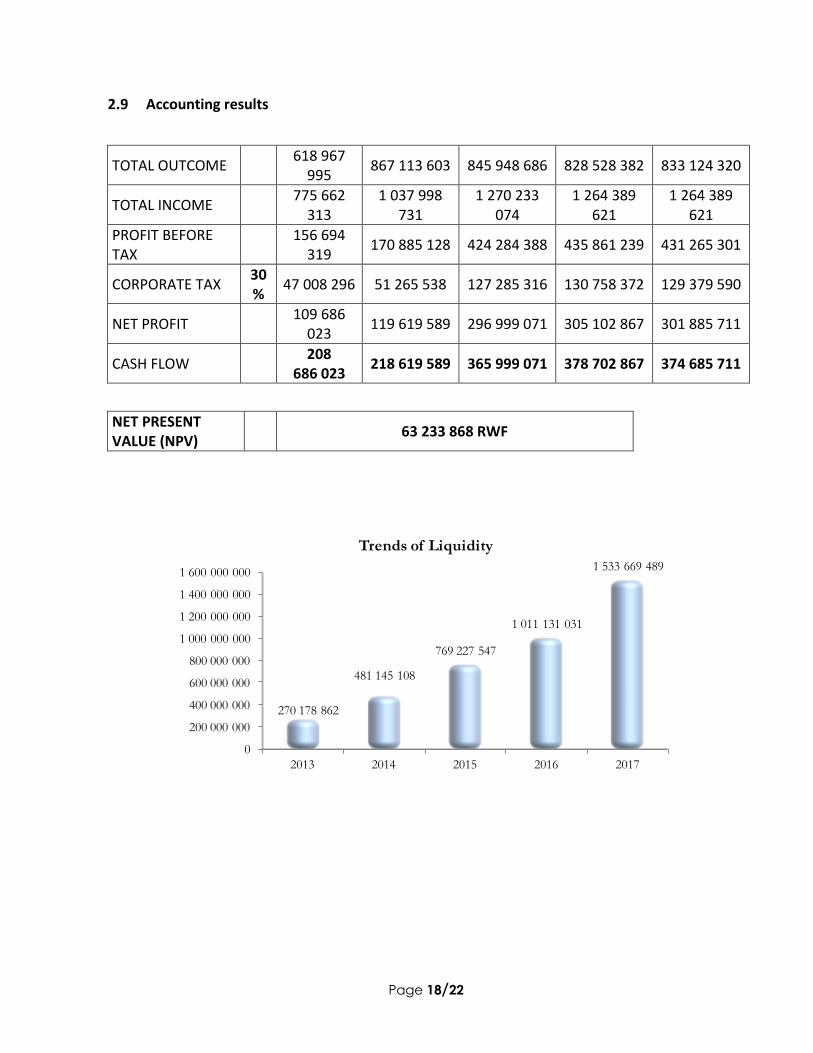
2.9 Accounting results
TOTAL OUTCOME 618 967
995 867 113 603 845 948 686 828 528 382 833 124 320
TOTAL INCOME 775 662
313 1 037 998
731 1 270 233
074 1 264 389
621 1 264 389
621
PROFIT BEFORE TAX
156 694
319 170 885 128 424 284 388 435 861 239 431 265 301
CORPORATE TAX 30%
47 008 296 51 265 538 127 285 316 130 758 372 129 379 590
NET PROFIT 109 686
023 119 619 589 296 999 071 305 102 867 301 885 711
CASH FLOW
208 686 023
218 619 589 365 999 071 378 702 867 374 685 711
NET PRESENT VALUE (NPV)
63 233 868 RWF
0
200 000 000
400 000 000
600 000 000
800 000 000
1 000 000 000
1 200 000 000
1 400 000 000
1 600 000 000
2013 2014 2015 2016 2017
270 178 862
481 145 108
769 227 547
1 011 131 031
1 533 669 489
Trends of Liquidity
Page 19/22
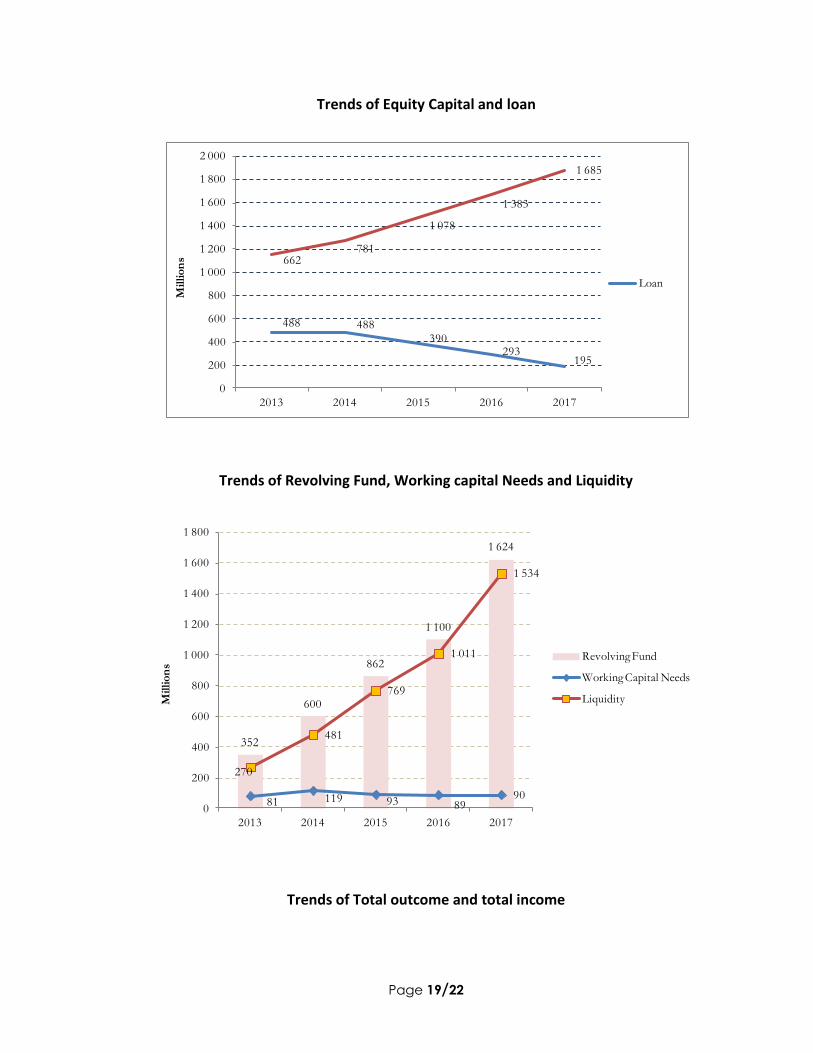
Trends of Equity Capital and loan
Trends of Revolving Fund, Working capital Needs and Liquidity
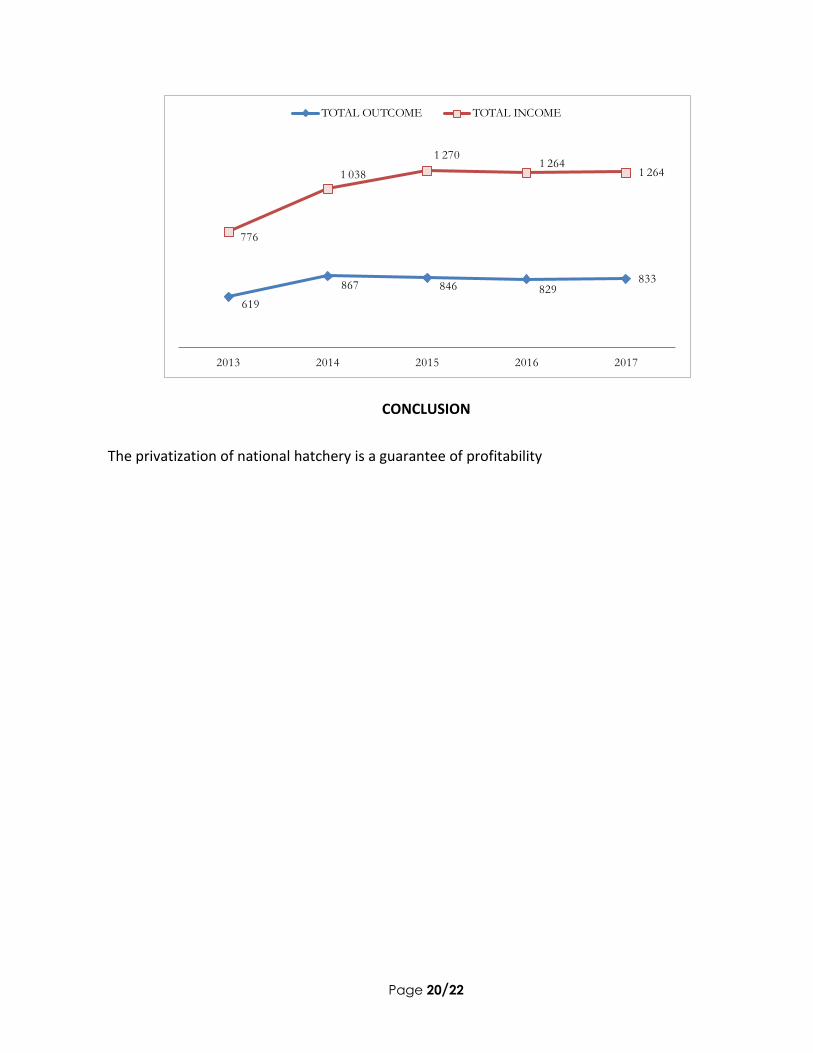
Trends of Total outcome and total income
488 488
390293
195
662781
1 078
1 383
1 685
0
200
400
600
800
1 000
1 200
1 400
1 600
1 800
2 000
2013 2014 2015 2016 2017
Mil
lio
ns
Loan
352
600
862
1 100
1 624
81 119 93 8990
270
481
769
1 011
1 534
0
200
400
600
800
1 000
1 200
1 400
1 600
1 800
2013 2014 2015 2016 2017
Millio
ns
Revolving Fund
Working Capital Needs
Liquidity
Page 20/22
CONCLUSION
The privatization of national hatchery is a guarantee of profitability
619
867 846 829833
776
1 038
1 2701 264
1 264
2013 2014 2015 2016 2017
TOTAL OUTCOME TOTAL INCOME
Page 21/22
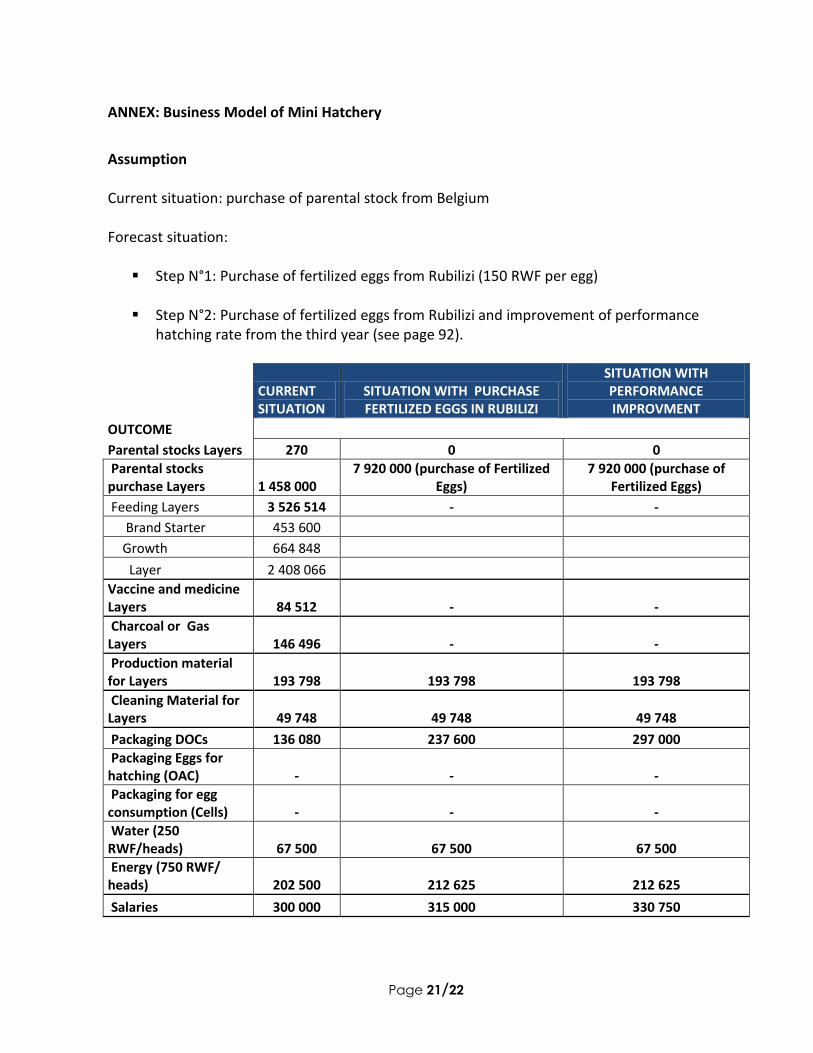
ANNEX: Business Model of Mini Hatchery
Assumption Current situation: purchase of parental stock from Belgium Forecast situation:
Step N°1: Purchase of fertilized eggs from Rubilizi (150 RWF per egg)
Step N°2: Purchase of fertilized eggs from Rubilizi and improvement of performance hatching rate from the third year (see page 92).
CURRENT SITUATION
SITUATION WITH PURCHASE FERTILIZED EGGS IN RUBILIZI
SITUATION WITH PERFORMANCE IMPROVMENT
OUTCOME Parental stocks Layers 270 0 0
Parental stocks purchase Layers 1 458 000
7 920 000 (purchase of Fertilized Eggs)
7 920 000 (purchase of Fertilized Eggs)
Feeding Layers 3 526 514 - -
Brand Starter 453 600 Growth 664 848 Layer 2 408 066 Vaccine and medicine
Layers 84 512 - -
Charcoal or Gas Layers 146 496 - -
Production material for Layers 193 798 193 798 193 798
Cleaning Material for Layers 49 748 49 748 49 748
Packaging DOCs 136 080 237 600 297 000
Packaging Eggs for hatching (OAC) - - -
Packaging for egg consumption (Cells) - - -
Water (250 RWF/heads) 67 500 67 500 67 500
Energy (750 RWF/ heads) 202 500 212 625 212 625
Salaries 300 000 315 000 330 750
Page 22/22
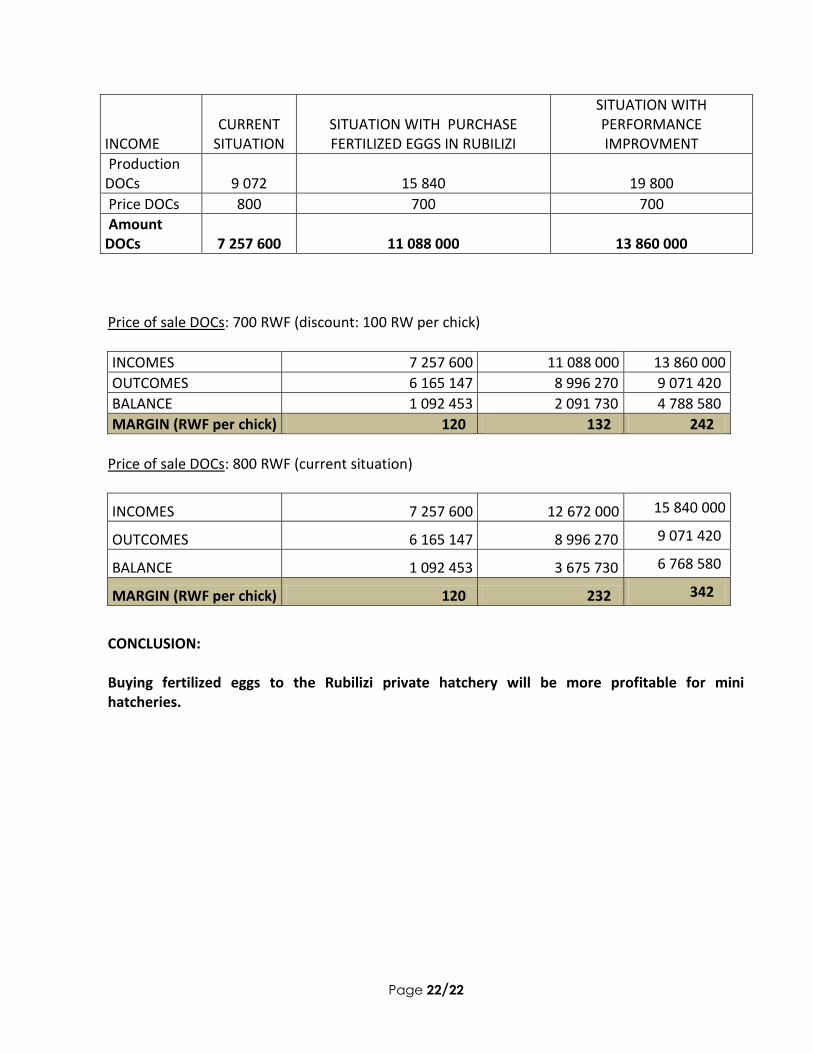
INCOME CURRENT
SITUATION SITUATION WITH PURCHASE FERTILIZED EGGS IN RUBILIZI
SITUATION WITH PERFORMANCE IMPROVMENT
Production DOCs 9 072 15 840 19 800
Price DOCs 800 700 700
Amount DOCs 7 257 600 11 088 000 13 860 000
Price of sale DOCs: 700 RWF (discount: 100 RW per chick)
INCOMES 7 257 600 11 088 000 13 860 000
OUTCOMES 6 165 147 8 996 270 9 071 420
BALANCE 1 092 453 2 091 730 4 788 580
MARGIN (RWF per chick) 120 132 242
Price of sale DOCs: 800 RWF (current situation)
INCOMES 7 257 600 12 672 000 15 840 000
OUTCOMES 6 165 147 8 996 270 9 071 420
BALANCE 1 092 453 3 675 730 6 768 580
MARGIN (RWF per chick) 120 232 342
CONCLUSION: Buying fertilized eggs to the Rubilizi private hatchery will be more profitable for mini hatcheries.