Embed Size (px)
Citation preview
Research ArticleModeling Neurovascular Coupling from ClusteredParameter Sets for Multimodal EEG-NIRS
M. Tanveer Talukdar,1 H. Robert Frost,2 and Solomon G. Diamond1
1Thayer School of Engineering at Dartmouth, 14 Engineering Drive, Hanover, NH 03755, USA2Institute for Quantitative Biomedical Sciences, One Medical Center Drive, Lebanon, NH 03756, USA
Correspondence should be addressed to M. Tanveer Talukdar; [email protected]
Received 24 November 2014; Revised 3 February 2015; Accepted 4 February 2015
Academic Editor: Phaneendra K. Yalavarthy
Copyright © 2015 M. Tanveer Talukdar et al. This is an open access article distributed under the Creative Commons AttributionLicense, which permits unrestricted use, distribution, and reproduction in any medium, provided the original work is properlycited.
Despite significant improvements in neuroimaging technologies and analysis methods, the fundamental relationship betweenlocal changes in cerebral hemodynamics and the underlying neural activity remains largely unknown. In this study, a data drivenapproach is proposed formodeling this neurovascular coupling relationship from simultaneously acquired electroencephalographic(EEG) and near-infrared spectroscopic (NIRS) data. The approach uses gamma transfer functions to map EEG spectral envelopesthat reflect time-varying power variations in neural rhythms to hemodynamics measured with NIRS during median nervestimulation. The approach is evaluated first with simulated EEG-NIRS data and then by applying the method to experimentalEEG-NIRS data measured from 3 human subjects. Results from the experimental data indicate that the neurovascular couplingrelationship can be modeled using multiple sets of gamma transfer functions. By applying cluster analysis, statistically significantparameter sets were found to predict NIRS hemodynamics from EEG spectral envelopes. All subjects were found to have significantclustered parameters (𝑃 < 0.05) for EEG-NIRS data fitted using gamma transfer functions. These results suggest that the use ofgamma transfer functions followed by cluster analysis of the resulting parameter sets may provide insights into neurovascularcoupling in human neuroimaging data.
1. Introduction
Neural activity is a complex biophysical process that involveselectrochemical and vascular interaction at the cellular level.Modern neuroimaging technologies such as functional mag-netic resonance imaging (fMRI), near infrared spectroscopy(NIRS), and diffuse optical imaging (DOI) typically detectchanges in the local blood flow associated with the vascularresponse to provide an indirect measure of neural activity.A major limitation with these techniques is their inability tomap precisely the source of the underlying neural activity[1, 2]. Consequently, understanding neurovascular couplingor the relationship linking the underlying neural activity tothe local changes in cerebral hemodynamics remains a vitalarea of research.
To date, noninvasive multimodal neuroimaging tech-niques with electroencephalography (EEG) and fMRI havebeen widely used to investigate the relationship betweenneural activity and cerebral hemodynamics [3–5].These stud-ies attempt to show quantitative aspects such as the degree
of correlation between electrical scalp potentials recordedusing EEG and the hemodynamic response measured fromfMRI after separately preprocessing the acquired data. Onlya few studies have investigated the direct link betweenneural activity and the hemodynamic response by estimat-ing transfer functions which map neural rhythms recordedusing EEG to fMRI blood-oxygen level dependent (BOLD)signals reflecting the hemodynamic response. Despite beinginformative, there are a number of methodological andtechnical difficulties associated with multimodal EEG-fMRItechniques. EEG data recorded during fMRI acquisitionscan be contaminated by gradient artifacts induced by thechanging magnetic field gradients used for spatial encodingin MRI [6]. Electromagnetic interference could decreasethe signal quality in both modalities and therefore obscurefeatures of interest in the datasets being used to identify theneurovascular coupling relationship. Moreover, EEG-fMRIinstrumentation can be fairly complex to set up and is notreadily accessible for conducting neuroimaging research insmaller research facilities.
Hindawi Publishing CorporationComputational and Mathematical Methods in MedicineVolume 2015, Article ID 830849, 13 pageshttp://dx.doi.org/10.1155/2015/830849
2 Computational and Mathematical Methods in Medicine
Multimodal neuroimagingwith EEGandNIRS is increas-ingly gaining popularity due to the portability of EEG-NIRSinstrumentation. EEG-NIRS systems can provide measure-ments with high signal-to-noise ratio (SNR) since thereis no electrooptical interference. More importantly, NIRScan measure the hemodynamic changes at the capillarylevel while fMRI detects BOLD signal that is sensitive tochanges in venous outflow [7]. This makes NIRS potentiallyadvantageous for measuring hemodynamics associated withneural activity as there is evidence which suggests that neu-ronal function is supported by brain capillary oxygenation[8]. A number of studies have used EEG-NIRS systems toinvestigate neurovascular coupling from the measurement ofthe electrical scalp potential and the vascular response instimuli evoked neural responses [9–11]. Although these priorworks show that neural correlates of EEG signals covary withNIRS hemodynamics, there is still not a clear understandingof how the signalsmeasuredwith EEG are predictive of NIRS.Newer methods need to be established based on models thatrelate neural activity to the hemodynamic response.
In this workwe introduce a neurovascular-couplingmod-eling approach based on fitting gamma transfer functions andthen clustering the parameters into sets that most effectivelymap the electrical scalp potentials recorded using EEG to thecerebrovascular responsemeasured fromNIRS hemodynam-ics. Gamma transfer functions have been used to representthe hemodynamic response function (HRF) in fMRI analysismethods [12–14]. Typically in fMRI data analysis, the BOLDsignal is regressed on a general linear model (GLM) con-structed by convolving theHRFwith a boxcar function repre-senting the temporal structure of the experimental paradigm[15]. In recent years, NIRS studies have also adopted the GLMframework to map brain activations [16]. Unfortunately, aboxcar function convolved with a canonical HRF may notaccurately represent the cerebrovascular response since thereis variability in the neural response between brain regionsand different tasks [17, 18]. In addition, the shape of the HRFwill depend on the type of imaging modality used [19]. NIRShemodynamics, which have higher temporal resolution thanfMRI BOLD signals and different hemodynamic measures,will require a different parameter set for the HRF comparedto parameters used in the BOLD fMRI. With respect tothe GLM modeling framework, our neurovascular-couplingmodeling approach takes advantage of the measured EEGsignal linked directly to neural rhythms in order to predictthe NIRS hemodynamic response. Moreover, we vary theparameters of the gamma transfer function so that our modelpredictions have improved fit. Finally, using our approach wewant to identify reliable gamma transfer function parametersthat can predict NIRS ΔHbO hemodynamic response fromEEG spectral envelopes within an individual.
2. Methods
We conducted an Institutional Review Board (IRB) approvedexperiment that involved unilateral stimulation of themediannerve. Typically, stimulation of the median nerve on thehand induces mu rhythm desynchronization in the 8–13Hz
range in the contralateral somatosensory area of the brain.The cortical response can be detected as fluctuations in theEEGmu band and is also known to produce positive changesin ΔHbO calculated from NIRS optical measurements [20,21]. Our experimental paradigm is designed in order tofacilitate detection of signal components that correlate withthe median nerve stimulus. In this way we have selectedfor signals that are likely to have originated in the samebrain region, which makes it practical to study neurovascularcoupling.
In our study we use an EEG-NIRS head probe that wasdesigned to record neural activity from optimally placed EEGelectrodes and NIRS optodes, which cover the whole head[22]. The positioning of the EEG sensors is configured sothat they are equidistant and close in proximity to a NIRSoptode.This ensures to somedegree that themeasured signalsfrom an EEG electrode and a NIRS optode have a commonsource in the cerebral cortex.TheEEG-NIRS instrumentationconsists of 16 optical sources and 8 detectors interleaved withEEG sensors, which are arranged according to the Inter-national 10–20 system. The NIRS system emits continuouswave (CW) near infrared light at four wavelengths (690 nm,785 nm, 808 nm, and 830 nm). The source-detector spacingis 33 mm, which allows for probing neural activation withhigh sensitivity [23]. The EEG system measures the electricalscalp potentials from 30 electrodes. The data acquisitionrates for the EEG and NIRS systems are 2048Hz and 25Hz,respectively.
2.1. Data Preprocessing. EEG data is contaminated by ocular,muscular, cardiac, and other physiological artifacts. For thesampled EEG data, epochs containing aberrant waveformswere manually discarded by visual inspection using theEEGLAB TOOLBOX 10.2.2.4b (Swartz Center for Compu-tational Neurosciences, La Jolla, CA; http://www.sccn.ucsd.edu/eeglab/).We then applied independent component anal-ysis (ICA) using the Infomax ICA algorithm [24], as imple-mented in EEGLAB to remove ocular movement and blinkartifacts from the EEG data [25–27]. Empirical mode decom-position (EMD)was next applied to themotion corrected andnoise artifact reducedEEGdata for extracting neural rhythmslinked to mu rhythm desynchronization. EMD decomposesa signal into a set of band limited functions called intrinsicoscillatory modes or integral mode functions (IMF) [28].Each IMF represents oscillations in a narrow frequency bandand may reveal particular features of interest in the givensignal. The EMD method can offer better time-frequencylocalization compared to traditional methods like short timeFourier transform (STFT) and wavelet decomposition tech-niques [29, 30]. STFT has fixed time-frequency resolutiondue to the fact that it gives a global frequency distribution inthe processing time window. Wavelet analysis, on the otherhand, can provide variable time-frequency resolution com-pared to STFT method. However, there is a trade off betweenthe temporal and spatial scales depending on choice of thewavelet basis function. In EMD, one does not require anybasis functions and the signals do not need to be stationary, asis assumed in STFT and wavelet analysis methods. As a resultEMD has gained considerable popularity for the analysis of
Computational and Mathematical Methods in Medicine 3
EEG-NIRS head probe
Discard movement, ocular,and muscle artifacts
Extract IMF1 from EMD
Apply Hilberttransform on IMF1
Remove linear trend
Low pass filter
Discard movement andphysiological artifacts
NIRS data (25Hz)
Bandpass filter 5–14Hz
at 0.5Hz
Resample at 25Hz
EEG data (2048Hz)
Calculate ΔHbO, ΔHbR
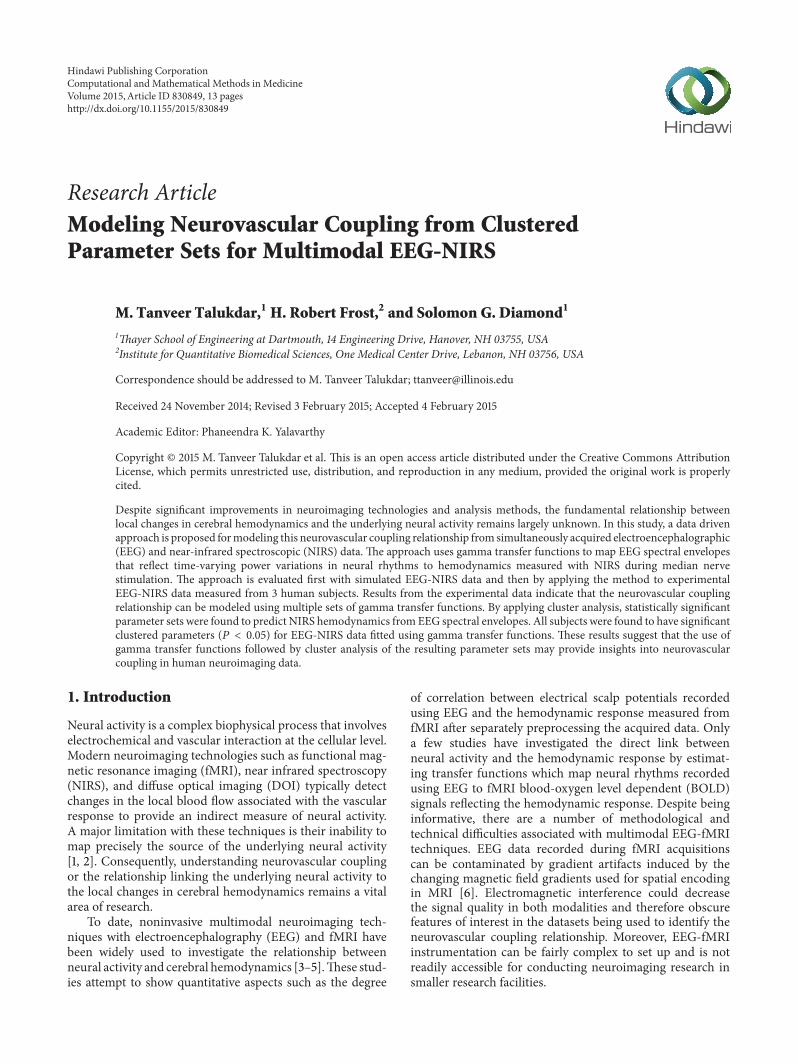
Figure 1: Flowchart: EEG-NIRS data preprocessing.
EEG data, which exhibit a high degree of nonlinearity andoscillatory rhythms in subband frequencies [31, 32].
NIRS optical signal can be contaminated by motion arti-facts and sources of physiological noise such as cardiac sig-nals. Motion artifacts were rejected by applying Chauvenet’scriterion [33]. A deviation ratio (DR) at each time pointwas calculated by dividing the NIRS signal deviations by thestandard deviation of the signal deviations. Signal deviationswere calculated as the difference between the raw data andits smoothed version obtained by applying a moving averagefilter with a span of 30 points (1.2 s duration). Data with aDR greater than the standard Chauvenet’s criterion thresholdwere eliminated and the discontinuous data segments thenspliced together. The resulting NIRS signal was then usedto calculate changes in hemodynamics by solving equationsof the modified Beer-Lambert law (MBLL), which relatesthe attenuation of light to relative changes in concentrationof oxy-hemoglobin (ΔHbO) and deoxy-hemoglobin (ΔHbR)[34]. ΔHbO and ΔHbR were then detrended and low passfiltered using a zero-phase 3rd order Butterworth filter witha cutoff frequency of 0.5Hz to remove cardiac oscillations,which contaminate NIRS signal [35].
Figure 1 shows a flowchart of the preprocessing stream forthe simultaneously acquired EEG-NIRS data during mediannerve stimulation. EEG and NIRS data were sampled at2048Hz and 25Hz, respectively, using the prototype EEG-NIRS head probe. Both EEG and NIRS data were treatedfor artifact rejection and were matched temporally acrosssampled data points. The EEG recordings were bandpassfiltered (5–14Hz) using a zero-phase 4th order Butterworthfilter in order to contain the mu rhythm band (8–13Hz).Hilbert transform [36] was then applied on the first IMFsignal component (IMF1) to generate EEG spectral envelopes,which was later downsampled to 25Hz. The EEG spectralenvelope corresponding to IMF1 was chosen because it ismodulated by frequency components in the mu band andis temporally correlated to the NIRS hemodynamic responsedue to the median nerve stimuli. The EEG spectral envelopeand NIRS hemodynamics also have similar timing andbandwidth in the frequency domain.
2.2. Neurovascular-Coupling Model. In our model of neu-rovascular coupling, we assume that gamma transfer func-tions can map EEG spectral envelopes containing neu-ral rhythms to NIRS ΔHbO reflecting the hemodynamicresponse linked to the underlying neural activity. This map-ping can be expressed by
𝑓 (𝑡) = 𝑎 (𝑔 (𝑡) ∗ ℎ (𝑡; 𝜏, 𝑛, 𝑑)) + 𝑏, (1)
where 𝑔(𝑡) is an EEG spectral envelope, which is convolvedwith a candidate gamma transfer function ℎ(𝑡; 𝜏, 𝑛, 𝑑) topredict the hemodynamic response 𝑓(𝑡). The variables 𝑎 and𝑏 are the gain and offset, respectively. Gamma transfer func-tions can be expressed in exponential form with parameters𝜏, 𝑛, and 𝑑 [37]:
ℎ (𝑡; 𝜏, 𝑛, 𝑑) =[(𝑡 − 𝑑) /𝜏]
𝑛−1
𝑒−(𝑡−𝑑)/𝜏
𝜏 (𝑛 − 1)!, (2)
where 𝜏 determines the rise time to peak amplitude, 𝑛 is aninteger which governs the shape of the function, and 𝑑 isa pure delay. In our method, we recover the parameters 𝜏,𝑛, and 𝑑 of the gamma transfer function that produces thebest fit between the observed and predicted NIRS hemody-namics. Identification of the gamma transfer function andits parameters are carried out in two steps. In the first step,a brute force technique is applied to calculate values 𝑎 and𝑏 in (1) by least squares inversion for each gamma transferfunction constructed from a set of predefined parameters 𝜏,𝑛, and 𝑑. These predefined parameter values (𝜏 = 0.1–0.6 s, 𝑛= 1–4, and 𝑑 = 0.5–3 s) were empirically chosen based on theobservation of NIRS ΔHbO response time to median nervestimulation. Usually the delay in ΔHbO response time canvary between 2 and 3 s, while the time to peak can be fairlyquick 0.1–0.5 s [38]. From the solution space, we then identify𝑎, 𝑏, 𝜏, 𝑛, and 𝑑, which minimize the residual sum squarederror (SSE). In the second step, the identified gamma functionparameters (𝜏, 𝑛, and 𝑑) including the gain 𝑎 and offset 𝑏 arejointly optimized using a simplex search method [39]. This isperformed using Maltab’s “fminsearch” routine in which wespecify SSE as the objective function.
2.3. EstimatingGammaTransfer Functions for Simulated EEG-NIRS Data. We simulated EEG data reflecting mu rhythmdesynchronization associated with neural responses in thesomatosensory cortex [40]. The artificially produced EEGdata was in the form of an amplitude modulated sinusoidalsignal having a carrier frequency of 9Hz. A rectangular pulsetrain with eight pulses having a width and period of 20 s and40 s, respectively, was used to modulate the sinusoidal signal.This pulse train was first convolved with a Kaiser windowhaving a size of 250 data points. This smoothed the edges ofthe pulse train and introduced a time shift of approximately5 s in the pulse onset times. The sign of the time shifted pulsetrain was then reversed to represent the spectral envelopefor mu rhythm desynchronization events that diminish inpower during the stimulus. This was then used to generatethe simulated EEG signal by standard amplitude modulationoperation given by
𝑦 (𝑡) = [1 + 𝑚 (𝑡)] ⋅ 𝑐 (𝑡) , (3)
4 Computational and Mathematical Methods in Medicine
where 𝑚(𝑡) is the modulation wave, 𝑐(𝑡) is the carrier wave,and 𝑦(𝑡) is the modulated signal. The EEG signal thuscontained eight 20 s mu rhythm desynchronization eventswith a latency of 5 s at each onset time.
NIRS ΔHbO was generated from the forward modelof (1). Gamma transfer functions were evaluated for fivedifferent combinations of 𝜏, 𝑛, and 𝑑 that ranged in valuesfrom 0.3–0.6 s, 2–4, and 2-3 s, respectively. The gain 𝑎 andoffset 𝑏 were set to 1 and 0. Each of the 5 gamma transferfunctions was next convolved with the amplitude signal ofthe first IMF (IMF1) obtained from decomposition of thesimulated EEG by the EMD technique. IMF1 basically hada spectral peak around the carrier frequency of 9Hz and itsamplitude signal was calculated from the Hilbert transform[36]. Both the lMF signal and NIRS ΔHbO were normalizedin their amplitudes by dividing by their respective standarddeviations. We then titrated both the EEG IMF1 signal andNIRS ΔHbO with varying degrees of white Gaussian noise(WGN) at each epoch. In case of ΔHbO, we also added asinusoidal signal component of 0.5Hz frequency modulatingthe WGN. The resulting ΔHbO were representative of morerealistic NIRS measurements, which contain physiologicalnoise such as cardiac oscillations that are in the 0.4–2.0Hzrange [41].The amplitude ratio (AR) of theWGNwas selectedto be in the range from −∞ dB (no noise) to 16 dB.
After generating the 5 EEG-NIRS datasets, we estimatedthe known gamma transfer functions that were used tomodelthe NIRS data and recover the corresponding parameters 𝜏,𝑛, and 𝑑. We applied the brute force and the simplex searchmethod to calculate the gamma transfer function parametersfor each EEG-NIRS epoch data segments that spanned thepulse start times to 15 s past their end times. The parameters𝜏, 𝑛, and 𝑑 identified at each epoch data segments were thenused in the forward model of (1) to predict the simulatedΔHbO. The Pearson’s correlation between the simulated andpredicted ΔHbO was then evaluated at each amplitude ratioof the WGN.
2.4. Estimating Gamma Transfer Functions for Experimen-tal EEG-NIRS Data. Gamma transfer functions that pro-vide insight into the neurovascular coupling relationshipin humans were estimated from EEG-NIRS data measuredfrom three right handed male subjects (mean age of 31) inan IRB approved study. The subjects participating in thestudy had no history of neurological or psychiatric disordersand were in general good health. The left and right mediannerves were stimulated using an electrical pulse generatorthat operated at 10Hz. Pulses were transmitted during a 15-second block interval followed by 30 second rest intervalduring each experimental run that lasted a total of 6 minutes.Five recording sessions were carried out, two for each of theleft and right median nerve stimulation runs and and one forwhich the subject was at rest and no stimulation was applied.
IMF1 spectral envelopes were derived for each of the30 EEG channels. We then selected sets of IMF1 spectralenvelopes corresponding to EEG channels located in the leftand right hemispheres based on how strongly they correlatedwith the electrical pulse sequence. Similarly, NIRS ΔHbO
signals were selected within each hemisphere if they showedchanges in concentrations above 0.5 𝜇M. For each EEG IMF1spectral envelope and NIRS ΔHbO paired dataset withina hemisphere, we extracted epochs spanning the stimulusinterval of 15 s including 5 s of pre- and poststimulus period.The epoch data were later smoothed with a moving averagewindow having a time span of 4 s and normalized by dividingby their standard deviation. Each of the epoch datasetsconsisting of normalized IMF1 spectral envelope and NIRSΔHbO finally served as the neurovascular-coupling modelinput and output, respectively. Gamma transfer functionswere then estimated for each epoch data segment using thetwo-step method described in Section 2.2.
We next investigated whether the estimated gammatransfer functions could be clustered into groups which arestatistically significant in their predictions of theNIRSΔHbOhemodynamics. By clustering the estimated gamma transferfunctions, we hope to reduce the effect of overfitting in ourneurovascular-coupling model. In addition, the clusteringmethod is intended to identify reliable gamma transfer func-tions which link the EEG input to the NIRS hemodynamicoutput at the individual level. For each of the estimatedgamma transfer functions, the parameters 𝜏, 𝑛, 𝑑, gain 𝑎, andoffset 𝑏 were used to form a 5-dimensional feature vectoror data point. Since the features were scaled differently, westandardized the feature space so that they have zero meanunit variance. Hierarchical clustering was then applied onthe feature space derived from all the standardized parameterfeature vectors comprised of 𝑎, 𝑏, 𝜏, 𝑛, and 𝑑. We chose thisclustering method due to its relative ease of implementationand also because it is widely used as a clustering tool. Inhierarchical clustering, data is grouped by linking featurevectors in a binary tree called a dendrogram [42]. There area number of linkage methods to merge the feature vectorsinto clustered parameter sets.We usedWard’s linkagemethodas it has been shown to have better clustering performance[43]. In this method the within-cluster variance is minimizedover all partitions obtainable by merging two clusters fromthe previous generation.
By specifying threshold values for cutting off the den-drogram at specific depths, we clustered the feature vectorsinto cluster divisions 𝐶
𝑁, where 𝑁 = 2, 3, . . . , 12. For
each clustered parameter set, we calculated the Pearson’scorrelation coefficient 𝑟 between the predicted NIRS ΔHbOobtained using the forward model (Equation (1)) and themeasuredΔHbO.The correlationswere Fisher𝑍 transformedto give 𝑧 values that are approximately standard normal intheir distribution. The mean 𝑧 value, 𝑧, was then computedfor each of the clustered parameter sets. The 𝑧 value wasnext tested for statistical significance by performing a two-sided 𝑍-test under the null hypothesis 𝐻
0that 𝑧 = 0, which
corresponds to a correlation coefficient of zero.This was doneby first computing the 𝑍 score, 𝑧∗, from the relationship:
𝑧∗
= √𝑛𝑧, (4)
where 𝑛 is the number of feature vectors in the cluster. This𝑧∗ value was then compared against the standard 𝑍 score𝑧𝛼at the 5% significance level (𝛼 = 0.05). It is important
Computational and Mathematical Methods in Medicine 5
0 5 10 15 20 25 30 35
0
0.2
0.4
0.6
0.8
1
Time (s)
Nor
mal
ized
ampl
itude
−1
−0.8
−0.6
−0.4
−0.2
−5
(a)
0 5 10 150
0.2
0.4
0.6
0.8
1
1.2
1.4
Time (s)
𝜏1 = 0.3 s, n1 = 2, d1 = 2 s𝜏2 = 0.2 s, n2 = 3, d2 = 3 s𝜏3 = 0.3 s, n3 = 3, d3 = 3 s𝜏4 = 0.58 s, n4 = 4, d4 = 2.6 s𝜏5 = 0.35 s, n5 = 2, d5 = 2.1 s
(b)
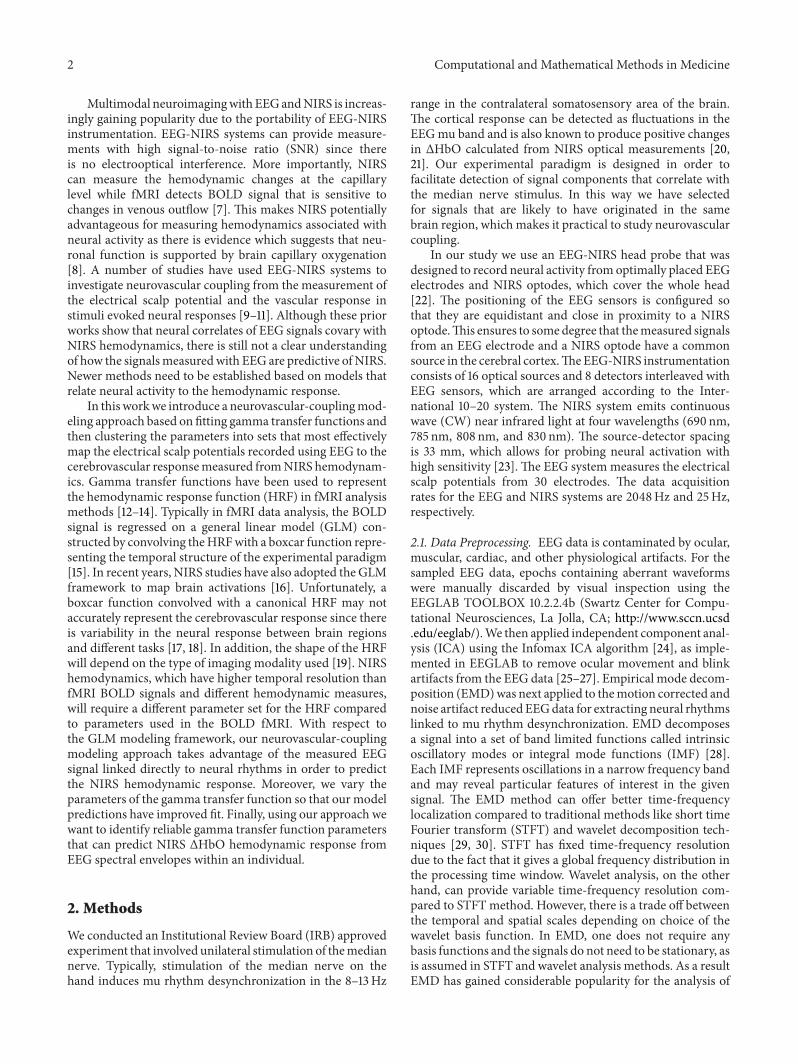
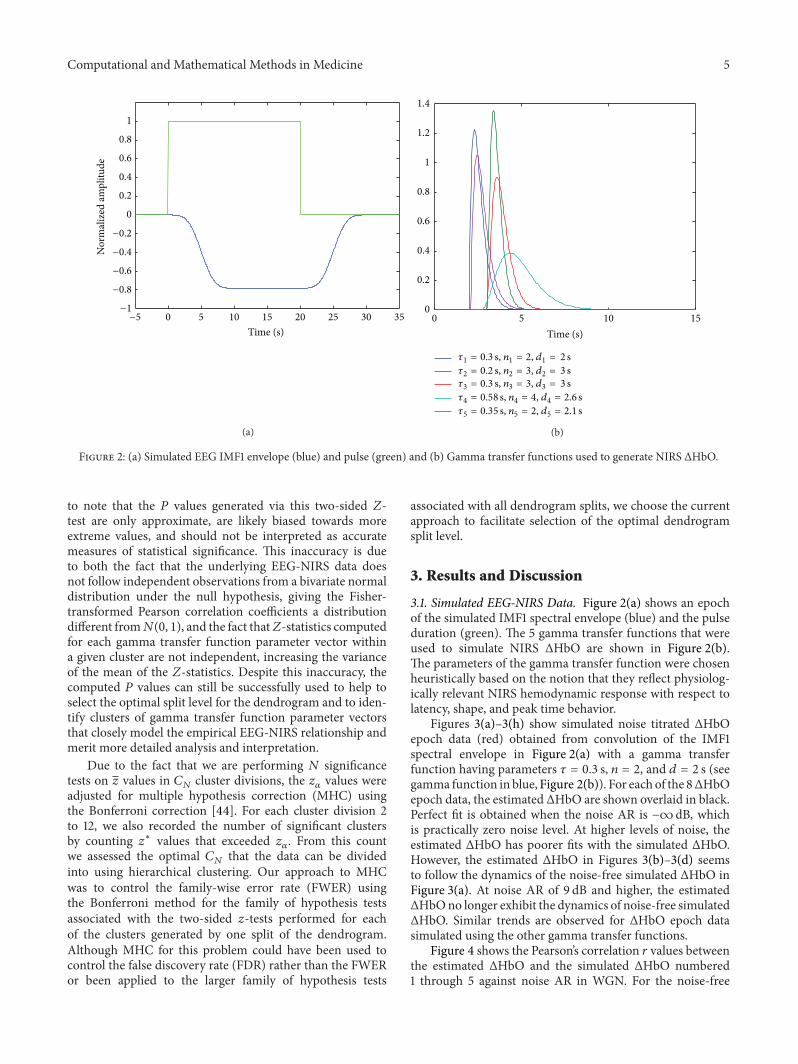
Figure 2: (a) Simulated EEG IMF1 envelope (blue) and pulse (green) and (b) Gamma transfer functions used to generate NIRS ΔHbO.
to note that the 𝑃 values generated via this two-sided 𝑍-test are only approximate, are likely biased towards moreextreme values, and should not be interpreted as accuratemeasures of statistical significance. This inaccuracy is dueto both the fact that the underlying EEG-NIRS data doesnot follow independent observations from a bivariate normaldistribution under the null hypothesis, giving the Fisher-transformed Pearson correlation coefficients a distributiondifferent from𝑁(0, 1), and the fact that𝑍-statistics computedfor each gamma transfer function parameter vector withina given cluster are not independent, increasing the varianceof the mean of the 𝑍-statistics. Despite this inaccuracy, thecomputed 𝑃 values can still be successfully used to help toselect the optimal split level for the dendrogram and to iden-tify clusters of gamma transfer function parameter vectorsthat closely model the empirical EEG-NIRS relationship andmerit more detailed analysis and interpretation.
Due to the fact that we are performing 𝑁 significancetests on 𝑧 values in 𝐶
𝑁cluster divisions, the 𝑧
𝛼values were
adjusted for multiple hypothesis correction (MHC) usingthe Bonferroni correction [44]. For each cluster division 2to 12, we also recorded the number of significant clustersby counting 𝑧∗ values that exceeded 𝑧
𝛼. From this count
we assessed the optimal 𝐶𝑁
that the data can be dividedinto using hierarchical clustering. Our approach to MHCwas to control the family-wise error rate (FWER) usingthe Bonferroni method for the family of hypothesis testsassociated with the two-sided 𝑧-tests performed for eachof the clusters generated by one split of the dendrogram.Although MHC for this problem could have been used tocontrol the false discovery rate (FDR) rather than the FWERor been applied to the larger family of hypothesis tests
associated with all dendrogram splits, we choose the currentapproach to facilitate selection of the optimal dendrogramsplit level.
3. Results and Discussion
3.1. Simulated EEG-NIRS Data. Figure 2(a) shows an epochof the simulated IMF1 spectral envelope (blue) and the pulseduration (green). The 5 gamma transfer functions that wereused to simulate NIRS ΔHbO are shown in Figure 2(b).The parameters of the gamma transfer function were chosenheuristically based on the notion that they reflect physiolog-ically relevant NIRS hemodynamic response with respect tolatency, shape, and peak time behavior.
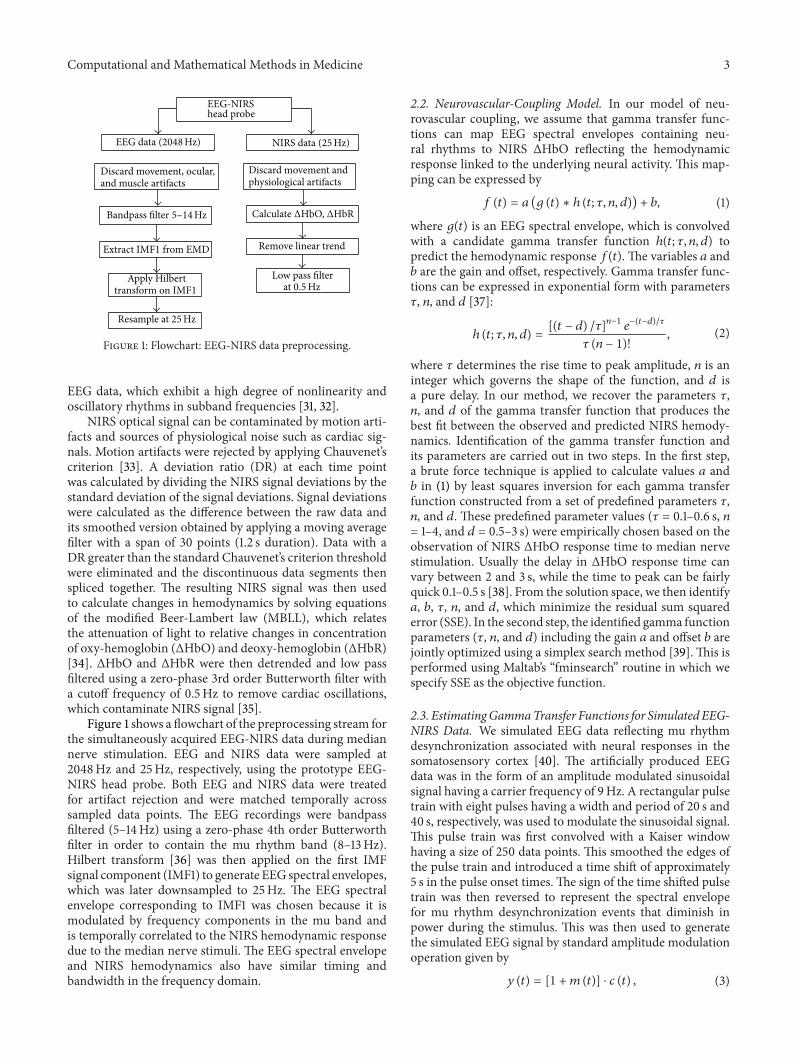
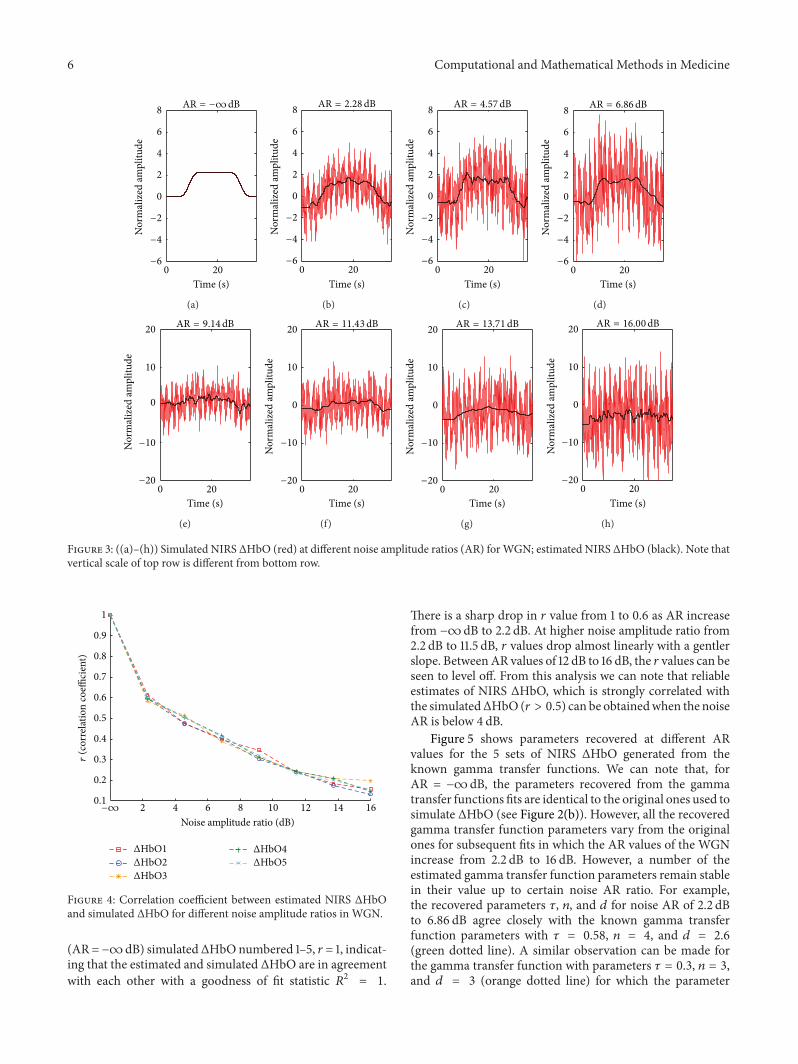
Figures 3(a)–3(h) show simulated noise titrated ΔHbOepoch data (red) obtained from convolution of the IMF1spectral envelope in Figure 2(a) with a gamma transferfunction having parameters 𝜏 = 0.3 s, 𝑛 = 2, and 𝑑 = 2 s (seegamma function in blue, Figure 2(b)). For each of the 8ΔHbOepoch data, the estimated ΔHbO are shown overlaid in black.Perfect fit is obtained when the noise AR is −∞ dB, whichis practically zero noise level. At higher levels of noise, theestimated ΔHbO has poorer fits with the simulated ΔHbO.However, the estimated ΔHbO in Figures 3(b)–3(d) seemsto follow the dynamics of the noise-free simulated ΔHbO inFigure 3(a). At noise AR of 9 dB and higher, the estimatedΔHbOno longer exhibit the dynamics of noise-free simulatedΔHbO. Similar trends are observed for ΔHbO epoch datasimulated using the other gamma transfer functions.
Figure 4 shows the Pearson’s correlation 𝑟 values betweenthe estimated ΔHbO and the simulated ΔHbO numbered1 through 5 against noise AR in WGN. For the noise-free
6 Computational and Mathematical Methods in Medicine
8
6
4
2
0
−2
−4
−60 20
AR = −∞dB
Time (s)
Nor
mal
ized
ampl
itude
(a)
AR = 2.28dB
0 20
Time (s)
8
6
4
2
0
−2
−4
−6
Nor
mal
ized
ampl
itude
(b)
AR = 4.57dB
0 20
Time (s)
8
6
4
2
0
−2
−4
−6
Nor
mal
ized
ampl
itude
(c)
AR = 6.86dB
0 20
Time (s)
8
6
4
2
0
−2
−4
−6
Nor
mal
ized
ampl
itude
(d)
−20
−10
AR = 9.14dB
Nor
mal
ized
ampl
itude
0
0
20
20
10
Time (s)
(e)
AR = 11.43dB
0
−20
−10
Nor
mal
ized
ampl
itude
0 20
20
10
Time (s)
(f)
AR = 13.71dB
0
−20
−10
Nor
mal
ized
ampl
itude
0 20
20
10
Time (s)
(g)
AR = 16.00dB
−20
−10
Nor
mal
ized
ampl
itude
0 20
20
10
Time (s)
0
(h)
Figure 3: ((a)–(h)) Simulated NIRS ΔHbO (red) at different noise amplitude ratios (AR) forWGN; estimated NIRS ΔHbO (black). Note thatvertical scale of top row is different from bottom row.
1
0.9
0.8
0.7
0.6
0.5
0.4
0.3
0.2
0.1−∞ 2 4 6 8 10 12 14 16
r(c
orre
latio
n co
effici
ent)
Noise amplitude ratio (dB)
ΔHbO1ΔHbO2ΔHbO3
ΔHbO4ΔHbO5
Figure 4: Correlation coefficient between estimated NIRS ΔHbOand simulated ΔHbO for different noise amplitude ratios in WGN.
(AR =−∞ dB) simulatedΔHbOnumbered 1–5, 𝑟 = 1, indicat-ing that the estimated and simulated ΔHbO are in agreementwith each other with a goodness of fit statistic 𝑅2 = 1.
There is a sharp drop in 𝑟 value from 1 to 0.6 as AR increasefrom −∞ dB to 2.2 dB. At higher noise amplitude ratio from2.2 dB to 11.5 dB, 𝑟 values drop almost linearly with a gentlerslope. BetweenAR values of 12 dB to 16 dB, the 𝑟 values can beseen to level off. From this analysis we can note that reliableestimates of NIRS ΔHbO, which is strongly correlated withthe simulatedΔHbO(𝑟 > 0.5) can be obtainedwhen the noiseAR is below 4 dB.
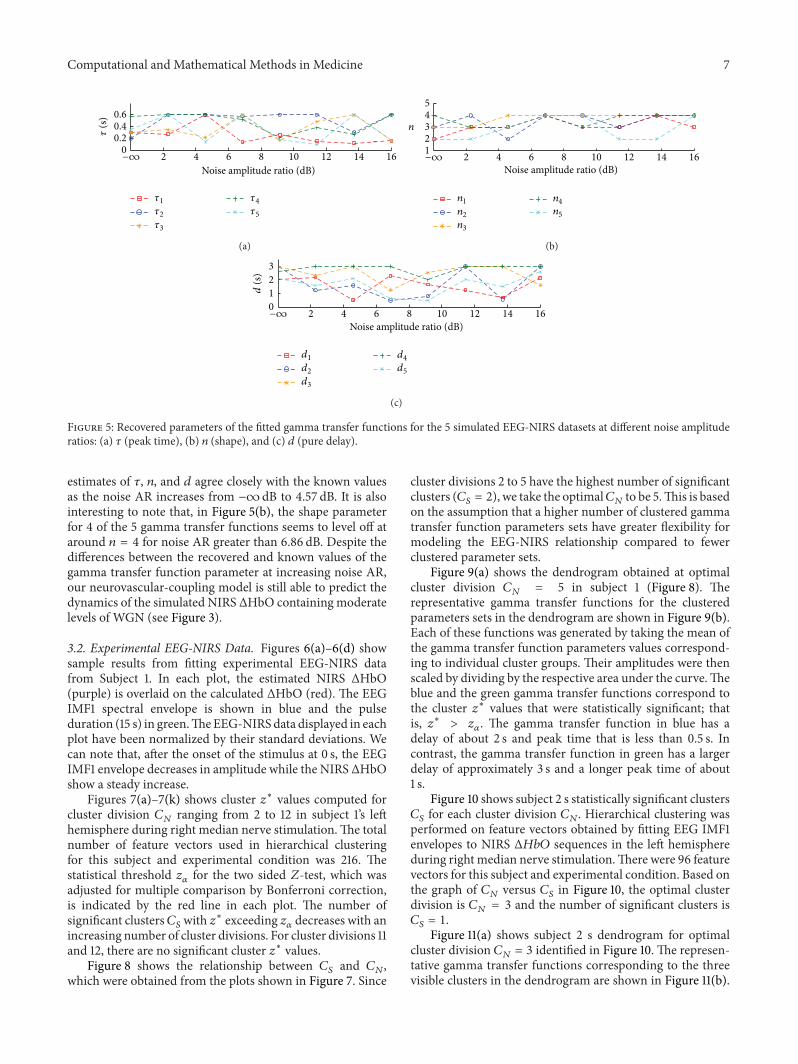
Figure 5 shows parameters recovered at different ARvalues for the 5 sets of NIRS ΔHbO generated from theknown gamma transfer functions. We can note that, forAR = −∞ dB, the parameters recovered from the gammatransfer functions fits are identical to the original ones used tosimulate ΔHbO (see Figure 2(b)). However, all the recoveredgamma transfer function parameters vary from the originalones for subsequent fits in which the AR values of the WGNincrease from 2.2 dB to 16 dB. However, a number of theestimated gamma transfer function parameters remain stablein their value up to certain noise AR ratio. For example,the recovered parameters 𝜏, 𝑛, and 𝑑 for noise AR of 2.2 dBto 6.86 dB agree closely with the known gamma transferfunction parameters with 𝜏 = 0.58, 𝑛 = 4, and 𝑑 = 2.6
(green dotted line). A similar observation can be made forthe gamma transfer function with parameters 𝜏 = 0.3, 𝑛 = 3,and 𝑑 = 3 (orange dotted line) for which the parameter
Computational and Mathematical Methods in Medicine 7
𝜏(s
)
𝜏1
𝜏2
𝜏3
𝜏4
𝜏5
0.6
0.4
0.2
0−∞ 2 4 6 8 10 12 14 16
Noise amplitude ratio (dB)
(a)
n
n1
n2
n3
n4
n5
1
2
3
4
5
−∞ 2 4 6 8 10 12 14 16
Noise amplitude ratio (dB)
(b)d
(s)
d1
d2
d3
d4
d5
1
0
2
3
−∞ 2 4 6 8 10 12 14 16
Noise amplitude ratio (dB)
(c)
Figure 5: Recovered parameters of the fitted gamma transfer functions for the 5 simulated EEG-NIRS datasets at different noise amplituderatios: (a) 𝜏 (peak time), (b) 𝑛 (shape), and (c) 𝑑 (pure delay).
estimates of 𝜏, 𝑛, and 𝑑 agree closely with the known valuesas the noise AR increases from −∞ dB to 4.57 dB. It is alsointeresting to note that, in Figure 5(b), the shape parameterfor 4 of the 5 gamma transfer functions seems to level off ataround 𝑛 = 4 for noise AR greater than 6.86 dB. Despite thedifferences between the recovered and known values of thegamma transfer function parameter at increasing noise AR,our neurovascular-coupling model is still able to predict thedynamics of the simulated NIRS ΔHbO containing moderatelevels of WGN (see Figure 3).
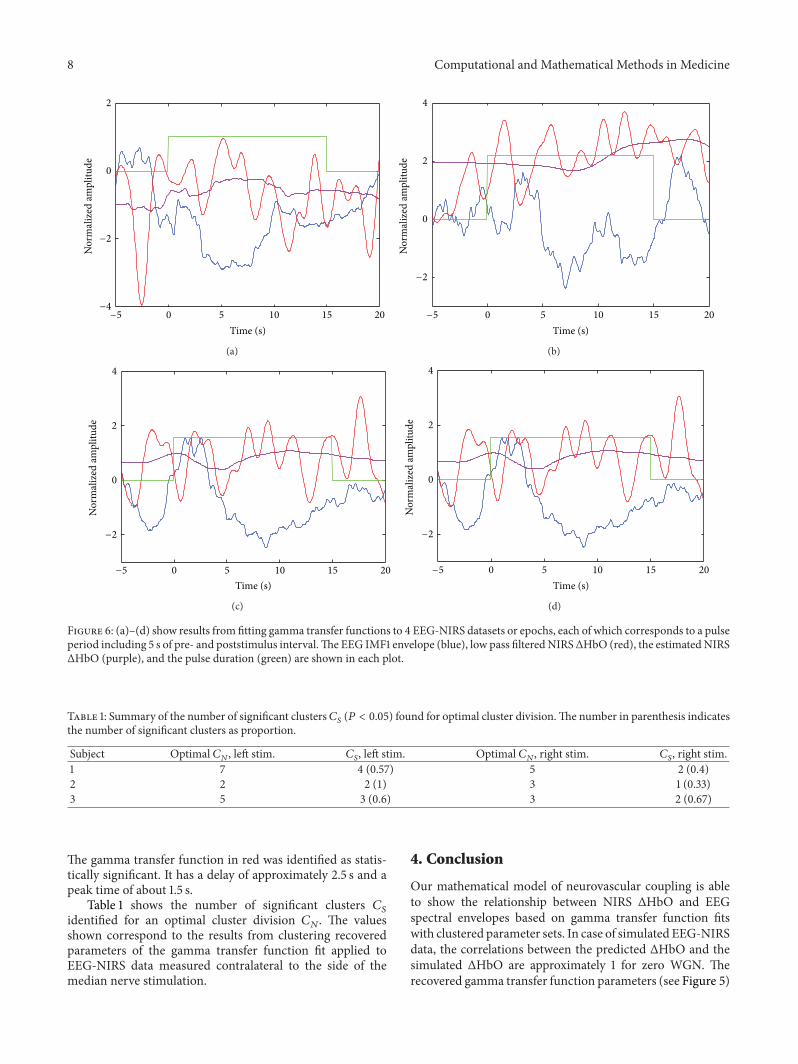
3.2. Experimental EEG-NIRS Data. Figures 6(a)–6(d) showsample results from fitting experimental EEG-NIRS datafrom Subject 1. In each plot, the estimated NIRS ΔHbO(purple) is overlaid on the calculated ΔHbO (red). The EEGIMF1 spectral envelope is shown in blue and the pulseduration (15 s) in green.TheEEG-NIRSdata displayed in eachplot have been normalized by their standard deviations. Wecan note that, after the onset of the stimulus at 0 s, the EEGIMF1 envelope decreases in amplitude while the NIRS ΔHbOshow a steady increase.
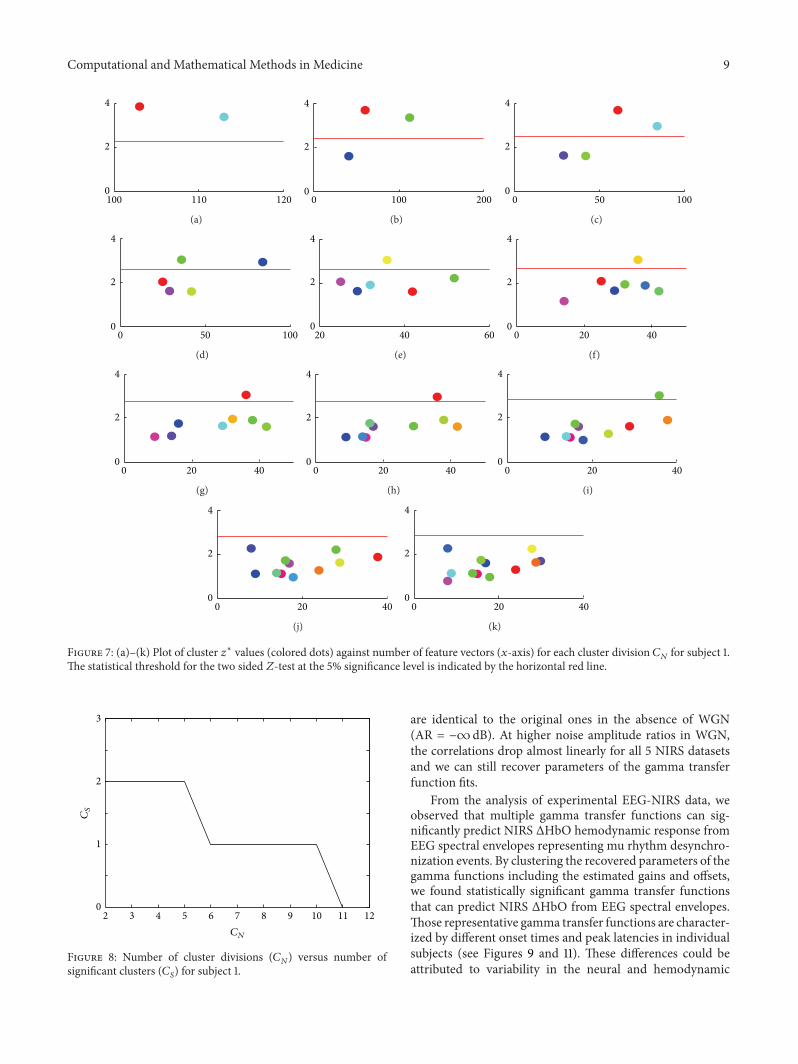
Figures 7(a)–7(k) shows cluster 𝑧∗ values computed forcluster division 𝐶
𝑁ranging from 2 to 12 in subject 1’s left
hemisphere during right median nerve stimulation.The totalnumber of feature vectors used in hierarchical clusteringfor this subject and experimental condition was 216. Thestatistical threshold 𝑧
𝛼for the two sided 𝑍-test, which was
adjusted for multiple comparison by Bonferroni correction,is indicated by the red line in each plot. The number ofsignificant clusters𝐶
𝑆with 𝑧∗ exceeding 𝑧
𝛼decreases with an
increasing number of cluster divisions. For cluster divisions 11and 12, there are no significant cluster 𝑧∗ values.
Figure 8 shows the relationship between 𝐶𝑆and 𝐶
𝑁,
which were obtained from the plots shown in Figure 7. Since
cluster divisions 2 to 5 have the highest number of significantclusters (𝐶
𝑆= 2), we take the optimal𝐶
𝑁to be 5.This is based
on the assumption that a higher number of clustered gammatransfer function parameters sets have greater flexibility formodeling the EEG-NIRS relationship compared to fewerclustered parameter sets.
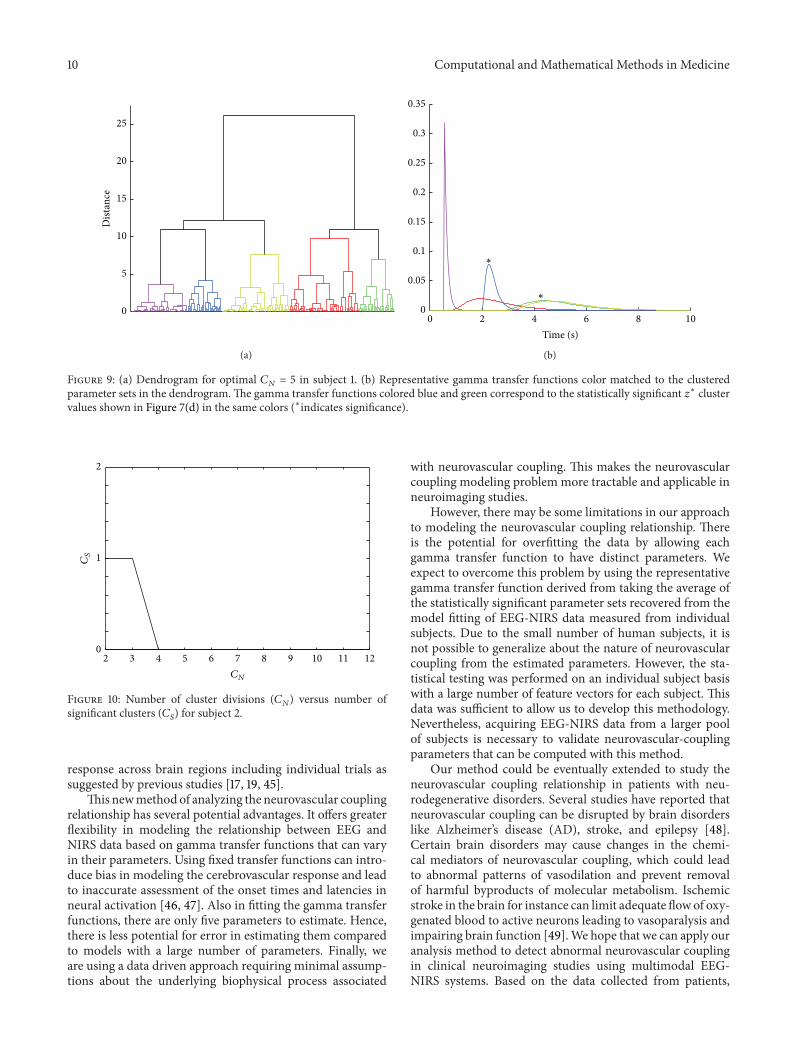
Figure 9(a) shows the dendrogram obtained at optimalcluster division 𝐶
𝑁= 5 in subject 1 (Figure 8). The
representative gamma transfer functions for the clusteredparameters sets in the dendrogram are shown in Figure 9(b).Each of these functions was generated by taking the mean ofthe gamma transfer function parameters values correspond-ing to individual cluster groups. Their amplitudes were thenscaled by dividing by the respective area under the curve.Theblue and the green gamma transfer functions correspond tothe cluster 𝑧∗ values that were statistically significant; thatis, 𝑧∗ > 𝑧
𝛼. The gamma transfer function in blue has a
delay of about 2 s and peak time that is less than 0.5 s. Incontrast, the gamma transfer function in green has a largerdelay of approximately 3 s and a longer peak time of about1 s.
Figure 10 shows subject 2 s statistically significant clusters𝐶𝑆for each cluster division 𝐶
𝑁. Hierarchical clustering was
performed on feature vectors obtained by fitting EEG IMF1envelopes to NIRS Δ𝐻𝑏𝑂 sequences in the left hemisphereduring right median nerve stimulation.There were 96 featurevectors for this subject and experimental condition. Based onthe graph of 𝐶
𝑁versus 𝐶
𝑆in Figure 10, the optimal cluster
division is 𝐶𝑁= 3 and the number of significant clusters is
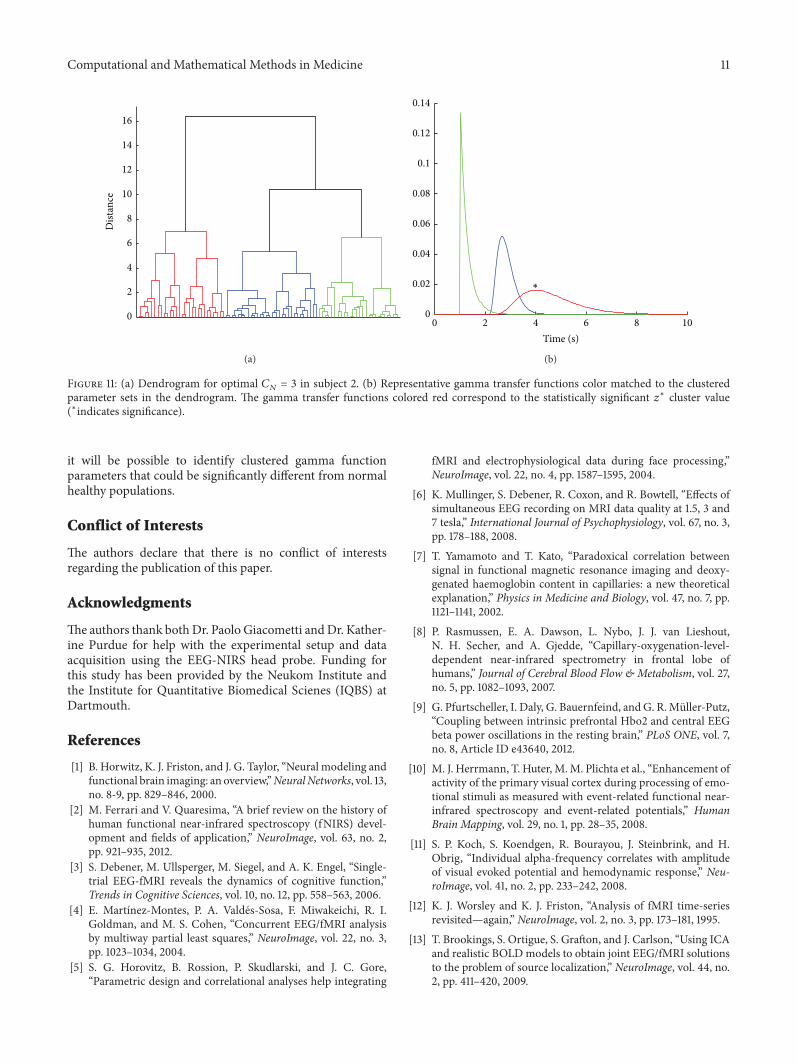
𝐶𝑆= 1.Figure 11(a) shows subject 2 s dendrogram for optimal
cluster division 𝐶𝑁= 3 identified in Figure 10. The represen-
tative gamma transfer functions corresponding to the threevisible clusters in the dendrogram are shown in Figure 11(b).
8 Computational and Mathematical Methods in Medicine
2
0
−2
−4−5 0 5 10 15 20
Time (s)
Nor
mal
ized
ampl
itude
(a)
−5 0 5 10 15 20
Time (s)
2
4
0
−2
Nor
mal
ized
ampl
itude
(b)
−5 0 5 10 15 20
Time (s)
4
2
0
−2
Nor
mal
ized
ampl
itude
(c)
−5 0 5 10 15 20
Time (s)
4
2
0
−2
Nor
mal
ized
ampl
itude
(d)
Figure 6: (a)–(d) show results from fitting gamma transfer functions to 4 EEG-NIRS datasets or epochs, each of which corresponds to a pulseperiod including 5 s of pre- and poststimulus interval.The EEG IMF1 envelope (blue), low pass filtered NIRSΔHbO (red), the estimated NIRSΔHbO (purple), and the pulse duration (green) are shown in each plot.
Table 1: Summary of the number of significant clusters 𝐶𝑆(𝑃 < 0.05) found for optimal cluster division.The number in parenthesis indicates
the number of significant clusters as proportion.
Subject Optimal 𝐶𝑁, left stim. 𝐶
𝑆, left stim. Optimal 𝐶
𝑁, right stim. 𝐶
𝑆, right stim.
1 7 4 (0.57) 5 2 (0.4)2 2 2 (1) 3 1 (0.33)3 5 3 (0.6) 3 2 (0.67)
The gamma transfer function in red was identified as statis-tically significant. It has a delay of approximately 2.5 s and apeak time of about 1.5 s.
Table 1 shows the number of significant clusters 𝐶𝑆
identified for an optimal cluster division 𝐶𝑁. The values
shown correspond to the results from clustering recoveredparameters of the gamma transfer function fit applied toEEG-NIRS data measured contralateral to the side of themedian nerve stimulation.
4. Conclusion
Our mathematical model of neurovascular coupling is ableto show the relationship between NIRS ΔHbO and EEGspectral envelopes based on gamma transfer function fitswith clustered parameter sets. In case of simulated EEG-NIRSdata, the correlations between the predicted ΔHbO and thesimulated ΔHbO are approximately 1 for zero WGN. Therecovered gamma transfer function parameters (see Figure 5)
Computational and Mathematical Methods in Medicine 9
4
2
0100 110 120
(a)
4
2
00 100 200
(b)
4
2
00 50 100
(c)
4
2
00 50 100
(d)
4
2
020 40 60
(e)
4
2
00 20 40
(f)
4
2
00 20 40
(g)
4
2
00 20 40
(h)
4
2
00 20 40
(i)
4
2
00 20 40
(j)
4
2
00 20 40
(k)
Figure 7: (a)–(k) Plot of cluster 𝑧∗ values (colored dots) against number of feature vectors (𝑥-axis) for each cluster division 𝐶𝑁for subject 1.
The statistical threshold for the two sided 𝑍-test at the 5% significance level is indicated by the horizontal red line.
2 3 4 5 6 7 8 9 10 11 120
1
2
3
CN
CS
Figure 8: Number of cluster divisions (𝐶𝑁) versus number of
significant clusters (𝐶𝑆) for subject 1.
are identical to the original ones in the absence of WGN(AR = −∞ dB). At higher noise amplitude ratios in WGN,the correlations drop almost linearly for all 5 NIRS datasetsand we can still recover parameters of the gamma transferfunction fits.
From the analysis of experimental EEG-NIRS data, weobserved that multiple gamma transfer functions can sig-nificantly predict NIRS ΔHbO hemodynamic response fromEEG spectral envelopes representing mu rhythm desynchro-nization events. By clustering the recovered parameters of thegamma functions including the estimated gains and offsets,we found statistically significant gamma transfer functionsthat can predict NIRS ΔHbO from EEG spectral envelopes.Those representative gamma transfer functions are character-ized by different onset times and peak latencies in individualsubjects (see Figures 9 and 11). These differences could beattributed to variability in the neural and hemodynamic
10 Computational and Mathematical Methods in Medicine
0
5
10
15
20
25D
istan
ce
(a)
0 2 4 6 8 100
0.05
0.1
0.15
0.2
0.25
0.3
0.35
Time (s)
∗
∗
(b)
Figure 9: (a) Dendrogram for optimal 𝐶𝑁= 5 in subject 1. (b) Representative gamma transfer functions color matched to the clustered
parameter sets in the dendrogram.The gamma transfer functions colored blue and green correspond to the statistically significant 𝑧∗ clustervalues shown in Figure 7(d) in the same colors (∗indicates significance).
2 3 4 5 6 7 8 9 10 11 120
1
2
CN
CS
Figure 10: Number of cluster divisions (𝐶𝑁) versus number of
significant clusters (𝐶𝑆) for subject 2.
response across brain regions including individual trials assuggested by previous studies [17, 19, 45].
This newmethod of analyzing the neurovascular couplingrelationship has several potential advantages. It offers greaterflexibility in modeling the relationship between EEG andNIRS data based on gamma transfer functions that can varyin their parameters. Using fixed transfer functions can intro-duce bias in modeling the cerebrovascular response and leadto inaccurate assessment of the onset times and latencies inneural activation [46, 47]. Also in fitting the gamma transferfunctions, there are only five parameters to estimate. Hence,there is less potential for error in estimating them comparedto models with a large number of parameters. Finally, weare using a data driven approach requiring minimal assump-tions about the underlying biophysical process associated
with neurovascular coupling. This makes the neurovascularcoupling modeling problem more tractable and applicable inneuroimaging studies.
However, there may be some limitations in our approachto modeling the neurovascular coupling relationship. Thereis the potential for overfitting the data by allowing eachgamma transfer function to have distinct parameters. Weexpect to overcome this problem by using the representativegamma transfer function derived from taking the average ofthe statistically significant parameter sets recovered from themodel fitting of EEG-NIRS data measured from individualsubjects. Due to the small number of human subjects, it isnot possible to generalize about the nature of neurovascularcoupling from the estimated parameters. However, the sta-tistical testing was performed on an individual subject basiswith a large number of feature vectors for each subject. Thisdata was sufficient to allow us to develop this methodology.Nevertheless, acquiring EEG-NIRS data from a larger poolof subjects is necessary to validate neurovascular-couplingparameters that can be computed with this method.
Our method could be eventually extended to study theneurovascular coupling relationship in patients with neu-rodegenerative disorders. Several studies have reported thatneurovascular coupling can be disrupted by brain disorderslike Alzheimer’s disease (AD), stroke, and epilepsy [48].Certain brain disorders may cause changes in the chemi-cal mediators of neurovascular coupling, which could leadto abnormal patterns of vasodilation and prevent removalof harmful byproducts of molecular metabolism. Ischemicstroke in the brain for instance can limit adequate flow of oxy-genated blood to active neurons leading to vasoparalysis andimpairing brain function [49].We hope that we can apply ouranalysis method to detect abnormal neurovascular couplingin clinical neuroimaging studies using multimodal EEG-NIRS systems. Based on the data collected from patients,
Computational and Mathematical Methods in Medicine 11
0
2
4
6
8
10
12
14
16D
istan
ce
(a)
0 2 4 6 8 100
0.02
0.04
0.06
0.08
0.1
0.12
0.14
Time (s)
∗
(b)
Figure 11: (a) Dendrogram for optimal 𝐶𝑁= 3 in subject 2. (b) Representative gamma transfer functions color matched to the clustered
parameter sets in the dendrogram. The gamma transfer functions colored red correspond to the statistically significant 𝑧∗ cluster value(∗indicates significance).
it will be possible to identify clustered gamma functionparameters that could be significantly different from normalhealthy populations.
Conflict of Interests
The authors declare that there is no conflict of interestsregarding the publication of this paper.
Acknowledgments
The authors thank bothDr. Paolo Giacometti andDr. Kather-ine Purdue for help with the experimental setup and dataacquisition using the EEG-NIRS head probe. Funding forthis study has been provided by the Neukom Institute andthe Institute for Quantitative Biomedical Scienes (IQBS) atDartmouth.
References
[1] B. Horwitz, K. J. Friston, and J. G. Taylor, “Neural modeling andfunctional brain imaging: an overview,”NeuralNetworks, vol. 13,no. 8-9, pp. 829–846, 2000.
[2] M. Ferrari and V. Quaresima, “A brief review on the history ofhuman functional near-infrared spectroscopy (fNIRS) devel-opment and fields of application,” NeuroImage, vol. 63, no. 2,pp. 921–935, 2012.
[3] S. Debener, M. Ullsperger, M. Siegel, and A. K. Engel, “Single-trial EEG-fMRI reveals the dynamics of cognitive function,”Trends in Cognitive Sciences, vol. 10, no. 12, pp. 558–563, 2006.
[4] E. Martınez-Montes, P. A. Valdes-Sosa, F. Miwakeichi, R. I.Goldman, and M. S. Cohen, “Concurrent EEG/fMRI analysisby multiway partial least squares,” NeuroImage, vol. 22, no. 3,pp. 1023–1034, 2004.
[5] S. G. Horovitz, B. Rossion, P. Skudlarski, and J. C. Gore,“Parametric design and correlational analyses help integrating
fMRI and electrophysiological data during face processing,”NeuroImage, vol. 22, no. 4, pp. 1587–1595, 2004.
[6] K. Mullinger, S. Debener, R. Coxon, and R. Bowtell, “Effects ofsimultaneous EEG recording on MRI data quality at 1.5, 3 and7 tesla,” International Journal of Psychophysiology, vol. 67, no. 3,pp. 178–188, 2008.
[7] T. Yamamoto and T. Kato, “Paradoxical correlation betweensignal in functional magnetic resonance imaging and deoxy-genated haemoglobin content in capillaries: a new theoreticalexplanation,” Physics in Medicine and Biology, vol. 47, no. 7, pp.1121–1141, 2002.
[8] P. Rasmussen, E. A. Dawson, L. Nybo, J. J. van Lieshout,N. H. Secher, and A. Gjedde, “Capillary-oxygenation-level-dependent near-infrared spectrometry in frontal lobe ofhumans,” Journal of Cerebral Blood Flow & Metabolism, vol. 27,no. 5, pp. 1082–1093, 2007.
[9] G. Pfurtscheller, I. Daly, G. Bauernfeind, andG. R.Muller-Putz,“Coupling between intrinsic prefrontal Hbo2 and central EEGbeta power oscillations in the resting brain,” PLoS ONE, vol. 7,no. 8, Article ID e43640, 2012.
[10] M. J. Herrmann, T. Huter, M.M. Plichta et al., “Enhancement ofactivity of the primary visual cortex during processing of emo-tional stimuli as measured with event-related functional near-infrared spectroscopy and event-related potentials,” HumanBrain Mapping, vol. 29, no. 1, pp. 28–35, 2008.
[11] S. P. Koch, S. Koendgen, R. Bourayou, J. Steinbrink, and H.Obrig, “Individual alpha-frequency correlates with amplitudeof visual evoked potential and hemodynamic response,” Neu-roImage, vol. 41, no. 2, pp. 233–242, 2008.
[12] K. J. Worsley and K. J. Friston, “Analysis of fMRI time-seriesrevisited—again,” NeuroImage, vol. 2, no. 3, pp. 173–181, 1995.
[13] T. Brookings, S. Ortigue, S. Grafton, and J. Carlson, “Using ICAand realistic BOLDmodels to obtain joint EEG/fMRI solutionsto the problem of source localization,” NeuroImage, vol. 44, no.2, pp. 411–420, 2009.
12 Computational and Mathematical Methods in Medicine
[14] G. H. Glover, “Deconvolution of impulse response in event-related BOLD fMRI,” NeuroImage, vol. 9, no. 4, pp. 416–429,1999.
[15] K. J. Friston, A. P. Holmes, K. J. Worsley, J.-P. Poline, C. D.Frith, and R. S. J. Frackowiak, “Statistical parametric maps infunctional imaging: a general linear approach,” Human BrainMapping, vol. 2, no. 4, pp. 189–210, 1994.
[16] J. Cohen-Adad, S. Chapuisat, J. Doyon et al., “Activationdetection in diffuse optical imaging by means of the generallinearmodel,”Medical Image Analysis, vol. 11, no. 6, pp. 616–629,2007.
[17] D. A. Handwerker, J. M. Ollinger, andM. D’Esposito, “Variationof BOLD hemodynamic responses across subjects and brainregions and their effects on statistical analyses,” NeuroImage,vol. 21, no. 4, pp. 1639–1651, 2004.
[18] G. M. Boynton, S. A. Engel, and D. J. Heeger, “Linear systemsanalysis of the fMRI signal,”NeuroImage, vol. 62, no. 2, pp. 975–984, 2012.
[19] T. J. Huppert, R. D. Hoge, S. G. Diamond, M. A. Franceschini,and D. A. Boas, “A temporal comparison of BOLD, ASL,and NIRS hemodynamic responses to motor stimuli in adulthumans,” NeuroImage, vol. 29, no. 2, pp. 368–382, 2006.
[20] M. Takeuchi, E. Hori, K. Takamoto et al., “Brain corticalmapping by simultaneous recording of functional near infraredspectroscopy and electroencephalograms from the whole brainduring right median nerve stimulation,” Brain Topography, vol.22, no. 3, pp. 197–214, 2009.
[21] M. Tanosaki, Y. Hoshi, Y. Iguchi, Y. Oikawa, I. Oda, and M.Oda, “Variation of temporal characteristics in human cerebralhemodynamic responses to electric median nerve stimulation:a near-infrared spectroscopic study,” Neuroscience Letters, vol.316, no. 2, pp. 75–78, 2001.
[22] P. Giacometti and S. G. Diamond, “Compliant head probefor positioning electroencephalography electrodes and near-infrared spectroscopy optodes,” Journal of Biomedical Optics,vol. 18, no. 2, Article ID 027005, 2013.
[23] Y. Hoshi, M. Shimada, C. Sato, and Y. Iguchi, “Reevaluationof near-infrared light propagation in the adult human head:implications for functional near-infrared spectroscopy,” Journalof Biomedical Optics, vol. 10, no. 6, Article ID 064032, 2005.
[24] A. J. Bell and T. J. Sejnowski, “A non-linear informationmaximisation algorithm that performs blind separation,” inAdvances in Neural Information Processing Systems, vol. 7, pp.467–474, MIT Press, 1995.
[25] T.-P. Jung, S. Makeig, M. Westerfield, J. Townsend, E. Courch-esne, and T. J. Sejnowski, “Removal of eye activity artifacts fromvisual event-related potentials in normal and clinical subjects,”Clinical Neurophysiology, vol. 111, no. 10, pp. 1745–1758, 2000.
[26] D. Mantini, M. G. Perrucci, S. Cugini, A. Ferretti, G. L.Romani, and C. del Gratta, “Complete artifact removal forEEG recorded during continuous fMRI using independentcomponent analysis,” NeuroImage, vol. 34, no. 2, pp. 598–607,2007.
[27] S. Hoffmann and M. Falkenstein, “The correction of eye blinkartefacts in the EEG: a comparison of two prominent methods,”PLoS ONE, vol. 3, no. 8, Article ID e3004, 2008.
[28] P. Flandrin, G. Rilling, and P. Goncalves, “Empirical modedecomposition as a filter bank,” IEEE Signal Processing Letters,vol. 11, no. 2, pp. 112–114, 2004.
[29] S. Qian and D. Chen, “Joint time-frequency analysis,” IEEESignal Processing Magazine, vol. 16, no. 2, pp. 52–67, 1999.
[30] P. S. Addison, “Wavelet transforms and the ECG: a review,”Physiological Measurement, vol. 26, no. 5, pp. R155–R199, 2005.
[31] H. Liang, S. L. Bressler, R. Desimone, and P. Fries, “Empiricalmode decomposition: a method for analyzing neural data,”Neurocomputing, vol. 65-66, pp. 801–807, 2005.
[32] Z. Mehboob and H. Yin, “Information quantification of empir-ical mode decomposition and applications to field potentials,”International Journal of Neural Systems, vol. 21, no. 1, pp. 49–63,2011.
[33] T. Talukdar, J. H. Moore, and S. G. Diamond, “Continuouscorrection of differential path length factor in near-infraredspectroscopy,” Journal of Biomedical Optics, vol. 18, no. 5, ArticleID 056001, 2013.
[34] A. Villringer and B. Chance, “Non-invasive optical spec-troscopy and imaging of human brain function,” Trends inNeurosciences, vol. 20, no. 10, pp. 435–442, 1997.
[35] J. P. Holman and W. J. Gajda, Experimental Methods forEngineers, vol. 2, McGraw-Hill, New York, NY, USA, 1994.
[36] N. E. Huang and S. S. Shen, Hilbert-Huang Transform and ItsApplications, vol. 5, World Scientific, 2005.
[37] G. M. Boynton, S. A. Engel, G. H. Glover, and D. J. Heeger,“Linear systems analysis of functional magnetic resonanceimaging in human v1,” The Journal of Neuroscience, vol. 16, no.13, pp. 4207–4221, 1996.
[38] M. A. Franceschini, S. Fantini, J. H.Thompson, J. P. Culver, andD. A. Boas, “Hemodynamic evoked response of the sensorimo-tor cortex measured noninvasively with near-infrared opticalimaging,” Psychophysiology, vol. 40, no. 4, pp. 548–560, 2003.
[39] J. C. Lagarias, J. A. Reeds, M. H. Wright, and P. E. Wright,“Convergence properties of the Nelder—Mead simplex methodin low dimensions,” SIAM Journal on Optimization, vol. 9, no. 1,pp. 112–147, 1998.
[40] S. D. Muthukumaraswamy and B. W. Johnson, “Primary motorcortex activation during action observation revealed by waveletanalysis of the EEG,”Clinical Neurophysiology, vol. 115, no. 8, pp.1760–1766, 2004.
[41] T. J. Huppert, S. G. Diamond, M. A. Franceschini, and D. A.Boas, “Homer: a review of time-series analysis methods fornear-infrared spectroscopy of the brain,”Applied Optics, vol. 48,no. 10, pp. D280–D298, 2009.
[42] J. Han, M. Kamber, and J. Pei, Data Mining: Concepts andTechniques, Morgan Kaufmann, Boston, Mass, USA, 2006.
[43] L. Ferreira and D. B. Hitchcock, “A comparison of hierarchicalmethods for clustering functional data,” Communications inStatistics. Simulation and Computation, vol. 38, no. 9, pp. 1925–1949, 2009.
[44] R. V. Hogg and J. Ledolter, Applied Statistics for Engineers andPhysical Scientists, vol. 59,Macmillan,NewYork,NY,USA, 1992.
[45] G. Jasdzewski, G. Strangman, J. Wagner, K. K. Kwong, R. A.Poldrack, and D. A. Boas, “Differences in the hemodynamicresponse to event-related motor and visual paradigms as mea-sured by near-infrared spectroscopy,” NeuroImage, vol. 20, no.1, pp. 479–488, 2003.
[46] P. S. F. Bellgowan, Z. S. Saad, and P. A. Bandettini, “Under-standing neural system dynamics through task modulation andmeasurement of functionalMRI amplitude, latency, and width,”Proceedings of the National Academy of Sciences of the UnitedStates of America, vol. 100, no. 3, pp. 1415–1419, 2003.
[47] W. Richter, R. Somorjai, R. Summers et al., “Motor area activityduring mental rotation studied by time-resolved single-trialfMRI,” Journal of Cognitive Neuroscience, vol. 12, no. 2, pp. 310–320, 2000.

Computational and Mathematical Methods in Medicine 13
[48] H. Girouard and C. Iadecola, “Neurovascular coupling in thenormal brain and in hypertension, stroke, and Alzheimerdisease,” Journal of Applied Physiology, vol. 100, no. 1, pp. 328–335, 2006.
[49] C. Iadecola, “Cerebral circulatory dysregulation in ischemia,”Cerebrovascular Diseases, vol. 1, pp. 319–332, 1998.

Submit your manuscripts athttp://www.hindawi.com
Stem CellsInternational
Hindawi Publishing Corporationhttp://www.hindawi.com Volume 2014
Hindawi Publishing Corporationhttp://www.hindawi.com Volume 2014
MEDIATORSINFLAMMATION
of
Hindawi Publishing Corporationhttp://www.hindawi.com Volume 2014
Behavioural Neurology
EndocrinologyInternational Journal of
Hindawi Publishing Corporationhttp://www.hindawi.com Volume 2014
Hindawi Publishing Corporationhttp://www.hindawi.com Volume 2014
Disease Markers
Hindawi Publishing Corporationhttp://www.hindawi.com Volume 2014
BioMed Research International
OncologyJournal of
Hindawi Publishing Corporationhttp://www.hindawi.com Volume 2014
Hindawi Publishing Corporationhttp://www.hindawi.com Volume 2014
Oxidative Medicine and Cellular Longevity
Hindawi Publishing Corporationhttp://www.hindawi.com Volume 2014
PPAR Research
The Scientific World JournalHindawi Publishing Corporation http://www.hindawi.com Volume 2014
Immunology ResearchHindawi Publishing Corporationhttp://www.hindawi.com Volume 2014
Journal of
ObesityJournal of
Hindawi Publishing Corporationhttp://www.hindawi.com Volume 2014
Hindawi Publishing Corporationhttp://www.hindawi.com Volume 2014
Computational and Mathematical Methods in Medicine
OphthalmologyJournal of
Hindawi Publishing Corporationhttp://www.hindawi.com Volume 2014
Diabetes ResearchJournal of
Hindawi Publishing Corporationhttp://www.hindawi.com Volume 2014
Hindawi Publishing Corporationhttp://www.hindawi.com Volume 2014
Research and TreatmentAIDS
Hindawi Publishing Corporationhttp://www.hindawi.com Volume 2014
Gastroenterology Research and Practice
Hindawi Publishing Corporationhttp://www.hindawi.com Volume 2014
Parkinson’s Disease
Evidence-Based Complementary and Alternative Medicine
Volume 2014Hindawi Publishing Corporationhttp://www.hindawi.com


![Imaging in Neurovascular conflicts [Neurovascular compression syndrome ]](https://img.pdfslide.net/doc/110x75/559b6a361a28ab2c188b4611/imaging-in-neurovascular-conflicts-neurovascular-compression-syndrome-.jpg)