Embed Size (px)
Citation preview
Central London office analysis
RESEARCH
Q4 2020
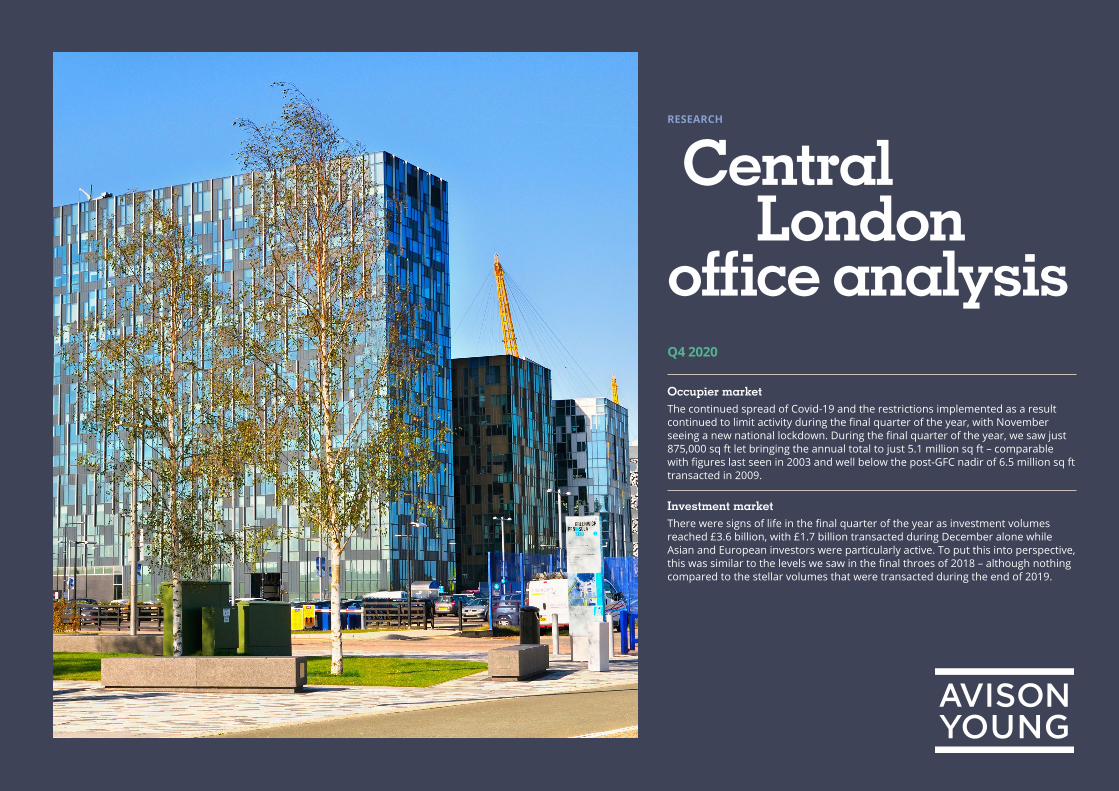
Occupier marketThe continued spread of Covid-19 and the restrictions implemented as a result continued to limit activity during the final quarter of the year, with November seeing a new national lockdown. During the final quarter of the year, we saw just 875,000 sq ft let bringing the annual total to just 5.1 million sq ft – comparable with figures last seen in 2003 and well below the post-GFC nadir of 6.5 million sq ft transacted in 2009.
Investment marketThere were signs of life in the final quarter of the year as investment volumes reached £3.6 billion, with £1.7 billion transacted during December alone while Asian and European investors were particularly active. To put this into perspective, this was similar to the levels we saw in the final throes of 2018 – although nothing compared to the stellar volumes that were transacted during the end of 2019.
THIS IS A NEW LOWThe continued spread of Covid-19 and the restrictions implemented as a result continued to limit activity during the final quarter of the year, with November seeing the start of a new national lockdown. During the final quarter of the year, we saw just 875,000 sq ft of office lettings bringing the annual total to just 5.1 million sq ft – comparable with figures last seen in 2003 and well below the post-GFC nadir of 6.5 million sq ft transacted in 2009.
Nevertheless, despite the lack of activity, there continues to be bright spots of demand, with the number of active requirements increasing slightly during early 2021. TikTok continues to be rumoured to be under offer on 86,000 sq ft at Kaleidoscope and we continue to see activity from the legal sector – during 2020, Slaughter and May, Cooley and Latham & Watkins all committed to the City through new leases or renewals.
IN THE BANKThe restrictions imposed in late 2020 and early 2021 mean that a number of occupiers are continuing to push back their return to the office plans until later in the year, when more confidence will be given by the rollout of the vaccine – with the City of London already planning a ‘reopening’ week in March.
In addition to the disruption seen by Covid-19, businesses are also continuing to adapt to new requirements brought about by the Trade Agreement between the EU and UK made on Christmas Eve. While this agreement removes the negative impact that a 'no-deal' or a deal with tariffs would have had, there continues to be significant uncertainty around the effects of Brexit on London but the UK does now have greater freedom over regulation and policy.
Perhaps most importantly, the Brexit agreement removes a key downside risk for the economy this year and much of the uncertainty around our future relationship with the EU. Macroeconomic factors directly drive real estate outcomes and a ‘no-deal’ scenario would have damaged the economy in a range of ways with consequent impacts for real estate. Beyond the elimination of this risk, there is a potential economic upside with the UK having more freedom over regulation and other policy areas which could be used to support growth that in the short-term was drowned out by the Covid-19 situation and short-lived negative news from Washington and Capitol Hill.
Nevertheless, with more detail around financial services equivalence yet to come, we are likely to see a number of businesses hold off for now on decision-making until they have more clarity. Interestingly, the CBI/PwC Financial Survey suggests that only 14% of financial services organisations consider the issue of equivalence to be ‘very important’, with an additional 54% marking the issue as ‘somewhat important’, and only 41% fully operational with regard to their dealings with the EU.
The same survey nevertheless suggests that the same financial services firms are perhaps more evolved when it comes to understanding their short-term office requirements, with 88% reviewing their estate and 57% apparently looking to cut office space.
Despite this, we are continuing to see requirements in the market. We are also now seeing a number of high profile announcements from banks who are looking to get back in the office, with Barclays and JP Morgan - both of whom have a significant footprint across the City - extolling the virtues of the office at the World Economic Forum.
WORD OF THE YEAR: BIFURCATIONDespite the travails of the year, we have seen new record rental tones set in both the West End and the City recently. In the final quarter of 2020, we saw a private family office pay £277.50 per sq ft for 2,700 sq ft at 30 Berkeley Square, W1 while at the beginning of Q1 2021 we saw Dtek, the Ukrainian energy giant rumoured to be paying £110 per sq ft at the Leadenhall Building, EC3.
This is obviously set against the backdrop of muted activity and increasing availability over the course of the year. We continue to see the supply of space in the market increase, and while a portion of that space is tenant space – with space increasing in the region of 70% during the year - which may be available at a significant discount, we are also seeing new developments coming to the market. 2020 and 2021 are likely to mark the peak of the development cycle, with developers understandably unlikely to kickstart developments in the short term.
Overall, we are witnessing ‘bifurcation’ of the market where at one end demand for new space remains relatively robust, considering the economic environment, while at the other the availability of second-hand space means that there is now a large supply of space available at discounted rents and with greater tenant incentives.
Occupier market in brief
NICK ROCKPrincipal
Despite the travails of the year, we have seen new record rental tones set in both the West End and the City recently.
“
The London market definitions have been amended to align better with up-to date market perceptions. If you require back-dated historic data, please let the Research team know.
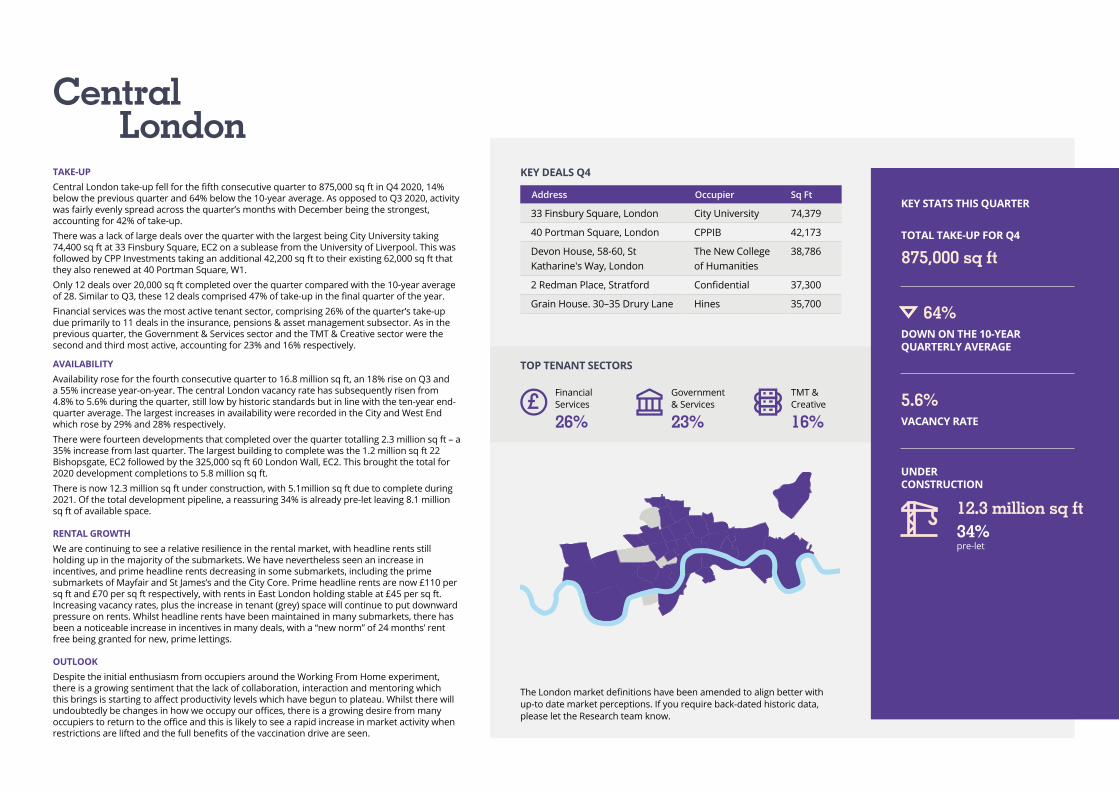
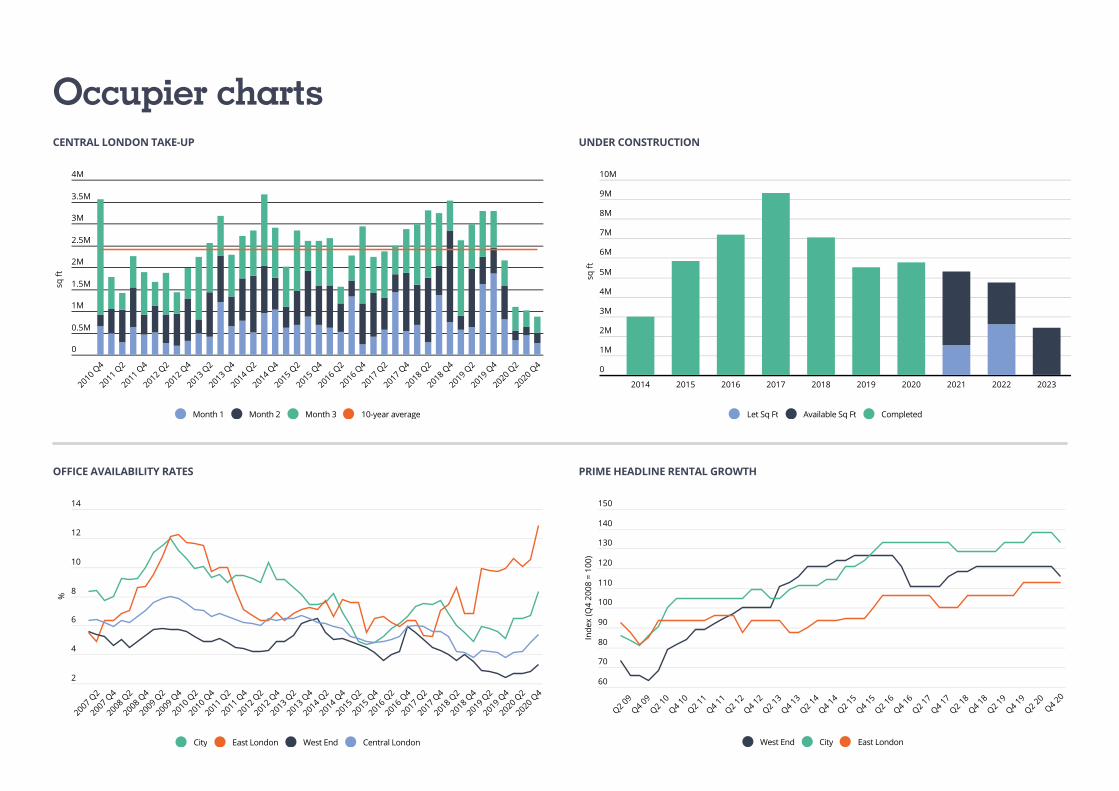
TAKE-UP Central London take-up fell for the fifth consecutive quarter to 875,000 sq ft in Q4 2020, 14% below the previous quarter and 64% below the 10-year average. As opposed to Q3 2020, activity was fairly evenly spread across the quarter’s months with December being the strongest, accounting for 42% of take-up. There was a lack of large deals over the quarter with the largest being City University taking 74,400 sq ft at 33 Finsbury Square, EC2 on a sublease from the University of Liverpool. This was followed by CPP Investments taking an additional 42,200 sq ft to their existing 62,000 sq ft that they also renewed at 40 Portman Square, W1. Only 12 deals over 20,000 sq ft completed over the quarter compared with the 10-year average of 28. Similar to Q3, these 12 deals comprised 47% of take-up in the final quarter of the year.Financial services was the most active tenant sector, comprising 26% of the quarter’s take-up due primarily to 11 deals in the insurance, pensions & asset management subsector. As in the previous quarter, the Government & Services sector and the TMT & Creative sector were the second and third most active, accounting for 23% and 16% respectively.
AVAILABILITYAvailability rose for the fourth consecutive quarter to 16.8 million sq ft, an 18% rise on Q3 and a 55% increase year-on-year. The central London vacancy rate has subsequently risen from 4.8% to 5.6% during the quarter, still low by historic standards but in line with the ten-year end-quarter average. The largest increases in availability were recorded in the City and West End which rose by 29% and 28% respectively. There were fourteen developments that completed over the quarter totalling 2.3 million sq ft – a 35% increase from last quarter. The largest building to complete was the 1.2 million sq ft 22 Bishopsgate, EC2 followed by the 325,000 sq ft 60 London Wall, EC2. This brought the total for 2020 development completions to 5.8 million sq ft.There is now 12.3 million sq ft under construction, with 5.1million sq ft due to complete during 2021. Of the total development pipeline, a reassuring 34% is already pre-let leaving 8.1 million sq ft of available space.
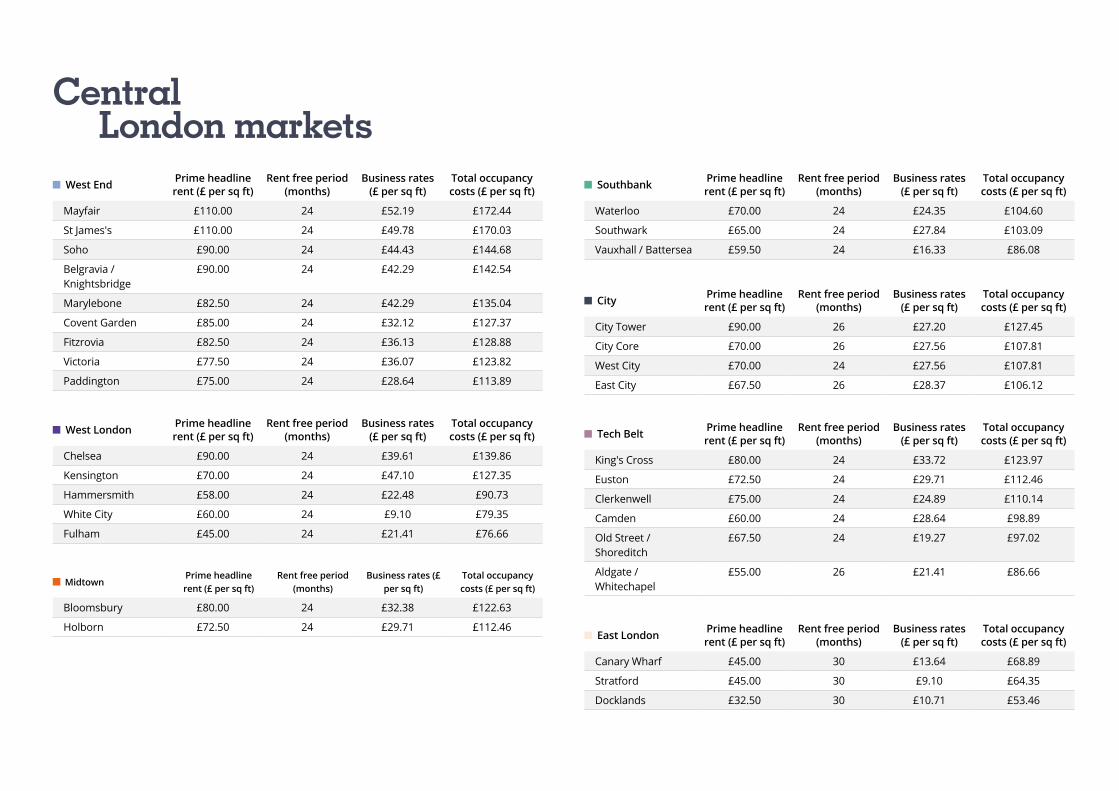
RENTAL GROWTHWe are continuing to see a relative resilience in the rental market, with headline rents still holding up in the majority of the submarkets. We have nevertheless seen an increase in incentives, and prime headline rents decreasing in some submarkets, including the prime submarkets of Mayfair and St James’s and the City Core. Prime headline rents are now £110 per sq ft and £70 per sq ft respectively, with rents in East London holding stable at £45 per sq ft. Increasing vacancy rates, plus the increase in tenant (grey) space will continue to put downward pressure on rents. Whilst headline rents have been maintained in many submarkets, there has been a noticeable increase in incentives in many deals, with a “new norm” of 24 months’ rent free being granted for new, prime lettings.
OUTLOOKDespite the initial enthusiasm from occupiers around the Working From Home experiment, there is a growing sentiment that the lack of collaboration, interaction and mentoring which this brings is starting to affect productivity levels which have begun to plateau. Whilst there will undoubtedly be changes in how we occupy our offices, there is a growing desire from many occupiers to return to the office and this is likely to see a rapid increase in market activity when restrictions are lifted and the full benefits of the vaccination drive are seen.
KEY STATS THIS QUARTER
Central London
KEY DEALS Q4
Address Occupier Sq Ft
33 Finsbury Square, London City University 74,379
40 Portman Square, London CPPIB 42,173
Devon House, 58-60, St Katharine's Way, London
The New College of Humanities
38,786
2 Redman Place, Stratford Confidential 37,300
Grain House. 30–35 Drury Lane Hines 35,700
875,000 sq ftTOTAL TAKE-UP FOR Q4
5.6%VACANCY RATE
DOWN ON THE 10-YEAR QUARTERLY AVERAGE
64%
12.3 million sq ft34%pre-let
UNDER CONSTRUCTION
TOP TENANT SECTORS
TMT & Creative
16%
Government & Services
23%
Financial Services
26%
60
70
80
90
100
110
120
130
140
150
Q2 09
Q4 09
Q2 10
Q4 10
Q2 11
Q4 11
Q2 12
Q4 12
Q2 13
Q4 13
Q2 14
Q4 14
Q2 15
Q4 15
Q2 16
Q4 16
Q2 17
Q4 17
Q2 18
Q4 18
Q2 19
Q4 19
Q2 20
Q4 20
Inde
x (Q
4 20
08 =
100
)
West End City East London
OFFICE AVAILABILITY RATES
2
4
6
8
10
12
14
2007 Q2
2007 Q4
2008 Q2
2008 Q4
2009 Q2
2009 Q4
2010 Q2
2010 Q4
2011 Q2
2011 Q4
2012 Q2
2012 Q4
2013 Q2
2013 Q4
2014 Q2
2014 Q4
2015 Q2
2015 Q4
2016 Q2
2016 Q4
2017 Q2
2017 Q4
2018 Q2
2018 Q4
2019 Q2
2019 Q4
2020 Q2
2020 Q4
%
City East London West End Central London
UNDER CONSTRUCTION
10M
9M
8M
7M
6M
5M
4M
3M
2M
1M
0
2014 2015 2016 2017 2018 2019 2020 2021 2022 2023
sq ft
Let Sq Ft Available Sq Ft Completed
PRIME HEADLINE RENTAL GROWTH
CENTRAL LONDON TAKE-UP
0
0.5M
1M
1.5M
2M
2.5M
3M
3.5M
4M
2010 Q4
2011 Q2
2011 Q4
2012 Q2
2012 Q4
2013 Q2
2013 Q4
2014 Q2
2014 Q4
2015 Q2
2015 Q4
2016 Q2
2016 Q4
2017 Q2
2017 Q4
2018 Q2
2018 Q4
2019 Q2
2019 Q4
2020 Q2
2020 Q4
sq ft
Month 1 Month 2 Month 3 10-year average
Occupier charts
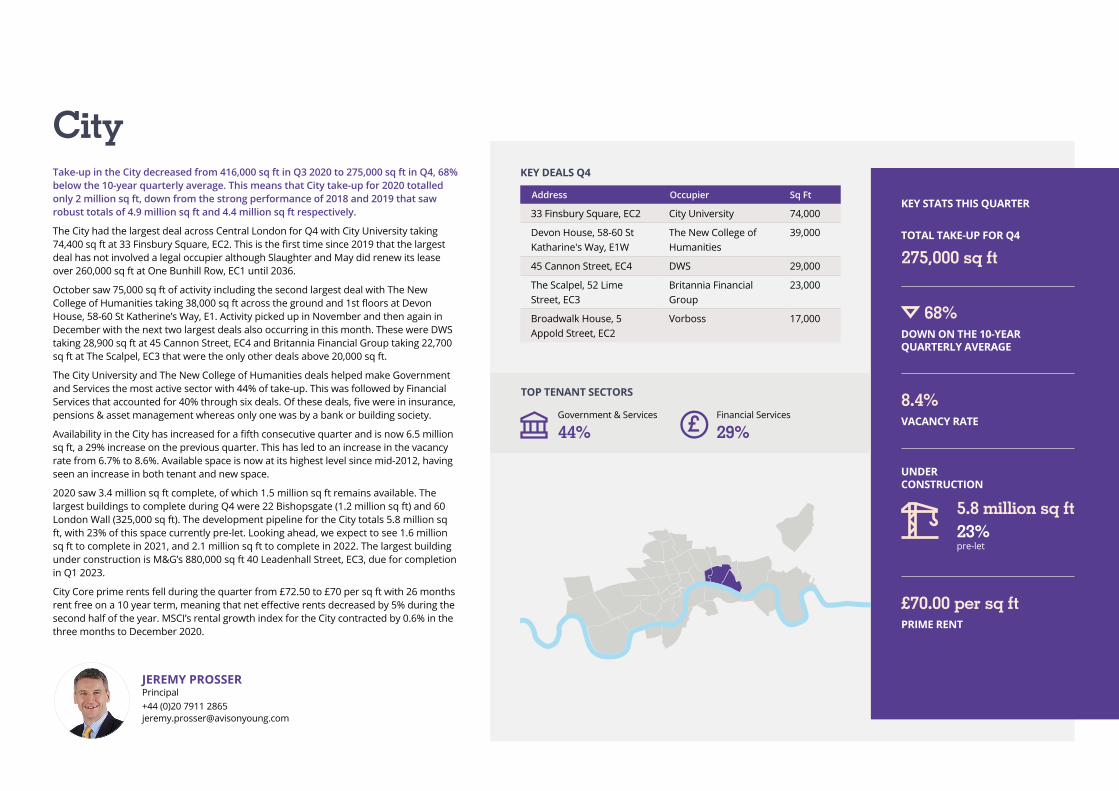
Government & Services
44%Financial Services
29%
Take-up in the City decreased from 416,000 sq ft in Q3 2020 to 275,000 sq ft in Q4, 68% below the 10-year quarterly average. This means that City take-up for 2020 totalled only 2 million sq ft, down from the strong performance of 2018 and 2019 that saw robust totals of 4.9 million sq ft and 4.4 million sq ft respectively.
The City had the largest deal across Central London for Q4 with City University taking 74,400 sq ft at 33 Finsbury Square, EC2. This is the first time since 2019 that the largest deal has not involved a legal occupier although Slaughter and May did renew its lease over 260,000 sq ft at One Bunhill Row, EC1 until 2036.
October saw 75,000 sq ft of activity including the second largest deal with The New College of Humanities taking 38,000 sq ft across the ground and 1st floors at Devon House, 58-60 St Katherine’s Way, E1. Activity picked up in November and then again in December with the next two largest deals also occurring in this month. These were DWS taking 28,900 sq ft at 45 Cannon Street, EC4 and Britannia Financial Group taking 22,700 sq ft at The Scalpel, EC3 that were the only other deals above 20,000 sq ft.
The City University and The New College of Humanities deals helped make Government and Services the most active sector with 44% of take-up. This was followed by Financial Services that accounted for 40% through six deals. Of these deals, five were in insurance, pensions & asset management whereas only one was by a bank or building society.
Availability in the City has increased for a fifth consecutive quarter and is now 6.5 million sq ft, a 29% increase on the previous quarter. This has led to an increase in the vacancy rate from 6.7% to 8.6%. Available space is now at its highest level since mid-2012, having seen an increase in both tenant and new space.
2020 saw 3.4 million sq ft complete, of which 1.5 million sq ft remains available. The largest buildings to complete during Q4 were 22 Bishopsgate (1.2 million sq ft) and 60 London Wall (325,000 sq ft). The development pipeline for the City totals 5.8 million sq ft, with 23% of this space currently pre-let. Looking ahead, we expect to see 1.6 million sq ft to complete in 2021, and 2.1 million sq ft to complete in 2022. The largest building under construction is M&G’s 880,000 sq ft 40 Leadenhall Street, EC3, due for completion in Q1 2023.
City Core prime rents fell during the quarter from £72.50 to £70 per sq ft with 26 months rent free on a 10 year term, meaning that net effective rents decreased by 5% during the second half of the year. MSCI’s rental growth index for the City contracted by 0.6% in the three months to December 2020.
KEY STATS THIS QUARTER
City
275,000 sq ftTOTAL TAKE-UP FOR Q4
8.4%VACANCY RATE
DOWN ON THE 10-YEAR QUARTERLY AVERAGE
5.8 million sq ft23%pre-let
UNDER CONSTRUCTION
TOP TENANT SECTORS
£70.00 per sq ftPRIME RENT
KEY DEALS Q4
Address Occupier Sq Ft
33 Finsbury Square, EC2 City University 74,000
Devon House, 58-60 St Katharine's Way, E1W
The New College of Humanities
39,000
45 Cannon Street, EC4 DWS 29,000
The Scalpel, 52 Lime Street, EC3
Britannia Financial Group
23,000
Broadwalk House, 5 Appold Street, EC2
Vorboss 17,000
JEREMY PROSSERPrincipal+44 (0)20 7911 2865 [email protected]
68%
Professional services
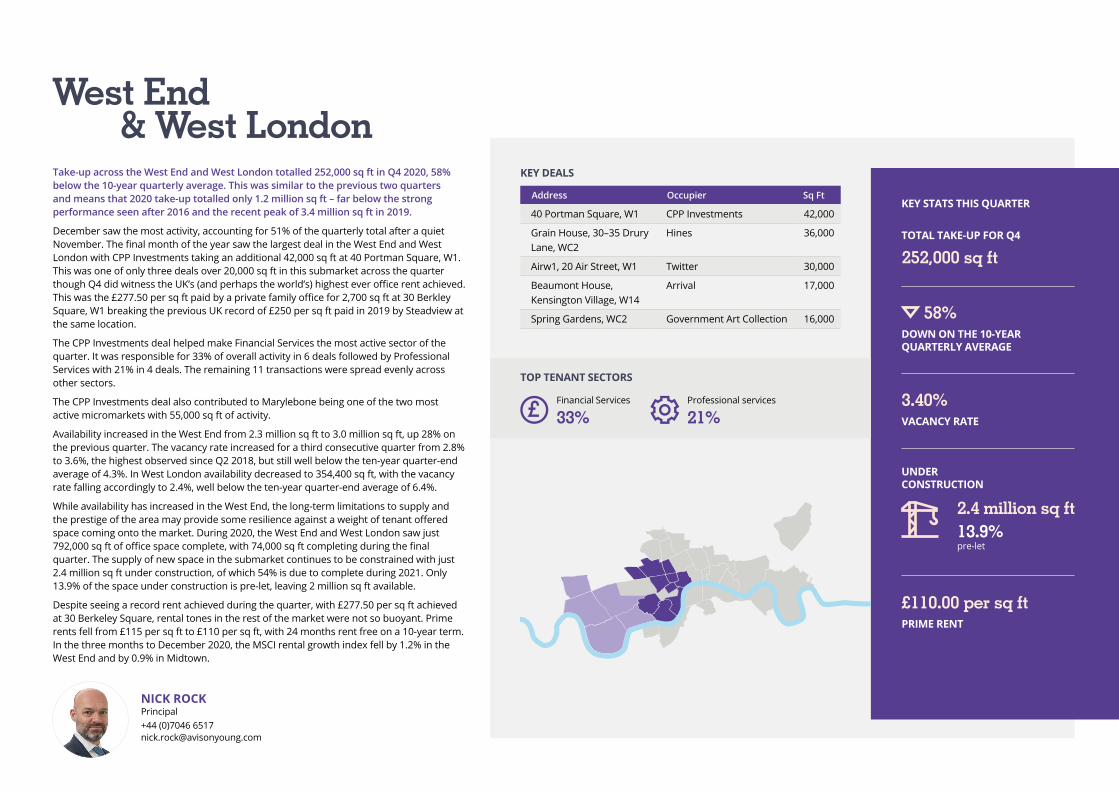
21%Financial Services
33%
Take-up across the West End and West London totalled 252,000 sq ft in Q4 2020, 58% below the 10-year quarterly average. This was similar to the previous two quarters and means that 2020 take-up totalled only 1.2 million sq ft – far below the strong performance seen after 2016 and the recent peak of 3.4 million sq ft in 2019.
December saw the most activity, accounting for 51% of the quarterly total after a quiet November. The final month of the year saw the largest deal in the West End and West London with CPP Investments taking an additional 42,000 sq ft at 40 Portman Square, W1. This was one of only three deals over 20,000 sq ft in this submarket across the quarter though Q4 did witness the UK’s (and perhaps the world’s) highest ever office rent achieved. This was the £277.50 per sq ft paid by a private family office for 2,700 sq ft at 30 Berkley Square, W1 breaking the previous UK record of £250 per sq ft paid in 2019 by Steadview at the same location.
The CPP Investments deal helped make Financial Services the most active sector of the quarter. It was responsible for 33% of overall activity in 6 deals followed by Professional Services with 21% in 4 deals. The remaining 11 transactions were spread evenly across other sectors.
The CPP Investments deal also contributed to Marylebone being one of the two most active micromarkets with 55,000 sq ft of activity.
Availability increased in the West End from 2.3 million sq ft to 3.0 million sq ft, up 28% on the previous quarter. The vacancy rate increased for a third consecutive quarter from 2.8% to 3.6%, the highest observed since Q2 2018, but still well below the ten-year quarter-end average of 4.3%. In West London availability decreased to 354,400 sq ft, with the vacancy rate falling accordingly to 2.4%, well below the ten-year quarter-end average of 6.4%.
While availability has increased in the West End, the long-term limitations to supply and the prestige of the area may provide some resilience against a weight of tenant offered space coming onto the market. During 2020, the West End and West London saw just 792,000 sq ft of office space complete, with 74,000 sq ft completing during the final quarter. The supply of new space in the submarket continues to be constrained with just 2.4 million sq ft under construction, of which 54% is due to complete during 2021. Only 13.9% of the space under construction is pre-let, leaving 2 million sq ft available.
Despite seeing a record rent achieved during the quarter, with £277.50 per sq ft achieved at 30 Berkeley Square, rental tones in the rest of the market were not so buoyant. Prime rents fell from £115 per sq ft to £110 per sq ft, with 24 months rent free on a 10-year term. In the three months to December 2020, the MSCI rental growth index fell by 1.2% in the West End and by 0.9% in Midtown.
KEY STATS THIS QUARTER
West End & West London
252,000 sq ftTOTAL TAKE-UP FOR Q4
3.40%VACANCY RATE
DOWN ON THE 10-YEAR QUARTERLY AVERAGE
58%
2.4 million sq ft13.9%pre-let
UNDER CONSTRUCTION
TOP TENANT SECTORS
£110.00 per sq ftPRIME RENT
NICK ROCKPrincipal+44 (0)7046 6517 [email protected]
KEY DEALS
Address Occupier Sq Ft
40 Portman Square, W1 CPP Investments 42,000
Grain House, 30–35 Drury Lane, WC2
Hines 36,000
Airw1, 20 Air Street, W1 Twitter 30,000
Beaumont House, Kensington Village, W14
Arrival 17,000
Spring Gardens, WC2 Government Art Collection 16,000
KEY DEALS
Address Occupier Sq Ft
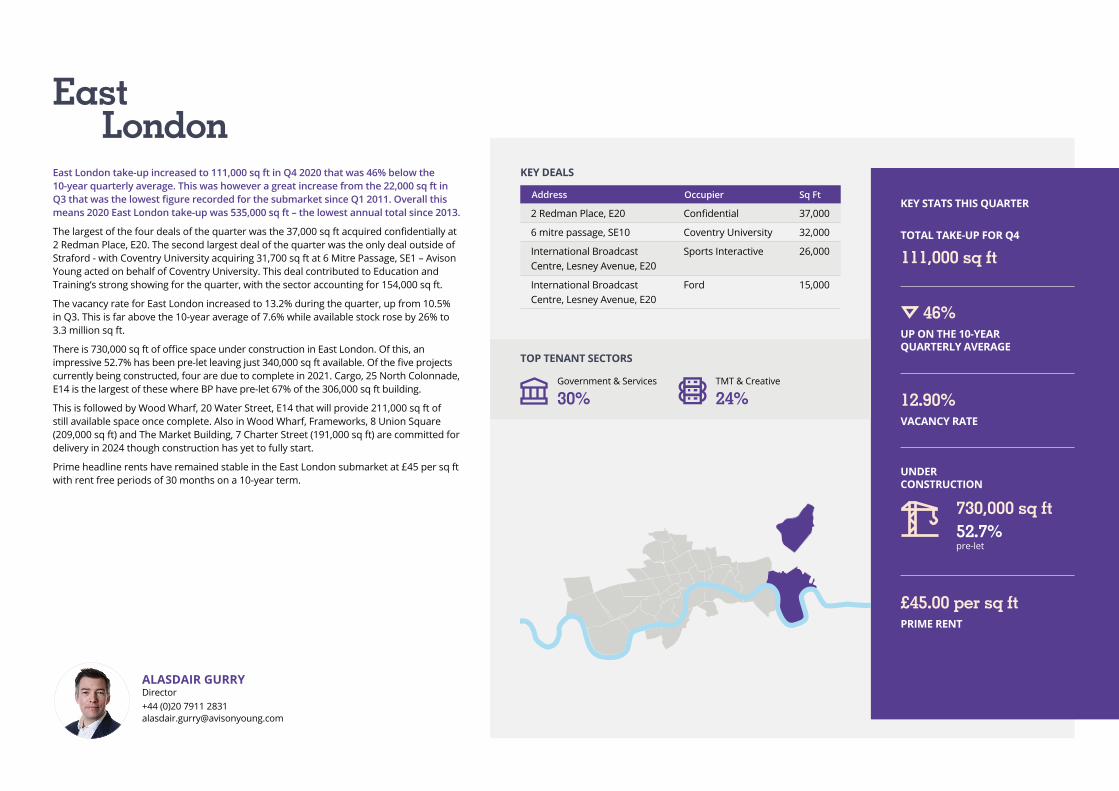
2 Redman Place, E20 Confidential 37,000
6 mitre passage, SE10 Coventry University 32,000
International Broadcast Centre, Lesney Avenue, E20
Sports Interactive 26,000
International Broadcast Centre, Lesney Avenue, E20
Ford 15,000
East London take-up increased to 111,000 sq ft in Q4 2020 that was 46% below the 10-year quarterly average. This was however a great increase from the 22,000 sq ft in Q3 that was the lowest figure recorded for the submarket since Q1 2011. Overall this means 2020 East London take-up was 535,000 sq ft – the lowest annual total since 2013.
The largest of the four deals of the quarter was the 37,000 sq ft acquired confidentially at 2 Redman Place, E20. The second largest deal of the quarter was the only deal outside of Straford - with Coventry University acquiring 31,700 sq ft at 6 Mitre Passage, SE1 – Avison Young acted on behalf of Coventry University. This deal contributed to Education and Training’s strong showing for the quarter, with the sector accounting for 154,000 sq ft.
The vacancy rate for East London increased to 13.2% during the quarter, up from 10.5% in Q3. This is far above the 10-year average of 7.6% while available stock rose by 26% to 3.3 million sq ft.
There is 730,000 sq ft of office space under construction in East London. Of this, an impressive 52.7% has been pre-let leaving just 340,000 sq ft available. Of the five projects currently being constructed, four are due to complete in 2021. Cargo, 25 North Colonnade, E14 is the largest of these where BP have pre-let 67% of the 306,000 sq ft building.
This is followed by Wood Wharf, 20 Water Street, E14 that will provide 211,000 sq ft of still available space once complete. Also in Wood Wharf, Frameworks, 8 Union Square (209,000 sq ft) and The Market Building, 7 Charter Street (191,000 sq ft) are committed for delivery in 2024 though construction has yet to fully start.
Prime headline rents have remained stable in the East London submarket at £45 per sq ft with rent free periods of 30 months on a 10-year term.
KEY STATS THIS QUARTER
East London
111,000 sq ftTOTAL TAKE-UP FOR Q4
12.90%VACANCY RATE
UP ON THE 10-YEAR QUARTERLY AVERAGE
46%
730,000 sq ft52.7%pre-let
UNDER CONSTRUCTION
£45.00 per sq ftPRIME RENT
ALASDAIR GURRYDirector+44 (0)20 7911 2831 [email protected]
Government & Services
30%
TOP TENANT SECTORS
TMT & Creative
24%
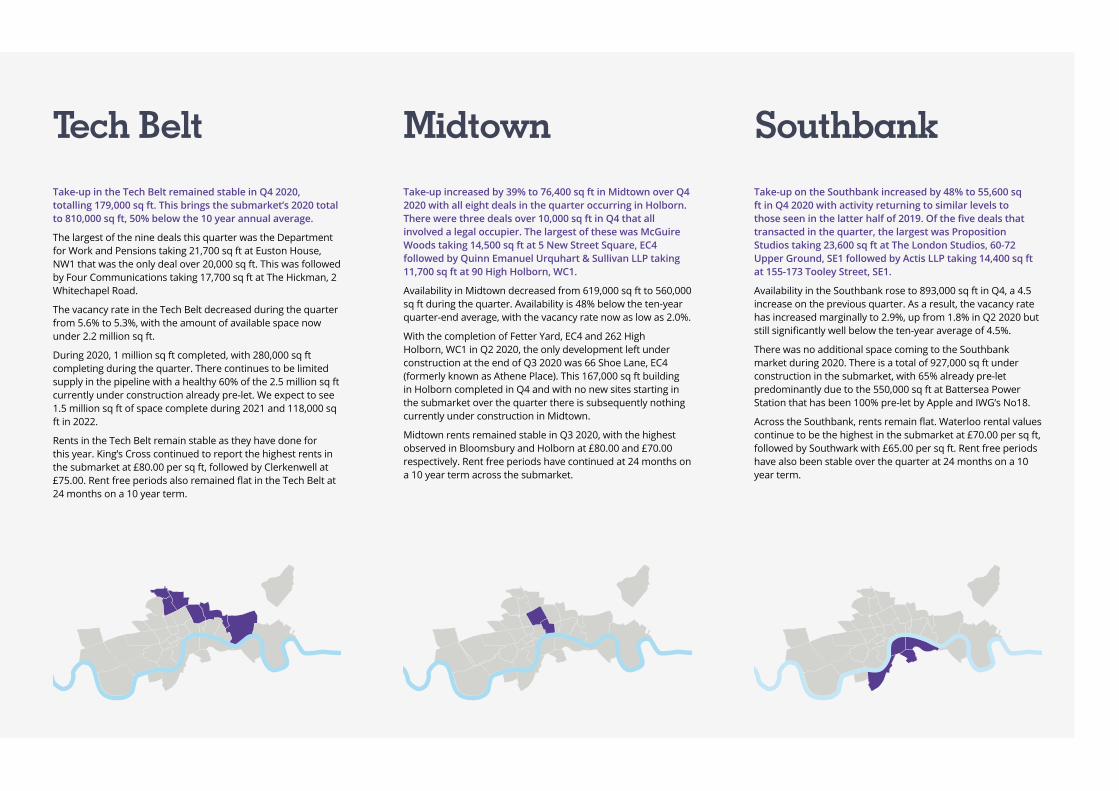
Take-up in the Tech Belt remained stable in Q4 2020, totalling 179,000 sq ft. This brings the submarket’s 2020 total to 810,000 sq ft, 50% below the 10 year annual average.
The largest of the nine deals this quarter was the Department for Work and Pensions taking 21,700 sq ft at Euston House, NW1 that was the only deal over 20,000 sq ft. This was followed by Four Communications taking 17,700 sq ft at The Hickman, 2 Whitechapel Road.
The vacancy rate in the Tech Belt decreased during the quarter from 5.6% to 5.3%, with the amount of available space now under 2.2 million sq ft.
During 2020, 1 million sq ft completed, with 280,000 sq ft completing during the quarter. There continues to be limited supply in the pipeline with a healthy 60% of the 2.5 million sq ft currently under construction already pre-let. We expect to see 1.5 million sq ft of space complete during 2021 and 118,000 sq ft in 2022.
Rents in the Tech Belt remain stable as they have done for this year. King’s Cross continued to report the highest rents in the submarket at £80.00 per sq ft, followed by Clerkenwell at £75.00. Rent free periods also remained flat in the Tech Belt at 24 months on a 10 year term.
Tech Belt
Take-up on the Southbank increased by 48% to 55,600 sq ft in Q4 2020 with activity returning to similar levels to those seen in the latter half of 2019. Of the five deals that transacted in the quarter, the largest was Proposition Studios taking 23,600 sq ft at The London Studios, 60-72 Upper Ground, SE1 followed by Actis LLP taking 14,400 sq ft at 155-173 Tooley Street, SE1.
Availability in the Southbank rose to 893,000 sq ft in Q4, a 4.5 increase on the previous quarter. As a result, the vacancy rate has increased marginally to 2.9%, up from 1.8% in Q2 2020 but still significantly well below the ten-year average of 4.5%.
There was no additional space coming to the Southbank market during 2020. There is a total of 927,000 sq ft under construction in the submarket, with 65% already pre-let predominantly due to the 550,000 sq ft at Battersea Power Station that has been 100% pre-let by Apple and IWG’s No18.
Across the Southbank, rents remain flat. Waterloo rental values continue to be the highest in the submarket at £70.00 per sq ft, followed by Southwark with £65.00 per sq ft. Rent free periods have also been stable over the quarter at 24 months on a 10 year term.
Southbank
Take-up increased by 39% to 76,400 sq ft in Midtown over Q4 2020 with all eight deals in the quarter occurring in Holborn. There were three deals over 10,000 sq ft in Q4 that all involved a legal occupier. The largest of these was McGuire Woods taking 14,500 sq ft at 5 New Street Square, EC4 followed by Quinn Emanuel Urquhart & Sullivan LLP taking 11,700 sq ft at 90 High Holborn, WC1.
Availability in Midtown decreased from 619,000 sq ft to 560,000 sq ft during the quarter. Availability is 48% below the ten-year quarter-end average, with the vacancy rate now as low as 2.0%.
With the completion of Fetter Yard, EC4 and 262 High Holborn, WC1 in Q2 2020, the only development left under construction at the end of Q3 2020 was 66 Shoe Lane, EC4 (formerly known as Athene Place). This 167,000 sq ft building in Holborn completed in Q4 and with no new sites starting in the submarket over the quarter there is subsequently nothing currently under construction in Midtown.
Midtown rents remained stable in Q3 2020, with the highest observed in Bloomsbury and Holborn at £80.00 and £70.00 respectively. Rent free periods have continued at 24 months on a 10 year term across the submarket.
Midtown
Fulham
Hammersmith
White City
Kensington
Chelsea
Hyde Park
Green Park/St James’s
Belgravia/ Knightsbridge
Victoria
Westminster
St James’s
MayfairSoho
Bloomsbury
HolbornWest City
East City
City Core
Paddington
Marylebone
Regent’s Park
Fitzrovia
Battersea Park
Covent Garden
Euston
Camden
King’s Cross
ClerkenwellOld Street/Shoreditch
Aldgate/Whitechapel
Canada Water
Docklands
Stratford
Vauxhall/Battersea
WaterlooSouthwark
Elephant& Castle
Canary Wharf
Southbank
West EndTech Belt
Midtown
East LondonCityWest London
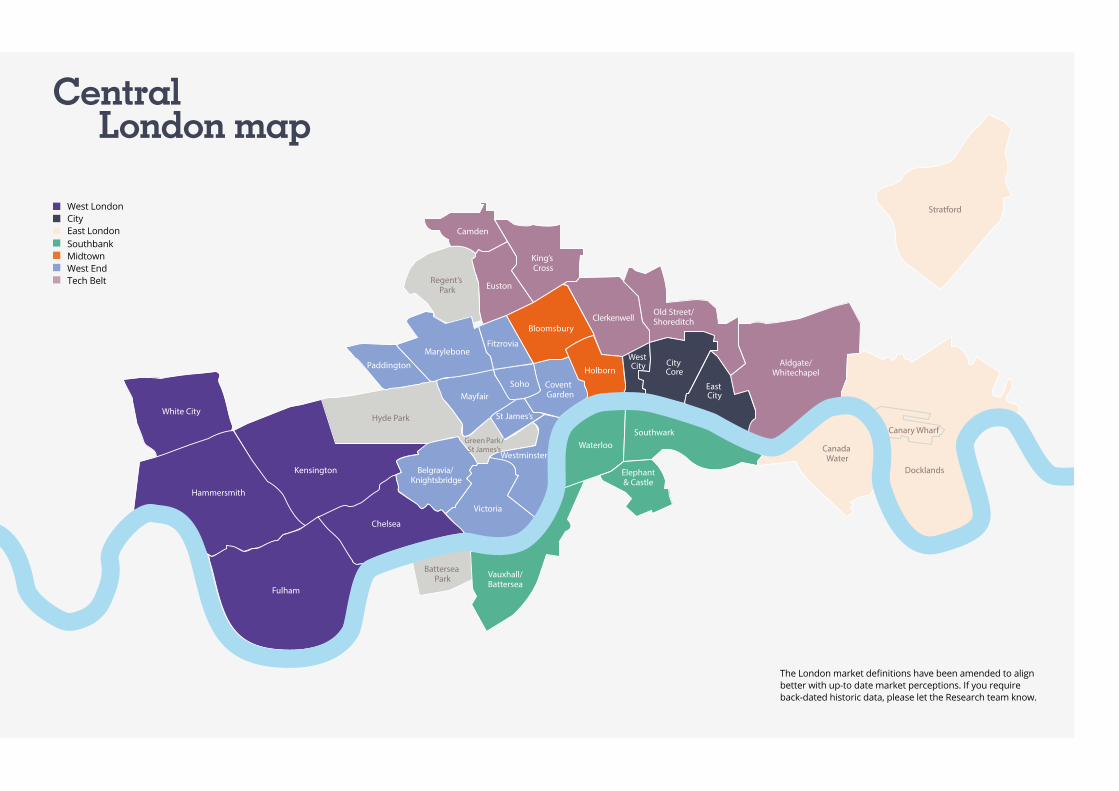
The London market definitions have been amended to align better with up-to date market perceptions. If you require back-dated historic data, please let the Research team know.
Central London map
City Prime headline rent (£ per sq ft)
Rent free period (months)
Business rates (£ per sq ft)
Total occupancy costs (£ per sq ft)
City Tower £90.00 26 £27.20 £127.45
City Core £70.00 26 £27.56 £107.81
West City £70.00 24 £27.56 £107.81
East City £67.50 26 £28.37 £106.12
Tech Belt Prime headline rent (£ per sq ft)
Rent free period (months)
Business rates (£ per sq ft)
Total occupancy costs (£ per sq ft)
King's Cross £80.00 24 £33.72 £123.97
Euston £72.50 24 £29.71 £112.46
Clerkenwell £75.00 24 £24.89 £110.14
Camden £60.00 24 £28.64 £98.89
Old Street /Shoreditch
£67.50 24 £19.27 £97.02
Aldgate /Whitechapel
£55.00 26 £21.41 £86.66
East London Prime headline rent (£ per sq ft)
Rent free period (months)
Business rates (£ per sq ft)
Total occupancy costs (£ per sq ft)
Canary Wharf £45.00 30 £13.64 £68.89
Stratford £45.00 30 £9.10 £64.35
Docklands £32.50 30 £10.71 £53.46
West End Prime headline rent (£ per sq ft)
Rent free period (months)
Business rates (£ per sq ft)
Total occupancy costs (£ per sq ft)
Mayfair £110.00 24 £52.19 £172.44
St James's £110.00 24 £49.78 £170.03
Soho £90.00 24 £44.43 £144.68
Belgravia / Knightsbridge
£90.00 24 £42.29 £142.54
Marylebone £82.50 24 £42.29 £135.04
Covent Garden £85.00 24 £32.12 £127.37
Fitzrovia £82.50 24 £36.13 £128.88
Victoria £77.50 24 £36.07 £123.82
Paddington £75.00 24 £28.64 £113.89
West London Prime headline rent (£ per sq ft)
Rent free period (months)
Business rates (£ per sq ft)
Total occupancy costs (£ per sq ft)
Chelsea £90.00 24 £39.61 £139.86
Kensington £70.00 24 £47.10 £127.35
Hammersmith £58.00 24 £22.48 £90.73
White City £60.00 24 £9.10 £79.35
Fulham £45.00 24 £21.41 £76.66
Southbank Prime headline rent (£ per sq ft)
Rent free period (months)
Business rates (£ per sq ft)
Total occupancy costs (£ per sq ft)
Waterloo £70.00 24 £24.35 £104.60
Southwark £65.00 24 £27.84 £103.09
Vauxhall / Battersea £59.50 24 £16.33 £86.08
Midtown Prime headline rent (£ per sq ft)
Rent free period (months)
Business rates (£ per sq ft)
Total occupancy costs (£ per sq ft)
Bloomsbury £80.00 24 £32.38 £122.63
Holborn £72.50 24 £29.71 £112.46
Central London markets
FINISHING STRONG
There were signs of life in the final quarter of the year as investment volumes reached £3.6 billion, with £1.7 billion transacted during December alone while Asian and European investors were particularly active. To put this into perspective, this was similar to the levels we saw in the final throes of 2018 – although nothing compared to the stellar volumes that were transacted during the end of 2019.
The West End was particularly busy, with Q4 2020 actually the most active quarter by volume since 2014, whilst a number of these deals were a sign of the time taken to complete in the current market, this was not the case for all assets transacted. We saw several deals particularly in St James’s, SW1 including Hong Kong investor Lifestyle International’s purchase of 1 St James’s Square, SW1 from previous owner-occupier BP for £250m, representing a capital value of £2,142 per sq ft. BP will stay in the building for two years before vacating in advance of redevelopment. Pontegadea purchased 21 St James’s Square from Columbia Threadneedle for £187.5m, representing a yield of 3.65% and a capital value of £2,793 per sq ft. The acquisition adds to their already impressive West End portfolio and is their second building on St James’s Square.
Despite travel restrictions we are seeing more interest from HK investors who are looking to get money into London - likely to get ahead of any potential capital restrictions put in place at home, as seen in mainland China. As well as the Lifestyle International purchase, other key deals included K&K’s acquisitions of the £115 million Endeavour House, WC2 from Aberdeen Standard and the £65 million purchase of Corinthian House, W1 from the failed Arcadia Group. The deals represented net initial yields of 4.8% and 4.25% respectively.
We also continued to see investment from Singapore with Suntec REIT completing their purchase of CPPIB's 50% stake in Nova, SW1 for £430m, at a yield of 4.6%. In the City, Sun Venture completed the largest deal of the year through their acquisition of 1 & 2 New Ludgate, EC4 for £552m, from Landsec, representing a net initial yield of 4.2%. At the beginning of the quarter, Dubai-based AGC Equity Partners competed their purchase of Schroder’s HQ at London Wall Place, EC2 from Brookfield for a reported price of £480m, and a net initial yield of 3.8%.
WHAT NEXT?
Despite the relative optimistic reading of the final quarter of 2020, we are continuing to experience a difficult environment for investment. The transaction volumes that we saw in the middle of 2020 highlight the difficulty of getting deals done in a lockdown environment and with difficulties inspecting buildings – particularly for overseas investors who still make up the majority of the market.
Despite the disruption, it is worth remembering that London maintains many of its long-held advantages. London is still a very easy place to invest - its a landlord friendly jurisdiction offering long occupational leases at significantly higher yields than most of the core European cities.
We believe that the market for well let trophy assets in central London will get more competitive as the year progresses. There is an argument to say that the market remains relatively good value, both historically and against other major European cities while many overseas investors will regard it as advantageous from a currency perspective. Unsatisfied capital continues to target London and with the vaccine rollout progressing well and an element of uncertainty removed due to the agreement of a Brexit trade deal with the EU, we believe investors who are able to view buildings and make decisions will continue to acquire best in class assets and generate yield compression. However, with a continued question mark over occupier demand, and a genuine nervousness over rents in the short-term, we may see an adjustment in pricing in the value-add and core-plus markets as headline rents come under pressure.
CHRIS GOREPrincipal
The West End was particularly busy, with Q4 2020 actually the most active quarter by volume since 2014.
“
Investment market in brief
Investment commentary
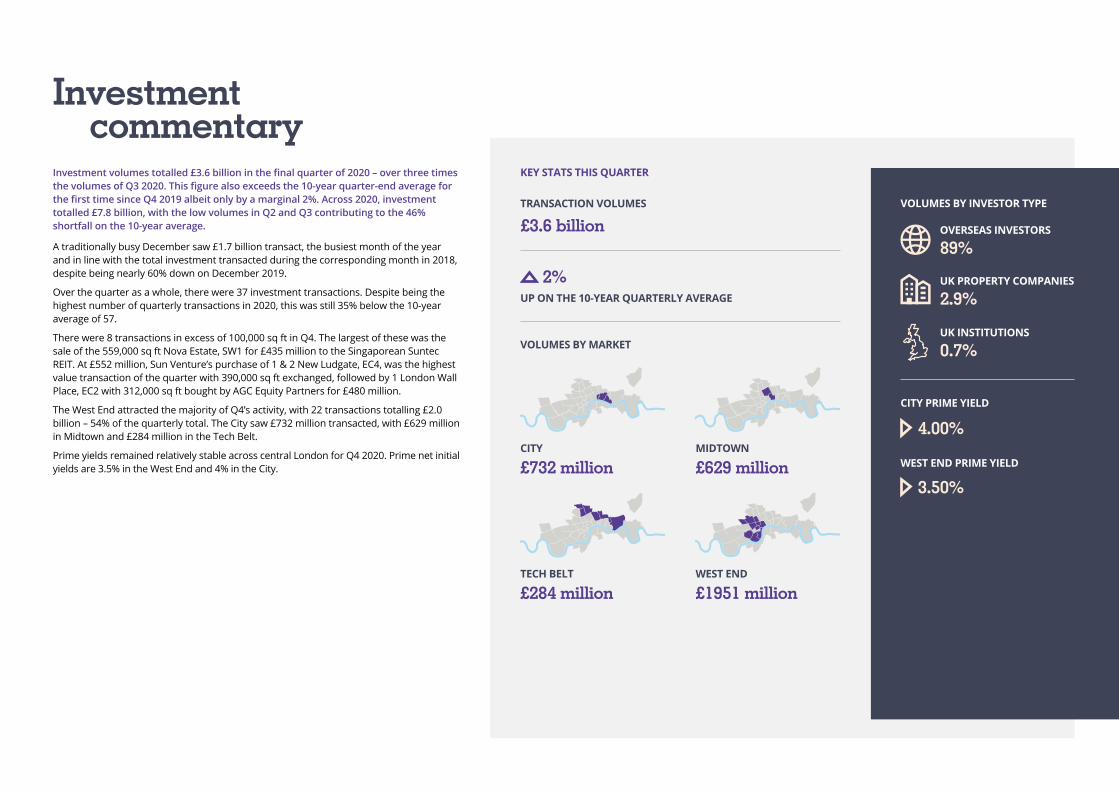
£732 millionCITY
£284 millionTECH BELT
£629 millionMIDTOWN
£1951 millionWEST END
OVERSEAS INVESTORS
89%
UK PROPERTY COMPANIES
2.9%
UK INSTITUTIONS
0.7%
Investment volumes totalled £3.6 billion in the final quarter of 2020 – over three times the volumes of Q3 2020. This figure also exceeds the 10-year quarter-end average for the first time since Q4 2019 albeit only by a marginal 2%. Across 2020, investment totalled £7.8 billion, with the low volumes in Q2 and Q3 contributing to the 46% shortfall on the 10-year average.
A traditionally busy December saw £1.7 billion transact, the busiest month of the year and in line with the total investment transacted during the corresponding month in 2018, despite being nearly 60% down on December 2019.
Over the quarter as a whole, there were 37 investment transactions. Despite being the highest number of quarterly transactions in 2020, this was still 35% below the 10-year average of 57.
There were 8 transactions in excess of 100,000 sq ft in Q4. The largest of these was the sale of the 559,000 sq ft Nova Estate, SW1 for £435 million to the Singaporean Suntec REIT. At £552 million, Sun Venture’s purchase of 1 & 2 New Ludgate, EC4, was the highest value transaction of the quarter with 390,000 sq ft exchanged, followed by 1 London Wall Place, EC2 with 312,000 sq ft bought by AGC Equity Partners for £480 million.
The West End attracted the majority of Q4’s activity, with 22 transactions totalling £2.0 billion – 54% of the quarterly total. The City saw £732 million transacted, with £629 million in Midtown and £284 million in the Tech Belt.
Prime yields remained relatively stable across central London for Q4 2020. Prime net initial yields are 3.5% in the West End and 4% in the City.
VOLUMES BY INVESTOR TYPE
KEY STATS THIS QUARTER
£3.6 billionTRANSACTION VOLUMES
VOLUMES BY MARKET
UP ON THE 10-YEAR QUARTERLY AVERAGE
2%
CITY PRIME YIELD
4.00%
3.50%
WEST END PRIME YIELD
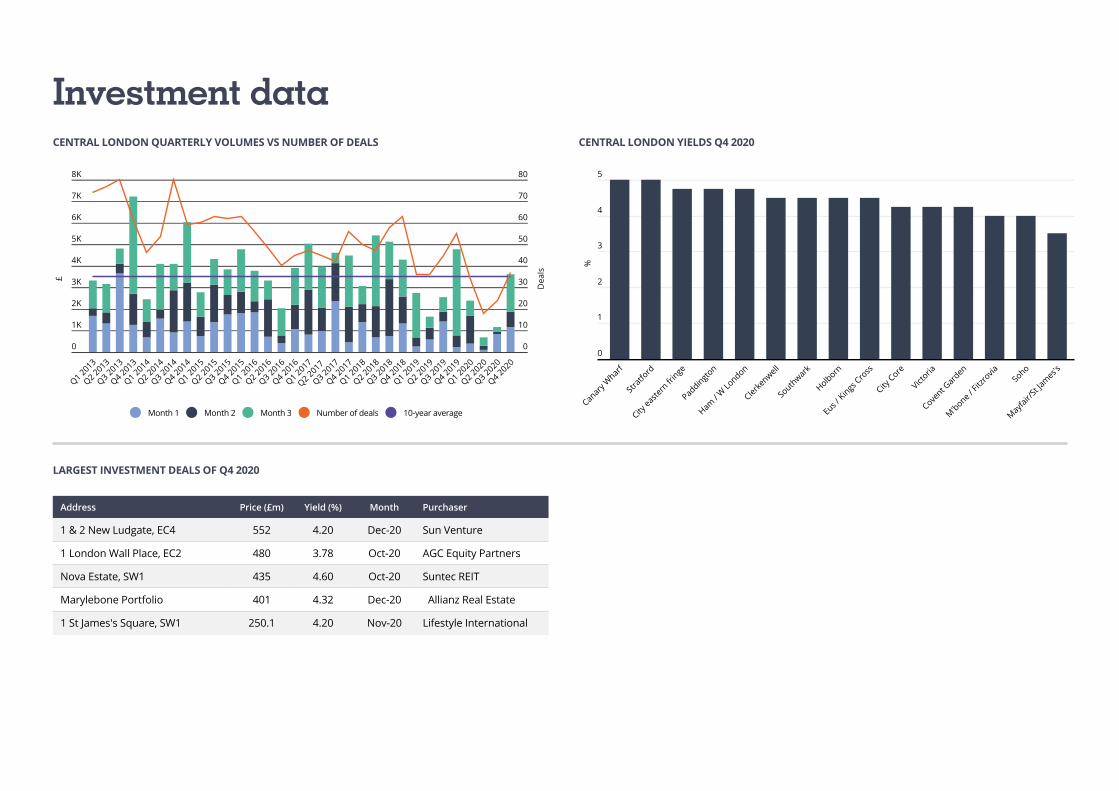
CENTRAL LONDON QUARTERLY VOLUMES VS NUMBER OF DEALS
LARGEST INVESTMENT DEALS OF Q4 2020
CENTRAL LONDON YIELDS Q4 2020
Address Price (£m) Yield (%) Month Purchaser
1 & 2 New Ludgate, EC4 552 4.20 Dec-20 Sun Venture
1 London Wall Place, EC2 480 3.78 Oct-20 AGC Equity Partners
Nova Estate, SW1 435 4.60 Oct-20 Suntec REIT
Marylebone Portfolio 401 4.32 Dec-20 Allianz Real Estate
1 St James's Square, SW1 250.1 4.20 Nov-20 Lifestyle International
0
1K
2K
3K
4K
5K
6K
7K
8K
0
10
20
30
40
50
60
70
80
Q1 2013
Q2 2013
Q3 2013
Q4 2013
Q1 2014
Q2 2014
Q3 2014
Q4 2014
Q1 2015
Q2 2015
Q3 2015
Q4 2015
Q1 2016
Q2 2016
Q3 2016
Q4 2016
Q1 2017
Q2 2017
Q3 2017
Q4 2017
Q1 2018
Q2 2018
Q3 2018
Q4 2018
Q1 2019
Q2 2019
Q3 2019
Q4 2019
Q1 2020
Q2 2020
Q3 2020
Q4 2020
£
Dea
ls
Month 1 Month 2 Month 3 Number of deals 10-year average
5
4
3
2
1
0
Canary Wharf
Stratfo
rd
City easte
rn fr
inge
Paddington
Ham / W Lo
ndon
Clerkenwell
South
wark
Holborn
Eus / Kings
Cross
City Core
Victoria
Covent G
arden
M'bone / Fitz
rovia
Soho
Mayfair/
St James's
%
Investment data

Should you wish to discuss any details within this update please get in touch.
@AYUKviews
Visit us onlineavisonyoung.co.uk/research
This report has been prepared by Avison Young for general information purposes only. Whilst Avison Young endeavours to ensure that the information in this report is correct it does not warrant completeness or accuracy. You should not rely on it without seeking professional advice. Avison Young assumes no responsibility for errors or omissions in this publication or other documents which are referenced by or linked to this report. To the maximum extent permitted by law and without limitation Avison Young excludes all representations, warranties and conditions relating to this report and the use of this report. All intellectual property rights are reserved and prior written permission is required from Avison Young to reproduce material contained in this report.
Avison Young is the trading name of Avison Young (UK) Limited. ©2021 Avison Young Created: 02/21 Ref: 12237
Chris GorePrincipal, Central London Investment+44 (0)20 7911 2036 [email protected]
Jeremy ProsserPrincipal, City Agency+44 (0)20 7911 2865 [email protected]
Alasdair GurryDirector, City and Docklands Agency+44 (0)20 7911 2831 [email protected]
Nick RockPrincipal, West End Agency+44 (0)7046 6517 [email protected]
Jamie OlleyPrincipal, Central London Investment +44 (0)20 7911 2802 [email protected]
John O'BrienAssistant Researcher +44 (0)20 7911 2659 john.o’[email protected]
Daryl PerryHead of UK Research +44 (0)20 7911 2340 [email protected]