Embed Size (px)
Citation preview
RESEARCH NOTES/NOTES DE RECHERCHE
Are happy employees healthyemployees? Researching theeffects of employee engagementon absenteeism
Dann Hoxsey
Abstract: In 2007, a survey was conducted to measure the levels of workplace engage-ment for British Columbian civil servants. Following the Heskett et al. model of the‘‘service profit chain’’ (1994, 2002), the government’s primary concerns were the in-creasing attrition rates and their effects on service delivery. Essentially, the modeldemonstrated that employees who were more engaged were more committed to theirwork and more likely to stay within the civil service and that this culminated in im-proved customer service. Under the joint rubrics of absenteeism and job satisfaction,this study uses a construct of engagement (i.e., job satisfaction) to test whether differ-ent levels of engagement have any effect on the amount of sick time (absenteeism) anemployee incurs. Specifically, the author looks at whether there is any correlation be-tween the amount of sick time used and an individual’s level of engagement andproposes that there is an inverse negative relationship: as job engagement increases,sick time used decreases. Testing the old adage ‘‘A happy employee is a healthy em-ployee,’’ this research demonstrates that, though a more engaged employee may useless sick time, the differences in use between highly engaged employees and thosenot engaged are fairly marginal and that correlations are further confounded by ahost of other (often missing) factors.
Sommaire : En 2007, une enquete a ete menee pour mesurer les niveaux d’engagementdes fonctionnaires de la Colombie-Britannique. En suivant le modele de la ß chaıne deprofit dans les services � de Heskett et al. (1994), les principales preoccupations dugouvernement etaient l’accroissement des taux d’attrition et leurs effets sur la presta-tion des services. Le modele demontrait essentiellement que les employes qui etaientplus engages s’impliquaient davantage dans leur travail et etaient plus susceptibles derester au sein de la fonction publique, ce qui aboutissait a une amelioration du servicea la clientele. Sous les rubriques conjointes d’absenteisme et de satisfaction au travail,la presente etude utilise un concept d’engagement (c.-a-d. la satisfaction au travail)
The author is a candidate in the Master of Arts program, Department of Sociology, University ofVictoria. This article was prepared for BC Stats. He would like to thank Angela Matheson, DianeAllan, and Dennis Pilon for their extensive input during the development of this project, as wellas the support provided by BC Stats. He would also like to acknowledge the helpful commentsmade by the Journal’s anonymous reviewers.
CANADIAN PUBLIC ADMINISTRATION / ADMINISTRATION P UBLIQUE DU CA NADA
VOLUME 53 , NO. 4 (DE CEMBER/DECE MB RE 20 10) , P P. 551 –57 1
r The Institute of Public Administration of Canada/L’Institut d’administration publique du Canada 2010
pour evaluer si differents niveaux d’engagement ont un effet sur le nombre de joursde conge de maladie (absenteisme) que prend un employe. L’auteur examine plusparticulierement s’il existe une correlation entre le nombre de jours de conge demaladie utilises et le niveau d’engagement d’un employe, et suggere ensuite qu’ilexiste un lien negatif inverse : avec l’augmentation d’implication au travail, les joursde conge de maladie diminuent. Mettant a l’epreuve le vieux dicton selon lequelß un employe heureux est un employe en bonne sante � , cette recherche demontreque, meme si un employe plus engage utilise moins de jours de conge de maladie, ladifference pratiquee entre les employes fortement engages et ceux qui ne le sontpas est assez marginale et que toutes sortes d’autres facteurs (souvent manquants)rendent les correlations encore plus deconcertantes.
In 2007, a survey was conducted by BC Stats to measure the levels ofworkplace engagement among British Columbian civil servants (BC Stats2007a). One of the government’s primary concerns was the increasingattrition rate and its effect on service delivery. The survey followed James L.Heskett et al.’s model of the ‘‘service profit chain’’ (1994, 2002), in whichcustomer satisfaction is linked to an employee’s job satisfaction and chiefloyalty to the company, and Ralph Heintzman and Brian Marson’s ‘‘servicevalue chain’’ (2006) for public-service employees. Essentially, Heintzmanand Marson’s model replaced profit as the motivator to demonstrate that anengaged employee was more committed to his or her work and more likelyto stay within the civil service and that this would culminate in improvedcustomer service and an increase in public confidence in the civil service.Furthermore, it had also been demonstrated that the social aspects of aworkplace and questions of job satisfaction are closely linked to reasons foremployees staying or leaving (Lease 1998). As some employees leave for theprivate sector, there is a growing focus on retaining employees and on betterunderstanding those who stay within the public service. Based on this idea,this survey questioned whether quitting was the only response to low jobsatisfaction. It is surmised that due to financial or family constraints, quittinga job is not always a viable option for many people. Consequently, one of theways in which employees might also express a lack of commitment andsatisfaction is in absenteeism. Though absenteeism is a broad term that istypically measured as ‘‘time away from work,’’ either voluntary or involuntary(Sagie 1998: 156), one of the most immediate measures of absenteeism is theamount of sick time an employee uses. Under the construct of absenteeism,time away could include taking the afternoon off for a headache, leaving toattend to a sick child or spouse, or a lengthy leave due to surgery or a seriousinjury incurred in an accident.
Under the joint rubrics of absenteeism and job satisfaction, in this presentstudy, I use a construct of engagement (i.e., job satisfaction) to test whetherdifferent levels of engagement had any effect on the amount of sick time
552 DANN HOXSEY
(absenteeism) an employee incurred. It is worth mentioning that similarforms of research have been carried out before, as Suzanne Lease notes in avery thorough review essay – ‘‘Job satisfaction is one of the most frequentlystudied work attitudes’’ (1998:154) – and that one regularly researched out-come of an employee’s ‘‘work attitude’’ was their use of sick time.
Often, such research projects were limited by two factors; they either hadlimited sample sizes (and limited access to populations) or imprecise mea-surements of sick leave. In one project, the sample size was larger than 30,000but was limited by the estimated (and inconsistently self-reported) sick-daysan employee may have taken in a year (Almond and Healey 2003),whereasAbraham Sagie had a detailed measure of absenteeism but a small samplesize of 172 employees, from only one company (1998).
Due to the unique nature of both a large sample size, the broad population,and the precise (automated) reporting of individual sick-leave (down tothe minute), our present project is well situated to add to the discussions onmeasuring job satisfaction in the workplace.
The British Columbia government’s employee benefits Short Term Illnessand Injury Plan (STIIP) is a reliable account of absenteeism; fifty-three percent of survey respondents used STIIP, accumulating a total of 633,560 hoursduring the 2007 calendar year and averaging sixty-seven hours per person (amore detailed discussion will follow). This research note will look at whetherthere was any correlation between the amount of STIIP used and an individ-ual’s level of engagement, proposing an inverse negative relationship: as jobengagement increased, STIIP use decreased. Testing the old adage ‘‘A happyemployee is a healthy employee,’’ I will demonstrate that though a more en-gaged employee may use less sick-time, the differences in use betweenhighly engaged employees and those not engaged were fairly marginal.Furthermore, regardless of the obvious assumption that a happy employee isa healthy employee, confounding factors such as gender responsibilities andthe assumed correlation between age and tenure (on STIIP use) point to aneed to expand the research project before making any such claims. My basicconclusion is that there are simply far too many intervening factors (knownand unknown) to make any definitive claim about the effect of job satisfactionon absenteeism.
Background and methodologyIn April 2007, BC Stats sent out its second annual BC Public Service WorkEnvironment Survey (WES), which consisted of seventy-nine closed-endedquestions and one open-ended question.1 The on-line survey was sent toover 25,000 British Columbia government employees, with an approximateresponse rate of seventy per cent.
This report is one of several BC Stats reports based on the annual WorkEnvironment Survey. Other reports produced by BC Stats, such as Exploring
EFFECTS OF EMPLOYEE ENGAGEMENT ON ABSENTEEISM 553
Employee Engagement in Your Organization, provide further statisticalinformation for each survey question. This particular report is a systematicapplication of the established engagement model that emerged from theparent report.
The initial target population for this study was the entire set of B.C.public-service employees. The sample for this report was a subset of casesthat met all of the following criteria: employees in a full-time position, thosein a permanent position for the entire 2007 calendar year, and employeeswho had used STIIP leave at least once during 2007. The data of the initial17,631 responses has also been filtered to exclude employees on temporaryassignment, part-time workers, retirees (within 2007), and those who hadeither voluntarily or involuntarily left the B.C. public service in 2007. Theremaining sample (n 5 13,389) was then filtered to exclude employees whohad not used STIIP leave in 2007, resulting in a final sample size of n 5 9,408.
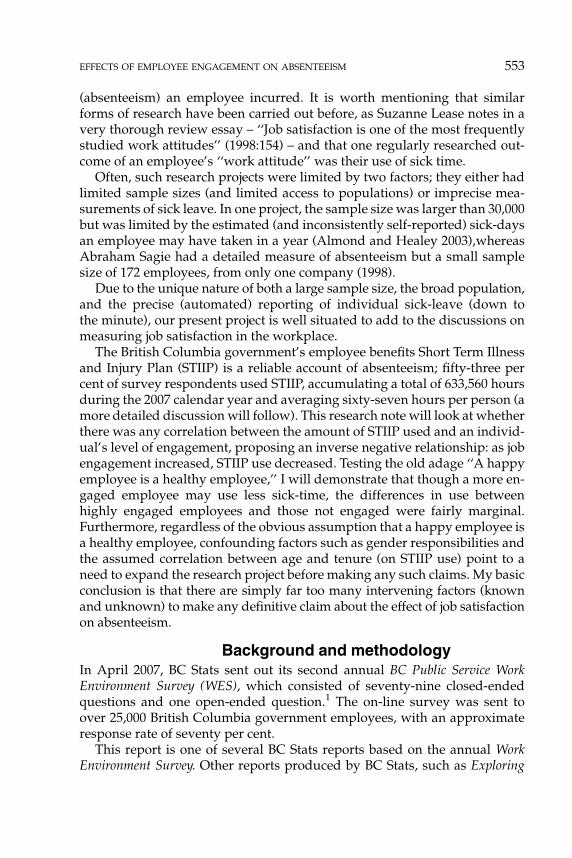
The overall model used regression analysis to test for a correlationbetween the effects of engagement scores on STIIP use, while controllingfor age, years of service, gender and union status (see Table 1).
Descriptive statisticsSTIIP use
The dependent variable, ‘‘STIIP use,’’ measured the amount of annual short-term sick-leave in one-hour increments, producing a range from 0 to 1,134hours per employee. The extreme of 1,134 hours posed a problem for analysiswhen trying to separate serious health issues from employees using STIIP asa possible outcome of low engagement. When reviewing the rules of STIIPuse, it was noted that no single instance of STIIP use could exceed six
Table 1. Descriptive Statistics
(n 5 9,408) Mean (SD) Median Mode
Range
Min. Max.
STIIP use 67.34 (107.22) 31 1 840
Engagement score 245.44 (96.12) 250 300 0 400
Age 45.98 (8.40) 47 21 66
Service years 13.80 (8.35) 14 1 39
Genderw 0 0 1
Union statusww 0 0 1
Source: BC Stats 2007�Total hours of STIIP use 5 633,560wFemale coded as reference (0)wwUnion membership coded as reference (0)
554 DANN HOXSEY
months.2 This limitation helped to frame an upward boundary of 840 hoursfor the study (twenty-four weeks, thirty-five hours per week 5 six months).Those with over six months of STIIP use were filtered out (n 5 34). The basisfor this decision was that a predominantly small group of employees withsuch extensive STIIP use should be looked at as a separate group rather thanbe included as extreme outliers in this study.
Similarly, due to the nature of the research question (the effects of engage-ment on STIIP use), it was decided that the high number of respondents whodid not use any STIIP hours (thirty per cent) constituted a group largeenough to warrant a separate study. Based on the research question, such alarge group of non-STIIP users would lead one to have expected a higherproportion of observations to fall within the ‘‘highly engaged’’ end of thescale. However, a similar regression applied to the group with zero STIIP usedemonstrated a relatively normal distribution across the engagement scale.In other words, those with zero STIIP use were just as engaged/unengagedas those with varying degrees of STIIP use. As the effect on removing thisgroup from the model was marginal, and because this research is interestedin testing the relationship between engagement and those who have usedSTIIP, non-STIIP users were excluded from this project.
The STIIP variable was then recoded to exclude both employees with zerohours of STIIP (n 5 3,981), and 8401hours of STIIP use (n 5 34), resulting in anew STIIP variable with a range of 1 to 840 hours (n 5 9,408, mean 5 67.34,Sd. 5 107.22). This particular variable exhibited a strong positive skew (seeAppendix: Tests for assumption, below).
Engagement score
The second variable, engagement score, was used as the independent vari-able central to the analysis of STIIP use. The engagement score was acomposite of four questions (see Table 2), which were combined to createone overall score that reflected an employee’s level of engagement with hisor her job. Respondents selected a response category from a five-point Likertscale ranging from ‘‘strongly disagree’’ (0) to ‘‘strongly agree’’ (100).
Typically, job satisfaction has been measured using the well-establishedJob Description Index (JDI) format (Lease 1998; Stanton et al 2002). The JDIused approximately seventy-two closed-ended questions to measure sixdifferent dimensions of job satisfaction: work, supervision, pay, promotions,co-workers, and satisfaction with job in general (Bedeian, Ferris, and Kacmar1992:37). In revising the JDI, Jeffrey Stanton and colleagues found a discrep-ancy in that stress-related items were contaminating satisfaction measures.3
For this reason, I have attempted to bracket the data measuring stress andfocused on four questions that more directly measure job satisfaction (as laidout in Stanton et al.’s model). It should be noted that the exploratory natureof this particular research project necessitated an abridged version.
EFFECTS OF EMPLOYEE ENGAGEMENT ON ABSENTEEISM 555
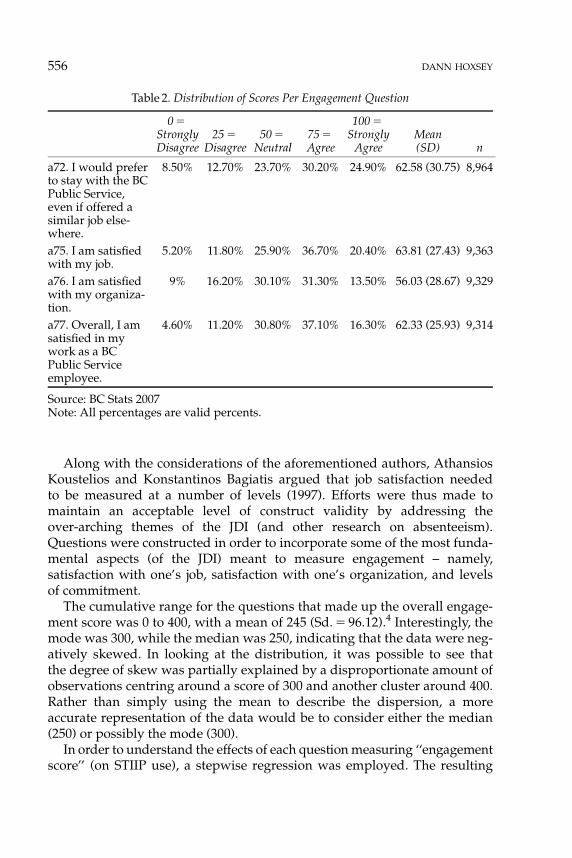
Along with the considerations of the aforementioned authors, AthansiosKoustelios and Konstantinos Bagiatis argued that job satisfaction neededto be measured at a number of levels (1997). Efforts were thus made tomaintain an acceptable level of construct validity by addressing theover-arching themes of the JDI (and other research on absenteeism).Questions were constructed in order to incorporate some of the most funda-mental aspects (of the JDI) meant to measure engagement – namely,satisfaction with one’s job, satisfaction with one’s organization, and levelsof commitment.
The cumulative range for the questions that made up the overall engage-ment score was 0 to 400, with a mean of 245 (Sd. 5 96.12).4 Interestingly, themode was 300, while the median was 250, indicating that the data were neg-atively skewed. In looking at the distribution, it was possible to see thatthe degree of skew was partially explained by a disproportionate amount ofobservations centring around a score of 300 and another cluster around 400.Rather than simply using the mean to describe the dispersion, a moreaccurate representation of the data would be to consider either the median(250) or possibly the mode (300).
In order to understand the effects of each question measuring ‘‘engagementscore’’ (on STIIP use), a stepwise regression was employed. The resulting
Table 2. Distribution of Scores Per Engagement Question
0 5StronglyDisagree
25 5Disagree
50 5Neutral
75 5Agree
100 5Strongly
AgreeMean(SD) n
a72. I would preferto stay with the BCPublic Service,even if offered asimilar job else-where.
8.50% 12.70% 23.70% 30.20% 24.90% 62.58 (30.75) 8,964
a75. I am satisfiedwith my job.
5.20% 11.80% 25.90% 36.70% 20.40% 63.81 (27.43) 9,363
a76. I am satisfiedwith my organiza-tion.
9% 16.20% 30.10% 31.30% 13.50% 56.03 (28.67) 9,329
a77. Overall, I amsatisfied in mywork as a BCPublic Serviceemployee.
4.60% 11.20% 30.80% 37.10% 16.30% 62.33 (25.93) 9,314
Source: BC Stats 2007Note: All percentages are valid percents.
556 DANN HOXSEY
model was significant at po0.001 (F 5 69.92, df 5 3, 8,885) and the adjustedR2 indicated that questions a72, a75, and a76 could only explain about 2.3 percent of the variance in STIIP use. Furthermore, this process showed thatquestion a75 accounted for 2 per cent (of the 2.3 per cent) of the variance andthat question a77 was not significant, and, therefore, was dropped from themodel. Following this logic, Chronbach’s test for reliability was performedto assess the internal reliability of the composite scores. The findingsdemonstrated that all questions were worth including with an overall alphaof a5 0.871. As all variables met the required alpha level (a � 0.8), and werecorrelated with the total scale to the degree of lower r 5 0.505, all questionswere retained and used in the composite engagement score for later regression.
Age
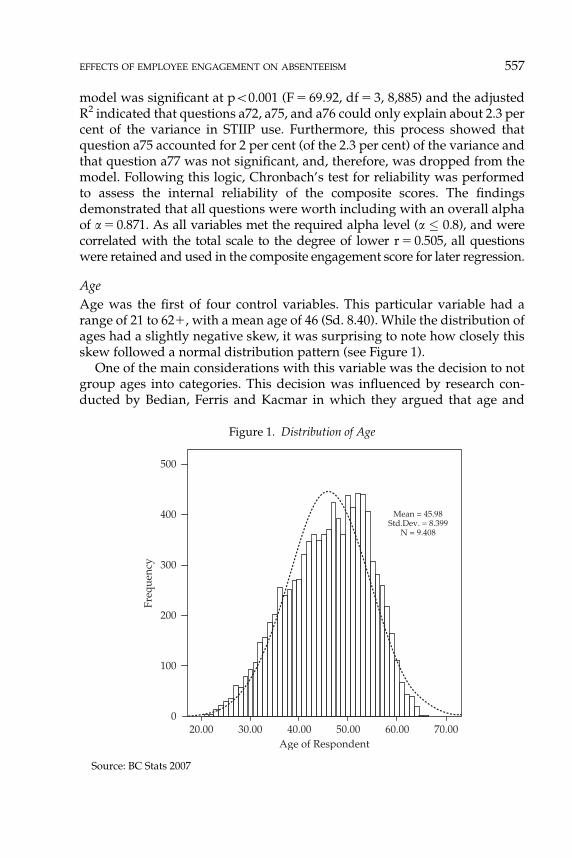
Age was the first of four control variables. This particular variable had arange of 21 to 621, with a mean age of 46 (Sd. 8.40). While the distribution ofages had a slightly negative skew, it was surprising to note how closely thisskew followed a normal distribution pattern (see Figure 1).
One of the main considerations with this variable was the decision to notgroup ages into categories. This decision was influenced by research con-ducted by Bedian, Ferris and Kacmar in which they argued that age and
500
400
300
200
100
020.00 30.00 40.00 50.00 60.00 70.00
Age of Respondent
Freq
uenc
y
Mean = 45.98Std.Dev. = 8.399
N = 9.408
Figure 1. Distribution of Age
Source: BC Stats 2007
EFFECTS OF EMPLOYEE ENGAGEMENT ON ABSENTEEISM 557
tenure (length of service years) were both systemically linked to an em-ployee’s job satisfaction (1992: 34). Given this, it was felt that by controllingfor age at all levels, the model would have greater explanatory value.
To test this idea, when age was divided into groups, the means for allSTIIP use by age groups fell within the range of 43.24 and 47.42, whereas themedian for age groups under 35, 35–44, 45–54, and 551 were 21, 18, 14 and14, respectively. Contrary to preconceived assumptions of a correlation be-tween an increase in age and an increase in STIIP use, when separated out,the frequency of STIIP use was slightly higher in the younger age groups.However, there were no significant distinctions between age groups and en-gagement scores, with a total group mean of 251.92 (Sd. 62.98), and a meanrange of 248.80 (Sd. 62.2) to 255.57 (Sd. 63.89) between the lowest and highestage group.
Service years
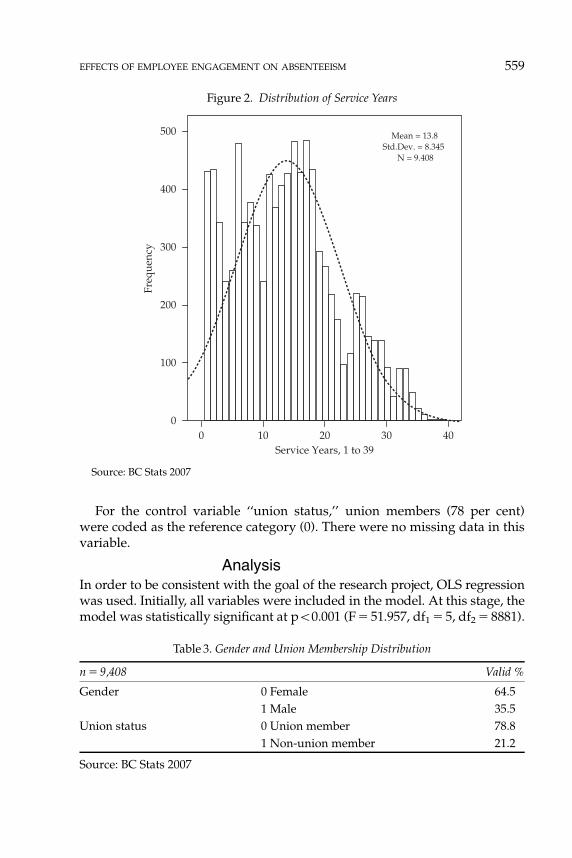
The second control variable measured an employee’s length of service inone-year increments. The variable ‘‘service years’’ had a mean of 13.8 (Sd.8.35), with a range from 1 to 39 years of service.
The distribution for this variable was multi-modal, with high clustersaround 1 to 2 and 16 to 18 years of service, as well as an additional smallercluster around 26 years (see Figure 2). The latter clusters may be partiallyexplained by the extensive province-wide layoffs in 2003, leaving a dispro-portionate number of employees with seniority. The former spike in serviceyears may be attributed to the subsequent hiring boom that had occurreddue to the aforementioned recent round of layoffs, as well as an increasedamount of hires due to the current retirement cohort. However, both expla-nations are speculative and require further research.
Incidentally, employees with less than one year of service were only en-titled to prorated amounts of STIIP use, depending on their tenure. Becauseof this, employees with less than one year of service were coded as missing.This allowed the study to focus on permanent full-time employees whowould have had comparable access to STIIP use.
Gender and union status
Both ‘‘gender’’ and ‘‘union status’’ were dichotomous dummy variables (seeTable 3). For the variable ‘‘gender,’’ females comprised 64 per cent (n 5 9,408)of the respondents and were coded as the reference category (0). It should benoted that due to the small sample size of respondents who identified as‘‘other’’ (n 5 3), they could not be used in this analysis. It might be beneficialto look at this group of people with a more qualitative approach ratherthan one that is focused on making predictions or inferences for an entirepopulation.
558 DANN HOXSEY
For the control variable ‘‘union status,’’ union members (78 per cent)were coded as the reference category (0). There were no missing data in thisvariable.
AnalysisIn order to be consistent with the goal of the research project, OLS regressionwas used. Initially, all variables were included in the model. At this stage, themodel was statistically significant at po0.001 (F 5 51.957, df1 5 5, df2 5 8881).
500
400
300
200
100
00
Service Years, 1 to 39
Freq
uenc
yMean = 13.8
Std.Dev. = 8.345N = 9.408
10 20 30 40
Figure 2. Distribution of Service Years
Source: BC Stats 2007
Table 3. Gender and Union Membership Distribution
n 5 9,408 Valid %
Gender 0 Female 64.5
1 Male 35.5
Union status 0 Union member 78.8
1 Non-union member 21.2
Source: BC Stats 2007
EFFECTS OF EMPLOYEE ENGAGEMENT ON ABSENTEEISM 559
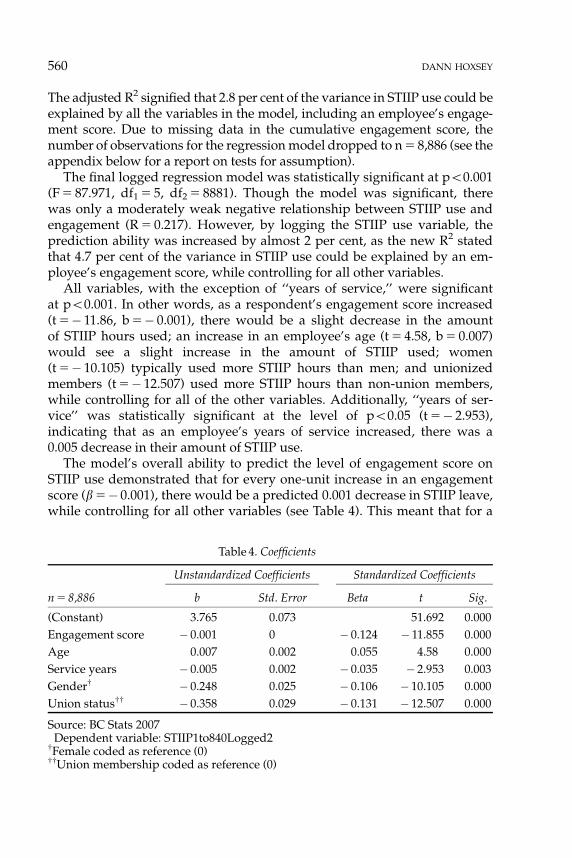
The adjusted R2 signified that 2.8 per cent of the variance in STIIP use could beexplained by all the variables in the model, including an employee’s engage-ment score. Due to missing data in the cumulative engagement score, thenumber of observations for the regression model dropped to n 5 8,886 (see theappendix below for a report on tests for assumption).
The final logged regression model was statistically significant at po0.001(F 5 87.971, df1 5 5, df2 5 8881). Though the model was significant, therewas only a moderately weak negative relationship between STIIP use andengagement (R 5 0.217). However, by logging the STIIP use variable, theprediction ability was increased by almost 2 per cent, as the new R2 statedthat 4.7 per cent of the variance in STIIP use could be explained by an em-ployee’s engagement score, while controlling for all other variables.
All variables, with the exception of ‘‘years of service,’’ were significantat po0.001. In other words, as a respondent’s engagement score increased(t 5� 11.86, b 5� 0.001), there would be a slight decrease in the amountof STIIP hours used; an increase in an employee’s age (t 5 4.58, b 5 0.007)would see a slight increase in the amount of STIIP used; women(t 5� 10.105) typically used more STIIP hours than men; and unionizedmembers (t 5� 12.507) used more STIIP hours than non-union members,while controlling for all of the other variables. Additionally, ‘‘years of ser-vice’’ was statistically significant at the level of po0.05 (t 5� 2.953),indicating that as an employee’s years of service increased, there was a0.005 decrease in their amount of STIIP use.
The model’s overall ability to predict the level of engagement score onSTIIP use demonstrated that for every one-unit increase in an engagementscore (b5� 0.001), there would be a predicted 0.001 decrease in STIIP leave,while controlling for all other variables (see Table 4). This meant that for a
Table 4. Coefficients�
n 5 8,886
Unstandardized Coefficients Standardized Coefficients
b Std. Error Beta t Sig.
(Constant) 3.765 0.073 51.692 0.000
Engagement score � 0.001 0 � 0.124 � 11.855 0.000
Age 0.007 0.002 0.055 4.58 0.000
Service years � 0.005 0.002 � 0.035 � 2.953 0.003
Genderw � 0.248 0.025 � 0.106 � 10.105 0.000
Union statusww � 0.358 0.029 � 0.131 � 12.507 0.000
Source: BC Stats 2007�Dependent variable: STIIP1to840Logged2wFemale coded as reference (0)wwUnion membership coded as reference (0)
560 DANN HOXSEY
thirty-five-year-old unionized female employee, with ten years of serviceand an engagement score of 100, the predicted STIIP use would be 3.86hours, whereas the same employee with an engagement score of 400 wouldhave a decrease in STIIP use to 3.56 hours.
DiscussionWhile the initial intentions of this research were to ascertain the effects of en-gagement on STIIP use, and, finding that the model was significant, explainingonly 4.7 per cent of the variance in STIPP use was not a particularly impressiveachievement. However (and perhaps more noteworthy), the research processrevealed a number of important issues that should influence any future ana-lysis. For example, topics that have emerged as requiring further investigationinclude the assumed correlations between age and service years, the effects ofgender on STIIP use, and some interesting limitations on this particular study.
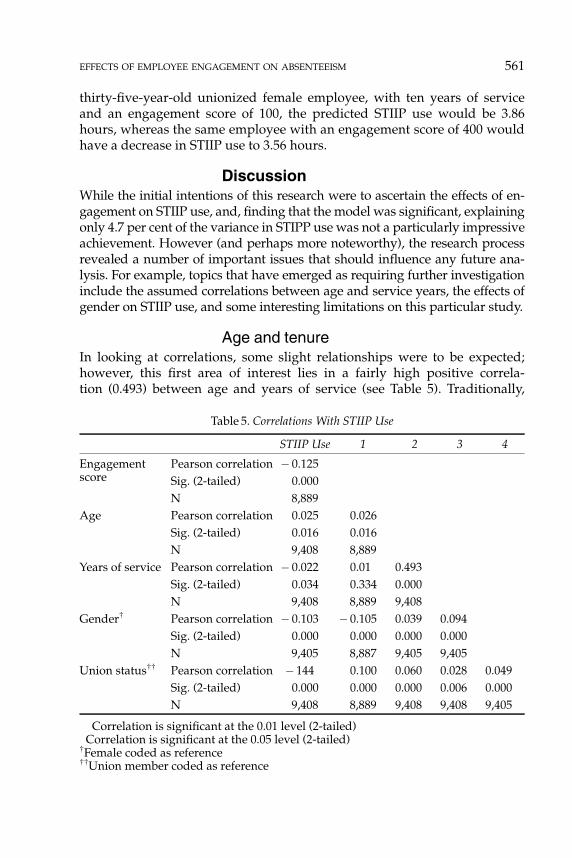
Age and tenureIn looking at correlations, some slight relationships were to be expected;however, this first area of interest lies in a fairly high positive correla-tion (0.493) between age and years of service (see Table 5). Traditionally,
Table 5. Correlations With STIIP Use
STIIP Use 1 2 3 4
Engagementscore
Pearson correlation � 0.125��
Sig. (2-tailed) 0.000
N 8,889
Age Pearson correlation 0.025� 0.026�
Sig. (2-tailed) 0.016 0.016
N 9,408 8,889
Years of service Pearson correlation � 0.022� 0.01 0.493��
Sig. (2-tailed) 0.034 0.334 0.000
N 9,408 8,889 9,408
Genderw Pearson correlation � 0.103�� � 0.105�� 0.039�� 0.094��
Sig. (2-tailed) 0.000 0.000 0.000 0.000
N 9,405 8,887 9,405 9,405
Union statusww Pearson correlation � 144�� 0.100�� 0.060�� 0.028�� 0.049��
Sig. (2-tailed) 0.000 0.000 0.000 0.006 0.000
N 9,408 8,889 9,408 9,408 9,405
��Correlation is significant at the 0.01 level (2-tailed)�Correlation is significant at the 0.05 level (2-tailed)wFemale coded as referencewwUnion member coded as reference
EFFECTS OF EMPLOYEE ENGAGEMENT ON ABSENTEEISM 561
arguments around strong associations state that if there is a high correlation,then both variables may be explaining the same thing. One option is to dis-card the less significant variable. In spite of this high correlation, otherresearchers state that although the two variables may be positively associ-ated (as age goes up, years of service also tends to increase), there is notnecessarily the same relationship between each independent variable andtheir effects on engagement scores. Bedeian, Ferris and Kacmar provide apersuasive argument for retaining both variables, suggesting that the impactof age on job satisfaction is indirect and that an employee’s years of servicehave a type of time bias (1992: 35).
Essentially, while older workers tend to be in positions with higher wagesand more autonomy, the intervening variable (‘‘years of service’’) might bepositively affecting their engagement score. By separating age from serviceyears, distinctions began to appear, demonstrating that older people newto a position did not have the same level of engagement as younger em-ployees who have been in the civil service for a lengthy period. For this rea-son, Bedeian, Ferris and Kacmar suggest that a rigorous model retain bothvariables.
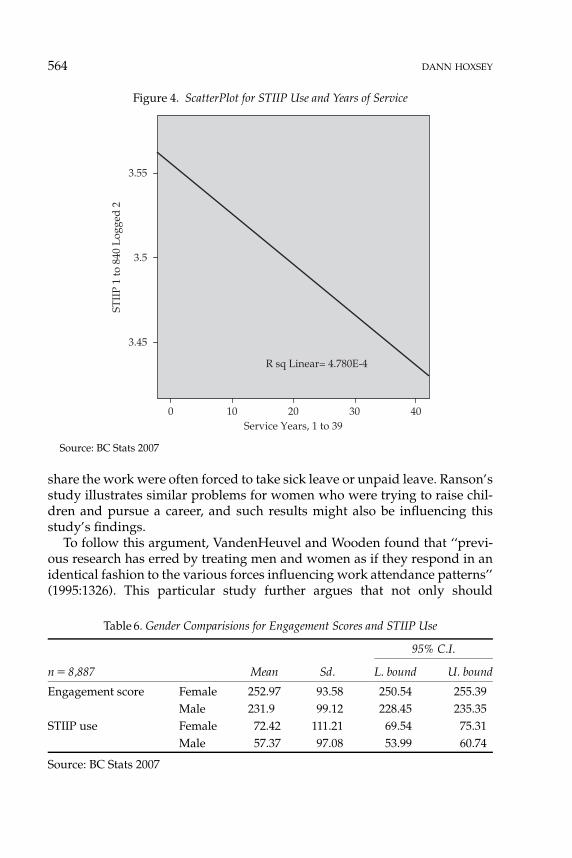
Based on this argument, the separate effects of ‘‘years of service’’ and ‘‘age’’were tested on STIIP use. The current model indicated that while anemployee’s years of service had a negative effect on STIIP use (b5� .005),age had a positive effect (b5 .007). In other words, as age increased, STIIP usealso tended to increase, but as service years increased, STIIP use tended todecrease. Figures 3 and 4 (located on the following two pages) present a visualrepresentation of this relationship and demonstrate that while age and thelength of time in a position were highly correlated, each had a significantlydifferent impact on STIIP use, justifying the inclusion of both in the model.
GenderThe second notable finding was the effect of gender on STIIP use. The modelestablished that women were more likely to have higher uses of STIIP thanmen. However, women also had slightly higher engagement scores thanmen.
The distributions showed that on average, although women used approx-imately fifteen more STIIP hours than men, they also had a higher thanaverage engagement score (253) than men (232) (see Table 6). Audrey Van-denHeuvel and Mark Wooden’s research on the differences between genderand absenteeism helps to provide some credibility for these findings (1995).As their study also demonstrated, women typically had higher satisfactionscores while maintaining higher levels of absenteeism. Similar to the find-ings of this research, they concluded that women’s job satisfaction was lessof a determinant on absenteeism than for men.
562 DANN HOXSEY
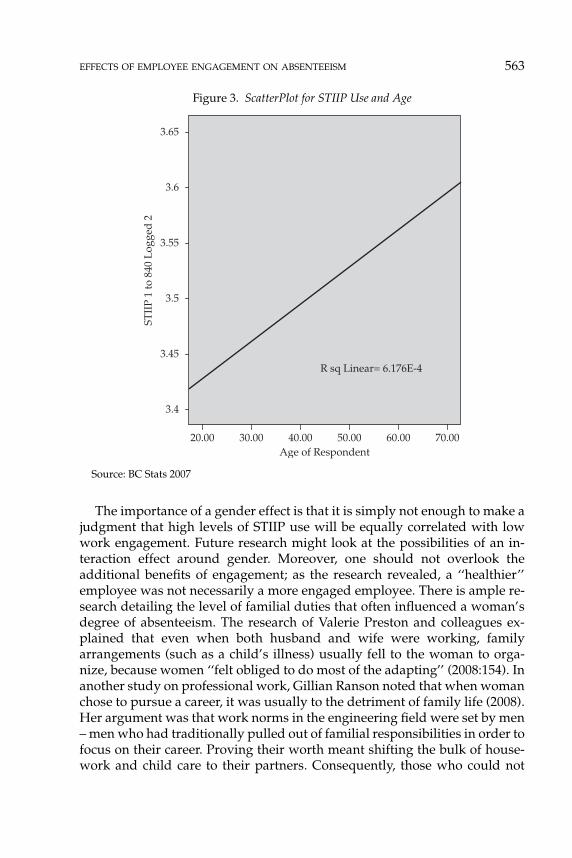
The importance of a gender effect is that it is simply not enough to make ajudgment that high levels of STIIP use will be equally correlated with lowwork engagement. Future research might look at the possibilities of an in-teraction effect around gender. Moreover, one should not overlook theadditional benefits of engagement; as the research revealed, a ‘‘healthier’’employee was not necessarily a more engaged employee. There is ample re-search detailing the level of familial duties that often influenced a woman’sdegree of absenteeism. The research of Valerie Preston and colleagues ex-plained that even when both husband and wife were working, familyarrangements (such as a child’s illness) usually fell to the woman to orga-nize, because women ‘‘felt obliged to do most of the adapting’’ (2008:154). Inanother study on professional work, Gillian Ranson noted that when womanchose to pursue a career, it was usually to the detriment of family life (2008).Her argument was that work norms in the engineering field were set by men– men who had traditionally pulled out of familial responsibilities in order tofocus on their career. Proving their worth meant shifting the bulk of house-work and child care to their partners. Consequently, those who could not
3.65
3.6
3.55
3.5
3.45
3.4
20.00 30.00 40.00 50.00 60.00 70.00Age of Respondent
STII
P 1
to 8
40 L
ogge
d 2
R sq Linear= 6.176E-4
Figure 3. ScatterPlot for STIIP Use and Age
Source: BC Stats 2007
EFFECTS OF EMPLOYEE ENGAGEMENT ON ABSENTEEISM 563
share the work were often forced to take sick leave or unpaid leave. Ranson’sstudy illustrates similar problems for women who were trying to raise chil-dren and pursue a career, and such results might also be influencing thisstudy’s findings.
To follow this argument, VandenHeuvel and Wooden found that ‘‘previ-ous research has erred by treating men and women as if they respond in anidentical fashion to the various forces influencing work attendance patterns’’(1995:1326). This particular study further argues that not only should
3.55
3.5
3.45
0 10 20 30 40Service Years, 1 to 39
STII
P 1
to 8
40 L
ogge
d 2
R sq Linear= 4.780E-4
Figure 4. ScatterPlot for STIIP Use and Years of Service
Source: BC Stats 2007
Table 6. Gender Comparisions for Engagement Scores and STIIP Use
n 5 8,887 Mean Sd.
95% C.I.
L. bound U. bound
Engagement score Female 252.97 93.58 250.54 255.39
Male 231.9 99.12 228.45 235.35
STIIP use Female 72.42 111.21 69.54 75.31
Male 57.37 97.08 53.99 60.74
Source: BC Stats 2007
564 DANN HOXSEY
women’s and men’s STIIP use be looked at separately, there is also a need formore exploratory research that focuses on uncovering the different ways inwhich each gender understands and expresses engagement.
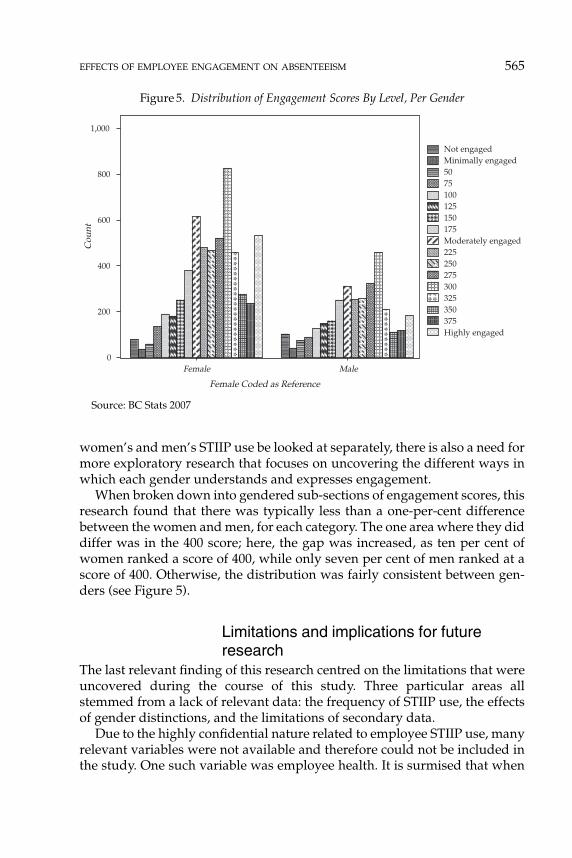
When broken down into gendered sub-sections of engagement scores, thisresearch found that there was typically less than a one-per-cent differencebetween the women and men, for each category. The one area where they diddiffer was in the 400 score; here, the gap was increased, as ten per cent ofwomen ranked a score of 400, while only seven per cent of men ranked at ascore of 400. Otherwise, the distribution was fairly consistent between gen-ders (see Figure 5).
Limitations and implications for futureresearch
The last relevant finding of this research centred on the limitations that wereuncovered during the course of this study. Three particular areas allstemmed from a lack of relevant data: the frequency of STIIP use, the effectsof gender distinctions, and the limitations of secondary data.
Due to the highly confidential nature related to employee STIIP use, manyrelevant variables were not available and therefore could not be included inthe study. One such variable was employee health. It is surmised that when
Not engagedMinimally engaged5075100125150175Moderately engaged225250275300325350375Highly engaged
1,000
800
600
400
200
0Female Male
Cou
nt
Female Coded as Reference
Figure 5. Distribution of Engagement Scores By Level, Per Gender
Source: BC Stats 2007
EFFECTS OF EMPLOYEE ENGAGEMENT ON ABSENTEEISM 565
controlling for health issues, the explanatory power of this model would in-crease dramatically. Furthermore, the scope of this analysis is currentlylimited to the cumulative STIIP hours used by each employee. This measuredoes not adequately reflect the effects of engagement on STIIP use. For ex-ample, a highly engaged employee may incur 700 hours due to majorsurgery, culminating in one five-month period of recovery, while a differentemployee may have fewer STIIP hours but over several instances of use.Additional research points to a distinction between the effects of voluntaryand involuntary STIIP use on absenteeism (Sagie 1998). In other words, byonly tracking the total volume of STIIP use per individual, this researchcould not differentiate between either the frequency of STIIP incidents or thetypes of STIIP used. It is possible to surmise that a disengaged employeewould have higher frequencies of STIIP use and that a highly engaged em-ployee (who might have incurred more hours) would have less instances ofSTIIP use. One possible future research design would be to test the effects ofengagement scores against the frequency of an employee’s STIIP use, hold-ing the length of STIIP use constant.
Along similar lines, the effects of gender distinctions on STIIP use are lostin this research, since the reasons for STIIP use were not made available.Whether women took more involuntary STIIP use than men (and whetherthere was an inverse correlation for voluntary STIIP use) remains unknown.VandenHeuvel and Wooden noted that the research across studies on absen-teeism was often inconsistent and contradictory, leaving this author to agreewith their conclusion that ‘‘simply including sex as a binary explanatoryvariable is inadequate’’ (1995:1327).
Finally, the limitations of using secondary data should be acknowledged.As noted above, this data set emerged out of a much larger project and wasbeing used in an exploratory way to determine the relevancy of measuringjob satisfactions in an abridged manner. Much has been done on the benefitsof the established Job Description Index model of job satisfaction, and wewere curious to see if the dramatic size of this sample (combined with accessto the unusual variable STIIP use) might allow for an abridged version of theJDI.
Although there was some disagreement on how extensive such a modelneeded to be, this project demonstrated that the use of four questions onlyprovided a blunt instrument that proved inadequate when trying to predictSTIIP use. Aside from the complexities of STIIP use listed above, theory alsosuggests that there are cultural implications that should be considered. Forinstance, Arnold Bakker, Hetty van Emmerik, and Martin Euwema foundthat levels of burn-out and engagement were susceptible to transference, atthe work-unit level. Simply put, ‘‘people do not perform their jobs in isola-tion’’ (2006: 465). This points to the need to track a more robust construct ofengagement and STIIP use levels on both an institutional level as well as a
566 DANN HOXSEY
local one.5 This research has not done so. Instead, working from theover-simplified theoretical construct of engagement (that a more engagedemployee is less likely to be absent), it was hypothesized that there would bea direct correlation between engagement and STIIP use, regardless of thework environment. What we have found is that our exclusively macro-model was not refined enough to adequately represent the proposedseventy-plus questions that typically made up a job-satisfaction model(Lease 1998; Russell et al. 2004; Stanton et al. 2002) nor was it localizedenough to capture any cultural transference that may be occurring.
Though the conclusions about the effects of engagement on STIIP usemay be suspect, the systematic attempt to assess the validity of themodel indicates that it is the model that is flawed and not necessarily theconcept behind the model. In a sense, some happier employees may beless inclined to use STIIP; however, this research provides a warningagainst repositioning data for other projects because the ability to generalizethe results can be significantly compromised. In light of the low (4.7 per cent)explanatory power of this research, it has been demonstrated that thelimited scope of this survey hampered the descriptive abilities of this re-search project, consequently affecting any possible generalizations to thepopulation.
ConclusionsThe primary objective of this research was to test whether an employee’slevel of engagement had any effect on the amount of STIIP use they wouldincur by hypothesizing that ‘‘happier’’ employees were ‘‘healthier’’ employ-ees. Though the overall findings were statistically significant, thuscorroborating the research hypothesis, the relationship was relatively weak;only 4.7 per cent of the variation in STIIP use could be explained by an em-ployee’s engagement score (controlling for age, years of service, gender, andunion status).
During the course of this research process, some contradictions emergedbetween the findings and the significance of the model. First, women had ahigher level of both engagement and STIIP use than men; this result was indirect contradiction with the significance of the model. Second, though as-sumed to be correlated, there was an inverse relationship between age andSTIIP use, and service years and STIIP use. And finally, the limitation of ac-cess to other variables was found to have hampered the explanatory powerof this research.
For these reasons, any conclusion of statistical significance is tentative atbest, and – more importantly – points to the need for a more sophisticatedconceptualization of ‘‘engagement’’ and operationalization of variables suchas STIIP use. Furthermore, the reasons put forth also caution researchersagainst making simple correlations between job satisfaction and absenteeism,
EFFECTS OF EMPLOYEE ENGAGEMENT ON ABSENTEEISM 567
or engagement and STIIP use. In the end, the easy ‘‘water-cooler’’ ideologythat unhappy employees are more likely to call in sick ignores the complex-ities required to explain absenteeism.
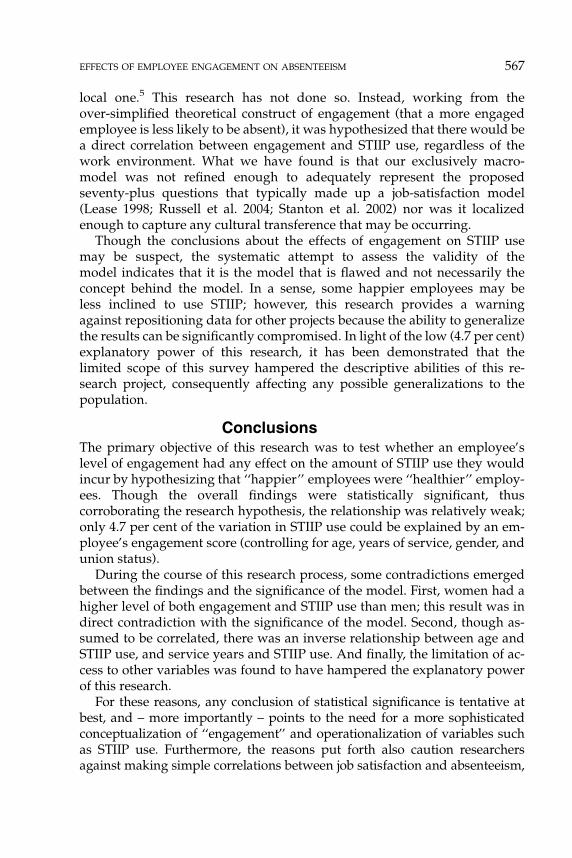
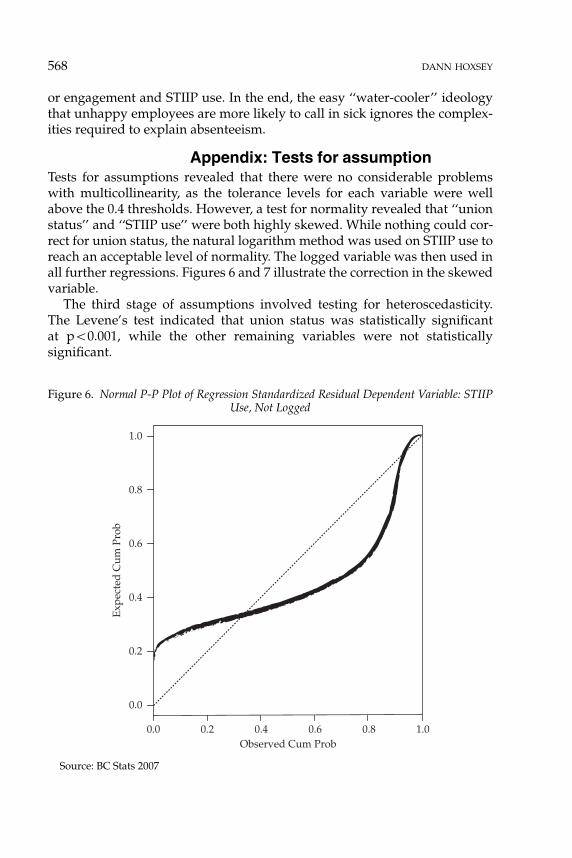
Appendix: Tests for assumptionTests for assumptions revealed that there were no considerable problemswith multicollinearity, as the tolerance levels for each variable were wellabove the 0.4 thresholds. However, a test for normality revealed that ‘‘unionstatus’’ and ‘‘STIIP use’’ were both highly skewed. While nothing could cor-rect for union status, the natural logarithm method was used on STIIP use toreach an acceptable level of normality. The logged variable was then used inall further regressions. Figures 6 and 7 illustrate the correction in the skewedvariable.
The third stage of assumptions involved testing for heteroscedasticity.The Levene’s test indicated that union status was statistically significantat po0.001, while the other remaining variables were not statisticallysignificant.
1.0
0.8
0.6
0.4
0.2
0.0
0.0 0.2 0.4 0.6 0.8 1.0Observed Cum Prob
Exp
ecte
d C
um P
rob
Figure 6. Normal P-P Plot of Regression Standardized Residual Dependent Variable: STIIPUse, Not Logged
Source: BC Stats 2007
568 DANN HOXSEY
The final assumptions test was to identify issues with outliers. Using avariety of tests (the zresid, sdresid and Cook methods), only one outlier wasfound. Upon investigation, there appeared to be no problems with the actualobservation; as the standardized residual was only slightly off from the pre-dicted value, a decision was made to retain the case in the dataset. The nextmethod of analysis was to employ a stepwise (or ‘‘remove’’) regressionmethod to the model. In doing so, the model remained statistically signifi-cant at po0.001 (F 5 87.971, df1 5 5, df2 5 8881) and removed the ‘‘years ofservice’’ variable. This method was discarded, as was clear earlier, becausean employee’s years of service were deemed too important to exclude.
Notes1 For details on the open-ended question, see the report Improving your Work Environment: Sug-
gestions from within (BC Stats 2007b), which complements the statistical data with a qualitativeanalysis of employees’ comments. All the tables and figures in the present research note comefrom the data subset ‘‘engagementfiltered,’’ generated by this survey.
2 Noted on the employees benefits web site: ‘‘Maximum Entitlement: In the event you are un-able to work due to an illness or injury for a period in excess of six months, and you are a
1.0
0.8
0.6
0.4
0.2
0.0
0.0 0.2 0.4 0.6 0.8 1.0Observed Cum Prob
Exp
ecte
d C
um P
rob
Figure 7. Normal P-P Plot of Regression Standardized Residual Dependent Variable: STIIPUse, Logged
Source: BC Stats 2007
EFFECTS OF EMPLOYEE ENGAGEMENT ON ABSENTEEISM 569
regular status employee . . . . Note: Some employer groups have a maximum entitlement ofseven months. Check with your personnel or payroll office’’ (see the BC Public Service Agencyweb site, at http://www.bcpublicservice.ca/benefits/plan_details/disability_stiip.htm#MaximumEntitement).
3 For a more detailed understanding of the distinctions between satisfaction, stress and control,see Stanton et al. (2002). Their article details the problems with assuming that job satisfactionis an indicator of stress and that higher control is correlated to higher levels of satisfaction.
4 Usual practice at BC Stats attributes a 0–100 value to each categorical response. While it mayhave made sense to report an overall score with margins from ‘‘� ’’ to ‘‘1’’, our approachrelies on the ‘‘percent to maximum transformation,’’ established by T.I. Miller and M.A. Miller(1991). I have followed BC Stats’ practice by using a cumulative (400) score. The benefits ofsuch an approach are threefold: a cumulative score (i.e., 325) discourages the reader from re-ferring to a score as a percentage, a cumulative score is more intuitive and easier tounderstand for the statistically uninitiated reader, and a 0–100 (and cumulative 0–400) scoreis more suitable for calculating and comparing means. Additionally, the breakdown of 400into individual scores per question allows for a clearer understanding of each score’s impact,per question.
5 Since the completion of this project, BC Stats has found that levels of STIIP use are not con-sistent across the B.C. civil service (ethical concerns prevent us from singling out individualwork units). Future research will recognize the need to employ a work-unit level analysisthat captures both the culture of engagement and any possible residual effects of a culture ofSTIIP use.
ReferencesAlmond, Stephen, and Andrew Healey. 2003. ‘‘Mental health and absence from work: New
evidence from the UK Quarterly Labour Force Survey.’’ Work, Employment and Society 17 (4)December: 731–42.
Bakker, Arnold B., Hetty van Emmerik, and Martin C. Euwema. 2006. ‘‘Crossover of burnoutand engagement in work teams.’’ Work and Occupations 33 (4) 1 November: 464–89.
BC Stats. 2007a. BC Public Service Work Environment Survey. Survey administered on behalf of BCPublic Service Agency. Victoria: Province of British Columbia.
———. 2007b. Improving your Work Environment: Suggestions from within. Victoria: Queen’s Printer.Bedeian, A., G. Ferris, and K. Kacmar. 1992. ‘‘Age, tenure, and job satisfaction: A tale of two
perspectives.’’ Journal of Vocational Behavior 40 (1) February: 33–48.Brough, Paula, and Joanne Williams. 2007. ‘‘Managing occupational stress in a high-risk indus-
try: Measuring the job demands of correctional officers.’’ Criminal Justice and Behavior 34 (4)April: 555–67.
Heintzman, Ralph, and Brian Marson. 2006. ‘‘People, service and trust: Links in a public sectorservice value chain.’’ Canadian Government Executive 12 (5), available at http://www.psagency-agencefp.gc.ca/rp/pstc-eng.asp.
Heskett, James L., T.O. Jones, G.W. Loveman, Earl W. Sasser, and Leonard A. Schlesinger. 1994.‘‘Putting the service profit chain to work.’’ Harvard Business Review 72 (2) March/April:167–74.
Heskett, James L., Earl W. Sasser, and Leonard A. Schlesinger. 2002. The Value Profit Chain: TreatEmployees Like Customers and Customers Like Employees. New York: Free Press.
Koustelios, Athansios, and Konstantinos Bagiatis. 1997. ‘‘The Employee Satisfaction Inventory(ESI): Development of a scale to measure satisfaction of Greek employees.’’ Educational andPsychological Measurement 57 (3) June: 469–76.
Lease, Suzanne H. 1998. ‘‘Annual review, 1993–1997: Work attitudes and outcomes.’’ Journal ofVocational Behavior 53 (1) February: 154–83.
570 DANN HOXSEY
Miller, T.I., and M.A. Miller. 1991. Citizen Surveys: How to Do Them, How to Use Them and WhatThey Mean. Washington: International City/Country Management Association.
Preston, Valerie, Damaris Rose, Glen Norcliffe, and John Holmes. 2007. ‘‘Shift work, childcare,and domestic work: Divisions of labour in Canadian paper mill communities. ’’ In TheGendered Society Reader: Canadian Edition, edited by Michael Kimmel, Amy Aronson, and AmyKaler. Don Mills, Ont.: Oxford University Press Canada.
Ranson, Gillian. 2007. ‘‘No-longer one of the boys: Negotiations with motherhood, as prospect orreality, among women engineering.’’ In The Gendered Society Reader: Canadian Edition, editedby Michael Kimmel, Amy Aronson, and Amy Kaler. Don Mills, Ont.: Oxford University PressCanada.
Russell, Steven S., Christiane Spitzmuller, Lilly F. Lin, Jeffrey M. Stanton, Patricia C. Smith, andGail H. Ironson. 2004. ‘‘Shorter can also be better: The abridged job in general scale.’’ Educa-tional and Psychological Measurement 64 (5) October: 878–93.
Sagie, Abraham. 1998. ‘‘Employee absenteeism, organizational commitment, and job satisfac-tion: Another look.’’ Journal of Vocational Behavior 52 (2) April: 156–71.
Stanton, Jeffrey M., Peter D. Bachiochi, Chet Robie, Lisa M. Perez, and Patricia C. Smith. 2002.‘‘Revising the JDI Work Satisfaction Subscale: Insights into stress and control.’’ Educational andPsychological Measurement 62 (5) October: 877–95.
VandenHeuvel, Audrey, and Mark Wooden. 1995. ‘‘Do explanations of absenteeism differ formen and women?’’ Human Relations 48 (11) November: 1309–329.
A complementary article, ‘‘Getting engaged: Public-service merit and motivationrevisited,’’ by Kenneth Kernaghan, will appear in our March 2011 issue. Ed.
EFFECTS OF EMPLOYEE ENGAGEMENT ON ABSENTEEISM 571


![GeneralizedLymphadenopathy:UnusualPresentationof ...downloads.hindawi.com/journals/criu/2011/439732.pdfare the first evident clinical manifestation of prostate adeno-carcinoma [4]](https://img.pdfslide.net/doc/110x75/607a2a4697809a3fcc747555/generalizedlymphadenopathyunusualpresentationof-are-the-irst-evident-clinical.jpg)