Embed Size (px)
Citation preview
Research
The Global Sales Ratio, Global and Domestic Firms
May 2017 | ftserussell.com
FTSE Russell | The Global Sales Ratio, Global and Domestic Firms 2
Table of Contents
1. Introduction ........................................................................................................ 3
2. Geographic Sources of Revenue ...................................................................... 3
3. Macroeconomic Factors and Global Sales Exposure ..................................... 4
3.1 FTSE BIRR Macroeconomic Model..................................................................................... 4
3.2 Macroeconomic Characteristics of UK Domestic and Global Stocks .................................. 5
3.3 Macroeconomic Characteristics of US Domestic and Global Stocks .................................. 7
3.4 Macroeconomic Characteristics of Japanese Domestic and Global Stocks ....................... 9
4. Exchange Rate Exposure and the Global Sales Ratio .................................. 10
4.1 Exchange Rate Exposure .................................................................................................. 10
4.2 Exchange Rate Exposure for UK Companies ................................................................... 11
4.3 Global Sales Ratio and Exchange Rate Exposure ............................................................ 12
4.4 Case Study: Brexit ............................................................................................................. 15
5. Conclusion ....................................................................................................... 17
Appendix I: Foreign Exchange Exposure Model ..................................................... 18
a. Choice of Market Index ...................................................................................................... 18
b. Choice of Currency ............................................................................................................ 19
c. Choice of Currency Horizon .............................................................................................. 21
d. Currency Regime and FX Exposure .................................................................................. 22
Appendix II: Global Sales Ratio Measures Geographical Revenue Sources ........ 24
Appendix III: GSR Coefficients: FTSE 350 ex Financials with Industry Effect ..... 25
References ................................................................................................................. 26
FTSE Russell | The Global Sales Ratio, Global and Domestic Firms 3
1. Introduction Global equity asset management is typically structured around country asset allocation, where market
capitalization index weightings provide a reference set of country allocations. This is supported by the
observation that country specific elements are a major influence on stock-price behavior. Conversely, if a
corporation is considered as a portfolio of international activities, its stock price should be influenced by
international factors related to the geographical breakdown of its activities rather than the location of its
headquarters or where its stock is listed and traded.
As companies expand globally, a greater proportion of revenue arises from sources other than the
country of incorporation or primary listing. Consequently, one alternative way to group companies is by
examining geographical sources of revenue. This approach is motivated by the observation that the
performance of domestic and globally focused companies is likely to be influenced by different macro-
economic factors. Global companies, diversified across geographic regions, are less likely to be
influenced by localized economic conditions.
We examine the impact of unanticipated changes in exchange rates on firm value as an appreciation of
the home currency may adversely affect the competitiveness of global firms. Domestic firms are also
affected by exchange rate fluctuations if for example their suppliers are exposed to international trade, or
they have foreign operations and through effects on overseas competitors.
The objective of this paper is to evaluate criteria for creating homogenous groups of global and domestic
companies. This may help market participants gain a deeper understanding of the effect of macro-
economic events and exchange rate changes on firms.
We use the proportion of overseas sales to total sales, the global sales ratio (GSR), to assess a
company’s level of domestic and global activity. We illustrate that a homogeneous group of companies
with similar exchange rate exposure can be formed using the GSR, irrespective of size or industry
differences. We show that the UK companies categorized as global using the GSR, including smaller and
FTSE 250 companies, exhibit negative exchange rate exposure on average and benefit from a
depreciation of Sterling. Conversely, Domestic companies exhibit positive exchange rate exposure on
average. Our results indicate that the GSR provides a cleaner separation than market capitalization in
forming global and domestic proxies for the UK. We also examine the effectiveness of the GSR in
separating the Russell 1000® and FTSE Japan constituents into domestic and global categories.
Finally, we highlight subtle differences between the GSR and exchange rate exposure. The GSR is based
on accounting data and therefore observable. Exchange rate exposure results from a regression analysis
and is sensitive to the specification of the regression. Furthermore, a firm's hedging policy will affect
exchange rate exposure estimates and hence the global nature of the firm.1 We conclude that the GSR is
a preferred measure for forming distinct groups of global and domestic stocks.
2. Geographic Sources of Revenue Companies are required to disclose geographic revenue breakdowns under both ASC280 (US GAAP)
and IFRS. For example, IFRS8 requires entity-wide disclosures of geographic revenues from external
customers. Information by geographic area is required for an entity’s country of domicile and for foreign
countries, if material. Drawing on this data, we calculate the global sales ratio (GSR) as the proportion of
total sales arising overseas. By definition, the domestic sales ratio (DSR) is one minus the GSR.2
Investment trusts in the UK are listed companies whose assets consist of a portfolio of shares and other
securities. We exclude Investment Trusts from our UK analysis since investment mandates may be global
and therefore not reflect the geographic breakdown of UK listed stocks.
1 Adjustments to exchange rate exposure for hedging activities would require knowledge of a firm’s use of currency derivatives. This
is beyond the scope of this study. 2 From 2015 onwards, available GSR is collected each September. Historical data prior to 2015 is lagged by 6 months to avoid look-
ahead bias.
FTSE Russell | The Global Sales Ratio, Global and Domestic Firms 4
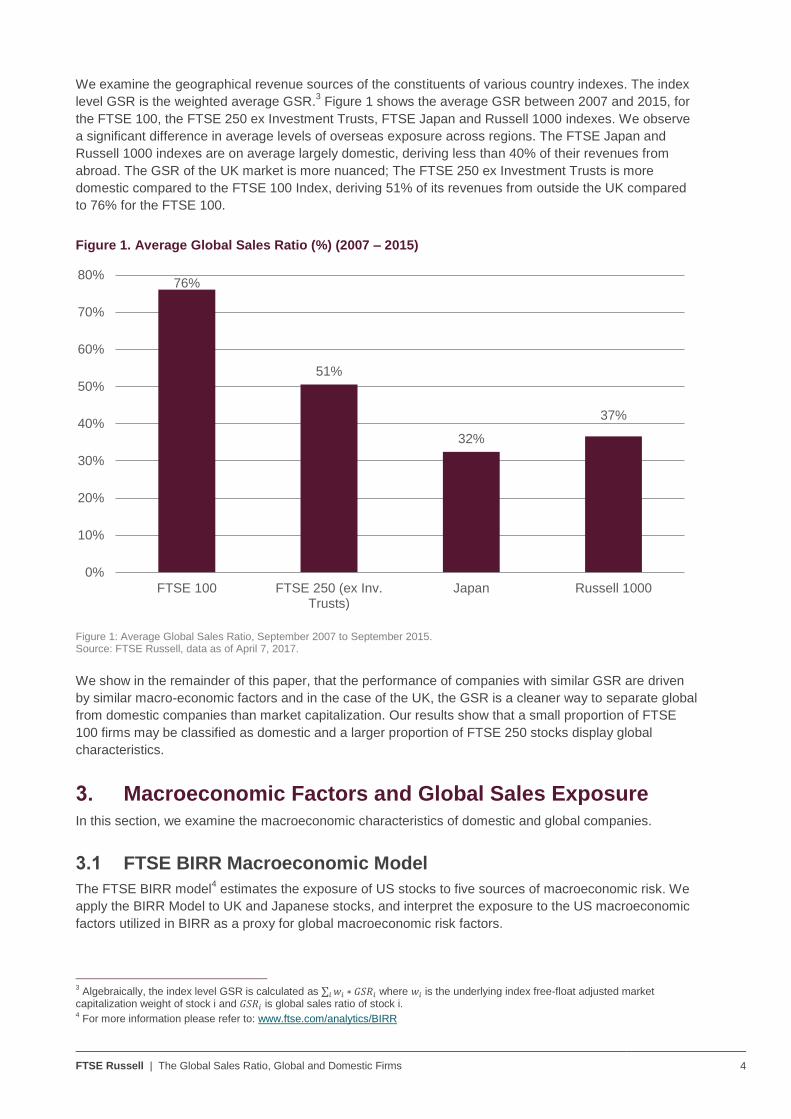
We examine the geographical revenue sources of the constituents of various country indexes. The index
level GSR is the weighted average GSR.3 Figure 1 shows the average GSR between 2007 and 2015, for
the FTSE 100, the FTSE 250 ex Investment Trusts, FTSE Japan and Russell 1000 indexes. We observe
a significant difference in average levels of overseas exposure across regions. The FTSE Japan and
Russell 1000 indexes are on average largely domestic, deriving less than 40% of their revenues from
abroad. The GSR of the UK market is more nuanced; The FTSE 250 ex Investment Trusts is more
domestic compared to the FTSE 100 Index, deriving 51% of its revenues from outside the UK compared
to 76% for the FTSE 100.
Figure 1. Average Global Sales Ratio (%) (2007 – 2015)
Figure 1: Average Global Sales Ratio, September 2007 to September 2015. Source: FTSE Russell, data as of April 7, 2017.
We show in the remainder of this paper, that the performance of companies with similar GSR are driven
by similar macro-economic factors and in the case of the UK, the GSR is a cleaner way to separate global
from domestic companies than market capitalization. Our results show that a small proportion of FTSE
100 firms may be classified as domestic and a larger proportion of FTSE 250 stocks display global
characteristics.
3. Macroeconomic Factors and Global Sales Exposure In this section, we examine the macroeconomic characteristics of domestic and global companies.
3.1 FTSE BIRR Macroeconomic Model
The FTSE BIRR model4 estimates the exposure of US stocks to five sources of macroeconomic risk. We
apply the BIRR Model to UK and Japanese stocks, and interpret the exposure to the US macroeconomic
factors utilized in BIRR as a proxy for global macroeconomic risk factors.
3 Algebraically, the index level GSR is calculated as ∑ 𝑤𝑖 ∗ 𝐺𝑆𝑅𝑖𝑖 where 𝑤𝑖 is the underlying index free-float adjusted market
capitalization weight of stock i and 𝐺𝑆𝑅𝑖 is global sales ratio of stock i. 4 For more information please refer to: www.ftse.com/analytics/BIRR
76%
51%
32%
37%
0%
10%
20%
30%
40%
50%
60%
70%
80%
FTSE 100 FTSE 250 (ex Inv.Trusts)
Japan Russell 1000
FTSE Russell | The Global Sales Ratio, Global and Domestic Firms 5
Confidence Risk: Unexpected changes in investor confidence. Confidence Risk is measured as the
difference between the monthly rate of return on 20-year corporate bonds and 20-year government
bonds. Confidence Risk reflects the degree of risk aversion. As investor confidence falls, the yield
spread between corporate and government bonds widens and relatively “safer” stocks rise in price.
Time Horizon Risk: Unexpected changes in investors’ investment horizon. Time Horizon Risk is
defined as the difference in expected returns to 20-year government bonds and 30-day T-bills. Time–
Horizon Risk captures investors' propensity to hold stocks for the longer term.
Inflation Risk: Unexpected changes in inflation. Inflation Risk is the inflationary surprise, measured
as the difference between actual and the expected inflation rates. A positive exposure to Inflation
Risk describes a stock benefitting from a positive inflation surprise.
Business Cycle Risk: Unexpected changes in the growth in business activity. Cyclical stocks are
more likely to exhibit positive exposure to Business Cycle Risk.
Market Timing Risk: Residual market risk that cannot be attributed to the other factors.
3.2 Macroeconomic Characteristics of UK Domestic and Global Stocks
In this section, we examine the aggregate macroeconomic risk exposures of domestic and global
constituents of the FTSE 350 ex Investment Trusts Index.
We divide the FTSE 350 ex Investment Trusts constituents into three groups by GSR: companies that
derive at least 80% of their revenue from overseas (GSR >= 80%) form the global group, whilst
companies that derive less than 20% of their revenue from overseas are categorized as domestic.
Companies with a GSR between 20% and 80% form the mixed group. Our results are insensitive to
reasonable cut-off points. Table 1 indicates an approximately equal number of stocks in each group and
suggests that the global group consists of larger stocks.
Table 1. Global and Domestic Groups - FTSE 350 ex Investment Trusts (2007 – 2016)
Global Domestic
Number of stocks 108 96
Percent of FTSE 350 ex Investment Trusts by market cap 58% 13%
Average market cap ($ B) 14.5 3.6
Table 1: Average number of stocks and proportion of total market capitalization: domestic and global groups - 2007 – 2016. Source: FTSE Russell, data as of April 7, 2017.
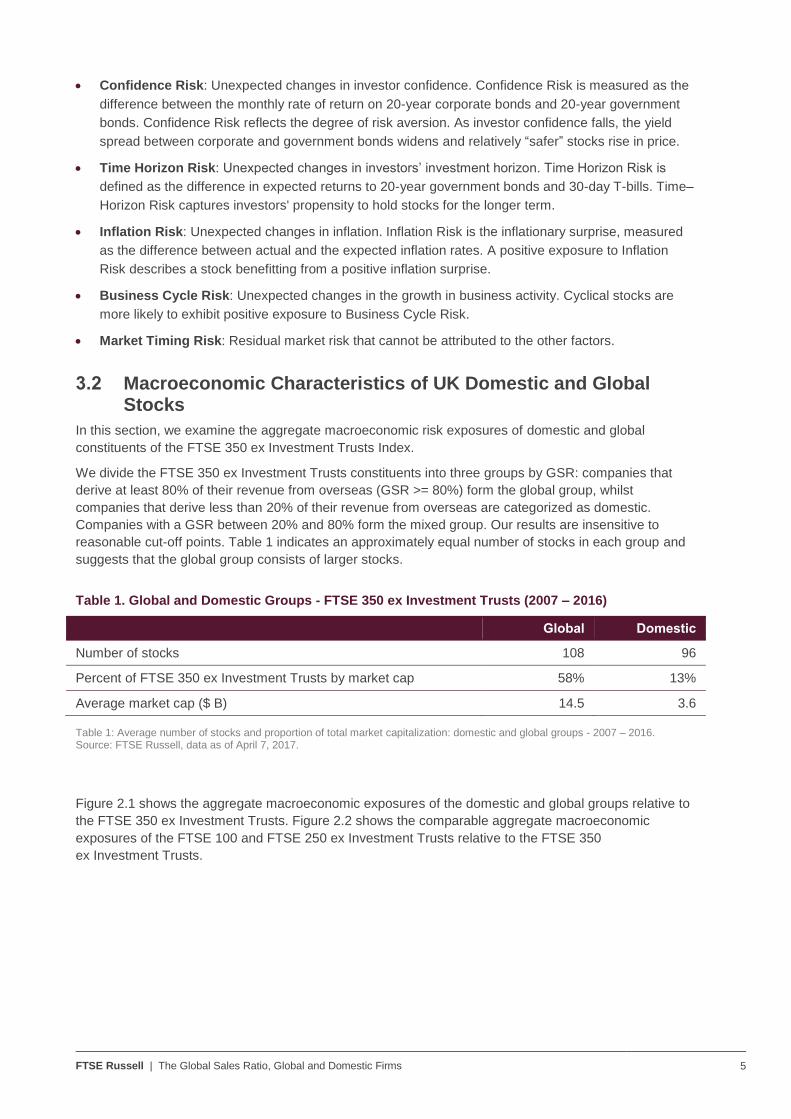
Figure 2.1 shows the aggregate macroeconomic exposures of the domestic and global groups relative to
the FTSE 350 ex Investment Trusts. Figure 2.2 shows the comparable aggregate macroeconomic
exposures of the FTSE 100 and FTSE 250 ex Investment Trusts relative to the FTSE 350
ex Investment Trusts.
FTSE Russell | The Global Sales Ratio, Global and Domestic Firms 6
Figure 2. Average Macro economic Exposure Relative to the FTSE 350 ex Investment Trusts
(2007 – 2016)
Figure 2.1: Global and Domestic Groups
Figure 2.2: FTSE 100 and FTSE 250 ex. Inv. Trusts
Figure 2: Stock level macroeconomic exposure is estimated using the FTSE BIRR model. Aggregate exposure is calculated relative to the FTSE 350 ex Investment Trusts Index, averaged over the period 2007 to 2016. Figure 2.1 displays the exposure of stocks grouped by GSR (Global, GSR> 80%; Domestic, GSR < 20%), whilst Figure 2.2 shows the exposure of the FTSE 100 and FTSE 250 ex Investment Trusts. Source: FTSE Russell, data as of April 7, 2017.Past performance is no guarantee of future results. Please see the end for important legal disclosures.
The domestic and global categories typically exhibit contrary macroeconomic exposures. Furthermore,
the results confirm the global and domestic nature of the FTSE 100 and FTSE 250 ex Investment Trusts
respectively. Domestic stocks and the FTSE 250 ex Investment Trusts benefit from increased levels of
business activity. The FTSE 100 and global group are largely immune to macroeconomic events. This
may be a result of the diversified nature of global companies that limits their sensitivity to the macro-
economic cycle.
There are some differences between domestic and FTSE 250 ex Investment Trust stocks: Changes in
Confidence Risk have the opposite effect on the two groups and the magnitude of Business Cycle
exposure is more pronounced for the FTSE 250 ex Investment Trusts. This may be because FTSE 250
stocks are relatively smaller and small caps tend to exhibit more positive exposure to Confidence and
Business Cycle Risk. Conversely, domestic stocks are not necessarily smaller as some FTSE 100
companies may also be classified as domestic.5
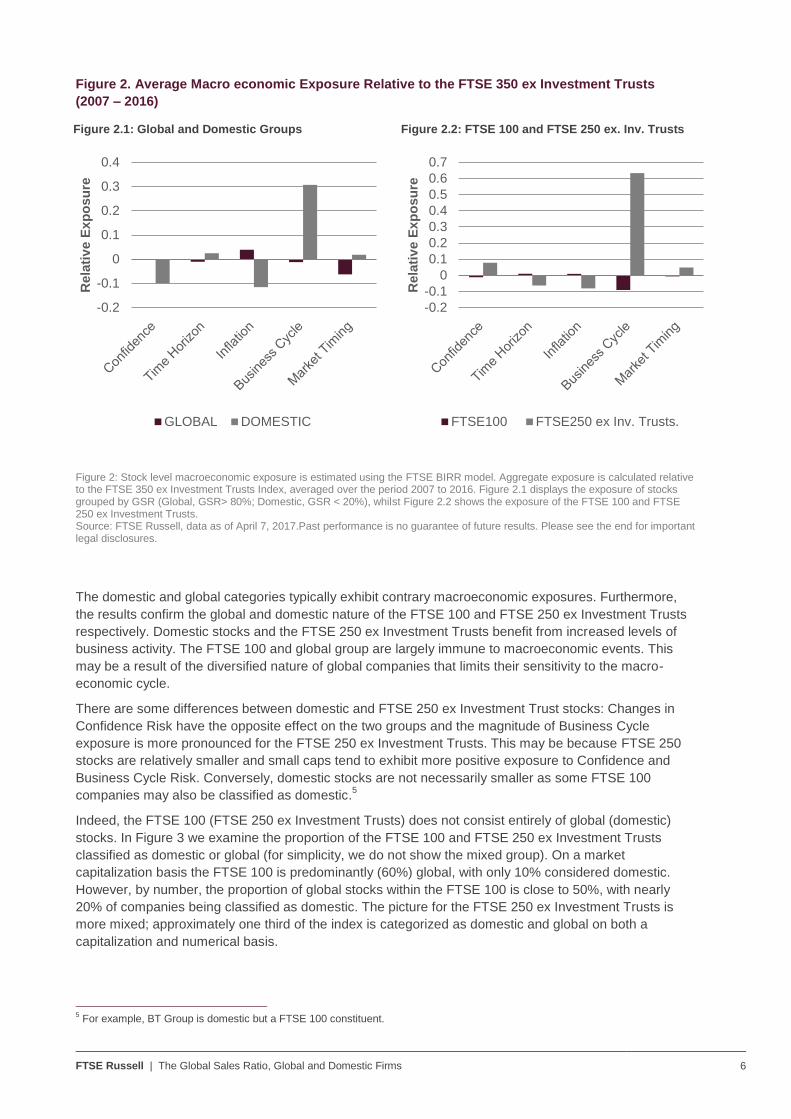
Indeed, the FTSE 100 (FTSE 250 ex Investment Trusts) does not consist entirely of global (domestic)
stocks. In Figure 3 we examine the proportion of the FTSE 100 and FTSE 250 ex Investment Trusts
classified as domestic or global (for simplicity, we do not show the mixed group). On a market
capitalization basis the FTSE 100 is predominantly (60%) global, with only 10% considered domestic.
However, by number, the proportion of global stocks within the FTSE 100 is close to 50%, with nearly
20% of companies being classified as domestic. The picture for the FTSE 250 ex Investment Trusts is
more mixed; approximately one third of the index is categorized as domestic and global on both a
capitalization and numerical basis.
5 For example, BT Group is domestic but a FTSE 100 constituent.
-0.2
-0.1
0
0.1
0.2
0.3
0.4
Rela
tiv
e E
xp
osu
re
GLOBAL DOMESTIC
-0.2
-0.1
0
0.1
0.2
0.3
0.4
0.5
0.6
0.7
Rela
tiv
e E
xp
osu
re
FTSE100 FTSE250 ex Inv. Trusts.
FTSE Russell | The Global Sales Ratio, Global and Domestic Firms 7
Figure 3: Average Composition - FTSE 100 and FTSE 250 ex Investment Trusts Index (2007-2016)
Figure 3.1: FTSE 100
Figure: 3.2 FTSE 250
Figure 3: FTSE 100 and FTSE 250 ex Investment Trusts: Average proportion of index classified as Global (GSR>80%) or Domestic (GSR<20%), by number of stocks and market capitalization (2007 to 2016). Source: FTSE Russell, data as of April 7, 2017.
Figure 2 indicates that the macroeconomic characteristics of the global (domestic) group are similar to
those of the FTSE 100 Index (FTSE 250 ex Investment Trusts Index). However, the fact that only half of
the constituents of the FTSE 100 are global and one third of the stocks in the FTSE 250 ex Investment
Trusts are domestic suggests the geographic source of revenue of the two indexes is more mixed.6
Anecdotally, market capitalization offers one mechanism for splitting the FTSE 350 ex Investment Trusts
constituents into globally and domestically focused groups of stocks. However, a separation predicated
on GSR, potentially provides as superior and more general mechanism for identifying domestic and
global stocks. In the following section, we examine whether the UK experience can be replicated in the
US and Japan and consider whether market capitalization can distinguish between domestic and global
companies.
3.3 Macroeconomic Characteristics of US Domestic and Global Stocks
In this section, we examine the macroeconomic characteristics of Russell 1000 global and domestic
baskets using the FTSE BIRR model. We divide the Russell 1000 constituents into three groups by GSR7:
global (GSR >= 50%), domestic (GSR <= 10%) and mixed Groups. A company that derives half of its
revenue from overseas may not be thought of as particularly global. However, in order to ensure a
reasonably even allocation of companies to each category, we use 50% and 10% as cut-off points to
define the global, mixed and domestic groups. The results are not sensitive to reasonable variations in
the choice of the cut-off points.8
We also consider whether market capitalization can be used to distinguish domestic and global
constituents of the Russell 1000 index. We form quintiles using investable market capitalization each
September between 2007 and 2016. Table 2 shows that the top (large capitalization) quintile on average
constitutes 70% of total Russell 1000 market capitalization, while the bottom (small capitalization) quintile
group comprises only 2% of the total market capitalization.
6 Our results are not sensitive to reasonable choices of GSR cut-off points.
7 We exclude REITs.
8 Our conclusions hold if we examine the macroeconomic exposures of quintiles formed on GSR.
0
10
20
30
40
50
60
70
By number By market cap
%
FTSE 100, Global FTSE 100, Domestic
0
10
20
30
40
50
60
70
By number By market cap
%
FTSE 250 ex Investmet Trusts,Global
FTSE 250 ex Investment Trusts,Domestic
FTSE Russell | The Global Sales Ratio, Global and Domestic Firms 8
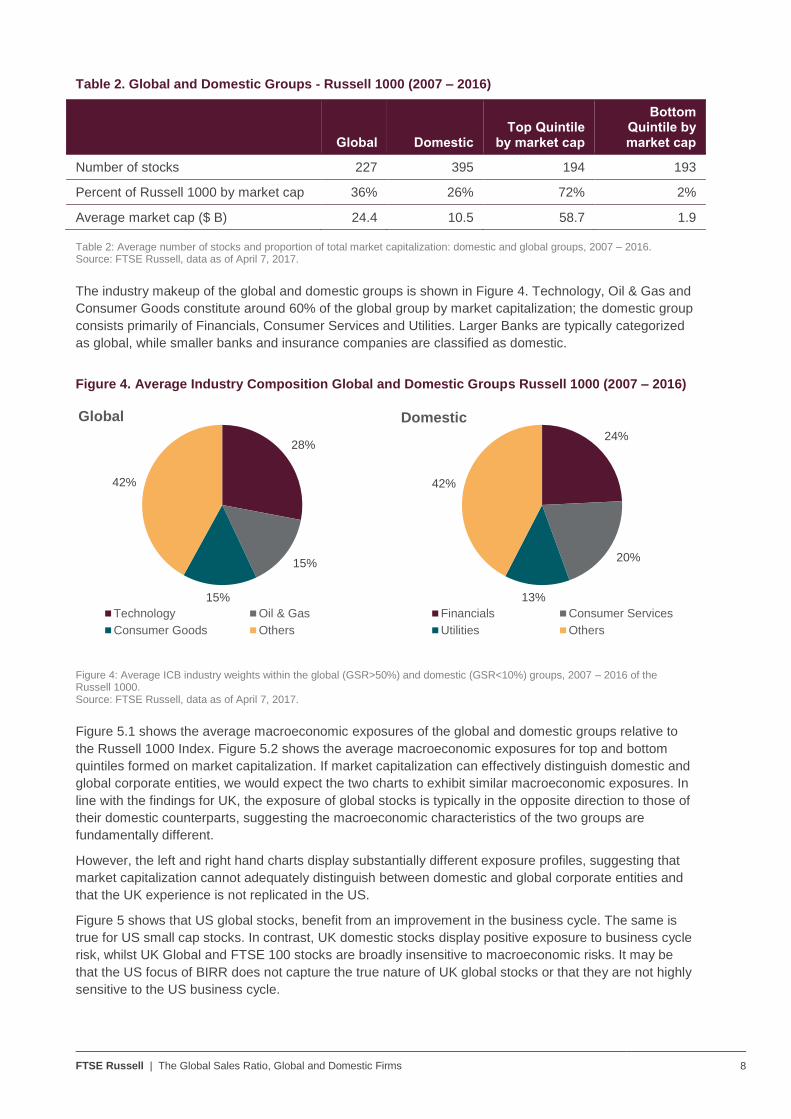
Table 2. Global and Domestic Groups - Russell 1000 (2007 – 2016)
Global Domestic Top Quintile
by market cap
Bottom Quintile by market cap
Number of stocks 227 395 194 193
Percent of Russell 1000 by market cap 36% 26% 72% 2%
Average market cap ($ B) 24.4 10.5 58.7 1.9
Table 2: Average number of stocks and proportion of total market capitalization: domestic and global groups, 2007 – 2016. Source: FTSE Russell, data as of April 7, 2017.
The industry makeup of the global and domestic groups is shown in Figure 4. Technology, Oil & Gas and
Consumer Goods constitute around 60% of the global group by market capitalization; the domestic group
consists primarily of Financials, Consumer Services and Utilities. Larger Banks are typically categorized
as global, while smaller banks and insurance companies are classified as domestic.
Figure 4. Average Industry Composition Global and Domestic Groups Russell 1000 (2007 – 2016)
Figure 4: Average ICB industry weights within the global (GSR>50%) and domestic (GSR<10%) groups, 2007 – 2016 of the Russell 1000. Source: FTSE Russell, data as of April 7, 2017.
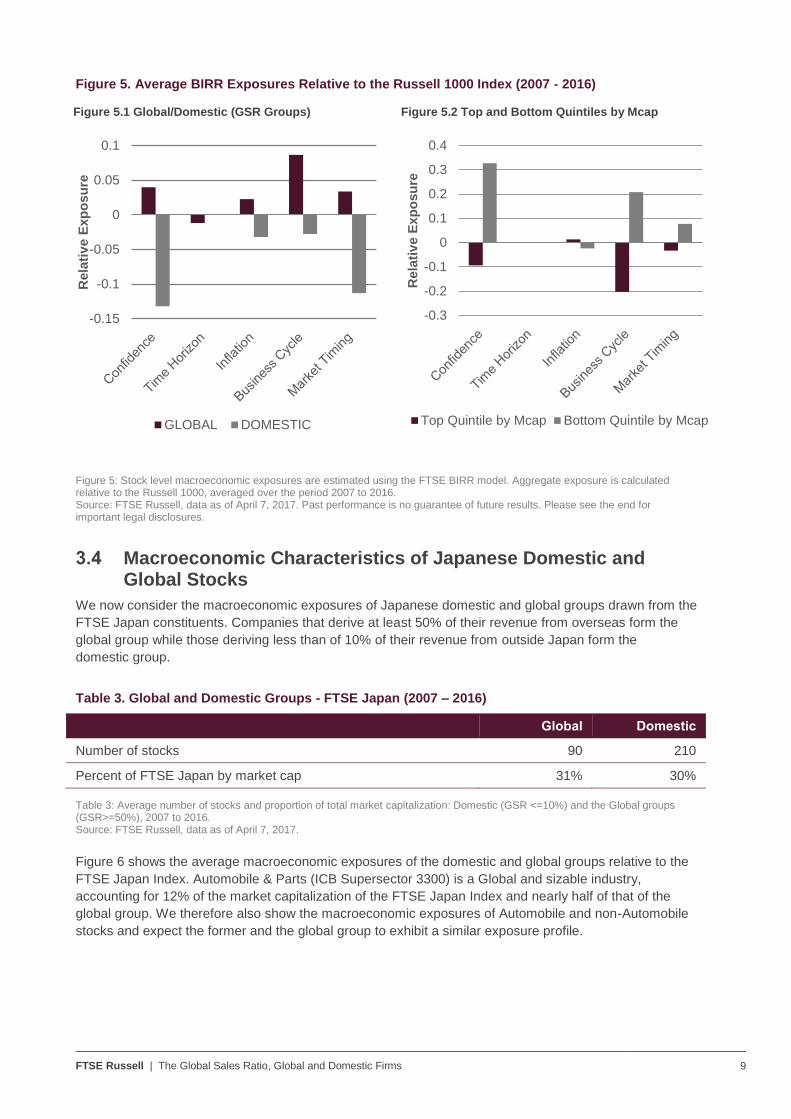
Figure 5.1 shows the average macroeconomic exposures of the global and domestic groups relative to
the Russell 1000 Index. Figure 5.2 shows the average macroeconomic exposures for top and bottom
quintiles formed on market capitalization. If market capitalization can effectively distinguish domestic and
global corporate entities, we would expect the two charts to exhibit similar macroeconomic exposures. In
line with the findings for UK, the exposure of global stocks is typically in the opposite direction to those of
their domestic counterparts, suggesting the macroeconomic characteristics of the two groups are
fundamentally different.
However, the left and right hand charts display substantially different exposure profiles, suggesting that
market capitalization cannot adequately distinguish between domestic and global corporate entities and
that the UK experience is not replicated in the US.
Figure 5 shows that US global stocks, benefit from an improvement in the business cycle. The same is
true for US small cap stocks. In contrast, UK domestic stocks display positive exposure to business cycle
risk, whilst UK Global and FTSE 100 stocks are broadly insensitive to macroeconomic risks. It may be
that the US focus of BIRR does not capture the true nature of UK global stocks or that they are not highly
sensitive to the US business cycle.
28%
15%
15%
42%
Global
Technology Oil & Gas
Consumer Goods Others
24%
20%
13%
42%
Domestic
Financials Consumer Services
Utilities Others
FTSE Russell | The Global Sales Ratio, Global and Domestic Firms 9
Figure 5. Average BIRR Exposures Relative to the Russell 1000 Index (2007 - 2016)
Figure 5.1 Global/Domestic (GSR Groups)
Figure 5.2 Top and Bottom Quintiles by Mcap
Figure 5: Stock level macroeconomic exposures are estimated using the FTSE BIRR model. Aggregate exposure is calculated relative to the Russell 1000, averaged over the period 2007 to 2016. Source: FTSE Russell, data as of April 7, 2017. Past performance is no guarantee of future results. Please see the end for important legal disclosures.
3.4 Macroeconomic Characteristics of Japanese Domestic and Global Stocks
We now consider the macroeconomic exposures of Japanese domestic and global groups drawn from the
FTSE Japan constituents. Companies that derive at least 50% of their revenue from overseas form the
global group while those deriving less than of 10% of their revenue from outside Japan form the
domestic group.
Table 3. Global and Domestic Groups - FTSE Japan (2007 – 2016)
Global Domestic
Number of stocks 90 210
Percent of FTSE Japan by market cap 31% 30%
Table 3: Average number of stocks and proportion of total market capitalization: Domestic (GSR <=10%) and the Global groups (GSR>=50%), 2007 to 2016. Source: FTSE Russell, data as of April 7, 2017.
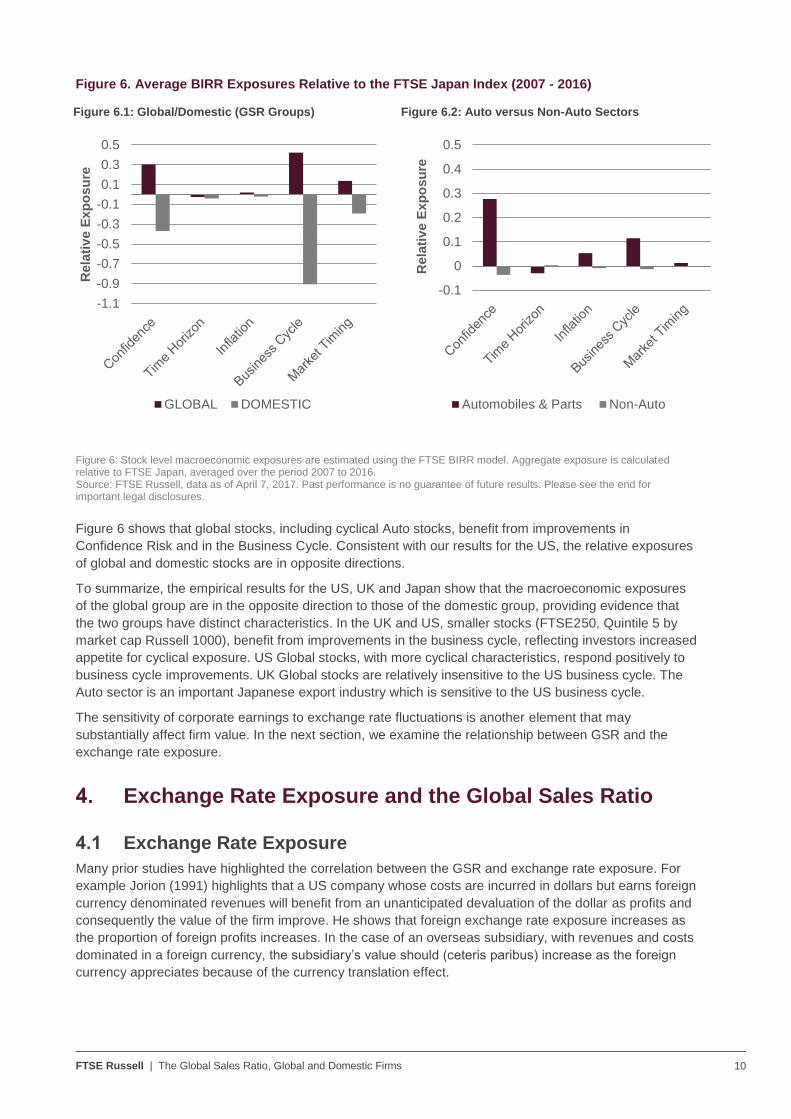
Figure 6 shows the average macroeconomic exposures of the domestic and global groups relative to the
FTSE Japan Index. Automobile & Parts (ICB Supersector 3300) is a Global and sizable industry,
accounting for 12% of the market capitalization of the FTSE Japan Index and nearly half of that of the
global group. We therefore also show the macroeconomic exposures of Automobile and non-Automobile
stocks and expect the former and the global group to exhibit a similar exposure profile.
-0.15
-0.1
-0.05
0
0.05
0.1
Rela
tiv
e E
xp
osu
re
GLOBAL DOMESTIC
-0.3
-0.2
-0.1
0
0.1
0.2
0.3
0.4
Rela
tiv
e E
xp
osu
re
Top Quintile by Mcap Bottom Quintile by Mcap
FTSE Russell | The Global Sales Ratio, Global and Domestic Firms 10
Figure 6. Average BIRR Exposures Relative to the FTSE Japan Index (2007 - 2016)
Figure 6.1: Global/Domestic (GSR Groups)
Figure 6.2: Auto versus Non-Auto Sectors
Figure 6: Stock level macroeconomic exposures are estimated using the FTSE BIRR model. Aggregate exposure is calculated relative to FTSE Japan, averaged over the period 2007 to 2016. Source: FTSE Russell, data as of April 7, 2017. Past performance is no guarantee of future results. Please see the end for important legal disclosures.
Figure 6 shows that global stocks, including cyclical Auto stocks, benefit from improvements in
Confidence Risk and in the Business Cycle. Consistent with our results for the US, the relative exposures
of global and domestic stocks are in opposite directions.
To summarize, the empirical results for the US, UK and Japan show that the macroeconomic exposures
of the global group are in the opposite direction to those of the domestic group, providing evidence that
the two groups have distinct characteristics. In the UK and US, smaller stocks (FTSE250, Quintile 5 by
market cap Russell 1000), benefit from improvements in the business cycle, reflecting investors increased
appetite for cyclical exposure. US Global stocks, with more cyclical characteristics, respond positively to
business cycle improvements. UK Global stocks are relatively insensitive to the US business cycle. The
Auto sector is an important Japanese export industry which is sensitive to the US business cycle.
The sensitivity of corporate earnings to exchange rate fluctuations is another element that may
substantially affect firm value. In the next section, we examine the relationship between GSR and the
exchange rate exposure.
4. Exchange Rate Exposure and the Global Sales Ratio
4.1 Exchange Rate Exposure
Many prior studies have highlighted the correlation between the GSR and exchange rate exposure. For
example Jorion (1991) highlights that a US company whose costs are incurred in dollars but earns foreign
currency denominated revenues will benefit from an unanticipated devaluation of the dollar as profits and
consequently the value of the firm improve. He shows that foreign exchange rate exposure increases as
the proportion of foreign profits increases. In the case of an overseas subsidiary, with revenues and costs
dominated in a foreign currency, the subsidiary’s value should (ceteris paribus) increase as the foreign
currency appreciates because of the currency translation effect.
-1.1
-0.9
-0.7
-0.5
-0.3
-0.1
0.1
0.3
0.5
Rela
tiv
e E
xp
osu
re
GLOBAL DOMESTIC
-0.1
0
0.1
0.2
0.3
0.4
0.5
Rela
tiv
e E
xp
osu
re
Automobiles & Parts Non-Auto
FTSE Russell | The Global Sales Ratio, Global and Domestic Firms 11
Domestic firms are indirectly exposed to exchange rate risk through their competitors, suppliers and the
sensitivity of customer demand to a choice of imported goods, but to a lesser extent than a firm with a
large percentage of earnings generated globally. As the value of the home currency rises, domestic firms
benefit from a fall in the cost of imported inputs. Conversely, cheaper imports of final goods may result in
increased competitive pressures in the home market, leading to a possible fall in the value of domestic
firms. However, the academic literature9 typically points to a positive foreign exchange effect.
4.2 Exchange Rate Exposure for UK Companies
We investigate the importance of exchange rate fluctuations and use stock returns to assess foreign
exchange rate exposure for UK stocks. We test the robustness of the model using a range of market
indexes, currencies and estimation horizons highlighting the importance of each. Details can be found in
Appendix I.
The relationship between stock returns and unanticipated changes in exchange rates is defined as:
𝑅𝑖,𝑡 = 𝛼0𝑖 + ∑ 𝛽𝑖,𝑘𝑅𝑘,𝑚𝑘𝑡𝐾𝑘=1 + ∑ 𝛿𝑖,𝑘𝐶𝑘,𝑡
𝑁𝑘=1 + 휀𝑖,𝑡 t= 1, …., T (1)
Where:
𝑅𝑖,𝑡 = Total return of stock i in local currency
𝑅𝑚𝑘𝑡 = Equally weighted return: FTSE 250 ex Investment Trusts or the S&P GS Energy and Metal index.
𝐶𝑘,𝑡 = Change in Bank of International Settlements broad nominal exchange rate (BIS EER) index and the
GBP/ USD exchange rate.
Currency is expressed as the value of USD per pound sterling i.e. a positive exchange rate change
reflects strengthening or appreciation of the pound. The exchange rate exposure 𝛿𝑖 reflects the change in
stock prices of the 𝑖𝑡ℎ company to unexpected changes10
in exchange rates. We expect to find larger and
more negative foreign exchange rate exposure estimates for Global / multinationals and smaller and more
positive foreign exchange rate exposure estimates for Domestic firms.
To the extent that it takes time for currency movements to be reflected in firm valuations, we estimate the
exchange rate exposure over a 3-month horizon. Exchange rate exposure estimated over shorter
horizons (e.g. weekly or monthly) is small.
To assess the extent to which exchange rate exposure is explained by different levels of GSR, we
estimate the following equation:
𝛽𝑖𝑓𝑥
= 𝜃0 + 𝜃1 ∗ 𝐺𝑆𝑅𝑖 (2)
Where: 𝛽𝑖𝑓𝑥
= ∑ 𝛿𝑖,𝑘𝑁𝑘=1
𝛿𝑖,𝑘 is the exchange rate exposure estimate for stock i and currency factor 𝑘. 𝛽𝑖𝑓𝑥
is therefore the
aggregate estimate of BIS EER and the GBP/ USD exchange rate exposure for stock 𝑖. 𝜃1 is the GSR
coefficient.
We apply this approach to the constituents of the FTSE 350 ex Financials, resulting in a universe of 227
stocks, of which 78 are FTSE100 constituents and 149 are members of the FTSE 250. We exclude
Financials as the currency impact is too complex to be captured by our model. A cash flow model would
be more appropriate11
which is beyond the scope of this paper. A minimum of three years of weekly
return data is required in order for a stock to be included in the analysis, reducing the sample to 203
stocks. The sample period covers the 10-year period from October 2006 to September 2016.
9 See for example, Aggarwal and Harper (2010)
10 If expected returns and the expected change in the FX rate are constant over time, this will be reflected in the intercept 𝛼0𝑖
11 See Martin and Mauer (2003)
FTSE Russell | The Global Sales Ratio, Global and Domestic Firms 12
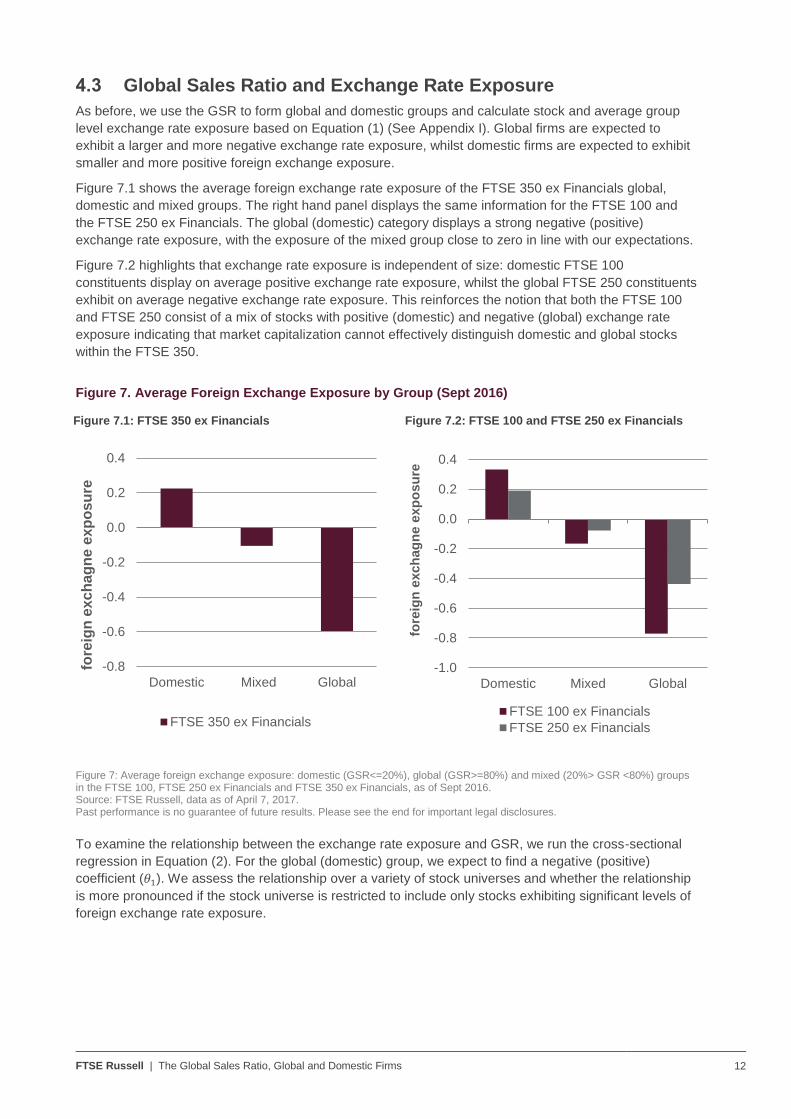
4.3 Global Sales Ratio and Exchange Rate Exposure
As before, we use the GSR to form global and domestic groups and calculate stock and average group
level exchange rate exposure based on Equation (1) (See Appendix I). Global firms are expected to
exhibit a larger and more negative exchange rate exposure, whilst domestic firms are expected to exhibit
smaller and more positive foreign exchange exposure.
Figure 7.1 shows the average foreign exchange rate exposure of the FTSE 350 ex Financials global,
domestic and mixed groups. The right hand panel displays the same information for the FTSE 100 and
the FTSE 250 ex Financials. The global (domestic) category displays a strong negative (positive)
exchange rate exposure, with the exposure of the mixed group close to zero in line with our expectations.
Figure 7.2 highlights that exchange rate exposure is independent of size: domestic FTSE 100
constituents display on average positive exchange rate exposure, whilst the global FTSE 250 constituents
exhibit on average negative exchange rate exposure. This reinforces the notion that both the FTSE 100
and FTSE 250 consist of a mix of stocks with positive (domestic) and negative (global) exchange rate
exposure indicating that market capitalization cannot effectively distinguish domestic and global stocks
within the FTSE 350.
Figure 7. Average Foreign Exchange Exposure by Group (Sept 2016)
Figure 7.1: FTSE 350 ex Financials
Figure 7.2: FTSE 100 and FTSE 250 ex Financials
Figure 7: Average foreign exchange exposure: domestic (GSR<=20%), global (GSR>=80%) and mixed (20%> GSR <80%) groups in the FTSE 100, FTSE 250 ex Financials and FTSE 350 ex Financials, as of Sept 2016. Source: FTSE Russell, data as of April 7, 2017. Past performance is no guarantee of future results. Please see the end for important legal disclosures.
To examine the relationship between the exchange rate exposure and GSR, we run the cross-sectional
regression in Equation (2). For the global (domestic) group, we expect to find a negative (positive)
coefficient (𝜃1). We assess the relationship over a variety of stock universes and whether the relationship
is more pronounced if the stock universe is restricted to include only stocks exhibiting significant levels of
foreign exchange rate exposure.
-0.8
-0.6
-0.4
-0.2
0.0
0.2
0.4
Domestic Mixed Global
fore
ign
exc
ha
gn
e e
xp
os
ure
FTSE 350 ex Financials
-1.0
-0.8
-0.6
-0.4
-0.2
0.0
0.2
0.4
Domestic Mixed Global
fore
ign
exch
ag
ne e
xp
osu
re
FTSE 100 ex Financials
FTSE 250 ex Financials
FTSE Russell | The Global Sales Ratio, Global and Domestic Firms 13
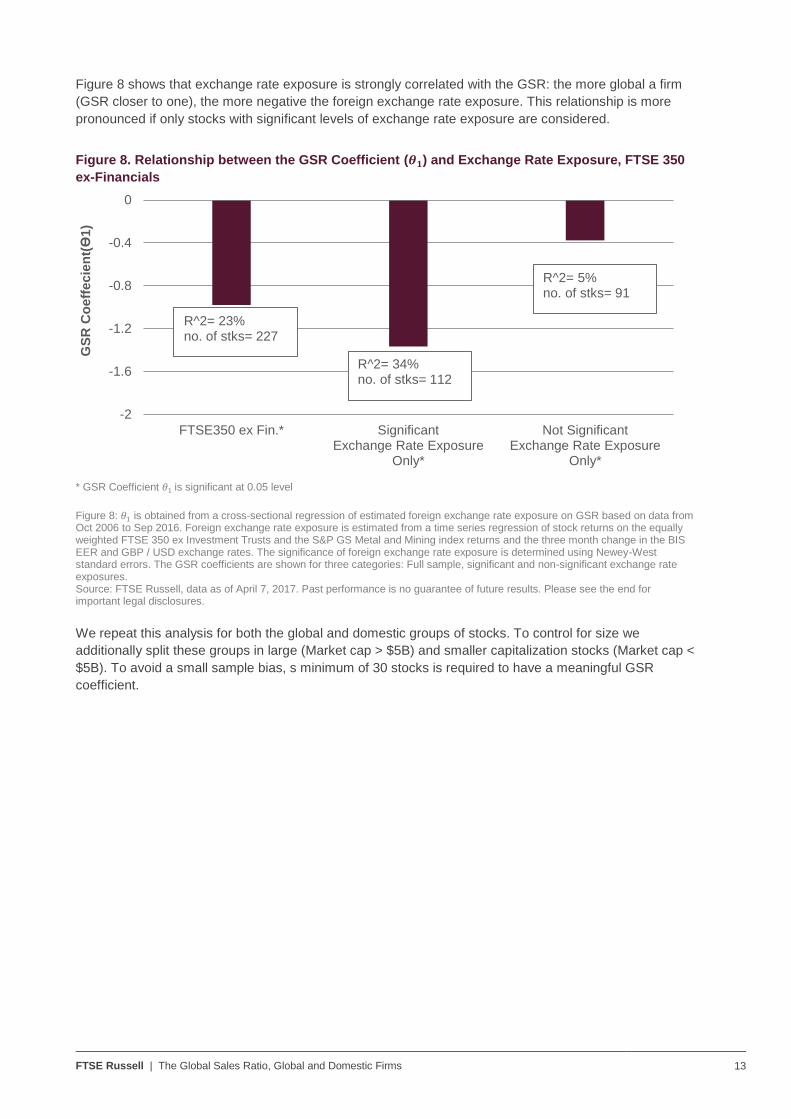
Figure 8 shows that exchange rate exposure is strongly correlated with the GSR: the more global a firm
(GSR closer to one), the more negative the foreign exchange rate exposure. This relationship is more
pronounced if only stocks with significant levels of exchange rate exposure are considered.
Figure 8. Relationship between the GSR Coefficient (𝜽𝟏) and Exchange Rate Exposure, FTSE 350
ex-Financials
* GSR Coefficient 𝜃1 is significant at 0.05 level
Figure 8: 𝜃1 is obtained from a cross-sectional regression of estimated foreign exchange rate exposure on GSR based on data from Oct 2006 to Sep 2016. Foreign exchange rate exposure is estimated from a time series regression of stock returns on the equally weighted FTSE 350 ex Investment Trusts and the S&P GS Metal and Mining index returns and the three month change in the BIS EER and GBP / USD exchange rates. The significance of foreign exchange rate exposure is determined using Newey-West standard errors. The GSR coefficients are shown for three categories: Full sample, significant and non-significant exchange rate exposures. Source: FTSE Russell, data as of April 7, 2017. Past performance is no guarantee of future results. Please see the end for important legal disclosures.
We repeat this analysis for both the global and domestic groups of stocks. To control for size we
additionally split these groups in large (Market cap > $5B) and smaller capitalization stocks (Market cap <
$5B). To avoid a small sample bias, s minimum of 30 stocks is required to have a meaningful GSR
coefficient.
-2
-1.6
-1.2
-0.8
-0.4
0
FTSE350 ex Fin.* SignificantExchange Rate Exposure
Only*
Not SignificantExchange Rate Exposure
Only*
GS
R C
oeff
ecie
nt(
ϴ1)
R^2= 34% no. of stks= 112
R^2= 5% no. of stks= 91
R^2= 23% no. of stks= 227
FTSE Russell | The Global Sales Ratio, Global and Domestic Firms 14
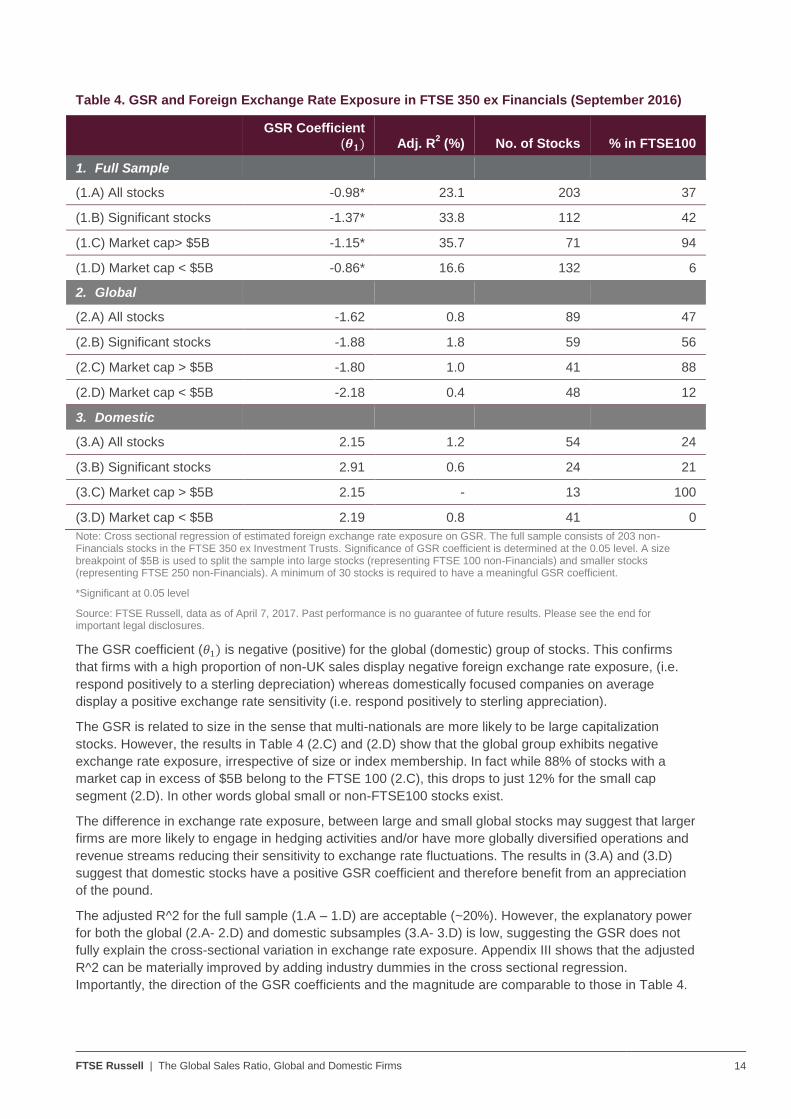
Table 4. GSR and Foreign Exchange Rate Exposure in FTSE 350 ex Financials (September 2016)
GSR Coefficient
(𝜽𝟏) Adj. R2 (%) No. of Stocks % in FTSE100
1. Full Sample
(1.A) All stocks -0.98* 23.1 203 37
(1.B) Significant stocks -1.37* 33.8 112 42
(1.C) Market cap> $5B -1.15* 35.7 71 94
(1.D) Market cap < $5B -0.86* 16.6 132 6
2. Global
(2.A) All stocks -1.62 0.8 89 47
(2.B) Significant stocks -1.88 1.8 59 56
(2.C) Market cap > $5B -1.80 1.0 41 88
(2.D) Market cap < $5B -2.18 0.4 48 12
3. Domestic
(3.A) All stocks 2.15 1.2 54 24
(3.B) Significant stocks 2.91 0.6 24 21
(3.C) Market cap > $5B 2.15 - 13 100
(3.D) Market cap < $5B 2.19 0.8 41 0
Note: Cross sectional regression of estimated foreign exchange rate exposure on GSR. The full sample consists of 203 non-Financials stocks in the FTSE 350 ex Investment Trusts. Significance of GSR coefficient is determined at the 0.05 level. A size breakpoint of $5B is used to split the sample into large stocks (representing FTSE 100 non-Financials) and smaller stocks (representing FTSE 250 non-Financials). A minimum of 30 stocks is required to have a meaningful GSR coefficient.
*Significant at 0.05 level
Source: FTSE Russell, data as of April 7, 2017. Past performance is no guarantee of future results. Please see the end for important legal disclosures.
The GSR coefficient (𝜃1) is negative (positive) for the global (domestic) group of stocks. This confirms
that firms with a high proportion of non-UK sales display negative foreign exchange rate exposure, (i.e.
respond positively to a sterling depreciation) whereas domestically focused companies on average
display a positive exchange rate sensitivity (i.e. respond positively to sterling appreciation).
The GSR is related to size in the sense that multi-nationals are more likely to be large capitalization
stocks. However, the results in Table 4 (2.C) and (2.D) show that the global group exhibits negative
exchange rate exposure, irrespective of size or index membership. In fact while 88% of stocks with a
market cap in excess of $5B belong to the FTSE 100 (2.C), this drops to just 12% for the small cap
segment (2.D). In other words global small or non-FTSE100 stocks exist.
The difference in exchange rate exposure, between large and small global stocks may suggest that larger
firms are more likely to engage in hedging activities and/or have more globally diversified operations and
revenue streams reducing their sensitivity to exchange rate fluctuations. The results in (3.A) and (3.D)
suggest that domestic stocks have a positive GSR coefficient and therefore benefit from an appreciation
of the pound.
The adjusted R^2 for the full sample (1.A – 1.D) are acceptable (~20%). However, the explanatory power
for both the global (2.A- 2.D) and domestic subsamples (3.A- 3.D) is low, suggesting the GSR does not
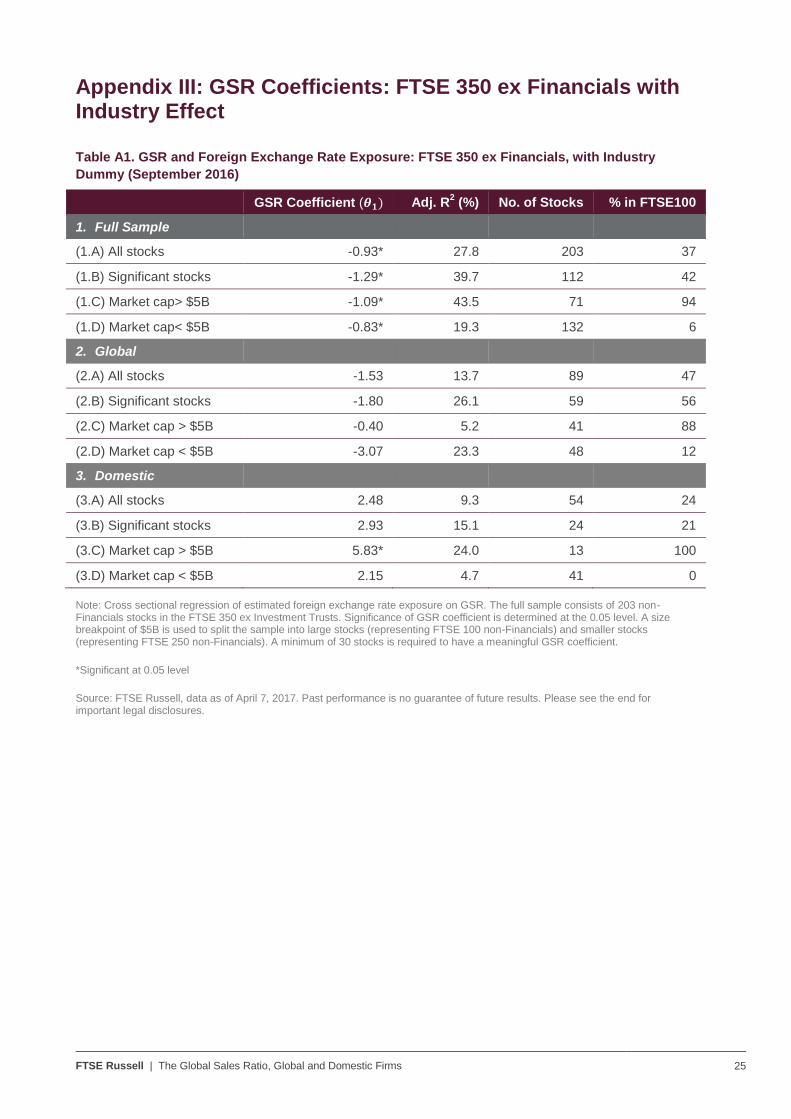
fully explain the cross-sectional variation in exchange rate exposure. Appendix III shows that the adjusted
R^2 can be materially improved by adding industry dummies in the cross sectional regression.
Importantly, the direction of the GSR coefficients and the magnitude are comparable to those in Table 4.
FTSE Russell | The Global Sales Ratio, Global and Domestic Firms 15
Our results in this section confirm a strong correlation between the GSR and exchange rate exposure.
Furthermore, the sign and magnitude of exchange rate exposure of global and domestic companies in
FTSE 100 are consistent with those shown by FTSE 250 constituents, suggesting the relationship
between the GSR and the exchange rate exposure is independent of size and index membership.
The GSR exhibit an observable characteristic. Companies that comply with accounting standards
ASC280 (US GAAP) and IFRS 8 are required to make entity-wide disclosures on geographical revenues
from external customers. Exchange rate exposure is estimated from a regression analysis of stock returns
on exchange rates and market indexes and hence is subject to estimation error and is sensitive to model
specification. This sensitivity to the choice of market index, currency and time horizon is explored in more
detail in Appendix I. Given the relative ease of obtaining a GSR measure versus the complication of
estimating exchange rate exposure and it's more comprehensive nature, the GSR seems a suitable
measure with which to identify global and domestic stocks.
An interesting case study is to examine the impact of Brexit on the relative performance of domestic and
global stocks. In the next section, we examine the sensitivity of the global and domestic groups to the
currency depreciation, post the Brexit referendum.
4.4 Case Study: Brexit
Brexit provides a good test of the efficacy using the GSR as a means of identifying UK global and
domestic stocks from within the FTSE 350 ex Investment Trusts universe. Following the referendum, it
was announced on June 24, 2016 that the UK would leave European Union. The pound fell significantly
against both the Euro (~7%) and the dollar (~9%) as at close of June 24.
We expect global stocks to benefit from the depreciation of the pound via FX translation effect and
increased demand for cheaper exports. Domestic stocks are expected to be less responsive in light of the
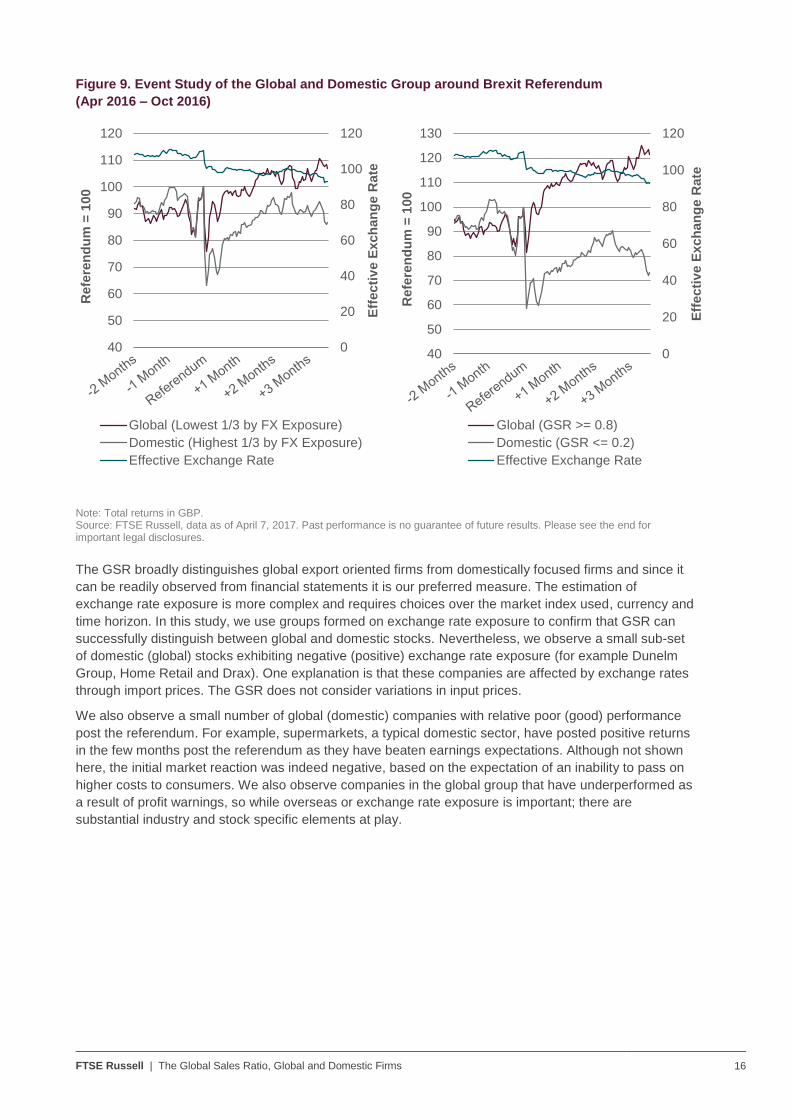
time taken for imported inflation to filter through the economy and be passed on to consumers. Figure 9
shows the equally weighted performance of global and domestic groups formed on two metrics; GSR (left
chart) and FX exposure (right chart). Both groups are formed in the end of September 2015, prior to the
referendum. We also show the value of effective exchange rate12
for reference. A lower value of the
effective exchange rate indicates a depreciation of the pound. The breakpoints of the GSR are the same
as in Section 3.2. For the FX exposure, we create tercile groups. To ensure a like-for-like comparison, we
exclude Financials as we do not estimate exchange rate exposure for Financials.
In the run-up to the referendum, the performance of the global and domestic groups is approximately in
line with one another. Immediately post-referendum, the performance spread between the global and
domestic groups based on the GSR is +20%. The performance differential between the global and
domestic groups based on the FX exposure is smaller in magnitude. A second bout of Sterling
depreciation three months after the referendum displays a similar performance differential between global
and domestic stocks.
12
The Bank of International Settlement nominal broad exchange rate.
FTSE Russell | The Global Sales Ratio, Global and Domestic Firms 16
Figure 9. Event Study of the Global and Domestic Group around Brexit Referendum
(Apr 2016 – Oct 2016)
Note: Total returns in GBP. Source: FTSE Russell, data as of April 7, 2017. Past performance is no guarantee of future results. Please see the end for important legal disclosures.
The GSR broadly distinguishes global export oriented firms from domestically focused firms and since it
can be readily observed from financial statements it is our preferred measure. The estimation of
exchange rate exposure is more complex and requires choices over the market index used, currency and
time horizon. In this study, we use groups formed on exchange rate exposure to confirm that GSR can
successfully distinguish between global and domestic stocks. Nevertheless, we observe a small sub-set
of domestic (global) stocks exhibiting negative (positive) exchange rate exposure (for example Dunelm
Group, Home Retail and Drax). One explanation is that these companies are affected by exchange rates
through import prices. The GSR does not consider variations in input prices.
We also observe a small number of global (domestic) companies with relative poor (good) performance
post the referendum. For example, supermarkets, a typical domestic sector, have posted positive returns
in the few months post the referendum as they have beaten earnings expectations. Although not shown
here, the initial market reaction was indeed negative, based on the expectation of an inability to pass on
higher costs to consumers. We also observe companies in the global group that have underperformed as
a result of profit warnings, so while overseas or exchange rate exposure is important; there are
substantial industry and stock specific elements at play.
0
20
40
60
80
100
120
40
50
60
70
80
90
100
110
120
Eff
ecti
ve E
xch
an
ge R
ate
Refe
ren
du
m =
100
Global (Lowest 1/3 by FX Exposure)
Domestic (Highest 1/3 by FX Exposure)
Effective Exchange Rate
0
20
40
60
80
100
120
40
50
60
70
80
90
100
110
120
130
Eff
ecti
ve E
xch
an
ge R
ate
Refe
ren
du
m =
100
Global (GSR >= 0.8)
Domestic (GSR <= 0.2)
Effective Exchange Rate
FTSE Russell | The Global Sales Ratio, Global and Domestic Firms 17
5. Conclusion As companies expand globally, a greater proportion of revenue arises from sources other than the
country of incorporation or primary listing. One alternative way to group companies is by
geographical sources of revenue. We show that groups of companies formed on the GSR exhibit
different macro-economic characteristics. In the UK, companies categorized as global (domestic)
using the GSR exhibit similar characteristics to the FTSE 100 index (the FTSE 250 ex Investment
Trusts). However, the UK experience is not replicated in the US, as size does not distinguish
domestic and global corporate entities.
We find that the US global stocks and the smaller Russell 1000 stocks benefit from improvements in
the business cycle and that US domestic stocks are perceived to be “safer” by market participants.
Sectoral make-up is important in the context of domestic and global status in Japan. We find that
Japanese global companies exhibit similar characteristics to the Japanese Automobile & Parts
sector. Indeed half of Japanese global companies are members of the Automobile & Parts sector.
The sensitivity of corporate earnings to exchange rate fluctuations may substantially affect firm
value. We illustrate that a homogeneous group of companies with similar exchange rate exposure
can be formed using the GSR, irrespective of size or index membership. We show that companies
categorized as global using the GSR, including smaller and FTSE 250 companies, exhibit negative
exchange rate exposure on average, benefiting from a depreciation of the local currency.
Conversely, domestic companies exhibit positive exchange rate exposure on average. Our results
indicate that the GSR provides a cleaner separation than the market capitalization used to form the
FTSE 100 and FTSE 250, typically used as global and domestic proxies.
Using Brexit as a case study, we use the GSR to identify global and domestic stocks in the FTSE
350 ex Investment. Trusts. During the run-up to the referendum, we observe no material
performance difference between global and domestics stocks. In the three month post referendum
period however, the global group formed on the GSR posted a +20% absolute return, whereas the
domestic group fell by 20%. The performance of groups formed on exchange rate exposure show a
similar though less pronounced performance pattern.
FTSE Russell | The Global Sales Ratio, Global and Domestic Firms 18
Appendix I: Foreign Exchange Exposure Model
a. Choice of Market Index
The market index itself will reflect a degree of exchange rate risk and hence the exchange rate exposure
estimates can be interpreted as “residual” FX exposure. Consequently, the magnitude of the exchange
rate exposure estimates depends on the choice of market index. As shown earlier, the FTSE 250 Index
has a domestic focus and is closer to an equally weighted index, with no individual companies dominating
the index in terms of weighting. Conversely, the FTSE 100 Index is dominated by large multi-nationals
and therefore embeds a large FX exposure, reducing the likelihood of companies showing significant
exchange rate exposure. Several studies13
have found that the use of equally weighted indexes result in
more significant exchange rate exposure estimates for multinationals than when capitalization weighted
indexes are used.
To illustrate the effect of the choice of market index on the exchange rate exposure estimates, we
estimate equation (1) and using equally weighted FTSE 250 ex Investment Trusts and the FTSE 100
index returns.
Although the local market index is expected to represent macroeconomic events impacting the economy
in general, specific events such as oil prices and the commodity cycle may also drive company value. We
therefore add the S&P GS Energy and Metal index as a secondary market factor to capture non-domestic
macroeconomic events. This is of particular importance for stocks classified as Oil & Gas and Basic
Resources.
The currency factor 𝐶𝑖𝑡 in this section is defined as the Bank of International Settlement nominal broad
exchange rate (BIS EER) index. In the next section explore combinations of this trade-weighted index and
additional currency pairs.
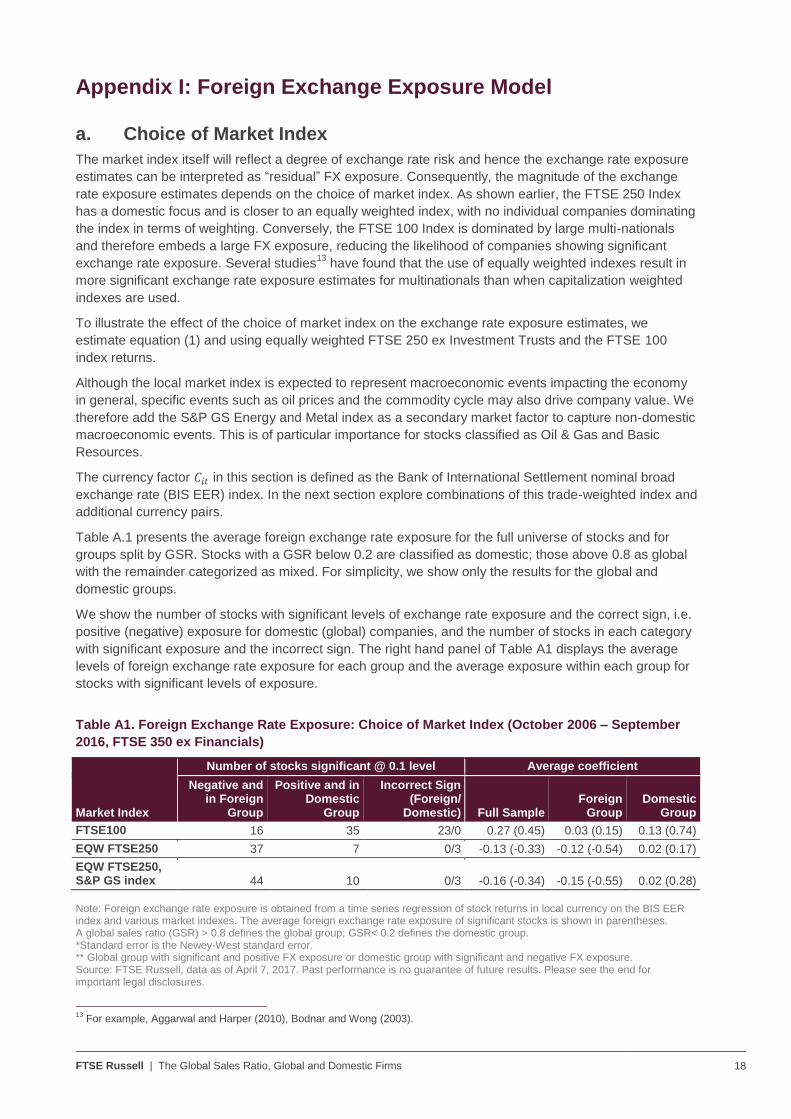
Table A.1 presents the average foreign exchange rate exposure for the full universe of stocks and for
groups split by GSR. Stocks with a GSR below 0.2 are classified as domestic; those above 0.8 as global
with the remainder categorized as mixed. For simplicity, we show only the results for the global and
domestic groups.
We show the number of stocks with significant levels of exchange rate exposure and the correct sign, i.e.
positive (negative) exposure for domestic (global) companies, and the number of stocks in each category
with significant exposure and the incorrect sign. The right hand panel of Table A1 displays the average
levels of foreign exchange rate exposure for each group and the average exposure within each group for
stocks with significant levels of exposure.
Table A1. Foreign Exchange Rate Exposure: Choice of Market Index (October 2006 – September
2016, FTSE 350 ex Financials)
Number of stocks significant @ 0.1 level Average coefficient
Market Index
Negative and in Foreign
Group
Positive and in Domestic
Group
Incorrect Sign (Foreign/
Domestic) Full Sample Foreign
Group Domestic
Group
FTSE100 16 35 23/0 0.27 (0.45) 0.03 (0.15) 0.13 (0.74)
EQW FTSE250 37 7 0/3 -0.13 (-0.33) -0.12 (-0.54) 0.02 (0.17)
EQW FTSE250, S&P GS index 44 10 0/3 -0.16 (-0.34) -0.15 (-0.55) 0.02 (0.28)
Note: Foreign exchange rate exposure is obtained from a time series regression of stock returns in local currency on the BIS EER index and various market indexes. The average foreign exchange rate exposure of significant stocks is shown in parentheses. A global sales ratio (GSR) > 0.8 defines the global group; GSR< 0.2 defines the domestic group. *Standard error is the Newey-West standard error. ** Global group with significant and positive FX exposure or domestic group with significant and negative FX exposure. Source: FTSE Russell, data as of April 7, 2017. Past performance is no guarantee of future results. Please see the end for important legal disclosures.
13
For example, Aggarwal and Harper (2010), Bodnar and Wong (2003).
FTSE Russell | The Global Sales Ratio, Global and Domestic Firms 19
Table A1 highlights that using the FTSE 100 as the market index results in significantly more positive
average exposure estimates (i.e. all stocks appear to more domestic) than when using an equally
weighted FTSE 250 index (0.27 versus -0.13).
If the FTSE 100 is used as the reference market index, only a small number of global stocks are allocated
the correct significant negative exposure (16) compared to an incorrect and significant positive exposure
(23). Using the equally weighted FTSE 250 a greater number of stocks have significant and negative
foreign exchange exposure and the average level of exposure of global stocks exhibits the correct sign.
The addition of the S&P GS Metal and Energy index slightly improves the results. In summary, the
equally weighted FTSE 250 Index and S&P GS Metal and Energy index appear to be appropriate market
indexes for estimation of foreign exchange exposure.
b. Choice of Currency
An effective currency index captures aggregate change in the home currency’s value and represents the
currency environment a firm would face on average. The downside is that this tends to net out the
multicurrency effects faced by a particular firm or industry. In this section we examine the explanatory
power of an effective currency index, individual currencies and a combination of the two.
We use the BIS EER index as a trade-weighted index. The BIS EER index covers 61 economies and is
broad to reflect the increasing importance of the emerging markets. The most recent weights are based
on trade flows in the 2011-13 periods. Europe is the biggest trade partner with the UK and hence carries
the largest weight in the index (44%). China, the US and Japan account for 13%, 11% and 4%
respectively14
. The BIS EER index is calculated as geometric weighted averages of bilateral exchange
rates. An increase in the BIS EER index indicates the appreciation of sterling against a broad basket of
currencies.
Table A2: Currency Weights in the BIS EER index
Country % weight
Euro area 43.72
China 12.69
United States 10.67
Japan 3.46
Other 29.47
Source: http://www.bis.org/statistics/eer.htm, as of October 2016.
Since the BIS EER index represents a broad basket of currencies, it may not be sufficient to pick up the
importance of for example the USD in certain industries. For example, Pharmaceuticals and Biotech face
competitive pressure from the US in particular and may benefit from a weakening of sterling against the
US dollar. Commodities are typically priced in US dollars. A depreciation of sterling therefore results in an
immediate increase in the sterling value of company revenues for Basic Resource and Oil & Gas stocks.
Various authors15
have demonstrated the advantage of using individual currencies, for completeness, we
also tested a combination of individual currencies.
14
http://www.bis.org/statistics/eer.htm 15
Martin and Mauer (2003), Aggarwal and Harper (2010)
FTSE Russell | The Global Sales Ratio, Global and Domestic Firms 20
Table A3: Foreign exchange exposure: Choice of currency (October 2006 – September 2016, FTSE
350 ex Financials)
Number of stocks significant @ 0.1 level Average coefficient
Market Index
Negative and in Foreign
Group
Positive and in Domestic
Group
Incorrect Sign (Foreign/
Domestic) Full Sample Foreign
Group Domestic
Group
BIS EER 44 10 0/3 -0.16 (-0.34) -0.15 (-0.55) 0.02 (0.28)
BIS EER, USD 48 10 1/5 -0.16 (-0.30) -0.37 (-0.50) 0.10 (0.15)
BIS EER, YEN 43 14 0/5 -0.16 (-0.28) -0.38 (-0.56) 0.11 (0.23)
EUR, USD, YEN 50 17 4/8 -0.13 (-0.17) -0.28 (-0.35) 0.07 (0.13)
Note: Foreign exchange exposure estimates are obtained from time series regressions of stock returns in local currency on the returns of the equally weighted FTSE 250 ex Investment Trusts, the S&P GS Metal and Mining index and various currency choices. A global sales ratio (GSR) > 0.8 defines the global group; GSR< 0.2 defines the domestic group. The average foreign exchange exposure of stocks with significant levels of exposure is shown in parentheses. * Standard error is Newey-West standard error. ** Global group with significant and positive exposure or domestic group with significant and negative exposure. Source: FTSE Russell, data as of April 7, 2017. Past performance is no guarantee of future results. Please see the end for important legal disclosures.
The foreign exchange exposure from the BIS EER index, a combination of the BIS EER index with USD,
and a combination of the three individual currencies exhibit correct sign: negative for the global group and
positive for the domestic group. All variations exhibit similar explanatory power with the individual
currencies approach being slightly superior. The number of stocks with an incorrect sign using individual
currencies is also slightly higher. The average currency exposure estimates are similar across all
variations, suggesting that the BIS EER index adequately captures general currency effects.
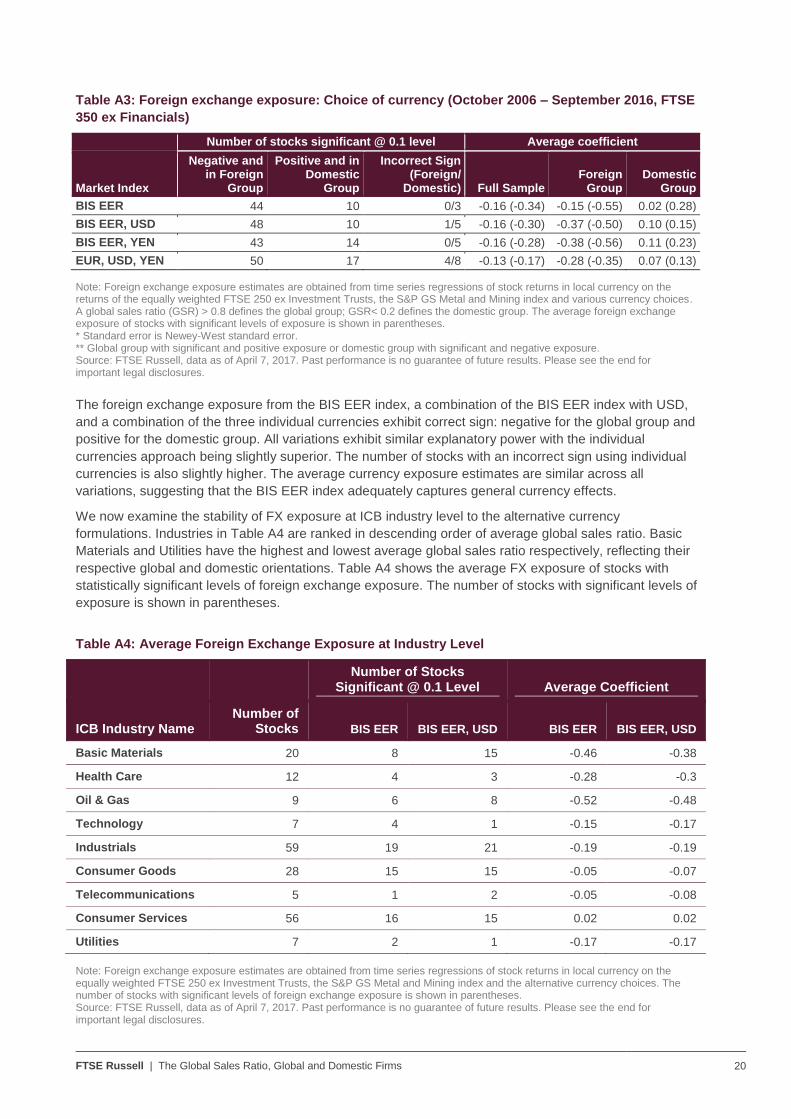
We now examine the stability of FX exposure at ICB industry level to the alternative currency
formulations. Industries in Table A4 are ranked in descending order of average global sales ratio. Basic
Materials and Utilities have the highest and lowest average global sales ratio respectively, reflecting their
respective global and domestic orientations. Table A4 shows the average FX exposure of stocks with
statistically significant levels of foreign exchange exposure. The number of stocks with significant levels of
exposure is shown in parentheses.
Table A4: Average Foreign Exchange Exposure at Industry Level
Number of Stocks Significant @ 0.1 Level Average Coefficient
ICB Industry Name
Number of Stocks BIS EER BIS EER, USD BIS EER BIS EER, USD
Basic Materials 20 8 15 -0.46 -0.38
Health Care 12 4 3 -0.28 -0.3
Oil & Gas 9 6 8 -0.52 -0.48
Technology 7 4 1 -0.15 -0.17
Industrials 59 19 21 -0.19 -0.19
Consumer Goods 28 15 15 -0.05 -0.07
Telecommunications 5 1 2 -0.05 -0.08
Consumer Services 56 16 15 0.02 0.02
Utilities 7 2 1 -0.17 -0.17
Note: Foreign exchange exposure estimates are obtained from time series regressions of stock returns in local currency on the equally weighted FTSE 250 ex Investment Trusts, the S&P GS Metal and Mining index and the alternative currency choices. The number of stocks with significant levels of foreign exchange exposure is shown in parentheses. Source: FTSE Russell, data as of April 7, 2017. Past performance is no guarantee of future results. Please see the end for important legal disclosures.
FTSE Russell | The Global Sales Ratio, Global and Domestic Firms 21
Firstly, industries generally perceived as global exhibit the largest estimated foreign exchange exposure
in particular Basic Materials and Oil & Gas.
We also examine the effect of alternative currency combinations on estimated foreign exchange exposure
and the number of stocks displaying significant levels of exposure across industries. It is apparent that
using the BIS EER index in isolation can be improved upon; focusing on the larger industries and Oil &
Gas, and considering the number of stocks with significant levels of estimated exposure, the BIS EER
index + USD seems the optimal combination. It provides the best trade-off between the size of the
exposure estimates and the number of stocks that are significant. The model also captures the USD
dependence of the Oil & Gas sector.
c. Choice of Currency Horizon
In previous sections, we examined the appropriate choice of market index and currencies and concluded
that the FTSE 250 equally weighted index, the S&P GS Energy and Metal index and the BIS EER index
and USD are appropriate choices.
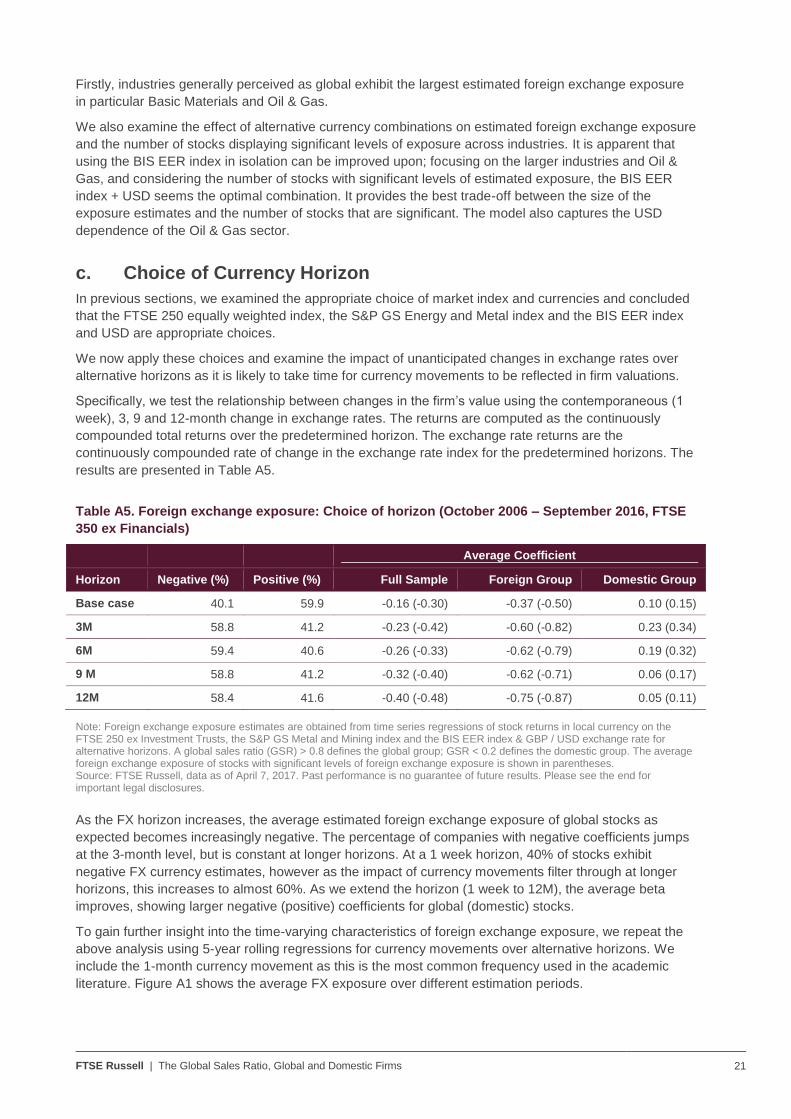
We now apply these choices and examine the impact of unanticipated changes in exchange rates over
alternative horizons as it is likely to take time for currency movements to be reflected in firm valuations.
Specifically, we test the relationship between changes in the firm’s value using the contemporaneous (1
week), 3, 9 and 12-month change in exchange rates. The returns are computed as the continuously
compounded total returns over the predetermined horizon. The exchange rate returns are the
continuously compounded rate of change in the exchange rate index for the predetermined horizons. The
results are presented in Table A5.
Table A5. Foreign exchange exposure: Choice of horizon (October 2006 – September 2016, FTSE
350 ex Financials)
Average Coefficient
Horizon Negative (%) Positive (%) Full Sample Foreign Group Domestic Group
Base case 40.1 59.9 -0.16 (-0.30) -0.37 (-0.50) 0.10 (0.15)
3M 58.8 41.2 -0.23 (-0.42) -0.60 (-0.82) 0.23 (0.34)
6M 59.4 40.6 -0.26 (-0.33) -0.62 (-0.79) 0.19 (0.32)
9 M 58.8 41.2 -0.32 (-0.40) -0.62 (-0.71) 0.06 (0.17)
12M 58.4 41.6 -0.40 (-0.48) -0.75 (-0.87) 0.05 (0.11)
Note: Foreign exchange exposure estimates are obtained from time series regressions of stock returns in local currency on the FTSE 250 ex Investment Trusts, the S&P GS Metal and Mining index and the BIS EER index & GBP / USD exchange rate for alternative horizons. A global sales ratio (GSR) > 0.8 defines the global group; GSR < 0.2 defines the domestic group. The average foreign exchange exposure of stocks with significant levels of foreign exchange exposure is shown in parentheses. Source: FTSE Russell, data as of April 7, 2017. Past performance is no guarantee of future results. Please see the end for important legal disclosures.
As the FX horizon increases, the average estimated foreign exchange exposure of global stocks as
expected becomes increasingly negative. The percentage of companies with negative coefficients jumps
at the 3-month level, but is constant at longer horizons. At a 1 week horizon, 40% of stocks exhibit
negative FX currency estimates, however as the impact of currency movements filter through at longer
horizons, this increases to almost 60%. As we extend the horizon (1 week to 12M), the average beta
improves, showing larger negative (positive) coefficients for global (domestic) stocks.
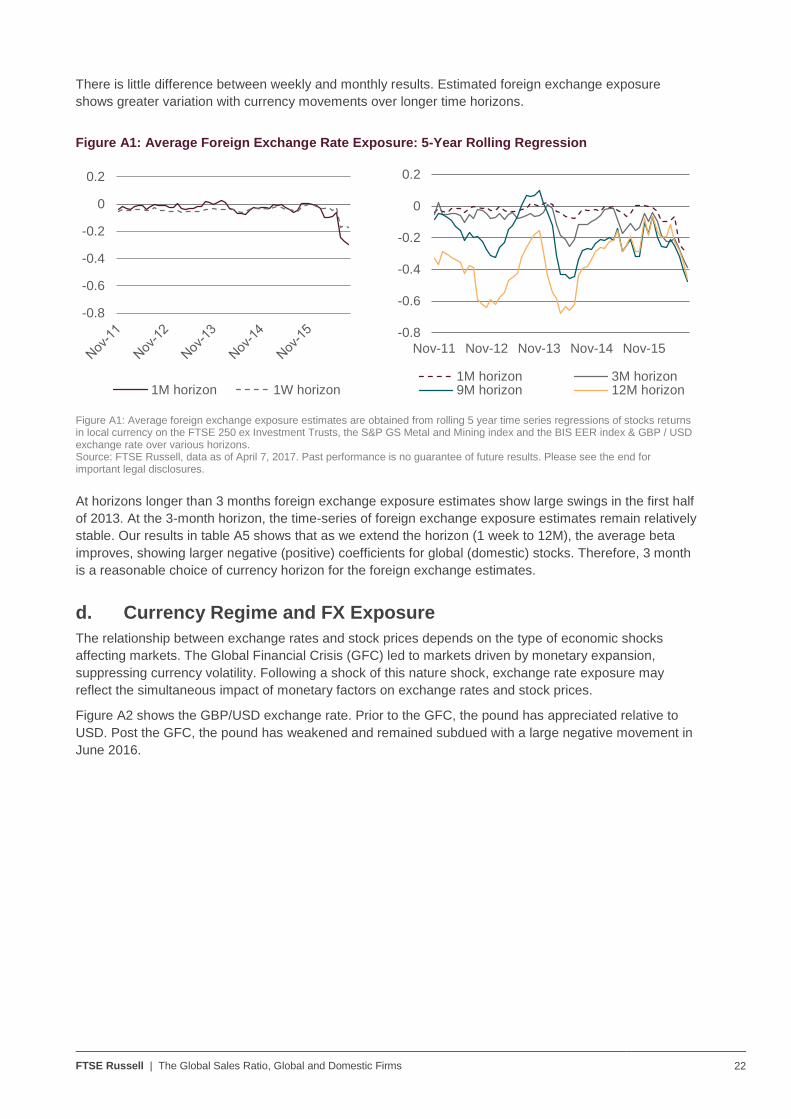
To gain further insight into the time-varying characteristics of foreign exchange exposure, we repeat the
above analysis using 5-year rolling regressions for currency movements over alternative horizons. We
include the 1-month currency movement as this is the most common frequency used in the academic
literature. Figure A1 shows the average FX exposure over different estimation periods.
FTSE Russell | The Global Sales Ratio, Global and Domestic Firms 22
There is little difference between weekly and monthly results. Estimated foreign exchange exposure
shows greater variation with currency movements over longer time horizons.
Figure A1: Average Foreign Exchange Rate Exposure: 5-Year Rolling Regression
Figure A1: Average foreign exchange exposure estimates are obtained from rolling 5 year time series regressions of stocks returns in local currency on the FTSE 250 ex Investment Trusts, the S&P GS Metal and Mining index and the BIS EER index & GBP / USD exchange rate over various horizons. Source: FTSE Russell, data as of April 7, 2017. Past performance is no guarantee of future results. Please see the end for important legal disclosures.
At horizons longer than 3 months foreign exchange exposure estimates show large swings in the first half
of 2013. At the 3-month horizon, the time-series of foreign exchange exposure estimates remain relatively
stable. Our results in table A5 shows that as we extend the horizon (1 week to 12M), the average beta
improves, showing larger negative (positive) coefficients for global (domestic) stocks. Therefore, 3 month
is a reasonable choice of currency horizon for the foreign exchange estimates.
d. Currency Regime and FX Exposure
The relationship between exchange rates and stock prices depends on the type of economic shocks
affecting markets. The Global Financial Crisis (GFC) led to markets driven by monetary expansion,
suppressing currency volatility. Following a shock of this nature shock, exchange rate exposure may
reflect the simultaneous impact of monetary factors on exchange rates and stock prices.
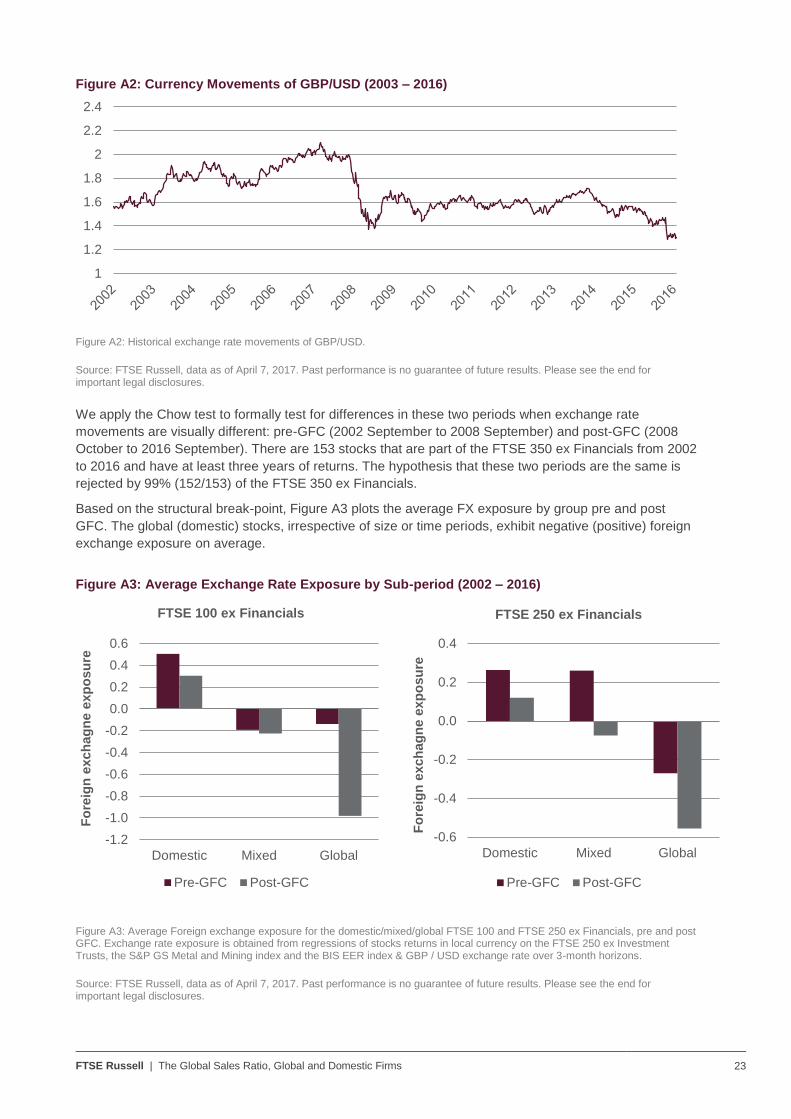
Figure A2 shows the GBP/USD exchange rate. Prior to the GFC, the pound has appreciated relative to
USD. Post the GFC, the pound has weakened and remained subdued with a large negative movement in
June 2016.
-0.8
-0.6
-0.4
-0.2
0
0.2
1M horizon 1W horizon
-0.8
-0.6
-0.4
-0.2
0
0.2
Nov-11 Nov-12 Nov-13 Nov-14 Nov-15
1M horizon 3M horizon9M horizon 12M horizon
FTSE Russell | The Global Sales Ratio, Global and Domestic Firms 23
Figure A2: Currency Movements of GBP/USD (2003 – 2016)
Figure A2: Historical exchange rate movements of GBP/USD.
Source: FTSE Russell, data as of April 7, 2017. Past performance is no guarantee of future results. Please see the end for important legal disclosures.
We apply the Chow test to formally test for differences in these two periods when exchange rate
movements are visually different: pre-GFC (2002 September to 2008 September) and post-GFC (2008
October to 2016 September). There are 153 stocks that are part of the FTSE 350 ex Financials from 2002
to 2016 and have at least three years of returns. The hypothesis that these two periods are the same is
rejected by 99% (152/153) of the FTSE 350 ex Financials.
Based on the structural break-point, Figure A3 plots the average FX exposure by group pre and post
GFC. The global (domestic) stocks, irrespective of size or time periods, exhibit negative (positive) foreign
exchange exposure on average.
Figure A3: Average Exchange Rate Exposure by Sub-period (2002 – 2016)
Figure A3: Average Foreign exchange exposure for the domestic/mixed/global FTSE 100 and FTSE 250 ex Financials, pre and post GFC. Exchange rate exposure is obtained from regressions of stocks returns in local currency on the FTSE 250 ex Investment Trusts, the S&P GS Metal and Mining index and the BIS EER index & GBP / USD exchange rate over 3-month horizons.
Source: FTSE Russell, data as of April 7, 2017. Past performance is no guarantee of future results. Please see the end for important legal disclosures.
1
1.2
1.4
1.6
1.8
2
2.2
2.4
-1.2
-1.0
-0.8
-0.6
-0.4
-0.2
0.0
0.2
0.4
0.6
Domestic Mixed Global
Fo
reig
n e
xch
ag
ne e
xp
osu
re
FTSE 100 ex Financials
Pre-GFC Post-GFC
-0.6
-0.4
-0.2
0.0
0.2
0.4
Domestic Mixed Global
Fo
reig
n e
xch
ag
ne e
xp
osu
re
FTSE 250 ex Financials
Pre-GFC Post-GFC
FTSE Russell | The Global Sales Ratio, Global and Domestic Firms 24
Appendix II: Global Sales Ratio Measures Geographical Revenue Sources Companies are required to disclose geographical revenues under both US GAAP and IFRS.
Accounting standards ASC280 (US GAAP) and IFRS 8 share similar requirements on segment reporting.
Broadly speaking, companies are required to disclose each reportable operating segment revenue until
75% of the consolidated revenue is identified. IFRS requires entity-wide disclosures on geographical
revenues from external customers. Information by geographical area is required for the entity’s country of
domicile and for foreign country, if material.
The combination of the complexity arising from nature of the business and the simplification of accounting
standards leads to difficulty in data capture. The granularity of geographical segment is by no means
homogenous across businesses. IFRS 8.33 says that an entity may allocate revenue from external
customers to geographical areas it deems most appropriate. For certain companies, geographical area is
equivalent to an operating segment. Indeed, we found that the revenue breakdown reported from larger
companies is likely to be by region whilst for smaller companies to be by country. Geographic revenue
disclosure is required even if the company has only one reportable operating segment. Given the 75%
threshold and the likelihood that there is only one operating segment, we have found that many
companies report “Domestic” and “Rest of the World” Sales only, and consequently a more granular direct
mapping to the country or regional level does not exist.
Furthermore, whilst most companies report sales, we found many may instead provide pre-tax income or
operating income only. We also found that the definition of sales differs among Financials. Additionally,
vendors may report several thousand unique geographical segment descriptions in textual form which in
reality may not be unique.
Due to the complexity of the data and since most companies report domestic revenues and total sales,
we calculate domestic and overseas sales ratios. Specifically, the domestic sales ratio is defined as
domestic revenue over total sales. The global (or overseas) sales ratio is defined as foreign sales over
total sales. By definition, global sales and domestic sales sum to one.
FTSE Russell | The Global Sales Ratio, Global and Domestic Firms 25
Appendix III: GSR Coefficients: FTSE 350 ex Financials with Industry Effect
Table A1. GSR and Foreign Exchange Rate Exposure: FTSE 350 ex Financials, with Industry
Dummy (September 2016)
GSR Coefficient (𝜽𝟏) Adj. R2 (%) No. of Stocks % in FTSE100
1. Full Sample
(1.A) All stocks -0.93* 27.8 203 37
(1.B) Significant stocks -1.29* 39.7 112 42
(1.C) Market cap> $5B -1.09* 43.5 71 94
(1.D) Market cap< $5B -0.83* 19.3 132 6
2. Global
(2.A) All stocks -1.53 13.7 89 47
(2.B) Significant stocks -1.80 26.1 59 56
(2.C) Market cap > $5B -0.40 5.2 41 88
(2.D) Market cap < $5B -3.07 23.3 48 12
3. Domestic
(3.A) All stocks 2.48 9.3 54 24
(3.B) Significant stocks 2.93 15.1 24 21
(3.C) Market cap > $5B 5.83* 24.0 13 100
(3.D) Market cap < $5B 2.15 4.7 41 0
Note: Cross sectional regression of estimated foreign exchange rate exposure on GSR. The full sample consists of 203 non-Financials stocks in the FTSE 350 ex Investment Trusts. Significance of GSR coefficient is determined at the 0.05 level. A size breakpoint of $5B is used to split the sample into large stocks (representing FTSE 100 non-Financials) and smaller stocks (representing FTSE 250 non-Financials). A minimum of 30 stocks is required to have a meaningful GSR coefficient.
*Significant at 0.05 level
Source: FTSE Russell, data as of April 7, 2017. Past performance is no guarantee of future results. Please see the end for important legal disclosures.
FTSE Russell | The Global Sales Ratio, Global and Domestic Firms 26
References Aggarwal, R. and J.T. Harper, 2010, “Foreign exchange exposure of ‘domestic’ corporations”, Journal of
International Money and Finance, Vol. 29, No. 8
Bodnar, G.M. and M.H.F. Wong, 2003, “Estimating exchange rate exposures: Issues in model structure,”
Financial Management, Vol.32, Nol.1
Jorion, P., 1991, “The pricing of exchange rate risk in the stock market”, Journal of Financial and
Quantitative Analysis, Vol. 26, No. 3
Martin, A.D. and L.J. Mauer, 2003, “Exchange rate exposure of US banks: A cash flow-based
methodology,” Journal of Banking and Finance, Vol.27, No.5
FTSE Russell 27
For more information about our indexes, please visit ftserussell.com.
© 2017 London Stock Exchange Group plc and its applicable group undertakings (the “LSE Group”). The LSE Group includes (1)
FTSE International Limited (“FTSE”), (2) Frank Russell Company (“Russell”), (3) FTSE TMX Global Debt Capital Markets Inc. and
FTSE TMX Global Debt Capital Markets Limited (together, “FTSE TMX”) and (4) MTSNext Limited (“MTSNext”). All rights reserved.
FTSE Russell® is a trading name of FTSE, Russell, FTSE TMX and MTS Next Limited. “FTSE®”, “Russell®”, “FTSE Russell®”
“MTS®”, “FTSE TMX®”, “FTSE4Good®” and “ICB®” and all other trademarks and service marks used herein (whether registered or
unregistered) are trademarks and/or service marks owned or licensed by the applicable member of the LSE Group or their
respective licensors and are owned, or used under license, by FTSE, Russell, MTSNext, or FTSE TMX.
All information is provided for information purposes only. Every effort is made to ensure that all information given in this publication
is accurate, but no responsibility or liability can be accepted by any member of the LSE Group nor their respective directors,
officers, employees, partners or licensors for any errors or for any loss from use of this publication or any of the information or data
contained herein.
No member of the LSE Group nor their respective directors, officers, employees, partners or licensors make any claim, prediction,
warranty or representation whatsoever, expressly or impliedly, either as to the results to be obtained from the use of the FTSE
Russell Indexes or the fitness or suitability of the Indexes for any particular purpose to which they might be put.
No member of the LSE Group nor their respective directors, officers, employees, partners or licensors provide investment advice
and nothing in this document should be taken as constituting financial or investment advice. No member of the LSE Group nor their
respective directors, officers, employees, partners or licensors make any representation regarding the advisability of investing in
any asset. A decision to invest in any such asset should not be made in reliance on any information herein. Indexes cannot be
invested in directly. Inclusion of an asset in an index is not a recommendation to buy, sell or hold that asset. The general
information contained in this publication should not be acted upon without obtaining specific legal, tax, and investment advice from a
licensed professional.
No part of this information may be reproduced, stored in a retrieval system or transmitted in any form or by any means, electronic,
mechanical, photocopying, recording or otherwise, without prior written permission of the applicable member of the LSE Group. Use
and distribution of the LSE Group index data and the use of their data to create financial products require a license from FTSE,
Russell, FTSE TMX, MTSNext and/or their respective licensors.
Past performance is no guarantee of future results. Charts and graphs are provided for illustrative purposes only. Index returns
shown may not represent the results of the actual trading of investable assets. Certain returns shown may reflect back-tested
performance. All performance presented prior to the index inception date is back-tested performance. Back-tested performance is
not actual performance, but is hypothetical. The back-test calculations are based on the same methodology that was in effect when
the index was officially launched. However, back- tested data may reflect the application of the index methodology with the benefit
of hindsight, and the historic calculations of an index may change from month to month based on revisions to the underlying
economic data used in the calculation of the index.
This publication may contain forward-looking statements. These are based upon a number of assumptions concerning future
conditions that ultimately may prove to be inaccurate. Such forward-looking statements are subject to risks and uncertainties and
may be affected by various factors that may cause actual results to differ materially from those in the forward-looking statements.
Any forward-looking statements speak only as of the date they are made and no member of the LSE Group nor their licensors
assume any duty to and do not undertake to update forward-looking statements.
FTSE Russell
About FTSE Russell
FTSE Russell is a leading global index provider creating and managing a
wide range of indexes, data and analytic solutions to meet client needs
across asset classes, style and strategies. Covering 98% of the investable
market, FTSE Russell indexes offer a true picture of global markets,
combined with the specialist knowledge gained from developing local
benchmarks around the world.
FTSE Russell index expertise and products are used extensively by
institutional and retail investors globally. More than $10 trillion is currently
benchmarked to FTSE Russell indexes. For over 30 years, leading asset
owners, asset managers, ETF providers and investment banks have chosen
FTSE Russell indexes to benchmark their investment performance and
create investment funds, ETFs, structured products and index-based
derivatives. FTSE Russell indexes also provide clients with tools for asset
allocation, investment strategy analysis and risk management.
A core set of universal principles guides FTSE Russell index design and
management: a transparent rules-based methodology is informed by
independent committees of leading market participants. FTSE Russell is
focused on index innovation and customer partnership applying the highest
industry standards and embracing the IOSCO Principles. FTSE Russell is
wholly owned by London Stock Exchange Group.
For more information, visit ftserussell.com.
To learn more, visit ftserussell.com; email [email protected]; or call your regional
Client Service Team office:
EMEA
+44 (0) 20 7866 1810
North America
+1 877 503 6437
Asia-Pacific
Hong Kong +852 2164 3333
Tokyo +81 3 3581 2764
Sydney +61 (0) 2 8823 3521


![Born Global Firms Working Paper CBS DK[1]](https://img.pdfslide.net/doc/110x75/577d2a191a28ab4e1ea8a802/born-global-firms-working-paper-cbs-dk1.jpg)