Embed Size (px)
Citation preview
RESEARCH ARTICLE
Obstructions in Vascular Networks: RelationBetween Network Morphology and BloodSupplyAimee M. Torres Rojas1, Alejandro Meza Romero1, Ignacio Pagonabarraga2, Rui D.M. Travasso3, Eugenia Corvera Poiré1,2*
1Departamento de Física y Química Teórica, Facultad de Química, Universidad Nacional Autónoma deMéxico, México D.F., Mexico, 2 Departament de Física Fonamental, Universitat de Barcelona, Barcelona,Spain, 3 Centro de Física da Universidade de Coimbra, Departamento de Física, Faculdade de Ciências eTecnologia, Universidade de Coimbra, Coimbra, Portugal
AbstractWe relate vascular network structure to hemodynamics after vessel obstructions. We con-
sider tree-like networks with a viscoelastic fluid with the rheological characteristics of blood.
We analyze the network hemodynamic response, which is a function of the frequencies in-
volved in the driving, and a measurement of the resistance to flow. This response function
allows the study of the hemodynamics of the system, without the knowledge of a particular
pressure gradient. We find analytical expressions for the network response, which explicitly
show the roles played by the network structure, the degree of obstruction, and the geometri-
cal place in which obstructions occur. Notably, we find that the sequence of resistances of
the network without occlusions strongly determines the tendencies that the response func-
tion has with the anatomical place where obstructions are located. We identify anatomical
sites in a network that are critical for its overall capacity to supply blood to a tissue after ob-
structions. We demonstrate that relatively small obstructions in such critical sites are able to
cause a much larger decrease on flow than larger obstructions placed in non-critical sites.
Our results indicate that, to a large extent, the response of the network is determined locally.
That is, it depends on the structure that the vasculature has around the place where occlu-
sions are found. This result is manifest in a network that follows Murray’s law, which is in
reasonable agreement with several mammalian vasculatures. For this one, occlusions in
early generation vessels have a radically different effect than occlusions in late generation
vessels occluding the same percentage of area available to flow. This locality implies that
whenever there is a tissue irrigated by a tree-like in vivo vasculature, our model is able to in-
terpret how important obstructions are for the irrigation of such tissue.
PLOS ONE | DOI:10.1371/journal.pone.0128111 June 18, 2015 1 / 17
a11111
OPEN ACCESS
Citation: Torres Rojas AM, Meza Romero A,Pagonabarraga I, Travasso RDM, Corvera Poiré E(2015) Obstructions in Vascular Networks: RelationBetween Network Morphology and Blood Supply.PLoS ONE 10(6): e0128111. doi:10.1371/journal.pone.0128111
Academic Editor: Alan Stitt, Queen’s UniversityBelfast, UNITED KINGDOM
Received: October 2, 2014
Accepted: April 22, 2015
Published: June 18, 2015
Copyright: © 2015 Torres Rojas et al. This is anopen access article distributed under the terms of theCreative Commons Attribution License, which permitsunrestricted use, distribution, and reproduction in anymedium, provided the original author and source arecredited.
Data Availability Statement: All relevant data arewithin the paper.
Funding: AMTR acknowledges financial supportfrom Consejo Nacional de Ciencia y Tecnología(CONACYT) through fellowship 245675 (http://www.conacyt.mx/). IP acknowledges financial support fromMinisterio de Economía y Competitividad (MINECO)under Project No. FIS2011-22603 (http://www.mineco.gob.es/portal/site/mineco/). IP alsoacknowledges financial support from Departamentd’Universitats Recerca i Societat de la Informació(DURSI) under Project No. 2009SGR-634 (http://web.
IntroductionOcclusion of tubes has always represented a problem. From engines and filters to arteries andbronchia, we can find countless systems where a reduction of the fluid flow in a particular sitedue to the presence of an obstacle, results in the partial or total failure of a process. Occlusionof bio-tubes in the human body represent an important issue in many diseases, and the circula-tory vascular network is particularly vulnerable to obstructions. For instance, after an occlusionin the arteries, blood flow decreases, and, in critical cases, is effectively suppressed downstream.Such decrease of flow may have serious consequences at different levels, affecting oxygen andnutrient delivery to a tissue, or implying an increase in the stress over the heart muscle [1].One dramatic example of the pathological effect of vascular obstructions is a retinal artery oc-clusion. Such an occlusion by a blood clot withdraws the nutrient and oxygen supply from theretinal cells and may render an individual blind from an eye within a few hours [2, 3]. In thisscenario is of the utmost importance to identify specific sites in a vasculature where a partialobstruction can dramatically affect blood supply.
Various simulations of flow around partial obstructions in vessels exist in the literature[4–12]. Such analyses aim at describing in detail the flow patterns around occlusions, such asthe velocity at different points inside a vessel, the existence of vortices, or the values of wallshear stress at different locations [5–7, 9–12]. Depending on the interest of each particularstudy, they may account for 3-dimensionality, elasticity or viscoelasticity of the vessels, inclu-sion of non-linear convective terms, and the effects on flow of bifurcations, to name a few.
The enormous amount of work involved in such computations is necessary when one wantsto describe specific zones of a vasculature, and to answer detailed questions regarding flow pro-files around obstacles, stenosis, bypasses, bifurcations, or flow in the aortic arch. These complexcomputations are able to predict how the waveforms of pressure and flow change in certainvessels due to obstructions, stenosis or vessel suppression at particular sites [4, 8, 13]. Sophisti-cated models are also very interesting from a theoretical and computational point of view.However, they involve too many variables to allow for the derivation of analytical expressionswhen one is interested in knowing the effect that obstructions have on the overall flow through-out an entire network. Analytical expressions might be very powerful and are potentially usefulclinically, where a reduced number of parameters is often appreciated.
Knowledge about the structure of vascular networks, is key to predict the flow after alter-ations in the vasculature, e.g. after the growth or introduction of new vessels [14, 15] or afterthe partial occlusion of vessels in the system [8, 11, 12, 16]. The correspondence between localstructural network information and global flow through a network after vascular alteration,was put forward in the work of Flores et al [14]; the simplicity of the model allowed for analyti-cal expressions that in turn lead to conclusions not attainable otherwise. For instance, it wasdemonstrated that the increase of flow in the network after the growth of new vessels in theform of anastomosis, is determined by the morphology of the vasculature in a small neighbor-hood around the place where the new vessels are included. Other processes that regulate vesselwidth, such as the myogenic effect, were shown to have a very small qualitative effect in howthe increase in response depends on the localization of the anastomoses.
The purpose of the present study is to relate the basic, generic characteristics of an arterialvasculature with the flow that goes through it after anatomical variations caused by obstruc-tions or vessel suppression occur. We deliberately keep a reductionist approach in order to ob-tain analytical expressions for the system response in which the roles played by the networkstructure, the degree of obstruction, and the geometrical place where obstructions occur, canbe clearly identified.
Obstructions in Vascular Networks: Critical Sites for Blood Supply
PLOS ONE | DOI:10.1371/journal.pone.0128111 June 18, 2015 2 / 17
gencat.cat/ca/inici/index.html). RDMTacknowledgesfinancial support from Fondo Europeo de DesarrolloRegional (FEDER) through COMPETE program andby FCT through project FCOMP-01-0124-FEDER-015708 (http://ec.europa.eu/regional_policy/thefunds/regional/index_es.cfm). ECP declares that theresearch leading to these results has receivedfunding from the European Union SeventhFramework Programme (FP7-PEOPLE-2011-IIF)under grant agreement no. 301214 (http://ec.europa.eu/research/fp7/index_en.cfm). ECP alsoacknowledges financial support from ConsejoNacional de Ciencia y Tecnología (CONACYT)through project 219584 (http://www.conacyt.mx/). Thefunders had no role in study design, data collectionand analysis, decision to publish, or preparation ofthe manuscript.
Competing Interests: The authors have declaredthat no competing interests exist.
We study flow in three types of networks: one constituted by identical vessels, a second onein which radii are given by Murray’s law, and a third case in which large changes in resistanceexist within the network. We show how the underlying network can lead to radically differentbehaviors of the hemodynamic response and identify structural features present in tree-likevasculatures that are critical for the overall capacity of the network to supply blood after ob-structions. We demonstrate that our results are local in the sense that they depend on the net-work structure around the place where obstructions occur. This implies that whenever there isa tree-like network in an in-vivo vasculature, our model is able to interpret the effect that anobstruction has on flow.
BackgroundRecently, a model has been introduced in order to study viscoelastic flow in a network of tubes[17]. This model consists of a tree-like network in which rigid vessels bifurcate always intoidentical vessels giving rise to identical branches of the network. At each bifurcation step, thepossibility of changes in the cross sectional area and the length of the vessels is allowed. Eachlevel (or generation) of the network is constituted by vessels with the same length and cross sec-tion. Segments belonging to the same level are labeled with the same index. Outer levels of thenetwork are the ones that are closer to the main branch, inner levels are the ones that are the re-sult of several successive bifurcations.
The model considers a linear viscoelastic fluid with the rheological characteristics of blood[18] in a range of shear rates where there is no shear thinning, and analyzes the network hemo-dynamic response to a time-dependent periodic pressure gradient. A Maxwell fluid [19] is usedfor this study, but the formalism can be easily generalized to consider any linear viscoelasticfluid [20]. By considering mass conservation, and assuming that the total pressure drop is thesum of individual pressure drops, the dynamic response of the network, χ(ω), is written interms of the dynamic permeability of individual vessels Ki(ω) as
1
w¼ 1
L
XNi¼1
li2i�1AiKi
ð1Þ
The sum is over the network levels, Ai and li are respectively the cross sectional area and thelength of the vessels at the i-th level, L and N are the total length of the network and the total
number of levels, respectively. The dynamic permeability for a vessel of radius ri is Ki ¼iZor 1� 2J1ðbriÞ
briJ0ðbriÞ
h iwhere J0 and J1 are Bessel functions of order zero and one, respectively, and
b2 ¼ rZ tro
2 þ ioð Þ, where ρ, tr, and η are the density, relaxation time and the fluid viscosity re-
spectively. In order to apply Eq (1) to a particular network of vessels, the network geometricalcharacteristics, namely, the number of levels -that determine the number of vessels-, lengthsand radii, are required.
The network hemodynamic response relates viscoelastic flow and pressure drop in frequen-cy domain [14, 17]. In order to have it explicitly in time domain one needs to specify a time de-pendent pressure gradient. As the equations are linear, we can obtain the fluid response to anytime-dependent pressure gradient as a linear superposition of sinusoidal modes. For a single-mode time-dependent pressure drop Δp = Δp0 cos(ω0t), the volumetric flow as a function oftime is given by
QðtÞ ¼ � 1
ZRe½wðo0Þ� cos ðo0tÞ þ Im½wðo0Þ� sin ðo0tÞ½ �Dp0
Lð2Þ
Obstructions in Vascular Networks: Critical Sites for Blood Supply
PLOS ONE | DOI:10.1371/journal.pone.0128111 June 18, 2015 3 / 17
where the real and the imaginary parts of the response function χ (Eq (1)) give the flow in-phase and out-of-phase with the pressure gradient, respectively [21]. Eq (2) puts forward theimportance of the dynamic response as a measurement of the resistance to flow. For systemsdriven at biologically relevant frequencies like the ones imposed by the heart, the imaginarypart of the response is often negligible compared to its real part and the real part of the re-sponse gives one the proportionality factor between pressure gradient and flow in time domain.The response function allows one to study the hemodynamics of the system, without the re-quirement of considering a particular pressure gradient. Our results are presented at 1.5 Hz,which is the resting heart rate of the dog [22]. At such low frequencies the network response isalmost indistinguishable from the steady-state regime where the response is real. However, wekeep the formalism as general as possible to make it applicable when external frequencies areimposed [21]. We use parameters for normal dog blood [23], ρ = 1050 kg/m3, η = 1.5 × 10⁻²
kg/(m s) and assume that the relaxation time is similar to the one reported for human blood: tr= 1 × 10⁻³ s. This one, might vary several orders of magnitude, depending on confinement anddynamic conditions [18]. However, for the studies presented in this paper, the dynamic re-sponse is almost independent on the choice of this quantity since we work at low frequencies.
Model for obstructions in a tree-like networkThe vascular system of mammals has a complex topology. However, there are several places inthe body in which tree-like networks at different scales irrigate certain regions or tissues, fromthe tree-like networks resulting from successive bifurcations of large arteries that irrigate thelimbs, to the tree-like networks characteristic of the microvasculature that irrigates the eyes.
We use an electrical analogy in which the resistance of each vessel is given by Ri ¼ liAiKi
. Med-
ical and biological literature frequently report the fraction, f, of the total cross sectional areathat has been obstructed. Accordingly, we consider the area of an obstructed vessel,
Aobsi ¼ ð1� f ÞAi. The radius of the obstructed vessel, r
obsi ¼ ffiffiffiffiffiffiffiffiffiffiffiffiffiffiffið1� f Þp
ri, modifies its perme-ability and its corresponding resistance. We consider that obstructions occur in half of thebranches of the same tree level as illustrated in Fig 1A. Although such an obstruction patterndoes not correspond generically to physiological conditions, it helps to highlight the impact ofvessel geometry for equivalent obstructions, that is, those which block the same percentage ofcross sectional area regardless of the level in which they occur.
The total resistance for an N-level network obstructed at level n is given by
Lw¼Xn�1
i¼1
Ri
2i�1 þ1
2n�2
R2int þ RintðRobs
n þ RnÞ þ Robsn Rn
2Rint þ Robsn þ Rn
ð3Þ
where Rint ¼PN
i¼nþ1Ri
2i�n and Robsn ¼ ln
ð1�f ÞAn Kobsn, where Kobs
n is the permeability of an obstructed
vessel; Fig 1B shows the electric analogy for a segment of a network with obstructions at level n.Although we will focus on the overall behavior of the network, the analytical approach can
predict the local flow at each of the network vessels. We will characterize the impact of vesselobstruction on tree-like networks by focusing on two different types of paths. We will considerunobstructed paths, those which cross the network without moving along any obstructed vessel,and obstructed paths, when an obstructed vessel is crossed at some point in the network.
Obstructions in a network with equal vesselsWe first treat the case of a network in which all vessels have approximately the same radius,which is the case of several networks at the arteriole level, and approximate it with a bifurcatingnetwork of equal vessels with resistance R1. We find that in this case, the effect caused by
Obstructions in Vascular Networks: Critical Sites for Blood Supply
PLOS ONE | DOI:10.1371/journal.pone.0128111 June 18, 2015 4 / 17
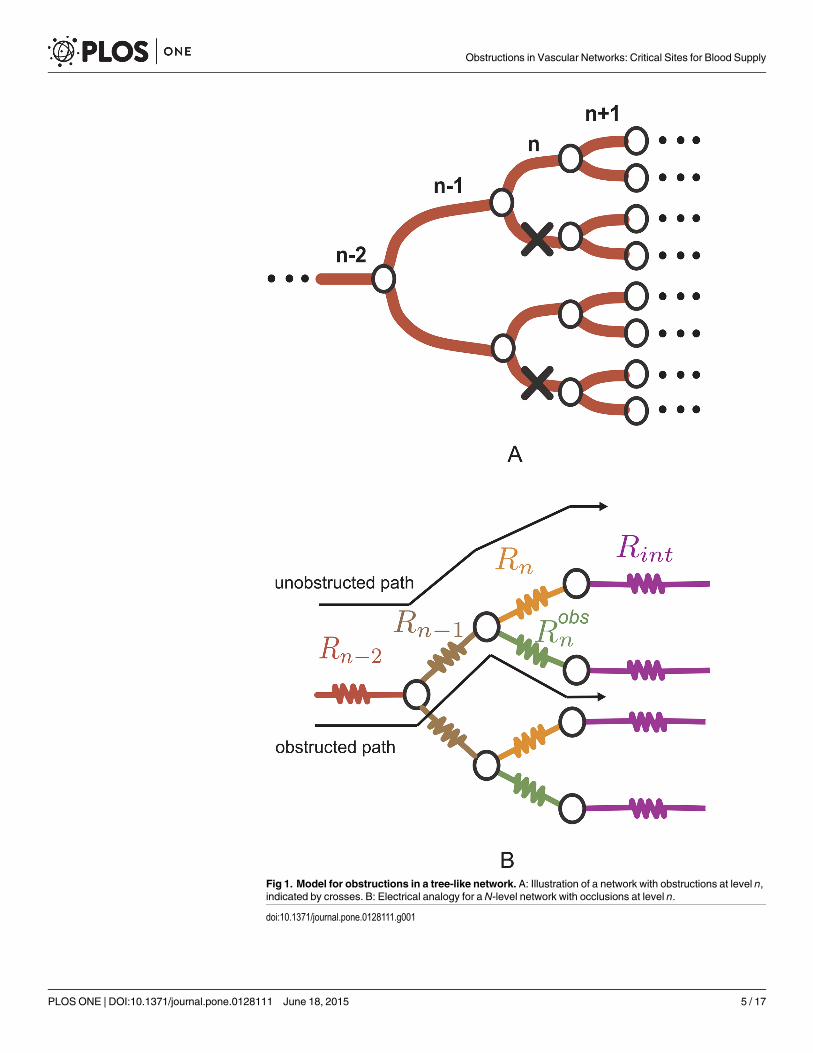
Fig 1. Model for obstructions in a tree-like network. A: Illustration of a network with obstructions at level n,indicated by crosses. B: Electrical analogy for aN-level network with occlusions at level n.
doi:10.1371/journal.pone.0128111.g001
Obstructions in Vascular Networks: Critical Sites for Blood Supply
PLOS ONE | DOI:10.1371/journal.pone.0128111 June 18, 2015 5 / 17
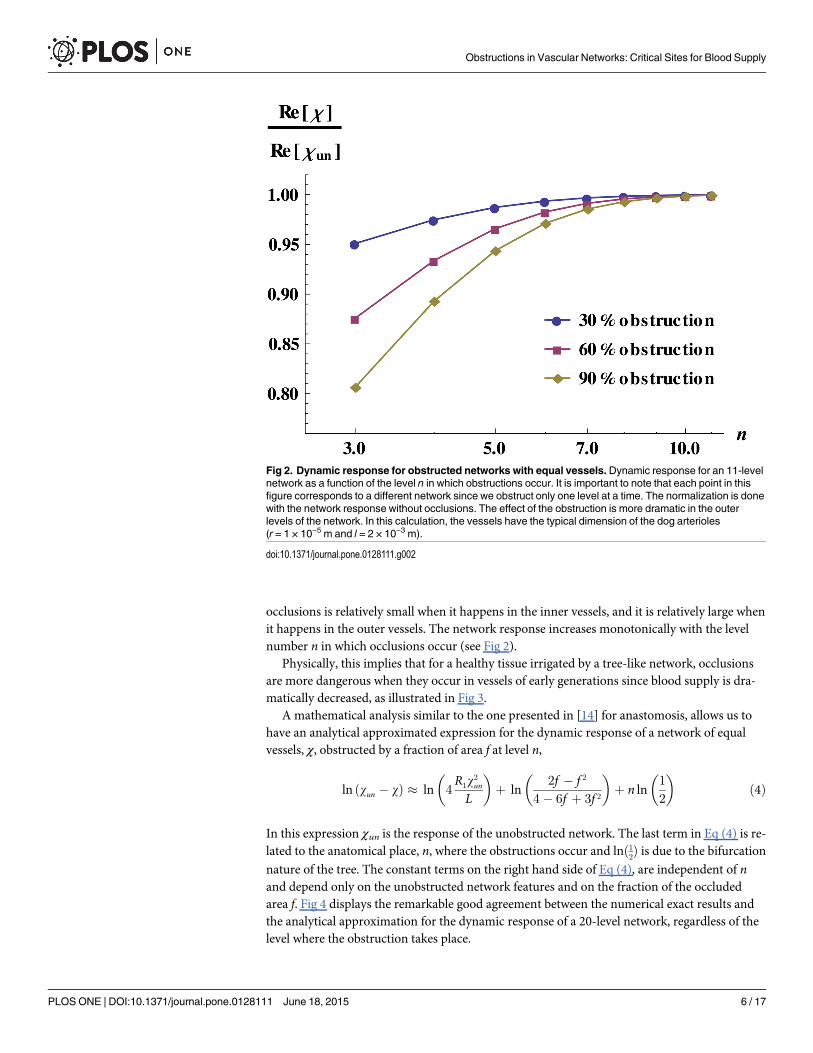
occlusions is relatively small when it happens in the inner vessels, and it is relatively large whenit happens in the outer vessels. The network response increases monotonically with the levelnumber n in which occlusions occur (see Fig 2).
Physically, this implies that for a healthy tissue irrigated by a tree-like network, occlusionsare more dangerous when they occur in vessels of early generations since blood supply is dra-matically decreased, as illustrated in Fig 3.
A mathematical analysis similar to the one presented in [14] for anastomosis, allows us tohave an analytical approximated expression for the dynamic response of a network of equalvessels, χ, obstructed by a fraction of area f at level n,
ln ðwun � wÞ � ln 4R1w
2un
L
� �þ ln
2f � f 2
4� 6f þ 3f 2
� �þ n ln
1
2
� �ð4Þ
In this expression χun is the response of the unobstructed network. The last term in Eq (4) is re-lated to the anatomical place, n, where the obstructions occur and lnð1
2Þ is due to the bifurcation
nature of the tree. The constant terms on the right hand side of Eq (4), are independent of nand depend only on the unobstructed network features and on the fraction of the occludedarea f. Fig 4 displays the remarkable good agreement between the numerical exact results andthe analytical approximation for the dynamic response of a 20-level network, regardless of thelevel where the obstruction takes place.
Fig 2. Dynamic response for obstructed networks with equal vessels.Dynamic response for an 11-levelnetwork as a function of the level n in which obstructions occur. It is important to note that each point in thisfigure corresponds to a different network since we obstruct only one level at a time. The normalization is donewith the network response without occlusions. The effect of the obstruction is more dramatic in the outerlevels of the network. In this calculation, the vessels have the typical dimension of the dog arterioles(r = 1 × 10⁻⁵ m and l = 2 × 10⁻³ m).
doi:10.1371/journal.pone.0128111.g002
Obstructions in Vascular Networks: Critical Sites for Blood Supply
PLOS ONE | DOI:10.1371/journal.pone.0128111 June 18, 2015 6 / 17
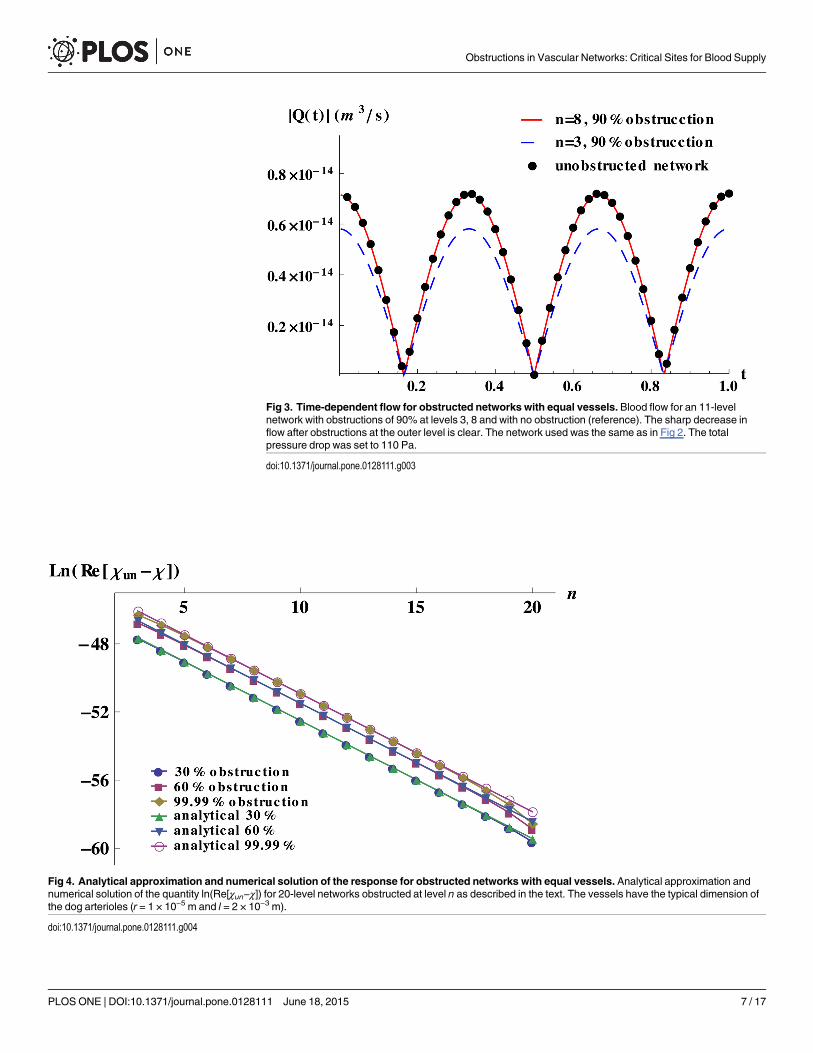
Fig 3. Time-dependent flow for obstructed networks with equal vessels. Blood flow for an 11-levelnetwork with obstructions of 90% at levels 3, 8 and with no obstruction (reference). The sharp decrease inflow after obstructions at the outer level is clear. The network used was the same as in Fig 2. The totalpressure drop was set to 110 Pa.
doi:10.1371/journal.pone.0128111.g003
Fig 4. Analytical approximation and numerical solution of the response for obstructed networks with equal vessels. Analytical approximation andnumerical solution of the quantity ln(Re[χun−χ]) for 20-level networks obstructed at level n as described in the text. The vessels have the typical dimension ofthe dog arterioles (r = 1 × 10⁻⁵ m and l = 2 × 10⁻³ m).
doi:10.1371/journal.pone.0128111.g004
Obstructions in Vascular Networks: Critical Sites for Blood Supply
PLOS ONE | DOI:10.1371/journal.pone.0128111 June 18, 2015 7 / 17
The theoretical prediction provides insight in the impact that the degree of obstruction andits location inside the network has in its global response; in particular the expression derivedclearly shows that the change in the network’s response due to the presence of obstructions ishighly determined by the structure of the unobstructed network.
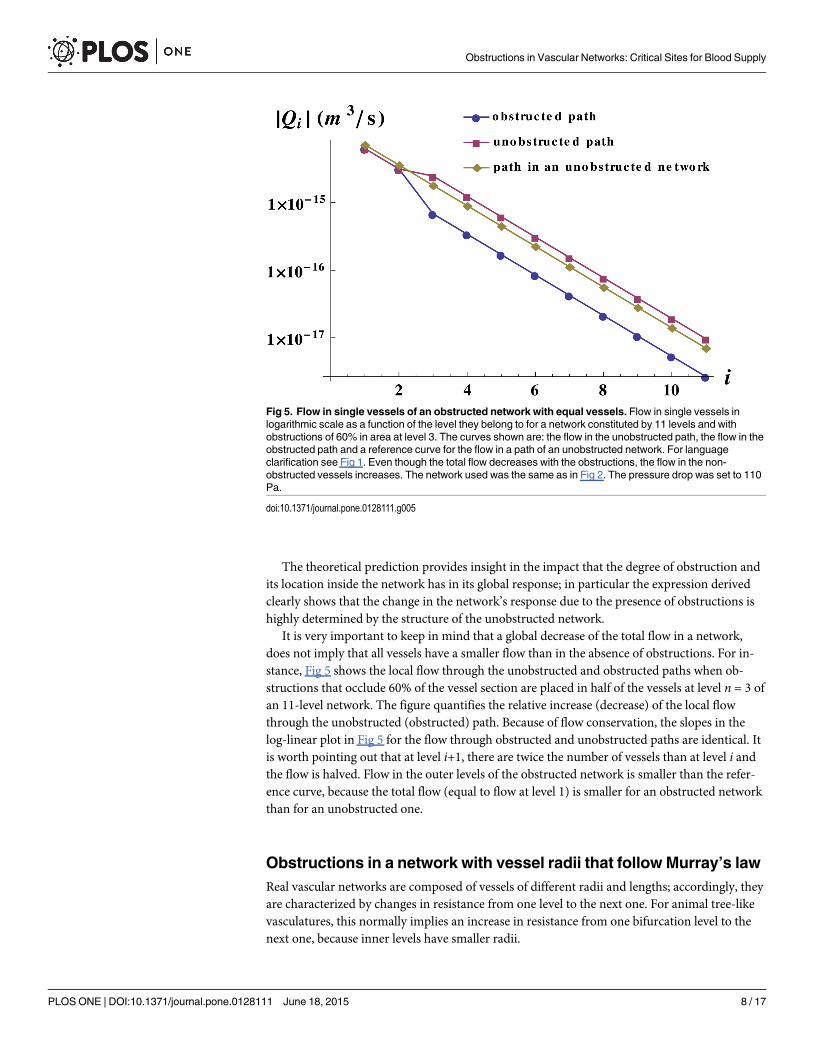
It is very important to keep in mind that a global decrease of the total flow in a network,does not imply that all vessels have a smaller flow than in the absence of obstructions. For in-stance, Fig 5 shows the local flow through the unobstructed and obstructed paths when ob-structions that occlude 60% of the vessel section are placed in half of the vessels at level n = 3 ofan 11-level network. The figure quantifies the relative increase (decrease) of the local flowthrough the unobstructed (obstructed) path. Because of flow conservation, the slopes in thelog-linear plot in Fig 5 for the flow through obstructed and unobstructed paths are identical. Itis worth pointing out that at level i+1, there are twice the number of vessels than at level i andthe flow is halved. Flow in the outer levels of the obstructed network is smaller than the refer-ence curve, because the total flow (equal to flow at level 1) is smaller for an obstructed networkthan for an unobstructed one.
Obstructions in a network with vessel radii that follow Murray’s lawReal vascular networks are composed of vessels of different radii and lengths; accordingly, theyare characterized by changes in resistance from one level to the next one. For animal tree-likevasculatures, this normally implies an increase in resistance from one bifurcation level to thenext one, because inner levels have smaller radii.
Fig 5. Flow in single vessels of an obstructed network with equal vessels. Flow in single vessels inlogarithmic scale as a function of the level they belong to for a network constituted by 11 levels and withobstructions of 60% in area at level 3. The curves shown are: the flow in the unobstructed path, the flow in theobstructed path and a reference curve for the flow in a path of an unobstructed network. For languageclarification see Fig 1. Even though the total flow decreases with the obstructions, the flow in the non-obstructed vessels increases. The network used was the same as in Fig 2. The pressure drop was set to 110Pa.
doi:10.1371/journal.pone.0128111.g005
Obstructions in Vascular Networks: Critical Sites for Blood Supply
PLOS ONE | DOI:10.1371/journal.pone.0128111 June 18, 2015 8 / 17
Assuming that the vascular system evolved to minimize the power required to maintain andcirculate blood [24], Murray derived, in 1926, the relationship known as Murray’s law. Thisone relates the parent radius, rp, and the two daughters vessels radii, rd1, rd2, before and after abifurcation, as
r3p ¼ r3d1 þ r3d2 ð5Þ
According to an extensive study on the validity of Murray’s law [25] and a review on vascu-lar flow of reference [26], physiological studies showed that, barring some anomalies, a largepart of the mammalian vasculatures have reasonable agreement with Eq (5). According to [26],there is also a considerable mass of literature comparing physiological studies in animals otherthan mammals, and even in plants [27–30], that show good agreement with Murray’s law.
We therefore consider Murray’s law as an example of physiological relevance, in which ouranalytical results illustrate how to explain the different tendencies in the dynamic response indifferent sections of the network.
For our studies, we consider symmetrical branching, so in this case, radii of subsequent lev-els are given by
ri ¼1
2
� �13ri�1
ð6Þ
For lengths, we consider a power law decay with parameters that match the actual length of theaorta and the length of the capillaries of the dog circulatory system.
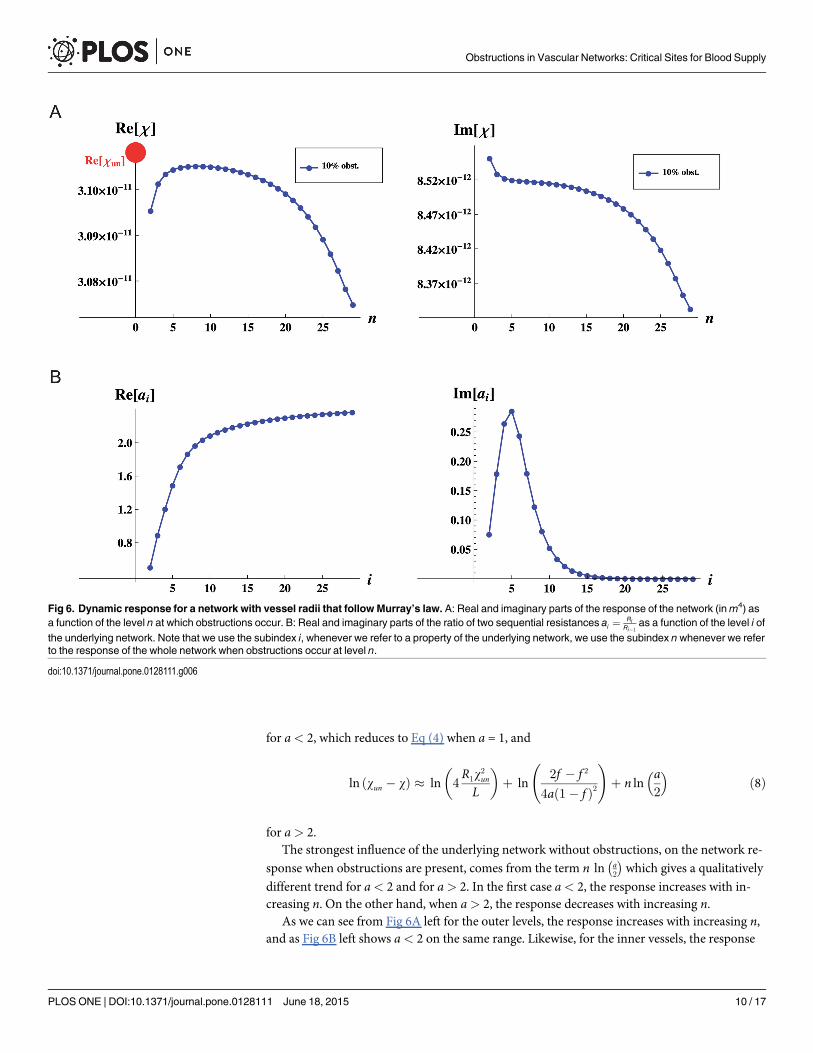
Figs 6B left and 6B right, show the real and imaginary parts of the ratio of two sequential re-
sistances of the underlying network, ai ¼ RiRi�1
, where Ri ¼ liAiKi
. The complex character of ai is
due to the fact that we are not working in a steady state, but at the frequency of the heart rate ofthe dog at rest. As for any realistic vasculature, the value of a changes along the network ac-cording to the lengths and radii of the vessels that compose it. A decrease in radii between sub-sequent levels produces an increase in resistance, on the other hand a decrease in lengthbetween subsequent levels, produces a decrease in resistance. It is therefore the interplay be-tween this two quantities which will determine the value of a. It turns out that for a bifurcatingnetwork, the response will be qualitatively different whenever a is smaller or larger than 2, aswe will see below.
Figs 6A left and 6A right, show the real and imaginary parts of the response as a function ofthe level n in which obstructions occur. As we can see from Fig 6A left for large arteries, thereal part of the response as a function of the level n in which obstructions occur, increases withincreasing n. On the other hand, for the section of smaller vessels, the real part of the responseas a function of the level n in which obstructions occur decreases with increasing n.
In order to gain insight into these results, we present analytical approximations for networksin which the ratio of subsequent resistances is less than two or larger than two. These onesagree well with numerical results whenever the real part of a is considerably larger than itsimaginary part. They are given by:
ln ðwun � wÞ � ln 4R1w
2un
L
� �þ ln
2f � f 2
a½4þ ð2þ aÞðf 2 � 2f Þ�� �
þ n lna2
� �ð7Þ
Obstructions in Vascular Networks: Critical Sites for Blood Supply
PLOS ONE | DOI:10.1371/journal.pone.0128111 June 18, 2015 9 / 17
for a< 2, which reduces to Eq (4) when a = 1, and
ln ðwun � wÞ � ln 4R1w
2un
L
� �þ ln
2f � f 2
4að1� f Þ2 !
þ n lna2
� �ð8Þ
for a> 2.The strongest influence of the underlying network without obstructions, on the network re-
sponse when obstructions are present, comes from the term n ln a2
� �which gives a qualitatively
different trend for a< 2 and for a> 2. In the first case a< 2, the response increases with in-creasing n. On the other hand, when a> 2, the response decreases with increasing n.
As we can see from Fig 6A left for the outer levels, the response increases with increasing n,and as Fig 6B left shows a< 2 on the same range. Likewise, for the inner vessels, the response
Fig 6. Dynamic response for a network with vessel radii that followMurray’s law. A: Real and imaginary parts of the response of the network (inm4) asa function of the level n at which obstructions occur. B: Real and imaginary parts of the ratio of two sequential resistances ai ¼ Ri
Ri�1as a function of the level i of
the underlying network. Note that we use the subindex i, whenever we refer to a property of the underlying network, we use the subindex nwhenever we referto the response of the whole network when obstructions occur at level n.
doi:10.1371/journal.pone.0128111.g006
Obstructions in Vascular Networks: Critical Sites for Blood Supply
PLOS ONE | DOI:10.1371/journal.pone.0128111 June 18, 2015 10 / 17
decreases with increasing n and a> 2 on the same range. For values of a< 2, just as in the caseof equal vessels (that has a = 1) presented in the previous section, occlusions are more danger-ous when they occur in vessels of early generations since blood supply is dramatically de-creased. On the other hand, when a> 2, occlusions are more dangerous when they occur invessels of late generations since blood supply is smaller than for instance at vessels around themiddle of the network.
For the network presented here, that follows Murray’s law for radii and a power law for ves-sel lengths, two radically different behaviors are observed, one for external levels, and one forinner vessels. Our analytical results help us to build an intuition for the interpretation of thedifferent behaviors of the response function in occluded vascular networks. Such behaviors arestrongly dependent on the structure of the underlying network.
Obstructions in a network with a jump in resistanceFinally, we consider a network for which vessels have a sudden jump in resistance. This corre-sponds to physiological conditions in cases where vessels of small radii branch from vessels oflarge radii. In particular, we consider a network for which we have a resistance R1 for i� k anda resistance R2 for i> k, where k is a level close to the middle of the network. Therefore, the
network has a jump in resistance a � R2R1between levels k and k+1. We obtain analytical approx-
imations for real a that could be useful when one analyzes jumps in resistance in the arterial
tree of mammals. The first case holds in the limit when ða� 1Þ 12
� �k�n<< 1 for n� k, and for a
given a it is better the farther away from the jump obstructions are. In this case, we find thatthe network response is given by
ln ðwun � wÞ � ln 4R1w
2un
L
� �þ ln
2f � f 2
4� 6f þ 3f 2
� �þ n ln
1
2
� �for n � k ð9Þ
and
ln ðwun � wÞ � ln 4R2w
2un
L
� �þ ln
2f � f 2
4� 6f þ 3f 2
� �þ n ln
1
2
� �for n > k ð10Þ
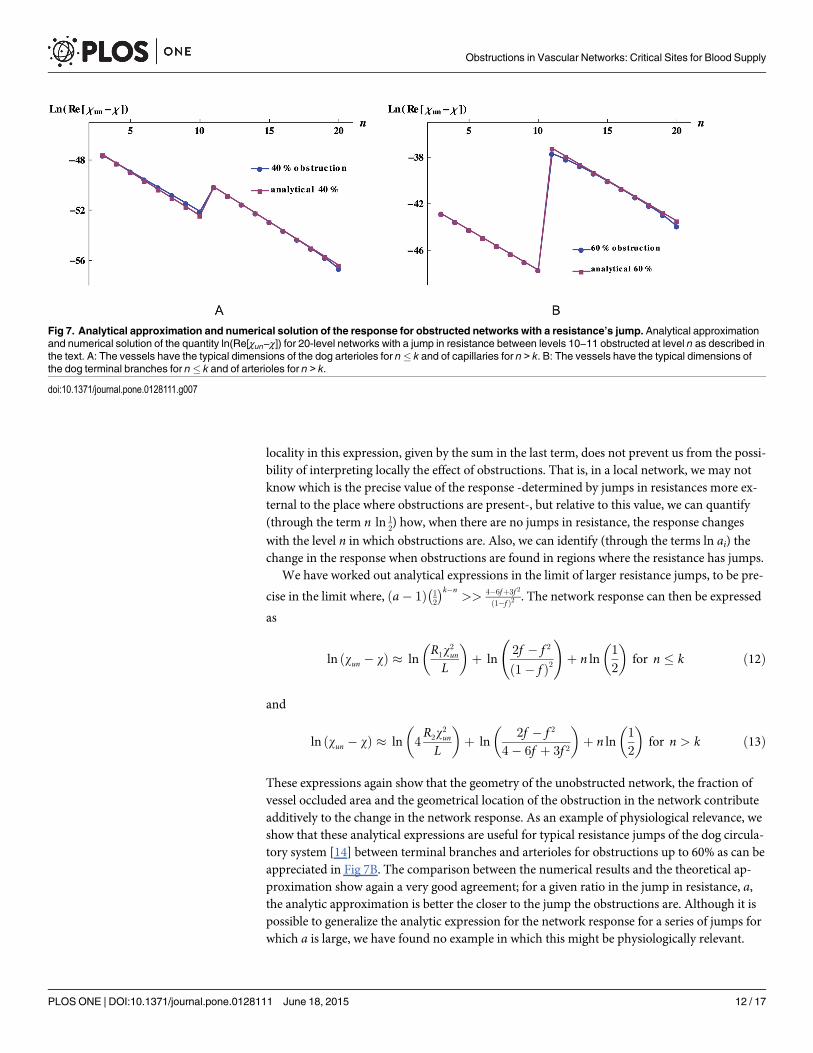
The right hand side of these expressions clearly highlights that the geometry of the underlyingnetwork, the fraction of obstructed vessels, and the geometrical place, n, where the obstructionis located contribute additively to the change in the network response. As examples of physio-logical relevance for which these analytical expressions could be useful, we find typical resis-tance jumps of the dog circulatory system [14] between main arterial branches and terminalbranches, and between arterioles and capillaries. For the former example, the analytical ap-proximation is good for degrees of obstruction up to 90%. For the later example, the analyticalapproximation is reasonably good for obstruction degrees up to 40%, Fig 7A shows the exactand approximated values for the difference of the response for an obstruction degree of 40%.
We have generalized these results for the case when a vasculature has several jumps, the ap-proximated analytical expression is given by
ln ðwun � wÞ � ln 4R1w
2un
L
� �þ ln
2f � f 2
4� 6f þ 3f 2
� �þ n ln
1
2
� �þXni¼2
ln ðaiÞ 8 n ð11Þ
Here, n represents the level in which obstructions occur, and ai is the ratio of two sequential re-
sistances, ai ¼ RiRi�1
. It is clear that whenever ai = 1 there is no contribution to the sum in the last
term of Eq (11), and that for a network in which there are no jumps in resistance, Eq (11) re-duces to Eq (4) with a = 1. This expression holds for jumps with small values of ai. The non-
Obstructions in Vascular Networks: Critical Sites for Blood Supply
PLOS ONE | DOI:10.1371/journal.pone.0128111 June 18, 2015 11 / 17
locality in this expression, given by the sum in the last term, does not prevent us from the possi-bility of interpreting locally the effect of obstructions. That is, in a local network, we may notknow which is the precise value of the response -determined by jumps in resistances more ex-ternal to the place where obstructions are present-, but relative to this value, we can quantify(through the term n ln 1
2) how, when there are no jumps in resistance, the response changes
with the level n in which obstructions are. Also, we can identify (through the terms ln ai) thechange in the response when obstructions are found in regions where the resistance has jumps.
We have worked out analytical expressions in the limit of larger resistance jumps, to be pre-
cise in the limit where, ða� 1Þ 12
� �k�n>> 4�6fþ3f 2
ð1�f Þ2 . The network response can then be expressed
as
ln ðwun � wÞ � lnR1w
2un
L
� �þ ln
2f � f 2
ð1� f Þ2 !
þ n ln1
2
� �for n � k ð12Þ
and
ln ðwun � wÞ � ln 4R2w
2un
L
� �þ ln
2f � f 2
4� 6f þ 3f 2
� �þ n ln
1
2
� �for n > k ð13Þ
These expressions again show that the geometry of the unobstructed network, the fraction ofvessel occluded area and the geometrical location of the obstruction in the network contributeadditively to the change in the network response. As an example of physiological relevance, weshow that these analytical expressions are useful for typical resistance jumps of the dog circula-tory system [14] between terminal branches and arterioles for obstructions up to 60% as can beappreciated in Fig 7B. The comparison between the numerical results and the theoretical ap-proximation show again a very good agreement; for a given ratio in the jump in resistance, a,the analytic approximation is better the closer to the jump the obstructions are. Although it ispossible to generalize the analytic expression for the network response for a series of jumps forwhich a is large, we have found no example in which this might be physiologically relevant.
Fig 7. Analytical approximation and numerical solution of the response for obstructed networks with a resistance’s jump. Analytical approximationand numerical solution of the quantity ln(Re[χun−χ]) for 20-level networks with a jump in resistance between levels 10−11 obstructed at level n as described inthe text. A: The vessels have the typical dimensions of the dog arterioles for n� k and of capillaries for n > k. B: The vessels have the typical dimensions ofthe dog terminal branches for n� k and of arterioles for n > k.
doi:10.1371/journal.pone.0128111.g007
Obstructions in Vascular Networks: Critical Sites for Blood Supply
PLOS ONE | DOI:10.1371/journal.pone.0128111 June 18, 2015 12 / 17
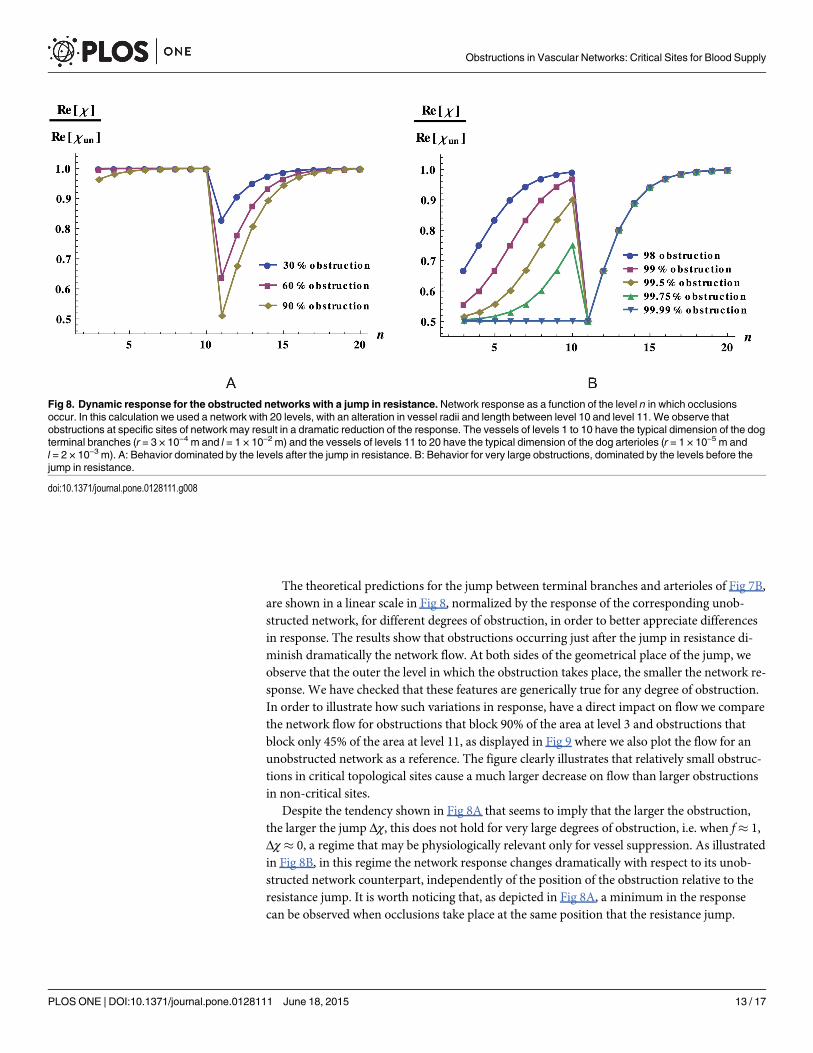
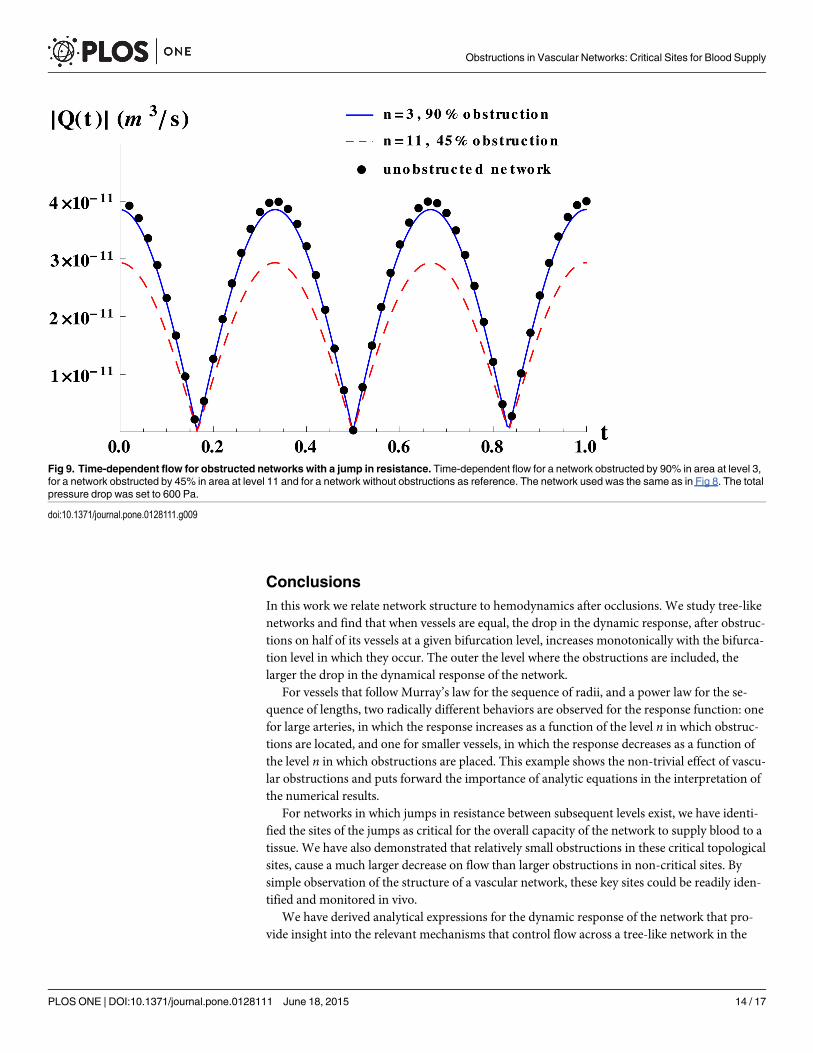
The theoretical predictions for the jump between terminal branches and arterioles of Fig 7B,are shown in a linear scale in Fig 8, normalized by the response of the corresponding unob-structed network, for different degrees of obstruction, in order to better appreciate differencesin response. The results show that obstructions occurring just after the jump in resistance di-minish dramatically the network flow. At both sides of the geometrical place of the jump, weobserve that the outer the level in which the obstruction takes place, the smaller the network re-sponse. We have checked that these features are generically true for any degree of obstruction.In order to illustrate how such variations in response, have a direct impact on flow we comparethe network flow for obstructions that block 90% of the area at level 3 and obstructions thatblock only 45% of the area at level 11, as displayed in Fig 9 where we also plot the flow for anunobstructed network as a reference. The figure clearly illustrates that relatively small obstruc-tions in critical topological sites cause a much larger decrease on flow than larger obstructionsin non-critical sites.
Despite the tendency shown in Fig 8A that seems to imply that the larger the obstruction,the larger the jump Δχ, this does not hold for very large degrees of obstruction, i.e. when f� 1,Δχ� 0, a regime that may be physiologically relevant only for vessel suppression. As illustratedin Fig 8B, in this regime the network response changes dramatically with respect to its unob-structed network counterpart, independently of the position of the obstruction relative to theresistance jump. It is worth noticing that, as depicted in Fig 8A, a minimum in the responsecan be observed when occlusions take place at the same position that the resistance jump.
Fig 8. Dynamic response for the obstructed networks with a jump in resistance.Network response as a function of the level n in which occlusionsoccur. In this calculation we used a network with 20 levels, with an alteration in vessel radii and length between level 10 and level 11. We observe thatobstructions at specific sites of network may result in a dramatic reduction of the response. The vessels of levels 1 to 10 have the typical dimension of the dogterminal branches (r = 3 × 10⁻⁴ m and l = 1 × 10⁻² m) and the vessels of levels 11 to 20 have the typical dimension of the dog arterioles (r = 1 × 10⁻⁵ m andl = 2 × 10⁻³ m). A: Behavior dominated by the levels after the jump in resistance. B: Behavior for very large obstructions, dominated by the levels before thejump in resistance.
doi:10.1371/journal.pone.0128111.g008
Obstructions in Vascular Networks: Critical Sites for Blood Supply
PLOS ONE | DOI:10.1371/journal.pone.0128111 June 18, 2015 13 / 17
ConclusionsIn this work we relate network structure to hemodynamics after occlusions. We study tree-likenetworks and find that when vessels are equal, the drop in the dynamic response, after obstruc-tions on half of its vessels at a given bifurcation level, increases monotonically with the bifurca-tion level in which they occur. The outer the level where the obstructions are included, thelarger the drop in the dynamical response of the network.
For vessels that follow Murray’s law for the sequence of radii, and a power law for the se-quence of lengths, two radically different behaviors are observed for the response function: onefor large arteries, in which the response increases as a function of the level n in which obstruc-tions are located, and one for smaller vessels, in which the response decreases as a function ofthe level n in which obstructions are placed. This example shows the non-trivial effect of vascu-lar obstructions and puts forward the importance of analytic equations in the interpretation ofthe numerical results.
For networks in which jumps in resistance between subsequent levels exist, we have identi-fied the sites of the jumps as critical for the overall capacity of the network to supply blood to atissue. We have also demonstrated that relatively small obstructions in these critical topologicalsites, cause a much larger decrease on flow than larger obstructions in non-critical sites. Bysimple observation of the structure of a vascular network, these key sites could be readily iden-tified and monitored in vivo.
We have derived analytical expressions for the dynamic response of the network that pro-vide insight into the relevant mechanisms that control flow across a tree-like network in the
Fig 9. Time-dependent flow for obstructed networks with a jump in resistance. Time-dependent flow for a network obstructed by 90% in area at level 3,for a network obstructed by 45% in area at level 11 and for a network without obstructions as reference. The network used was the same as in Fig 8. The totalpressure drop was set to 600 Pa.
doi:10.1371/journal.pone.0128111.g009
Obstructions in Vascular Networks: Critical Sites for Blood Supply
PLOS ONE | DOI:10.1371/journal.pone.0128111 June 18, 2015 14 / 17
presence of vessel occlusions. Moreover, we are able to find approximations for cases thatmight be physiologically relevant in which the roles played by the network structure, the degreeof obstruction and the geometrical place in which obstructions take place can be clearly identi-fied. We demonstrate that our results are local in the sense that they depend on the networkstructure around the place where obstructions are. This implies that whenever there is a tree-like network in an in-vivo vasculature, our model is able to interpret the effect that an obstruc-tion has on flow.
Our results demonstrate that the effect of occlusions on flow is somehow opposite to the ef-fect of the addition of anastomotic vessels [14]. When in the former case occlusions cause a de-crease on flow, in the latter, anastomosis causes an increase on flow. However they are similarin the sense that whenever vascular alterations to a network occur (either in the form of occlu-sions or in the form of addition of vessels), the impact on flow has similar tendencies. Namely,for vascular networks with a< 2 (a> 2), the outer (inner) the vascular alterations are placed,the larger the impact on flow. Also, sites presenting a large jump in resistance are critical forthe overall capacity of the network to supply blood. In the case of obstructions situated onthose critical sites, a large decrease in network response (and flow) might compromise the sur-vival of the tissue. While new vessels in the form of anastomosis added (naturally or artificially)at those critical sites, result in an extremely large increase in the network response and flow.
For our model, we have considered that vessels are rigid. However, real vessels are elastictubes. Important insight could be gained from the inclusion of elastic effects in the model, espe-cially for large arteries, where elastic effects are very important. Regional tissue metabolism,such as the myogenic effect in arteries, can be considered, as was done in reference [14], whereit was shown that the impact that is has on flow is large, but tendencies with the geometricalplace where anatomical variations occur, are qualitatively unaltered.
A validation of our model with an in-vivo biological system is currently not possible, since itwould require data of flow measurements after a systematic variation of the anatomical placewhere obstructions are located. Such information does not exist in literature. One possibility tovalidate the model, at least at certain length scales, in an experimental situation, would be touse artificial vessel networks, such as networks etched in microfluidic devices, where local vari-ations could be systematically done.
Vascular alterations might affect or help a patient depending on the medical condition, inthe case of ischemic conditions affecting the irrigation of vital tissues, the presence of occlu-sions is negative and the presence of anastomosis is positive for tissue irrigation. On the con-trary, for a vasculature irrigating a tumor, anastomosis might be good for the tumor and badfor the patient and occlusions would have the opposite effect. Our results can help to decidethe anatomical sites where selective suppression of vessels, might help to decrease blood flowtowards the tumor, decreasing its oxygen supply. The study of the effect on flow of other vascu-lature alterations, such as the presence of aneurisms, is desirable.
Our results put forward the importance of relating vasculature structure with hemodynam-ics. Recent progresses on high resolution microscopy allows the visualization of the characteris-tics of an individual vasculature [31]. Hence, the concurrence of sophisticated image-trackingsystems and mathematical models such as the one presented here, provides a new perspectiveand relevant tools in the determination of blood supply to a tissue.
Supporting InformationS1 Supporting Information. Supplementary material.(PDF)
Obstructions in Vascular Networks: Critical Sites for Blood Supply
PLOS ONE | DOI:10.1371/journal.pone.0128111 June 18, 2015 15 / 17

Author ContributionsConceived and designed the experiments: AMTR AMR IP RDMT ECP. Performed the experi-ments: AMTR AMR IP RDMT ECP. Analyzed the data: AMTR AMR IP RDMT ECP. Contrib-uted reagents/materials/analysis tools: AMTR AMR IP RDMT ECP. Wrote the paper: AMTRAMR IP RDMT ECP.
References1. Schwartz CJ, Gerrity RG. Anatomical pathology of sudden unexpected cardiac death. Circulation.
1975; 52(6 Suppl): III18–26. PMID: 1182972
2. Hayreh SS, Kolder HE, Weingeist TA. Central retinal artery occlusion and retinal tolerance time. Oph-thalmology. 1980; 87: 75–78. doi: 10.1016/S0161-6420(80)35283-4 PMID: 6769079
3. Hayreh SS, Jonas JB. Optic disk and retinal nerve fiber layer damage after transient central retinal ar-tery occlusion: an experimental study in rhesus monkeys. Am J Ophthalmol. 2000; 129: 786–795. doi:10.1016/S0002-9394(00)00384-6 PMID: 10926989
4. Stergiopulos N, Young DF, Rogge TR. Computer simulation of arterial flow with applications to arterialand aortic stenoses. J Biomech. 1992; 25: 1477–1488. doi: 10.1016/0021-9290(92)90060-E PMID:1491023
5. Stroud JS, Berger SA, Saloner D. Influence of stenosis morphology on flow through severely stenoticvessels: implications for plaque rupture. J Biomech. 2000; 33: 443–455. doi: 10.1016/S0021-9290(99)00207-9 PMID: 10768393
6. Botnar R, Rappitsch G, Scheidegger MB, Liepsch D, Perktold K, Boesiger P. Hemodynamics in the ca-rotid artery bifurcation: a comparison between numerical simulations and in vitro MRI measurements. JBiomech. 2000; 33: 137–144. doi: 10.1016/S0021-9290(99)00164-5 PMID: 10653026
7. Long Q, Xu XY, Ramnarine KV, Hoskins P. Numerical investigation of physiologically realistic pulsatileflow through arterial stenosis. J Biomech. 2001; 34: 1229–1242. doi: 10.1016/S0021-9290(01)00100-2PMID: 11522303
8. Formaggia L, Lamponi D, Tuveri M, Veneziani A. Numerical modeling of 1D arterial networks coupledwith a lumped parameters description of the heart. Comput Methods Biomech Biomed Engin. 2006; 9:273–288. doi: 10.1080/10255840600857767 PMID: 17132614
9. Varghese SS, Frankel SH, Fischer PF. Direct numerical simulation of stenotic flows. Part 1. Steadyflow. J Fluid Mech. 2007; 582: 253–280. doi: 10.1017/S0022112007005836
10. Varghese SS, Frankel SH, Fischer PF. Direct numerical simulation of stenotic flows. Part 2. Pulsatileflow. J Fluid Mech. 2007; 582: 281–318. doi: 10.1017/S0022112007005836
11. Frauenfelder T, Boutsianis E, Schertler T, Husmann L, Leschka S, Poulikakos D, et al. In-vivo flow sim-ulation in coronary arteries based on computed tomography datasets: feasibility and initial results. EurRadiol. 2007; 17: 1291–1300. doi: 10.1007/s00330-006-0465-1 PMID: 17061068
12. Lee SE, Lee SW, Fischer PF, Bassiouny HS, Loth F. Direct numerical simulation of transitional flow in astenosed carotid bifurcation. J Biomech. 2008; 41: 2551–2561. doi: 10.1016/j.jbiomech.2008.03.038PMID: 18656199
13. Alastruey J, Parker KH, Peiró J, Byrd SM, Sherwin SJ. Modelling the circle of Willis to assess the effectsof anatomical variations and occlusions on cerebral flows. J Biomech. 2007; 40: 1794–1805. doi: 10.1016/j.jbiomech.2006.07.008 PMID: 17045276
14. Flores J, Meza Romero A, Travasso RDM, Corvera Poiré E. Flow and anastomosis in vascular net-works. J Theor Biol. 2013; 317: 257–270. doi: 10.1016/j.jtbi.2012.10.005 PMID: 23084892
15. Suda M, Eder OJ, Kunsch B, Magometschnigg D, Magometschnigg H. Preoperative assessment andprediction of postoperative results in an artificial arterial network using computer simulation. ComputMethods Programs Biomed. 1993; 41: 77–87. doi: 10.1016/0169-2607(93)90067-U PMID: 8156753
16. Grasman J, Brascamp JW, Van Leeuwen JL, Van Putten B. The Multifractal Structure of Arterial Trees.J Theor Biol. 2003; 220: 75–82. doi: 10.1006/jtbi.2003.3151 PMID: 12453452
17. Flores J, Corvera Poiré E, del Río JA, López de Haro M. A plausible explanation for heart rates in mam-mals. J Theor Biol. 2010; 265: 599–603. doi: 10.1016/j.jtbi.2010.06.003 PMID: 20665970
18. Thurston GB, Henderson NM. Effects of flow geometry on blood viscoelasticity. Biorheology. 2006; 43:729–746. PMID: 17148856
19. Morrison FA. Understanding Rheology. New York: Oxford University Press; 2001.
20. Bravo-Gutiérrez ME, Castro M, Hernández-Machado A, Corvera Poiré E. Controlling viscoelastic flowin microchannels with slip. Langmuir. 2011; 27: 2075–2079. doi: 10.1021/la103520a PMID: 21322616
Obstructions in Vascular Networks: Critical Sites for Blood Supply
PLOS ONE | DOI:10.1371/journal.pone.0128111 June 18, 2015 16 / 17

21. Collepardo-Guevara R, Corvera Poiré E. Controlling viscoelastic flow by tuning frequency during occlu-sions. Phys Rev E Stat Nonlin Soft Matter Phys. 2007; 76: 026301-1–026301-7. doi: 10.1103/PhysRevE.76.026301
22. Nichols WW, O’Rourke MF. McDonald’s Blood Flow in Arteries Theoretical, Experimental and ClinicalPrinciples. New York: Arnold/Oxford University Press; 1998.
23. Kern TS, Engerman RL, Peterson CM. Elevated blood viscosity in alloxan diabetic dogs and experi-mentally galactosemic dogs. J Diabetes Complicat. 1989; 3(3): 158–162. doi: 10.1016/0891-6632(89)90039-1
24. Murray CD. The physiological principle of minimumwork. I. The vascular system and the cost of bloodvolume. Proc Natl Acad Sci USA. 1926; 12: 207–214. doi: 10.1073/pnas.12.3.207 PMID: 16576980
25. Sherman TF. On connecting large vessels to small. The meaning of Murray’s law. J Gen Physiol. 1981;78: 431–453. doi: 10.1085/jgp.78.4.431 PMID: 7288393
26. Williams HR, Trask RS, Weaver PM, Bond IP. Minimummass vascular networks in multifunctional ma-terials. J R Soc Interface. 2008; 5: 55–65. doi: 10.1098/rsif.2007.1022 PMID: 17426011
27. Taber LA, Ng S, Quesnel AM, Whatman J, Carmen CJ. Investigating Murray’s law in the chick embryo.J Biomech. 2001; 34: 121–124. doi: 10.1016/S0021-9290(00)00173-1 PMID: 11425071
28. McCulloh KA, Sperry JS, Adler FR. Water transport in plants obeys Murray’s law. Nature. 2003; 421:939–942. doi: 10.1038/nature01444 PMID: 12607000
29. McCulloh KA, Sperry JS, Adler FR. Murray’s law and the hydraulic vs mechanical functioning of wood.Funct Ecol. 2004; 18: 931–938. doi: 10.1111/j.0269-8463.2004.00913.x
30. McCulloh KA, Sperry JS. The evaluation of Murray’s law in Psilotum Nudum (Psilotaceae) an analogueof ancestral vascular plants. Am J Bot. 2005; 92(6): 985–989. doi: 10.3732/ajb.92.6.985 PMID:21652482
31. Zhang L, Hu C, Zhao T, Luo S. Noninvasive visualization of microvessels using diffraction enhancedimaging. Eur J Radiol. 2011; 80: 158–162. doi: 10.1016/j.ejrad.2010.08.019 PMID: 20833491
Obstructions in Vascular Networks: Critical Sites for Blood Supply
PLOS ONE | DOI:10.1371/journal.pone.0128111 June 18, 2015 17 / 17


![RESEARCHARTICLE TheSapir-WhorfHypothesisandProbabilistic ...yangxu/cibelli_xu_austerweil... · Sapir-Whorf hypothesis thatemphasize the importance ofverbalcodes[7,8],andtheinterplay](https://img.pdfslide.net/doc/110x75/5fcf567fcbb9d932aa6c4f0b/researcharticle-thesapir-whorfhypothesisandprobabilistic-yangxucibellixuausterweil.jpg)