Embed Size (px)
Citation preview
1Reshoring in Reverse Again
Reshoring in Reverse Again US manufacturers are not exactly coming back in droves. In fact, the latest Reshoring Index shows that imports from the traditional offshoring countries are at a record high.
1Reshoring in Reverse AgainView online: bit.ly/Reshoring-in-Reverse-Again
A.T. Kearney’s fourth annual Reshoring Index shows record imports from traditional offshoring countries in 2017—a sharp reversal of the glimmers of hope seen in 2016. Imports of manufactured goods into the United States from the 14 largest low-cost country trading partners in Asia rose by a staggering $55 billion, or 8 percent—the largest one-year increase since the economic recovery of 2011.
After rising to a five-year high in 2016 in the wake of a US presidential election year in which so much attention was paid to manufacturing job loss to China, the Reshoring Index has again dropped 27 basis points. Relative growth of imports from the low-cost country trading partners has now outpaced relative growth of US manufacturing gross output in four of the past five years and eight of the past 10 years, showing a clear direction away from significant reshoring. Since 2013, when A.T. Kearney first started studying reshoring as a phenomenon, imports of manufactured goods from the 14 largest low-cost countries have increased by $118 billion, or 19 percent, while US manufacturing gross output has grown by only $81 billion, or 1 percent.
There are several reasons for this ongoing trend away from reshoring, including the continued economic benefits of producing labor-intensive products overseas, the fact that significant offshore investments were made that are not easily abandoned, and the domestic shortage of skilled labor for manufacturing operations. Although tariffs and political posturing could impact and potentially change the direction of the reshoring trend, there are many potential futures. Companies must weigh the risks and, if imposed, assess the longevity of tariffs on goods from low-cost countries to determine whether the United States is even the most logical location to move their manufacturing capabilities, for example, if China is no longer economical.
Nonetheless, if the goal is to increase US output, it does not need to come solely from reshoring. In fact, three moves can cause a spike in manufacturing: American companies bringing manufacturing back from low-cost countries (reshoring), American companies manufacturing more in the United States, and foreign companies, including those from China, manufacturing in the United States (foreign direct investment). For example, on a small but growing scale, Americans are now buying products designed and marketed by Chinese companies, which could eventually lead to more Chinese companies setting up manufacturing facilities for consumer goods in the United States in addition to the mostly business-to-business operations they already have for industrial products such as steel tubing and automotive parts. However, the long-term trend of manufacturing products for the US market in countries such as China and other Asian low-cost countries has not been curbed and, even though 2017 and the roaring first half of 2018 are providing optimism for the US manufacturing sector, it will take more than political headlines to effect any meaningful and lasting change (see sidebar on page 2: Trade Wargaming). As a result, any tariffs put on imports from those low-cost countries will, in the short run, only be felt in American consumers’ wallets.
2017 US Reshoring Index: A Closer LookThe objective of A.T. Kearney’s US Reshoring Index is to assess actual reshored manufacturing—not manufacturing related to foreign direct investment (FDI), which is triggered by a very different set of macroeconomic factors—by comparing US manufacturing gross output to import data from 14 low-cost countries. To calculate the Index, we first look at the import of manufactured goods from the 14 Asian countries that have traditionally been offshore trading partners: China, Taiwan, Malaysia, India, Vietnam, Thailand, Indonesia, Singapore, the Philippines, Bangladesh, Pakistan, Hong Kong, Sri Lanka, and Cambodia (see sidebar on page 3: A.T. Kearney Reshoring Database). Next, we examine US domestic gross output of manufactured goods.
2Reshoring in Reverse AgainView online: bit.ly/Reshoring-in-Reverse-Again
Trade Wargaming
President Donald Trump has challenged the status quo of the US trading system, criticizing free trade agreements and their impact on workers and vowing to address trade. In one of the first acts of his presidency, he withdrew the United States from the Trans-Pacific Partnership, signaling a new course for the country’s trade policy. Since then, Trump’s administration has started renegotiating NAFTA, imposed tariffs on steel and aluminum imports, and—most significantly for the reshoring debate—added substantial tariffs on imports from China.
What effect on reshoring can we expect from the Trump adminis-tration’s trade policy? In the short term, tariffs on imports from China have the potential to significantly change the economic equation for some products. Two main factors will determine the impact. How will companies interpret the longevity of the tariffs? And if the tariffs are in place for the long term, is the United States the natural place to relocate production, or would producers consider other low-cost countries that are not subject to tariffs?
Long term, it remains to be seen what the administration will try to do to incentivize reshoring to a point where it starts to make a real difference. In negotiations with both China and the United States’ NAFTA partners, the United States has introduced demands to reduce the trade imbalance. However, it is unclear how that will happen. One option is that the United States is able to strike a grand bargain with trade partners along the lines of Japan’s voluntary import restrictions negotiated by the Reagan administration in the 1980s. That led to massive investments from Japanese auto companies to build production capacity in the United States. If the government is unable to compel its trade partners, a much more interven-tionist policy with tariffs on a broader range of countries and products can be conceived. However, that would come at a high cost. US consumers would see the tariffs reflected in the prices of the products they buy, and producers could see foreign trade partners retaliate on American products.
High uncertainty remains, so companies must develop plans to assess and mitigate risks and
capture opportunities from this administration’s trade policy.
Four actions can help companies create forward-thinking strategies:
• Understand the potential scenarios. Have a deep under-standing of the trade policy landscape, its stakeholders, the potential actions, timelines, and likely outcomes.
• Take stock of the company’s exposure. Assess the level of exposure to various outcomes, identifying key risk areas within the organization, at both a country level and a product family/sourcing category level.
• Develop contingency plans. Build robust responses to any scenario by wargaming through various outcomes and devel-oping options that mitigate risk, guide strategy, and capture emerging opportunities.
• Create a monitoring system. Develop a system to track developments and monitor signposts that indicate which outcomes are becoming more or less likely and when contin-gency plans should be enacted.
Then, we calculate the manufacturing import ratio (MIR), which is simply the quotient of dividing the first number by the second. The US Reshoring Index is the year-over-year change in the MIR, expressed in basis points. A positive number indicates net reshoring, which occurs if gross domestic output grew relatively faster than imports from the 14 offshore countries.
In 2017, imports of manufactured goods from offshore trading partners reached $751 billion. Of that $751 billion, China remains the dominant importer with $494 billion—roughly two-thirds— in manufactured goods imports. China imports grew 9 percent from 2016, a growth rate that outpaces all but the Philippines, Hong Kong, and Cambodia. US domestic gross output of
3Reshoring in Reverse AgainView online: bit.ly/Reshoring-in-Reverse-Again
A.T. Kearney Reshoring Database
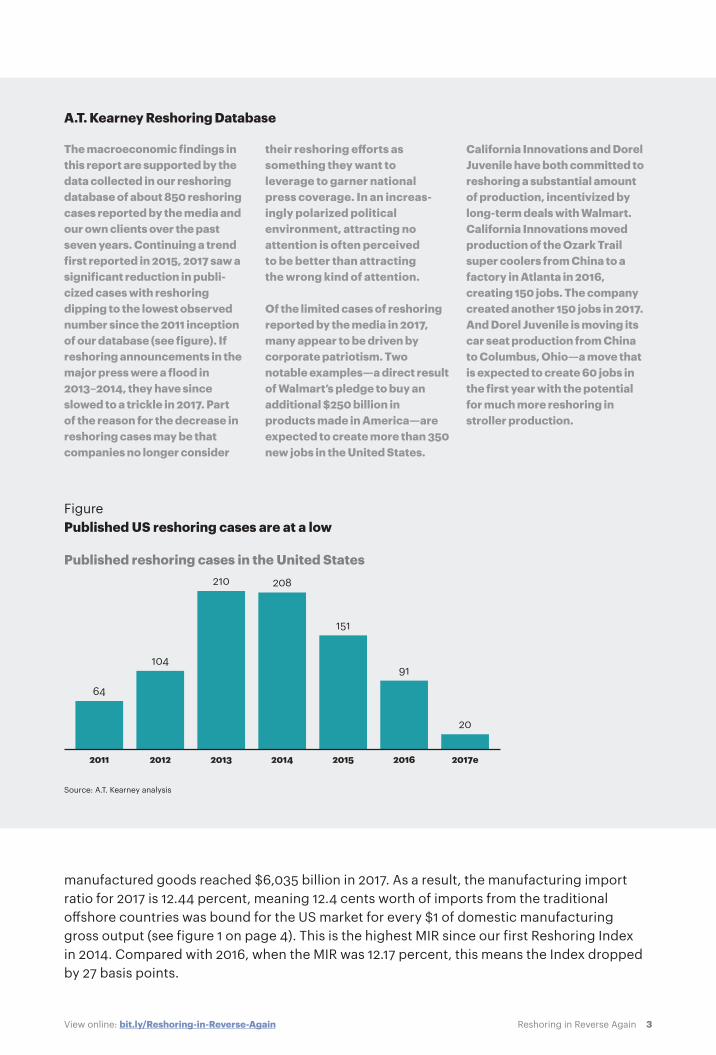
The macroeconomic findings in this report are supported by the data collected in our reshoring database of about 850 reshoring cases reported by the media and our own clients over the past seven years. Continuing a trend first reported in 2015, 2017 saw a significant reduction in publi-cized cases with reshoring dipping to the lowest observed number since the 2011 inception of our database (see figure). If reshoring announcements in the major press were a flood in 2013–2014, they have since slowed to a trickle in 2017. Part of the reason for the decrease in reshoring cases may be that companies no longer consider
their reshoring efforts as something they want to leverage to garner national press coverage. In an increas-ingly polarized political environment, attracting no attention is often perceived to be better than attracting the wrong kind of attention.
Of the limited cases of reshoring reported by the media in 2017, many appear to be driven by corporate patriotism. Two notable examples—a direct result of Walmart’s pledge to buy an additional $250 billion in products made in America—are expected to create more than 350 new jobs in the United States.
California Innovations and Dorel Juvenile have both committed to reshoring a substantial amount of production, incentivized by long-term deals with Walmart. California Innovations moved production of the Ozark Trail super coolers from China to a factory in Atlanta in 2016, creating 150 jobs. The company created another 150 jobs in 2017. And Dorel Juvenile is moving its car seat production from China to Columbus, Ohio—a move that is expected to create 60 jobs in the first year with the potential for much more reshoring in stroller production.
Published reshoring cases in the United States
FigurePublished US reshoring cases are at a low
Source: A.T. Kearney analysis
104
20122011
64
2013
210
2014
208
2015
151
2016
91
2017e
20
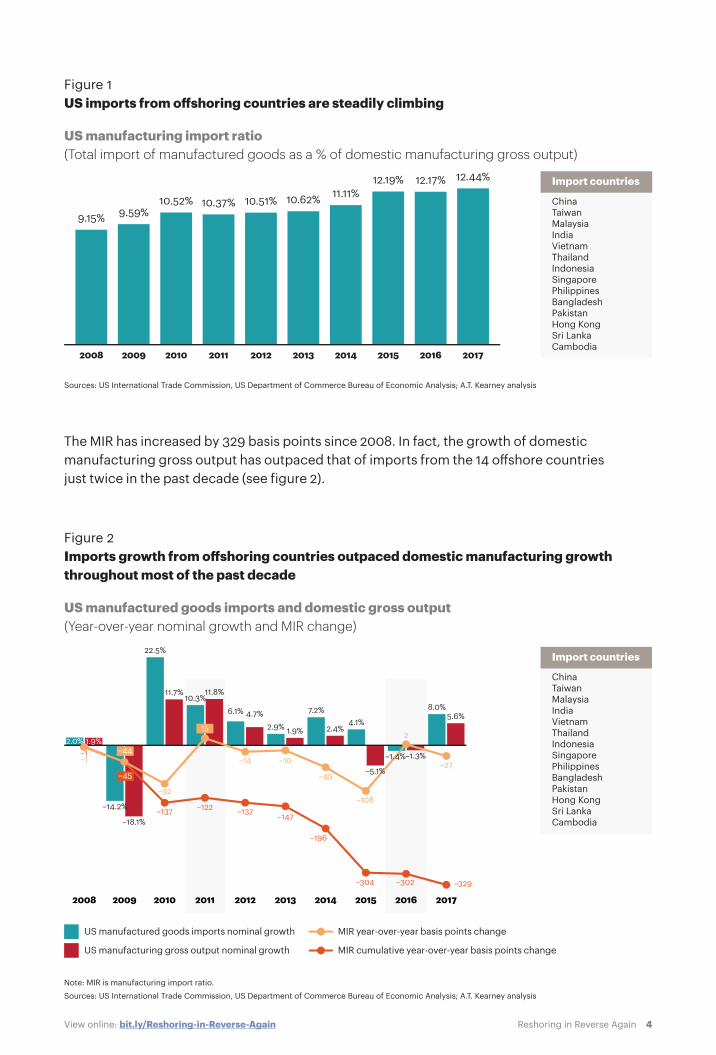
manufactured goods reached $6,035 billion in 2017. As a result, the manufacturing import ratio for 2017 is 12.44 percent, meaning 12.4 cents worth of imports from the traditional offshore countries was bound for the US market for every $1 of domestic manufacturing gross output (see figure 1 on page 4). This is the highest MIR since our first Reshoring Index in 2014. Compared with 2016, when the MIR was 12.17 percent, this means the Index dropped by 27 basis points.
4Reshoring in Reverse AgainView online: bit.ly/Reshoring-in-Reverse-Again
US manufacturing import ratio(Total import of manufactured goods as a % of domestic manufacturing gross output)
Figure 1 US imports from o�shoring countries are steadily climbing
Sources: US International Trade Commission, US Department of Commerce Bureau of Economic Analysis; A.T. Kearney analysis
10.51%
20122008
9.15%
2009
9.59%
2010
10.52%
2011
10.37%
2013
10.62%
2014
11.11%
2015
12.19%
2016
12.17%
2017
12.44%
ChinaTaiwanMalaysia India VietnamThailandIndonesiaSingaporePhilippinesBangladeshPakistanHong KongSri LankaCambodia
Import countries
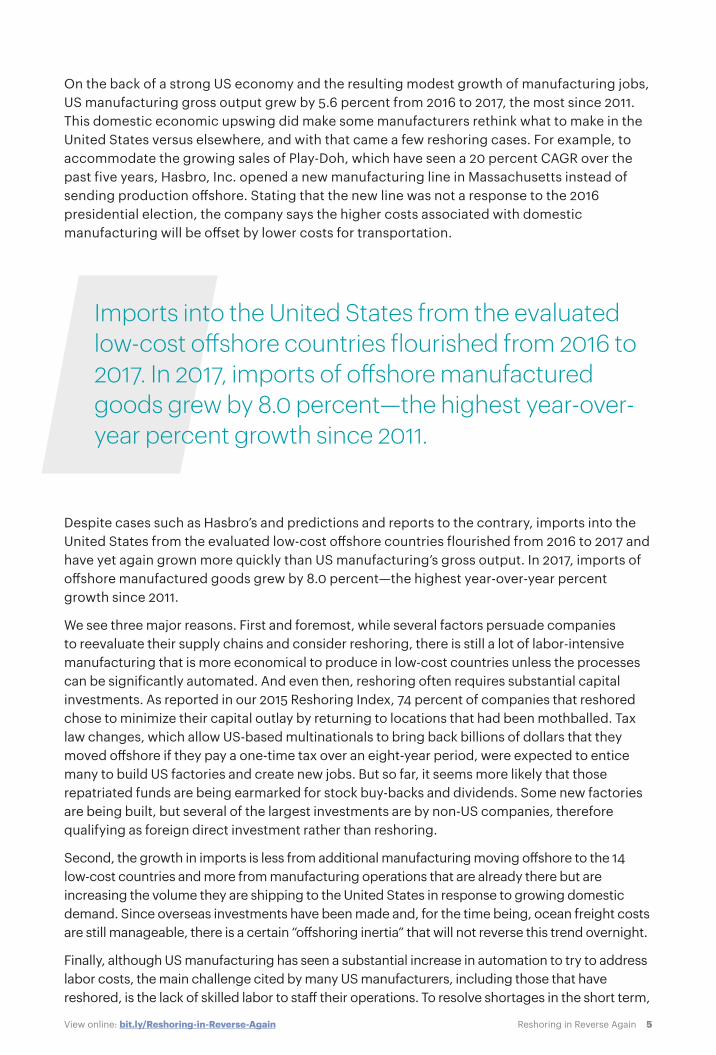
The MIR has increased by 329 basis points since 2008. In fact, the growth of domestic manufacturing gross output has outpaced that of imports from the 14 offshore countries just twice in the past decade (see figure 2).
US manufactured goods imports and domestic gross output (Year-over-year nominal growth and MIR change)
Figure 2Imports growth from o�shoring countries outpaced domestic manufacturing growth throughout most of the past decade
Note: MIR is manufacturing import ratio.
Sources: US International Trade Commission, US Department of Commerce Bureau of Economic Analysis; A.T. Kearney analysis
US manufactured goods imports nominal growth
US manufacturing gross output nominal growth
MIR year-over-year basis points change
MIR cumulative year-over-year basis points change
2017201620152014201320122011201020092008
2.0% 1.9%
–14.2%
–18.1%
22.5%
11.7%10.3%
11.8%
6.1% 4.7%2.9% 1.9%
7.2%
2.4%4.1%
8.0%5.6%
–1.3%–1
–137 –122 –137 –147
–196
–304 –302 –329
–1
–92–108
2
–44
–45
–14
–49–27–10
15
–5.1%
–1.4%
ChinaTaiwanMalaysia India VietnamThailandIndonesiaSingaporePhilippinesBangladeshPakistanHong KongSri LankaCambodia
Import countries
5Reshoring in Reverse AgainView online: bit.ly/Reshoring-in-Reverse-Again
On the back of a strong US economy and the resulting modest growth of manufacturing jobs, US manufacturing gross output grew by 5.6 percent from 2016 to 2017, the most since 2011. This domestic economic upswing did make some manufacturers rethink what to make in the United States versus elsewhere, and with that came a few reshoring cases. For example, to accommodate the growing sales of Play-Doh, which have seen a 20 percent CAGR over the past five years, Hasbro, Inc. opened a new manufacturing line in Massachusetts instead of sending production offshore. Stating that the new line was not a response to the 2016 presidential election, the company says the higher costs associated with domestic manufacturing will be offset by lower costs for transportation.
Imports into the United States from the evaluated low-cost offshore countries flourished from 2016 to 2017. In 2017, imports of offshore manufactured goods grew by 8.0 percent—the highest year-over-year percent growth since 2011.
Despite cases such as Hasbro’s and predictions and reports to the contrary, imports into the United States from the evaluated low-cost offshore countries flourished from 2016 to 2017 and have yet again grown more quickly than US manufacturing’s gross output. In 2017, imports of offshore manufactured goods grew by 8.0 percent—the highest year-over-year percent growth since 2011.
We see three major reasons. First and foremost, while several factors persuade companies to reevaluate their supply chains and consider reshoring, there is still a lot of labor-intensive manufacturing that is more economical to produce in low-cost countries unless the processes can be significantly automated. And even then, reshoring often requires substantial capital investments. As reported in our 2015 Reshoring Index, 74 percent of companies that reshored chose to minimize their capital outlay by returning to locations that had been mothballed. Tax law changes, which allow US-based multinationals to bring back billions of dollars that they moved offshore if they pay a one-time tax over an eight-year period, were expected to entice many to build US factories and create new jobs. But so far, it seems more likely that those repatriated funds are being earmarked for stock buy-backs and dividends. Some new factories are being built, but several of the largest investments are by non-US companies, therefore qualifying as foreign direct investment rather than reshoring.
Second, the growth in imports is less from additional manufacturing moving offshore to the 14 low-cost countries and more from manufacturing operations that are already there but are increasing the volume they are shipping to the United States in response to growing domestic demand. Since overseas investments have been made and, for the time being, ocean freight costs are still manageable, there is a certain “offshoring inertia” that will not reverse this trend overnight.
Finally, although US manufacturing has seen a substantial increase in automation to try to address labor costs, the main challenge cited by many US manufacturers, including those that have reshored, is the lack of skilled labor to staff their operations. To resolve shortages in the short term,
6Reshoring in Reverse AgainView online: bit.ly/Reshoring-in-Reverse-Again
several companies have gotten creative, for example, by looking to Germany, where a surge of retirees and a slowing of immigration have put a strain on the supply of skilled labor. With German technical schools (fachschule) as a model, some US companies are partnering with community colleges to offer vocational training in areas such as additive manufacturing and 3D printing, where the shortage of knowledgeable workers is particularly glaring. Some companies, such as General Electric, go as far as funding the purchase of equipment for educational institutions to expose the future workforce to additive manufacturing at an early age. Other companies have created co-ops, apprenticeships, and internships, starting as early as high school.
Unfortunately, not all companies have the resources to set up these programs. So instead of providing tax incentives to attract businesses that may then struggle to find quality labor, states could divert funds to train workers and then use the availability of skilled labor as a point of differentiation in the competition to attract investment and jobs. This training would provide companies with the skills they need in the short term and help employees stay up to date on the latest technologies, which will help them in the long term.
It is yet to be seen if the potential introduction of import tariffs and duties targeted at some offshore countries will change the dynamic of companies’ manufacturing decisions, but if it does result in more companies reshoring their operations, the skills availability issue will move even more into the spotlight, especially since there will already be 3.5 million manufacturing job vacancies over the next decade due to, for example, retirements, according to the National Association of Manufacturers.
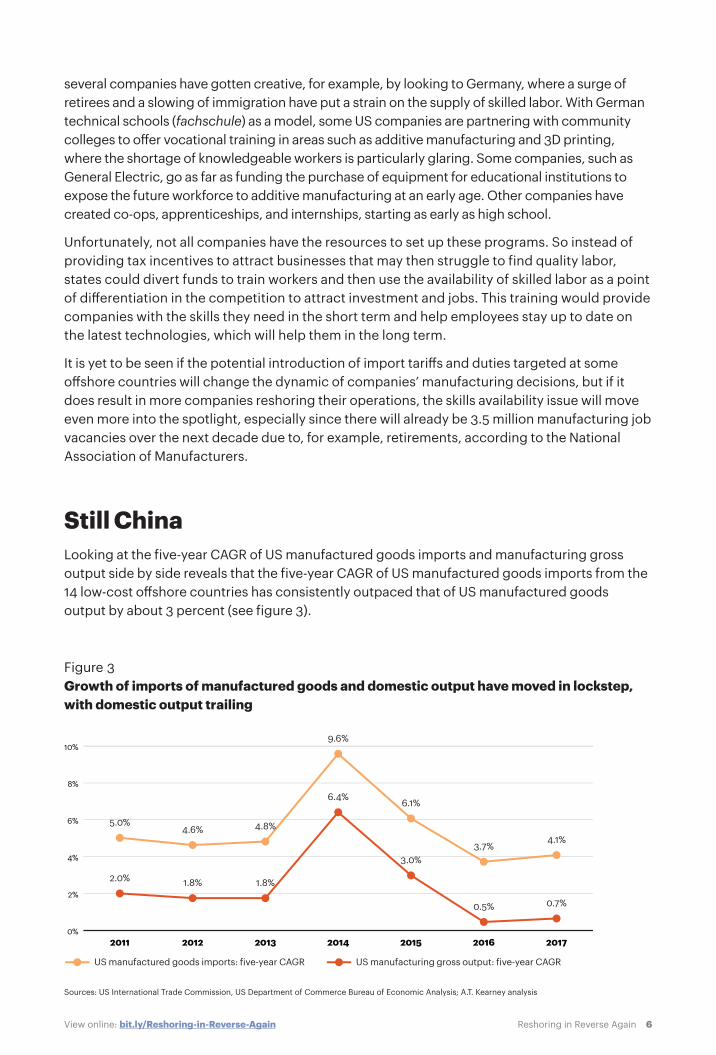
Still China Looking at the five-year CAGR of US manufactured goods imports and manufacturing gross output side by side reveals that the five-year CAGR of US manufactured goods imports from the 14 low-cost offshore countries has consistently outpaced that of US manufactured goods output by about 3 percent (see figure 3).
Figure 3Growth of imports of manufactured goods and domestic output have moved in lockstep, with domestic output trailing
Sources: US International Trade Commission, US Department of Commerce Bureau of Economic Analysis; A.T. Kearney analysis
US manufacturing gross output: five-year CAGRUS manufactured goods imports: five-year CAGR
0%
2%
4%
6%
8%
10%
2017201620152014201320122011
0.7%0.5%
3.0%
6.4%
1.8%1.8%2.0%
4.1%3.7%
6.1%
9.6%
4.8%4.6%5.0%
7Reshoring in Reverse AgainView online: bit.ly/Reshoring-in-Reverse-Again
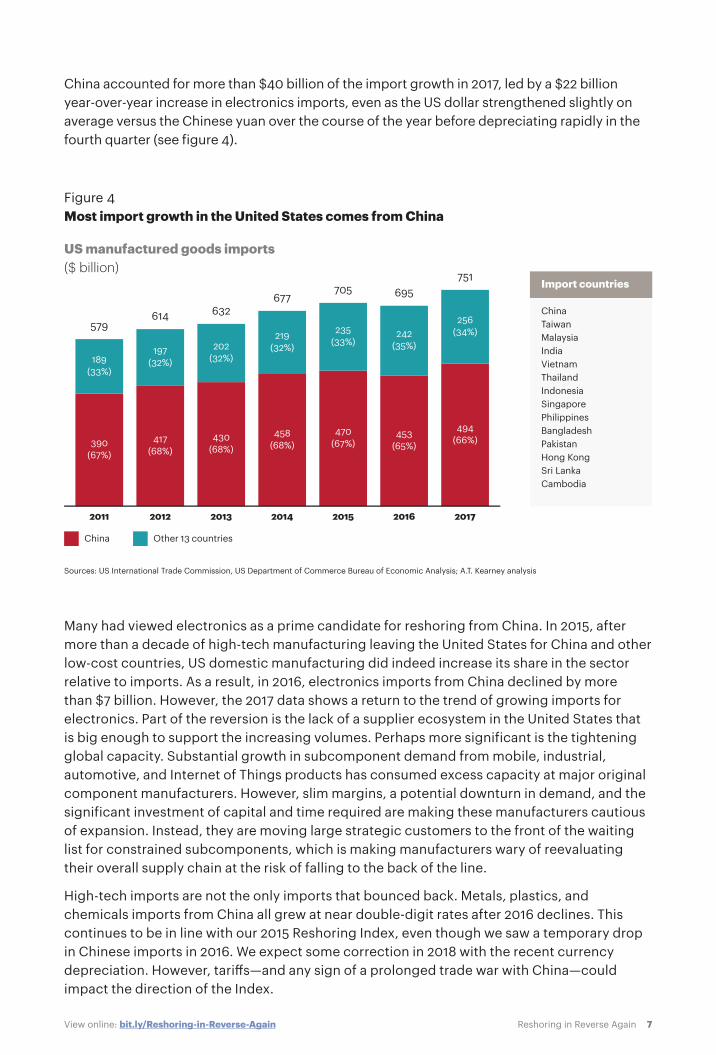
China accounted for more than $40 billion of the import growth in 2017, led by a $22 billion year-over-year increase in electronics imports, even as the US dollar strengthened slightly on average versus the Chinese yuan over the course of the year before depreciating rapidly in the fourth quarter (see figure 4).
US manufactured goods imports($ billion)
Figure 4Most import growth in the United States comes from China
Sources: US International Trade Commission, US Department of Commerce Bureau of Economic Analysis; A.T. Kearney analysis
614
20122011
579
2013
632
2014
677
2015
705
2016
695
2017
751
197(32%)189
(33%)
202(32%)
219(32%)
235(33%)
242(35%)
256(34%)
417(68%)
390(67%)
430(68%)
458(68%)
470(67%)
453(65%)
494(66%)
ChinaTaiwanMalaysia India VietnamThailandIndonesiaSingaporePhilippinesBangladeshPakistanHong KongSri LankaCambodia
Import countries
Other 13 countriesChina
Many had viewed electronics as a prime candidate for reshoring from China. In 2015, after more than a decade of high-tech manufacturing leaving the United States for China and other low-cost countries, US domestic manufacturing did indeed increase its share in the sector relative to imports. As a result, in 2016, electronics imports from China declined by more than $7 billion. However, the 2017 data shows a return to the trend of growing imports for electronics. Part of the reversion is the lack of a supplier ecosystem in the United States that is big enough to support the increasing volumes. Perhaps more significant is the tightening global capacity. Substantial growth in subcomponent demand from mobile, industrial, automotive, and Internet of Things products has consumed excess capacity at major original component manufacturers. However, slim margins, a potential downturn in demand, and the significant investment of capital and time required are making these manufacturers cautious of expansion. Instead, they are moving large strategic customers to the front of the waiting list for constrained subcomponents, which is making manufacturers wary of reevaluating their overall supply chain at the risk of falling to the back of the line.
High-tech imports are not the only imports that bounced back. Metals, plastics, and chemicals imports from China all grew at near double-digit rates after 2016 declines. This continues to be in line with our 2015 Reshoring Index, even though we saw a temporary drop in Chinese imports in 2016. We expect some correction in 2018 with the recent currency depreciation. However, tariffs—and any sign of a prolonged trade war with China—could impact the direction of the Index.
8Reshoring in Reverse AgainView online: bit.ly/Reshoring-in-Reverse-Again
A Reshoring SetbackThe 2017 Reshoring Index shows that reshoring continues to be a drop in the bucket, and US manufacturers are not exactly coming back in droves. Although 2017 was a strong year for US manufacturing, both imports and domestic gross output of manufactured goods grew at rates that have not been matched since 2011. Despite strong growth in US gross output of manufactured goods, imports grew much faster. So relatively speaking, the proportion of reshoring has become even smaller. The $1.5 trillion tax cut that President Donald Trump signed into law at the end of 2017, if anything, is likely to only exacerbate this. The combination of an overstimulated economy and a jobless rate that is the lowest it has been in more than a decade will likely result in even more imports when domestic manufacturing can’t keep up with growing consumer demand.
Making the picture even more complex, the traditional offshoring countries are starting to compete with American manufacturing in new areas. For example, China is no longer only a production base for developed countries’ brands. More products designed and marketed by Chinese companies are starting to appeal to American consumers, including Huawei’s telecom products, Anker electronics, and Haier home appliances. Furthermore, Chinese automotive giant GAC Motor is looking to enter the US market for SUVs in 2019 in a move that echoes earlier efforts by Japanese and South Korean manufacturers. If this trend continues, Chinese imports will not be purely about low cost, but also about product design and features. This poses additional challenges to US manufacturers as it could attack their competitive position in the domestic market.
Of course, the global economy is an oil tanker rather than a speedboat, so it’s possible that the political posturing, potential tariffs, and tax cuts could turn the tide over time. But with many unknowns in trade policy, companies must understand all potential futures and develop contingency plans, including reshoring.
Authors
Patrick Van den Bossche, partner, Washington, D.C. [email protected]
Brooks Levering, vice president, New York [email protected]
Johan Gott, principal, Washington, D.C. [email protected]
Alex Abraham, consultant, New York [email protected]
About the A.T. Kearney US Reshoring Index
When we launched the Reshoring Index in 2014, much of the evidence for reshoring was anecdotal, often highlighting no more than a handful of high-profile cases, and the conclusions seemed to reflect wishful thinking or political agendas more than hard facts. Even the best research focused more on promulgating models of future reshoring than on accurately assessing reality. So our objectives were simple: find out what US manufacturers are doing, and separate the hype from the reality. The Index addresses these objectives by aggregating actual US manufacturing and import data to track what is really happening while providing a simple but powerful indicator of where manufacturing for the US market is going.
A.T. Kearney Korea LLC is a separate and independent legal entity operating under the A.T. Kearney name in Korea.
A.T. Kearney operates in India as A.T. Kearney Limited (Branch Office), a branch office of A.T. Kearney Limited, a company organized under the laws of England and Wales.
© 2018, A.T. Kearney, Inc. All rights reserved.
For more information, permission to reprint or translate this work, and all other correspondence, please email: [email protected].
The signature of our namesake and founder, Andrew Thomas Kearney, on the cover of this document represents our pledge to live the values he instilled in our firm and uphold his commitment to ensuring “essential rightness” in all that we do.
A.T. Kearney is a leading global management consulting firm with offices in more than 40 countries. Since 1926, we have been trusted advisors to the world’s foremost organizations. A.T. Kearney is a partner-owned firm, committed to helping clients achieve immediate impact and growing advantage on their most mission-critical issues. For more information, visit www.atkearney.com.
Americas
Asia Pacific
Europe
Middle East and Africa
AtlantaBogotáBostonCalgary Chicago
DallasDetroitHoustonMexico CityNew York
San FranciscoSão PauloTorontoWashington, D.C.
BangkokBeijingBrisbaneHong KongJakarta
Kuala LumpurMelbourneMumbaiNew DelhiPerth
SeoulShanghaiSingaporeSydneyTokyo
Abu DhabiDoha
DubaiIstanbul
JohannesburgRiyadh
AmsterdamBerlinBrusselsBucharestCopenhagenDüsseldorfLisbon
LjubljanaLondonMadridMilanMoscowMunichOslo
ParisPragueRomeStockholmViennaWarsawZurich