Embed Size (px)
Citation preview
Residual Effects of No-Till Crop Residues on Corn Yieldand Nitrogen Uptake
M. S. Maskina, J. F. Power,* J. W. Doran, and W. W. Wilhelm
ABSTRACTThe residual effects of crop residues on N availability and crop
growth are largely unknown. A field experiment was conducted from1986 through 1988 at Lincoln, NE, to determine the residual effectson no-till corn (Zea mays L.) production and N uptake of 0, 50, 100,and 150% of the amount of crop residues produced by the previouscrop during the previous 5 yr. These effects were evaluated with andwithout tillage (disking), N fertilizer (60 kg N ha-1), and hairy vetch(Vicia villosa Roth ssp. villosa, 'Madison') winter cover crop. Increas-ing the previous crop residue rate increased organic C, total N, andNOj-N in the upper 30 cm of soil as much as 10, 12, and 66%,respectively. Growth and N uptake by corn (3-yr average) generallyincreased as previous residue rate increased. Corn grain and stoverproduction was 17 and 25% greater for the highest compared withthe lowest previous residue rate. Uptake of indigenous soil N, but notfertilizer N, also increased as previous residue rate increased. Covercrops generally increased growth and N uptake with no fertilizer, buthad little effect with N fertilizer. Soil properties, crop growth, and Nuptake generally were not affected by tillage or interactions amongthe variables. These results indicate that increasing no-till crop residuerates increased the capability of this soil to provide N to growing cropsfor many years. It appears this effect is somewhat self-perpetuating.
CROP FERTILIZER REQUIREMENT and soil nutrientavailability are influenced by soil fertility and
crop residue management. Crop residues contain ap-preciable plant nutrients and, therefore, have contrib-uted to the maintenance of soil productivity if returnedto the soil (Holland and Coleman, 1987; Paul andJuma, 1981). Returning residues also helps maintainsoil organic matter, which is important for soil struc-ture, soil and water conservation, and soil microbialand faunal activity. Furthermore, the microenviron-ment in residue-covered soils is usually less oxidativethan where residues are removed or incorporated(Doran, 1980). Prolonged removal or burning of cropresidues usually decreases nutrient and organic mattercontent (Hooker and Schepers, 1984; Unger, 1973).
The effects of clean tillage and soil erosion on de-creased soil organic matter content and loss of pro-ductivity have been documented frequently (Prasadand Power, 1991; Unger and McCalla, 1980). Theseadverse effects are largely overcome by use of reducedor no tillage and by use of cover crops (Doran et al.,1984; Smith et al., 1987; Unger and McCalla, 1980).Stratification of crop residues and conservation of soilorganic matter near the soil surface with reduced orno-till management are paralleled by greater soil mi-crobial biomass in these layers, which causes greaterimmobilization of fertilizer N, compared with plowing
M.S. Maskina, Punjab Agricultural Univ., Ludhiana, Punjab, In-dia; J.F. Power, J.W. Doran, and W.W. Wilhelm, USDA-ARS,Univ. of Nebraska, Lincoln, NE 68583. Published as Paper no.10438, Journal Series, Nebraska Agricultural Research Division,Lincoln. Received 27 Apr. 1992. *Corresponding author.
Published in Soil Sci. Soc. Am. J. 57:1555-1560 (1993).
or shallow tillage (Carter and Rennie, 1987; Doranand Smith, 1987). In Kansas, Hooker and Schepers(1984) showed greater soil N and C and plant N avail-ability after more than 10 yr of adding crop residuesvs. burning. In Montana, Black (1973) showed thataddition of wheat (Triticum aestivium L.) straw alsoincreased soil N and C and mineralizable N. Use oflegume cover crops likewise adds organic matter tosoils and affects soil N transformations (Janzen et al.,1990; Varco et al., 1989).
A number of studies have been published in whichthe effects of tillage, cover crops, N fertilization, andsoil organic matter individually influenced N availa-bility and uptake by a crop. Some studies have alsoinvestigated the effects of combinations of several ofthese factors, but few have simultaneously investi-gated the interactions between more than two of thesefactors that affect N availability and uptake. In nature,however, there are numerous environmental and cul-tural factors operating and interacting simultaneouslythat affect soil N availability. Consequently, we stud-ied the simultaneous effects and interactions of tillage,cover crop, N fertilization, and soil organic matterlevel on N availability and uptake by dryland corn.Differences in soil organic matter content were estab-lished in an earlier 5-yr experiment (1981-1985) inwhich crop residues were added to no-till plots at ratesof 0, 50, 100, and 150% of the quantity of residuesproduced by the previous crop (Power et al., 1986;Wilhelm et al., 1986).
MATERIALS AND METHODSThis study was conducted from 1986 through 1988 on a
Crete-Butler silty clay loam (fine, montmorillonitic, mesicPachic Argiustoll-Abruptic Argiaquoll) near Lincoln, NE. Cli-matic is continental with typically 70% of the average 717 mmof annual precipitation falling between April and September.However, rainfall distribution is highly variable. The experi-mental site is nearly level (0.2% slope).
In an earlier 5-yr experiment, we returned either 0, 50, 100,or 150% of the crops residues produced by the previous crop(either corn or soybean [Glycine max (L.) Merr.]) to the soilsurface in a no-till production system (Power et al., 1986;Wilhelm et al., 1986). In the 3-yr experiment reported here,which utilized the same plots as the previous 5-yr residue rateexperiment, we discontinued the variable crop residue rates(that is, all residues produced by the previous crop were lefton each plot), and we measured the residual effects of theprevious no-till residue rates on crop growth and soil proper-ties. In addition, we determined the effects of tillage (no-tilland tilled), winter legume cover crop (hairy vetch), and fer-tilizer N (0 and 60 kg N ha-1) on dryland corn production foreach of the previous residue rates. The experimental units werearranged as split plots within a randomized complete blockdesign. Main treatments were tillage, with previous residuerates as subblocks. The N fertilizer and cover crop treatmentswere randomized within each previous residue rate plot, in 9.1by 9.1 m subplots replicated four times.
At the initiation and several times during the experiment,soil samples were collected in the spring for laboratory char-
1555
1556 SOIL SCI. SOC. AM. J., VOL. 57, NOVEMBER-DECEMBER 1993
Table 1. Monthly precipitation and mean temperature during1986, 1987, and 1988 growing seasons at Lincoln, NE.
Precipitation TemperatureNor- Nor-
Month 1986 1987 1988 mal 1986 1987 1988 mal
AprilMayJuneJulyAugustSeptemberOctober
15975
113141159147154
62 62866947
1933075
95185161
1401
6996
10891878251
12.718.625.226.722.320.912.7
o
12.819.925.227.423.620.810.3
C ——10.520.326.726.626.720.110.5
11.317.523.125.824.719.913.2
Table 2. Soil characteristics at two dates as influenced by thelevel of crop residues returned to the soil in the 5 yr previousto this study.
LSDSoil properties 0% 50% 100% 150% (0.10)
0-30 cm, collected April 1986Organic matter, g kg-Total N, g kg-1
NO3-N, mg kg-1
NH4-N, mg kg-1
24.71.234.52
12.52
25.31.146.86
17.42
26.2 27.4 2.21.30 1.37 0.125.28 7.51 1.40
14.35 11.75 3.170-7.5 cm, collected October 1987
Soil bulk density, Mg m~3
Microbial biomass, kg ha"1
Total soil organic C, g kg-1
Total N, g kg-1
Water-holding capacity, g kg-
1.36 1.31 1.28 1.27142 246 164 165
16.5 16.6 17.3 18.91.38 1.41 1.47 1.56
540 570 580 560
NSNS1.80.10
30
acterization of organic matter content, total N, microbial bio-mass, and mineralized N, using methods outlined in Page etal. (1982). Bulk density and total water-holding capacity werealso determined (Klute et al., 1986).
Corn (cv. Nebraska 611) was planted in 0.76-m row spacingat 42 000, 37 500 and 39 700 kernels ha-1 on 14 May 1986,9 June 1987, and 12 May 1988, respectively. Appropriate cornplots were overseeded (broadcast) with 30 kg hairy vetch seedha-1 near 1 September each fall. In April 1987, hairy vetchgrowth was very poor due to excessive March and early Aprilrainfall. Hence soybean, a substitute legume cover crop, wasplanted on 27 April and killed and incorporated on 8 June. ForN-fertilized subplots, NH4NO3 was broadcast at 60 kg N ha"1
within 1 wk of corn planting. In 1987, 15N-depleted NH4N03was substituted on one-half of each subplot. This process wasrepeated in 1988 on the other half of N-fertilized subplots.Legume cover crops were killed with 2,4-D amine (amine saltof 2,4-dichlorophenoxyacetic acid) and dicamba (2-methoxy-3-6-dichlorobenzoic acid) in no-till plots and were incorporatedby disking in tilled plots 1 to 2 d before corn planting. Biomassand N accumulation in the aboveground portion of legumecover.crops were determined by harvesting four 0.5-m2 quadratper plot before killing the legume. At maturity, grain and stoveryields were determined by hand harvesting 5.0 m2 plot-1. Plantsamples were analyzed for total N by modified micro-Kjeldahldigestion followed by NH4
f determination using automated co-lorometric procedures (Schuman et al., 1973). The isotopicratio of 15N and 14N in plant and soil samples was determinedby mass spectrometry (Schepers et al., 1989). Nitrogen contentderived from fertilizer (NDFF) was calculated, and from thesedata uptake of soil and fertilizer N was determined. An analysisof variance was made on all data collected, and means were
Table 3. Effect of previous crop residue levels on growth andN accumulation in cover crops.
Year 100% 150% LSD (0.10)kg ha~
Total dry biomass of winter legume19861987f1988Avg.
640660
1200830
810680
16401040
850520
1450940
1250590
17501200
390NS
360350
N accumulation in aboveground portion198619871988Avg.
26.831.732.726.2
30.520.746.432.5
32.616.241.530.1
47.218.542.236.0
14.2NS8.89.3
t Soybean grown as cover crop.
separated by calculating least significant differences at P =0.10.
RESULTSGrowing conditions for corn during the 3 yr of this
study varied widely (Table 1). Precipitation distributionand air temperature regimes in 1986 were favorable fordryland corn production and grain yields were high. In1987, brief periods of drought and high temperaturesoccurred between tasselling and maturity, resulting in amore typical year for dryland corn production in thisregion. Precipitation in June, July, and August 1988 wasbelow the long-term average, which, when coupled withabnormally high air temperatures, severely stressed thecrop during pollination and grain fill.
Before starting the experiment in April 1986, surfacesoil samples were analyzed to evaluate the effect on soilproperties of crop residues applied in the previous study(Table 2). Average quantity of crop residues added an-nually the previous 5 yr varied from 0 to about 6 Mgha"1 (150% rate). Addition of 150% crop residues in-creased soil organic matter by 10%, total N by 12%, andNO3-N by 66% over respective values for complete res-idue removal (0%). Likewise, at later soil sampling dates(Table 2), increased rates of previous crop residues tendedto positively influence several soil properties associatedwith enhanced crop yields, such as microbial biomass,water-holding capacity, and total water-filled pore space(Doran and Smith, 1987; Prasad and Power, 1991). Ef-fects of previous crop residue rate on soil bulk densitywere generally not significant. Interaction between pre-vious crop residue treatments and the cover crop, fertil-izer N rate, or tillage treatment imposed during this studywere seldom statistically significant for the parametersinvestigated.
Average total biomass of hairy vetch was significantlyhigher for the 150% than for 0% previous residue ratesduring 1986 and 1988 (Table 3). In 1987, however, growthof soybean (substituted as a cover crop) was not affectedby previous crop residue treatment. Compared with the0% previous residue treatment, total dry matter produc-tion by hairy vetch averaged 33% greater for the 50%treatment, 25% greater for the 100% treatment, and 63%greater for the 150% treatment. Likewise total N accu-
MASKINA ET AL.: NO-TILL CROP RESIDUE RESIDUAL EFFECTS 1557
Table 4. Grain and stover dry weights (3-yr average), as affected by previous residue rate and N fertilization.Previousresiduerate
Grain Stover
0 kg N ha- 60 kg N ha-' Avg. 0 kg N ha- 60 kg N ha- Avg.kg ha~
050
100150Avg.LSD (0.10)
39504220437049004360
440
52905510529058305480
46204870483053604920380
25803110314034803080
490
35104000355041403800
30503560335038103440480
mulation in hairy vetch dry matter was 29, 25, and 50%greater for these three respective previous residue levels.The only significant interaction for both hairy vetch dryweight and N uptake resulted from greater response toincreased previous 5 yr residue rate for no-till than fortilled plots (data not shown). Concentration of N in covercrops was not influenced by previous crop residue treat-ment.
Previous crop residue rate significantly increased the3-yr average yield of corn grain and stover over all Nfertilizer, tillage, and cover crop treatments (Table 4).Grain and stover yields were 16 and 25% greater for thehighest (150% level) than the lowest (0% level) previouscrop residue treatments. Grain yields were significantlyaffected by previous crop residue rate, N fertilization,and year, but not by tillage or winter cover crop. Meangrain yields in 1986 were 6500 kg ha-1, 4950 kg ha-1
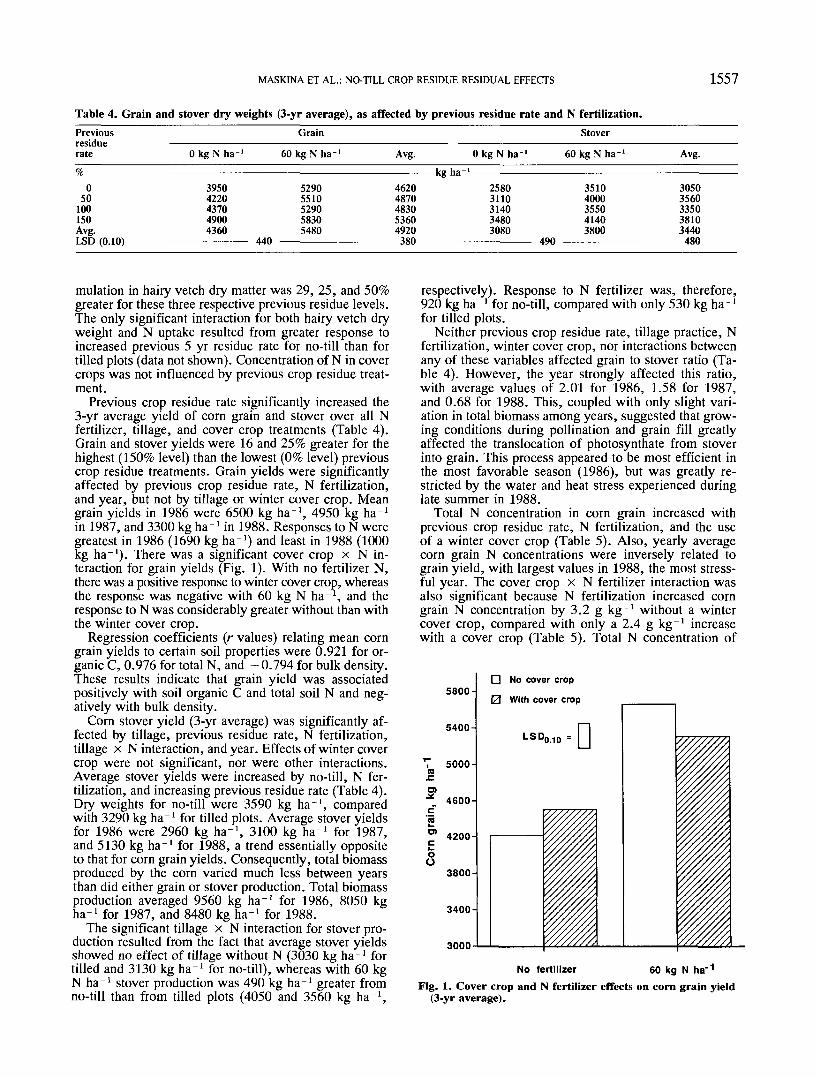
in 1987, and 3300 kg ha-1 in 1988. Responses to N weregreatest in 1986 (1690 kg ha-1) and least in 1988 (1000kg ha"1). There was a significant cover crop x N in-teraction for grain yields (Fig. 1). With no fertilizer N,there was a positive response to winter cover crop, whereasthe response was negative with 60 kg N ha"1, and theresponse to N was considerably greater without than withthe winter cover crop.
Regression coefficients (r values) relating mean corngrain yields to certain soil properties were 0.921 for or-ganic C, 0.976 for total N, and - 0.794 for bulk density.These results indicate that grain yield was associatedpositively with soil organic C and total soil N and neg-atively with bulk density.
Corn stover yield (3-yr average) was significantly af-fected by tillage, previous residue rate, N fertilization,tillage x N interaction, and year. Effects of winter covercrop were not significant, nor were other interactions.Average stover yields were increased by no-till, N fer-tilization, and increasing previous residue rate (Table 4).Dry weights for no-till were 3590 kg ha-1, comparedwith 3290 kg ha"1 for tilled plots. Average stover yieldsfor 1986 were 2960 kg ha-1, 3100 kg ha-1 for 1987,and 5130 kg ha"1 for 1988, a trend essentially oppositeto that for corn grain yields. Consequently, total biomassproduced by the corn varied much less between yearsthan did either grain or stover production. Total biomassproduction averaged 9560 kg ha-1 for 1986, 8050 kgha-1 for 1987, and 8480 kg ha-1 for 1988.
The significant tillage x N interaction for stover pro-duction resulted from the fact that average stover yieldsshowed no effect of tillage without N (3030 kg ha-1 fortilled and 3130 kg ha"1 for no-till), whereas with 60 kgN ha-1 stover production was 490 kg ha"1 greater fromno-till than from tilled plots (4050 and 3560 kg ha-1,
respectively). Response to N fertilizer was, therefore,920 kg ha"1 for no-till, compared with only 530 kg ha-1
for tilled plots.Neither previous crop residue rate, tillage practice, N
fertilization, winter cover crop, nor interactions betweenany of these variables affected grain to stover ratio (Ta-ble 4). However, the year strongly affected this ratio,with average values of 2.01 for 1986, 1.58 for 1987,and 0.68 for 1988. This, coupled with only slight vari-ation in total biomass among years, suggested that grow-ing conditions during pollination and grain fill greatlyaffected the translocation of photosynthate from stoverinto grain. This process appeared to be most efficient inthe most favorable season (1986), but was greatly re-stricted by the water and heat stress experienced duringlate summer in 1988.
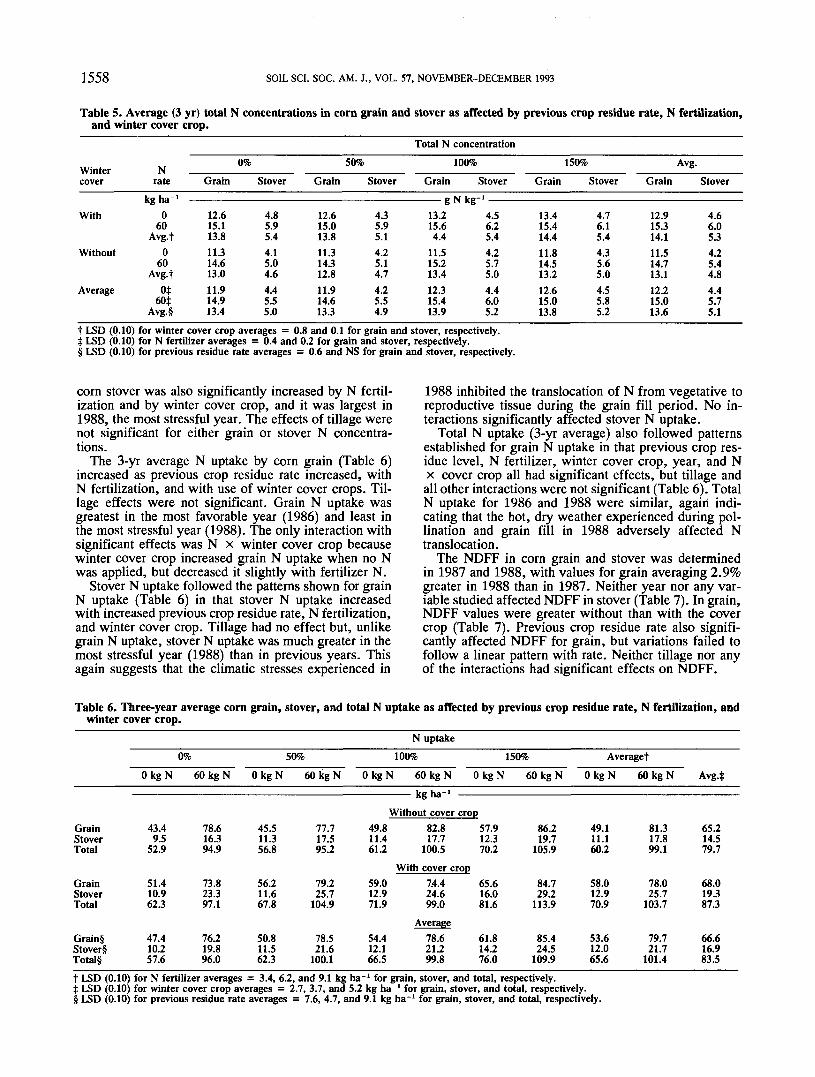
Total N concentration in corn grain increased withprevious crop residue rate, N fertilization, and the useof a winter cover crop (Table 5). Also, yearly averagecorn grain N concentrations were inversely related tograin yield, with largest values in 1988, the most stress-ful year. The cover crop x N fertilizer interaction wasalso significant because N fertilization increased corngrain N concentration by 3.2 g kg-1 without a wintercover crop, compared with only a 2.4 g kg"1 increasewith a cover crop (Table 5). Total N concentration of
5800-
5400-
3000
Q No cover crop0 With cover crop
No fertilizer 60 kg N ha'1
Fig. 1. Cover crop and N fertilizer effects on corn grain yield(3-yr average).
1558 SOIL SCI. SOC. AM. J., VOL. 57, NOVEMBER-DECEMBER 1993
Table 5. Average (3 yr) total N concentrations in corn grain and stover as affected by previous crop residue rate, N fertilization,and winter cover crop.
Total N concentration50% 100% 150%
Wintercover
With
Without
Average
Nrate
kg ha-'0
60Avg.t
060
Avg.fot
60|:Avg.§
Grain
12.615.113.811.314.613.011.914.913.4
Stover
4.85.95.44.15.04.64.45.55.0
Grain
12.615.013.811.314.312.811.914.613.3
Stover
4.35.95.14.25.14.74.25.54.9
Grain
——— g N13.215.64.4
11.515.213.412.315.413.9
Stover
kg-' ————4.56.25.44.25.75.04.46.05.2
Grain
13.415.414.411.814.513.212.615.013.8
Stover
4.76.15.44.35.65.04.55.85.2
Grain
12.915.314.111.514.713.112.215.013.6
'B-
Stover
4.66.05.34.25.44.84.45.75.1
t LSD (0.10) for winter cover crop averages = 0.8 and 0.1 for grain and stover, respectively.t LSD (0.10) for N fertilizer averages = 0.4 and 0.2 for grain and stover, respectively.§ LSD (0.10) for previous residue rate averages = 0.6 and NS for grain and stover, respectively.
corn stover was also significantly increased by N fertil-ization and by winter cover crop, and it was largest in1988, the most stressful year. The effects of tillage werenot significant for either grain or stover N concentra-tions.
The 3-yr average N uptake by corn grain (Table 6)increased as previous crop residue rate increased, withN fertilization, and with use of winter cover crops. Til-lage effects were not significant. Grain N uptake wasgreatest in the most favorable year (1986) and least inthe most stressful year (1988). The only interaction withsignificant effects was N x winter cover crop becausewinter cover crop increased grain N uptake when no Nwas applied, but decreased it slightly with fertilizer N.
Stover N uptake followed the patterns shown for grainN uptake (Table 6) in that stover N uptake increasedwith increased previous crop residue rate, N fertilization,and winter cover crop. Tillage had no effect but, unlikegrain N uptake, stover N uptake was much greater in themost stressful year (1988) than in previous years. Thisagain suggests that the climatic stresses experienced in
1988 inhibited the translocation of N from vegetative toreproductive tissue during the grain fill period. No in-teractions significantly affected stover N uptake.
Total N uptake (3-yr average) also followed patternsestablished for grain N uptake in that previous crop res-idue level, N fertilizer, winter cover crop, year, and Nx cover crop all had significant effects, but tillage andall other interactions were not significant (Table 6). TotalN uptake for 1986 and 1988 were similar, again indi-cating that the hot, dry weather experienced during pol-lination and grain fill in 1988 adversely affected Ntranslocation.
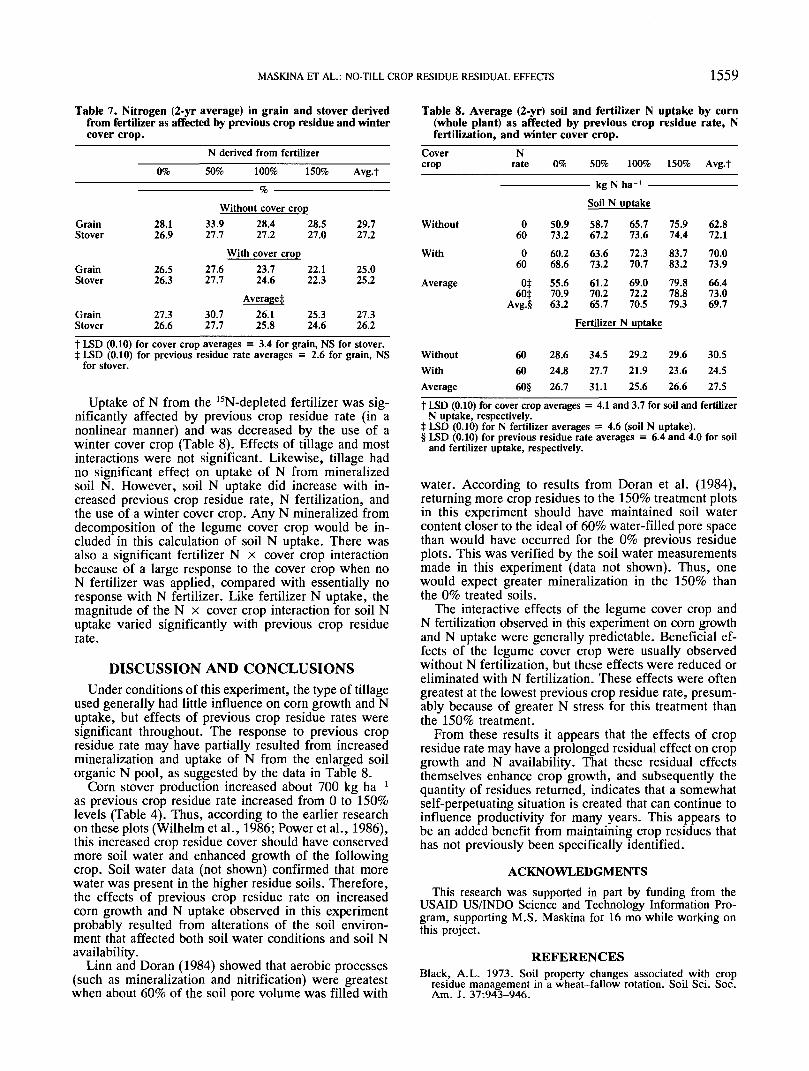
The NDFF in corn grain and stover was determinedin 1987 and 1988, with values for grain averaging 2.9%greater in 1988 than in 1987. Neither year nor any var-iable studied affected NDFF in stover (Table 7). In grain,NDFF values were greater without than with the covercrop (Table 7). Previous crop residue rate also signifi-cantly affected NDFF for grain, but variations failed tofollow a linear pattern with rate. Neither tillage nor anyof the interactions had significant effects on NDFF.
Table 6. Three-year average corn grain, stover, and total N uptake as affected by previous crop residue rate, N fertilization, andwinter cover crop.
N uptake
GrainStoverTotal
50% 100% 150% AveragefO k g N 60kgN O k g N 60 kg N 0 kg N 60 kg N 0 kg N 60 kg N 0 kg N 60 kg N Avg4
kg ha-1
Without cover crop43.4 78.6 45.5 77.7 49.8 82.8 57.99.5 16.3 11.3 17.5 11.4 17.7 12.3
52.9 94.9 56.8 95.2 61.2 100.5 70.2With cover crop
86.219.7
105.9
49.111.160.2
81.317.899.1
65.214.579.7
GrainStoverTotal
Grain§Stover§Total§
51.410.962.3
47.410.257.6
73.823.397.1
76.219.896.0
56.211.667.8
50.811.562.3
79.225.7
104.9
78.521.6
100.1
59.012.971.9
54.412.166.5
7,4.424.699.0
Average78.621.299.8
65.616.081.6
61.814.276.0
84.729.2
113.9
85.424.5
109.9
58.012.970.9
53.612.065.6
78.025.7
103.7
79.721.7
101.4
68.019.387.3
66.616.983.5
t LSD (0.10) for N fertilizer averages = 3.4, 6.2, and 9.1 kg ha"1 for grain, stover, and total, respectively.t LSD (0.10) for winter cover crop averages = 2.7, 3.7, and 5.2 kg ha~' for grain, stover, and total, respectively.§ LSD (0.10) for previous residue rate averages = 7.6, 4.7, and 9.1 kg ha"' for grain, stover, and total, respectively.
MASKINA ET AL.: NO-TILL CROP RESIDUE RESIDUAL EFFECTS 1559
Table 7. Nitrogen (2-yr average) in grain and stover derivedfrom fertilizer as affected by previous crop residue and wintercover crop.
N derived from fertilizer50% 100% 150% Avg.f
Without cover cropGrainStover
GrainStover
GrainStover
28.126.9
26.526.3
27.326.6
33.927.7
27.627.7
28.427.2
With cover crop23.724.6
28.527.0
22.122.3
30.727.7
26.125.8
25.324.6
29.727.2
25.025.2
27.326.2
t LSD (0.10) for cover crop averages = 3.4 for grain, NS for stover.i LSD (0.10) for previous residue rate averages = 2.6 for grain, NS
for stover.
Uptake of N from the 15N-depleted fertilizer was sig-nificantly affected by previous crop residue rate (in anonlinear manner) and was decreased by the use of awinter cover crop (Table 8). Effects of tillage and mostinteractions were not significant. Likewise, tillage hadno significant effect on uptake of N from mineralizedsoil N. However, soil N uptake did increase with in-creased previous crop residue rate, N fertilization, andthe use of a winter cover crop. Any N mineralized fromdecomposition of the legume cover crop would be in-cluded in this calculation of soil N uptake. There wasalso a significant fertilizer N x cover crop interactionbecause of a large response to the cover crop when noN fertilizer was applied, compared with essentially noresponse with N fertilizer. Like fertilizer N uptake, themagnitude of the N x cover crop interaction for soil Nuptake varied significantly with previous crop residuerate.
DISCUSSION AND CONCLUSIONSUnder conditions of this experiment, the type of tillage
used generally had little influence on corn growth and Nuptake, but effects of previous crop residue rates weresignificant throughout. The response to previous cropresidue rate may have partially resulted from increasedmineralization and uptake of N from the enlarged soilorganic N pool, as suggested by the data in Table 8.
Corn stover production increased about 700 kg ha"1
as previous crop residue rate increased from O to 150%levels (Table 4). Thus, according to the earlier researchon these plots (Wilhelm et al., 1986; Power et al., 1986),this increased crop residue cover should have conservedmore soil water and enhanced growth of the followingcrop. Soil water data (not shown) confirmed that morewater was present in the higher residue soils. Therefore,the effects of previous crop residue rate on increasedcorn growth and N uptake observed in this experimentprobably resulted from alterations of the soil environ-ment that affected both soil water conditions and soil Navailability.
Linn and Doran (1984) showed that aerobic processes(such as mineralization and nitrification) were greatestwhen about 60% of the soil pore volume was filled with
Table 8. Average (2-yr) soil and fertilizer N uptake by corn(•whole plant) as affected by previous crop residue rate, Nfertilization, and winter cover crop.
Covercrop
Nrate 50% 100% 150% Avg.t
- kg N ha-1 -
Soil N uptake
Without
With
Average
O60
O60
50.973.260.268.6
Ot 55.660$ 70.9
Avg.§ 63.2
58.767.263.673.261.270.265.7
65.773.672.370.769.072.270.5
75.974.483.783.2
62.872.170.073.9
79.8 66.478.8 73.079.3 69.7
Fertilizer N uptake
WithoutWithAverage
606060§
28.624.826.7
34.527.731.1
29.221.925.6
29.623.626.6
30.524.527.5
t LSD (0.10) for cover crop averages = 4.1 and 3.7 for soil and fertilizerN uptake, respectively.
t LSD (0.10) for N fertilizer averages = 4.6 (soil N uptake).§ LSD (0.10) for previous residue rate averages = 6.4 and 4.0 for soil
and fertilizer uptake, respectively.
water. According to results from Doran et al. (1984),returning more crop residues to the 150% treatment plotsin this experiment should have maintained soil watercontent closer to the ideal of 60% water-filled pore spacethan would have occurred for the 0% previous residueplots. This was verified by the soil water measurementsmade in this experiment (data not shown). Thus, onewould expect greater mineralization in the 150% thanthe 0% treated soils.
The interactive effects of the legume cover crop andN fertilization observed in this experiment on corn growthand N uptake were generally predictable. Beneficial ef-fects of the legume cover crop were usually observedwithout N fertilization, but these effects were reduced oreliminated with N fertilization. These effects were oftengreatest at the lowest previous crop residue rate, presum-ably because of greater N stress for this treatment thanthe 150% treatment.
From these results it appears that the effects of cropresidue rate may have a prolonged residual effect on cropgrowth and N availability. That these residual effectsthemselves enhance crop growth, and subsequently thequantity of residues returned, indicates that a somewhatself-perpetuating situation is created that can continue toinfluence productivity for many years. This appears tobe an added benefit from maintaining crop residues thathas not previously been specifically identified.
ACKNOWLEDGMENTSThis research was supported in part by funding from the
USAID US/INDO Science and Technology Information Pro-gram, supporting M.S. Maskina for 16 mo while working onthis project.
1560 SOIL SCI. SOC. AM. J., VOL. 57, NOVEMBER-DECEMBER 1993