Embed Size (px)
Citation preview
Creating value from uncertainty
Broadleaf Capital International Pty Ltd
ABN 24 054 021 117
www.Broadleaf.com.au
1 of 12
Resource: Linking and integrating different views of project risk Qualitative and quantitative views of project risk are
often treated as if they are distinct from one
another. It is easier to make sense of uncertainty if
that artificial divide is set aside. This paper describes
a way to frame processes based on qualitative and
quantitative descriptions of uncertainty as an
integrated view of project risk management. This can
be used to assist in implementing risk management
and as an aid to clear communication about project
risk.
Version 1, 2018
Qualitative and quantitative analysis
2 of 12
Contents
1 Introduction 3
2 Views of uncertainty 3
3 An integrated view 5
3.1 Establishing the context 7
3.2 Risk identification and model structure 7
3.3 Qualitative analysis and model parameters 8
3.4 Evaluation and interpretation 8
3.5 Quantitative reconciliation and treatment 9
3.6 Validation and reconciliation 9
4 Planning analysis tasks 10
5 Conclusion 11
6 Contacts 12
Figures
Figure 1: Aggregate project cost uncertainty 3
Figure 2: Summary of project risks 4
Figure 3: ISO 31000 process outline 5
Figure 4: An integrated view 6
Figure 5: Sequence of analysis 10
Qualitative and quantitative analysis
3 of 12
1 Introduction
Qualitative and quantitative views of project risk are often treated as if they are
distinct from one another. It is easier to make sense of uncertainty if that
artificial divide is set aside. This paper describes a way to frame processes based
on qualitative and quantitative descriptions of uncertainty as an integrated
view of project risk management. This can be used to assist in implementing
risk management and as an aid to clear communication about project risk.
2 Views of uncertainty
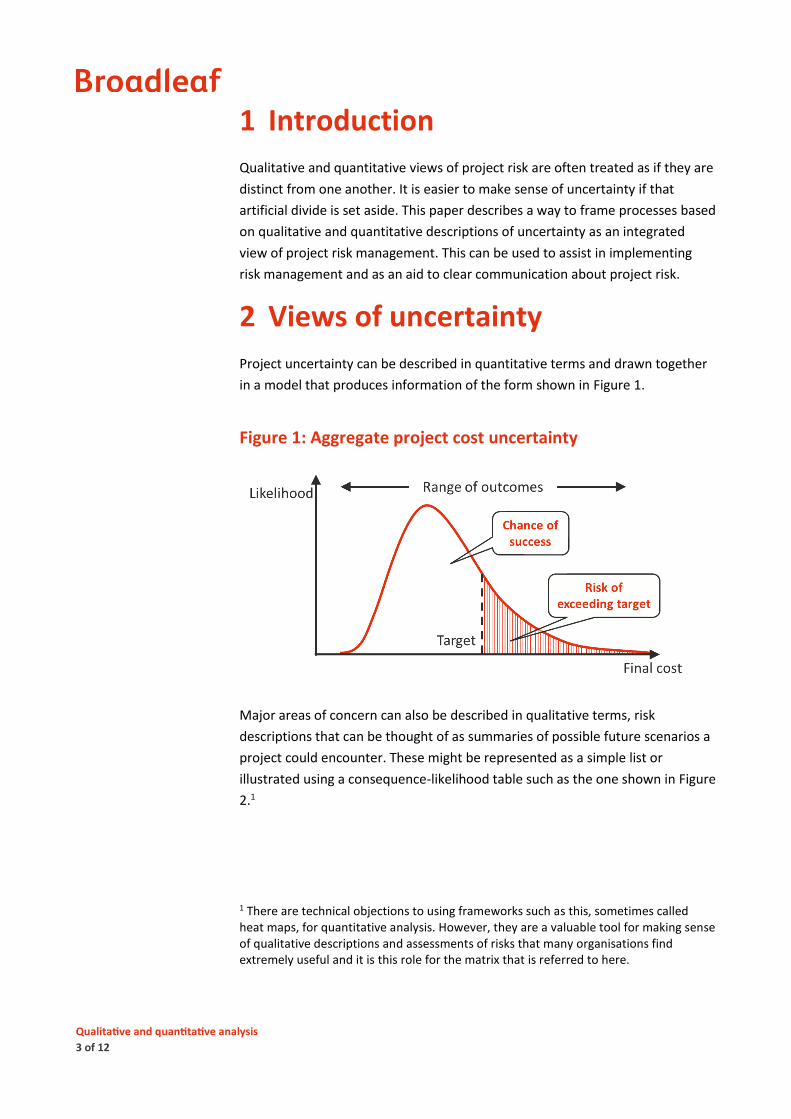
Project uncertainty can be described in quantitative terms and drawn together
in a model that produces information of the form shown in Figure 1.
Figure 1: Aggregate project cost uncertainty
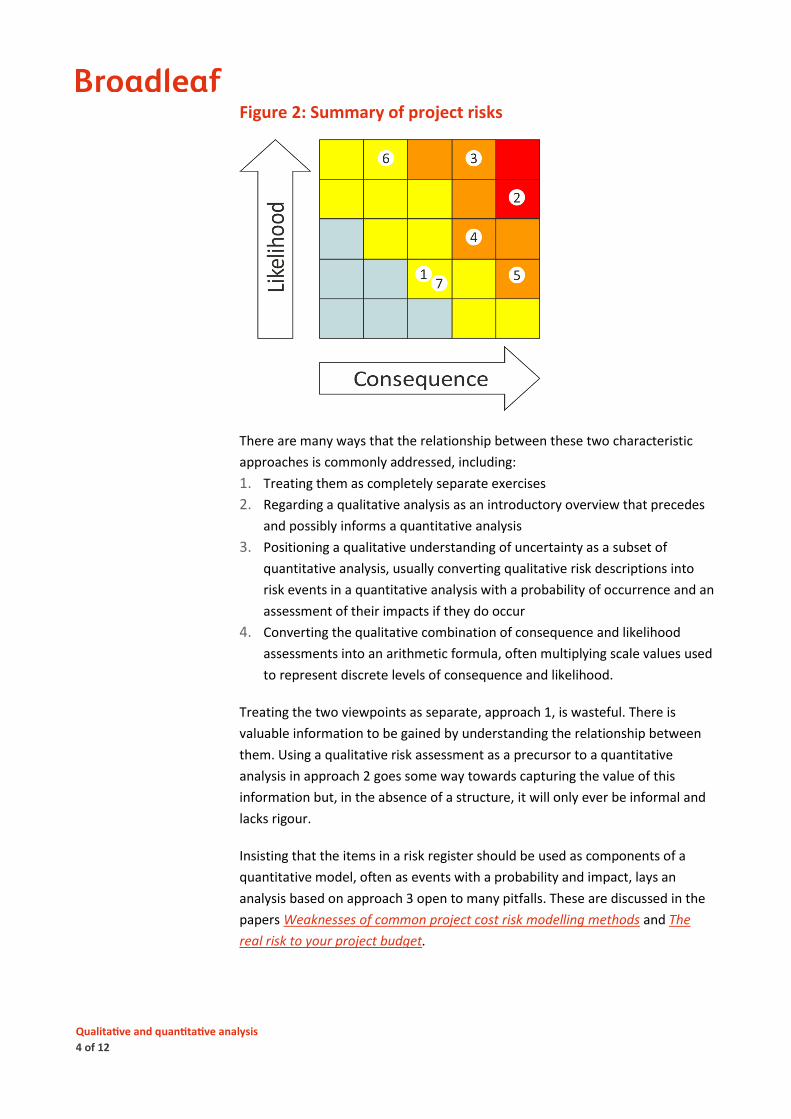
Major areas of concern can also be described in qualitative terms, risk
descriptions that can be thought of as summaries of possible future scenarios a
project could encounter. These might be represented as a simple list or
illustrated using a consequence-likelihood table such as the one shown in Figure
2.1
1 There are technical objections to using frameworks such as this, sometimes called heat maps, for quantitative analysis. However, they are a valuable tool for making sense of qualitative descriptions and assessments of risks that many organisations find extremely useful and it is this role for the matrix that is referred to here.
Qualitative and quantitative analysis
4 of 12
Figure 2: Summary of project risks
There are many ways that the relationship between these two characteristic
approaches is commonly addressed, including:
1. Treating them as completely separate exercises
2. Regarding a qualitative analysis as an introductory overview that precedes
and possibly informs a quantitative analysis
3. Positioning a qualitative understanding of uncertainty as a subset of
quantitative analysis, usually converting qualitative risk descriptions into
risk events in a quantitative analysis with a probability of occurrence and an
assessment of their impacts if they do occur
4. Converting the qualitative combination of consequence and likelihood
assessments into an arithmetic formula, often multiplying scale values used
to represent discrete levels of consequence and likelihood.
Treating the two viewpoints as separate, approach 1, is wasteful. There is
valuable information to be gained by understanding the relationship between
them. Using a qualitative risk assessment as a precursor to a quantitative
analysis in approach 2 goes some way towards capturing the value of this
information but, in the absence of a structure, it will only ever be informal and
lacks rigour.
Insisting that the items in a risk register should be used as components of a
quantitative model, often as events with a probability and impact, lays an
analysis based on approach 3 open to many pitfalls. These are discussed in the
papers Weaknesses of common project cost risk modelling methods and The
real risk to your project budget.
Qualitative and quantitative analysis
5 of 12
Approach 4, using arithmetic to combine consequence and likelihood scores
based on ordinal (ranking) scales with numbers attached to them, is
fundamentally flawed because it encourages misuse of the analysis. Once
ratings are converted to numerical values, many people assume that these
values can be used in further calculations. Common mistakes include adding up
all the separate risk ratings to obtain a so called ‘project risk rating’, believing
that a risk with a rating half the value of another risk, for instance, is 50% less
important than the other risk, and converting rating values into dollar amounts
with arbitrary factors.
None of these common approaches to dealing with the relationship between
qualitative and quantitative views of uncertainty is rigorous or effective.
3 An integrated view
To make sense of the relationships between qualitative and quantitative views
of uncertainty, it is useful to separate important activities that make up project
risk management. The standard ISO 31000 offers a useful level of granularity in
its description of the component parts of a risk management process and
meaningful relationships between them (Figure 3).
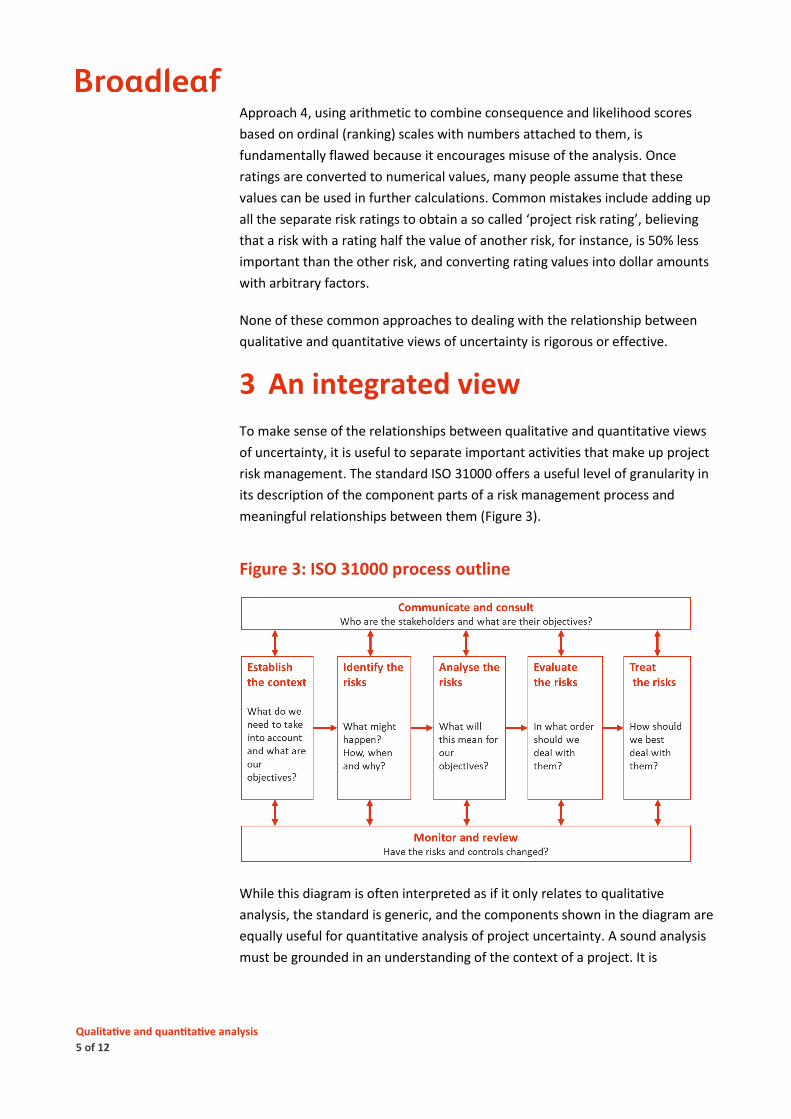
Figure 3: ISO 31000 process outline
While this diagram is often interpreted as if it only relates to qualitative
analysis, the standard is generic, and the components shown in the diagram are
equally useful for quantitative analysis of project uncertainty. A sound analysis
must be grounded in an understanding of the context of a project. It is
Qualitative and quantitative analysis
6 of 12
necessary to identify what will be included in a model before gathering
numerical inputs, establishing the context. After inputs have been processed,
interpretation and checking are essential, evaluation, and none of this is of any
use unless it is followed by actions, treatment.
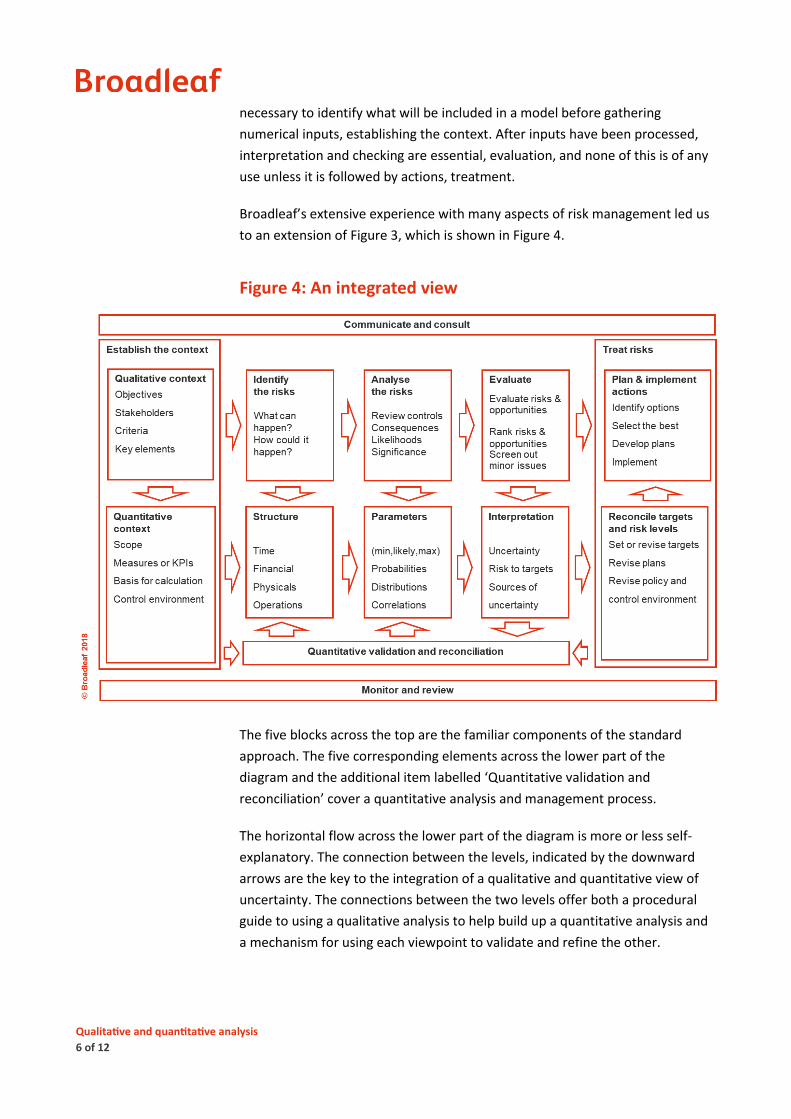
Broadleaf’s extensive experience with many aspects of risk management led us
to an extension of Figure 3, which is shown in Figure 4.
Figure 4: An integrated view
The five blocks across the top are the familiar components of the standard
approach. The five corresponding elements across the lower part of the
diagram and the additional item labelled ‘Quantitative validation and
reconciliation’ cover a quantitative analysis and management process.
The horizontal flow across the lower part of the diagram is more or less self-
explanatory. The connection between the levels, indicated by the downward
arrows are the key to the integration of a qualitative and quantitative view of
uncertainty. The connections between the two levels offer both a procedural
guide to using a qualitative analysis to help build up a quantitative analysis and
a mechanism for using each viewpoint to validate and refine the other.
Qualitative and quantitative analysis
7 of 12
3.1 Establishing the context
The information generated by establishing the context for a qualitative analysis
is a natural precursor to defining the scope, metrics and background for the
quantitative analysis. Checking back from the quantitative analysis to the
qualitative context, if there is a sense that a quantitative characteristic of a
project is a crucial measure of success and yet it has not been reflected in the
initial establishment of the context for a qualitative assessment, it would be
prudent to examine this mismatch. It might be that the matter is not after all as
important as had been assumed, which will help focus attention on the true
priorities in the quantitative analysis, or that it has been overlooked in one view
of project uncertainty and should be included in both.
3.2 Risk identification and model structure
Knowing the main areas of concern in a project is a good guide to
understanding how a quantitative risk model should be structured. Risk models
are generally built using relatively high-level summaries of project costs and the
activity network. A sense of where the uncertainties lie, derived from a
qualitative assessment, is a valuable guide to understanding what the model
will have to represent. This can assist in deciding where to include detail and
where to summarise, what interactions and dependencies to build into the
model and where correlations between uncertain factors might be important.
The relationship between risks identified in the qualitative approach and the
structure of a quantitative risk model is close but not, as some assume, one-to-
one. Several risk descriptions produced in a qualitative analysis might be
encompassed in a single component of a quantitative analysis and several
components of a risk model might each correspond to more than one high level
risk description.
For instance, outstanding design decisions and uncertainty about the
environment in which a project is to be implemented could affect the quantities
of the materials required. This might be represented in a model by a single
distribution or probability density function describing the possible effect of
quantity variation on related costs such as bulk material supply, labour costs,
plant costs, and contractor’s overheads. In that case, many components of the
qualitative view will be linked to one component of the quantitative view.
Conversely, there might be many consequences that can flow from a delay to a
major external dependency, such as a critical delivery to a project. In the
Qualitative and quantitative analysis
8 of 12
qualitative description of uncertainty this might be summarised in a single
statement about that delivery being delayed. In a model, that delay might be
linked to several costs and consequent delays in other areas. In that case one
component of the qualitative view will be linked to multiple components of the
quantitative view.
In this many-to-many relationship, any gaps are an indication that one of the
viewpoints might be incomplete. If a risk has been described in the qualitative
assessment and there is nothing in the quantitative analysis that represents its
role in the project, the model might be deficient. On the other hand, if the
quantitative analysis includes a source of uncertainty that has not been
described in the qualitative analysis, the qualitative analysis might be
incomplete.
3.3 Qualitative analysis and model parameters
The correspondence between the analysis and rating of risks in a qualitative
process and the magnitude of uncertainties in a model is not as clear cut as the
correspondence between the list of risks identified in a qualitative analysis and
the structure of a model. However, it is another way to check the integrity of
each of the two viewpoints and a guide to the possible magnitude of
uncertainties and risks’ consequences.
From a qualitative assessment, those involved in a project will gain some sense
of which uncertainties are the most significant and, separately, from the
analysis of a quantitative model they will have a view of their magnitude in
terms of time, money or other real world measures. If one viewpoint presents a
different impression from the other about the significance of various sources of
uncertainty in a project, exploring the discrepancy will often yield valuable
insights.
There may be a valid reason for a difference between the two viewpoints,
which in itself is often useful information. On the other hand, it might be that
an erroneous impression of the uncertainty has become embedded in one or
the other analysis and this can be corrected.
3.4 Evaluation and interpretation
When the overall impression of a project is formed by looking at all the risk
descriptions and ratings, it can be compared with the overall outcome of a
quantitative analysis. As with the comparison of individual risk analyses and
Qualitative and quantitative analysis
9 of 12
parameters, an overall comparison such as this provides a means of confirming
the validity of both viewpoints. If there are significant differences, exploring
them should improve the quality of both analyses and confirm the confidence
that can be placed in their conclusions.
3.5 Quantitative reconciliation and treatment
Quantitative analysis is sometimes the key to understanding whether a project
is a worthwhile investment at all. Understanding when there is a need for a
significant revision of costs, or the sequencing of work and allocation of
resources, might set the envelope within which detailed treatment planning is
carried out. Even when a quantitative analysis confirms the viability of a project,
understanding the areas of the cost and the schedule that are under the
greatest stress is a useful guide to decision making about treatment actions.
3.6 Validation and reconciliation
The validation activity shown at the centre of the lower edge of the main
diagram, below and connected to the components labelled structure,
parameters and interpretation, is a vital step in quantitative modelling.
A human observer will rarely be able to confirm the relationship between the
aggregate effect of inputs and the outputs generated by a quantitative analysis
in even the most straightforward and transparent model. However, by
reviewing the evaluation and interpretation of the project as a whole, setting
this against skilled and experienced judgement about the project, and testing
the sensitivity of the outcomes to the inputs, it is possible to check that the
model makes sense.
If a very large contribution to the difference between the base estimate and a
probabilistic assessment of cost, perhaps its mean value or the value of a
selected percentile point in the distribution, comes from a minor area of work,
it might be a sign that there is an error in the model. Similarly, if the sensitivity
of the variation in output values to the variation in input values, perhaps
assessed using a correlation analysis, is inconsistent with a general
understanding of which sources will be most significant, this will usually be
worth exploring.
It is vital to view quantitative risk modelling as an iterative process: developing
a conceptual model, defining the input parameters it requires, gathering input
assessments, examining outputs, validating the results and revising the model
Qualitative and quantitative analysis
10 of 12
structure or inputs as required, and generating fresh outputs to ensure that it
makes sense. This process can help expose simple errors and bugs in a model. It
will also often expose misconceptions and biases that have been incorporated
into the model structure or parameters.
4 Planning analysis tasks
In addition to helping make sense of the relationship between different views
of project uncertainty, the structure in Figure 4 can be used to plan an
integrated approach to initiating or reviewing risk management for a project.
There is a natural order to the matters to be addressed that can be used to help
develop a plan for the work.
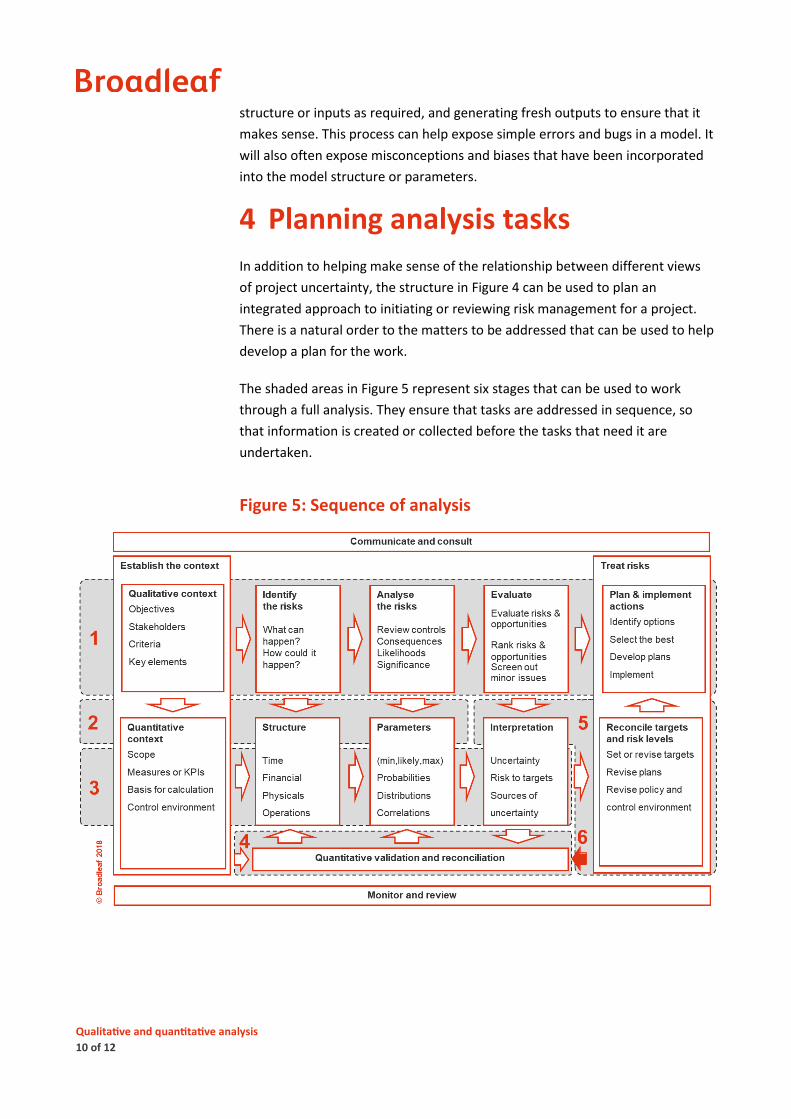
The shaded areas in Figure 5 represent six stages that can be used to work
through a full analysis. They ensure that tasks are addressed in sequence, so
that information is created or collected before the tasks that need it are
undertaken.
Figure 5: Sequence of analysis
Qualitative and quantitative analysis
11 of 12
Stage 1 is the standard approach to initiating risk management used by many. It
is a complete pass from establishing the context to examining treatment
options.
Stage 2 represents the conventional approach to planning a risk modelling
exercise. It is intended to encompass developing the model structure and
defining the parameters to be evaluated as inputs but not actually evaluating
the parameters at this stage. Once the required parameters are identified, an
exercise to gather information (Stage 3) can be planned.
Stage 3 represents the actual quantitative assessment exercise, possibly
allowing for revisions of the model structure as discussions proceed, and
including assessing ranges of uncertainties, probabilities of events and
correlations between factors, leading to the production of initial outputs.
Stage 4 is a critical review of the outcome of the model and the relationships
between inputs and outputs. It will usually include both an examination of the
model results and sensitivity analyses to test the relationship of inputs to
outputs and the balance between separate areas of risk. Subject to the
outcome of this review, the model structure and parameter values might be
revised.
Stage 5 represents the use of the model outcomes and the insights gained from
sensitivity analyses to make decisions about whether the project plan should be
reviewed and where further action should be directed to maximise value and
the chances of success.
Stage 6 draws attention to the fact that, as treatment actions are formulated
and implemented, the analysis should be reviewed to ensure that it remains
current and to check the likely efficacy of the actions being implemented.
5 Conclusion
Qualitative and quantitative views of project risk are framed in different terms
but they simply represent the same information in different ways. It is possible
to understand the relationships between them in a way that enhances both
viewpoints and provides a basis for planning a systematic analysis.
The relationships can also be used to assist with clear communication about
project risk, using the qualitative and quantitative expressions of the factors at
work to support and reinforce one another.
Qualitative and quantitative analysis
12 of 12
6 Contacts
If you would like further information about this topic, please contact us. We will
endeavour to reply promptly.
Dr Dale F Cooper
Dr Stephen Grey
Pauline Bosnich
Grant Purdy
Geoff Raymond
Phil Walker
Mike Wood
For further information, visit www.Broadleaf.com.au
© 2018 Broadleaf Capital
International Pty Ltd.
All rights reserved.