Embed Size (px)
Citation preview
Respiratory Knowledge Portal (RKP)Providing act ionable information to help cl in ic ians improve respiratory care processes
NAVIGATING VENTILATOR MANAGEMENT AND WEANING PROTOCOLS IS COMPLEX
Inefficiencies and variance from weaning protocols can lead to prolonged ventilator support and secondary lung injury.
Unplanned, extended ICU care undermines patient comfort, raises care costs, and increases risk of physical and cognitive complications for patients.
Data trending information, multidisciplinary planning, coordination, and effective practice execution are necessary for you to focus more on your patient’s health.
Weaning non-compliance>$5,000/episode1
VAP$41,000/episode2
Delirium$9,000/episode3
2
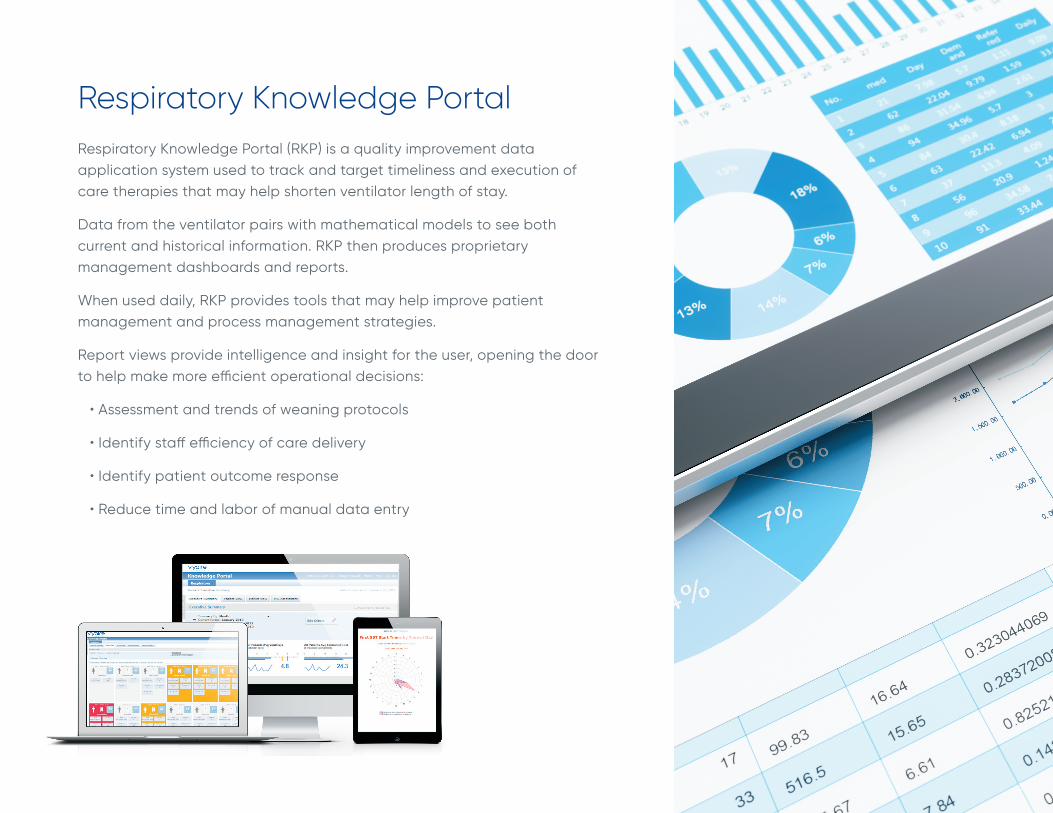
Respiratory Knowledge PortalRespiratory Knowledge Portal (RKP) is a quality improvement data application system used to track and target timeliness and execution of care therapies that may help shorten ventilator length of stay.
Data from the ventilator pairs with mathematical models to see both current and historical information. RKP then produces proprietary management dashboards and reports.
When used daily, RKP provides tools that may help improve patient management and process management strategies.
Report views provide intelligence and insight for the user, opening the door to help make more efficient operational decisions:
• Assessment and trends of weaning protocols
• Identify staff efficiency of care delivery
• Identify patient outcome response
• Reduce time and labor of manual data entry
3
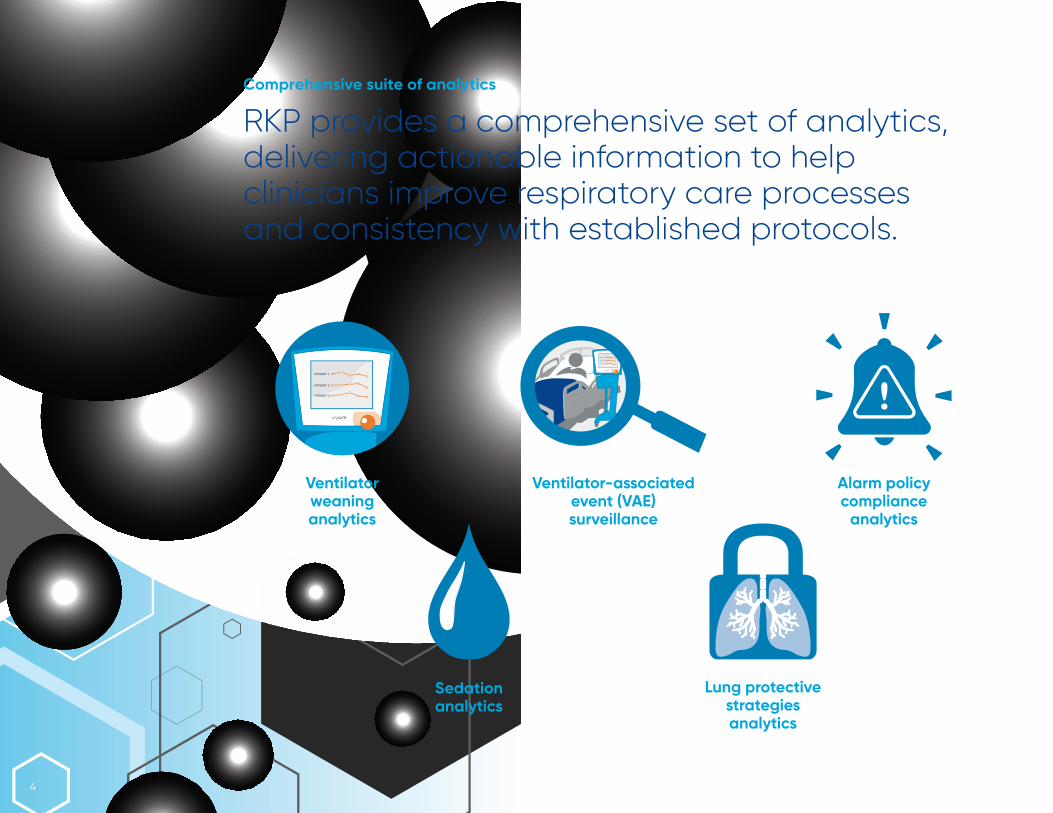
Comprehensive suite of analytics
RKP provides a comprehensive set of analytics, delivering actionable information to help clinicians improve respiratory care processes and consistency with established protocols.
Lung protective strategies analytics
Alarm policy compliance
analytics
Sedation analytics
Ventilator weaning analytics
PATIENT 1
PATIENT 2
PATIENT 3
Ventilator-associated event (VAE) surveillance
PATIENT 1
PATIENT 2
PATIENT 3
4
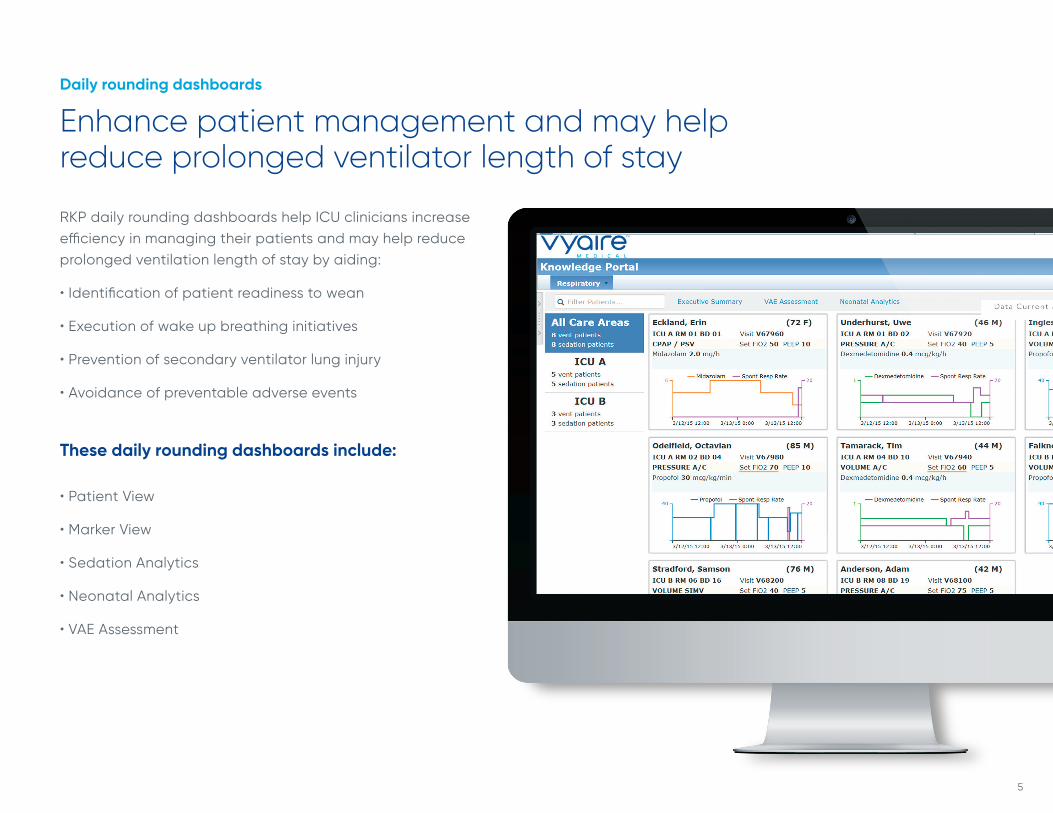
Daily rounding dashboards
Enhance patient management and may help reduce prolonged ventilator length of stay
RKP daily rounding dashboards help ICU clinicians increase efficiency in managing their patients and may help reduce prolonged ventilation length of stay by aiding:
• Identification of patient readiness to wean
• Execution of wake up breathing initiatives
• Prevention of secondary ventilator lung injury
• Avoidance of preventable adverse events
These daily rounding dashboards include:
• Patient View
• Marker View
• Sedation Analytics
• Neonatal Analytics
• VAE Assessment
5
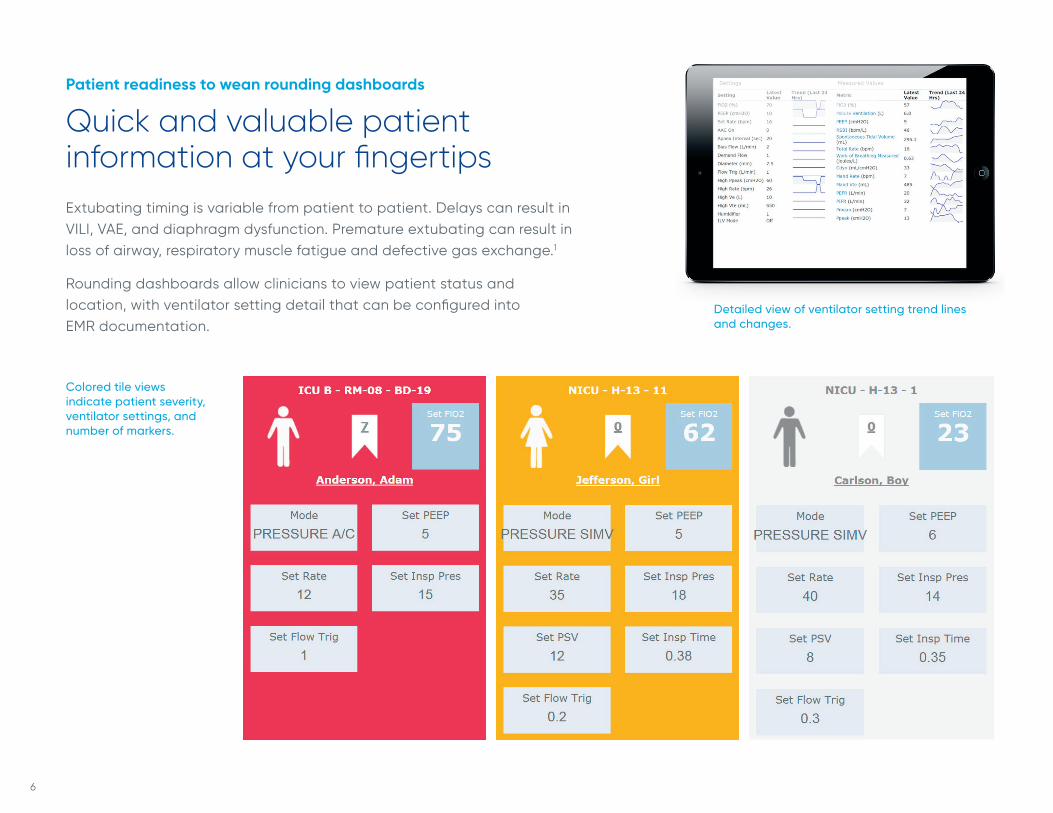
Patient readiness to wean rounding dashboards
Quick and valuable patient information at your fingertips
Extubating timing is variable from patient to patient. Delays can result in VILI, VAE, and diaphragm dysfunction. Premature extubating can result in loss of airway, respiratory muscle fatigue and defective gas exchange.1
Rounding dashboards allow clinicians to view patient status and location, with ventilator setting detail that can be configured into EMR documentation.
Colored tile views indicate patient severity, ventilator settings, and number of markers.
Detailed view of ventilator setting trend lines and changes.
6
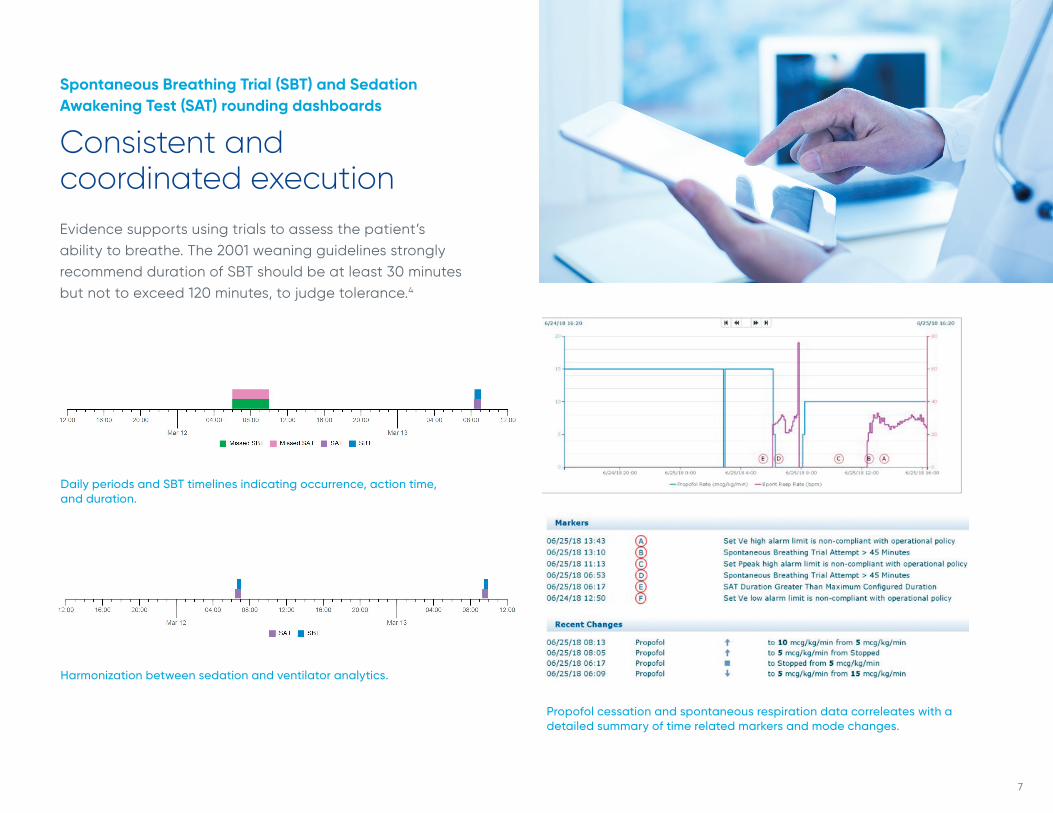
Spontaneous Breathing Trial (SBT) and Sedation Awakening Test (SAT) rounding dashboards
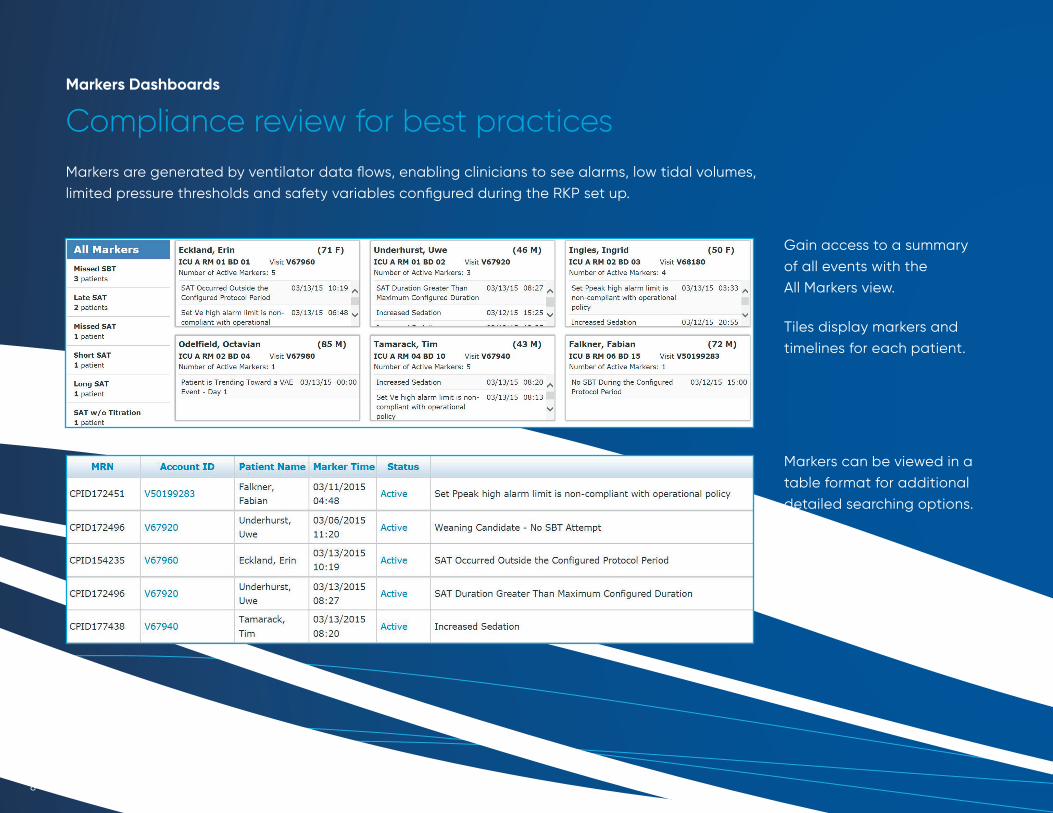
Consistent and coordinated executionEvidence supports using trials to assess the patient’s ability to breathe. The 2001 weaning guidelines strongly recommend duration of SBT should be at least 30 minutes but not to exceed 120 minutes, to judge tolerance.4
Daily periods and SBT timelines indicating occurrence, action time, and duration.
Harmonization between sedation and ventilator analytics.
Propofol cessation and spontaneous respiration data correleates with a detailed summary of time related markers and mode changes.
7
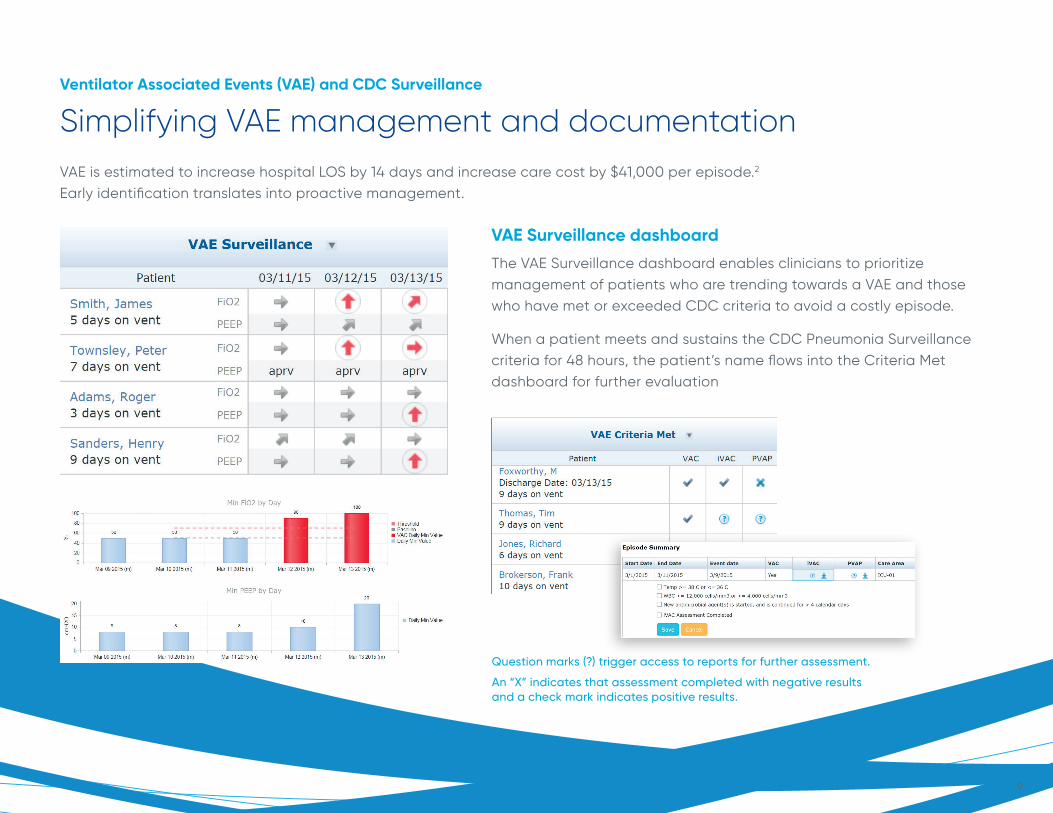
Markers Dashboards
Compliance review for best practicesMarkers are generated by ventilator data flows, enabling clinicians to see alarms, low tidal volumes, limited pressure thresholds and safety variables configured during the RKP set up.
Markers can be viewed in a table format for additional detailed searching options.
Gain access to a summary of all events with the All Markers view.
Tiles display markers and timelines for each patient.
8
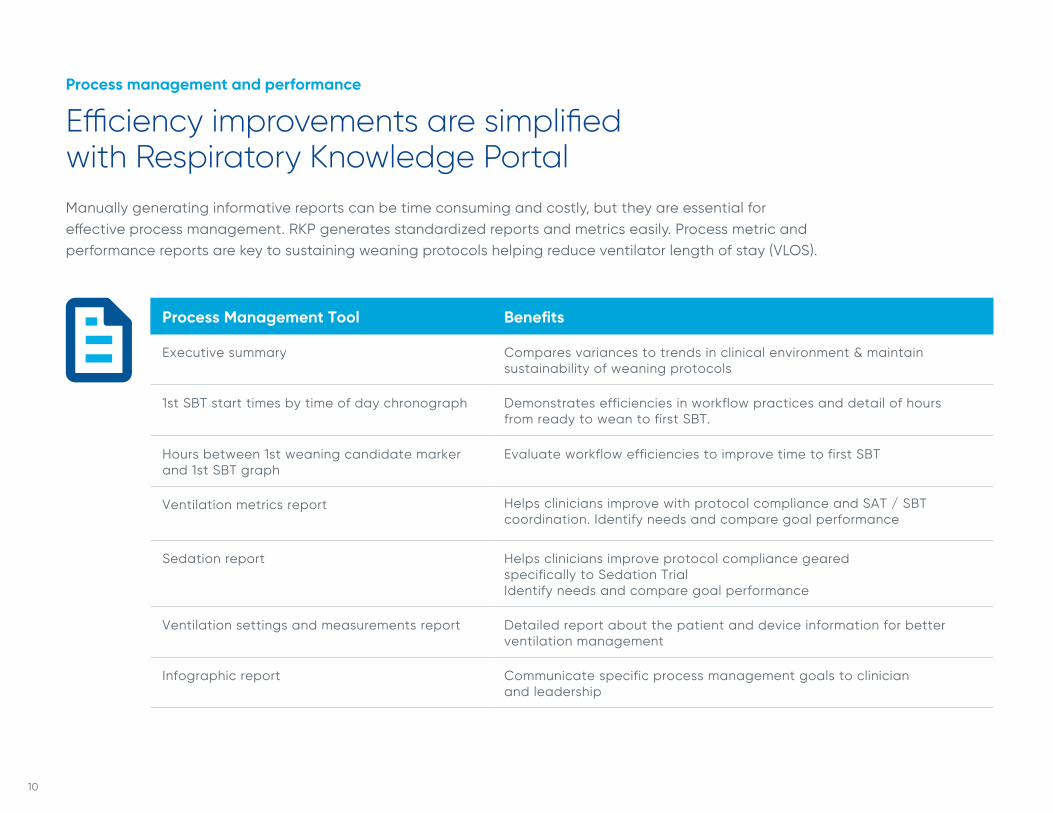
Ventilator Associated Events (VAE) and CDC Surveillance
Simplifying VAE management and documentation
VAE is estimated to increase hospital LOS by 14 days and increase care cost by $41,000 per episode.2 Early identification translates into proactive management.
VAE Surveillance dashboard
The VAE Surveillance dashboard enables clinicians to prioritize management of patients who are trending towards a VAE and those who have met or exceeded CDC criteria to avoid a costly episode.
When a patient meets and sustains the CDC Pneumonia Surveillance criteria for 48 hours, the patient’s name flows into the Criteria Met dashboard for further evaluation
Question marks (?) trigger access to reports for further assessment.
An “X” indicates that assessment completed with negative results and a check mark indicates positive results.
9
Process management and performance
Efficiency improvements are simplified with Respiratory Knowledge PortalManually generating informative reports can be time consuming and costly, but they are essential for effective process management. RKP generates standardized reports and metrics easily. Process metric and performance reports are key to sustaining weaning protocols helping reduce ventilator length of stay (VLOS).
Process Management Tool Benefits
Executive summary Compares variances to trends in clinical environment & maintain sustainability of weaning protocols
1st SBT start times by time of day chronograph Demonstrates efficiencies in workflow practices and detail of hours from ready to wean to first SBT.
Hours between 1st weaning candidate marker and 1st SBT graph
Evaluate workflow efficiencies to improve time to first SBT
Ventilation metrics report Helps clinicians improve with protocol compliance and SAT / SBT coordination. Identify needs and compare goal performance
Sedation report Helps clinicians improve protocol compliance geared specifically to Sedation TrialIdentify needs and compare goal performance
Ventilation settings and measurements report Detailed report about the patient and device information for better ventilation management
Infographic report Communicate specific process management goals to clinician and leadership
10
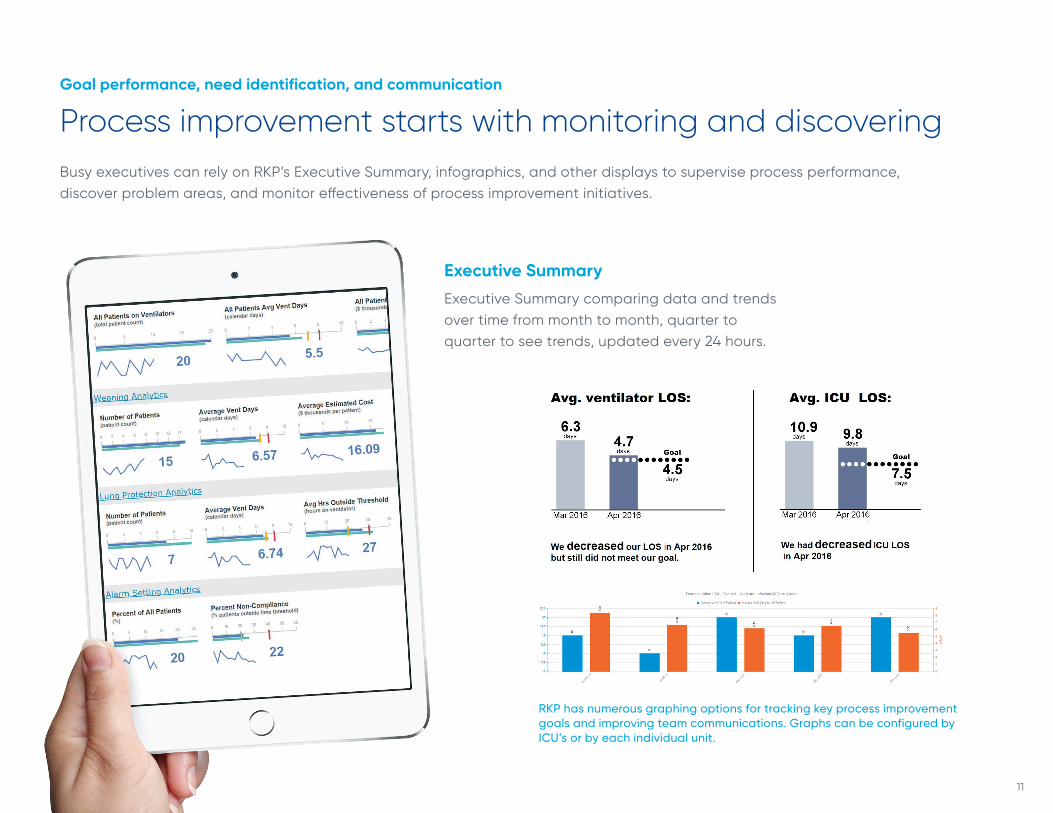
Goal performance, need identification, and communication
Process improvement starts with monitoring and discovering
Busy executives can rely on RKP’s Executive Summary, infographics, and other displays to supervise process performance, discover problem areas, and monitor effectiveness of process improvement initiatives.
RKP has numerous graphing options for tracking key process improvement goals and improving team communications. Graphs can be configured by ICU’s or by each individual unit.
Executive Summary
Executive Summary comparing data and trends over time from month to month, quarter to quarter to see trends, updated every 24 hours.
11
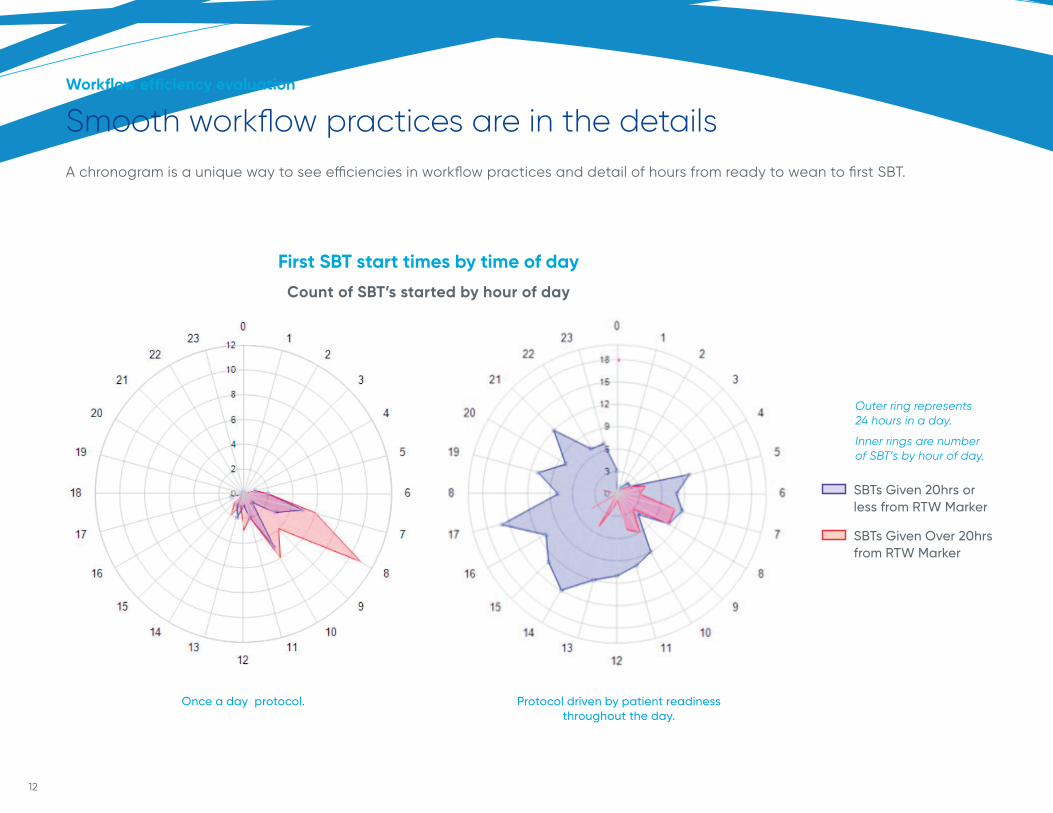
Workflow efficiency evaluation
Smooth workflow practices are in the details
A chronogram is a unique way to see efficiencies in workflow practices and detail of hours from ready to wean to first SBT.
Outer ring represents 24 hours in a day.
Inner rings are number of SBT’s by hour of day.
First SBT start times by time of day
Count of SBT’s started by hour of day
SBTs Given 20hrs or less from RTW Marker
SBTs Given Over 20hrs from RTW Marker
Protocol driven by patient readiness throughout the day.
Once a day protocol.
12
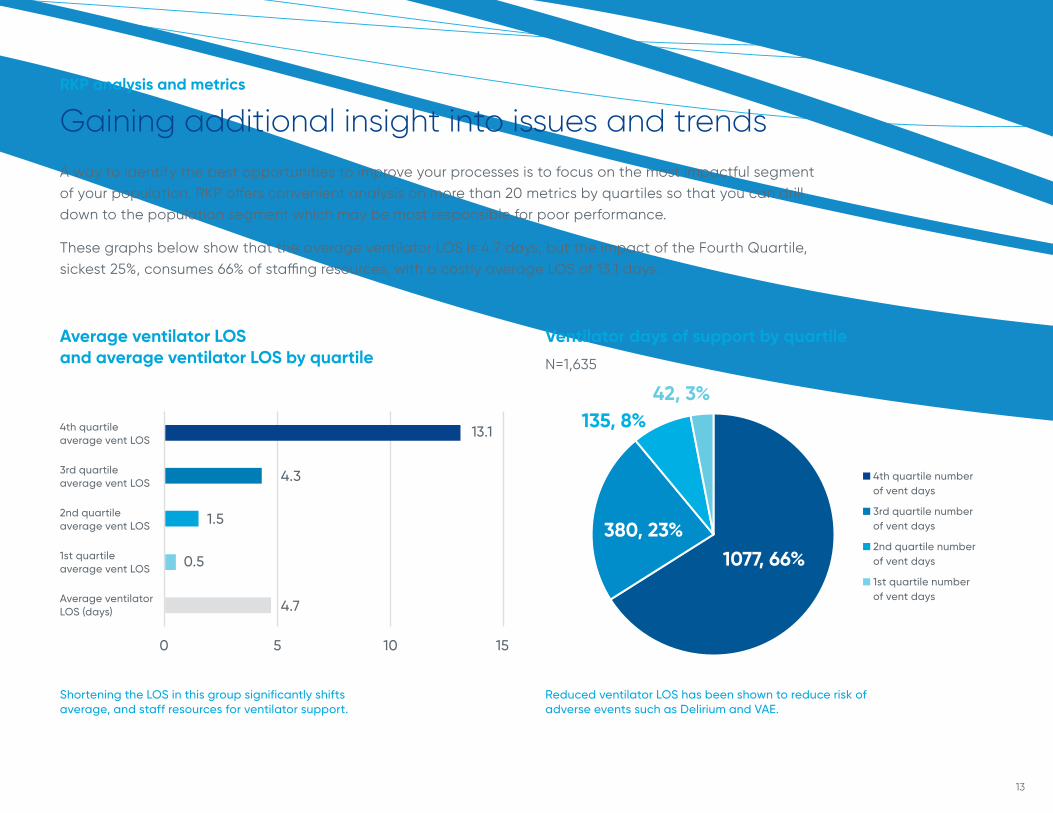
RKP analysis and metrics
Gaining additional insight into issues and trends
A way to identify the best opportunities to improve your processes is to focus on the most impactful segment of your population. RKP offers convenient analysis on more than 20 metrics by quartiles so that you can drill down to the population segment which may be most responsible for poor performance.
These graphs below show that the average ventilator LOS is 4.7 days, but the impact of the Fourth Quartile, sickest 25%, consumes 66% of staffing resources, with a costly average LOS of 13.1 days .
Shortening the LOS in this group significantly shifts average, and staff resources for ventilator support.
Reduced ventilator LOS has been shown to reduce risk of adverse events such as Delirium and VAE.
4th quartile number of vent days
3rd quartile number of vent days
2nd quartile number of vent days
1st quartile number of vent days
Ventilator days of support by quartile
N=1,635
Average ventilator LOS and average ventilator LOS by quartile
42, 3%135, 8%
380, 23%1077, 66%
4th quartile average vent LOS
3rd quartile average vent LOS
2nd quartile average vent LOS
1st quartile average vent LOS
Average ventilator LOS (days)
13.1
4.3
1.5
0.5
4.7
0 5 10 15
13
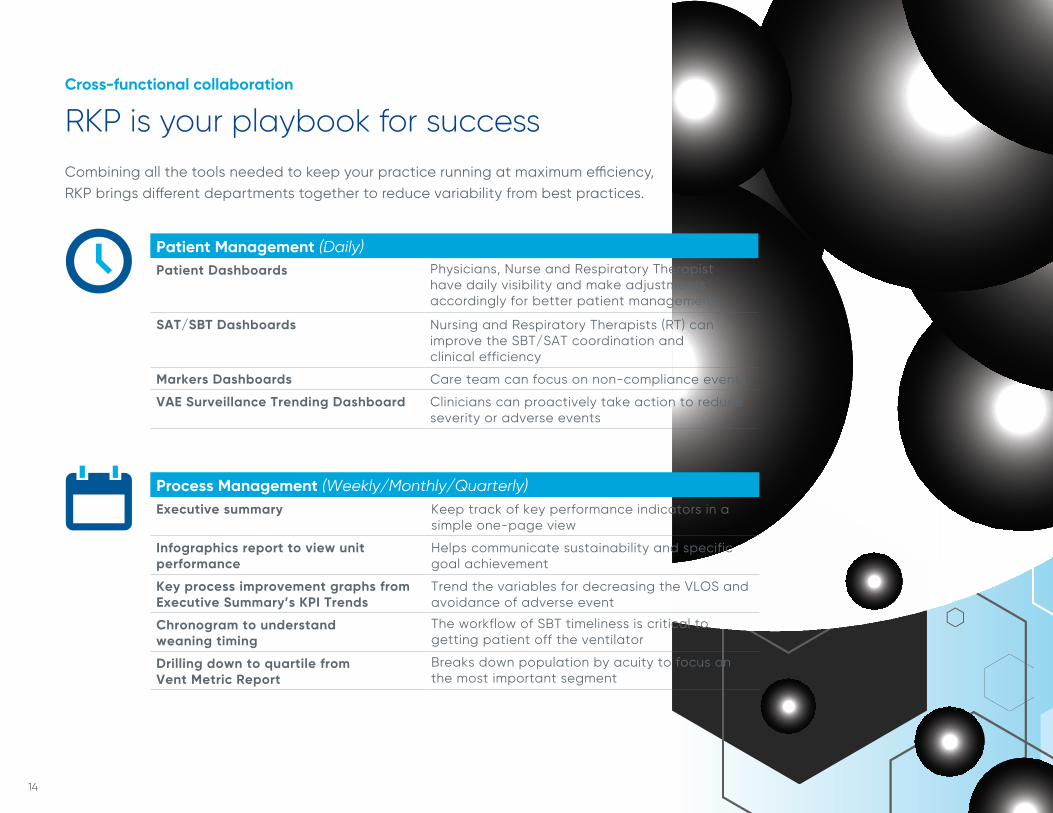
Cross-functional collaboration
RKP is your playbook for successCombining all the tools needed to keep your practice running at maximum efficiency, RKP brings different departments together to reduce variability from best practices.
Patient Management (Daily) Patient Dashboards Physicians, Nurse and Respiratory Therapist
have daily visibility and make adjustments accordingly for better patient management
SAT/SBT Dashboards Nursing and Respiratory Therapists (RT) can improve the SBT/SAT coordination and clinical efficiency
Markers Dashboards Care team can focus on non-compliance events
VAE Surveillance Trending Dashboard Clinicians can proactively take action to reduce severity or adverse events
Process Management (Weekly/Monthly/Quarterly)Executive summary Keep track of key performance indicators in a
simple one-page view
Infographics report to view unit performance
Helps communicate sustainability and specific goal achievement
Key process improvement graphs from Executive Summary’s KPI Trends
Trend the variables for decreasing the VLOS and avoidance of adverse event
Chronogram to understand weaning timing
The workflow of SBT timeliness is critical to getting patient off the ventilator
Drilling down to quartile from Vent Metric Report
Breaks down population by acuity to focus on the most important segment
14

Cross-functional project planning
Configuration of best
practices and benchmarking
Implementation
Training Optimization Performance Benchmarking
The path to better patient management and process improvement begins with RKP
At Vyaire, we follow a well-defined method to help you succeed
Contact Vyaire today to learn how RKP can benefit you
1.833.327.3284vyaire.com
15
vyaire.comScreenshots do not contain customer identifiable information.U.S. distribution only © 2018 Vyaire. Vyaire and the Vyaire logo are trademarks or registered trademarks of Vyaire Medical, Inc., or one of its affiliates. CF/804/18/0046 (0918)
G L O B A L H E A D Q U A R T E R S
Vyai re Medica l , Inc.26125 Nor th R iverwoods B lvdMettawa, I L 60045, USA
R E F E R E N C E S1 M a c I n t y re N . Ev i d e n c e-B a s e d G u i d e l i n e s f o r We a n i n g a n d D i s c o n t i n u i n g Ve n t i l a to r S u p p o r t . A C o l l e c t i ve Ta s k F o rc e F a c i l i ta te d by
th e A m e r i c a n C o l l e g e of C h e s t Phy s i c i a n s , T h e A m e r i c a n A s s o c i a t i o n f o r R e s p i ra to r y C a re , a n d th e A m e r i c a n C o l l e g e of C r i t i c a l C a re
M e d i c i n e . R e s p i a to r y C a re 20 02; 47( 1 ) 69-9 0.
2 H e a l th R e s e a rc h Ed u c a t i o n Tr u s t . Ve n t i l a to r-A s s o c i a te d Eve n t s ( VA E ) C h a n g e Pa c ka g e: 201 6 . H e a l th R e s e a rc h a n d Ed u c a t i o n a l Tr u s t .
201 7, F e b r u a r y.
3 E r i c B . M i l b ra n d t , et a l . C o s t s a s s o c i a te d w i th d e l i r i u m i n m e c h a n i c a l l y ve n t i l a te d p a t i e n t s . C r i t C a re M e d , 20 0 4 Vo l . 32 , N o . 4 . 95 5-962 .