Embed Size (px)
Citation preview
INTERIM RESULTS PRESENTATION FOR THE 26 WEEKS ENDED 1 JULY 2018
InterimResults
for the period ended 1 July 2018
AGENDA
FINANCIAL REVIEWOPERATIONAL REVIEW
FINANCIAL REVIEW
Hans van Lierop
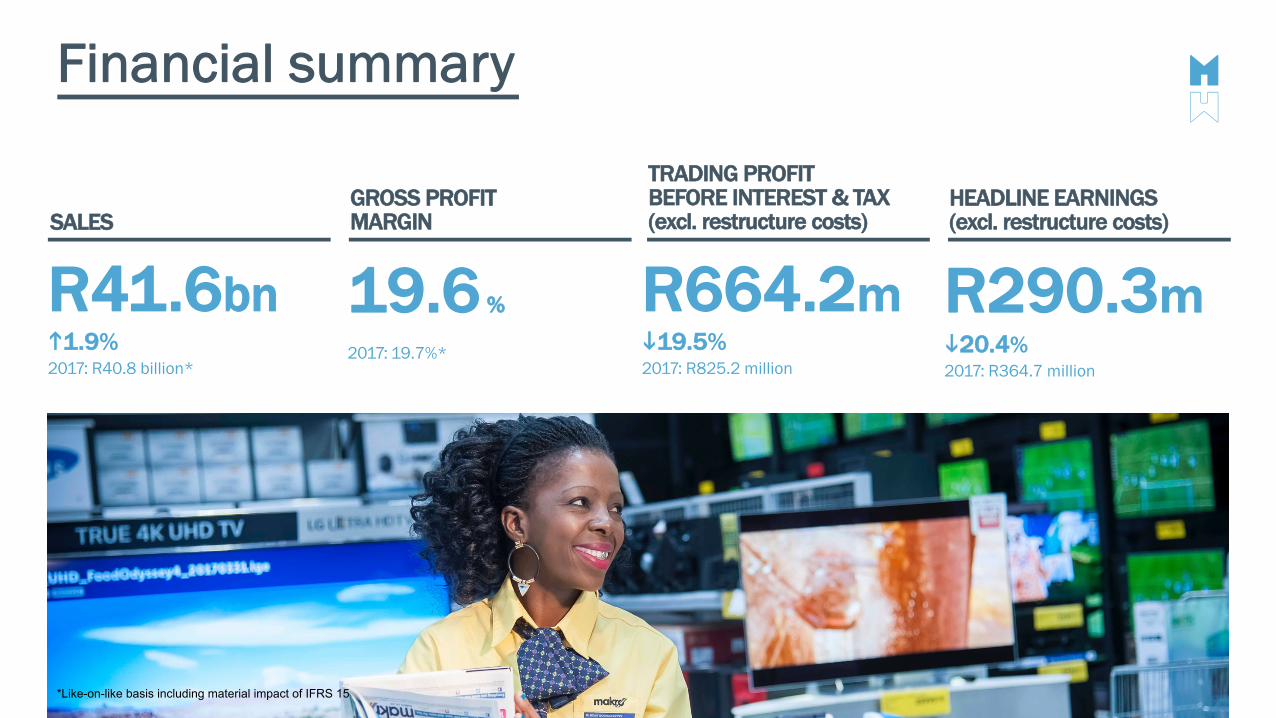
Financial summary
SALES
R290.3m 2
i20.4%2017: R364.7 million
GROSS PROFITMARGIN
TRADING PROFIT BEFORE INTEREST & TAX (excl. restructure costs)
HEADLINE EARNINGS (excl. restructure costs)
2017: 19.7%*
R41.6bnh1.9%2017: R40.8 billion*
19.6 % R664.2mi19.5%2017: R825.2 million
*Like-on-like basis including material impact of IFRS 15
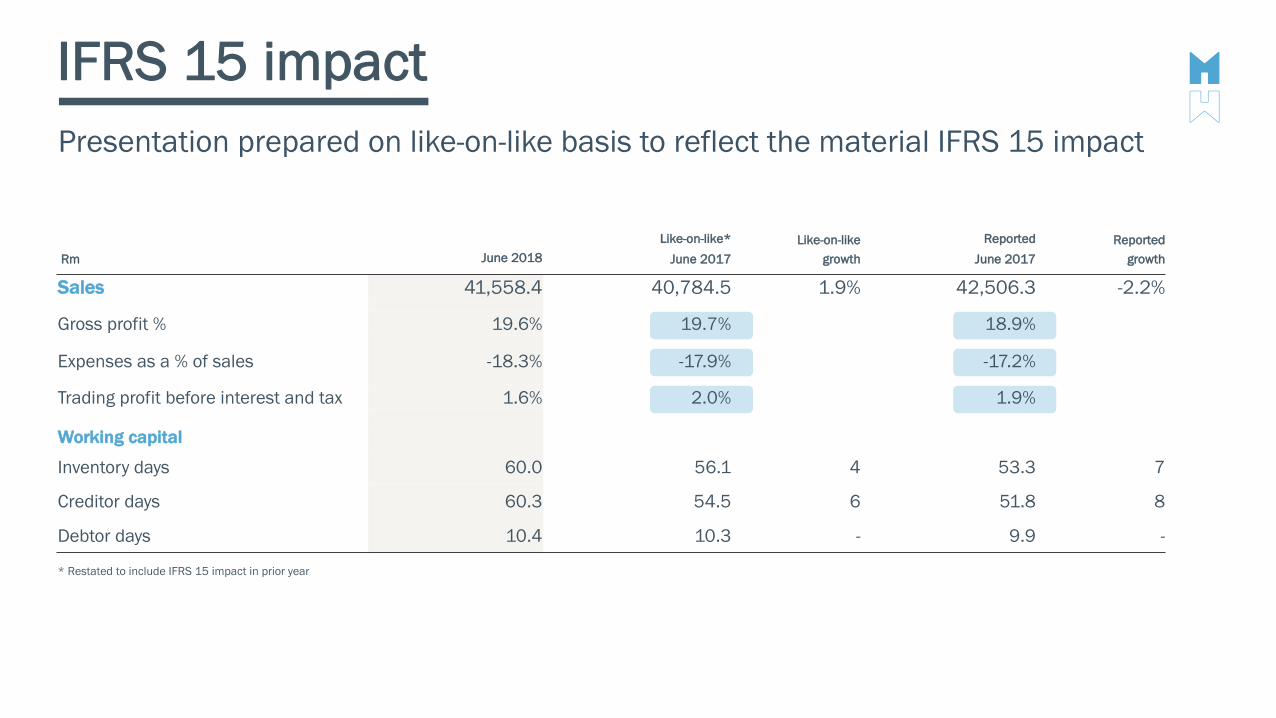
IFRS 15 impactPresentation prepared on like-on-like basis to reflect the material IFRS 15 impact
Like-on-like* Like-on-like Reported ReportedRm June 2018 June 2017 growth June 2017 growth
Sales 41,558.4 40,784.5 1.9% 42,506.3 -2.2%
Gross profit % 19.6% 19.7% 18.9%
Expenses as a % of sales -18.3% -17.9% -17.2%
Trading profit before interest and tax 1.6% 2.0% 1.9%
Working capital
Inventory days 60.0 56.1 4 53.3 7
Creditor days 60.3 54.5 6 51.8 8
Debtor days 10.4 10.3 - 9.9 -
* Restated to include IFRS 15 impact in prior year
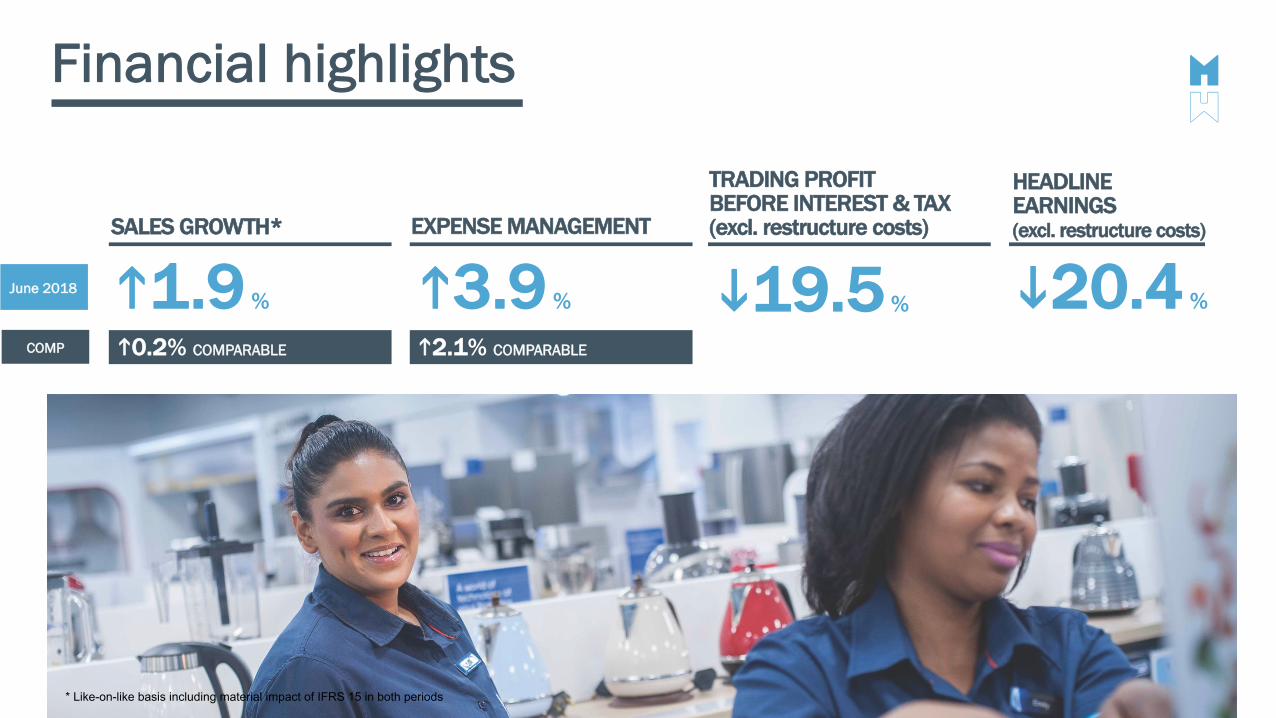
Financial highlights
SALES GROWTH* EXPENSE MANAGEMENT
TRADING PROFIT BEFORE INTEREST & TAX(excl. restructure costs)
HEADLINE EARNINGS (excl. restructure costs)
h1.9 % h3.9 % i19.5 % i20.4 %
h0.2% COMPARABLE h2.1% COMPARABLE
June 2018
COMP
* Like-on-like basis including material impact of IFRS 15 in both periods
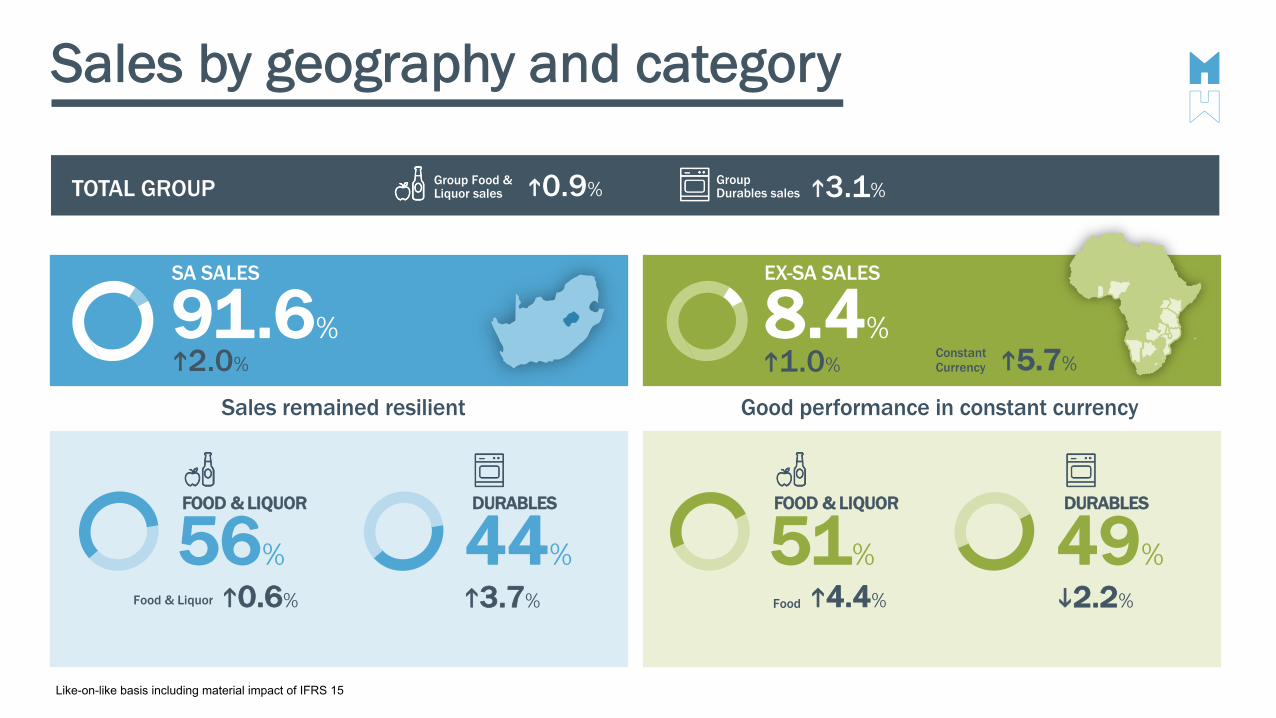
SA SALES
91.6%
EX-SA SALES
8.4%h2.0%
Sales by geography and category
h1.0%
Good performance in constant currency
FOOD & LIQUOR
51%i2.2%
DURABLES
Food h4.4%
49%
FOOD & LIQUOR
56%h3.7%
DURABLES
Food & Liquor h0.6%
44%
ConstantCurrency h5.7%
Group Durables sales h3.1%Group Food &
Liquor sales h0.9%TOTAL GROUP
Sales remained resilient
Like-on-like basis including material impact of IFRS 15
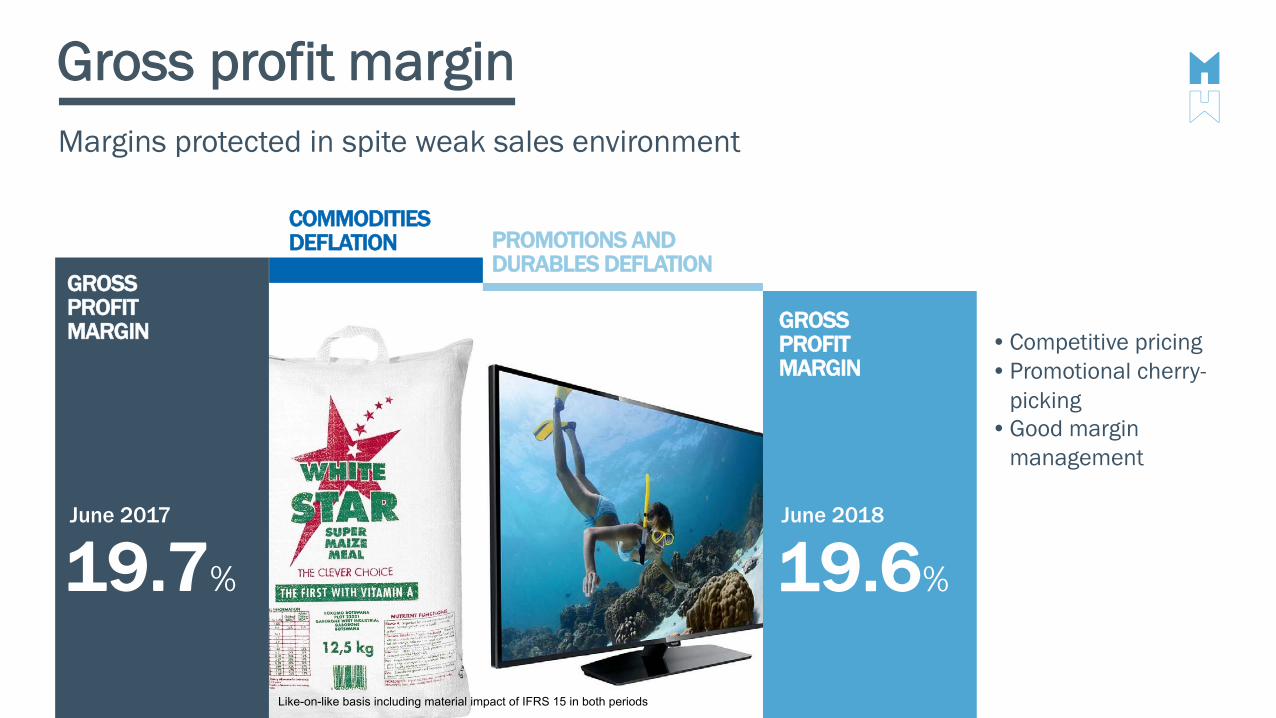
Gross profit margin
June 2017
19.7%
COMMODITIES DEFLATION PROMOTIONS AND
DURABLES DEFLATION
Margins protected in spite weak sales environment
GROSS PROFIT MARGIN
June 2018
19.6%
GROSS PROFIT MARGIN
•Competitive pricing•Promotional cherry-
picking •Good margin
management
Like-on-like basis including material impact of IFRS 15 in both periods
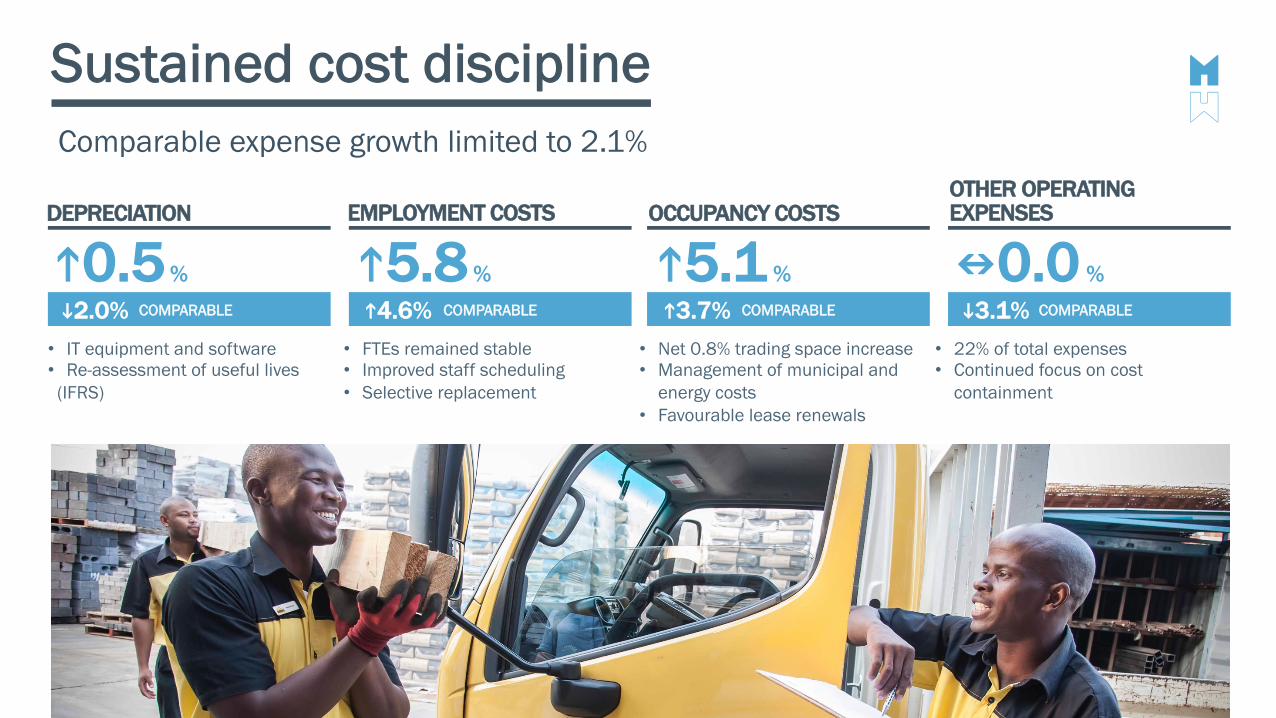
Sustained cost discipline
EMPLOYMENT COSTSDEPRECIATION OCCUPANCY COSTSOTHER OPERATING EXPENSES
h0.5%i2.0%• IT equipment and software• Re-assessment of useful lives(IFRS)
• FTEs remained stable• Improved staff scheduling• Selective replacement
• Net 0.8% trading space increase• Management of municipal and
energy costs• Favourable lease renewals
• 22% of total expenses• Continued focus on cost
containment
h5.8%h4.6%
h5.1 %h3.7%
n0.0 %i3.1%COMPARABLE COMPARABLE COMPARABLE COMPARABLE
Comparable expense growth limited to 2.1%
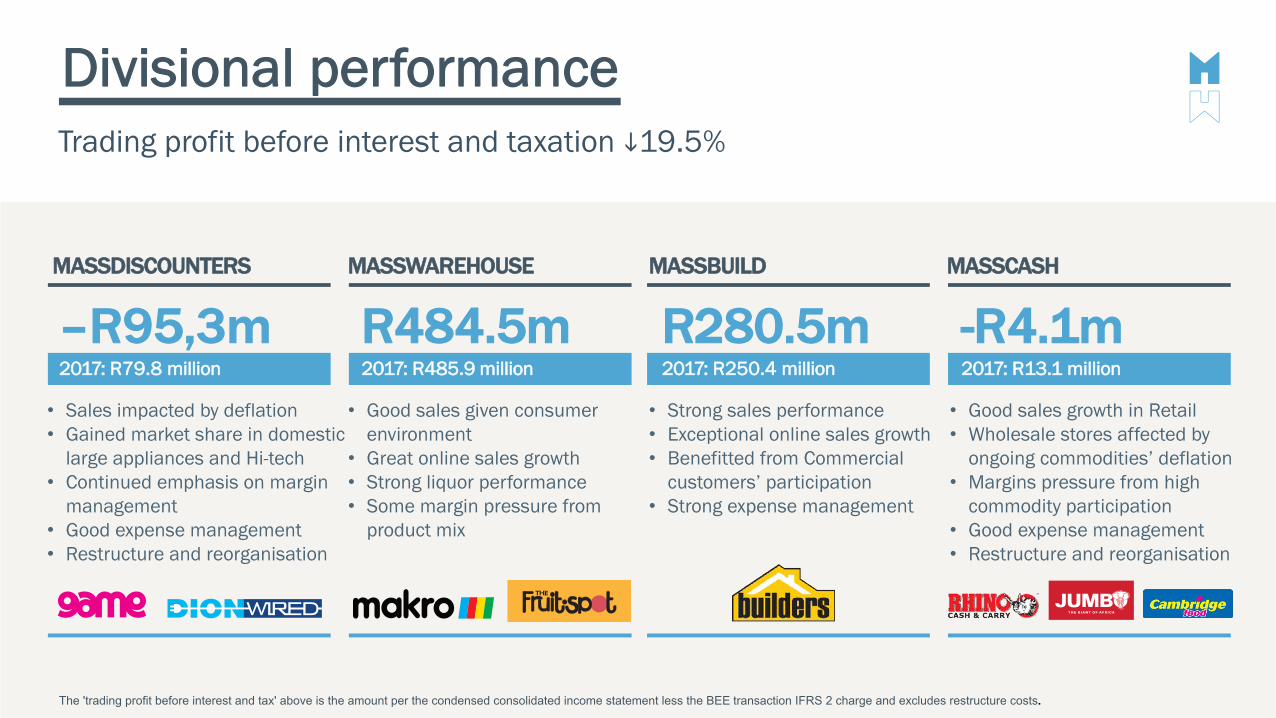
Divisional performance
–R95,3m2017: R79.8 million
R484.5m2017: R485.9 million
R280.5m2017: R250.4 million
-R4.1m2017: R13.1 million
MASSDISCOUNTERS MASSWAREHOUSE MASSBUILD MASSCASH
• Sales impacted by deflation• Gained market share in domestic
large appliances and Hi-tech• Continued emphasis on margin
management• Good expense management• Restructure and reorganisation
• Good sales given consumer environment
• Great online sales growth• Strong liquor performance• Some margin pressure from
product mix
• Strong sales performance• Exceptional online sales growth• Benefitted from Commercial
customers’ participation• Strong expense management
• Good sales growth in Retail• Wholesale stores affected by
ongoing commodities’ deflation• Margins pressure from high
commodity participation• Good expense management• Restructure and reorganisation
The 'trading profit before interest and tax' above is the amount per the condensed consolidated income statement less the BEE transaction IFRS 2 charge and excludes restructure costs.
T H E G I A N T O F A F R I C A
Trading profit before interest and taxation i19.5%
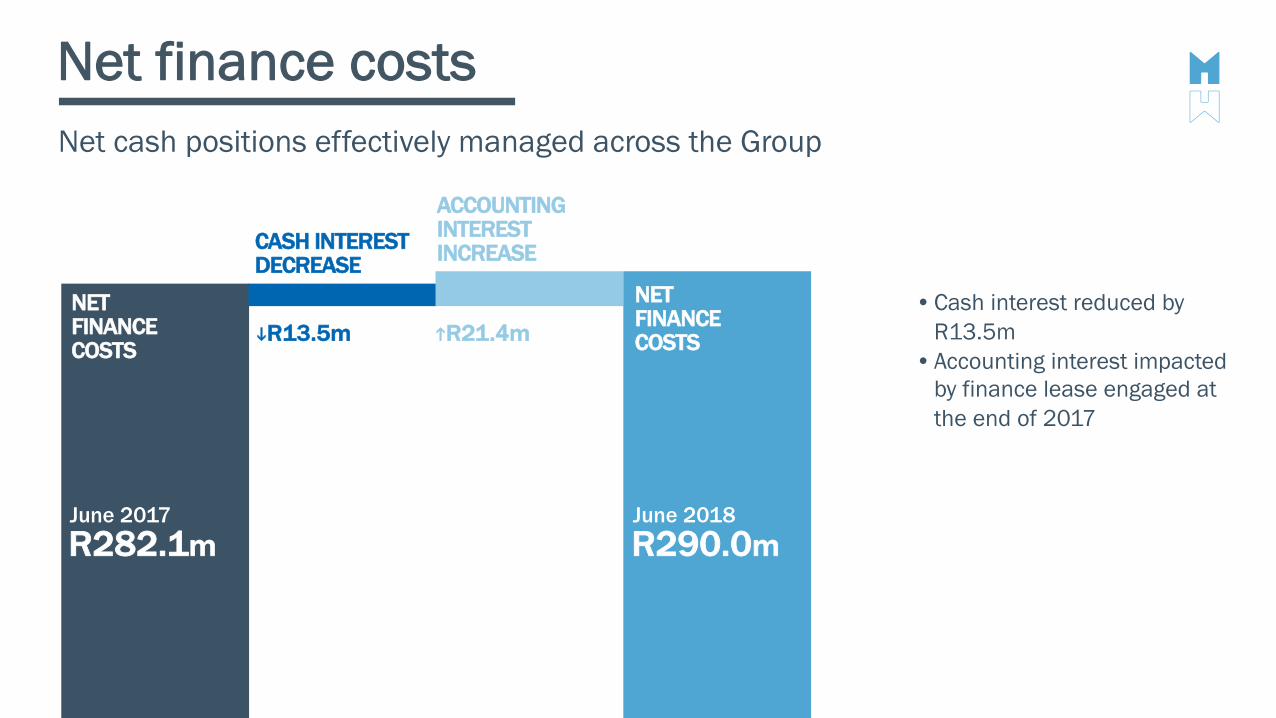
Net finance costs
June 2017R282.1m
CASH INTERESTDECREASE
ACCOUNTINGINTEREST INCREASE
Net cash positions effectively managed across the Group
NETFINANCECOSTS
•Cash interest reduced by R13.5m
•Accounting interest impacted by finance lease engaged at the end of 2017
June 2018R290.0m
hR21.4miR13.5m
NETFINANCECOSTS
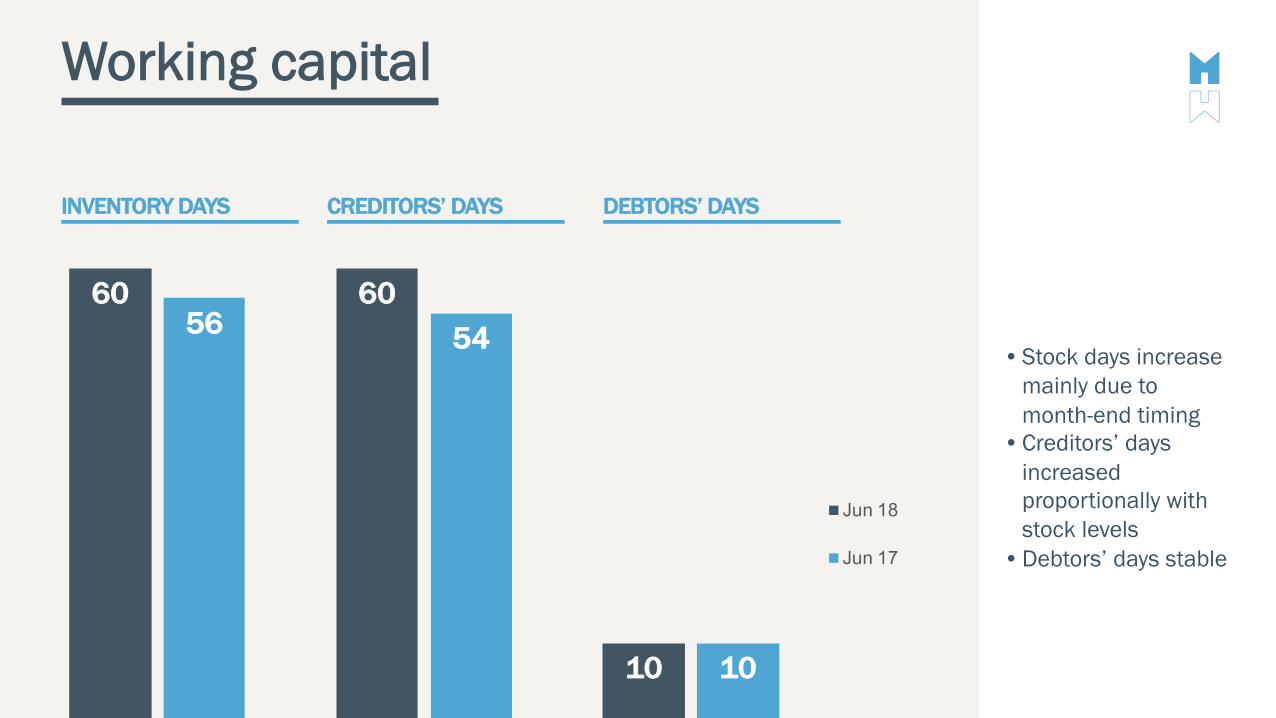
Working capital
DEBTORS’ DAYSCREDITORS’ DAYSINVENTORY DAYS
•Stock days increase mainly due to month-end timing
•Creditors’ days increased proportionally with stock levels
•Debtors’ days stable
60 60
10
56 54
10
Jun 18
Jun 17
OPERATIONAL REVIEW
Guy Hayward
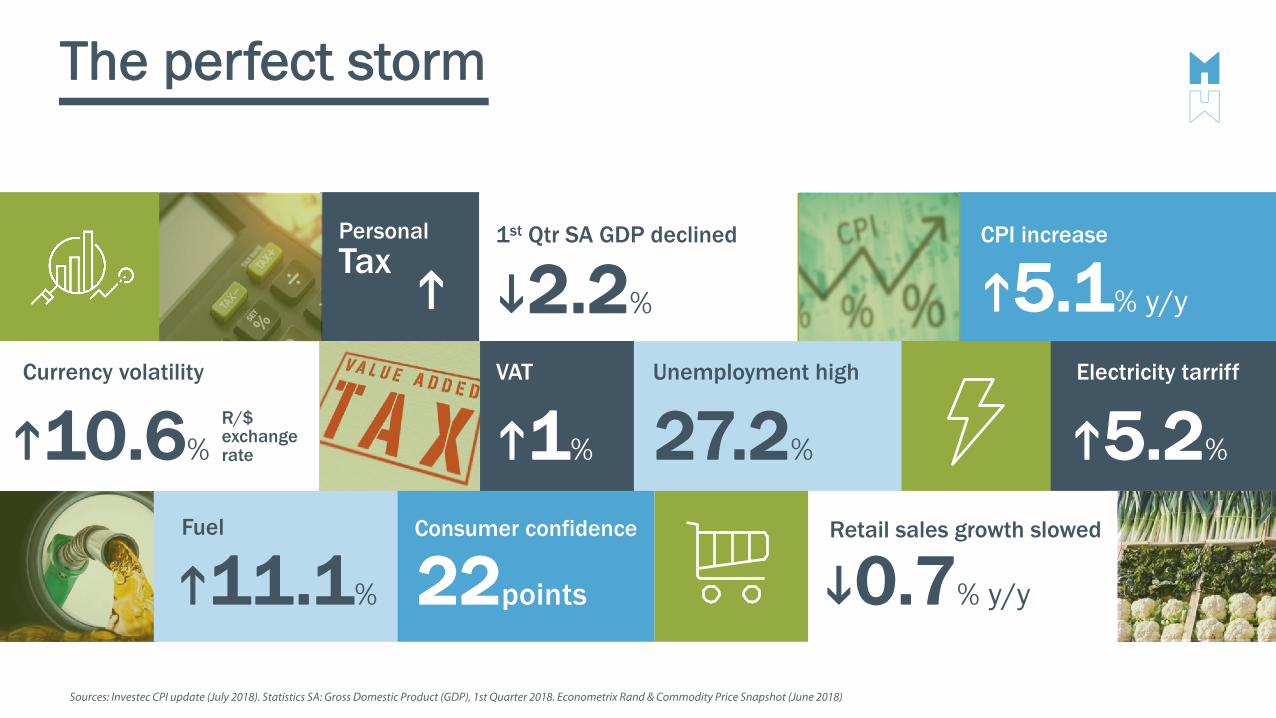
The perfect storm
1st Qtr SA GDP declined CPI increase
Sources: Investec CPI update (July 2018). Statistics SA: Gross Domestic Product (GDP), 1st Quarter 2018. Econometrix Rand & Commodity Price Snapshot (June 2018)
PersonalTax
h5.1% y/yi2.2%hElectricity tarriff
h5.2%
Currency volatility
R/$ exchange rateh10.6%
VAT
h1%
Unemployment high
27.2%
Retail sales growth slowedConsumer confidenceFuel
i0.7% y/yh11.1% 22points
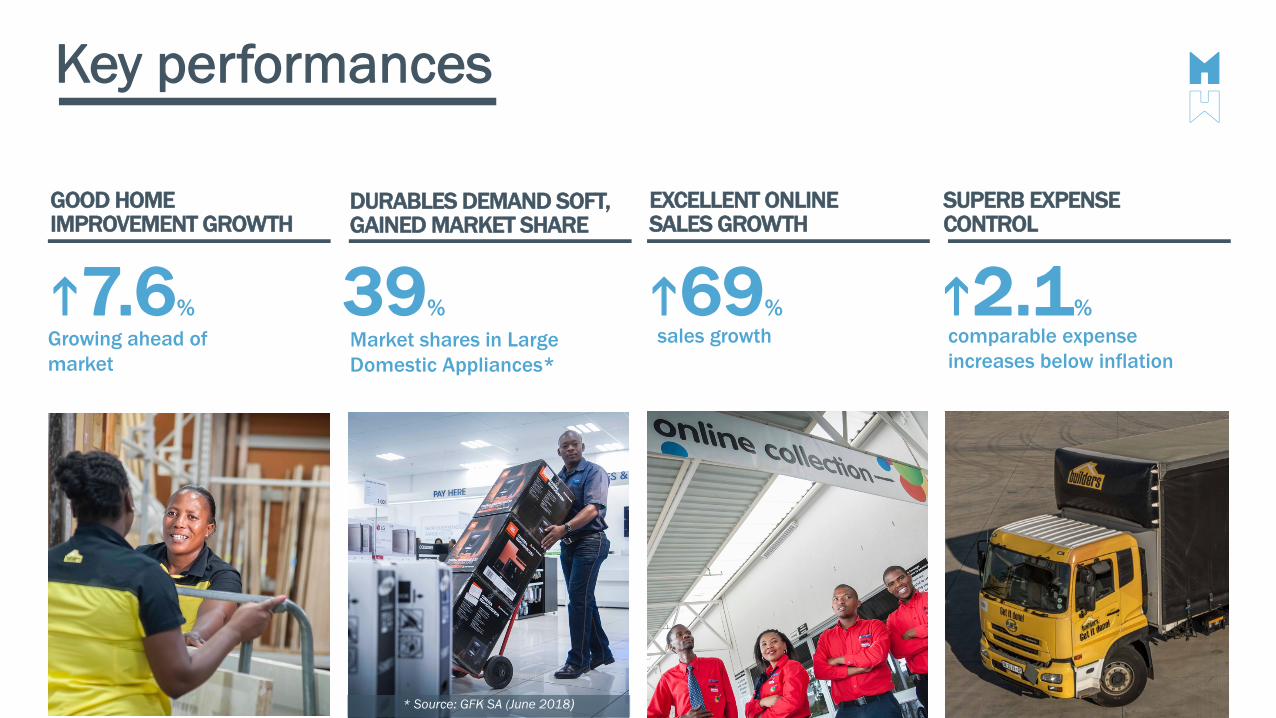
Key performances
Growing ahead of market
comparable expense increases below inflation
sales growthMarket shares in Large Domestic Appliances*
h2.1%39%h7.6% h69%
* Source: GFK SA (June 2018)
EXCELLENT ONLINE SALES GROWTH
SUPERB EXPENSE CONTROL
DURABLES DEMAND SOFT, GAINED MARKET SHARE
GOOD HOME IMPROVEMENT GROWTH
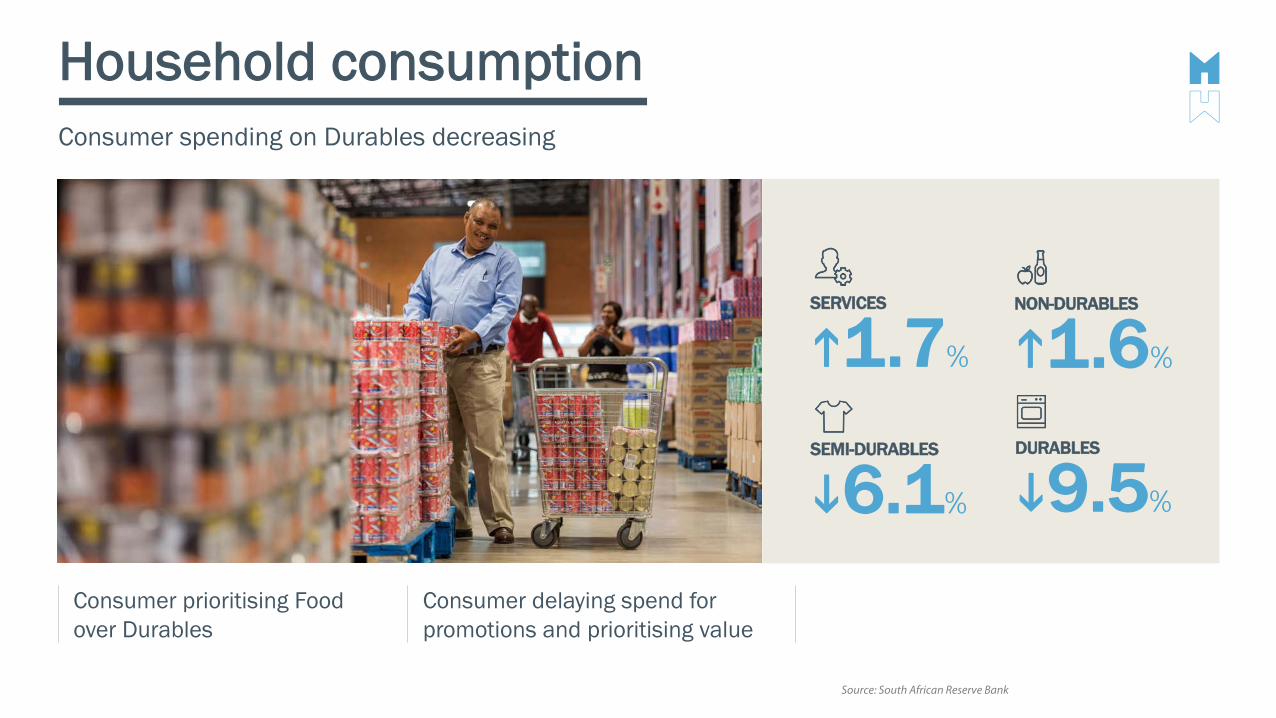
Household consumptionConsumer spending on Durables decreasing
Source: South African Reserve Bank
h1.6%
NON-DURABLES
h1.7%
SERVICES
i9.5%
DURABLES
i6.1%
SEMI-DURABLES
Consumer prioritising Food over Durables
Consumer delaying spend for promotions and prioritising value
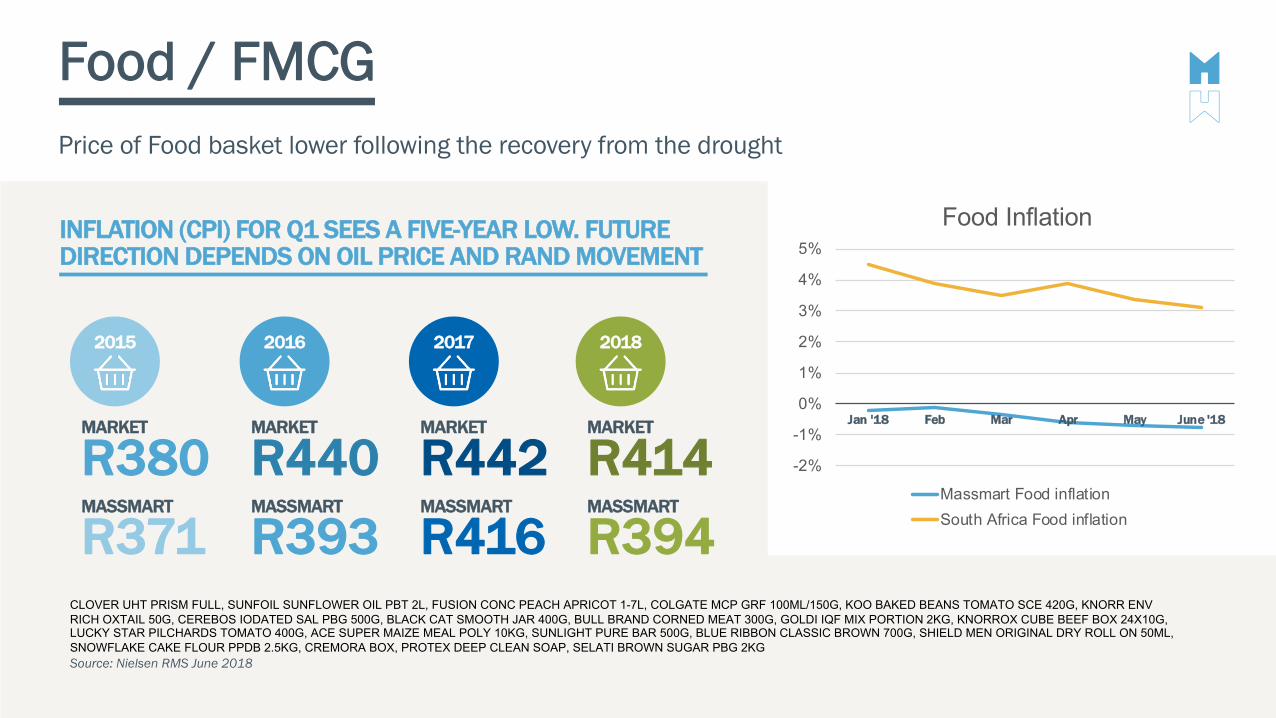
Food / FMCGPrice of Food basket lower following the recovery from the drought
CLOVER UHT PRISM FULL, SUNFOIL SUNFLOWER OIL PBT 2L, FUSION CONC PEACH APRICOT 1-7L, COLGATE MCP GRF 100ML/150G, KOO BAKED BEANS TOMATO SCE 420G, KNORR ENV RICH OXTAIL 50G, CEREBOS IODATED SAL PBG 500G, BLACK CAT SMOOTH JAR 400G, BULL BRAND CORNED MEAT 300G, GOLDI IQF MIX PORTION 2KG, KNORROX CUBE BEEF BOX 24X10G, LUCKY STAR PILCHARDS TOMATO 400G, ACE SUPER MAIZE MEAL POLY 10KG, SUNLIGHT PURE BAR 500G, BLUE RIBBON CLASSIC BROWN 700G, SHIELD MEN ORIGINAL DRY ROLL ON 50ML, SNOWFLAKE CAKE FLOUR PPDB 2.5KG, CREMORA BOX, PROTEX DEEP CLEAN SOAP, SELATI BROWN SUGAR PBG 2KGSource: Nielsen RMS June 2018
INFLATION (CPI) FOR Q1 SEES A FIVE-YEAR LOW. FUTURE DIRECTION DEPENDS ON OIL PRICE AND RAND MOVEMENT
R380MARKET
R371MASSMART
2015
R440MARKET
R393MASSMART
2016
R442MARKET
R416MASSMART
2017
R414MARKET
R394MASSMART
2018
-2%
-1%
0%
1%
2%
3%
4%
5%
Jan '18 Feb Mar Apr May June '18
Food Inflation
Massmart Food inflation
South Africa Food inflation
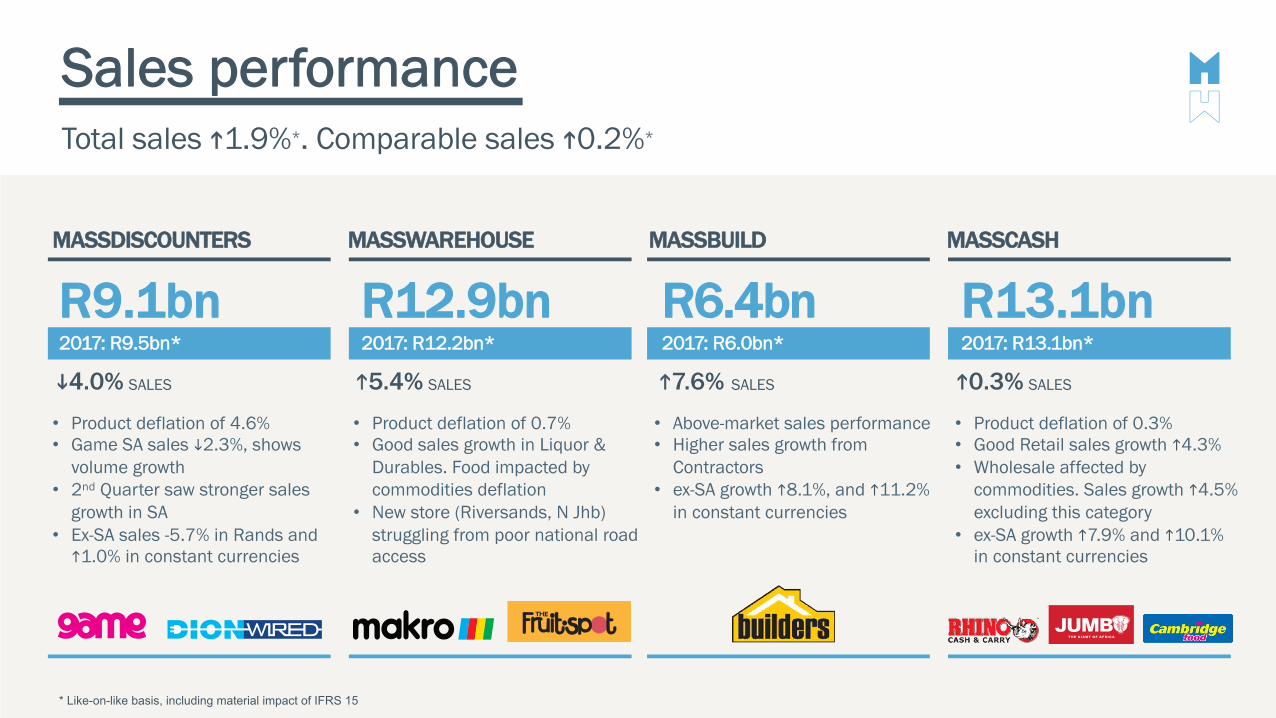
Sales performance
R9.1bn2017: R9.5bn*
R12.9bn2017: R12.2bn*
R6.4bn2017: R6.0bn*
R13.1bn2017: R13.1bn*
Total sales h1.9%*. Comparable sales h0.2%*
MASSDISCOUNTERS MASSWAREHOUSE MASSBUILD MASSCASH
• Product deflation of 4.6%• Game SA sales i2.3%, shows
volume growth • 2nd Quarter saw stronger sales
growth in SA • Ex-SA sales -5.7% in Rands and
h1.0% in constant currencies
• Product deflation of 0.7%• Good sales growth in Liquor &
Durables. Food impacted by commodities deflation
• New store (Riversands, N Jhb) struggling from poor national roadaccess
• Above-market sales performance• Higher sales growth from
Contractors • ex-SA growth h8.1%, and h11.2%
in constant currencies
• Product deflation of 0.3%• Good Retail sales growth h4.3%• Wholesale affected by
commodities. Sales growth h4.5% excluding this category
• ex-SA growth h7.9% and h10.1% in constant currencies
* Like-on-like basis, including material impact of IFRS 15
i4.0% SALES h5.4% SALES h7.6% SALES h0.3% SALES
T H E G I A N T O F A F R I C A
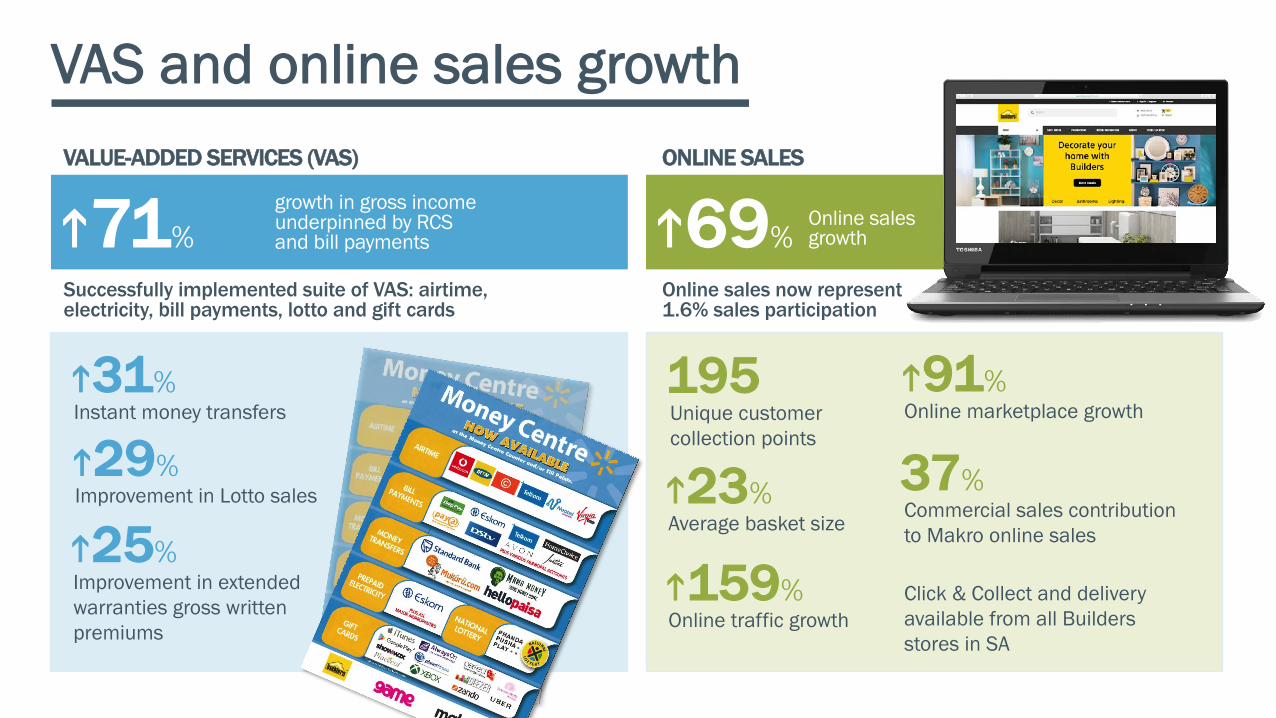
h71%
VAS and online sales growth
growth in gross income underpinned by RCS and bill payments
h29%Improvement in Lotto sales
h31%Instant money transfers
h25%Improvement in extended warranties gross written premiums
Successfully implemented suite of VAS: airtime, electricity, bill payments, lotto and gift cards
h69%Online sales growth
h23%Average basket size
h159%Online traffic growth
h91%Online marketplace growth
195Unique customer collection points
37%Commercial sales contribution to Makro online sales
Click & Collect and delivery available from all Builders stores in SA
Online sales now represent 1.6% sales participation
ONLINE SALESVALUE-ADDED SERVICES (VAS)
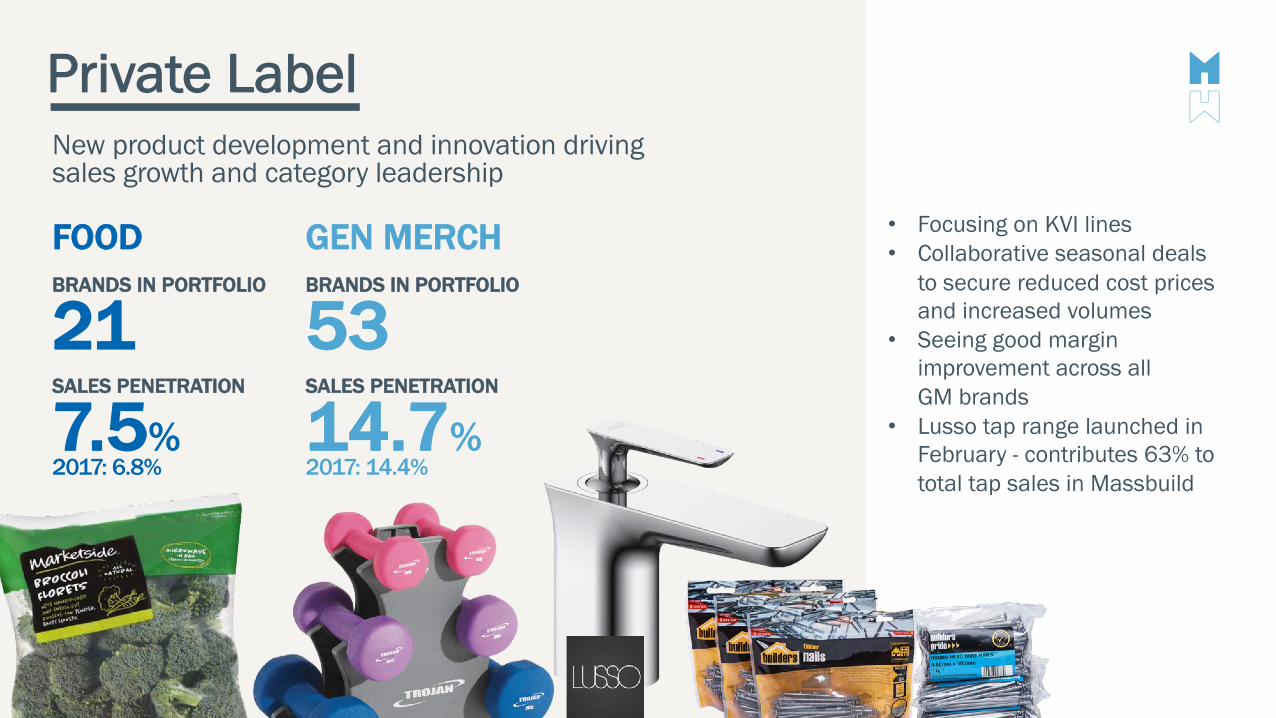
Private LabelNew product development and innovation driving sales growth and category leadership
• Focusing on KVI lines• Collaborative seasonal deals
to secure reduced cost prices and increased volumes
• Seeing good margin improvement across all GM brands
• Lusso tap range launched in February - contributes 63% to total tap sales in Massbuild
GEN MERCH
53BRANDS IN PORTFOLIO
14.7%SALES PENETRATION
2017: 14.4%
FOOD
21BRANDS IN PORTFOLIO
7.5%SALES PENETRATION
2017: 6.8%
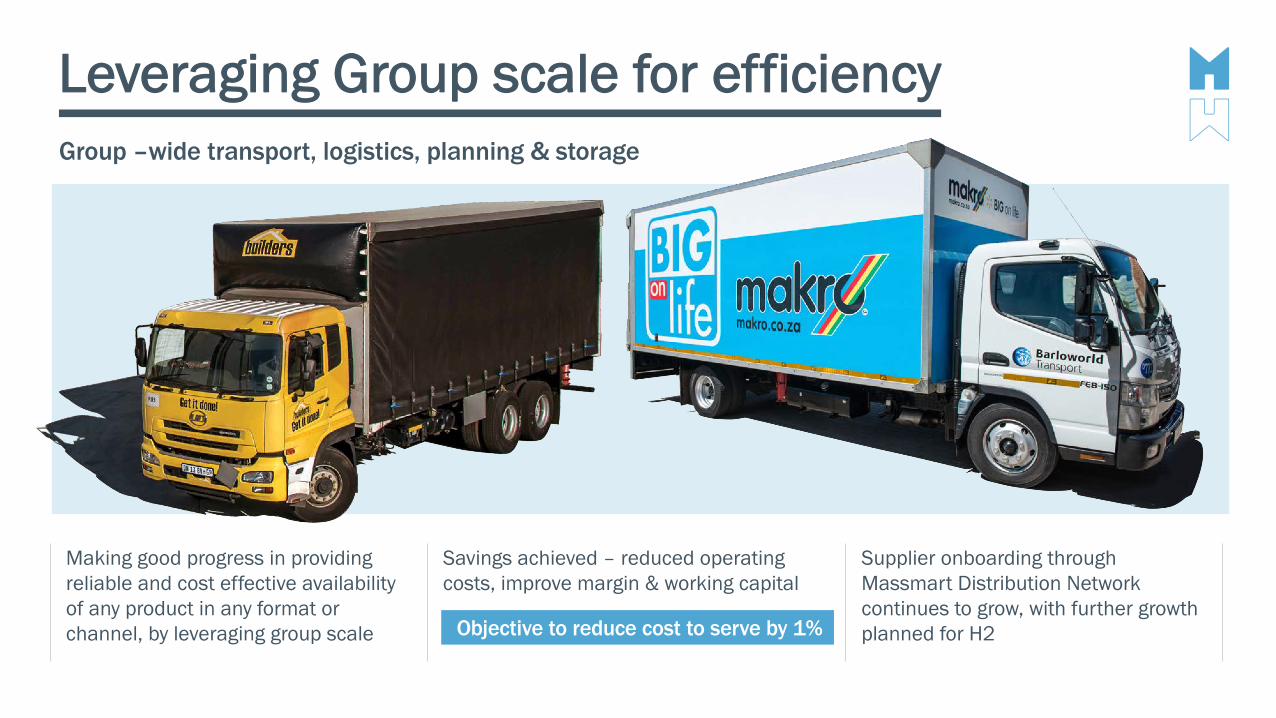
Leveraging Group scale for efficiencyGroup –wide transport, logistics, planning & storage
Making good progress in providing reliable and cost effective availability of any product in any format or channel, by leveraging group scale
Savings achieved – reduced operating costs, improve margin & working capital
Supplier onboarding through Massmart Distribution Network continues to grow, with further growth planned for H2Objective to reduce cost to serve by 1%
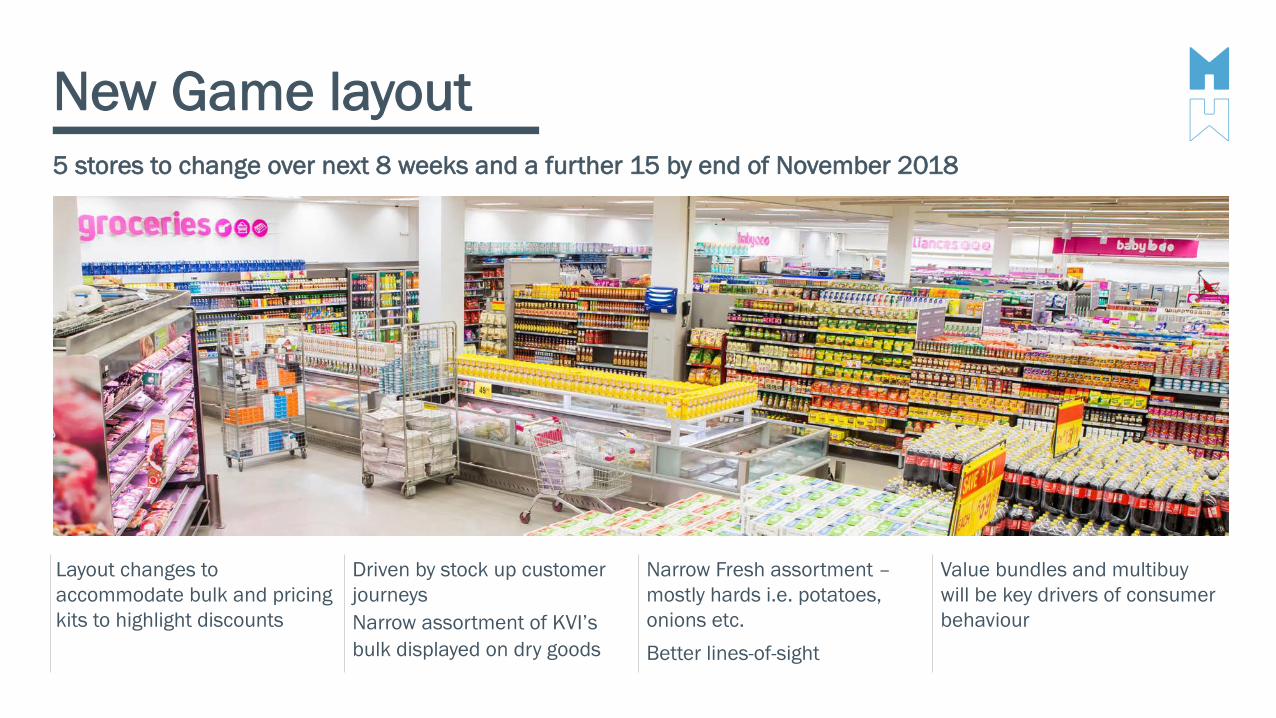
Layout changes to accommodate bulk and pricing kits to highlight discounts
Driven by stock up customer journeysNarrow assortment of KVI’s bulk displayed on dry goods
Narrow Fresh assortment –mostly hards i.e. potatoes, onions etc.Better lines-of-sight
Value bundles and multibuy will be key drivers of consumer behaviour
New Game layout5 stores to change over next 8 weeks and a further 15 by end of November 2018
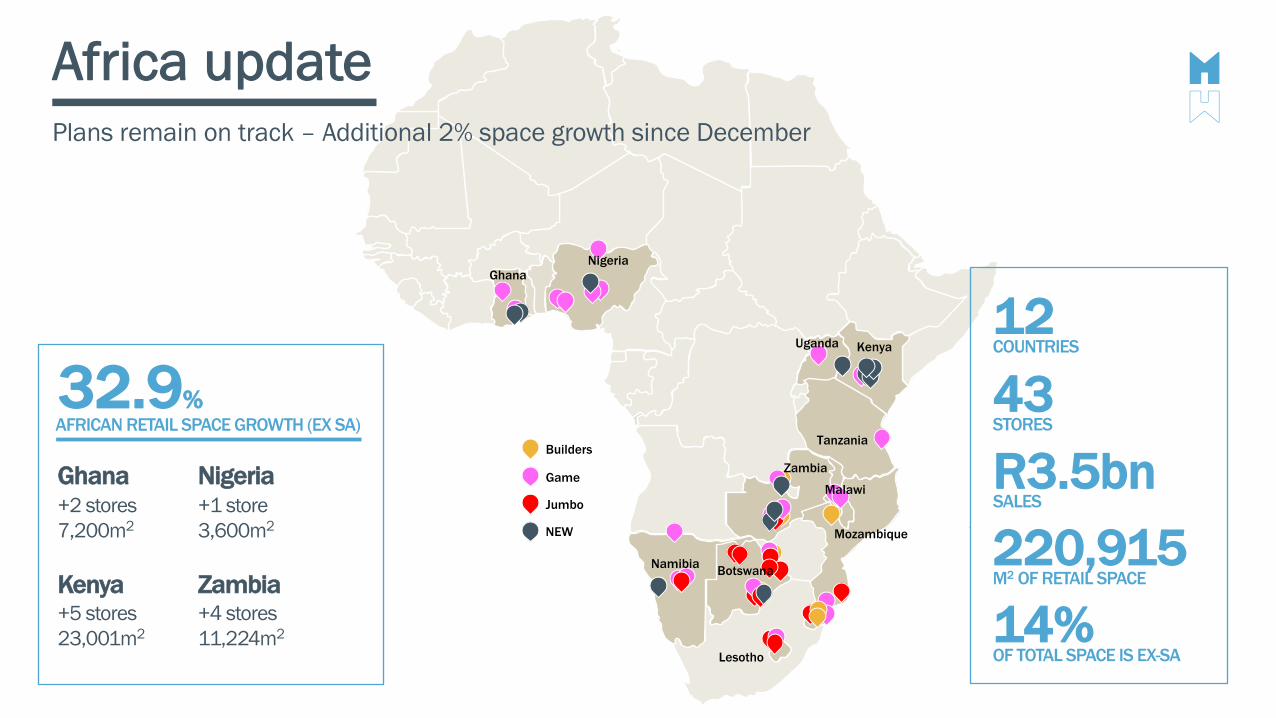
Builders
Game
Jumbo
BotswanaNamibia
Zambia
Mozambique
Uganda
Nigeria
Tanzania
Malawi
Ghana
Lesotho
Kenya
NEW
Africa update
AFRICAN RETAIL SPACE GROWTH (EX SA)32.9%
Ghana+2 stores 7,200m2
Kenya+5 stores 23,001m2
Nigeria+1 store 3,600m2
Zambia+4 stores 11,224m2
Plans remain on track – Additional 2% space growth since December
220,915M2 OF RETAIL SPACE
R3.5bnSALES
43STORES
12COUNTRIES
14%OF TOTAL SPACE IS EX-SA
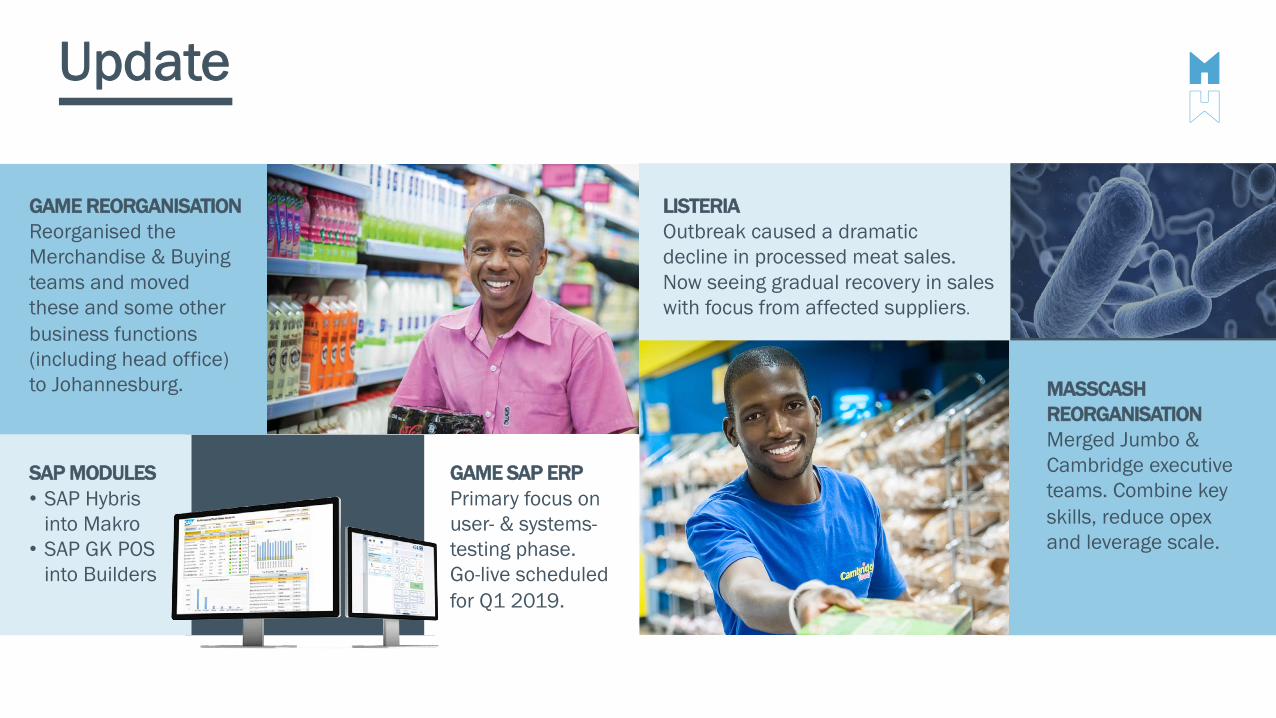
Update
GAME SAP ERPPrimary focus on user- & systems-testing phase.Go-live scheduled for Q1 2019.
MASSCASH REORGANISATIONMerged Jumbo & Cambridge executive teams. Combine key skills, reduce opexand leverage scale.
LISTERIAOutbreak caused a dramatic decline in processed meat sales. Now seeing gradual recovery in sales with focus from affected suppliers.
GAME REORGANISATIONReorganised the Merchandise & Buying teams and moved these and some other business functions (including head office) to Johannesburg.
SAP MODULES• SAP Hybris
into Makro• SAP GK POS
into Builders
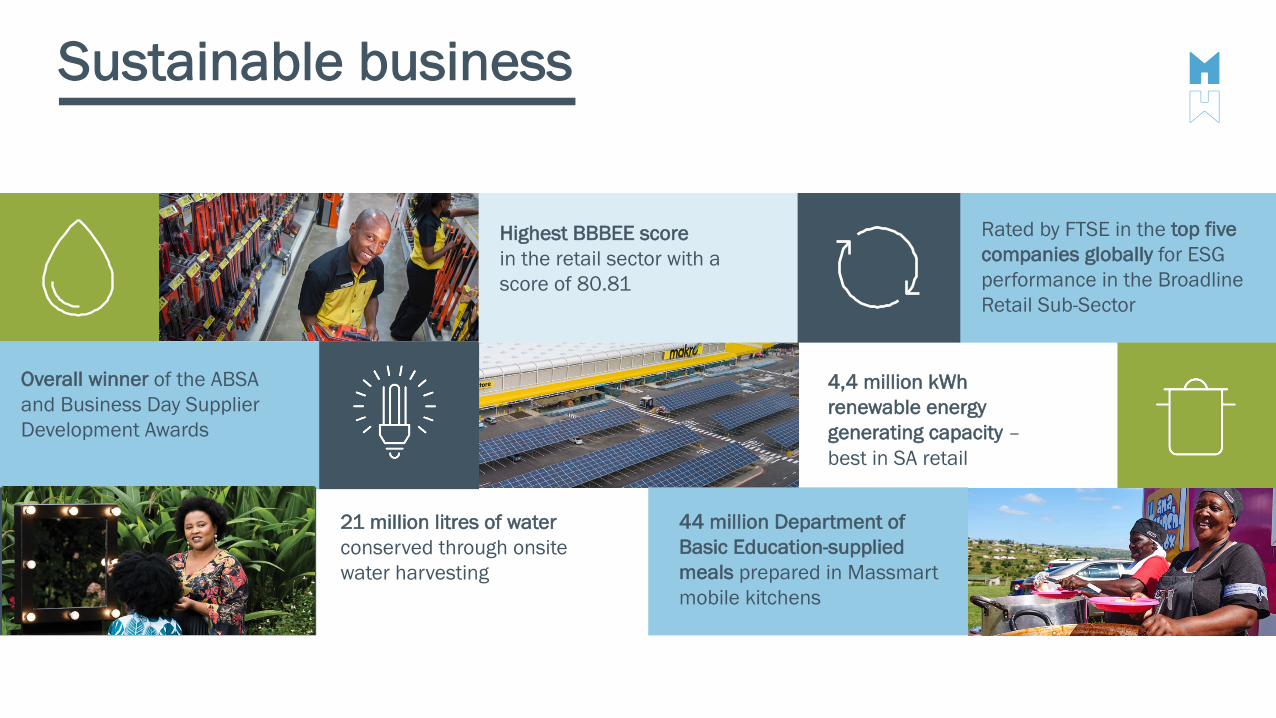
4,4 million kWh renewable energy generating capacity –best in SA retail
Sustainable business
Highest BBBEE score in the retail sector with a score of 80.81
Overall winner of the ABSA and Business Day Supplier Development Awards
44 million Department of Basic Education-supplied meals prepared in Massmart mobile kitchens
Rated by FTSE in the top five companies globally for ESG performance in the Broadline Retail Sub-Sector
21 million litres of waterconserved through onsite water harvesting
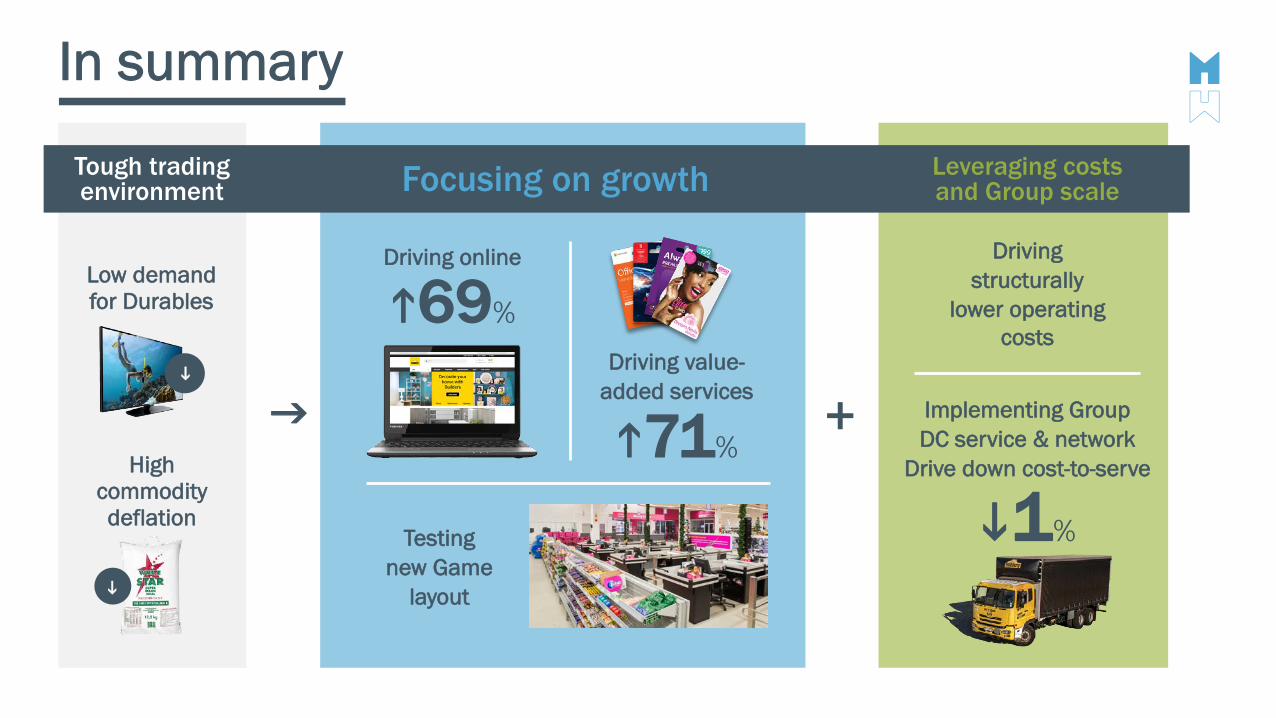
In summary
Low demand for Durables
High commodity deflation
i
iDriving value-
added services
h71%
Driving online
h69%
Testing new Game
layout
Focusing on growth
g
Tough trading environment
Leveraging costsand Group scale
+
i1%
Implementing Group DC service & network
Drive down cost-to-serve
Driving structurally
lower operating costs
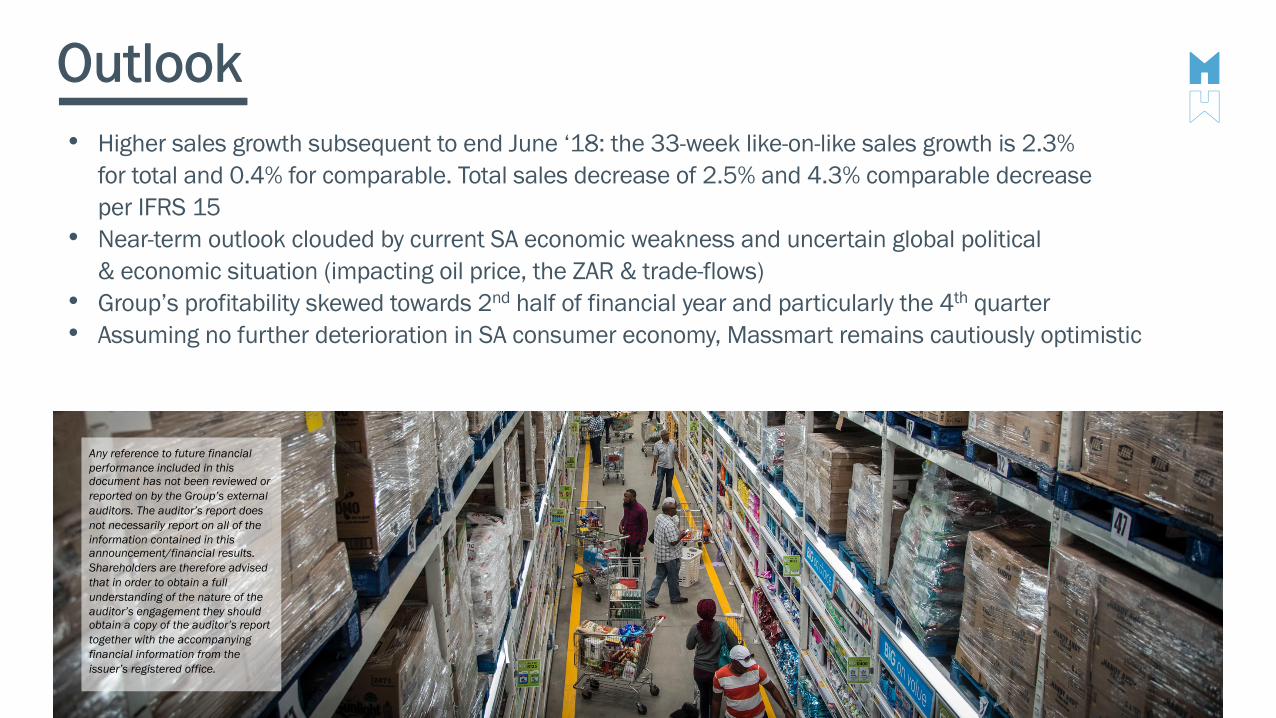
Outlook• Higher sales growth subsequent to end June ‘18: the 33-week like-on-like sales growth is 2.3%
for total and 0.4% for comparable. Total sales decrease of 2.5% and 4.3% comparable decrease per IFRS 15
• Near-term outlook clouded by current SA economic weakness and uncertain global political & economic situation (impacting oil price, the ZAR & trade-flows)
• Group’s profitability skewed towards 2nd half of financial year and particularly the 4th quarter • Assuming no further deterioration in SA consumer economy, Massmart remains cautiously optimistic
Any reference to future financial performance included in this document has not been reviewed or reported on by the Group’s external auditors. The auditor’s report does not necessarily report on all of the information contained in this announcement/financial results. Shareholders are therefore advised that in order to obtain a full understanding of the nature of the auditor’s engagement they should obtain a copy of the auditor’s report together with the accompanying financial information from the issuer’s registered office.
FOR FURTHER DETAILSWWW.MASSMART.CO.ZA/INTERIMRESULTS2018
ADDITIONAL INFORMATIONCondensed consolidated income statementTax rate reconciliationCash flow statementCapital expenditureCapex per categoryStore portfolioForecast stores: Jul 2018 – Jun 2020Number of shares
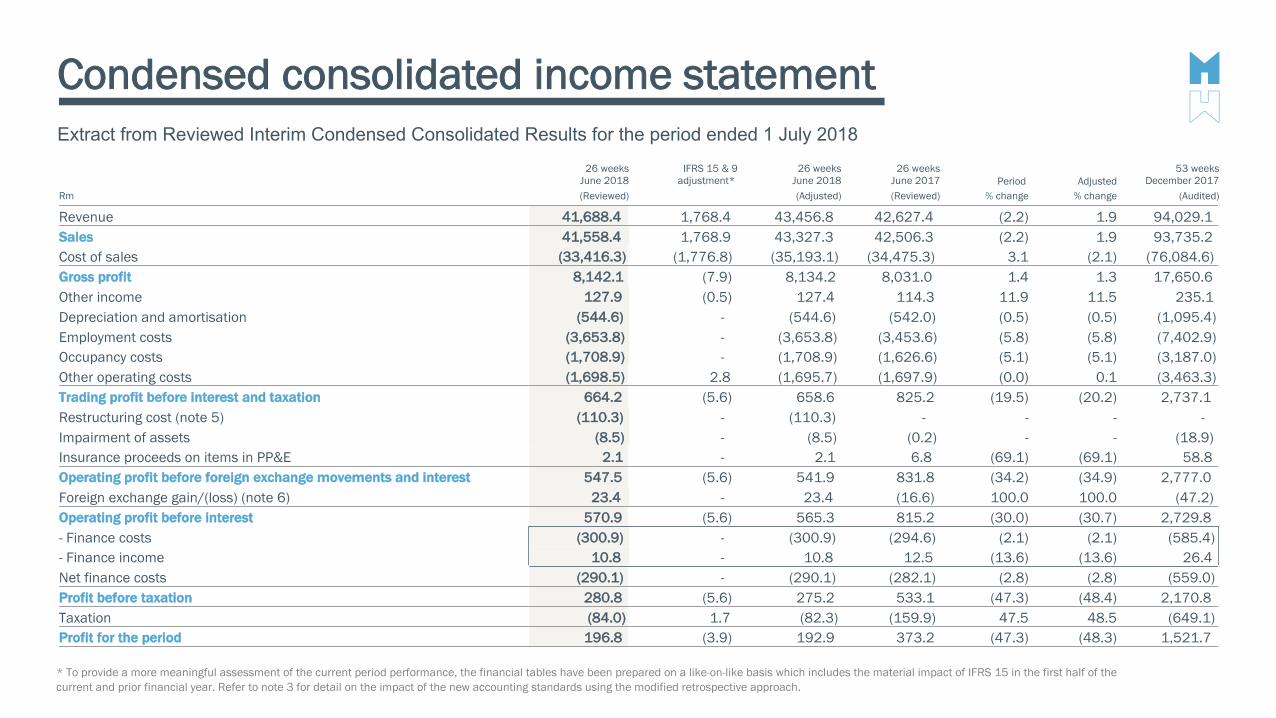
Condensed consolidated income statementExtract from Reviewed Interim Condensed Consolidated Results for the period ended 1 July 2018
* To provide a more meaningful assessment of the current period performance, the financial tables have been prepared on a like-on-like basis which includes the material impact of IFRS 15 in the first half of the current and prior financial year. Refer to note 3 for detail on the impact of the new accounting standards using the modified retrospective approach.
26 weeksJune 2018
IFRS 15 & 9 adjustment*
26 weeksJune 2018
26 weeksJune 2017 Period Adjusted
53 weeksDecember 2017
Rm (Reviewed) (Adjusted) (Reviewed) % change % change (Audited)
Revenue 41,688.4 1,768.4 43,456.8 42,627.4 (2.2) 1.9 94,029.1 Sales 41,558.4 1,768.9 43,327.3 42,506.3 (2.2) 1.9 93,735.2 Cost of sales (33,416.3) (1,776.8) (35,193.1) (34,475.3) 3.1 (2.1) (76,084.6)Gross profit 8,142.1 (7.9) 8,134.2 8,031.0 1.4 1.3 17,650.6 Other income 127.9 (0.5) 127.4 114.3 11.9 11.5 235.1 Depreciation and amortisation (544.6) - (544.6) (542.0) (0.5) (0.5) (1,095.4)Employment costs (3,653.8) - (3,653.8) (3,453.6) (5.8) (5.8) (7,402.9)Occupancy costs (1,708.9) - (1,708.9) (1,626.6) (5.1) (5.1) (3,187.0)Other operating costs (1,698.5) 2.8 (1,695.7) (1,697.9) (0.0) 0.1 (3,463.3)Trading profit before interest and taxation 664.2 (5.6) 658.6 825.2 (19.5) (20.2) 2,737.1 Restructuring cost (note 5) (110.3) - (110.3) - - - -Impairment of assets (8.5) - (8.5) (0.2) - - (18.9)Insurance proceeds on items in PP&E 2.1 - 2.1 6.8 (69.1) (69.1) 58.8 Operating profit before foreign exchange movements and interest 547.5 (5.6) 541.9 831.8 (34.2) (34.9) 2,777.0 Foreign exchange gain/(loss) (note 6) 23.4 - 23.4 (16.6) 100.0 100.0 (47.2)Operating profit before interest 570.9 (5.6) 565.3 815.2 (30.0) (30.7) 2,729.8 - Finance costs (300.9) - (300.9) (294.6) (2.1) (2.1) (585.4)- Finance income 10.8 - 10.8 12.5 (13.6) (13.6) 26.4 Net finance costs (290.1) - (290.1) (282.1) (2.8) (2.8) (559.0)Profit before taxation 280.8 (5.6) 275.2 533.1 (47.3) (48.4) 2,170.8 Taxation (84.0) 1.7 (82.3) (159.9) 47.5 48.5 (649.1)Profit for the period 196.8 (3.9) 192.9 373.2 (47.3) (48.3) 1,521.7
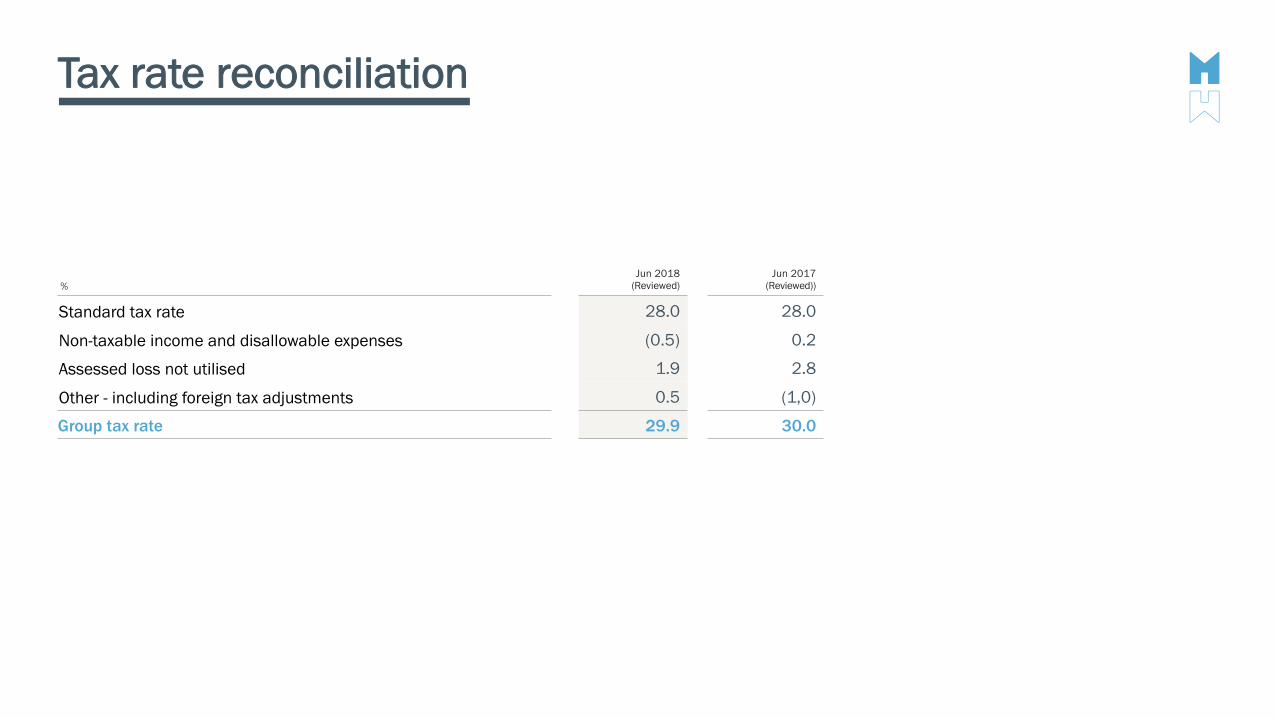
Tax rate reconciliation
%Jun 2018
(Reviewed)Jun 2017
(Reviewed))
Standard tax rate 28.0 28.0
Non-taxable income and disallowable expenses (0.5) 0.2
Assessed loss not utilised 1.9 2.8
Other - including foreign tax adjustments 0.5 (1,0)
Group tax rate 29.9 30.0
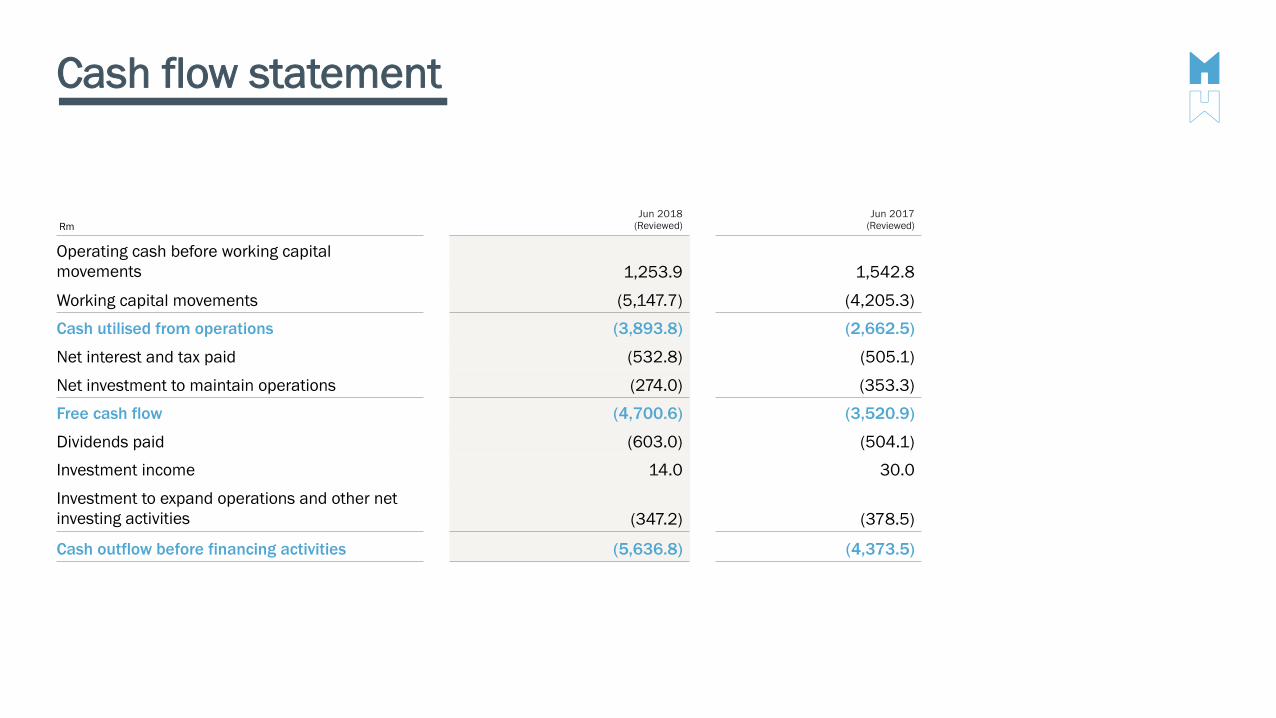
Cash flow statement
RmJun 2018
(Reviewed)Jun 2017
(Reviewed)
Operating cash before working capital movements 1,253.9 1,542.8
Working capital movements (5,147.7) (4,205.3)
Cash utilised from operations (3,893.8) (2,662.5)
Net interest and tax paid (532.8) (505.1)
Net investment to maintain operations (274.0) (353.3)
Free cash flow (4,700.6) (3,520.9)
Dividends paid (603.0) (504.1)
Investment income 14.0 30.0
Investment to expand operations and other net investing activities (347.2) (378.5)
Cash outflow before financing activities (5,636.8) (4,373.5)
0.0
200.0
400.0
600.0
800.0
1,000.0
1,200.0
1,400.0
0.0%
0.5%
1.0%
1.5%
2.0%
2.5%
3.0%
3.5%
4.0%
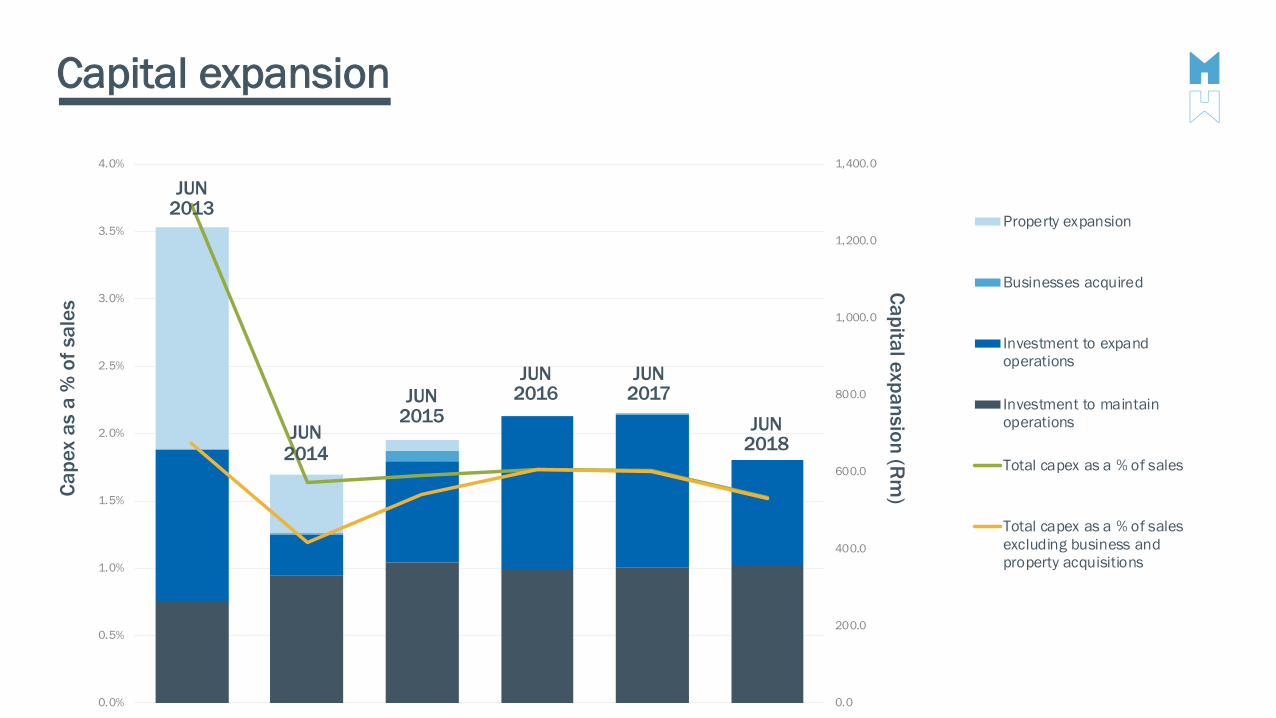
Property expansion
Businesses acquired
Investment to expandoperations
Investment to maintainoperations
Total capex as a % of sales
Total capex as a % of salesexcluding business andproperty acquisitions
Cape
x as
a %
of s
ales
JUN 2013
JUN 2015
JUN2014
JUN 2016
JUN 2017
JUN 2018
Capital expansion
Capital expansion (Rm
)
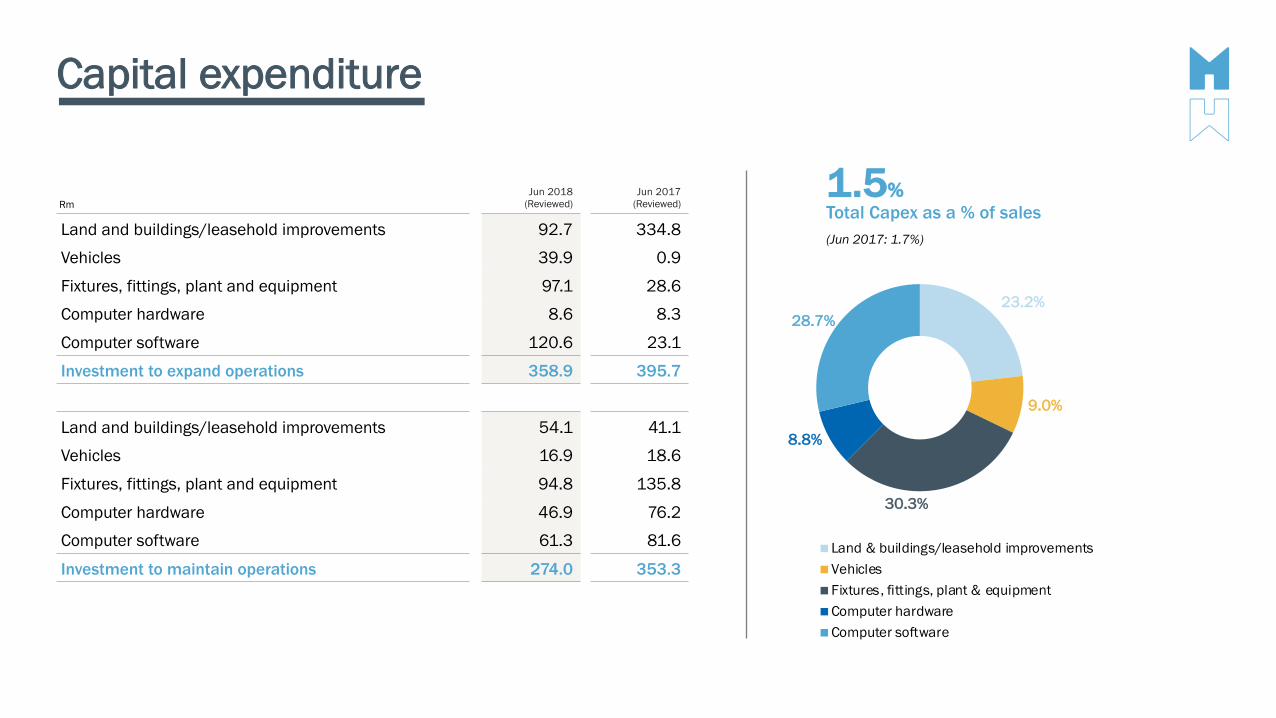
Capital expenditure
RmJun 2018
(Reviewed)Jun 2017
(Reviewed)
Land and buildings/leasehold improvements 92.7 334.8
Vehicles 39.9 0.9
Fixtures, fittings, plant and equipment 97.1 28.6
Computer hardware 8.6 8.3
Computer software 120.6 23.1
Investment to expand operations 358.9 395.7
Land and buildings/leasehold improvements 54.1 41.1
Vehicles 16.9 18.6
Fixtures, fittings, plant and equipment 94.8 135.8
Computer hardware 46.9 76.2
Computer software 61.3 81.6
Investment to maintain operations 274.0 353.3
23.2%
9.0%
30.3%
8.8%
28.7%
Land & buildings/leasehold improvementsVehiclesFixtures, fittings, plant & equipmentComputer hardwareComputer software
Total Capex as a % of sales(Jun 2017: 1.7%)
1.5%
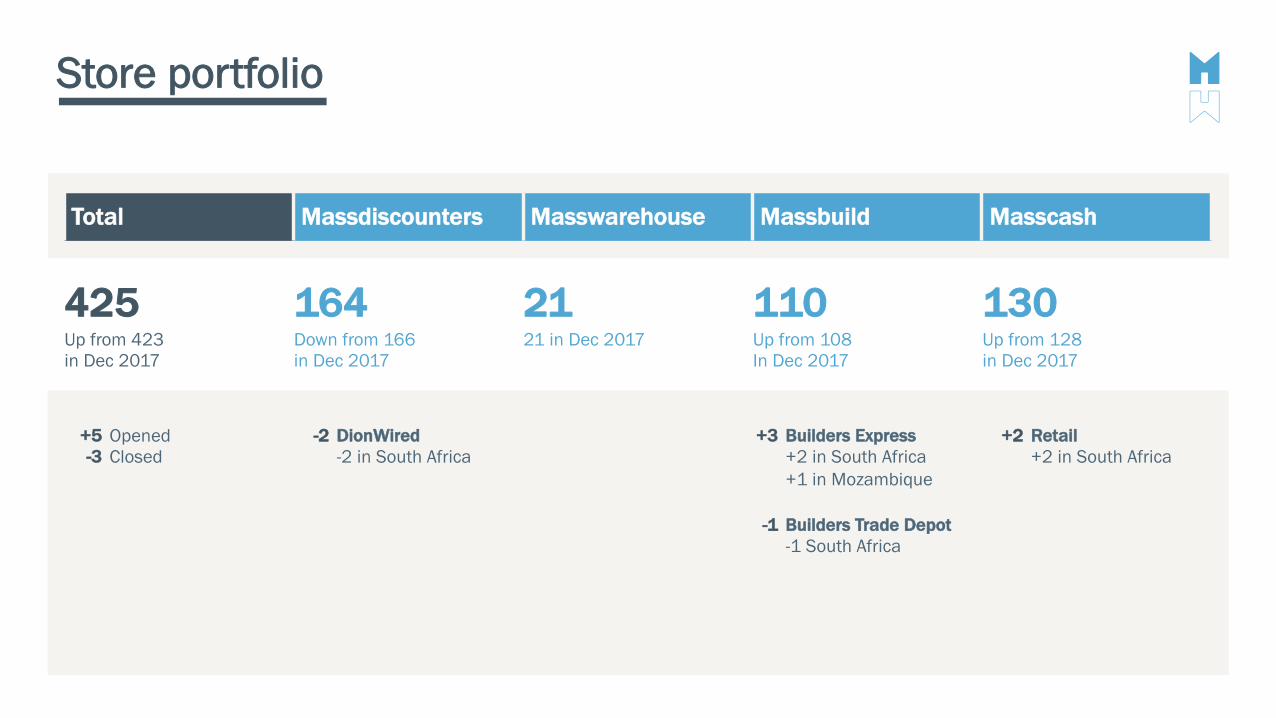
Store portfolio
Total Massdiscounters Masswarehouse Massbuild Masscash
425 164 21 110 130Up from 423 in Dec 2017
Down from 166 in Dec 2017
21 in Dec 2017 Up from 108 In Dec 2017
Up from 128 in Dec 2017
+5-3
OpenedClosed
-2 DionWired-2 in South Africa
+3 Builders Express+2 in South Africa+1 in Mozambique
+2 Retail+2 in South Africa
-1 Builders Trade Depot-1 South Africa
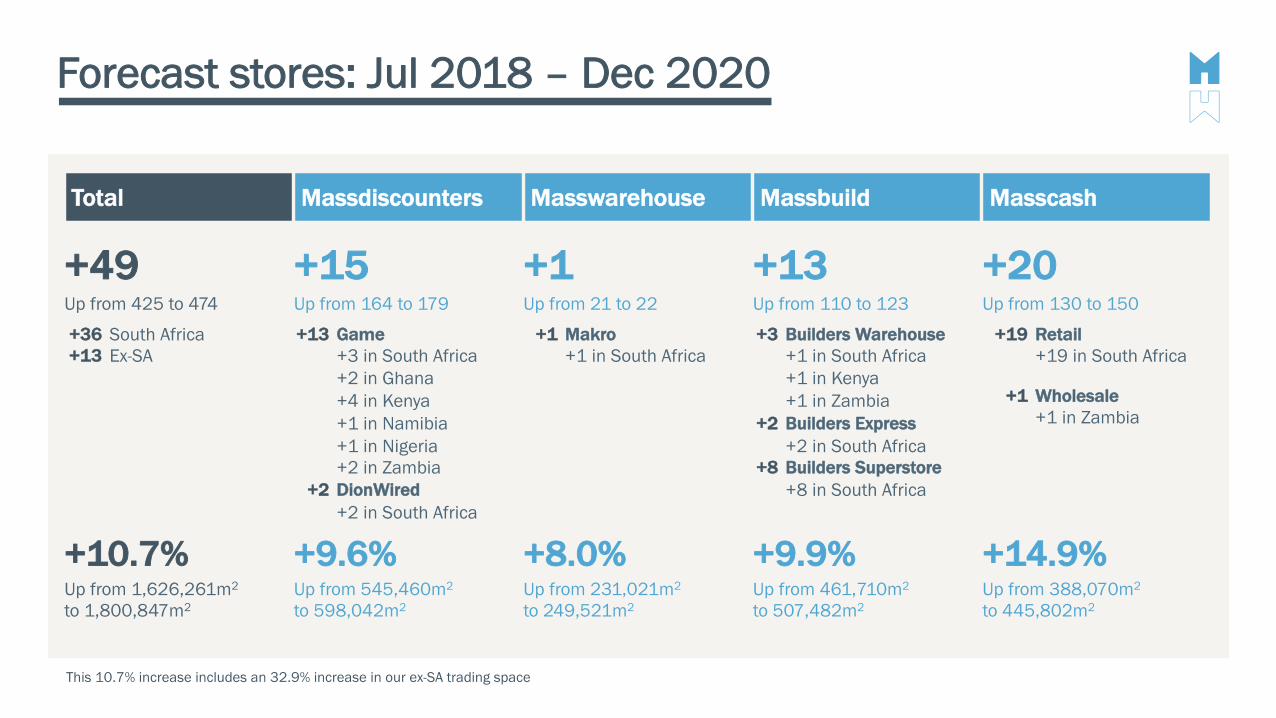
Forecast stores: Jul 2018 – Dec 2020
This 10.7% increase includes an 32.9% increase in our ex-SA trading space
Total Massdiscounters Masswarehouse Massbuild Masscash
+49 +15 +1 +13 +20Up from 425 to 474 Up from 164 to 179 Up from 21 to 22 Up from 110 to 123 Up from 130 to 150
+36 +13
South AfricaEx-SA
+13
+2
Game+3 in South Africa+2 in Ghana+4 in Kenya+1 in Namibia+1 in Nigeria+2 in ZambiaDionWired+2 in South Africa
+1 Makro+1 in South Africa
+3
+2
+8
Builders Warehouse+1 in South Africa+1 in Kenya+1 in ZambiaBuilders Express+2 in South AfricaBuilders Superstore+8 in South Africa
+19 Retail+19 in South Africa
+10.7% +9.6% +8.0% +9.9% +14.9%Up from 1,626,261m2
to 1,800,847m2Up from 545,460m2
to 598,042m2Up from 231,021m2
to 249,521m2Up from 461,710m2
to 507,482m2Up from 388,070m2
to 445,802m2
+1 Wholesale+1 in Zambia
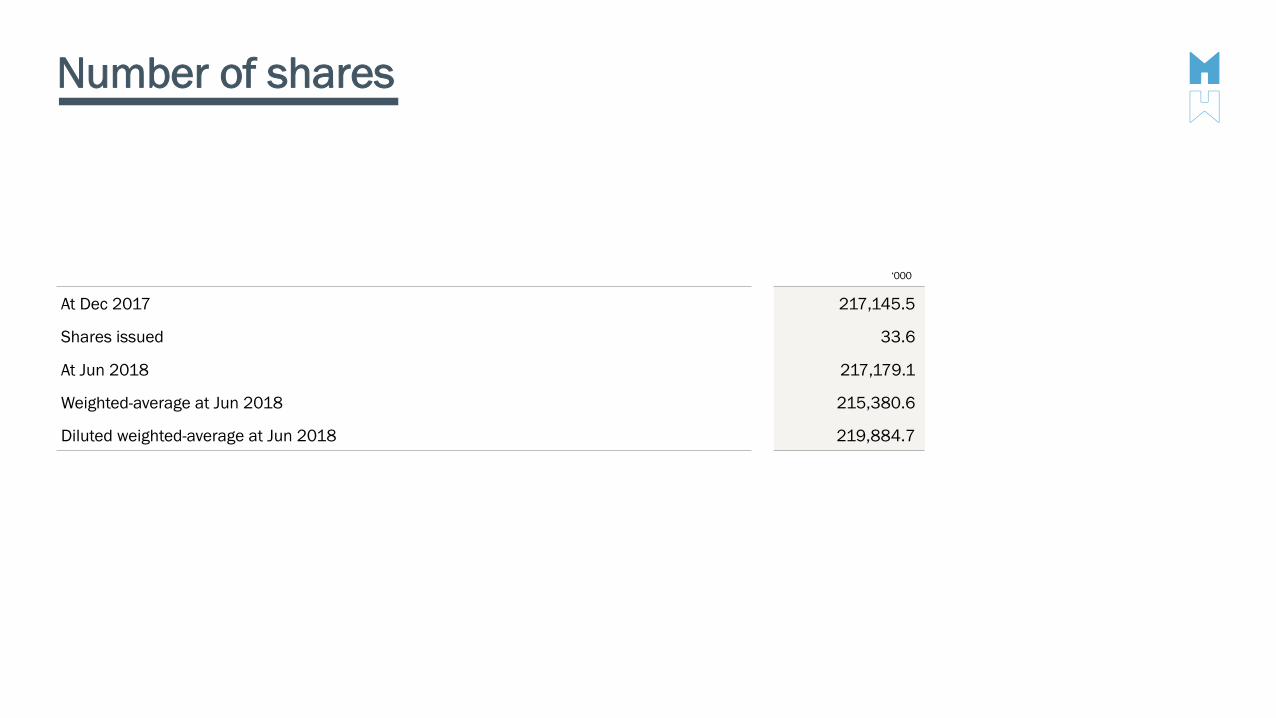
Number of shares
‘000
At Dec 2017 217,145.5
Shares issued 33.6
At Jun 2018 217,179.1
Weighted-average at Jun 2018 215,380.6
Diluted weighted-average at Jun 2018 219,884.7