Embed Size (px)
Citation preview
RESULTS PRESENTATION
Q3FY11
1. HIGHLIGHTS
2.BUSINESS WISE PERFORMANCE
3.WAY FORWARD
4.FINANCIAL RESULTS
2
CONTENTS
1. Statements in this “Presentation” describing the Company’s objectives, projections, estimates,expectations or predictions may be “forward looking statements” within the meaning of applicablesecurities laws and regulations. Actual results could differ materially from those expressed or implied.Important factors that could make a difference to the Company’s operations include global and Indiandemand supply conditions, finished goods prices, input material availability and prices, cyclical demandand pricing in the Company’s principal markets, changes in Government regulations, tax regimes,economic developments within India and the countries within which the company conducts businessand other factors such as litigation and labour negotiations. The Company assumes no responsibility topublicly amend, modify or revise any forward looking statement, on the basis of any subsequentdevelopment, information or events, or otherwise.
2. Numbers mentioned in this note other than Raymond Ltd standalone results, including quarterlyconsolidated revenues and results and additional information including but not limited to retail sales andbranded sales etc. have been compiled by the management and are being provided only by way ofadditional information. These are not to be construed as being provided under any legal or regulatoryrequirements. The accuracy of this information and the provisional quarterly consolidated numbers haveneither been vetted nor approved by the Audit Committee and the Board of Directors of Raymond Ltd.,nor have they been vetted or reviewed by the Auditors, and therefore may differ significantly from theactual. The Company assumes no responsibility for the use of information mentioned herein.
3. Previous years figures have been regrouped wherever necessary.
3
DISCLAIMER

HIGHLIGHTS
4
HIGHLIGHTS
5
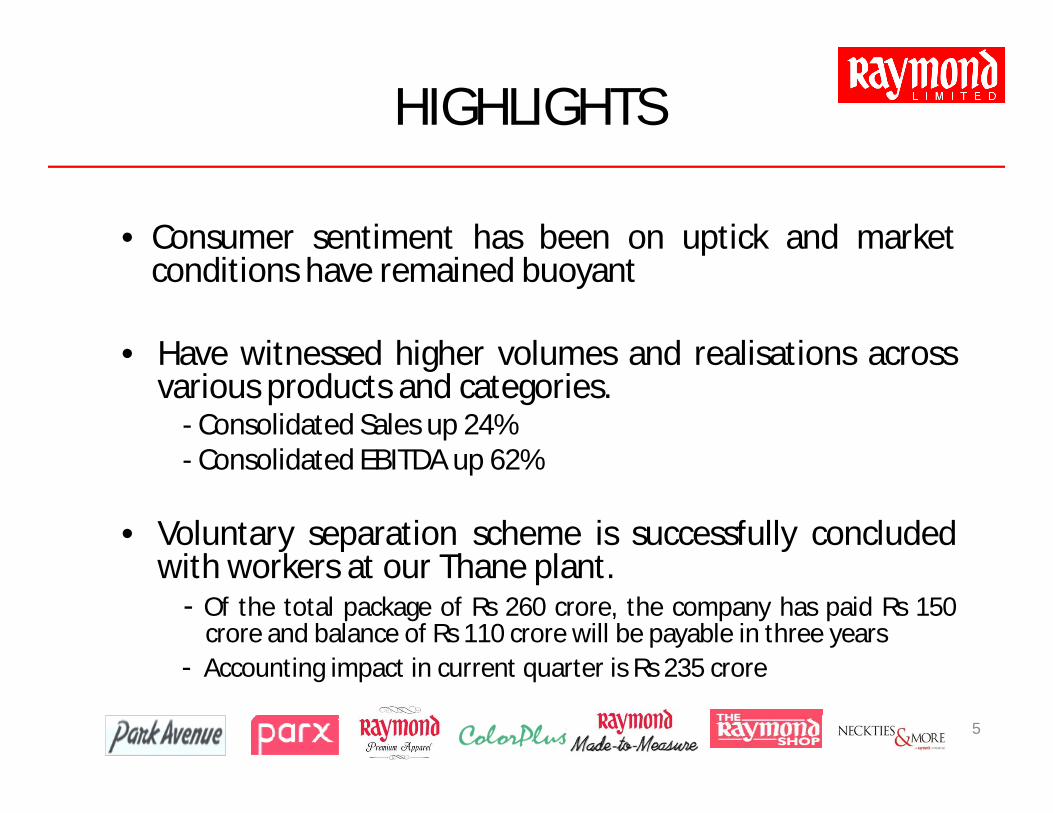
• Consumer sentiment has been on uptick and marketconditions have remained buoyant
• Have witnessed higher volumes and realisations acrossvarious products and categories.
- Consolidated Sales up 24%- Consolidated EBITDA up 62%
• Voluntary separation scheme is successfully concludedwith workers at our Thane plant.
- Of the total package of Rs 260 crore, the company has paid Rs 150crore and balance of Rs 110 crore will be payable in three years
- Accounting impact in current quarter is Rs 235 crore
HIGHLIGHTS (contd...)
6
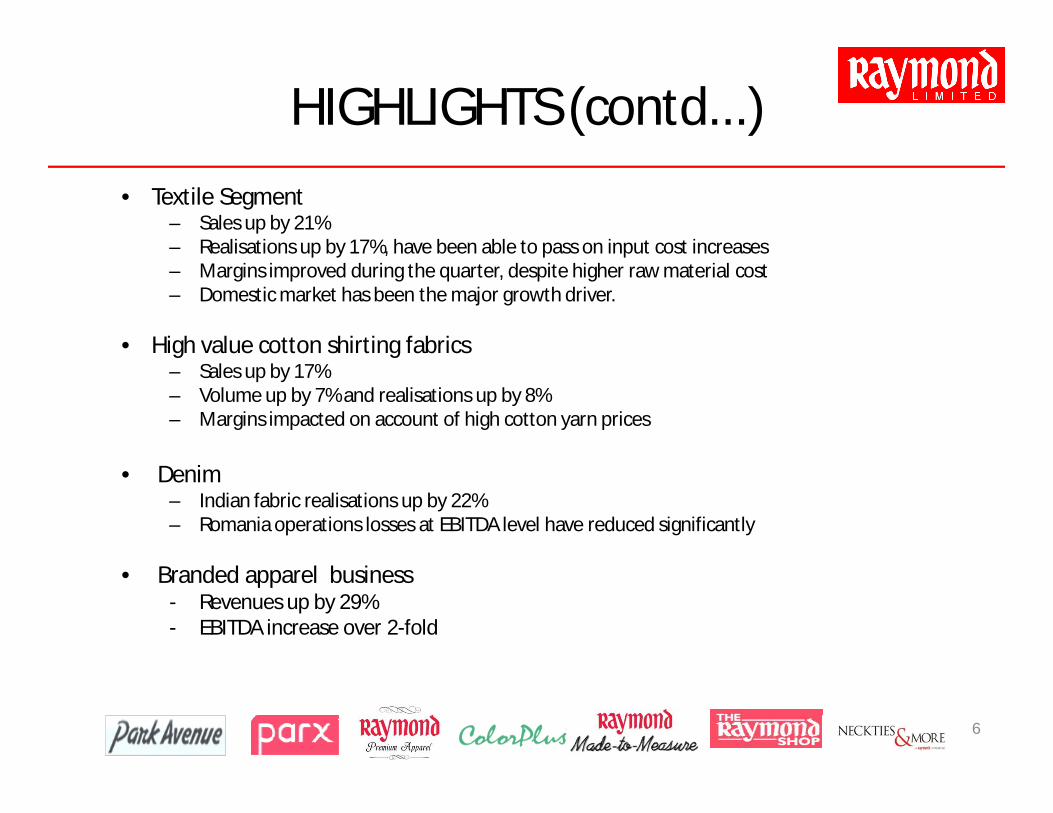
• Textile Segment– Sales up by 21%– Realisations up by 17%, have been able to pass on input cost increases– Margins improved during the quarter, despite higher raw material cost– Domestic market has been the major growth driver.
• High value cotton shirting fabrics– Sales up by 17%– Volume up by 7% and realisations up by 8%– Margins impacted on account of high cotton yarn prices
• Denim– Indian fabric realisations up by 22%– Romania operations losses at EBITDA level have reduced significantly
• Branded apparel business- Revenues up by 29%- EBITDA increase over 2-fold
HIGHLIGHTS (contd...)
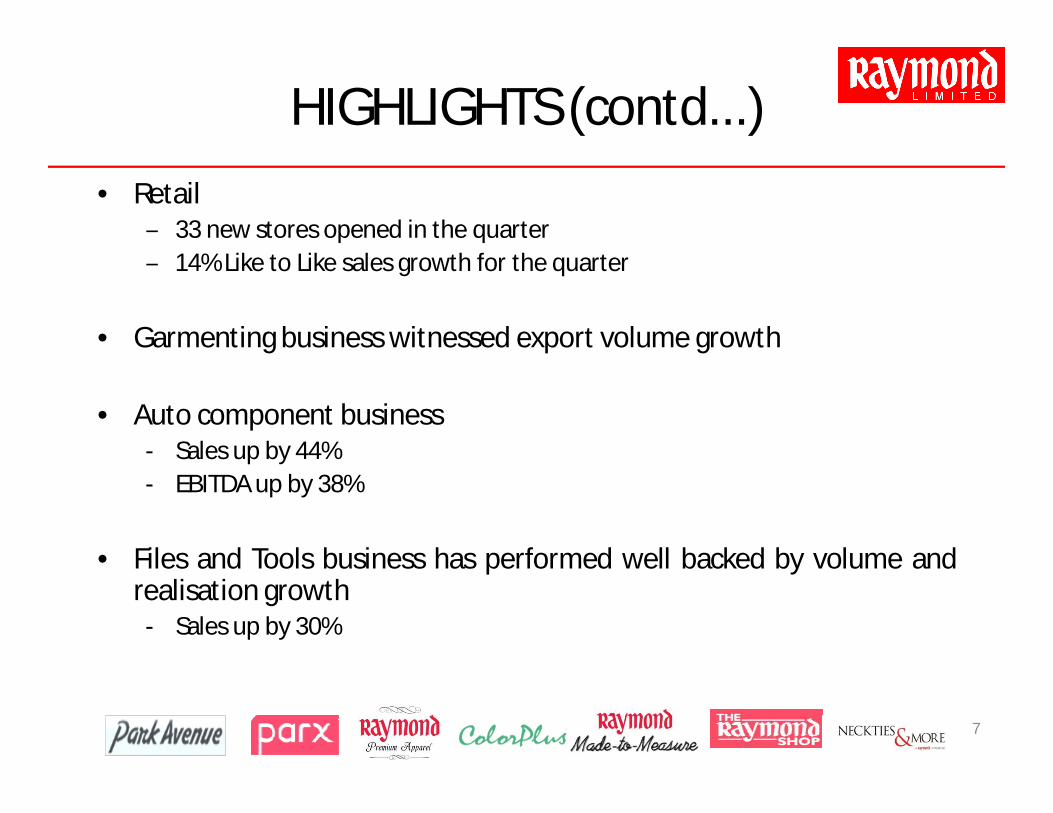
• Retail‒ 33 new stores opened in the quarter‒ 14% Like to Like sales growth for the quarter
• Garmenting business witnessed export volume growth
• Auto component business- Sales up by 44%- EBITDA up by 38%
• Files and Tools business has performed well backed by volume andrealisation growth
- Sales up by 30%
7
8
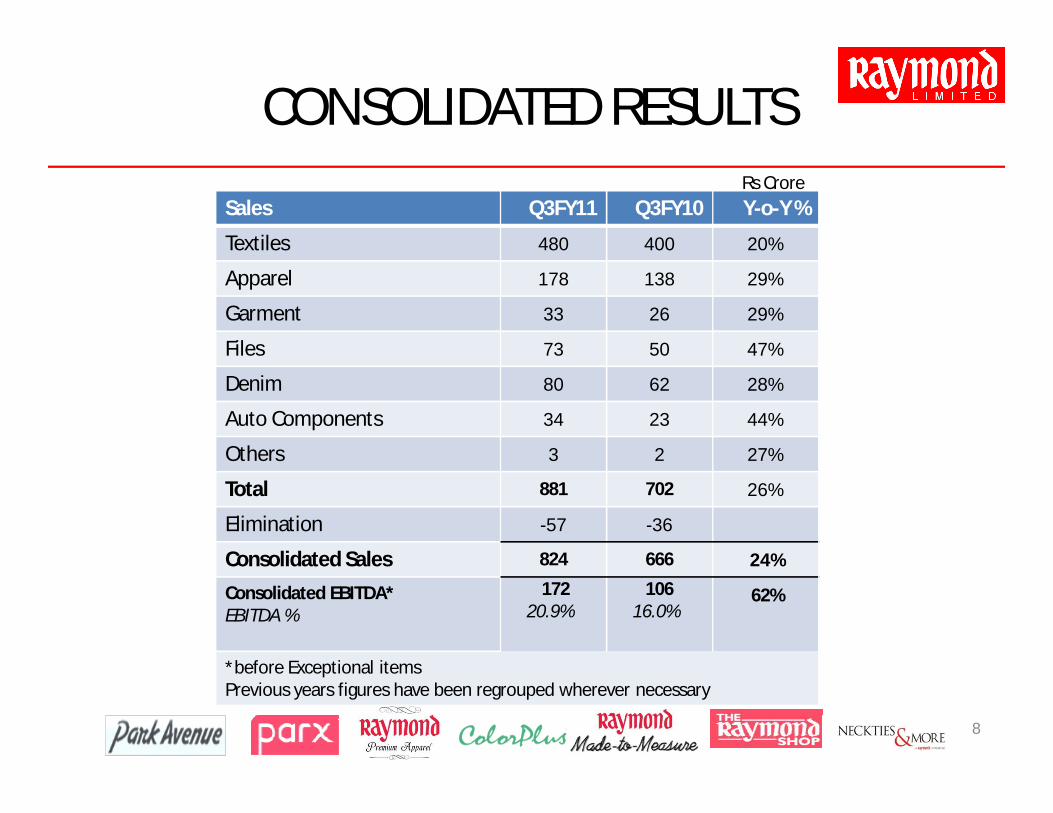
CONSOLIDATED RESULTS
Sales Q3FY11 Q3FY10 Y-o-Y %
Textiles 480 400 20%
Apparel 178 138 29%
Garment 33 26 29%
Files 73 50 47%
Denim 80 62 28%
Auto Components 34 23 44%
Others 3 2 27%
Total 881 702 26%
Elimination -57 -36
Consolidated Sales 824 666 24%
Consolidated EBITDA*EBITDA %
17220.9%
10616.0%
62%
*before Exceptional itemsPrevious years figures have been regrouped wherever necessary
Rs Crore
BUSINESS WISE PERFORMANCE
9
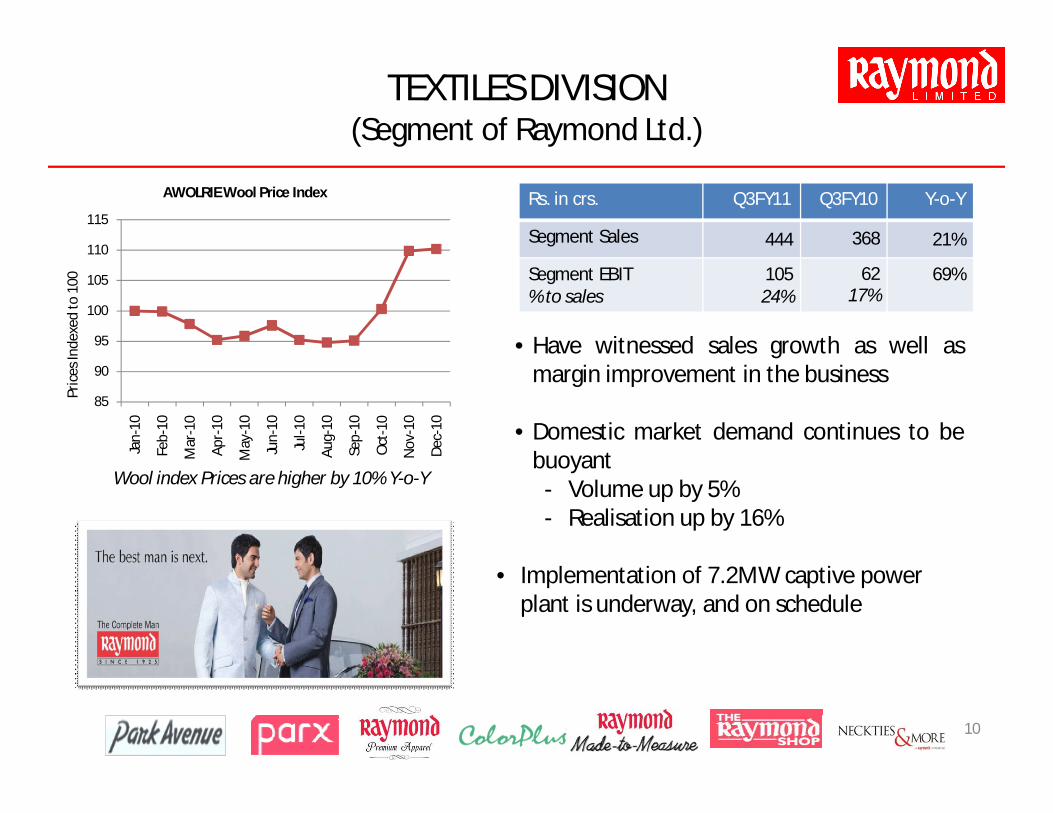
• Have witnessed sales growth as well asmargin improvement in the business
• Domestic market demand continues to bebuoyant
- Volume up by 5%- Realisation up by 16%
• Implementation of 7.2MW captive power plant is underway, and on schedule
TEXTILES DIVISION(Segment of Raymond Ltd.)
Wool index Prices are higher by 10% Y-o-Y
Rs. in crs. Q3FY11 Q3FY10 Y-o-Y
Segment Sales 444 368 21%
Segment EBIT% to sales
10524%
6217%
69%
10
85
90
95
100
105
110
115
Jan-
10
Feb-
10
Mar
-10
Apr
-10
May
-10
Jun-
10
Jul-1
0
Aug
-10
Sep-
10
Oct
-10
Nov
-10
Dec
-10
AWOLRIE Wool Price Index
Pric
es In
dexe
d to
100
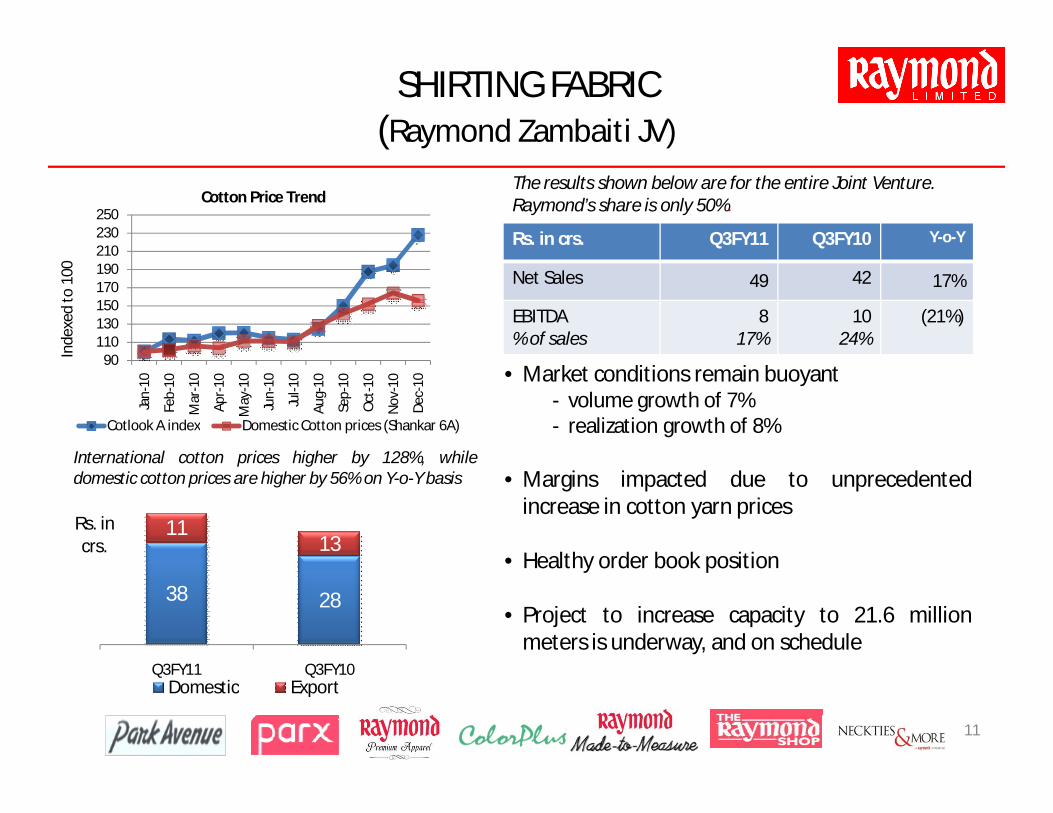
SHIRTING FABRIC(Raymond Zambaiti JV)
38 28
1113
Q3FY11 Q3FY10
Rs. in crs.
Domestic Export
11
• Market conditions remain buoyant- volume growth of 7%- realization growth of 8%
• Margins impacted due to unprecedentedincrease in cotton yarn prices
• Healthy order book position
• Project to increase capacity to 21.6 millionmeters is underway, and on schedule
The results shown below are for the entire Joint Venture. Raymond’s share is only 50%.
International cotton prices higher by 128%, whiledomestic cotton prices are higher by 56% on Y-o-Y basis
Rs. in crs. Q3FY11 Q3FY10 Y-o-Y
Net Sales 49 42 17%
EBITDA% of sales
817%
1024%
(21%)
90110130150170190210230250
Jan-
10
Feb-
10
Mar
-10
Apr-
10
May
-10
Jun-
10
Jul-1
0
Aug-
10
Sep-
10
Oct
-10
Nov
-10
Dec
-10
Cotlook A index Domestic Cotton prices (Shankar 6A)
Inde
xed
to 1
00
Cotton Price Trend
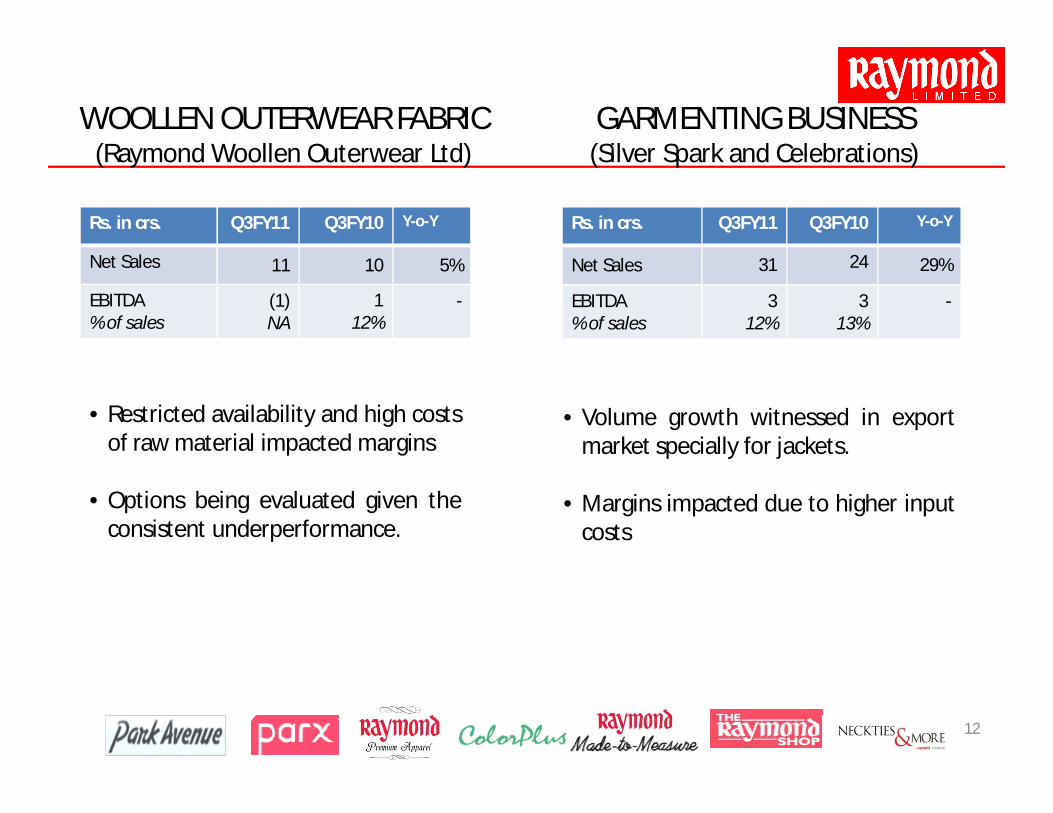
• Restricted availability and high costsof raw material impacted margins
• Options being evaluated given theconsistent underperformance.
WOOLLEN OUTERWEAR FABRIC(Raymond Woollen Outerwear Ltd)
12
Rs. in crs. Q3FY11 Q3FY10 Y-o-Y
Net Sales 11 10 5%
EBITDA% of sales
(1)NA
112%
-
GARMENTING BUSINESS(Silver Spark and Celebrations)
• Volume growth witnessed in exportmarket specially for jackets.
• Margins impacted due to higher inputcosts
Rs. in crs. Q3FY11 Q3FY10 Y-o-Y
Net Sales 31 24 29%
EBITDA% of sales
312%
313%
-
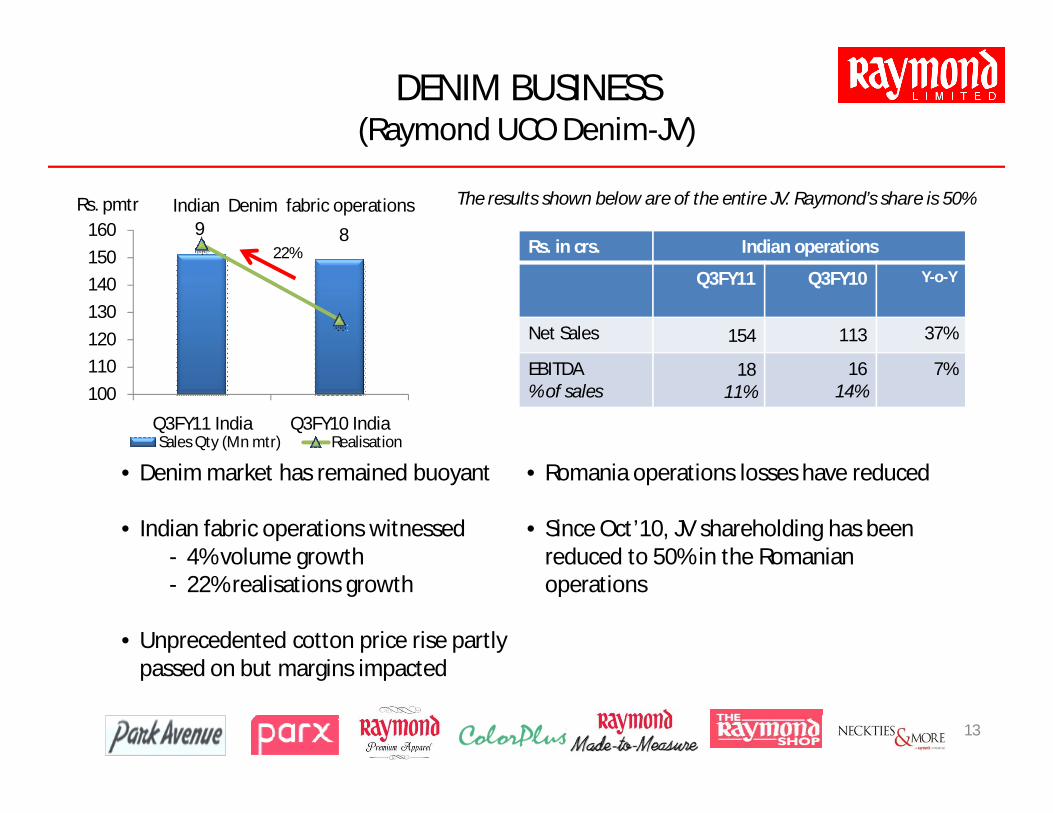
9 8
100
110
120
130
140
150
160
Q3FY11 India Q3FY10 India
Rs. pmtr Indian Denim fabric operations
Sales Qty (Mn mtr) Realisation
DENIM BUSINESS(Raymond UCO Denim-JV)
22%
• Denim market has remained buoyant
• Indian fabric operations witnessed - 4% volume growth - 22% realisations growth
• Unprecedented cotton price rise partly passed on but margins impacted
• Romania operations losses have reduced
• Since Oct’10, JV shareholding has been reduced to 50% in the Romanian operations
Rs. in crs. Indian operations
Q3FY11 Q3FY10 Y-o-Y
Net Sales 154 113 37%
EBITDA% of sales
1811%
1614%
7%
13
The results shown below are of the entire JV. Raymond’s share is 50%
14
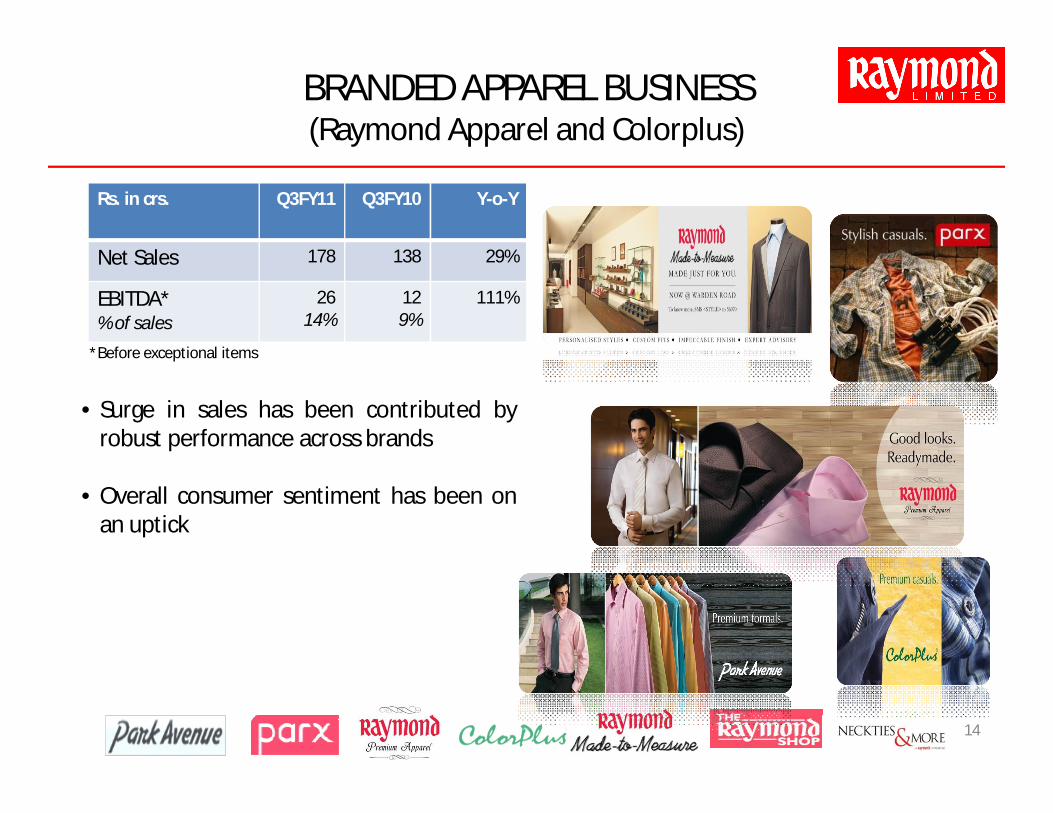
BRANDED APPAREL BUSINESS(Raymond Apparel and Colorplus)
• Surge in sales has been contributed byrobust performance across brands
• Overall consumer sentiment has been onan uptick
Rs. in crs. Q3FY11 Q3FY10 Y-o-Y
Net Sales 178 138 29%
EBITDA*% of sales
2614%
129%
111%
*Before exceptional items
15
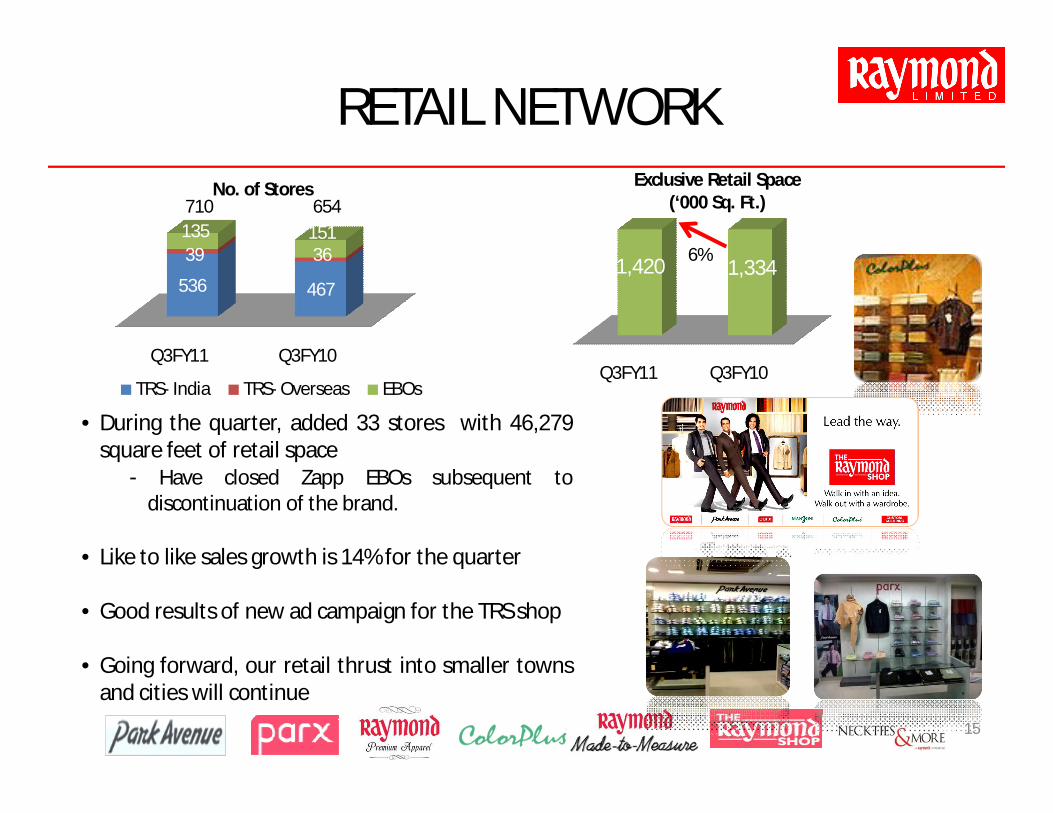
RETAIL NETWORK
Q3FY11 Q3FY10
536 467
135 151
No. of Stores
TRS- India TRS- Overseas EBOsQ3FY11 Q3FY10
1,420 1,334
Exclusive Retail Space (‘000 Sq. Ft.)
6%
• During the quarter, added 33 stores with 46,279square feet of retail space
- Have closed Zapp EBOs subsequent todiscontinuation of the brand.
• Like to like sales growth is 14% for the quarter
• Good results of new ad campaign for the TRS shop
• Going forward, our retail thrust into smaller townsand cities will continue
710 654
39 36
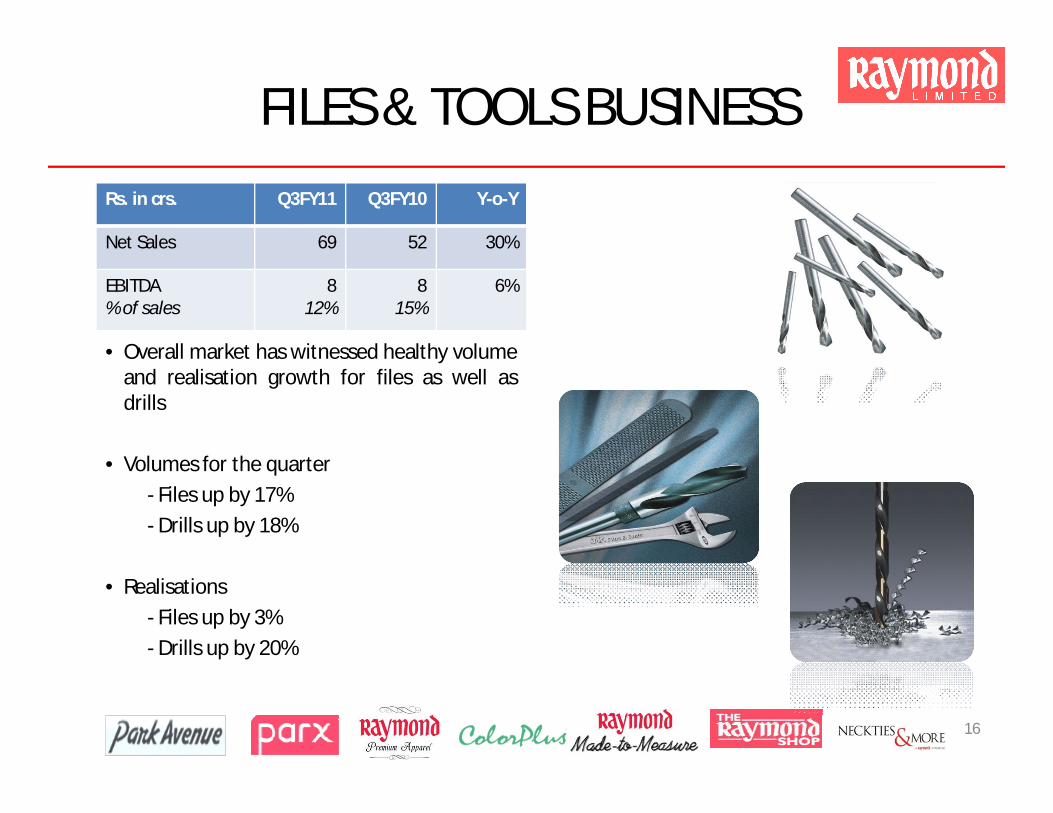
• Overall market has witnessed healthy volumeand realisation growth for files as well asdrills
• Volumes for the quarter
- Files up by 17%
- Drills up by 18%
• Realisations
- Files up by 3%
- Drills up by 20%
16
FILES & TOOLS BUSINESS
Rs. in crs. Q3FY11 Q3FY10 Y-o-Y
Net Sales 69 52 30%
EBITDA% of sales
812%
815%
6%
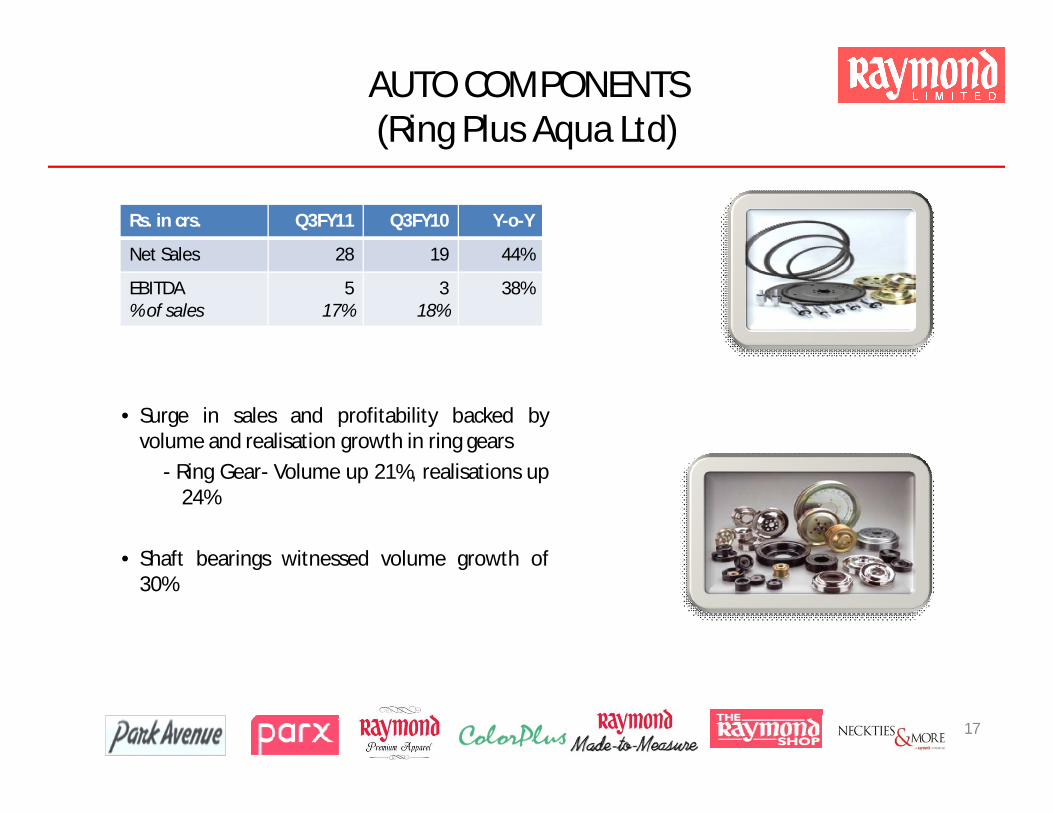
• Surge in sales and profitability backed byvolume and realisation growth in ring gears
- Ring Gear- Volume up 21%, realisations up24%
• Shaft bearings witnessed volume growth of30%
17
AUTO COMPONENTS (Ring Plus Aqua Ltd)
Rs. in crs. Q3FY11 Q3FY10 Y-o-Y
Net Sales 28 19 44%
EBITDA% of sales
517%
318%
38%

WAY FORWARD
18
WAY FORWARD
• Continue rapid expansion of the ‘TRS’ network in smallercities and towns.
• Enhance customer servicing by widening product offeringsacross all price points
• Implementation of capacity expansions- Cotton shirting fabric capacity at Kolhapur- Captive power plant at Vapi for Textiles
• Concerns - Unprecedented commodity price increases andinflation
19
FINANCIAL RESULTS
20

21
UNAUDITED FINANCIAL RESULTS (PROVISIONAL) FOR THE QUARTER / NINE MONTHS ENDED DECEMBER 31, 2010(Rs. In lacs)
Third Quarter Ended Particulars Nine Months Ended
Previous Year Ended(Audited)
31.12.10 31.12.09 31.12.10 31.12.09 31.03.10INCOME
44724 37233 Gross Sales/Income from Operations 108303 101003 1339370 0 Less: Excise Duty 0 440 440
44724 37233 Net sales / Income from Operations 108303 100563 133497385 357 Other Operating Income 1085 1235 1946
45109 37590 Total 109388 101798 135443EXPENDITURE
-2101 5434 a) (Increase) / Decrease in stock- in- trade -6698 3640 639110430 6850 b) Consumption of materials 27890 23045 30818
3441 1797 c) Purchase of traded goods 6927 6244 74636062 6214 d) Staff cost 19407 19974 254542603 2806 e) Depreciation and Amortisation 7703 8316 111317947 5905 f) Other Manufacturing & Operating Expenses 20350 18749 246493059 2540 g) Advertisement 6660 5744 6479
-37 -275h) Loss/(Gain) on variation in foreign exchange rates
(net) 228 -719 -8976402 5169 i) Other expenditure 16670 15197 20691
0 -1793j) Finished & process stocks transferred on
divestment of business 0 -1793 -179337806 34648 Total 99137 98398 130386
7303 2942Profit from Operations before Other Income, Interest and Exceptional items 10251 3400 5057
1202 1281 Other Income (Net) 4064 4103 51398505 4223 Profit before Interest and Exceptional items 14315 7503 101962547 2110 Interest - expense- (Net) 6901 6702 84395958 2113 Profit before tax and exceptional items 7414 801 1757
-23542 1690 Exceptional items - (Net) -23742 -324 117-17584 3803 Profit/(Loss) before tax -16328 477 1874
-6005 -454 Provision for Taxation -5676 -1363 -632-11579 4257 Net Profit/(Loss) after tax -10652 1840 2506
0 0 Tax in respect of earlier years 503 0 0-11579 4257 Net Profit/(Loss) -10149 1840 2506
22
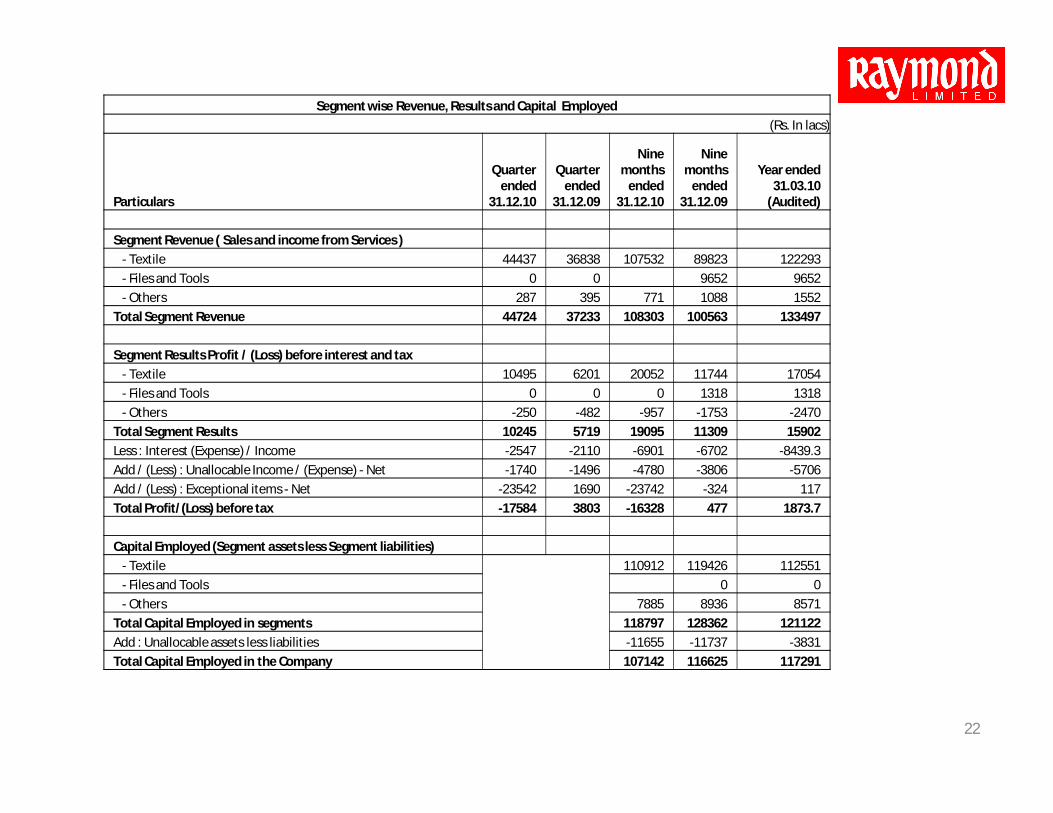
Segment wise Revenue, Results and Capital Employed (Rs. In lacs)
Particulars
Quarter ended
31.12.10
Quarter ended
31.12.09
Nine months
ended 31.12.10
Nine months
ended 31.12.09
Year ended 31.03.10
(Audited)
Segment Revenue ( Sales and income from Services )- Textile 44437 36838 107532 89823 122293- Files and Tools 0 0 9652 9652- Others 287 395 771 1088 1552
Total Segment Revenue 44724 37233 108303 100563 133497
Segment Results Profit / (Loss) before interest and tax- Textile 10495 6201 20052 11744 17054- Files and Tools 0 0 0 1318 1318- Others -250 -482 -957 -1753 -2470
Total Segment Results 10245 5719 19095 11309 15902Less : Interest (Expense) / Income -2547 -2110 -6901 -6702 -8439.3Add / (Less) : Unallocable Income / (Expense) - Net -1740 -1496 -4780 -3806 -5706Add / (Less) : Exceptional items - Net -23542 1690 -23742 -324 117Total Profit/(Loss) before tax -17584 3803 -16328 477 1873.7
Capital Employed (Segment assets less Segment liabilities)- Textile 110912 119426 112551- Files and Tools 0 0- Others 7885 8936 8571
Total Capital Employed in segments 118797 128362 121122Add : Unallocable assets less liabilities -11655 -11737 -3831Total Capital Employed in the Company 107142 116625 117291
23
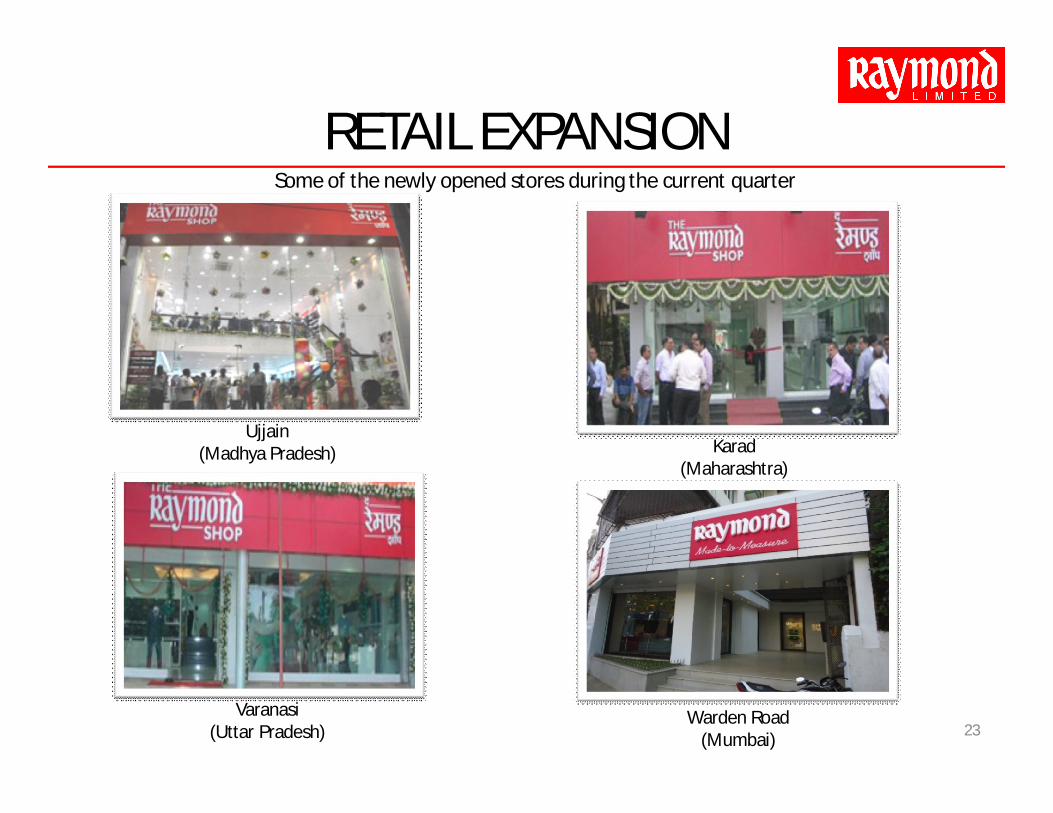
RETAIL EXPANSIONSome of the newly opened stores during the current quarter
Karad(Maharashtra)
Ujjain(Madhya Pradesh)
Varanasi(Uttar Pradesh)
Warden Road(Mumbai)
THANK YOU
24


![Conference Call 17 03 14 [modalit compatibilit ] · 6 Financial ratios CONFERENCE CALL FY 2013 consolidated results Pieve di Soligo, March, 17th 2014 NFP / EBITDA EBITDA / FC NFP](https://img.pdfslide.net/doc/110x75/5b9abff709d3f291158bf925/conference-call-17-03-14-modalit-compatibilit-6-financial-ratios-conference.jpg)