Embed Size (px)
Citation preview
Results presentation – FY2014 interimsSeptember 2013

OverviewAcquisitions
Financial review
Operational review
Appendix
3
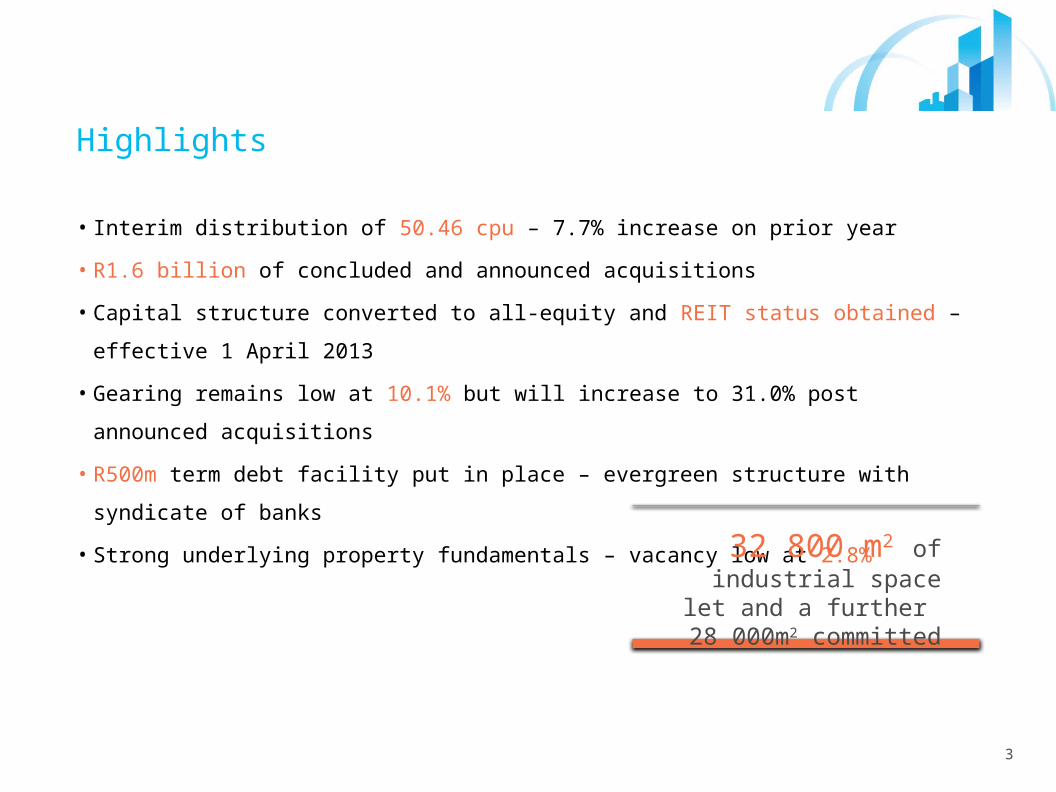
Highlights
• Interim distribution of 50.46 cpu – 7.7% increase on prior year
• R1.6 billion of concluded and announced acquisitions
• Capital structure converted to all-equity and REIT status obtained – effective 1 April 2013
• Gearing remains low at 10.1% but will increase to 31.0% post announced acquisitions
• R500m term debt facility put in place – evergreen structure with syndicate of banks
• Strong underlying property fundamentals – vacancy low at 2.8%
32 800 m2 of industrial space let and a further
28 000m2 committed
4
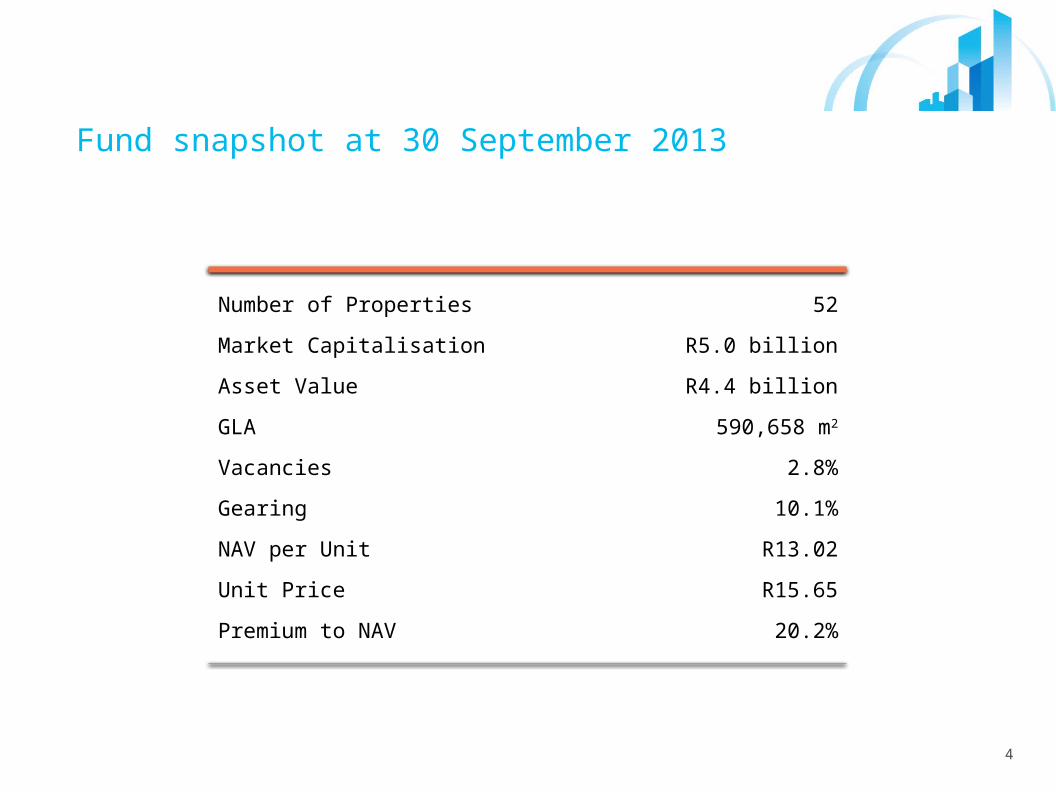
Number of Properties 52
Market Capitalisation R5.0 billion
Asset Value R4.4 billion
GLA 590,658 m2
Vacancies 2.8%
Gearing 10.1%
NAV per Unit R13.02
Unit Price R15.65
Premium to NAV 20.2%
Fund snapshot at 30 September 2013
5
For
tres
s B
Res
ilien
t
Hyp
rop
Hos
pita
lity
B
Gro
wth
poin
t
Cap
ital
Inve
stec
Red
efin
e
Fou
ntai
nhea
d
Acu
cap
Syc
om
Oct
odec
Pre
miu
m
Vuk
ile
Reb
osis
For
tres
s A
SA
Cor
pora
te
Dip
ula
A
Vun
ani
Em
ira
Asc
ensi
on B
Arr
owhe
ad A
Syn
ergy
A
Hos
pita
lity
A
Asc
ensi
on A
Ann
uity
Arr
owhe
ad B
Del
ta
Dip
ula
B
Tow
er
Syn
ergy
B
Viv
iden
d
5.1% 5.
8%
6.5% 6.
8% 6.9% 7.
6%
7.8%
7.8% 8.0%
8.0%
8.1% 8.3%
8.3%
8.4%
8.5% 8.
6% 8.7%
8.8%
8.8% 9.
0%
9.1%
9.2%
9.2%
9.2%
9.2%
9.2%
9.3%
9.3% 9.
7% 9.9% 10
.3%
12.1
%
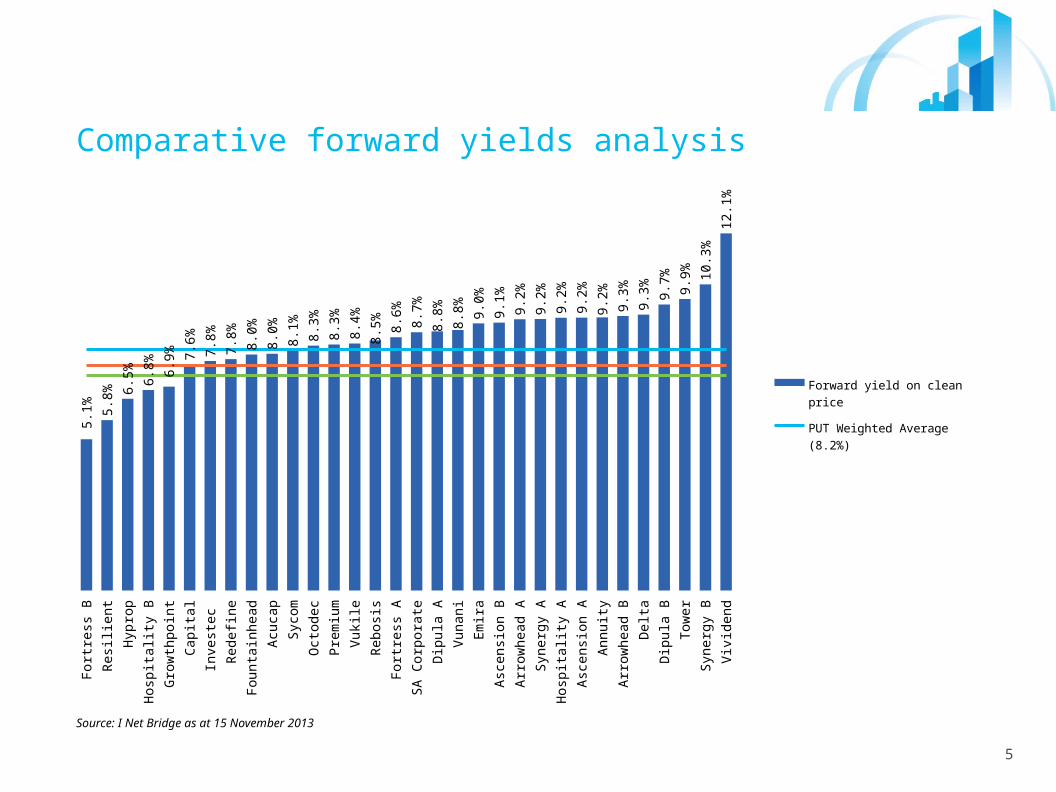
Forward yield on clean price
PUT Weighted Average (8.2%)
PLS Weighted Average (7.3%)
Sector Weighted Average (7.6%)
Comparative forward yields analysis
Source: I Net Bridge as at 15 November 2013
6
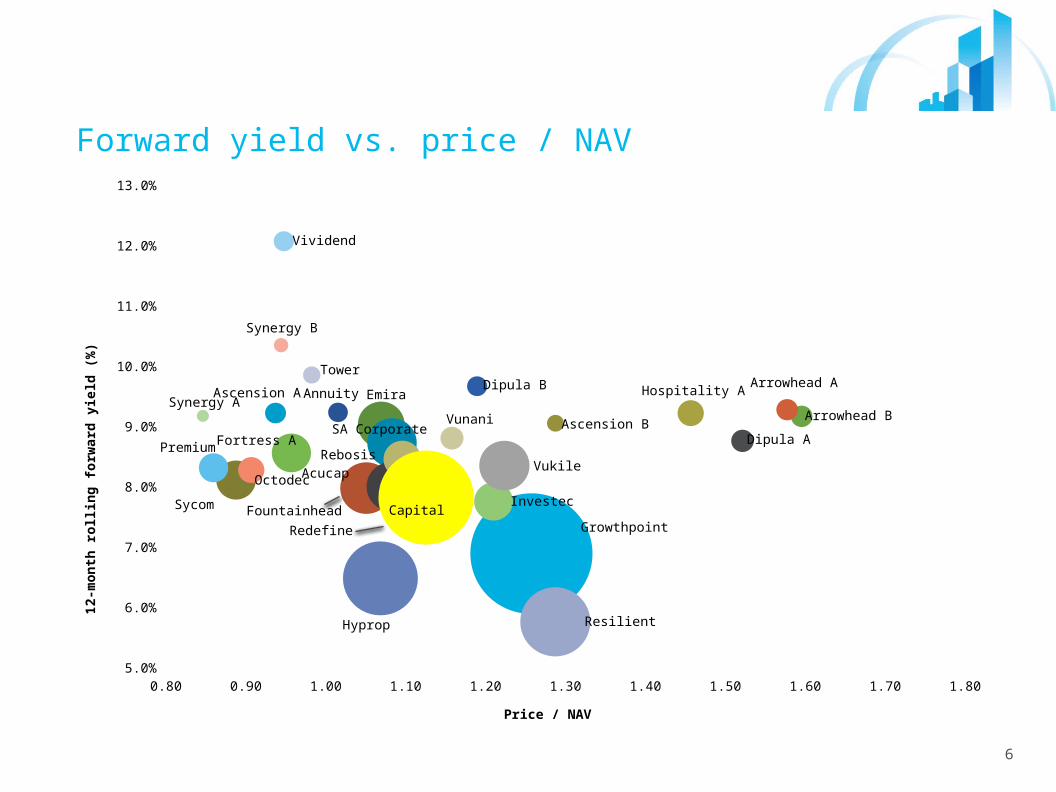
Forward yield vs. price / NAV
0.80 0.90 1.00 1.10 1.20 1.30 1.40 1.50 1.60 1.70 1.80 5.0%
6.0%
7.0%
8.0%
9.0%
10.0%
11.0%
12.0%
13.0%
Capital
Emira
Fountainhead
SA Corporate
Sycom
Acucap
AnnuityArrowhead A
Arrowhead B
Ascension A
Ascension BDipula A
Dipula B
Fortress A
Growthpoint
Hospitality A
Hyprop
Investec
Octodec
PremiumRebosis
Redefine
Resilient
Synergy A
Synergy B
Vividend
Vunani
Vukile
Tower
Price / NAV
12-m
on
th r
oll
ing
fo
rwar
d y
ield
(%
)

Overview
AcquisitionsFinancial review
Operational review
Appendix
8
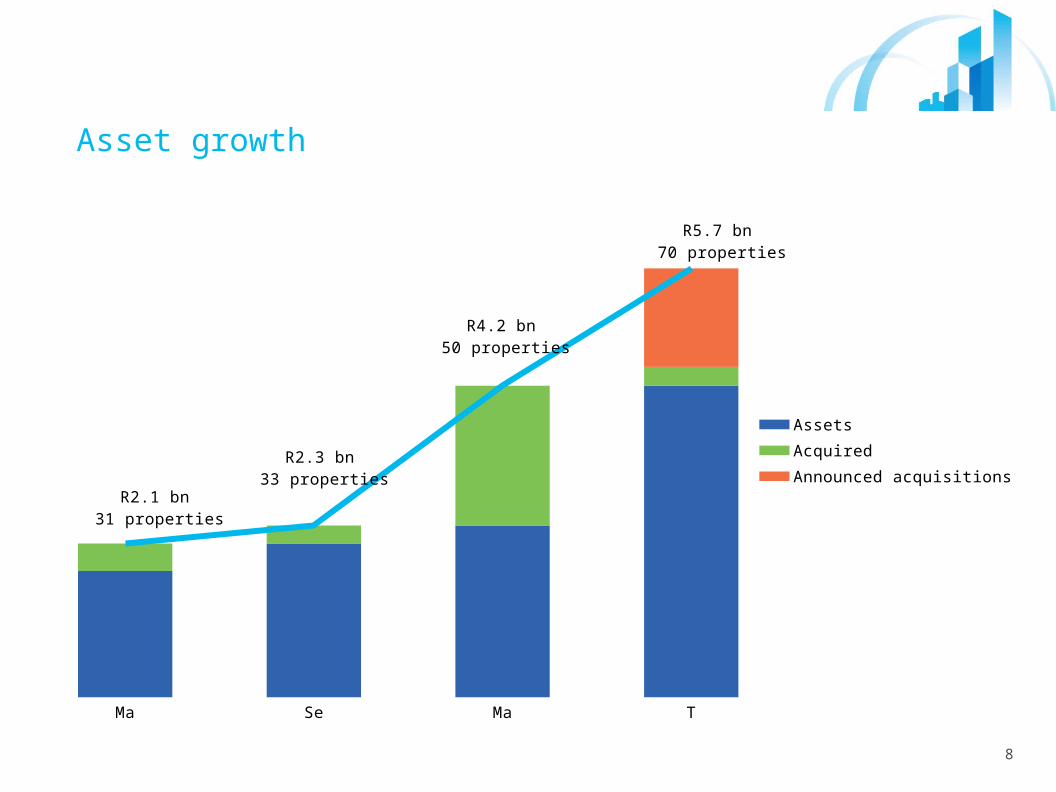
Asset growth
Mar-12 Sep-12 Mar-13 Today
R2.1 bn 31 properties
R2.3 bn 33 properties
R4.2 bn 50 properties
R5.7 bn 70 properties
Assets
Acquired
Announced acquisitions
9
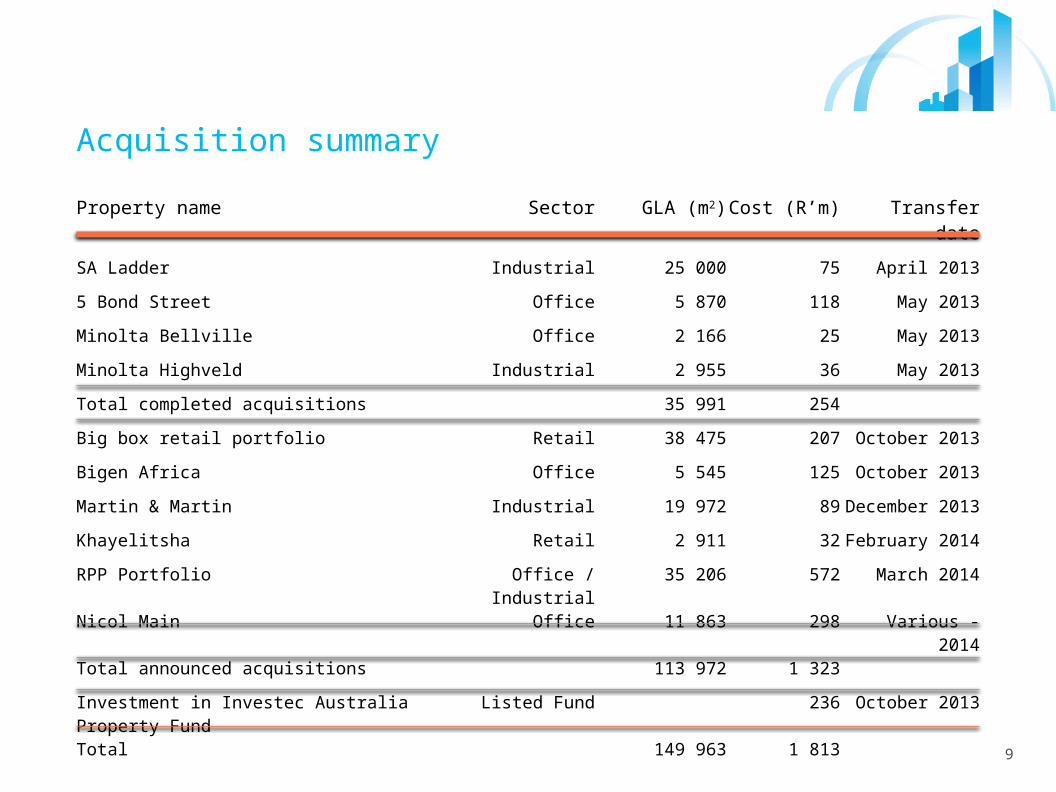
Acquisition summary
Property name Sector GLA (m2) Cost (R’m) Transfer date
SA Ladder Industrial 25 000 75 April 2013
5 Bond Street Office 5 870 118 May 2013
Minolta Bellville Office 2 166 25 May 2013
Minolta Highveld Industrial 2 955 36 May 2013
Total completed acquisitions 35 991 254
Big box retail portfolio Retail 38 475 207 October 2013
Bigen Africa Office 5 545 125 October 2013
Martin & Martin Industrial 19 972 89 December 2013
Khayelitsha Retail 2 911 32 February 2014
RPP Portfolio Office / Industrial 35 206 572 March 2014
Nicol Main Office 11 863 298 Various - 2014
Total announced acquisitions 113 972 1 323
Investment in Investec Australia Property Fund Listed Fund 236 October 2013
Total 149 963 1 813
10
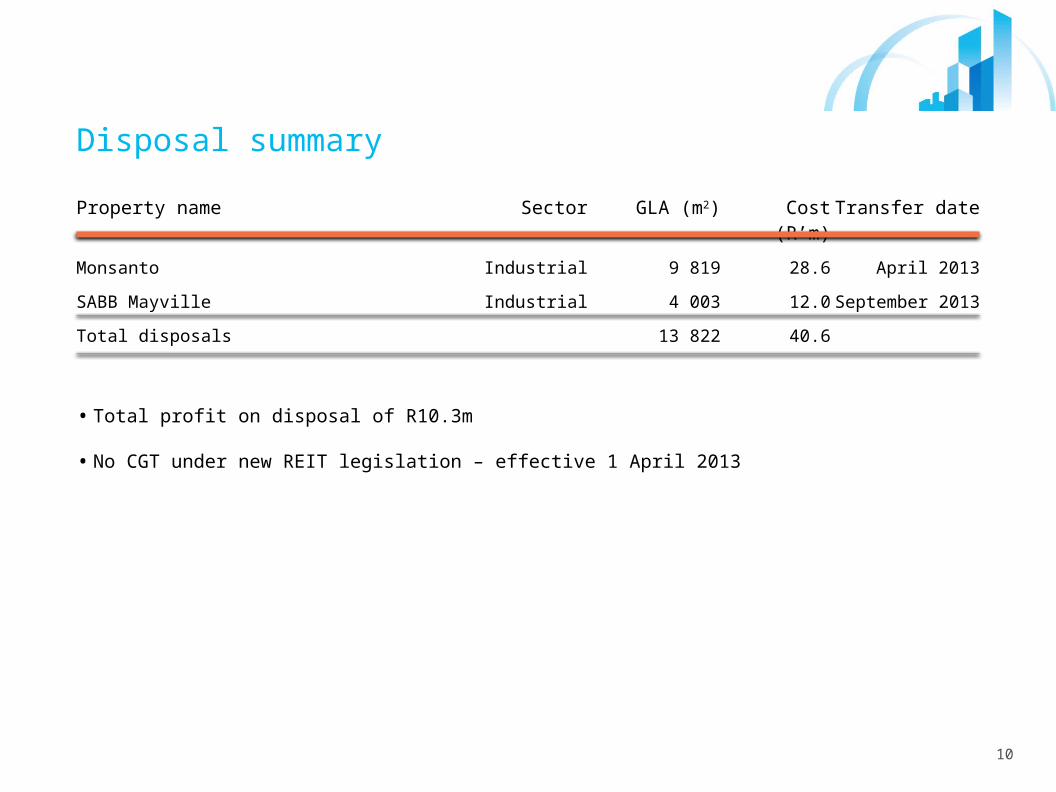
Disposal summary
Property name Sector GLA (m2) Cost (R’m) Transfer date
Monsanto Industrial 9 819 28.6 April 2013
SABB Mayville Industrial 4 003 12.0 September 2013
Total disposals 13 822 40.6
• Total profit on disposal of R10.3m
• No CGT under new REIT legislation – effective 1 April 2013
Overview
Acquisitions
Financial reviewOperational review
Appendix
12
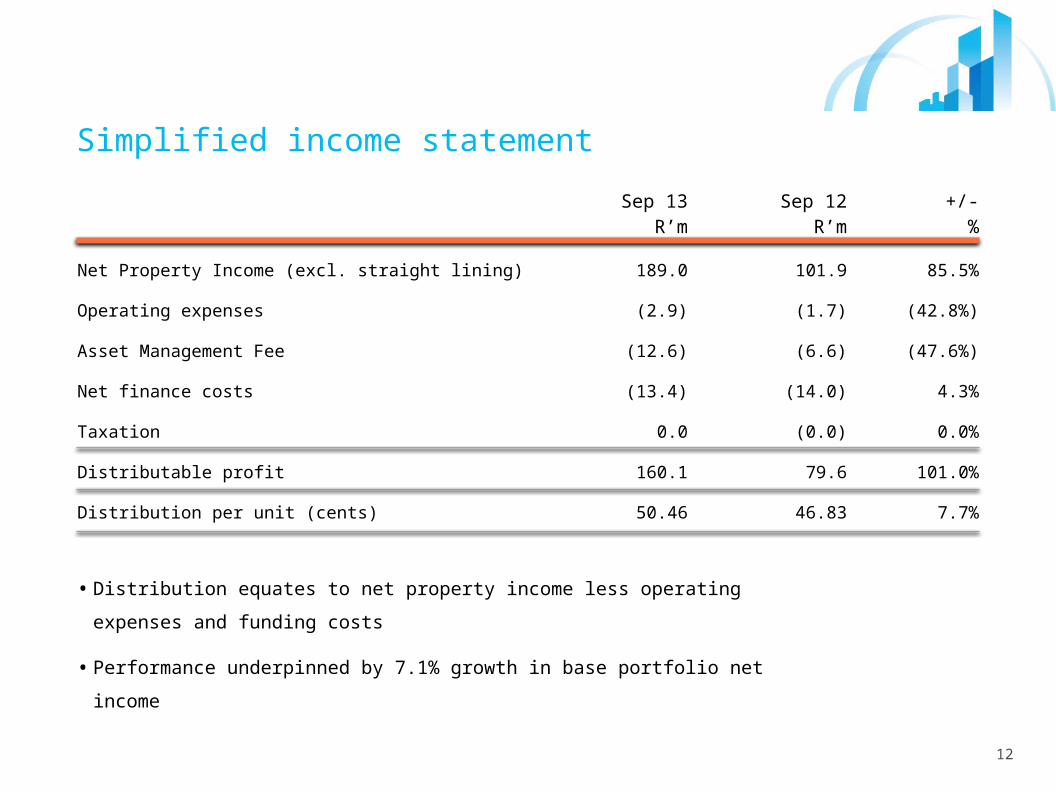
Simplified income statement
Sep 13R’m
Sep 12R’m
+/-%
Net Property Income (excl. straight lining) 189.0 101.9 85.5%
Operating expenses (2.9) (1.7) (42.8%)
Asset Management Fee (12.6) (6.6) (47.6%)
Net finance costs (13.4) (14.0) 4.3%
Taxation 0.0 (0.0) 0.0%
Distributable profit 160.1 79.6 101.0%
Distribution per unit (cents) 50.46 46.83 7.7%
• Distribution equates to net property income less operating expenses and funding
costs
• Performance underpinned by 7.1% growth in base portfolio net income
13
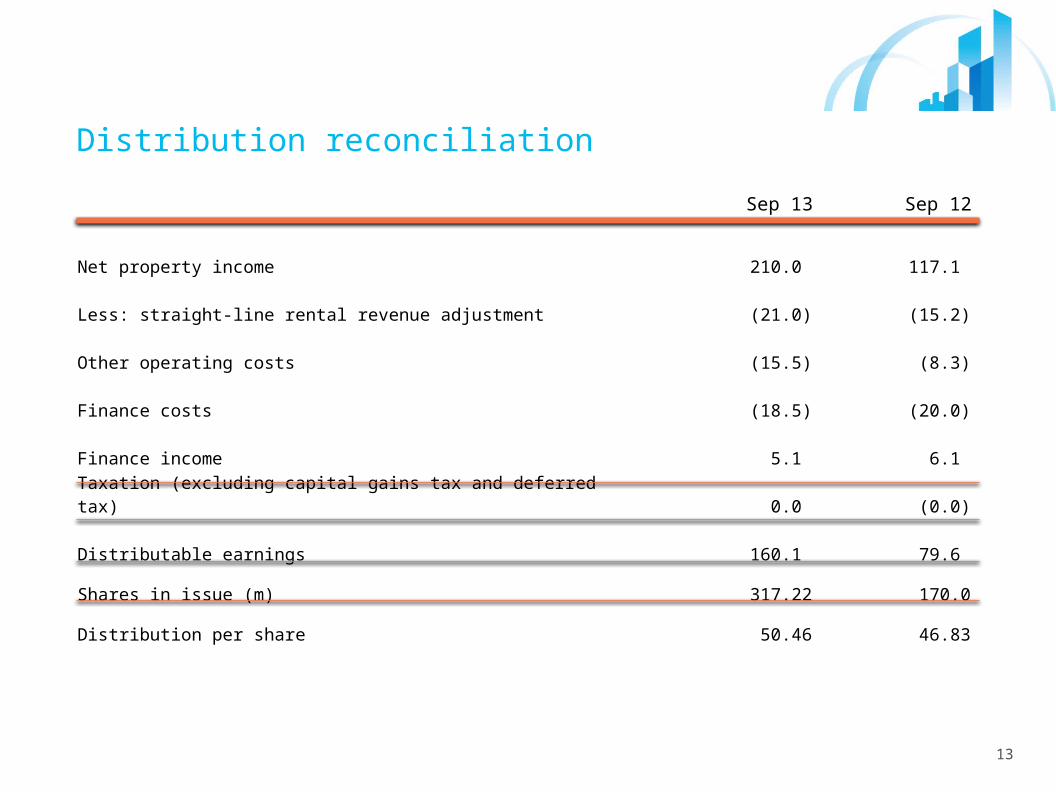
Distribution reconciliation
Sep 13 Sep 12
Net property income 210.0 117.1
Less: straight-line rental revenue adjustment (21.0) (15.2)
Other operating costs (15.5) (8.3)
Finance costs (18.5) (20.0)
Finance income 5.1 6.1
Taxation (excluding capital gains tax and deferred tax) 0.0 (0.0)
Distributable earnings 160.1 79.6
Shares in issue (m) 317.22 170.0
Distribution per share 50.46 46.83
14
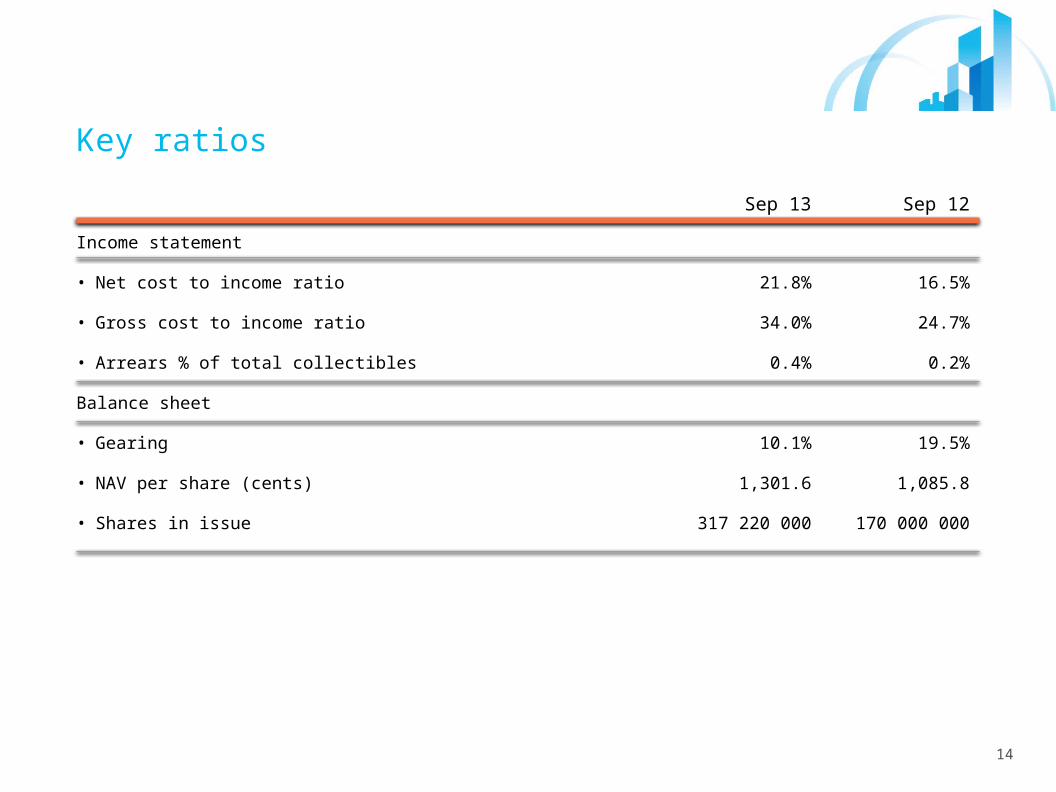
Key ratios
Sep 13 Sep 12
Income statement
• Net cost to income ratio 21.8% 16.5%
• Gross cost to income ratio 34.0% 24.7%
• Arrears % of total collectibles 0.4% 0.2%
Balance sheet
• Gearing 10.1% 19.5%
• NAV per share (cents) 1,301.6 1,085.8
• Shares in issue 317 220 000 170 000 000
15
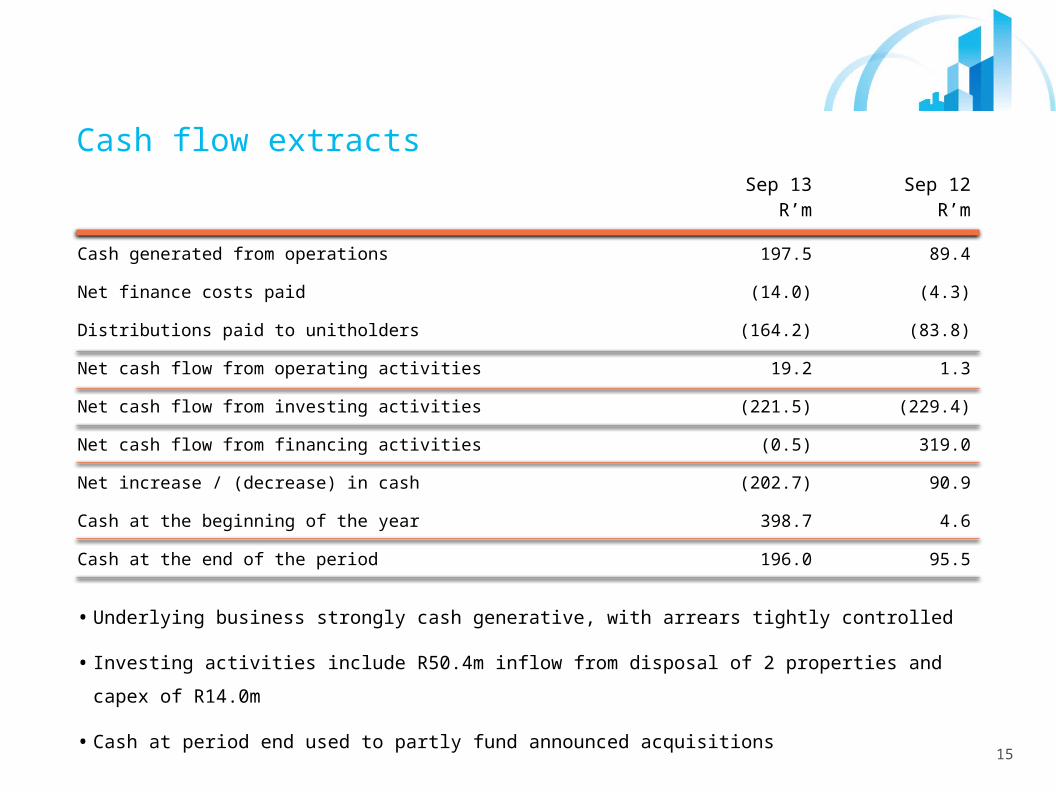
Cash flow extractsSep 13
R’mSep 12
R’m
Cash generated from operations 197.5 89.4
Net finance costs paid (14.0) (4.3)
Distributions paid to unitholders (164.2) (83.8)
Net cash flow from operating activities 19.2 1.3
Net cash flow from investing activities (221.5) (229.4)
Net cash flow from financing activities (0.5) 319.0
Net increase / (decrease) in cash (202.7) 90.9
Cash at the beginning of the year 398.7 4.6
Cash at the end of the period 196.0 95.5
• Underlying business strongly cash generative, with arrears tightly controlled
• Investing activities include R50.4m inflow from disposal of 2 properties and capex of R14.0m
• Cash at period end used to partly fund announced acquisitions
16
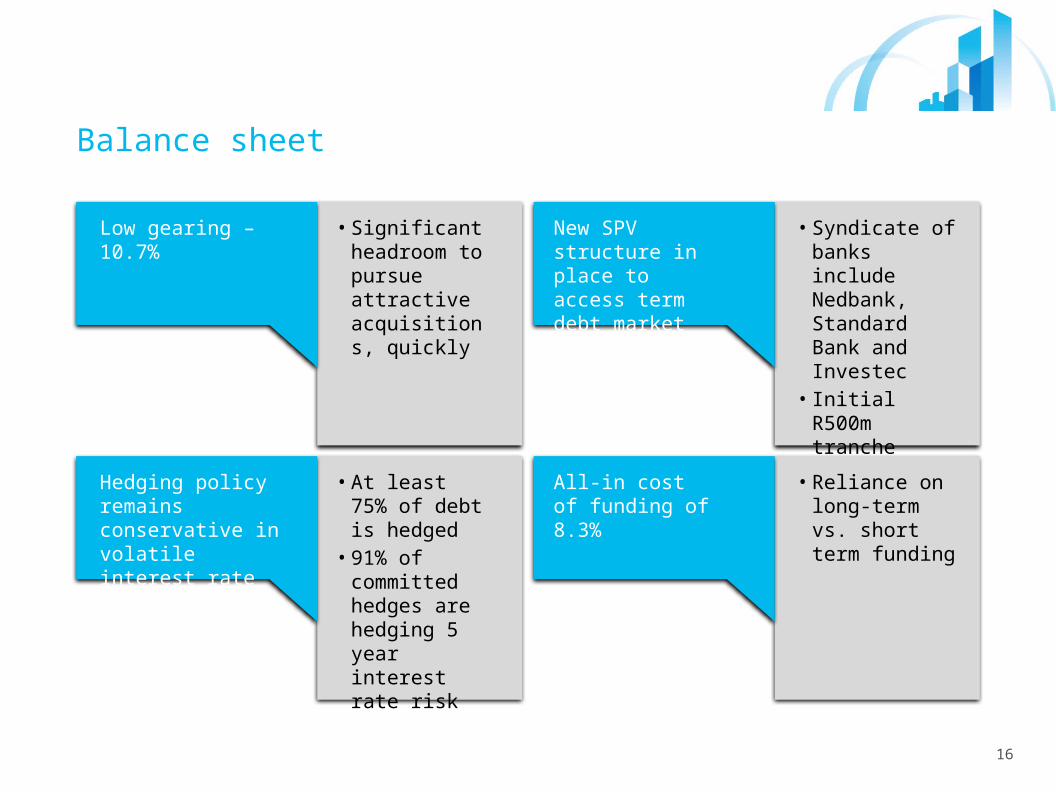
Balance sheet
Low gearing – 10.7%
• Significant headroom to pursue attractive acquisitions, quickly
New SPV structure in place to access term debt market
• Syndicate of banks include Nedbank, Standard Bank and Investec
• Initial R500m tranche
Hedging policy remains conservative in volatile interest rate environment
• At least 75% of debt is hedged
• 91% of committed hedges are hedging 5 year interest rate risk
All-in cost of funding of 8.3%
• Reliance on long-term vs. short term funding
17
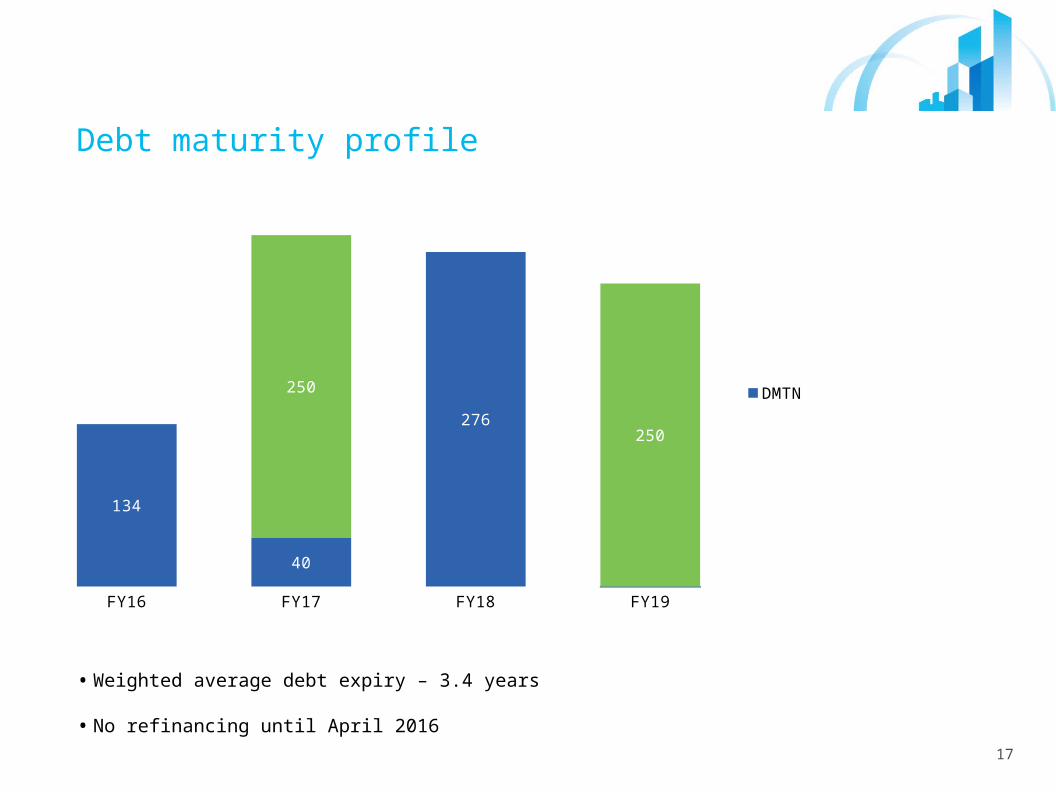
Debt maturity profile
• R million
• Weighted average debt expiry – 3.4 years
• No refinancing until April 2016
FY16 FY17 FY18 FY19
134
40
276
250
250
DMTN
Bank debt - post period end
18
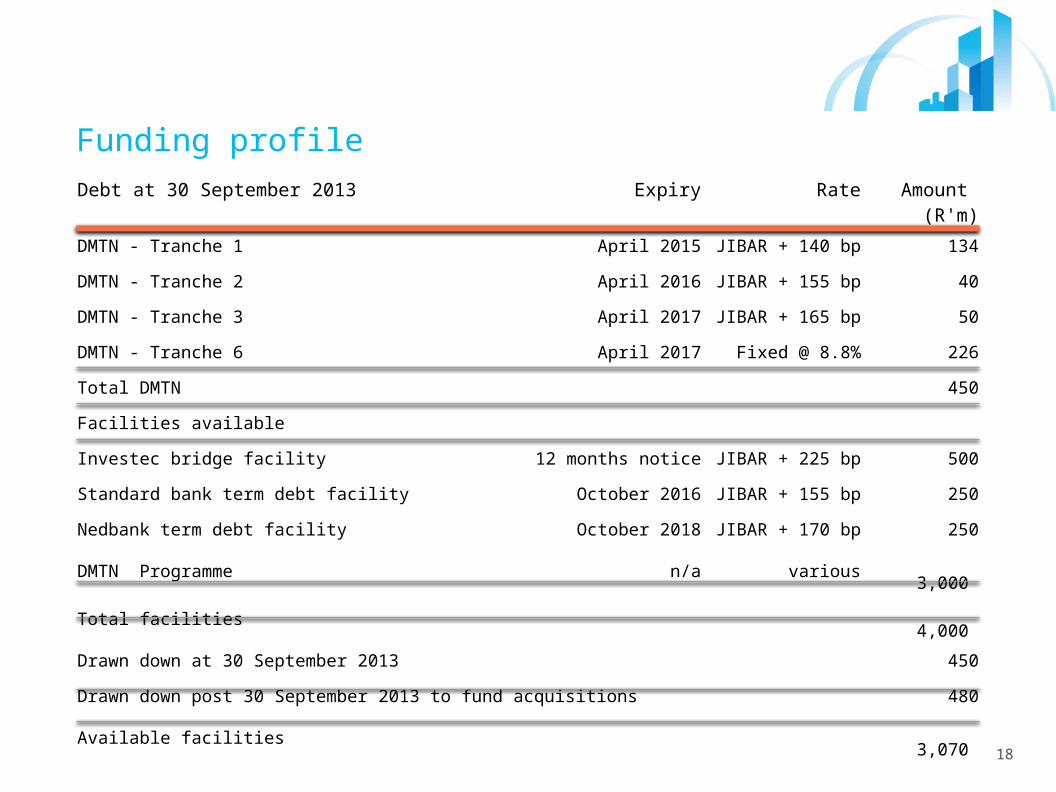
Funding profileDebt at 30 September 2013 Expiry Rate Amount
(R'm)
DMTN - Tranche 1 April 2015 JIBAR + 140 bp 134
DMTN - Tranche 2 April 2016 JIBAR + 155 bp 40
DMTN - Tranche 3 April 2017 JIBAR + 165 bp 50
DMTN - Tranche 6 April 2017 Fixed @ 8.8% 226
Total DMTN 450
Facilities available
Investec bridge facility 12 months notice JIBAR + 225 bp 500
Standard bank term debt facility October 2016 JIBAR + 155 bp 250
Nedbank term debt facility October 2018 JIBAR + 170 bp 250
DMTN Programme n/a various 3,000
Total facilities 4,000
Drawn down at 30 September 2013 450
Drawn down post 30 September 2013 to fund acquisitions 480
Available facilities 3,070
Overview
Acquisitions
Financial review
Operational reviewAppendix
20
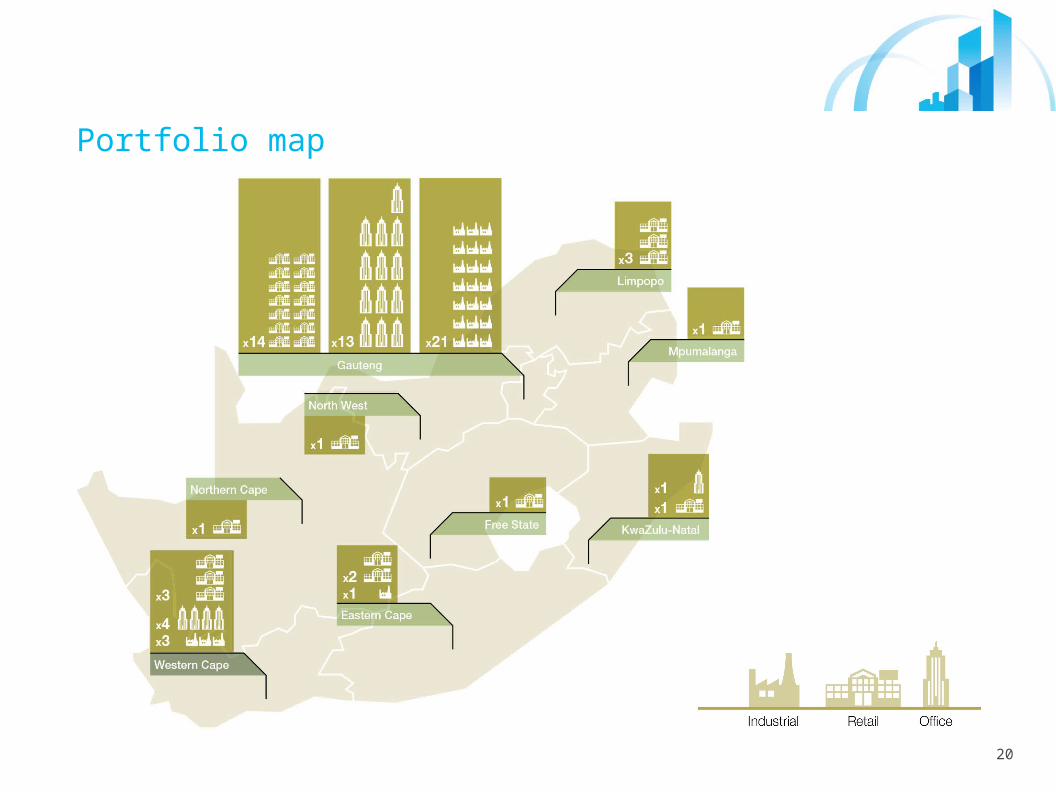
Portfolio map
21
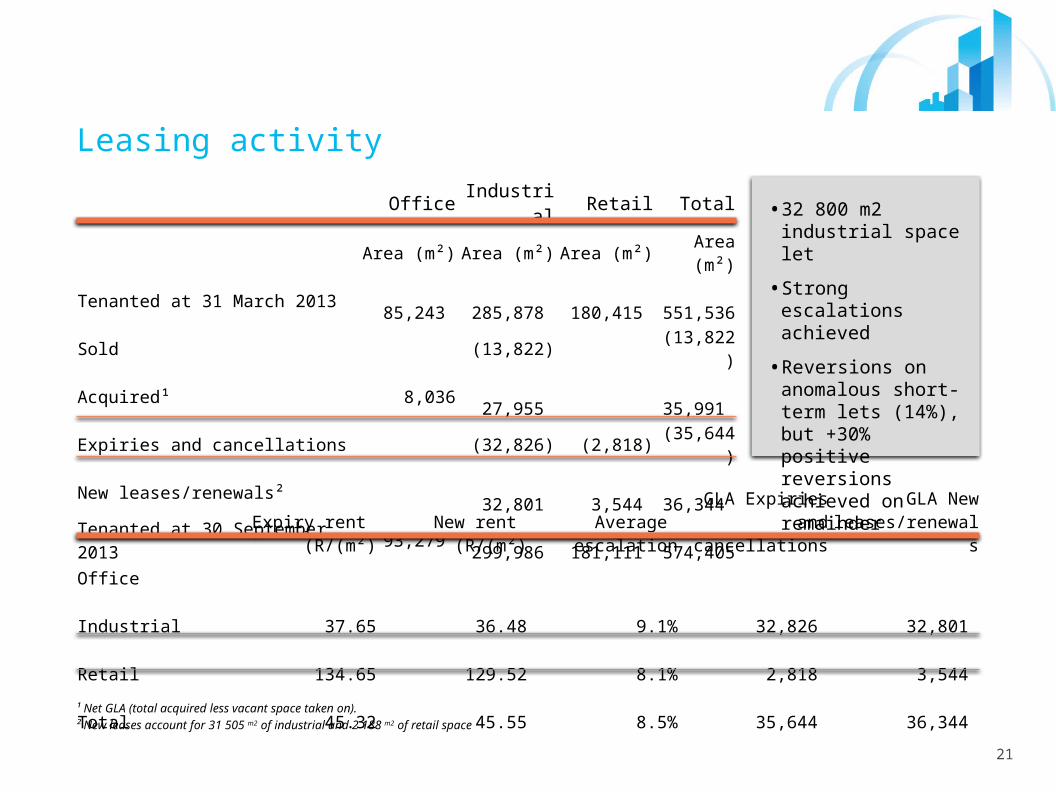
Leasing activity
¹ Net GLA (total acquired less vacant space taken on).
² New leases account for 31 505 m2 of industrial and 2 188 m2 of retail space
Office Industrial Retail Total
Area (m²) Area (m²) Area (m²) Area (m²)
Tenanted at 31 March 2013 85,243 285,878 180,415 551,536
Sold (13,822) (13,822)
Acquired¹ 8,036 27,955 35,991
Expiries and cancellations (32,826) (2,818) (35,644)
New leases/renewals² 32,801 3,544 36,344
Tenanted at 30 September 2013 93,279 299,986 181,111 574,405
Expiry rent
(R/(m²)New rent
(R/(m²)Average
escalationGLA Expiries and
cancellationsGLA New
leases/renewals
Office
Industrial 37.65 36.48 9.1% 32,826 32,801
Retail 134.65 129.52 8.1% 2,818 3,544
Total 45.32 45.55 8.5% 35,644 36,344
• 32 800 m2 industrial space let
• Strong escalations achieved
• Reversions on anomalous short-term lets (14%), but +30% positive reversions achieved on remainder
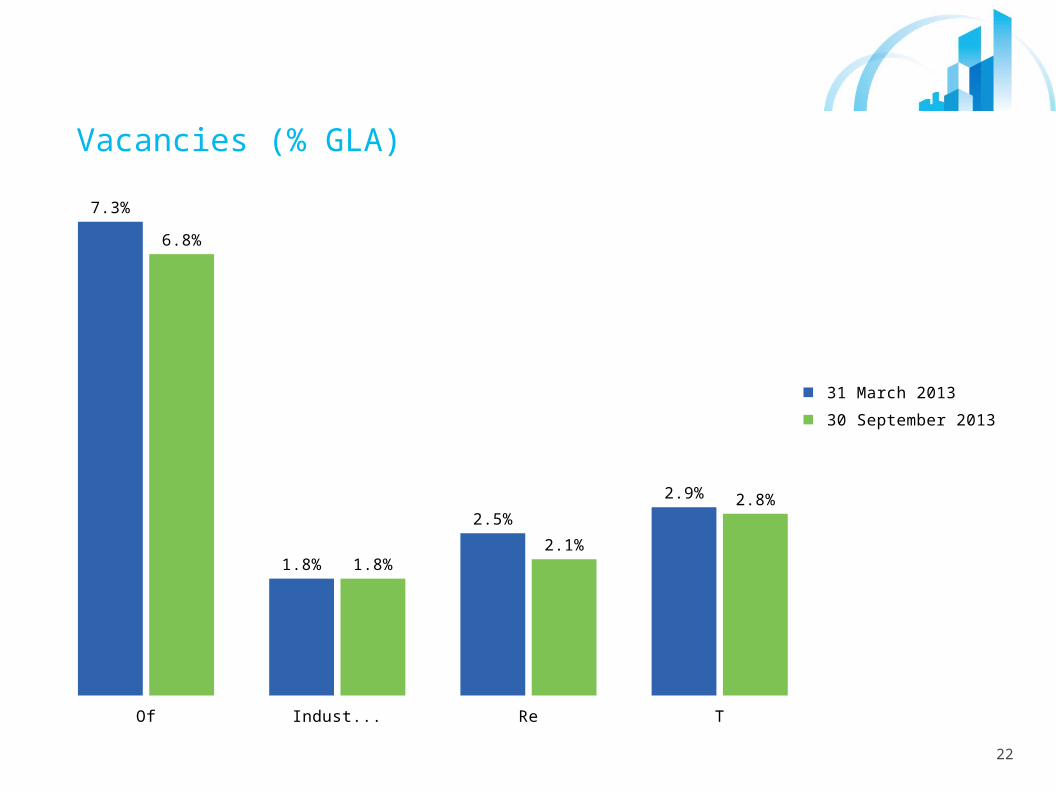
22
Vacancies (% GLA)
• GLA (m2)
Office Industrial Retail Total
7.3%
1.8%
2.5%
2.9%
6.8%
1.8%2.1%
2.8%
31 March 2013
30 September 2013
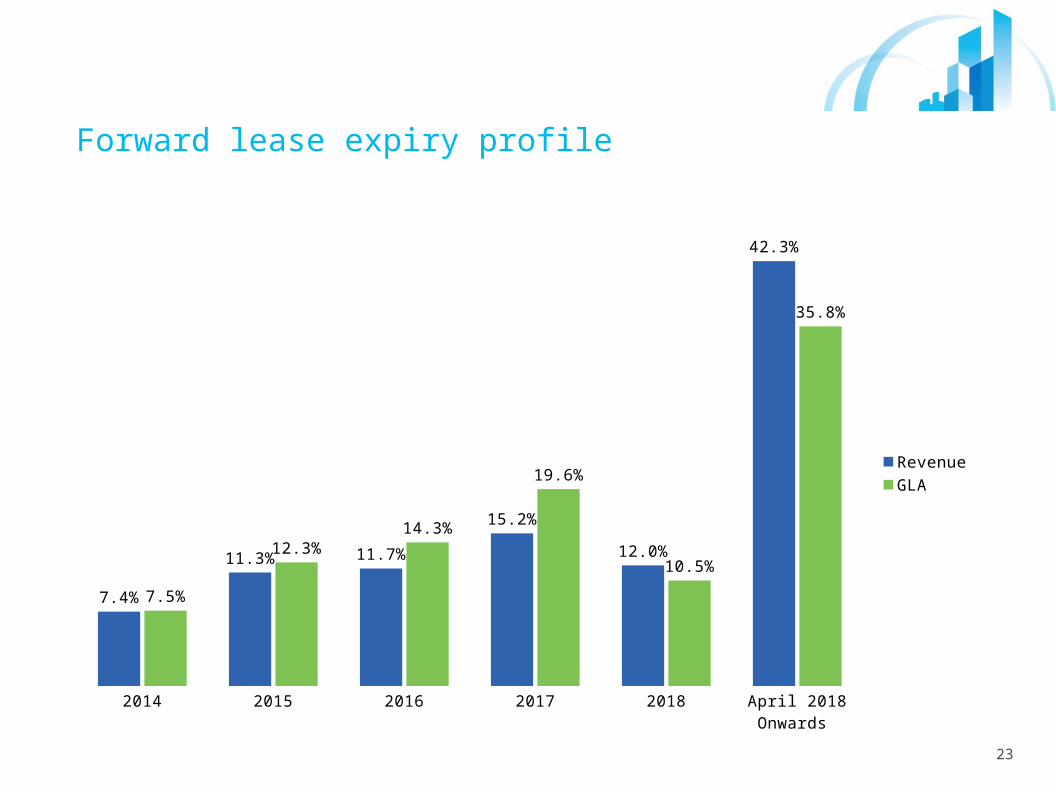
23
Forward lease expiry profile
2014 2015 2016 2017 2018 April 2018 Onwards
7.4%
11.3% 11.7%
15.2%
12.0%
42.3%
7.5%
12.3%14.3%
19.6%
10.5%
35.8%
RevenueGLA
24
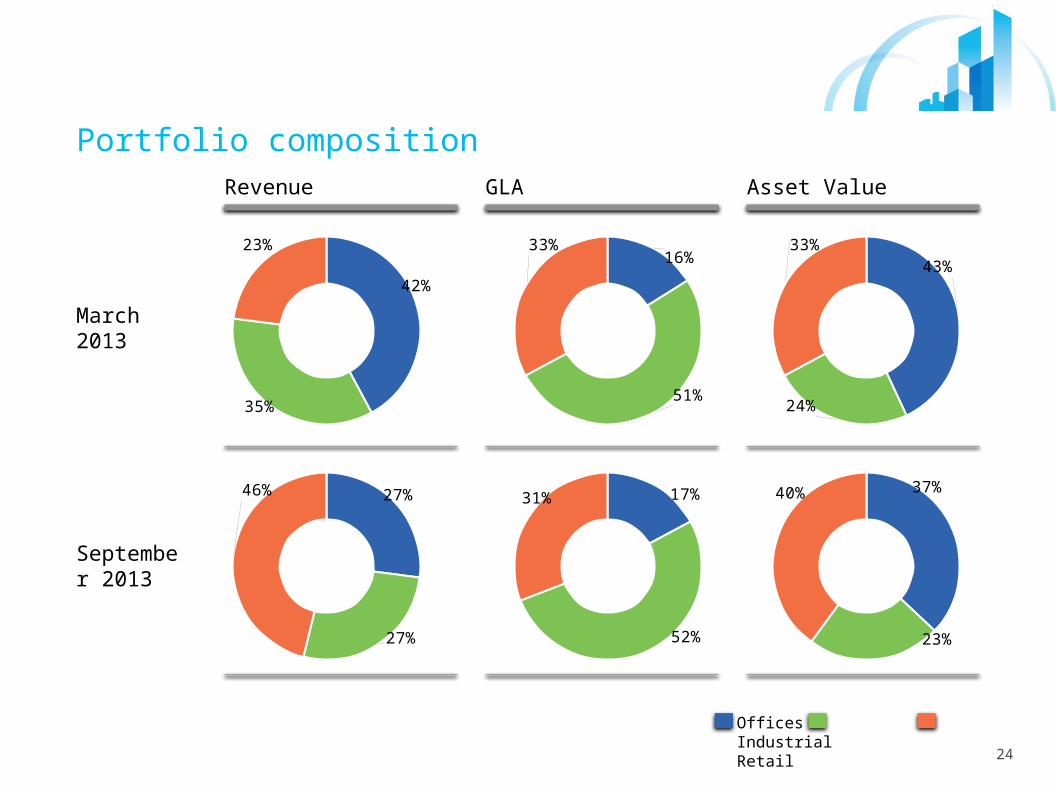
Portfolio compositionRevenue
March2013
September 2013
GLA Asset Value
Offices Industrial Retail
42%
35%
23%16%
51%
33%43%
24%
33%
27%
27%
46% 17%
52%
31%37%
23%
40%
25
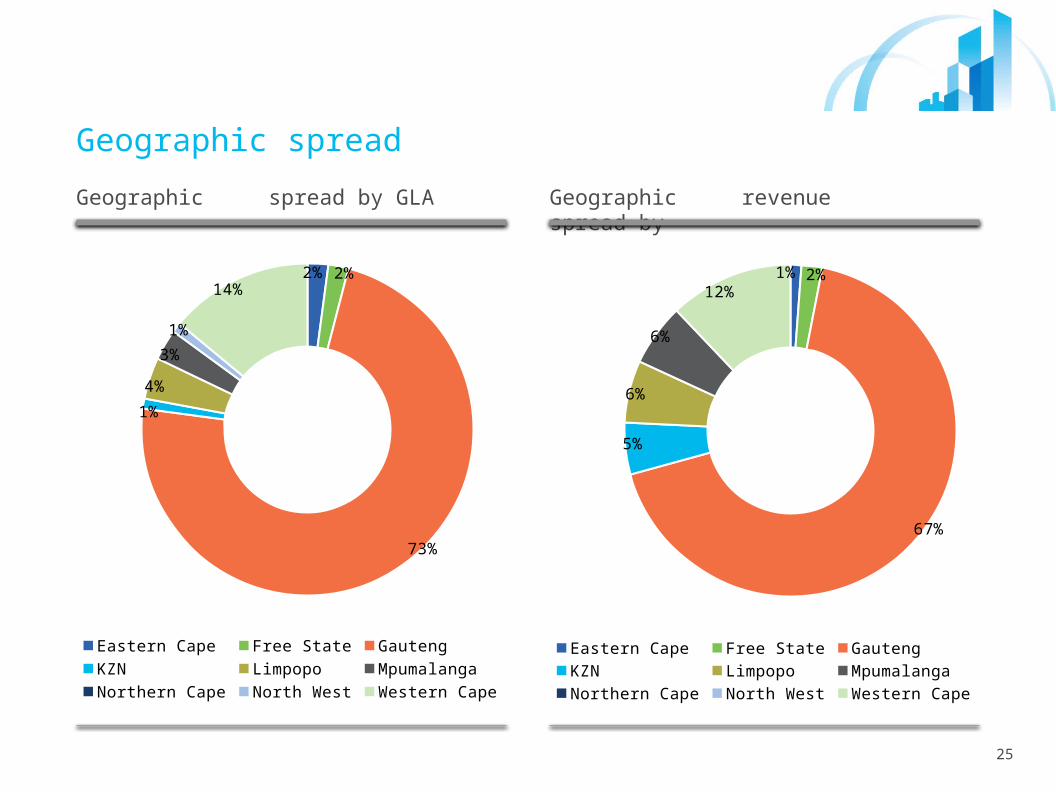
Geographic spread
Geographic spread by GLA
2% 2%
73%
1%
4%
3%
1%
14%
Eastern Cape Free State GautengKZN Limpopo MpumalangaNorthern Cape North West Western Cape
Geographic spread by revenue
1% 2%
67%
5%
6%
6%
12%
Eastern Cape Free State GautengKZN Limpopo MpumalangaNorthern Cape North West Western Cape
26
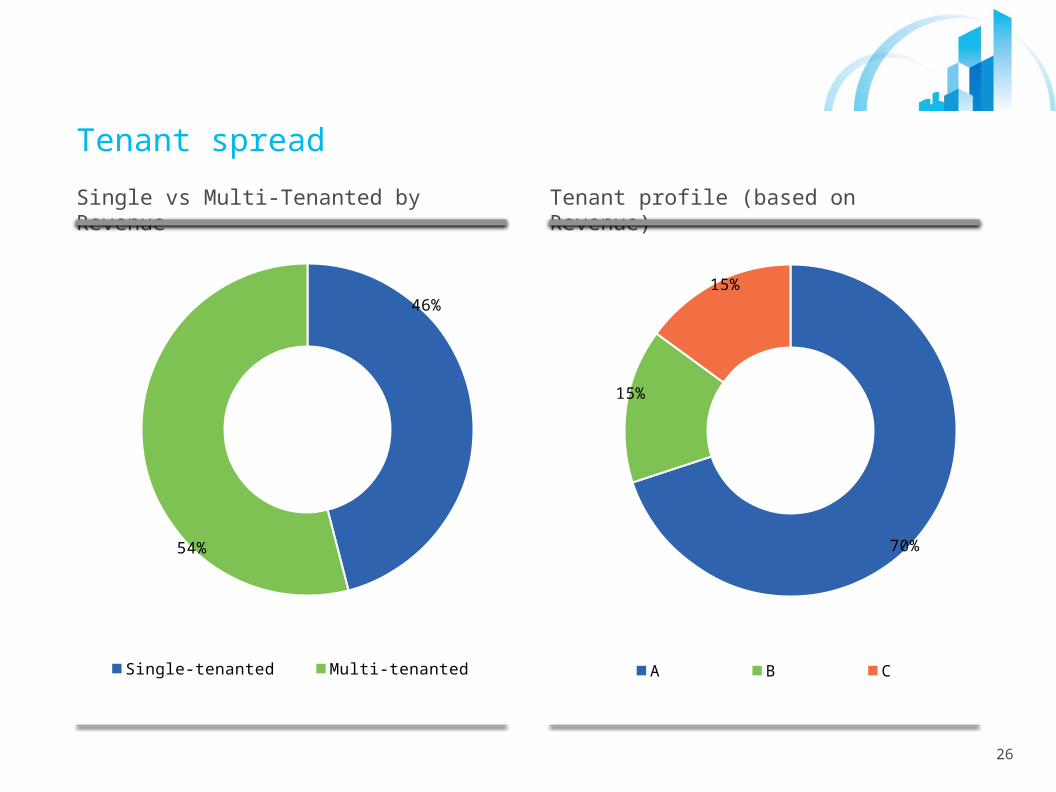
Tenant spread
Single vs Multi-Tenanted by Revenue
46%
54%
Single-tenanted Multi-tenanted
Tenant profile (based on Revenue)
70%
15%
15%
A B C
Overview
Acquisitions
Financial review
Operational review
Appendix
28
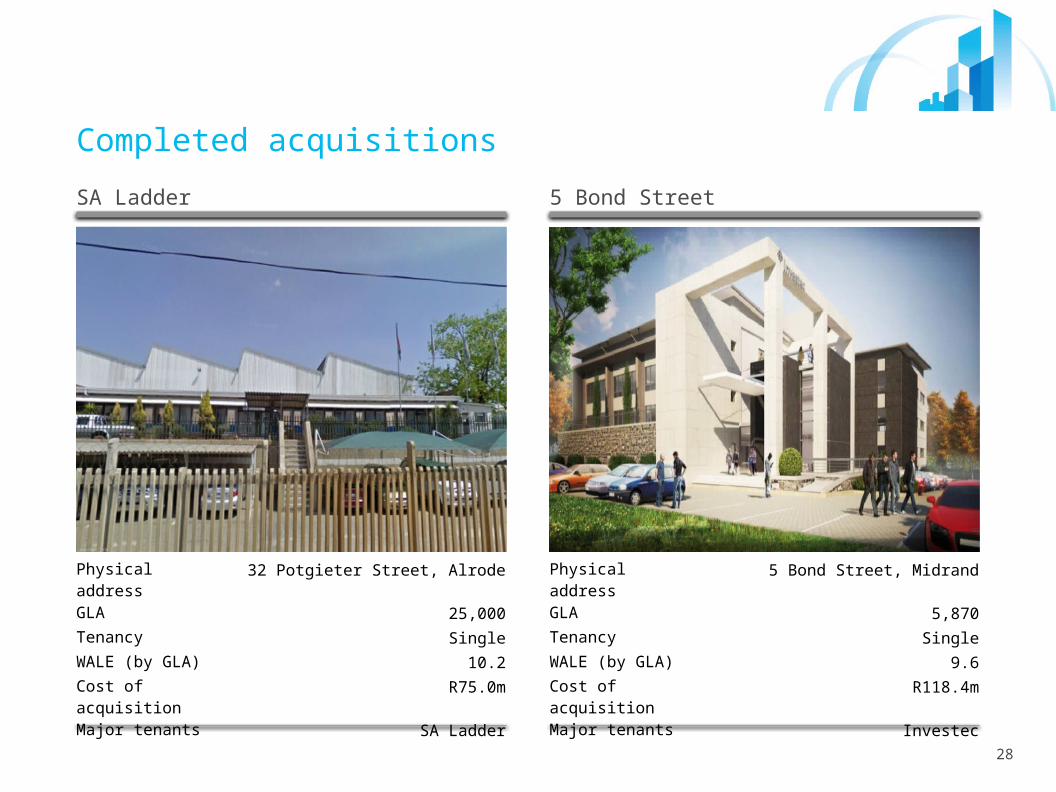
Completed acquisitions
SA Ladder 5 Bond Street
Physical address 32 Potgieter Street, Alrode
GLA 25,000
Tenancy Single
WALE (by GLA) 10.2
Cost of acquisition R75.0m
Major tenants SA Ladder
Physical address 5 Bond Street, Midrand
GLA 5,870
Tenancy Single
WALE (by GLA) 9.6
Cost of acquisition R118.4m
Major tenants Investec
29
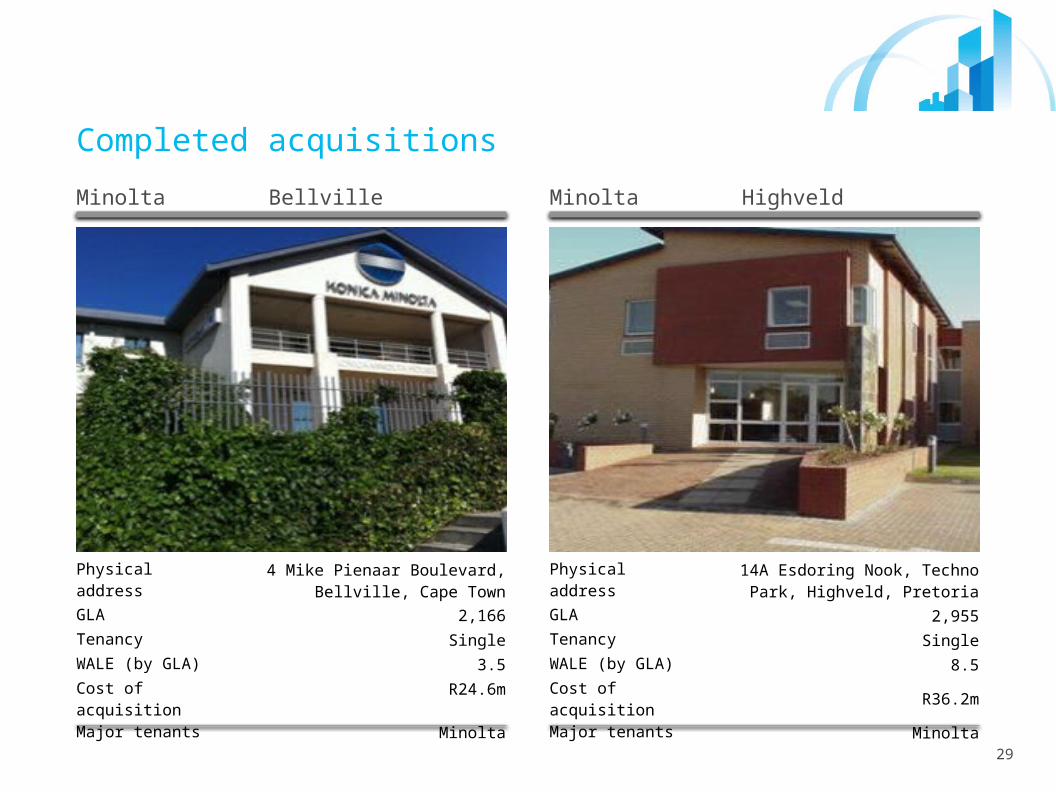
Completed acquisitions
Minolta Bellville Minolta Highveld
Physical address 4 Mike Pienaar Boulevard, Bellville, Cape Town
GLA 2,166
Tenancy Single
WALE (by GLA) 3.5
Cost of acquisition R24.6m
Major tenants Minolta
Physical address 14A Esdoring Nook, Techno Park, Highveld, Pretoria
GLA 2,955Tenancy SingleWALE (by GLA) 8.5Cost of acquisition R36.2mMajor tenants Minolta
30
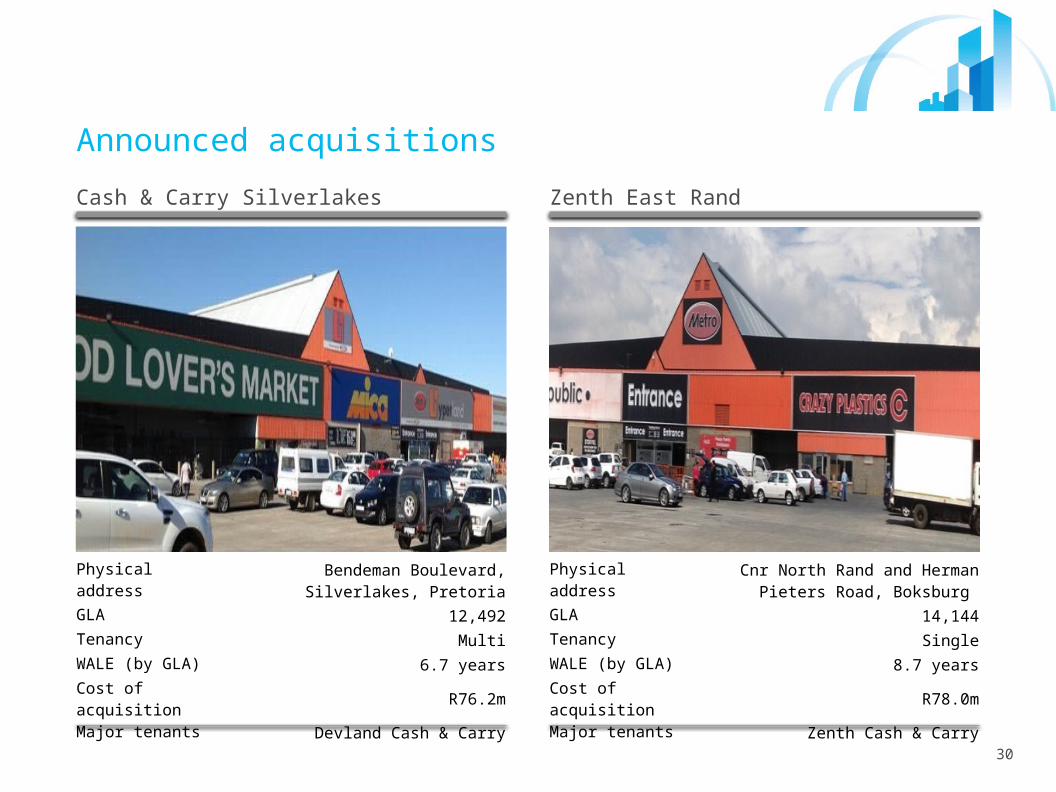
Announced acquisitions
Cash & Carry Silverlakes Zenth East Rand
Physical address Bendeman Boulevard, Silverlakes, Pretoria
GLA 12,492Tenancy MultiWALE (by GLA) 6.7 yearsCost of acquisition R76.2mMajor tenants Devland Cash & Carry
Physical address Cnr North Rand and Herman Pieters Road, Boksburg
GLA 14,144Tenancy SingleWALE (by GLA) 8.7 yearsCost of acquisition R78.0mMajor tenants Zenth Cash & Carry
31
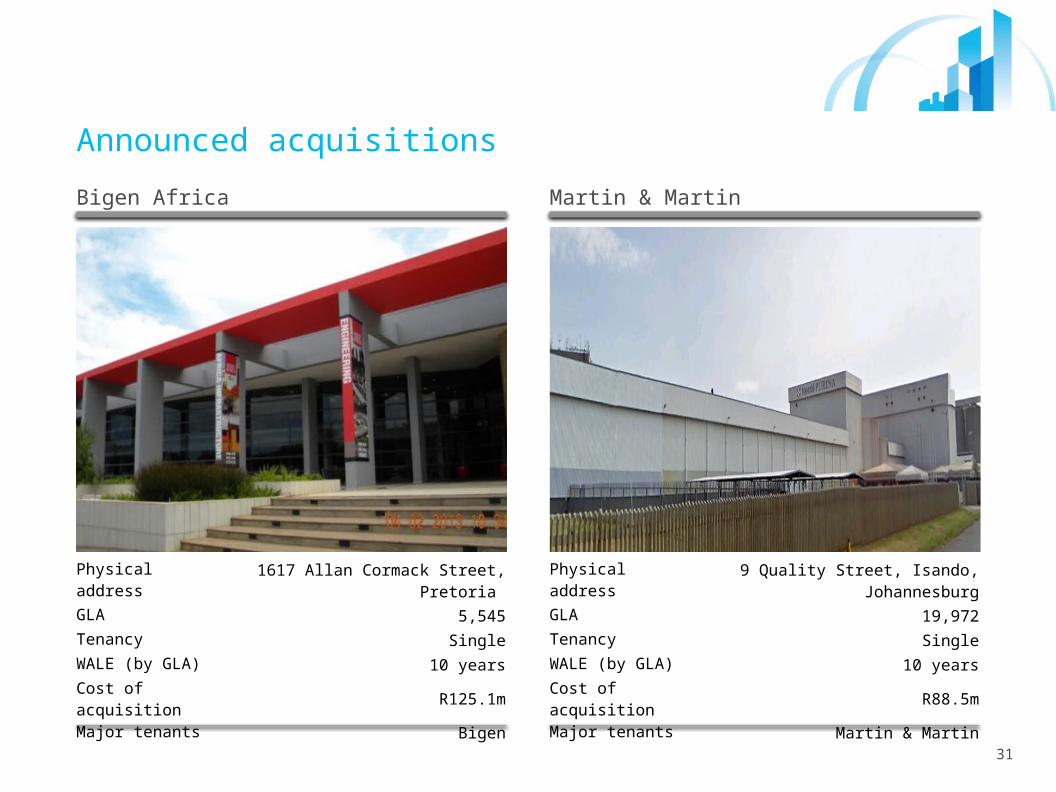
Announced acquisitions
Bigen Africa Martin & Martin
Physical address 1617 Allan Cormack Street, Pretoria GLA 5,545Tenancy SingleWALE (by GLA) 10 yearsCost of acquisition R125.1mMajor tenants Bigen
Physical address 9 Quality Street, Isando, Johannesburg
GLA 19,972Tenancy SingleWALE (by GLA) 10 yearsCost of acquisition R88.5mMajor tenants Martin & Martin
32
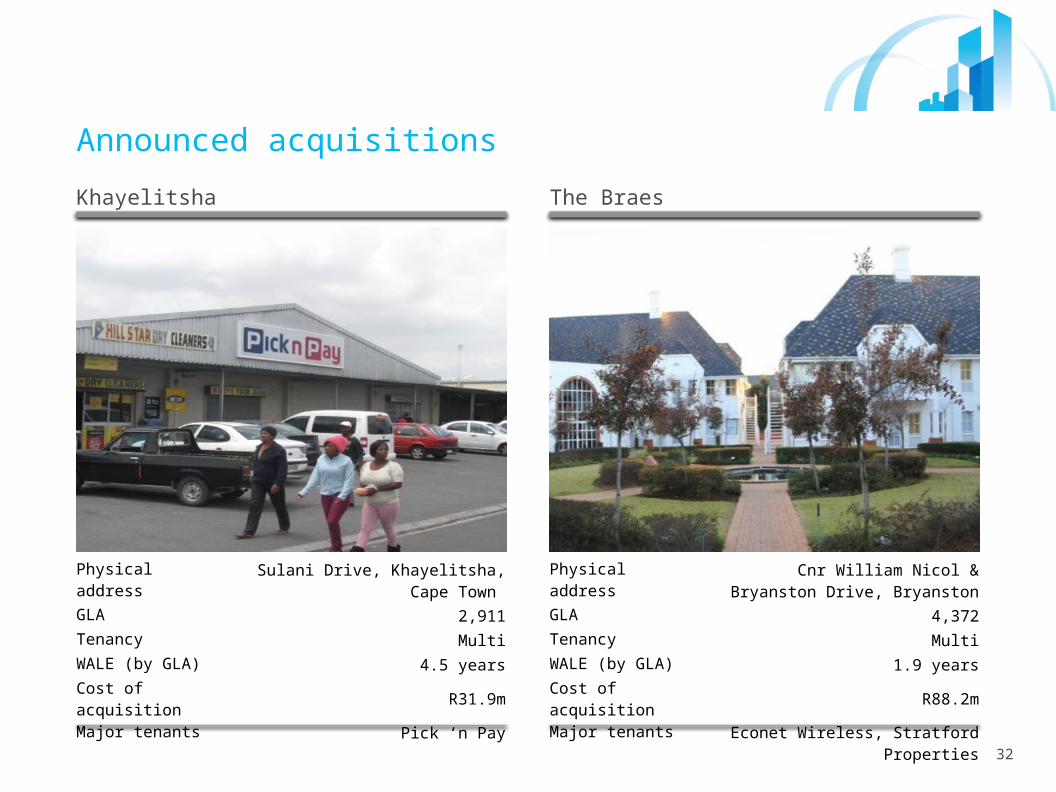
Announced acquisitions
Khayelitsha The Braes
Physical address Sulani Drive, Khayelitsha, Cape Town GLA 2,911Tenancy MultiWALE (by GLA) 4.5 yearsCost of acquisition R31.9mMajor tenants Pick ‘n Pay
Physical address Cnr William Nicol & Bryanston Drive, Bryanston
GLA 4,372Tenancy MultiWALE (by GLA) 1.9 yearsCost of acquisition R88.2mMajor tenants Econet Wireless, Stratford Properties
33
Announced acquisitions
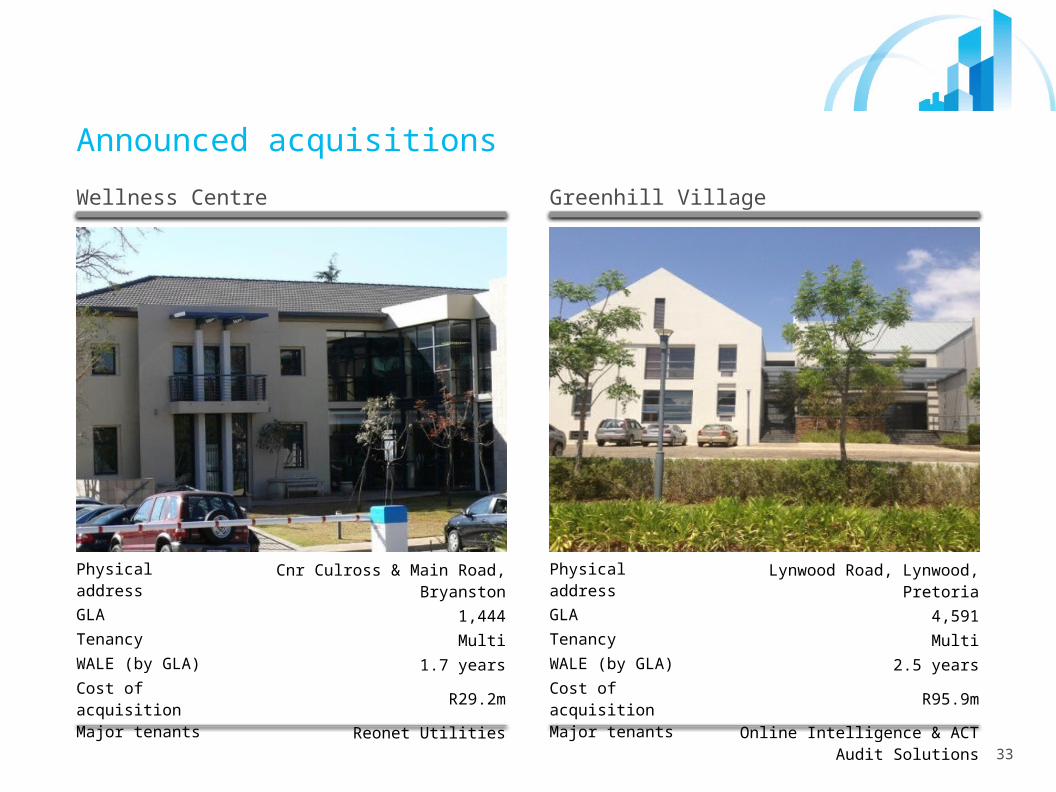
Wellness Centre Greenhill Village
Physical address Cnr Culross & Main Road, BryanstonGLA 1,444Tenancy MultiWALE (by GLA) 1.7 yearsCost of acquisition R29.2mMajor tenants Reonet Utilities
Physical address Lynwood Road, Lynwood, PretoriaGLA 4,591Tenancy MultiWALE (by GLA) 2.5 yearsCost of acquisition R95.9mMajor tenants Online Intelligence & ACT Audit
Solutions
34
Announced acquisitions
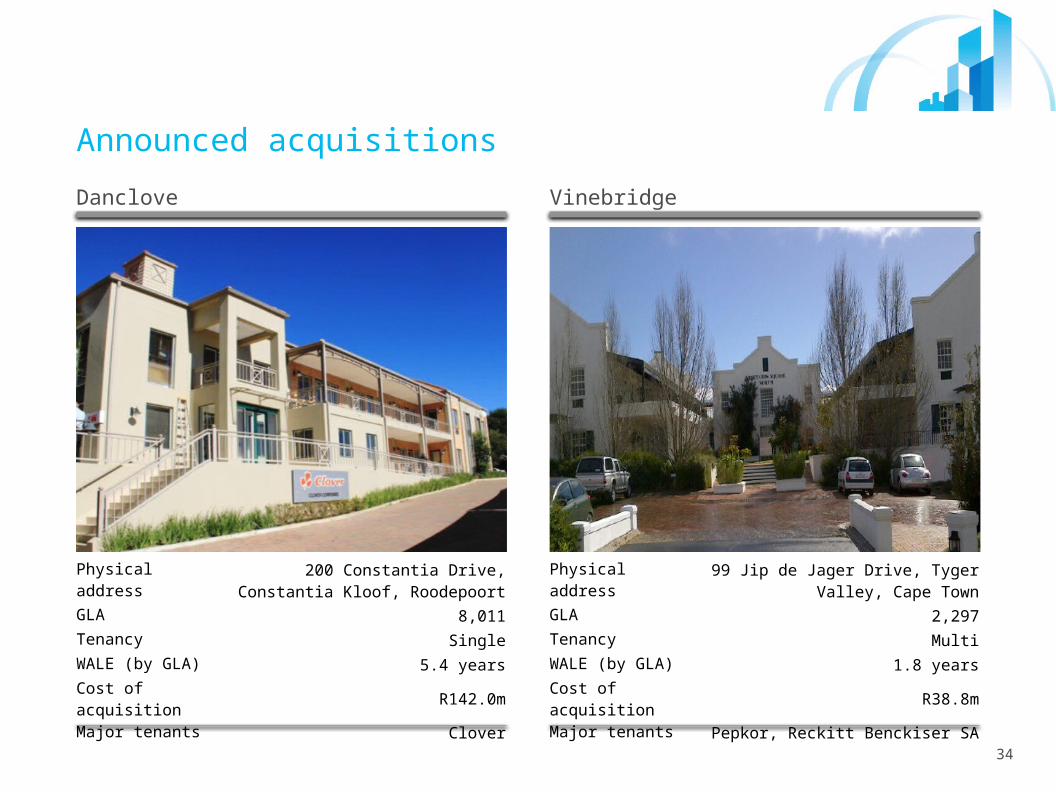
Danclove Vinebridge
Physical address 200 Constantia Drive, Constantia Kloof, Roodepoort
GLA 8,011Tenancy SingleWALE (by GLA) 5.4 yearsCost of acquisition R142.0mMajor tenants Clover
Physical address 99 Jip de Jager Drive, Tyger Valley, Cape Town
GLA 2,297Tenancy MultiWALE (by GLA) 1.8 yearsCost of acquisition R38.8mMajor tenants Pepkor, Reckitt Benckiser SA
35
Announced acquisitions
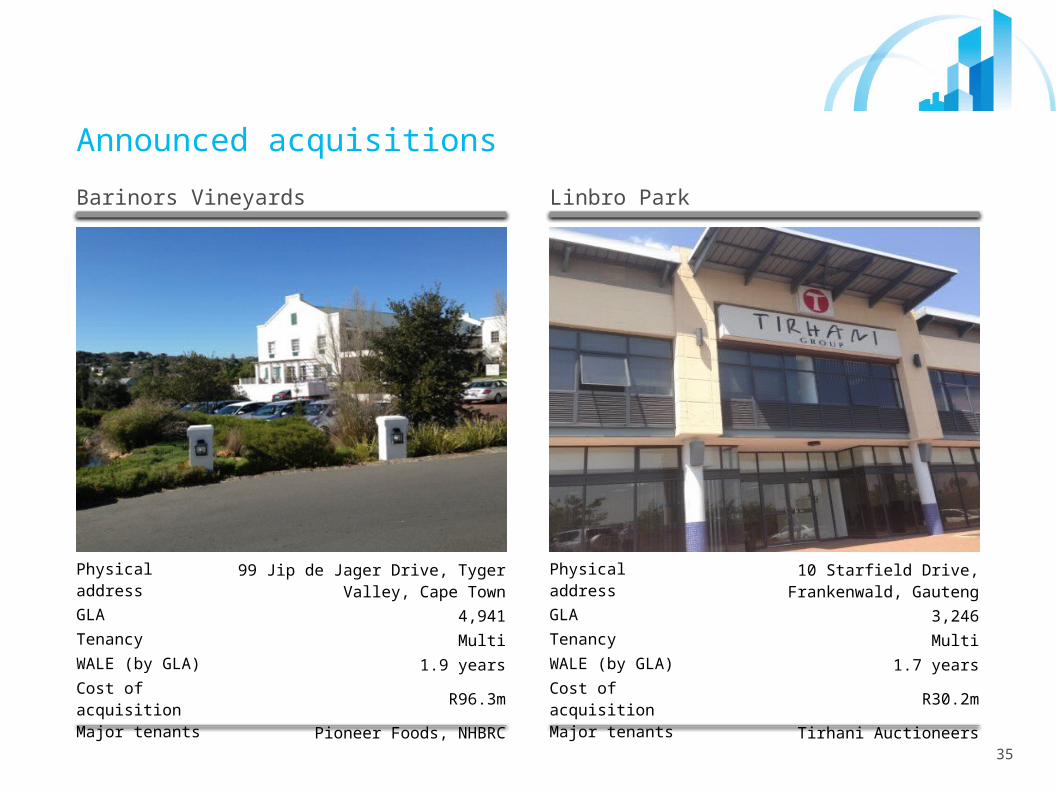
Barinors Vineyards Linbro Park
Physical address 99 Jip de Jager Drive, Tyger Valley, Cape Town
GLA 4,941Tenancy MultiWALE (by GLA) 1.9 yearsCost of acquisition R96.3mMajor tenants Pioneer Foods, NHBRC
Physical address 10 Starfield Drive, Frankenwald, Gauteng
GLA 3,246Tenancy MultiWALE (by GLA) 1.7 yearsCost of acquisition R30.2mMajor tenants Tirhani Auctioneers
36
Announced acquisitions
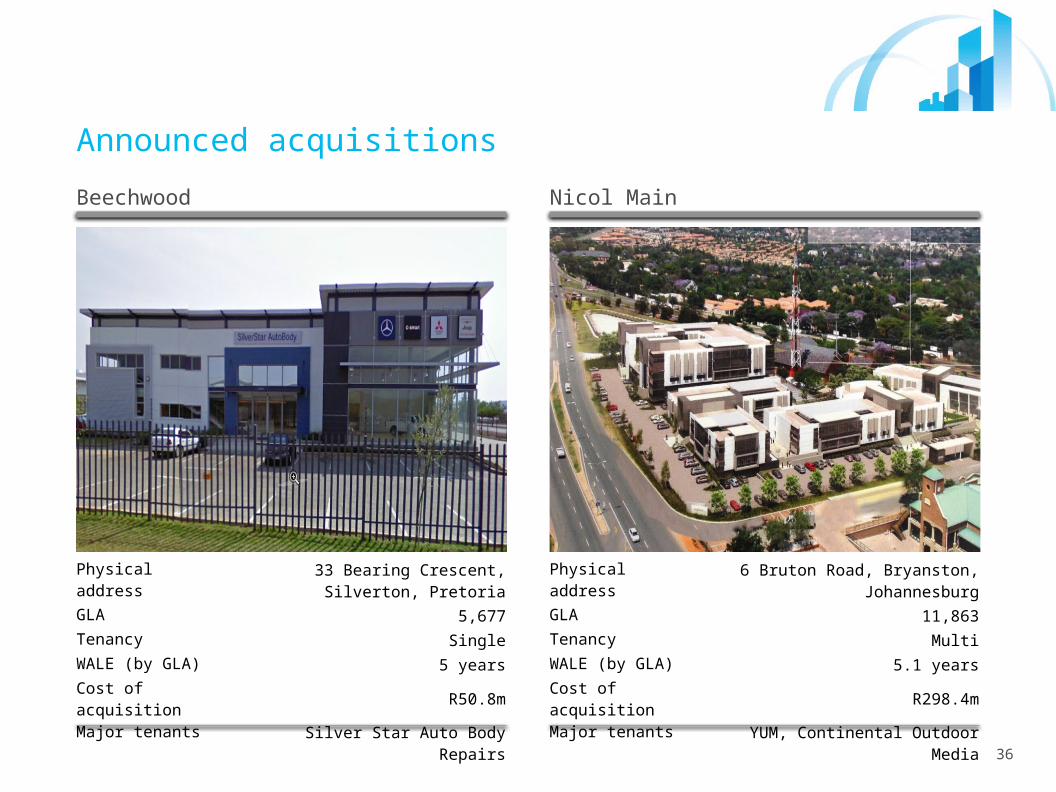
Beechwood Nicol Main
Physical address 33 Bearing Crescent, Silverton, Pretoria
GLA 5,677Tenancy SingleWALE (by GLA) 5 yearsCost of acquisition R50.8mMajor tenants Silver Star Auto Body Repairs
Physical address 6 Bruton Road, Bryanston, Johannesburg
GLA 11,863Tenancy MultiWALE (by GLA) 5.1 yearsCost of acquisition R298.4mMajor tenants YUM, Continental Outdoor Media
37
Disclaimer
The information contained herein is for information purposes only and readers should not rely on such information as advice in relation to a specific issue without taking financial, banking, investment or professional advice. Although information has been obtained from sources believed to be reliable, Investec Property Fund Limited (Reg. No.2008/011366/06) and or any affiliates (collectively “Investec Property”), do not warrant its completeness or accuracy. Opinions and estimates represent Investec’s view at the time of going to print and are subject to change without notice.
Past performance is not indicative of future returns. The information contained herein does not constitute an offer or solicitation of investment, banking or financial services by Investec Property. Neither Investec Property nor Investec Bank Limited shall be held liable in respect of any claim, damages or loss of whatever nature arising in connection with such information. Investec Property accepts no liability for any loss or damage of whatsoever nature including but not limited to loss of profits, goodwill or any type of financial or other pecuniary or direct or special indirect or consequential loss however arising, whether in negligence or for breach of contract or other duty as a result of use of or reliance on the information contained in this document whether authorised or not.
This document/publication may not be reproduced in whole or in part or copies distributed without the prior written consent of Investec Property.