Embed Size (px)
Citation preview
RETAIL TRADE AREAPSYCHOGRAPHIC PROFILEBessemer City, North Carolina
Prepared forCity of Bessemer CityAugust 2015
2
Copyright © and (P) 1988–2012 Microsoft Corporation and/or its suppliers. All rights reserved. http://www.microsoft.com/mappoint/Certain mapping and direction data © 2012 NAVTEQ. All rights reserved. The Data for areas of Canada includes information taken with permission from Canadian authorities, including: © Her Majesty the Queen in Right of Canada, © Queen's Printer for Ontario. NAVTEQ and NAVTEQ ON BOARD are trademarks of NAVTEQ. © 2012 Tele Atlas North America, Inc. All rights reserved. Tele Atlas and Tele Atlas North America are trademarks of Tele Atlas, Inc. © 2012 by Applied Geographic Solutions. All rights reserved. Portions © Copyright 2012 by Woodall Publications Corp. All rights reserved.
BessemerCityNC_RTA_Map_2015
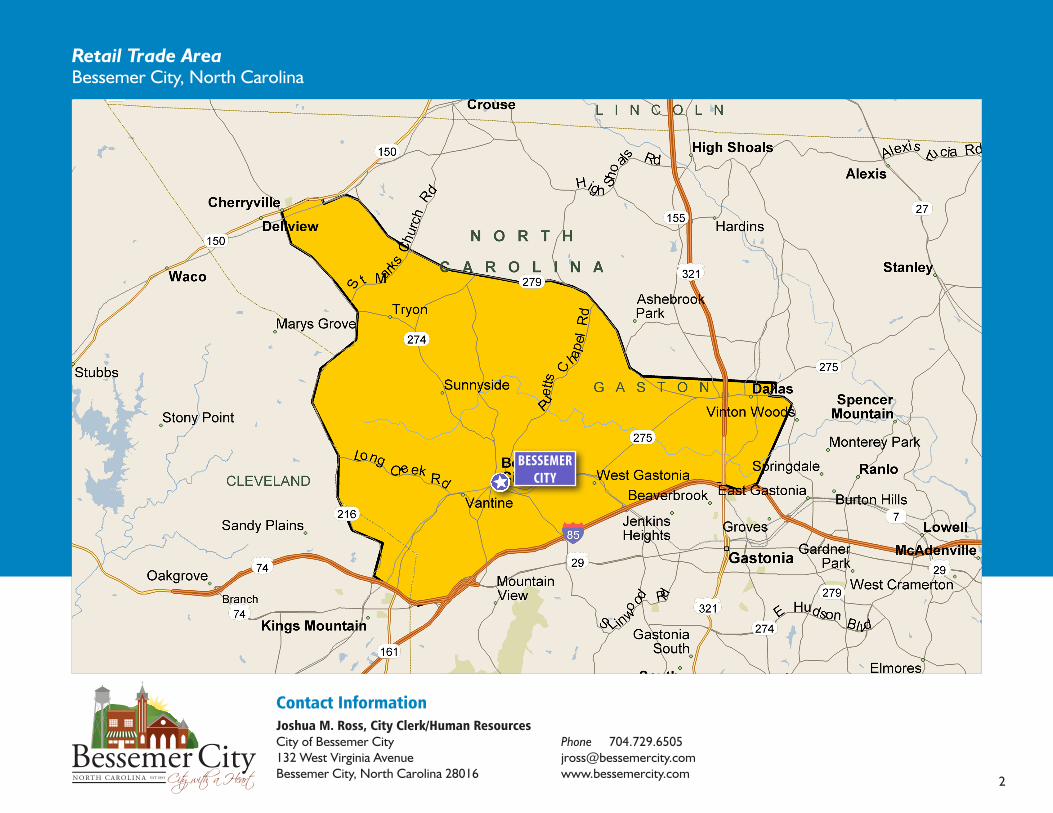
0 mi 2 4 6 8Contact InformationJoshua M. Ross, City Clerk/Human ResourcesCity of Bessemer City132 West Virginia AvenueBessemer City, North Carolina 28016
Phone [email protected]
Retail Trade AreaBessemer City, North Carolina
BESSEMER CITY
3
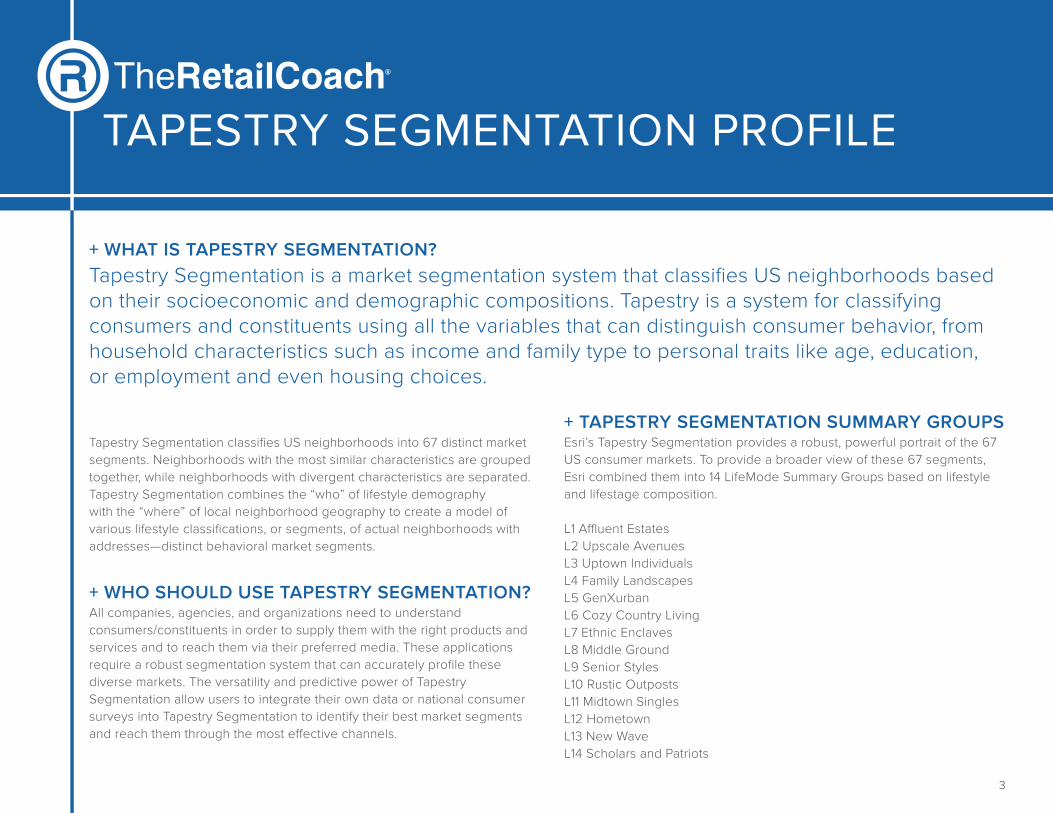
Tapestry Segmentation classifies US neighborhoods into 67 distinct market segments. Neighborhoods with the most similar characteristics are grouped together, while neighborhoods with divergent characteristics are separated. Tapestry Segmentation combines the “who” of lifestyle demography with the “where” of local neighborhood geography to create a model of various lifestyle classifications, or segments, of actual neighborhoods with addresses—distinct behavioral market segments.
+ WHO SHOULD USE TAPESTRY SEGMENTATION?All companies, agencies, and organizations need to understand consumers/constituents in order to supply them with the right products and services and to reach them via their preferred media. These applications require a robust segmentation system that can accurately profile these diverse markets. The versatility and predictive power of Tapestry Segmentation allow users to integrate their own data or national consumer surveys into Tapestry Segmentation to identify their best market segments and reach them through the most effective channels.
+ TAPESTRY SEGMENTATION SUMMARY GROUPSEsri’s Tapestry Segmentation provides a robust, powerful portrait of the 67 US consumer markets. To provide a broader view of these 67 segments, Esri combined them into 14 LifeMode Summary Groups based on lifestyle and lifestage composition.
L1 Affluent EstatesL2 Upscale AvenuesL3 Uptown IndividualsL4 Family LandscapesL5 GenXurbanL6 Cozy Country LivingL7 Ethnic EnclavesL8 Middle GroundL9 Senior StylesL10 Rustic OutpostsL11 Midtown SinglesL12 HometownL13 New WaveL14 Scholars and Patriots
+ WHAT IS TAPESTRY SEGMENTATION?Tapestry Segmentation is a market segmentation system that classifies US neighborhoods based on their socioeconomic and demographic compositions. Tapestry is a system for classifying consumers and constituents using all the variables that can distinguish consumer behavior, from household characteristics such as income and family type to personal traits like age, education,or employment and even housing choices.
TAPESTRY SEGMENTATION PROFILE
4
+ Affluent Estates
+ Upscale Avenues
+ Uptown Individuals
+ Family Landscapes
+ GenXurban
+ Cozy Country Living
+ Ethnic Enclaves
+ Middle Ground
+ Senior Styles
+ Rustic Outposts
+ Midtown Singles
+ Hometown
+ New Wave
+ Scholars and Patriots
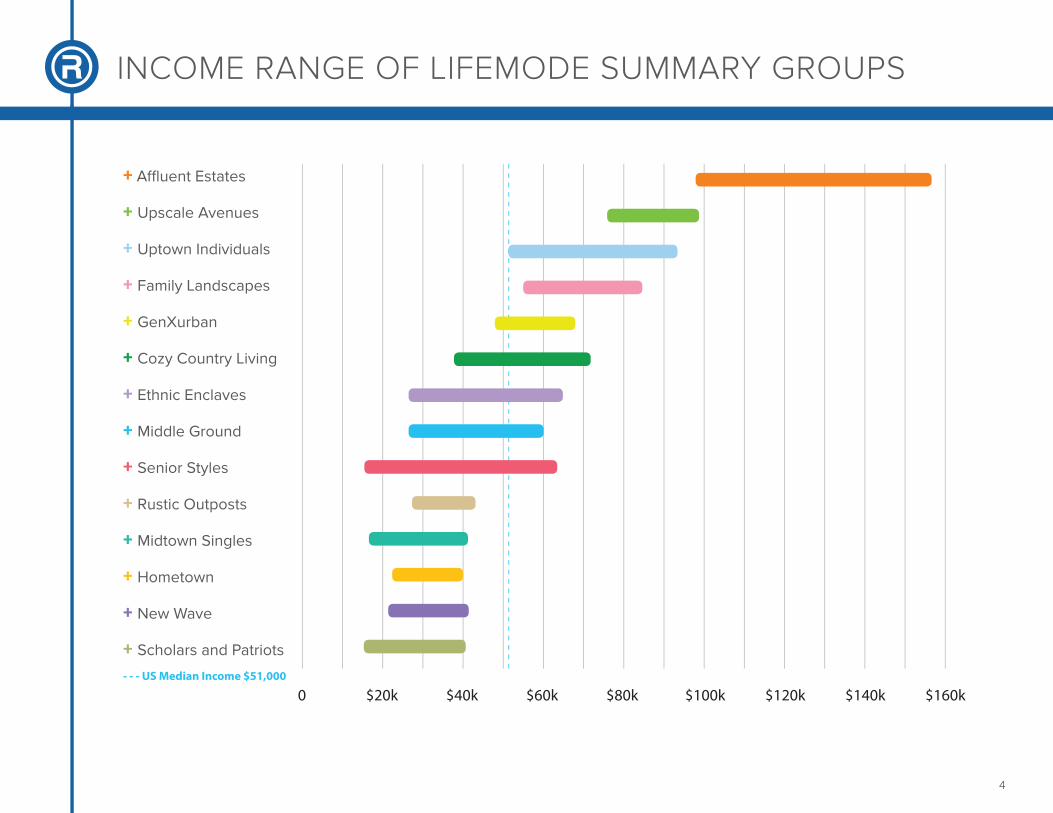
- - - US Median Income $51,000
0 $20k $40k $60k $80k $100k $120k $140k $160k
INCOME RANGE OF LIFEMODE SUMMARY GROUPS
5
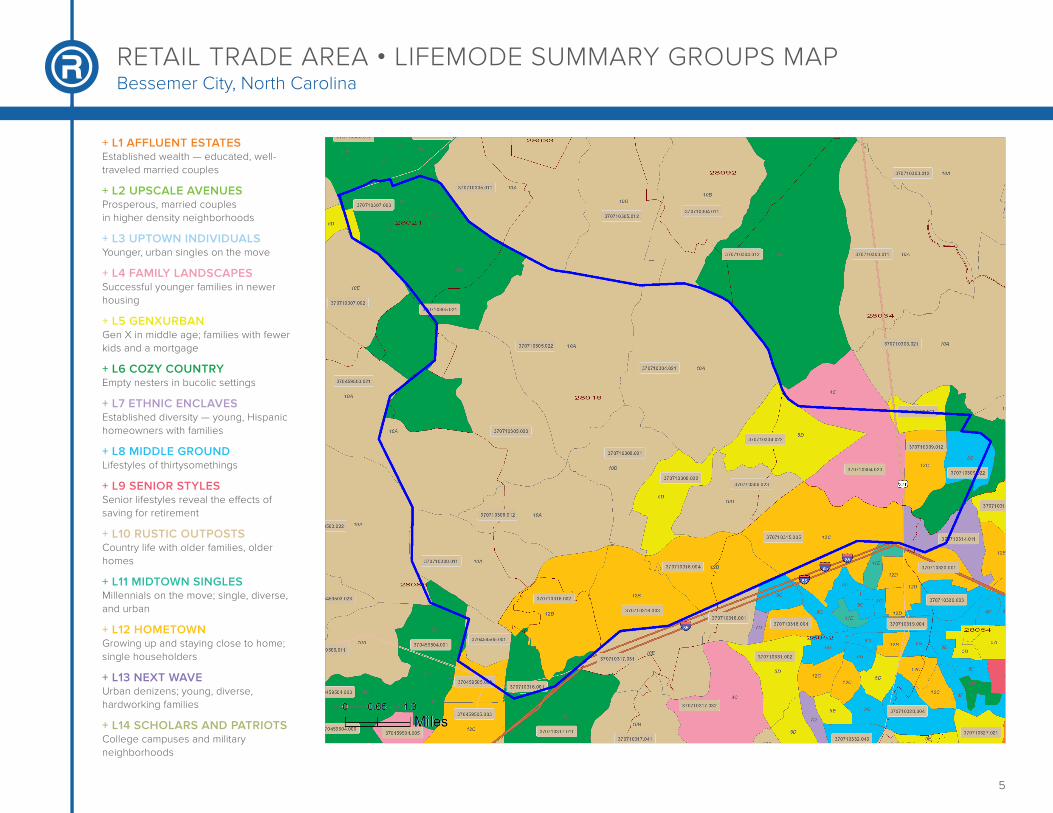
+ L1 AFFLUENT ESTATESEstablished wealth — educated, well-traveled married couples
+ L2 UPSCALE AVENUESProsperous, married couplesin higher density neighborhoods
+ L3 UPTOWN INDIVIDUALSYounger, urban singles on the move
+ L4 FAMILY LANDSCAPESSuccessful younger families in newer housing
+ L5 GENXURBANGen X in middle age; families with fewer kids and a mortgage
+ L6 COZY COUNTRYEmpty nesters in bucolic settings
+ L7 ETHNIC ENCLAVESEstablished diversity — young, Hispanic homeowners with families
+ L8 MIDDLE GROUNDLifestyles of thirtysomethings
+ L9 SENIOR STYLESSenior lifestyles reveal the effects of saving for retirement
+ L10 RUSTIC OUTPOSTSCountry life with older families, older homes
+ L11 MIDTOWN SINGLESMillennials on the move; single, diverse, and urban
+ L12 HOMETOWNGrowing up and staying close to home; single householders
+ L13 NEXT WAVEUrban denizens; young, diverse,hardworking families
+ L14 SCHOLARS AND PATRIOTSCollege campuses and military neighborhoods
RETAIL TRADE AREA • LIFEMODE SUMMARY GROUPS MAPBessemer City, North Carolina
Dominant Tapestry MapBessemerCityNC_RTA_Map_2015 Prepared by EsriArea: 62.02 square miles
Source: Esri
August 06, 2015
©2015 Esri Page 1 of 2
6
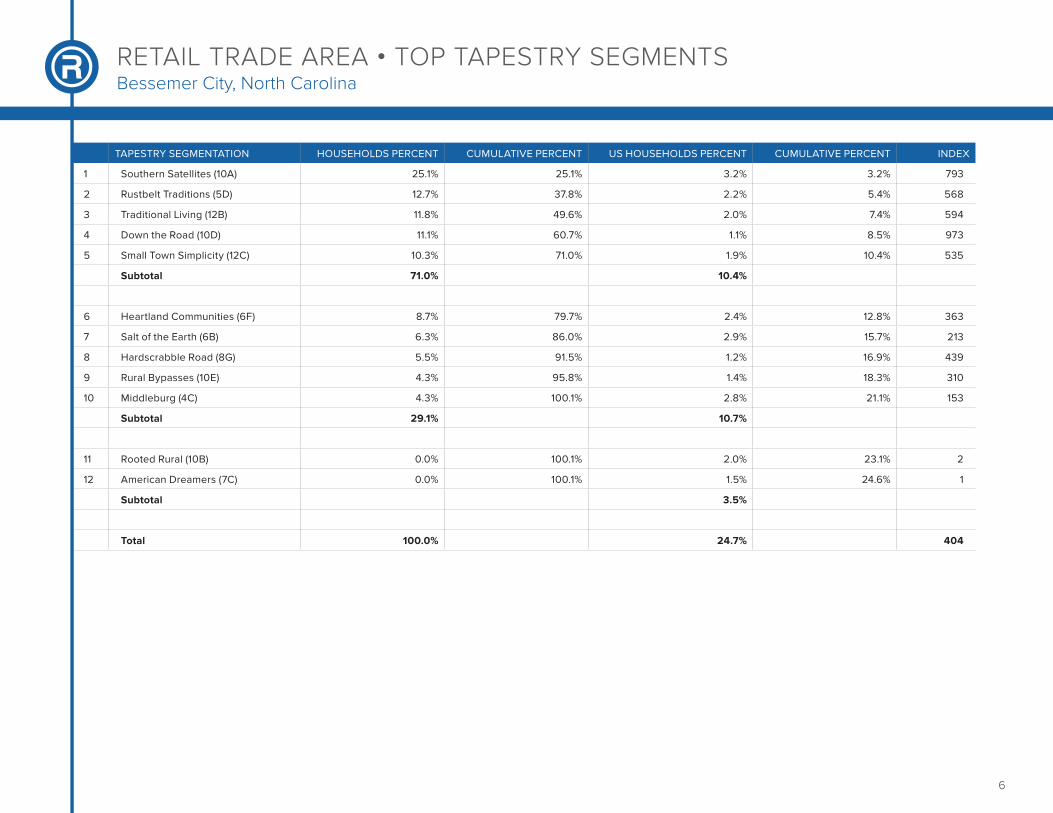
TAPESTRY SEGMENTATION HOUSEHOLDS PERCENT CUMULATIVE PERCENT US HOUSEHOLDS PERCENT CUMULATIVE PERCENT INDEX
1 Southern Satellites (10A) 25.1% 25.1% 3.2% 3.2% 793
2 Rustbelt Traditions (5D) 12.7% 37.8% 2.2% 5.4% 568
3 Traditional Living (12B) 11.8% 49.6% 2.0% 7.4% 594
4 Down the Road (10D) 11.1% 60.7% 1.1% 8.5% 973
5 Small Town Simplicity (12C) 10.3% 71.0% 1.9% 10.4% 535
Subtotal 71.0% 10.4%
6 Heartland Communities (6F) 8.7% 79.7% 2.4% 12.8% 363
7 Salt of the Earth (6B) 6.3% 86.0% 2.9% 15.7% 213
8 Hardscrabble Road (8G) 5.5% 91.5% 1.2% 16.9% 439
9 Rural Bypasses (10E) 4.3% 95.8% 1.4% 18.3% 310
10 Middleburg (4C) 4.3% 100.1% 2.8% 21.1% 153
Subtotal 29.1% 10.7%
11 Rooted Rural (10B) 0.0% 100.1% 2.0% 23.1% 2
12 American Dreamers (7C) 0.0% 100.1% 1.5% 24.6% 1
Subtotal 3.5%
Total 100.0% 24.7% 404
RETAIL TRADE AREA • TOP TAPESTRY SEGMENTSBessemer City, North Carolina
7
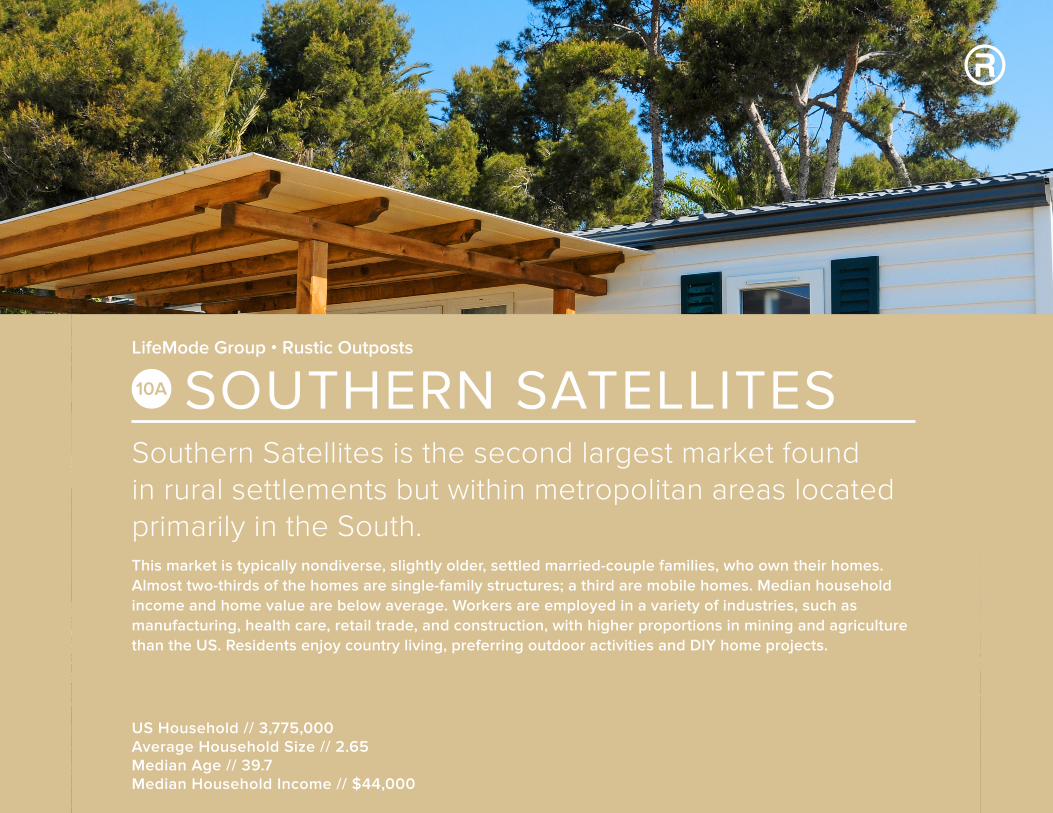
Southern Satellites is the second largest market foundin rural settlements but within metropolitan areas locatedprimarily in the South.This market is typically nondiverse, slightly older, settled married-couple families, who own their homes. Almost two-thirds of the homes are single-family structures; a third are mobile homes. Median household income and home value are below average. Workers are employed in a variety of industries, such as manufacturing, health care, retail trade, and construction, with higher proportions in mining and agriculture than the US. Residents enjoy country living, preferring outdoor activities and DIY home projects.
US Household // 3,775,000Average Household Size // 2.65Median Age // 39.7Median Household Income // $44,000
LifeMode Group • Rustic Outposts
SOUTHERN SATELLITES10A
8
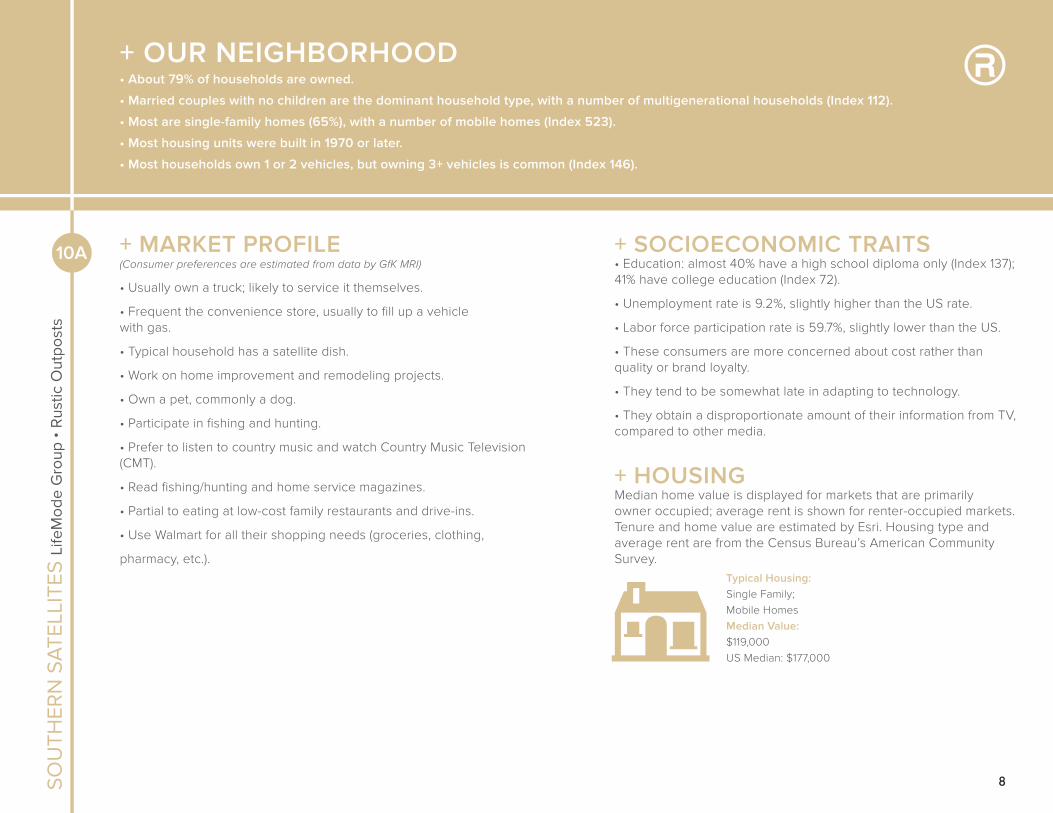
+ MARKET PROFILE(Consumer preferences are estimated from data by GfK MRI)
• Usually own a truck; likely to service it themselves.
• Frequent the convenience store, usually to fill up a vehiclewith gas.
• Typical household has a satellite dish.
• Work on home improvement and remodeling projects.
• Own a pet, commonly a dog.
• Participate in fishing and hunting.
• Prefer to listen to country music and watch Country Music Television (CMT).
• Read fishing/hunting and home service magazines.
• Partial to eating at low-cost family restaurants and drive-ins.
• Use Walmart for all their shopping needs (groceries, clothing,
pharmacy, etc.).
+ SOCIOECONOMIC TRAITS• Education: almost 40% have a high school diploma only (Index 137); 41% have college education (Index 72).
• Unemployment rate is 9.2%, slightly higher than the US rate.
• Labor force participation rate is 59.7%, slightly lower than the US.
• These consumers are more concerned about cost rather than quality or brand loyalty.
• They tend to be somewhat late in adapting to technology.
• They obtain a disproportionate amount of their information from TV, compared to other media.
+ HOUSINGMedian home value is displayed for markets that are primarilyowner occupied; average rent is shown for renter-occupied markets.Tenure and home value are estimated by Esri. Housing type and average rent are from the Census Bureau’s American Community Survey.
Typical Housing:Single Family;Mobile HomesMedian Value:$119,000US Median: $177,000
10A
SOU
THER
N S
ATE
LLIT
ES L
ifeM
ode
Gro
up •
Rus
tic O
utpo
sts
+ OUR NEIGHBORHOOD• About 79% of households are owned.
• Married couples with no children are the dominant household type, with a number of multigenerational households (Index 112).
• Most are single-family homes (65%), with a number of mobile homes (Index 523).
• Most housing units were built in 1970 or later.
• Most households own 1 or 2 vehicles, but owning 3+ vehicles is common (Index 146).
9
SOUTHERN SATELLITES LifeMode Group • Rustic Outposts10A
Male Female8% 4% 0 4% 8%
85+80–8475–7970–7465–6960–6455–5950–5445–4940–4435–3930–3425–2920–2415–1910–14
5–9< 5
* Hispanic can be of any race. US Average
84.7%
7.9%
3.4%
2.0%
8.2%
1.4%
0.7%
80%60%40%20%0
White
Black
AmericanIndian
Asian andPac. Island
Other
Multiple
Hispanic*
0
$60k $90k$30k $120k+
Median Household Income
$44,000
US Median $51,000
0
0
$300k$100k $200k $400k+
Median Net Worth
$70,000
US Median $71,000
$40,000
$30,000
$20,000
$10,000
0 700,000
Med
ian
Ear
ning
s
Workers (Age 16+)500,000300,000100,000
Sales and Related
Transportation andMaterial Moving
Office andAdministrative Support
ProductionConstruction and Extraction
3500 50 100 150 200 250 300
Housing
Food
Apparel & Services
Transportation
Health Care
Entertainment &Recreation
Education
Pensions &Social Security
Other
80
49
85
87
83
61
76
79
74
TAPESTRYSEGMENTATION
TM
esri.com/tapestry
LifeMode Group: Rustic Outposts
Southern Satellites
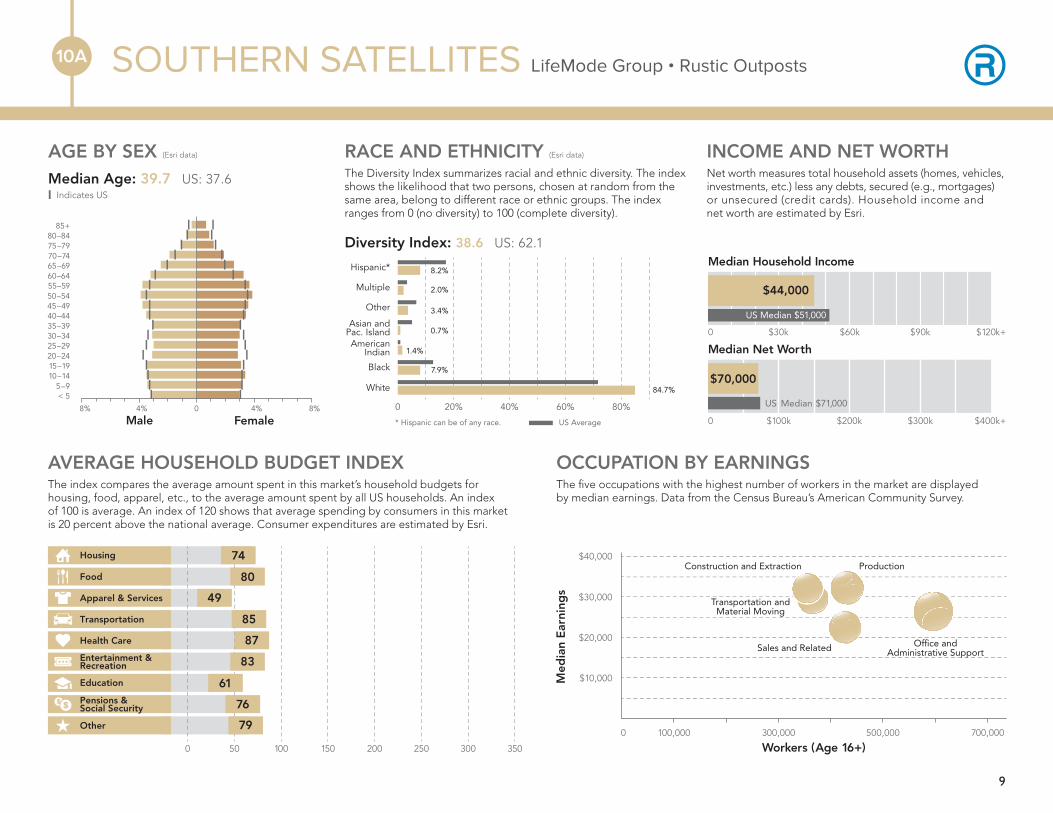
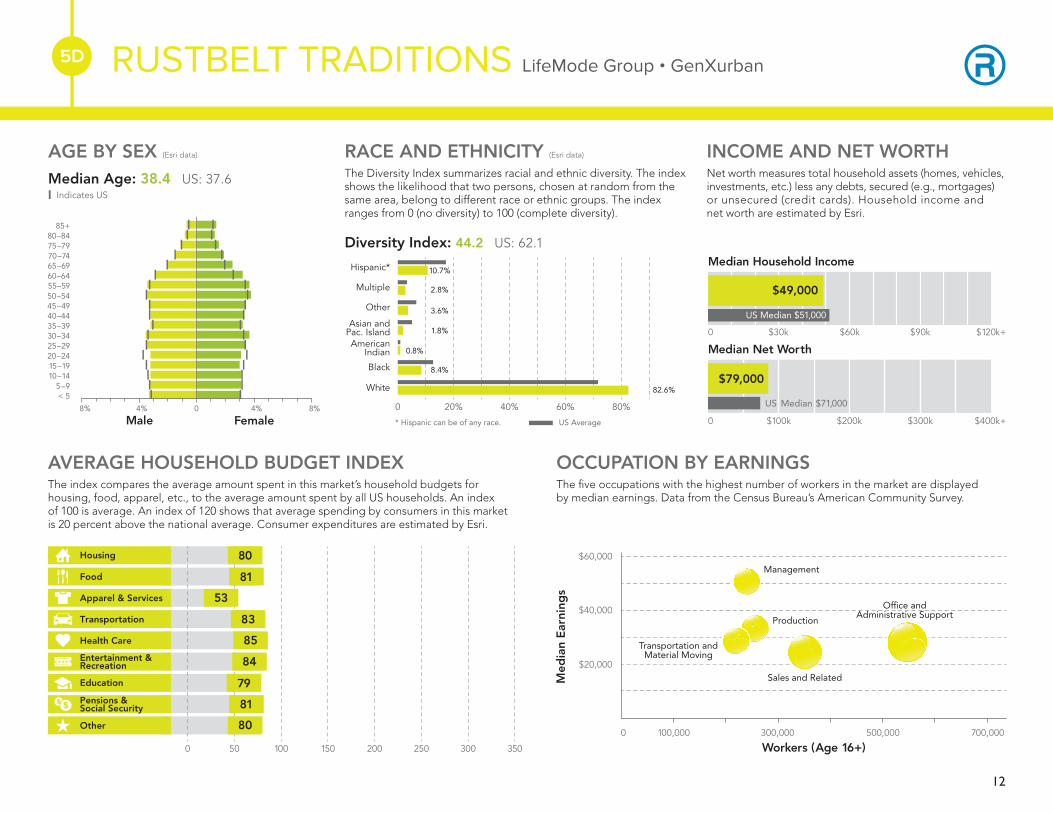
INCOME AND NET WORTHNet worth measures total household assets (homes, vehicles, investments, etc.) less any debts, secured (e.g., mortgages)or unsecured (credit cards). Household income andnet worth are estimated by Esri.
AGE BY SEX (Esri data)
Median Age: 39.7 US: 37.6| Indicates US
RACE AND ETHNICITY (Esri data)
The Diversity Index summarizes racial and ethnic diversity. The index shows the likelihood that two persons, chosen at random from the same area, belong to different race or ethnic groups. The index ranges from 0 (no diversity) to 100 (complete diversity).
Diversity Index: 38.6 US: 62.1
10A
OCCUPATION BY EARNINGSThe fi ve occupations with the highest number of workers in the market are displayedby median earnings. Data from the Census Bureau’s American Community Survey.
AVERAGE HOUSEHOLD BUDGET INDEXThe index compares the average amount spent in this market’s household budgets for housing, food, apparel, etc., to the average amount spent by all US households. An indexof 100 is average. An index of 120 shows that average spending by consumers in this marketis 20 percent above the national average. Consumer expenditures are estimated by Esri.
10
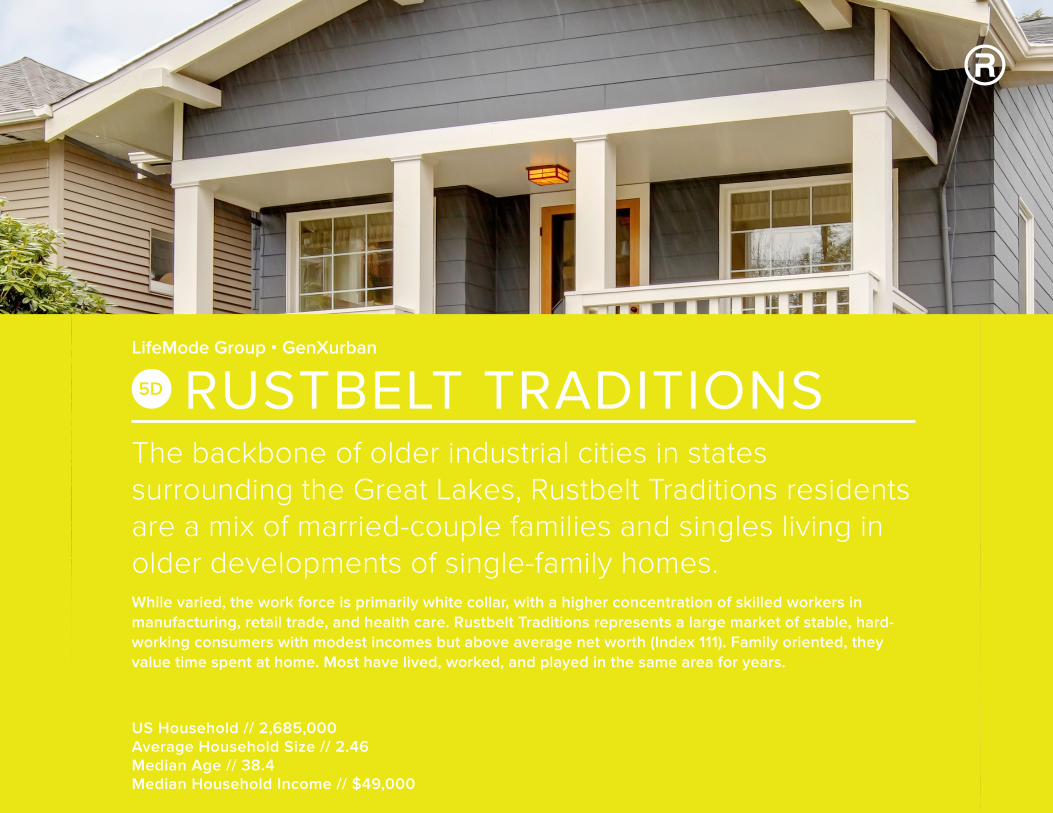
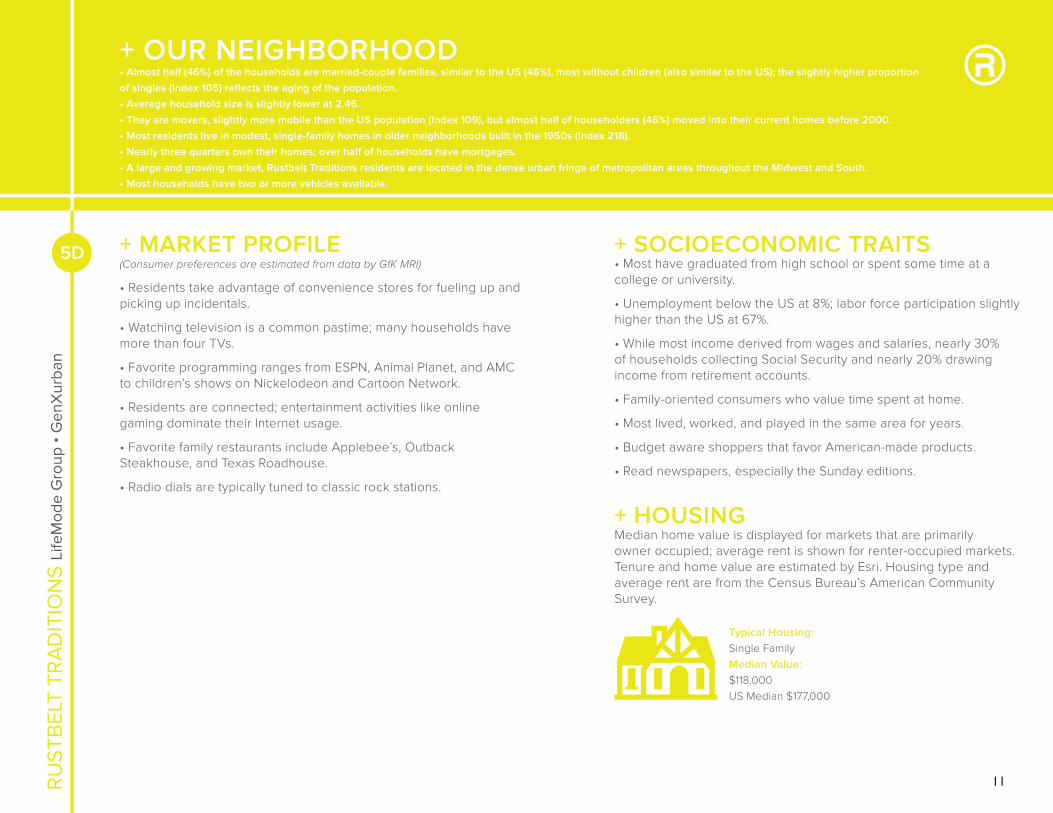
The backbone of older industrial cities in statessurrounding the Great Lakes, Rustbelt Traditions residents are a mix of married-couple families and singles living in older developments of single-family homes.While varied, the work force is primarily white collar, with a higher concentration of skilled workers in manufacturing, retail trade, and health care. Rustbelt Traditions represents a large market of stable, hard-working consumers with modest incomes but above average net worth (Index 111). Family oriented, they value time spent at home. Most have lived, worked, and played in the same area for years.
US Household // 2,685,000Average Household Size // 2.46Median Age // 38.4Median Household Income // $49,000
LifeMode Group • GenXurban
RUSTBELT TRADITIONS5D
11
+ MARKET PROFILE(Consumer preferences are estimated from data by GfK MRI)
• Residents take advantage of convenience stores for fueling up and picking up incidentals.
• Watching television is a common pastime; many households have more than four TVs.
• Favorite programming ranges from ESPN, Animal Planet, and AMC to children’s shows on Nickelodeon and Cartoon Network.
• Residents are connected; entertainment activities like online gaming dominate their Internet usage.
• Favorite family restaurants include Applebee’s, Outback Steakhouse, and Texas Roadhouse.
• Radio dials are typically tuned to classic rock stations.
+ SOCIOECONOMIC TRAITS• Most have graduated from high school or spent some time at a college or university.
• Unemployment below the US at 8%; labor force participation slightly higher than the US at 67%.
• While most income derived from wages and salaries, nearly 30% of households collecting Social Security and nearly 20% drawing income from retirement accounts.
• Family-oriented consumers who value time spent at home.
• Most lived, worked, and played in the same area for years.
• Budget aware shoppers that favor American-made products.
• Read newspapers, especially the Sunday editions.
+ HOUSINGMedian home value is displayed for markets that are primarilyowner occupied; average rent is shown for renter-occupied markets.Tenure and home value are estimated by Esri. Housing type and average rent are from the Census Bureau’s American Community Survey.
Typical Housing:Single FamilyMedian Value:$118,000US Median $177,000
5D
RU
STB
ELT
TRA
DIT
ION
S Li
feM
ode
Gro
up •
Gen
Xur
ban
+ OUR NEIGHBORHOOD• Almost half (46%) of the households are married-couple families, similar to the US (48%), most without children (also similar to the US); the slightly higher proportion
of singles (Index 105) reflects the aging of the population.
• Average household size is slightly lower at 2.46.
• They are movers, slightly more mobile than the US population (Index 109), but almost half of householders (46%) moved into their current homes before 2000.
• Most residents live in modest, single-family homes in older neighborhoods built in the 1950s (Index 218).
• Nearly three quarters own their homes; over half of households have mortgages.
• A large and growing market, Rustbelt Traditions residents are located in the dense urban fringe of metropolitan areas throughout the Midwest and South.
• Most households have two or more vehicles available.
12
RUSTBELT TRADITIONS LifeMode Group • GenXurban5D
Male Female8% 4% 0 4% 8%
85+80–8475–7970–7465–6960–6455–5950–5445–4940–4435–3930–3425–2920–2415–1910–14
5–9< 5
* Hispanic can be of any race. US Average
82.6%
8.4%
3.6%
2.8%
10.7%
0.8%
1.8%
80%60%40%20%0
White
Black
AmericanIndian
Asian andPac. Island
Other
Multiple
Hispanic*
0
$60k $90k$30k $120k+
Median Household Income
$49,000
US Median $51,000
0
0
$300k$100k $200k $400k+
Median Net Worth
$79,000
US Median $71,000
$60,000
$40,000
$20,000
0 300,000 500,000 700,000
Med
ian
Ear
ning
s
Workers (Age 16+)100,000
Production
Transportation andMaterial Moving
Office andAdministrative Support
Management
Sales and Related
3500 50 100 150 200 250 300
Housing
Food
Apparel & Services
Transportation
Health Care
Entertainment &Recreation
Education
Pensions &Social Security
Other
81
53
83
85
84
79
81
80
80
TAPESTRYSEGMENTATION
TM
esri.com/tapestry
LifeMode Group: GenXurban
Rustbelt Traditions
INCOME AND NET WORTHNet worth measures total household assets (homes, vehicles, investments, etc.) less any debts, secured (e.g., mortgages)or unsecured (credit cards). Household income andnet worth are estimated by Esri.
AGE BY SEX (Esri data)
Median Age: 38.4 US: 37.6| Indicates US
RACE AND ETHNICITY (Esri data)
The Diversity Index summarizes racial and ethnic diversity. The index shows the likelihood that two persons, chosen at random from the same area, belong to different race or ethnic groups. The index ranges from 0 (no diversity) to 100 (complete diversity).
Diversity Index: 44.2 US: 62.1
5D
OCCUPATION BY EARNINGSThe fi ve occupations with the highest number of workers in the market are displayedby median earnings. Data from the Census Bureau’s American Community Survey.
AVERAGE HOUSEHOLD BUDGET INDEXThe index compares the average amount spent in this market’s household budgets for housing, food, apparel, etc., to the average amount spent by all US households. An indexof 100 is average. An index of 120 shows that average spending by consumers in this marketis 20 percent above the national average. Consumer expenditures are estimated by Esri.
13
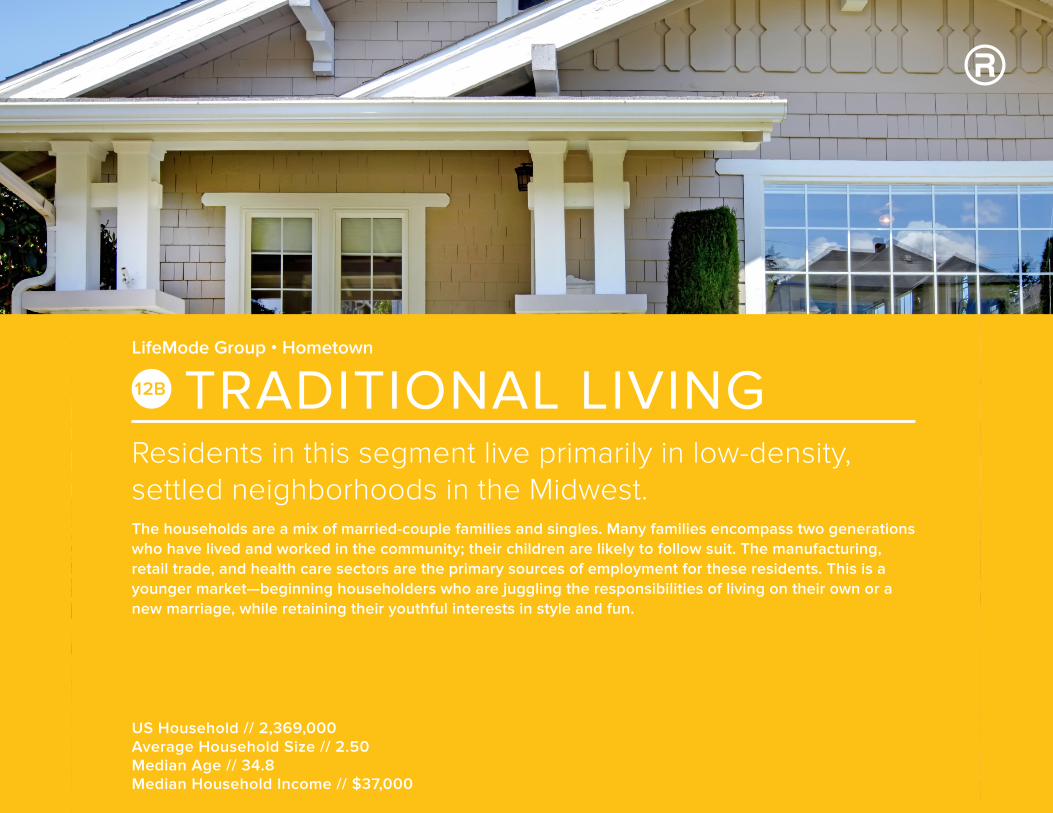
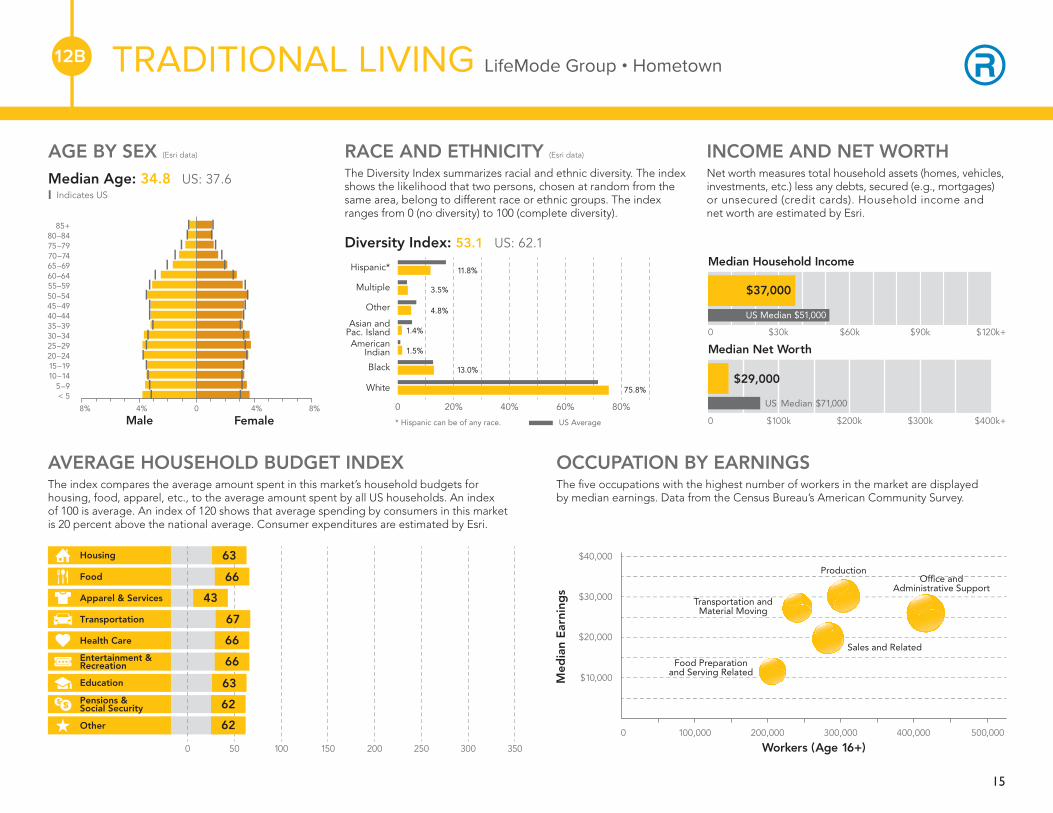
Residents in this segment live primarily in low-density,settled neighborhoods in the Midwest.The households are a mix of married-couple families and singles. Many families encompass two generations who have lived and worked in the community; their children are likely to follow suit. The manufacturing, retail trade, and health care sectors are the primary sources of employment for these residents. This is a younger market—beginning householders who are juggling the responsibilities of living on their own or a new marriage, while retaining their youthful interests in style and fun.
US Household // 2,369,000Average Household Size // 2.50Median Age // 34.8Median Household Income // $37,000
LifeMode Group • Hometown
TRADITIONAL LIVING12B
14
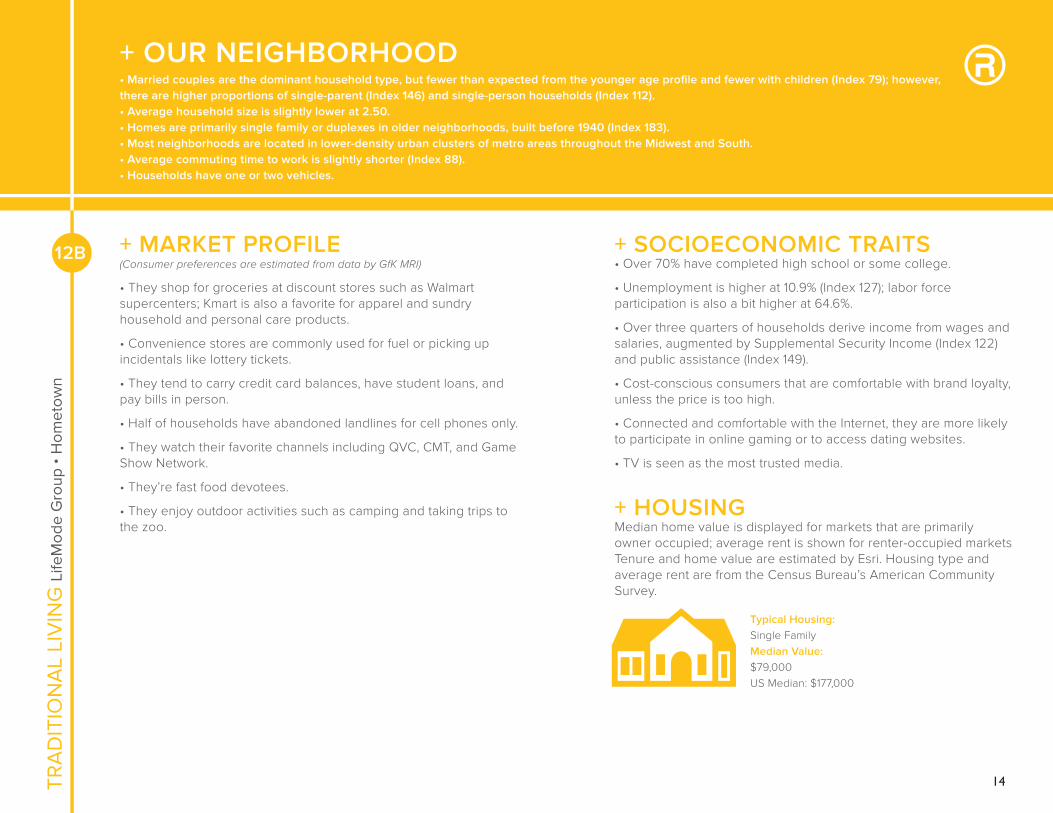
+ MARKET PROFILE(Consumer preferences are estimated from data by GfK MRI)
• They shop for groceries at discount stores such as Walmart supercenters; Kmart is also a favorite for apparel and sundry household and personal care products.
• Convenience stores are commonly used for fuel or picking up incidentals like lottery tickets.
• They tend to carry credit card balances, have student loans, and pay bills in person.
• Half of households have abandoned landlines for cell phones only.
• They watch their favorite channels including QVC, CMT, and Game Show Network.
• They’re fast food devotees.
• They enjoy outdoor activities such as camping and taking trips to the zoo.
+ SOCIOECONOMIC TRAITS• Over 70% have completed high school or some college.
• Unemployment is higher at 10.9% (Index 127); labor force participation is also a bit higher at 64.6%.
• Over three quarters of households derive income from wages and salaries, augmented by Supplemental Security Income (Index 122) and public assistance (Index 149).
• Cost-conscious consumers that are comfortable with brand loyalty, unless the price is too high.
• Connected and comfortable with the Internet, they are more likely to participate in online gaming or to access dating websites.
• TV is seen as the most trusted media.
+ HOUSINGMedian home value is displayed for markets that are primarilyowner occupied; average rent is shown for renter-occupied markets Tenure and home value are estimated by Esri. Housing type and average rent are from the Census Bureau’s American Community Survey.
Typical Housing:Single FamilyMedian Value:$79,000US Median: $177,000
12B
TRA
DIT
ION
AL
LIV
ING
Life
Mod
e G
roup
• H
omet
own
+ OUR NEIGHBORHOOD• Married couples are the dominant household type, but fewer than expected from the younger age profile and fewer with children (Index 79); however, there are higher proportions of single-parent (Index 146) and single-person households (Index 112).• Average household size is slightly lower at 2.50.• Homes are primarily single family or duplexes in older neighborhoods, built before 1940 (Index 183).• Most neighborhoods are located in lower-density urban clusters of metro areas throughout the Midwest and South.• Average commuting time to work is slightly shorter (Index 88).• Households have one or two vehicles.
15
TRADITIONAL LIVING LifeMode Group • Hometown12B
Male Female8% 4% 0 4% 8%
85+80–8475–7970–7465–6960–6455–5950–5445–4940–4435–3930–3425–2920–2415–1910–14
5–9< 5
* Hispanic can be of any race. US Average
75.8%
13.0%
4.8%
3.5%
11.8%
1.5%
1.4%
80%60%40%20%0
White
Black
AmericanIndian
Asian andPac. Island
Other
Multiple
Hispanic*
0
$60k $90k$30k $120k+
Median Household Income
$37,000
US Median $51,000
0
0
$300k$100k $200k $400k+
Median Net Worth
$29,000
US Median $71,000
$40,000
$30,000
$20,000
$10,000
0 500,000
Med
ian
Ear
ning
s
Workers (Age 16+)300,000200,000100,000 400,000
Sales and Related
Food Preparationand Serving Related
Office andAdministrative Support
Production
Transportation andMaterial Moving
3500 50 100 150 200 250 300
Housing
Food
Apparel & Services
Transportation
Health Care
Entertainment &Recreation
Education
Pensions &Social Security
Other
66
43
67
66
66
63
62
62
63
TAPESTRYSEGMENTATION
TM
esri.com/tapestry
LifeMode Group: Hometown
Traditional Living
INCOME AND NET WORTHNet worth measures total household assets (homes, vehicles, investments, etc.) less any debts, secured (e.g., mortgages)or unsecured (credit cards). Household income andnet worth are estimated by Esri.
AGE BY SEX (Esri data)
Median Age: 34.8 US: 37.6| Indicates US
RACE AND ETHNICITY (Esri data)
The Diversity Index summarizes racial and ethnic diversity. The index shows the likelihood that two persons, chosen at random from the same area, belong to different race or ethnic groups. The index ranges from 0 (no diversity) to 100 (complete diversity).
Diversity Index: 53.1 US: 62.1
12B
OCCUPATION BY EARNINGSThe fi ve occupations with the highest number of workers in the market are displayedby median earnings. Data from the Census Bureau’s American Community Survey.
AVERAGE HOUSEHOLD BUDGET INDEXThe index compares the average amount spent in this market’s household budgets for housing, food, apparel, etc., to the average amount spent by all US households. An indexof 100 is average. An index of 120 shows that average spending by consumers in this marketis 20 percent above the national average. Consumer expenditures are estimated by Esri.
16
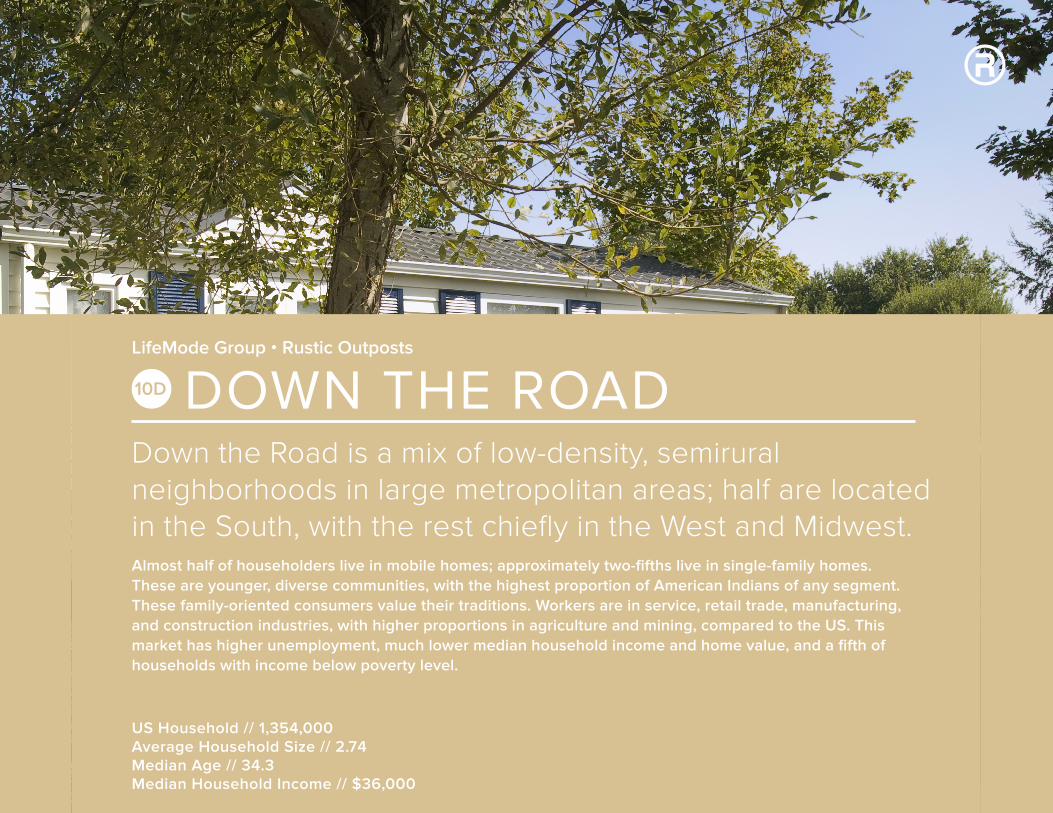
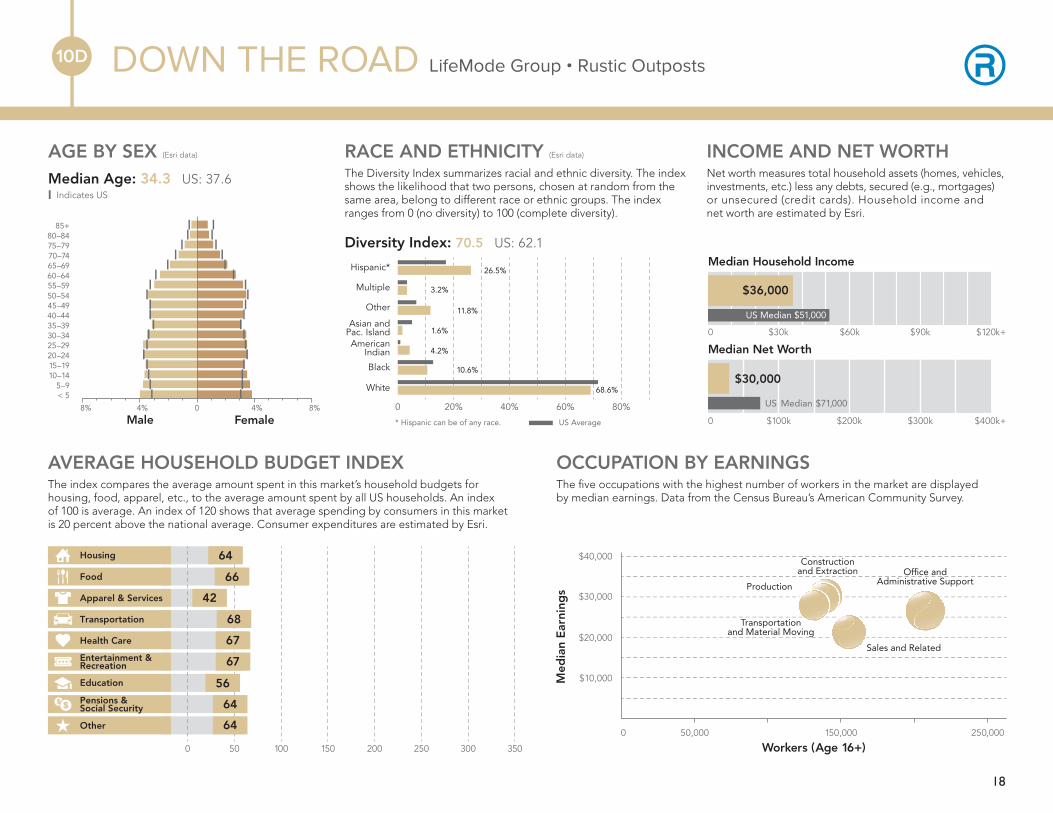
Down the Road is a mix of low-density, semiruralneighborhoods in large metropolitan areas; half are located in the South, with the rest chiefly in the West and Midwest.Almost half of householders live in mobile homes; approximately two-fifths live in single-family homes.These are younger, diverse communities, with the highest proportion of American Indians of any segment. These family-oriented consumers value their traditions. Workers are in service, retail trade, manufacturing,and construction industries, with higher proportions in agriculture and mining, compared to the US. This market has higher unemployment, much lower median household income and home value, and a fifth of households with income below poverty level.
US Household // 1,354,000Average Household Size // 2.74Median Age // 34.3Median Household Income // $36,000
LifeMode Group • Rustic Outposts
DOWN THE ROAD10D
17
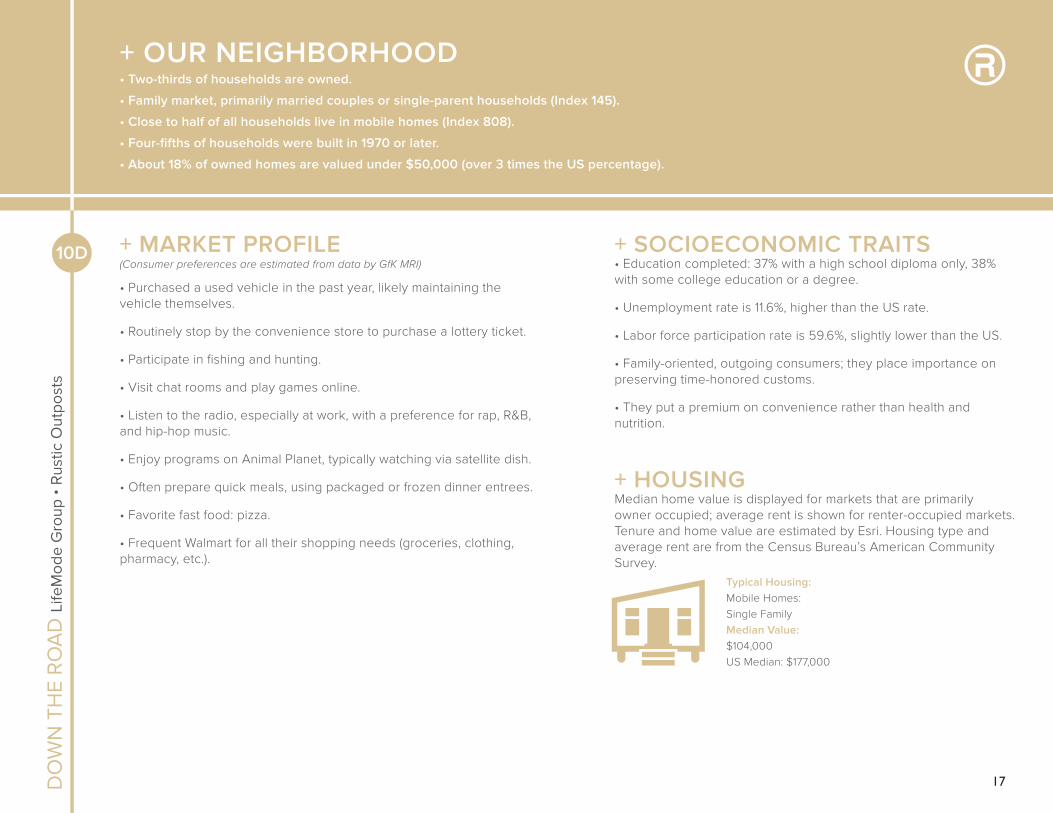
+ MARKET PROFILE(Consumer preferences are estimated from data by GfK MRI)
• Purchased a used vehicle in the past year, likely maintaining the vehicle themselves.
• Routinely stop by the convenience store to purchase a lottery ticket.
• Participate in fishing and hunting.
• Visit chat rooms and play games online.
• Listen to the radio, especially at work, with a preference for rap, R&B, and hip-hop music.
• Enjoy programs on Animal Planet, typically watching via satellite dish.
• Often prepare quick meals, using packaged or frozen dinner entrees.
• Favorite fast food: pizza.
• Frequent Walmart for all their shopping needs (groceries, clothing, pharmacy, etc.).
+ SOCIOECONOMIC TRAITS• Education completed: 37% with a high school diploma only, 38% with some college education or a degree.
• Unemployment rate is 11.6%, higher than the US rate.
• Labor force participation rate is 59.6%, slightly lower than the US.
• Family-oriented, outgoing consumers; they place importance on preserving time-honored customs.
• They put a premium on convenience rather than health and nutrition.
+ HOUSINGMedian home value is displayed for markets that are primarilyowner occupied; average rent is shown for renter-occupied markets.Tenure and home value are estimated by Esri. Housing type and average rent are from the Census Bureau’s American Community Survey.
Typical Housing:Mobile Homes:Single FamilyMedian Value:$104,000US Median: $177,000
10D
DO
WN
TH
E R
OA
D L
ifeM
ode
Gro
up •
Rus
tic O
utpo
sts
+ OUR NEIGHBORHOOD• Two-thirds of households are owned.
• Family market, primarily married couples or single-parent households (Index 145).
• Close to half of all households live in mobile homes (Index 808).
• Four-fifths of households were built in 1970 or later.
• About 18% of owned homes are valued under $50,000 (over 3 times the US percentage).
18
DOWN THE ROAD LifeMode Group • Rustic Outposts10D
85+80–8475–7970–7465–6960–6455–5950–5445–4940–4435–3930–3425–2920–2415–1910–14
Male Female
5–9< 5
8% 4% 0 4% 8%
* Hispanic can be of any race. US Average
68.6%
10.6%
11.8%
3.2%
26.5%
4.2%
1.6%
80%60%40%20%0
White
Black
AmericanIndian
Asian andPac. Island
Other
Multiple
Hispanic*
0
$60k $90k$30k $120k+
Median Household Income
$36,000
US Median $51,000
0
0
$300k$100k $200k $400k+
Median Net Worth
$30,000
US Median $71,000
$40,000
$30,000
$20,000
$10,000
0 250,000
Med
ian
Ear
ning
s
Workers (Age 16+)50,000 150,000
Sales and Related
Constructionand Extraction Office and
Administrative SupportProduction
Transportationand Material Moving
3500 50 100 150 200 250 300
Housing
Food
Apparel & Services
Transportation
Health Care
Entertainment &Recreation
Education
Pensions &Social Security
Other
66
42
68
67
67
56
64
64
64
TAPESTRYSEGMENTATION
TM
esri.com/tapestry
LifeMode Group: Rustic Outposts
Down the Road
INCOME AND NET WORTHNet worth measures total household assets (homes, vehicles, investments, etc.) less any debts, secured (e.g., mortgages)or unsecured (credit cards). Household income andnet worth are estimated by Esri.
AGE BY SEX (Esri data)
Median Age: 34.3 US: 37.6| Indicates US
RACE AND ETHNICITY (Esri data)
The Diversity Index summarizes racial and ethnic diversity. The index shows the likelihood that two persons, chosen at random from the same area, belong to different race or ethnic groups. The index ranges from 0 (no diversity) to 100 (complete diversity).
Diversity Index: 70.5 US: 62.1
10D
OCCUPATION BY EARNINGSThe fi ve occupations with the highest number of workers in the market are displayedby median earnings. Data from the Census Bureau’s American Community Survey.
AVERAGE HOUSEHOLD BUDGET INDEXThe index compares the average amount spent in this market’s household budgets for housing, food, apparel, etc., to the average amount spent by all US households. An indexof 100 is average. An index of 120 shows that average spending by consumers in this marketis 20 percent above the national average. Consumer expenditures are estimated by Esri.
19
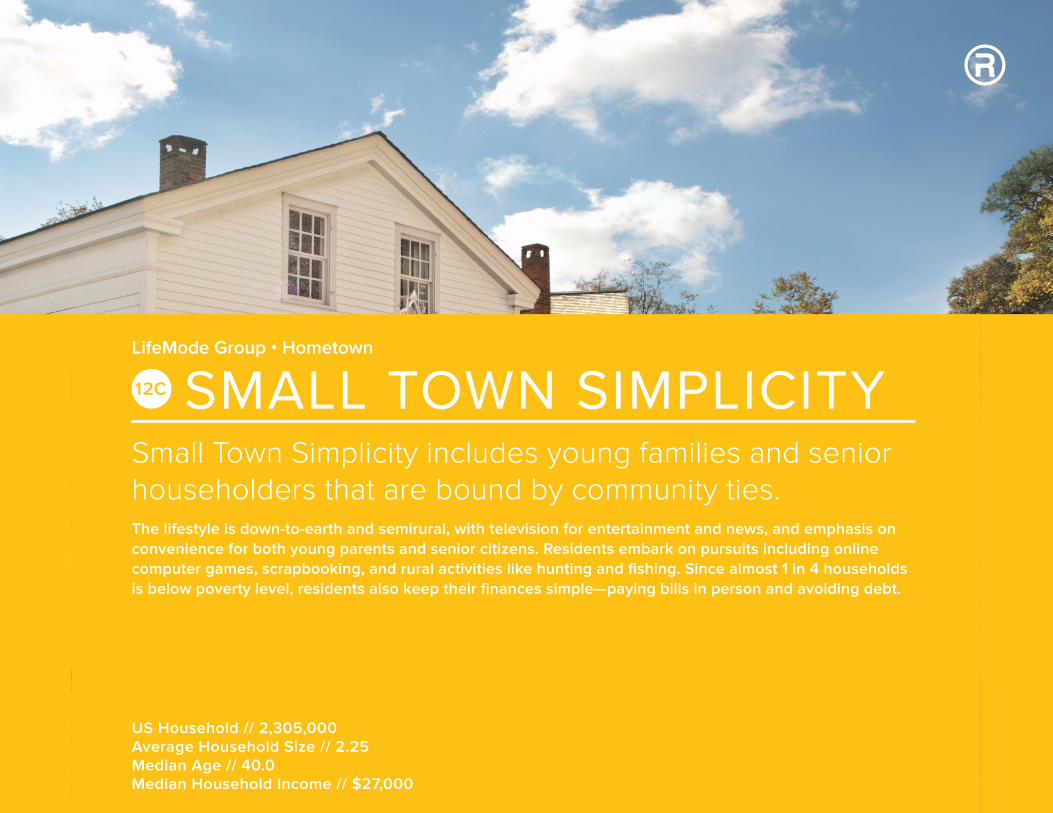
Small Town Simplicity includes young families and senior householders that are bound by community ties.The lifestyle is down-to-earth and semirural, with television for entertainment and news, and emphasis on convenience for both young parents and senior citizens. Residents embark on pursuits including online computer games, scrapbooking, and rural activities like hunting and fishing. Since almost 1 in 4 households is below poverty level, residents also keep their finances simple—paying bills in person and avoiding debt.
US Household // 2,305,000Average Household Size // 2.25Median Age // 40.0Median Household Income // $27,000
LifeMode Group • Hometown
SMALL TOWN SIMPLICITY12C
20
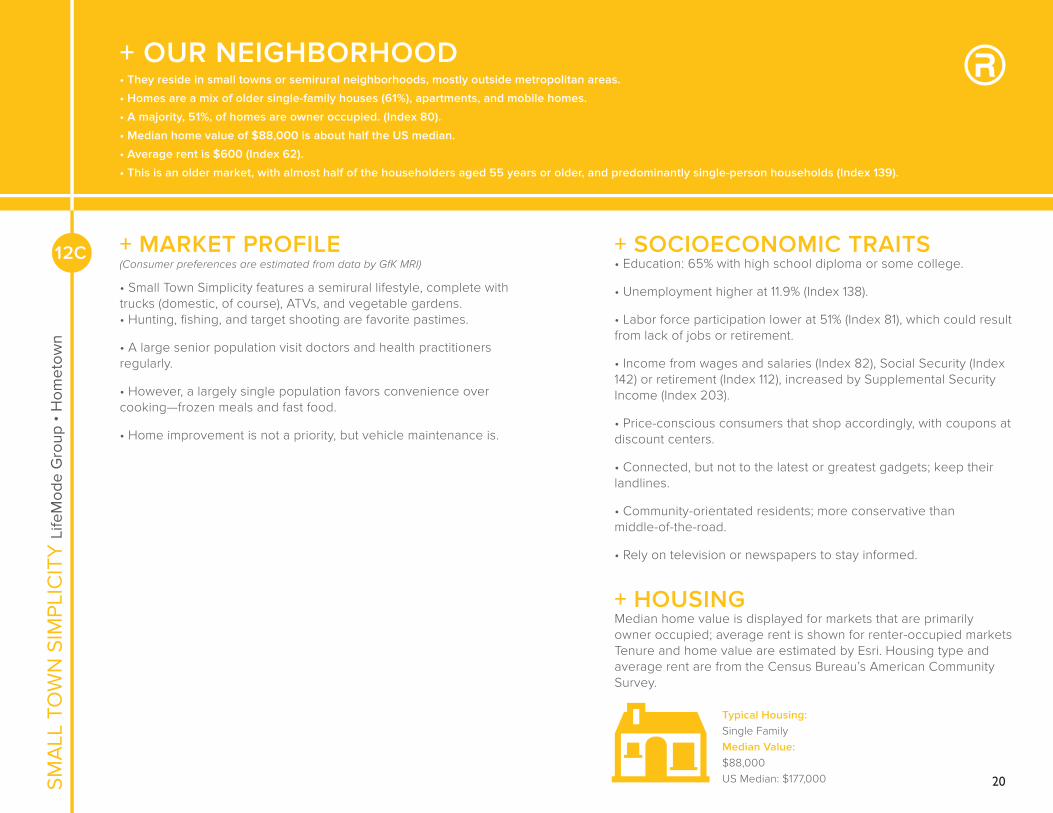
+ MARKET PROFILE(Consumer preferences are estimated from data by GfK MRI)
• Small Town Simplicity features a semirural lifestyle, complete with trucks (domestic, of course), ATVs, and vegetable gardens.• Hunting, fishing, and target shooting are favorite pastimes.
• A large senior population visit doctors and health practitioners regularly.
• However, a largely single population favors convenience over cooking—frozen meals and fast food.
• Home improvement is not a priority, but vehicle maintenance is.
+ SOCIOECONOMIC TRAITS• Education: 65% with high school diploma or some college.
• Unemployment higher at 11.9% (Index 138).
• Labor force participation lower at 51% (Index 81), which could result from lack of jobs or retirement.
• Income from wages and salaries (Index 82), Social Security (Index 142) or retirement (Index 112), increased by Supplemental Security Income (Index 203).
• Price-conscious consumers that shop accordingly, with coupons at discount centers.
• Connected, but not to the latest or greatest gadgets; keep their landlines.
• Community-orientated residents; more conservative thanmiddle-of-the-road.
• Rely on television or newspapers to stay informed.
+ HOUSINGMedian home value is displayed for markets that are primarilyowner occupied; average rent is shown for renter-occupied markets Tenure and home value are estimated by Esri. Housing type and average rent are from the Census Bureau’s American Community Survey.
Typical Housing:Single FamilyMedian Value:$88,000US Median: $177,000
12C
SMA
LL T
OW
N S
IMPL
ICIT
Y L
ifeM
ode
Gro
up •
Hom
etow
n+ OUR NEIGHBORHOOD• They reside in small towns or semirural neighborhoods, mostly outside metropolitan areas.
• Homes are a mix of older single-family houses (61%), apartments, and mobile homes.
• A majority, 51%, of homes are owner occupied. (Index 80).
• Median home value of $88,000 is about half the US median.
• Average rent is $600 (Index 62).
• This is an older market, with almost half of the householders aged 55 years or older, and predominantly single-person households (Index 139).
21
SMALL TOWN SIMPLICITY LifeMode Group • Hometown12C
Male Female8% 4% 0 4% 8%
85+80–8475–7970–7465–6960–6455–5950–5445–4940–4435–3930–3425–2920–2415–1910–14
5–9< 5
* Hispanic can be of any race. US Average
77.3%
13.1%
3.8%
2.9%
9.5%
1.6%
1.2%
80%60%40%20%0
White
Black
AmericanIndian
Asian andPac. Island
Other
Multiple
Hispanic*
0
$60k $90k$30k $120k+
Median Household Income
$27,000
US Median $51,000
0
0
$300k$100k $200k $400k+
Median Net Worth
$14,000
US Median $71,000
$35,000
$25,000
$15,000
$5,000
0 350,000
Med
ian
Ear
ning
s
Workers (Age 16+)150,00050,000 250,000
Sales and Related
Food Preparationand Serving Related
Office andAdministrative Support
Production
Transportation andMaterial Moving
3500 50 100 150 200 250 300
Housing
Food
Apparel & Services
Transportation
Health Care
Entertainment &Recreation
Education
Pensions &Social Security
Other
57
35
58
59
57
50
50
54
53
TAPESTRYSEGMENTATION
TM
esri.com/tapestry
LifeMode Group: Hometown
Small Town Simplicity
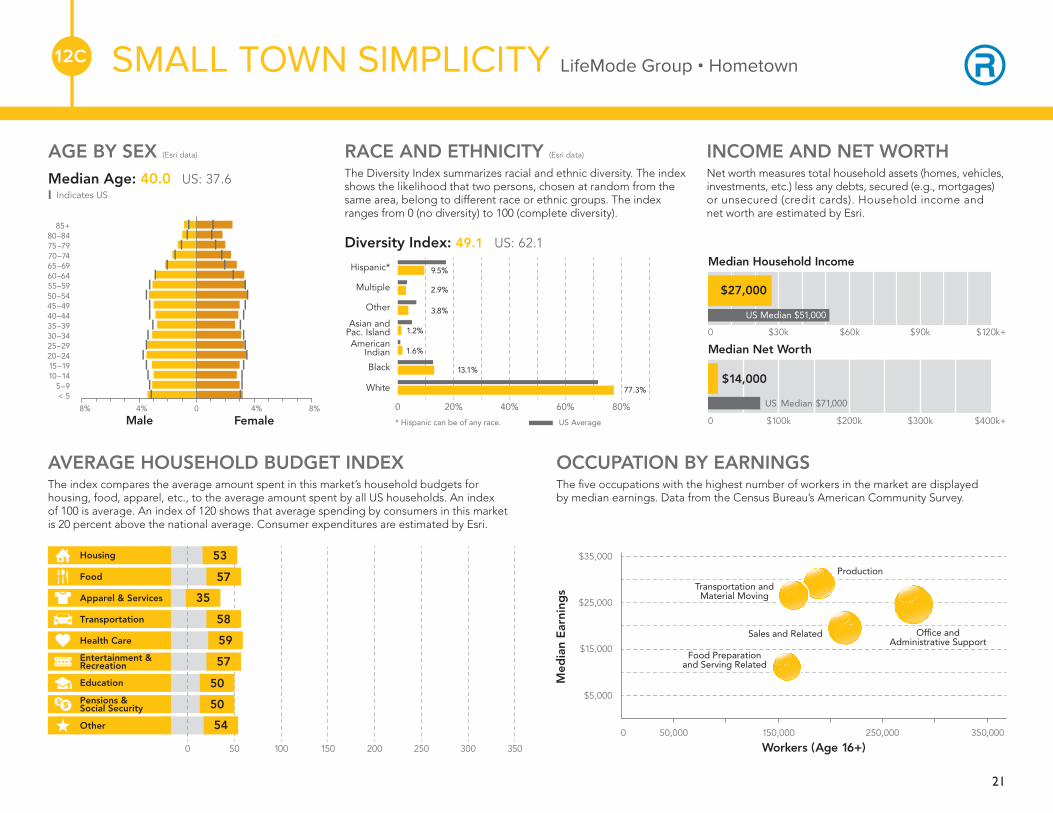
INCOME AND NET WORTHNet worth measures total household assets (homes, vehicles, investments, etc.) less any debts, secured (e.g., mortgages)or unsecured (credit cards). Household income andnet worth are estimated by Esri.
AGE BY SEX (Esri data)
Median Age: 40.0 US: 37.6| Indicates US
RACE AND ETHNICITY (Esri data)
The Diversity Index summarizes racial and ethnic diversity. The index shows the likelihood that two persons, chosen at random from the same area, belong to different race or ethnic groups. The index ranges from 0 (no diversity) to 100 (complete diversity).
Diversity Index: 49.1 US: 62.1
12C
OCCUPATION BY EARNINGSThe fi ve occupations with the highest number of workers in the market are displayedby median earnings. Data from the Census Bureau’s American Community Survey.
AVERAGE HOUSEHOLD BUDGET INDEXThe index compares the average amount spent in this market’s household budgets for housing, food, apparel, etc., to the average amount spent by all US households. An indexof 100 is average. An index of 120 shows that average spending by consumers in this marketis 20 percent above the national average. Consumer expenditures are estimated by Esri.

22
About The Retail Coach
The Retail Coach, LLC, is a national retail analytics and locational intelligence firm that specializes in all aspects of retail market analyses and recruitment, from “macro to micro” trade area assessment to actively recruiting retailers on behalf of our clients.
Through its unique Retail:360 process, The Retail Coach offers a dynamic system of products and services that better enable communities to maximize their retail development potential.
Retail:360 Process
Providing more than simple data reports of psychographic and demographic trends, The Retail Coach goes well beyond other retail consulting and market research firms’ offerings by combining current national and statewide demographics and trend data with real-world, “on-the-ground” data gathered through extensive visits within our clients’ communities.
Every community is different, and there is no “one size fits all” retail recruitment solution. Compiling the gathered data into client-tailored information packets that are uniquely designed for, and targeted to, specific retailers and restaurants who meet the community’s needs helps assure our clients that they are receiving the latest and best information for their retail recruitment efforts — all with personal service and coaching guidance that continues beyond the initial project scope and timeline.
Our Retail:360 process assures that communities get timely, accurate and relevant information. Translating that data into the information that retailers need and seek assures our clients even better possibilities for tremendous retail growth and success.
The Retail Coach -It’s not about data. It’s about your success.
The Retail Coach, LLC | P. O. Box 7272 | Tupelo, Mississippi 38802tel 800.851.0962 | fax 662.844.2738 | e-mail [email protected] | web www.theretailcoach.net
C. Kelly Cofer President & CEO
The Retail Coach, LLC
23
Acknowledgements
The observations, conclusions and recommendations contained in this study are solely those of The Retail Coach, LLC and should not be construed to represent the opinions of others, including its clients, or any other entity prior to such entity’s express approval of this study.
Sources used in completing this study include: infoUSA™, Applied Geographic Solutions, Nielsen 2014/2015, ESRI 2014, U.S. Census Bureau, Economy.com, Spatial Insights Inc., Urban Land Institute, CensusViewer.com, International Council of Shopping Centers, and/or U.S. Bureau of Labor and Statistics.
To better represent current data, where applicable, portions of estimated actual sales may be calculated using an average sales per square foot model.
Mapping data is provided by MapInfo, Nielsen, ESRI and/or Microsoft Corporation.
All information furnished is from sources deemed reliable and is submitted subject to errors, omissions, change of terms and/or conditions.