Embed Size (px)
Citation preview
Revenue Cycle Benchmarking
Going Beyond…
To Improve Revenue Cycle Outcomes
Presented by:Frank GiannantonioPresident
Objective
• Understanding of some Standard Revenue Cycle Management Key Results Indicators (KRI).
• Difference between internal reporting of these figures versus externally measuring against others.
• How to utilize the results of benchmarking to improve Revenue Cycle Outcomes.
Going Beyond…To Improve Revenue Cycle Outcomes
• Pressure for Metrics to Measure Performance.
• Relevant Performance Measures are Dependent on a Clear Definition of Your Goals.
Going Beyond…To Improve Revenue Cycle Outcomes
What is the Goal of Going Beyond To Improving Revenue Cycle Outcomes?
• Reduce Outstanding and Unpaid claims!
• Increase Cash Flow!
Metrics = Key Result Indicators (KRI)
Indicators are Measures That Certain Outcomes Have Been Achieved.
They Tell You How Much Progress You Have Made Toward a Particular Goal (Outcome).
Going Beyond…To Improve Revenue Cycle Outcomes
Patient Accounts Staff
• Focused on Getting Bills Out the Door
• Posting Cash Timely and Accurately
• Minor Follow-up
• Do it all over again!!!
Going Beyond…To Improve Revenue Cycle Outcomes
Not Going to Discuss:
• Maximizing HHRG Scores
• Episode Profitability
• Improving Case Mix Weights
• Retrospective Claim/Chart Audits
Metrics = Key Result Indicators (KRI)
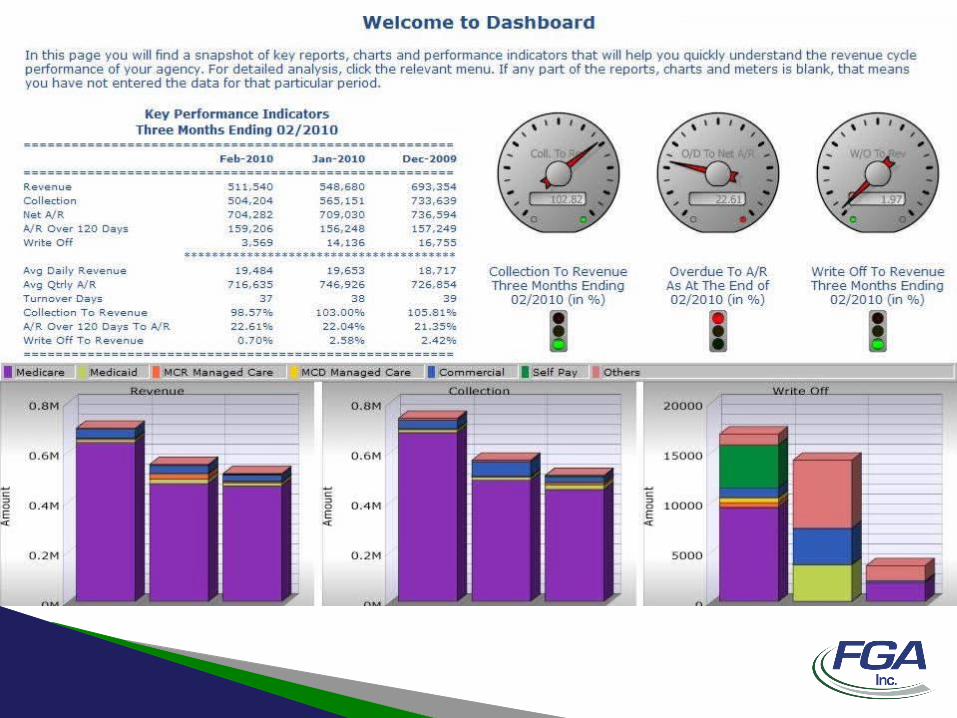
• A/R Turnover Days = Days Sales Outstanding (DSO)
• A/R >120 days by Major Payer
• Collection as Percentage of Revenue
• Write-offs as Percentage of Revenue
• Days from Beginning of Episode to RAP
• Days from End of Episode to Final Claim
This List Can be as Expansiveas You Like
• Late Billing to Current Billing as a ratio
• Medicare RAP Take Backs
• Medicare Episodes on Hold
• Denials by Reason
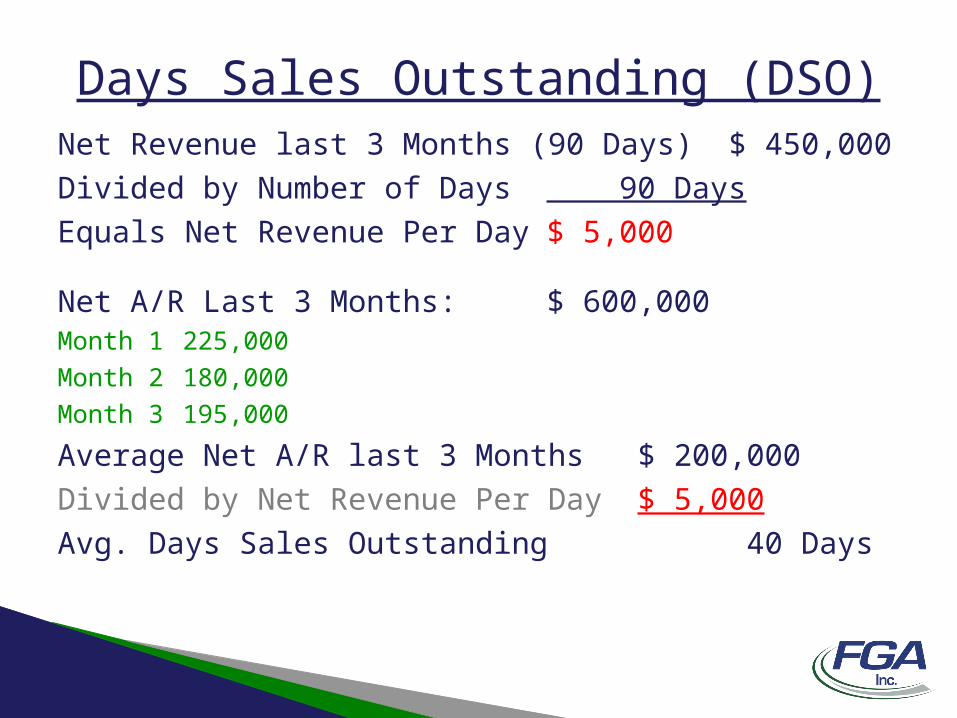
Days Sales Outstanding (DSO)Net Revenue last 3 Months (90 Days) $ 450,000
Divided by Number of Days 90 Days
Equals Net Revenue Per Day $ 5,000
Net A/R Last 3 Months: $ 600,000Month 1 225,000
Month 2 180,000
Month 3 195,000
Average Net A/R last 3 Months $ 200,000
Divided by Net Revenue Per Day $ 5,000
Avg. Days Sales Outstanding 40 Days
Others
• A/R >120 days by major payer– Measures the % of total A/R >120 days
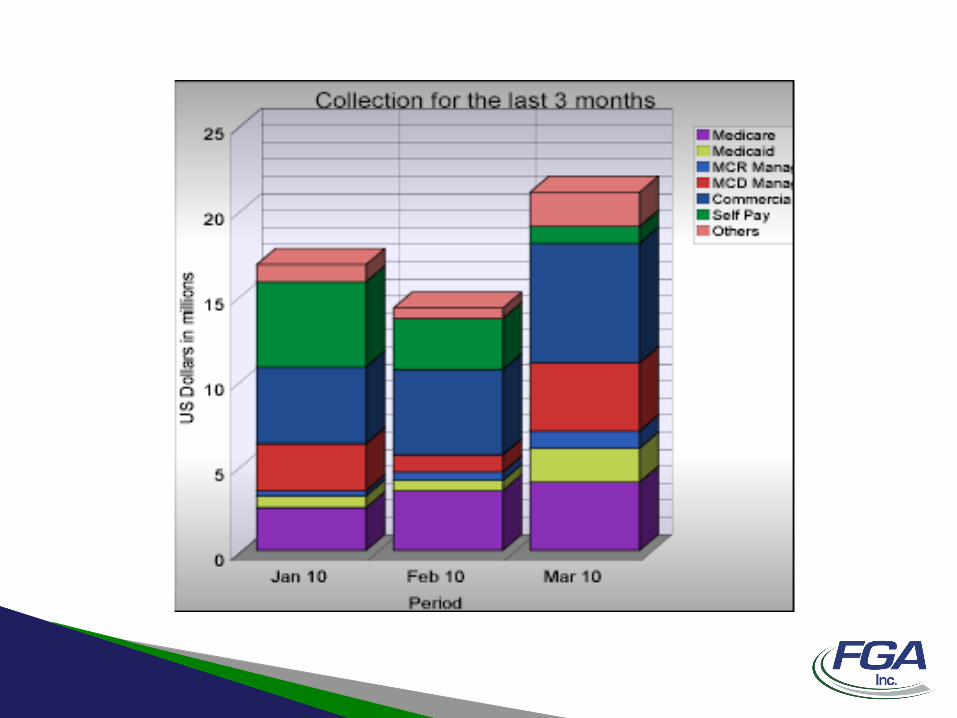
• Collection as percentage of Revenue– Measures the % of cash received to Revenue billed
• Write-offs as percentage of Revenue– Measures the % of Write offs to Revenue billed
• Days from Beginning of Episode to RAP
• Days from End of Episode to Final Claim

Going Beyond…To Improve Revenue Cycle Outcomes
Frankie Fact
If You Can Measure the Results of an Activity…..
You Can Improve its Outcome!
Going Beyond…To Improve Revenue Cycle Outcomes
• At best, agencies have created their own core of acceptable norms for internal reporting of some of these KRIs.
• Baseline – “A specific value that can serve as a comparison or control”
Going Beyond…To Improve Revenue Cycle Outcomes
We may meet our baseline, but how do we know if our numbers are acceptable?
How can we improve if we don’t know what is good?
Until recently there were no industry standards to compare to!
How can we improve if we don’t know what is good?
Benchmarking
Benchmark – Any standard or reference which others can be measured or judged.
Benchmarking provides context to the measure by allowing us to measure ourselves against others.

How can we improve if we don’t know what is good?
Benchmarking is the process of determining who is the very best, who sets the standard and what that standard is!
How is a Benchmark Determined?
How is a Benchmark Determined
Usually for Revenue Cycle Purposes it is determined with the help of a mathematical concept called the Median.
Median: is the middle number in an ordered set of data that marks the center, above which 50% of the data falls and below 50% of the data resides.
How is a Benchmark Determined
Quartiles: For a more detailed analysis in Benchmarking you may also use this concept.
How is a Benchmark Determined
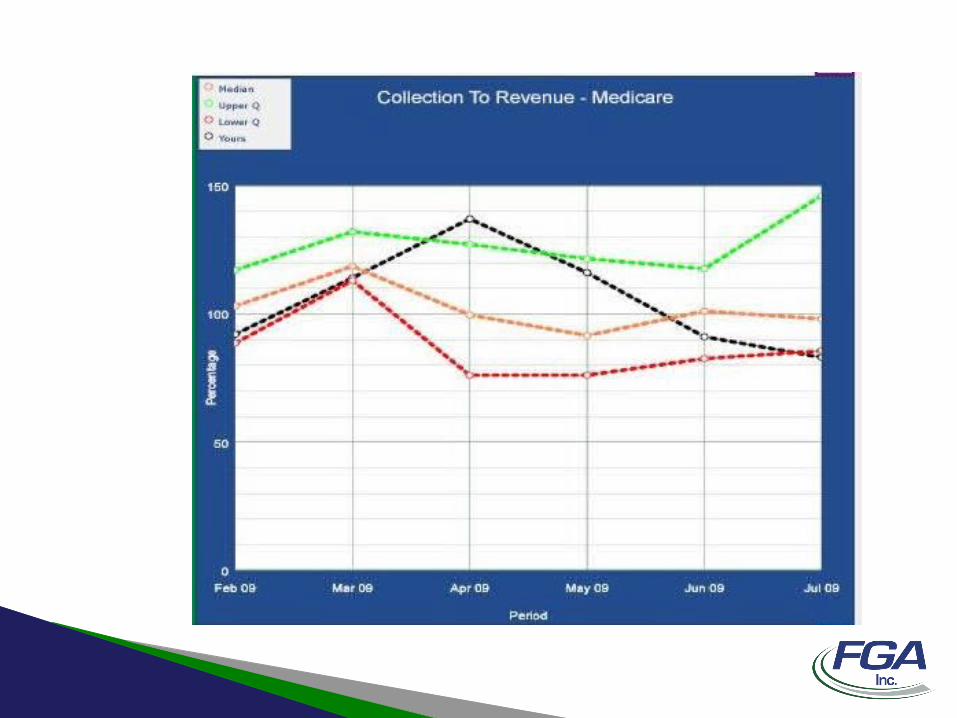
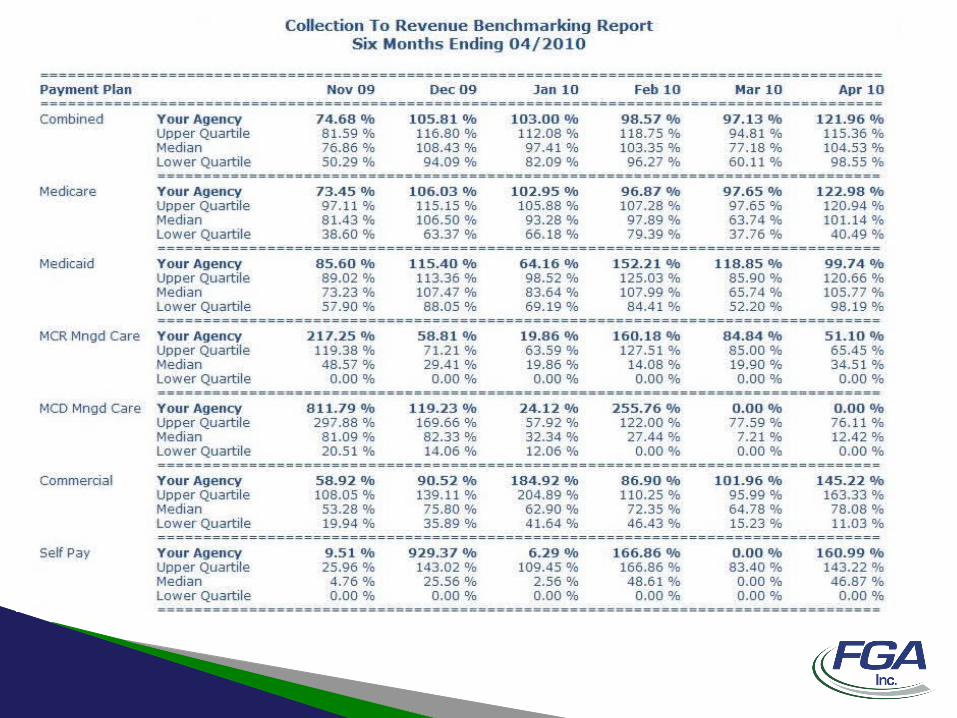
Once you apply these concepts to the reported KRI’s of the participating agencies in a Benchmarking database you can begin to provide the upper quartile, lower quartile and median and compare a single agency’s performance to these figures to identify their performance.
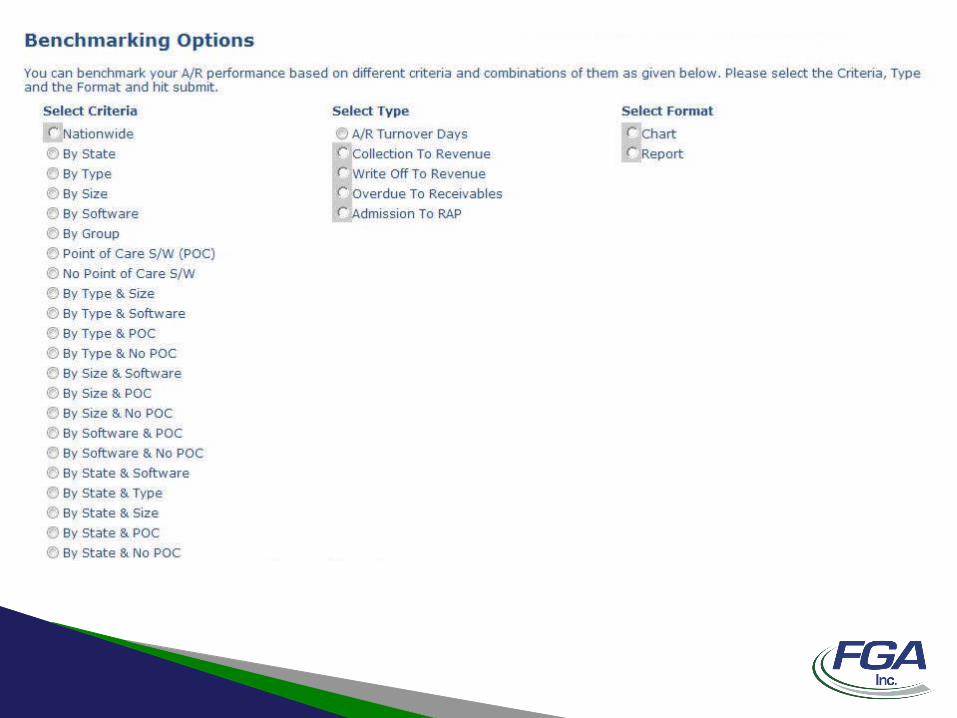
How Are Benchmarks Presented?
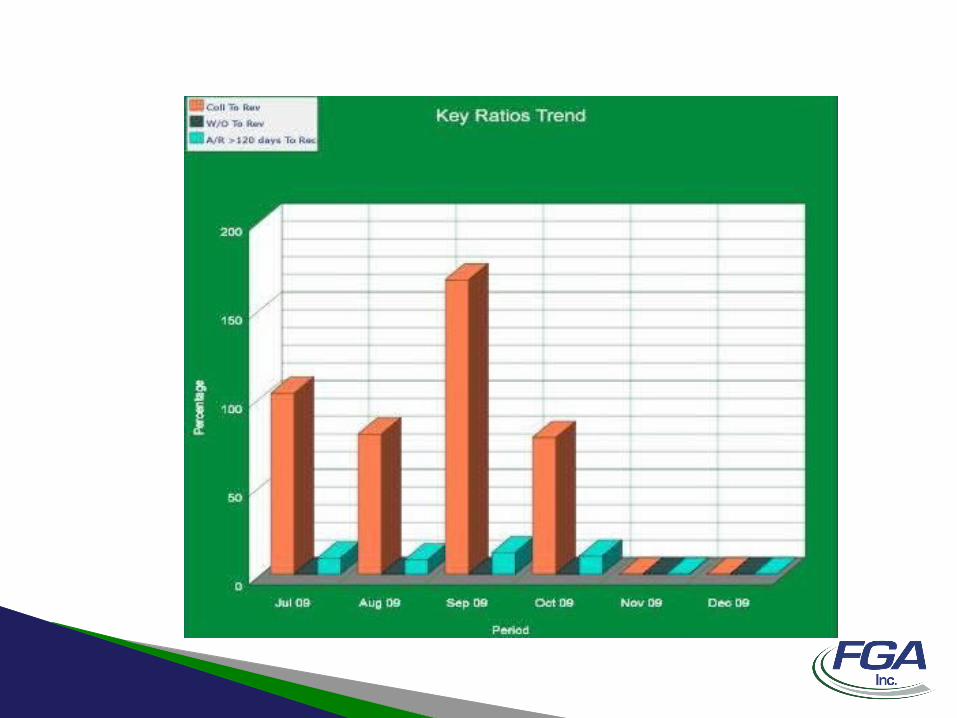
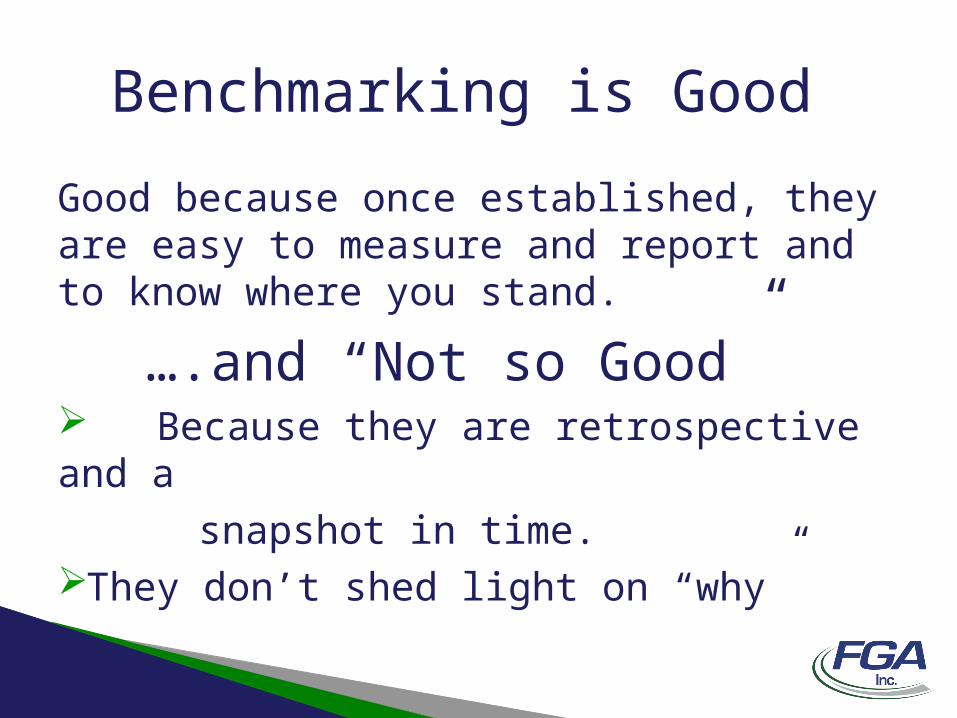
Benchmarking is Good
Good because once established, they are easy to measure and report and to know where you stand.
….and “Not so Good” Because they are retrospective and a
snapshot in time.They don’t shed light on “why”
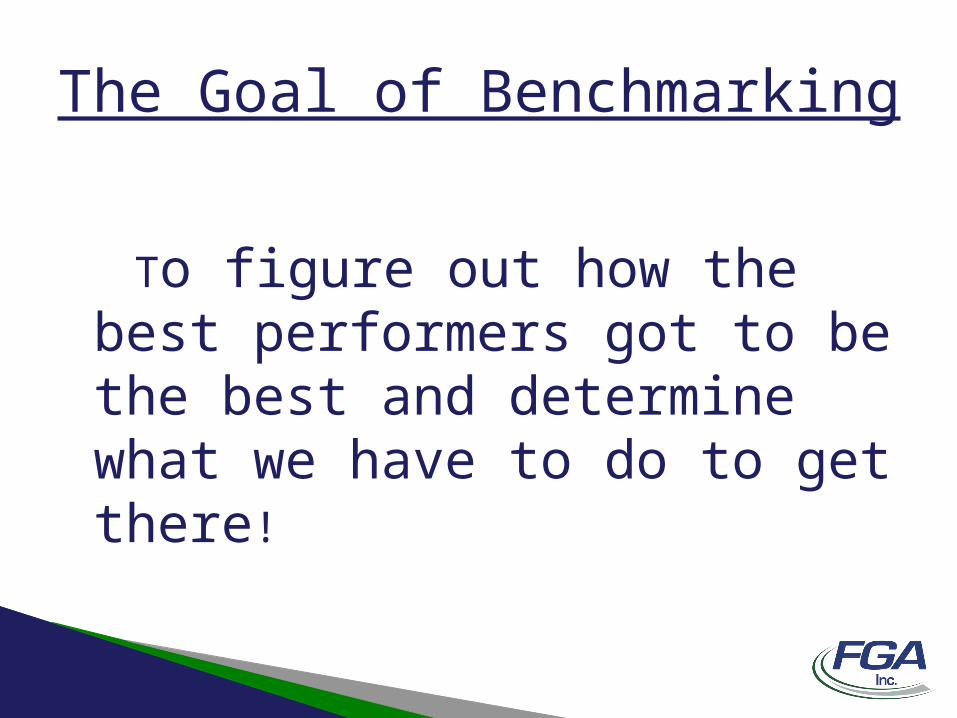
The Goal of Benchmarking
To figure out how the best performers got to be the best and determine what we have to do to get there!
The Goal of Benchmarking
If an organization is serious about Benchmarking it will usually be utilized as part of a larger effort of a Process Improvement Initiative.
“If you can’t recognize failure, you can’t correct it”

Going Beyond…To Improve Revenue Cycle Outcomes
Patient Accounts Staff
• Focused on Getting Bills Out the Door
• Posting Cash Timely and Accurately
• Minor Follow-up
• Do it all over again!!!
Going Beyond…To Improve Revenue Cycle Outcomes
• Focused on getting bills out the door
- Claims/Episode “On Hold” Analysis
- Unsigned or No Interim Order
- Authorization Issues
- Other Clinical Documentation Issues
- Claim/Chart Inconsistencies
Going Beyond…To Improve Revenue Cycle Outcomes
• Posting Cash Timely and Accurately
- Blindly Posting Cash Electronically
- Misapplied Payments within Health System
- Not Reconciling Cash Posted to Cash Receipts (Deposits)
- Not Able To or Don’t Post Denials
Going Beyond…To Improve Revenue Cycle Outcomes
• Minor Follow-up– Must be re-conditioned to On-Going
Comprehensive Follow-up
– Develop a Payment/Denial Analysis Methodology
Going Beyond…To Improve Revenue Cycle Outcomes
Frankie Fact
If You Can Measure the Results of an Activity…..
You Can Improve its Outcome!
Going Beyond…To Improve Revenue Cycle Outcomes
Payment/Denial Analysis Methodology
• Eligibility Issues• Incorrect Payer Source (Initial Submission)
• Authorization Issues
• Incorrect Payments for Services
• Additional Documentation Requests
• Clinical Appeals
In Summary Key Result Indicators (KRI)
• Provide a way to see if our strategy is working.• Focus attention on what matters most to
success.• Provide a common language for communication.• Are Valid, to ensure measurement of the right
things.
So To Go Beyond…To Improve Revenue Cycle Outcomes.
• Implement Benchmarking
• It Provides Context to Your Performance Measures by Allowing you to Compare Yourselves Against Others.

Objective
• Understanding of some Standard Revenue Cycle Management Key Results Indicators (KRI).
• Difference between internal reporting of these figures versus externally measuring against others.
• How to utilize the results of benchmarking to improve Revenue Cycle Outcomes.

Thank You For Your Time!
Questions?