Embed Size (px)
Citation preview
Revenue Diversification in Nonprofit Organizations: A Quantitative Study of the Change
to American Nonprofit Revenue Streams after the Great Recession of 2008
Eric Bronson James
Trinity Washington University
Submitted to Dr. Kelley Wood on behalf of the faculty of the School of Business and
Graduate Studies in partial fulfillment of the degree requirements for the Master of Science
Administration in Nonprofit Management
Spring 2016
REVENUE DIVERSIFICATION IN NONPROFIT ORGANIZATIONS 2
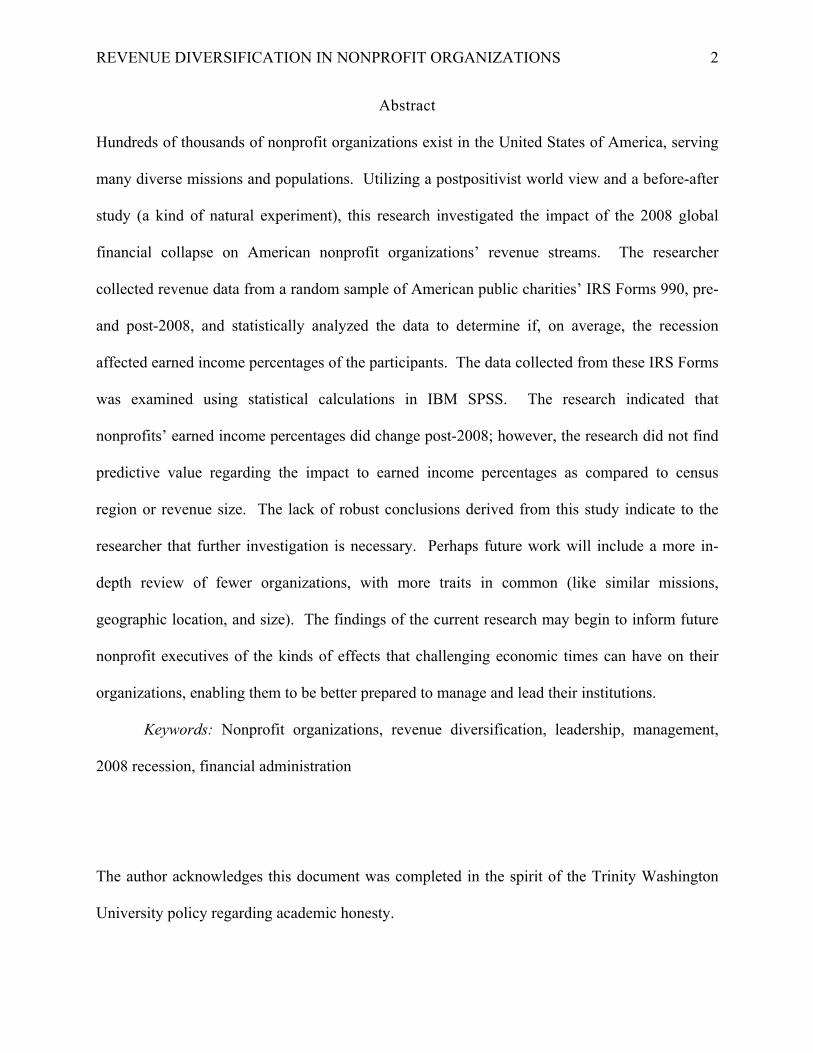
Abstract
Hundreds of thousands of nonprofit organizations exist in the United States of America, serving
many diverse missions and populations. Utilizing a postpositivist world view and a before-after
study (a kind of natural experiment), this research investigated the impact of the 2008 global
financial collapse on American nonprofit organizations’ revenue streams. The researcher
collected revenue data from a random sample of American public charities’ IRS Forms 990, pre-
and post-2008, and statistically analyzed the data to determine if, on average, the recession
affected earned income percentages of the participants. The data collected from these IRS Forms
was examined using statistical calculations in IBM SPSS. The research indicated that
nonprofits’ earned income percentages did change post-2008; however, the research did not find
predictive value regarding the impact to earned income percentages as compared to census
region or revenue size. The lack of robust conclusions derived from this study indicate to the
researcher that further investigation is necessary. Perhaps future work will include a more in-
depth review of fewer organizations, with more traits in common (like similar missions,
geographic location, and size). The findings of the current research may begin to inform future
nonprofit executives of the kinds of effects that challenging economic times can have on their
organizations, enabling them to be better prepared to manage and lead their institutions.
Keywords: Nonprofit organizations, revenue diversification, leadership, management,
2008 recession, financial administration
The author acknowledges this document was completed in the spirit of the Trinity Washington
University policy regarding academic honesty.
REVENUE DIVERSIFICATION IN NONPROFIT ORGANIZATIONS 3
Table of Contents
Page
Introduction ................................................................................................................................... 5
Statement of the Problem ......................................................................................................... 5
Objective .................................................................................................................................. 6
Definition of Key Terms .......................................................................................................... 6
Research Questions .................................................................................................................. 7
Design ....................................................................................................................................... 7
Participants ............................................................................................................................. 10
Assumptions and Limitations ................................................................................................. 11
Summary ................................................................................................................................ 11
Theory ........................................................................................................................................... 12
Theoretical Perspective .......................................................................................................... 12
Theoretical Framework .......................................................................................................... 15
Dependent variable ........................................................................................................... 16
Independent variable one .................................................................................................. 16
Control variable one .......................................................................................................... 16
Control variable two .......................................................................................................... 16
Control variable three ....................................................................................................... 16
Summary ................................................................................................................................ 17
Analysis ......................................................................................................................................... 19
Data Analysis and Strategy .................................................................................................... 19
Sample .................................................................................................................................... 21
Data Analysis ......................................................................................................................... 22
Frequency. ......................................................................................................................... 22
Two-Way ANOVA. ............................................................................................................. 22
Summary ................................................................................................................................ 25
Discussion ..................................................................................................................................... 27
Conclusions ............................................................................................................................ 28
Recommendations .................................................................................................................. 30
Summary ................................................................................................................................ 31
REVENUE DIVERSIFICATION IN NONPROFIT ORGANIZATIONS 4
References .................................................................................................................................... 33
List of Tables
Page
Table 1. Frequency: Census Region. ............................................................................................. 21
Table 2. Frequency: Revenue Class. ............................................................................................. 21
Table 3. Frequency: Change in earned income percentage. .......................................................... 22
Table 4. Two-Way ANOVA. ........................................................................................................ 23
Table 5. Descriptive Statistics: Comparing change in earned revenue to revenue class and census
region. ............................................................................................................................................ 24
List of Figures
Page
Figure 1. U.S. Census bureau regions map. .................................................................................... 9
Figure 2. Model of theoretical framework: Nonprofit revenue diversification. ........................... 17
Figure 3. Change in earned income percentage compared to revenue class and census region. .. 25
REVENUE DIVERSIFICATION IN NONPROFIT ORGANIZATIONS 5
Introduction
While mission-driven organizations date back centuries, modern nonprofits in the United
States of America have been providing for the public good for decades. Others emerge every
year to innovatively address the needs of the nation. When these organizations fail, no matter the
cause, many Americans must look elsewhere for education, cultural experiences, health and
human services, as well as for life’s most basic of needs: food, water, and shelter. Hall (2004)
wrote,
It is difficult to generalize about what nonprofit organizations are, what they do,
and how they do it. They vary enormously in scope and scale….their impact is so
far-reaching—touching on every aspect of our lives and every level of institutions
(p. 4).
With this in mind, understanding the impact of tough economic times and how nonprofit
organizations and their executives navigate them has become ever more important.
Statement of the Problem
In 2008, the global economy slid into recession, the impact of which is still being felt by
businesses and individuals worldwide. Nonprofit organizations were not immune to this
financial crisis. Some were able to weather the economic storm, while others were forced to
make drastic changes to their business models. Still others closed down all together. When
nonprofit organizations cease to exist, all people suffer because there are fewer schools,
museums, health clinics, homeless shelters, and food pantries to serve constituents who have
nowhere else to turn.
While there are likely many reasons why nonprofits failed as a result of the 2008 global
financial collapse, one possibility is nonprofits’ overreliance on contributed income (donations).
As Carroll and Stater (2008) suggested in their research, nonprofits with balanced revenue
REVENUE DIVERSIFICATION IN NONPROFIT ORGANIZATIONS 6
streams that include contributed and earned income, are less volatile and therefore less
susceptible to changing environmental forces. This study aims to investigate the hypothesis that
recessionary forces caused nonprofits that survived the global financial collapse of 2008 to
diversify their revenue streams. Understanding the existence (or lack thereof) of this
phenomenon may provide information to nonprofit executives regarding how they can best
prepare their organizations for future economic downturns.
Objective
The researcher’s objective in this quantitative study was to investigate whether the
revenue streams of nonprofit organizations, on average, experienced change as a result of the
2008 global recession. This study will help inform future nonprofit executives about the
potential effects of changing economic forces on their organizations. This information may aid
nonprofit executives in navigating through or preparing for future economic recessions when
they inevitably occur.
Definition of Key Terms
Revenue diversification: Froelich (1999) defined revenue diversification for nonprofits
by stating, “Nonprofit organizations must rely on a variety of activities and resource providers to
support their mission-related work” (p. 247). For the purposes of this study, “variety of
activities” will mean contributed, earned, and investment revenue streams.
Earned revenue: For the purposes of this research, earned income referred to all income
of a nonprofit organization (including income derived from investing activities) other than that
which is donated (restricted or unrestricted) to the organization. Earned income can include
income derived from program fees, publications sales, advertising, and membership fees, and
investments just to name a few (Carroll, D. A. & Stater, K. J., 2008).
REVENUE DIVERSIFICATION IN NONPROFIT ORGANIZATIONS 7
Contributed revenue: For the purposes of this research, contributed revenue is defined
as any income that is the result of a donation, whether it be restricted or unrestricted, to the
nonprofit organization (Carroll, D. A. & Stater, K. J., 2008).
Research Question
The purpose of the following research question was to understand the impact of the 2008
global financial collapse on American nonprofit organizations, as it pertains to revenue
diversification. This quantitative research study investigated the following question:
Research question one (RQ1)
Did the global financial collapse of 2008, on average, change American nonprofit
organizations revenue streams?
Null hypothesis one (Hₒ1):
The global financial collapse had no effect on the proportions of earned and contributed
revenue, as compared to total revenue, of American nonprofit organizations.
Alternate hypothesis one (Hₐ1ₐ):
The global financial collapse of 2008 on average changed American nonprofit
organizations’ proportions of earned and contributed revenue, as compared to total revenue.
Design
This quantitative before-after study took the form of a natural experiment, which is a
hybrid between an observational and experimental strategy. According to Remler and Van
Ryzin (2015), “In a natural experiment, a researcher looks for and finds a naturally occurring
situation in which the independent variable of interest just happens to be exogenous to the
outcome (the dependent variable)” (p. 468). The researcher conducted this natural experiment
REVENUE DIVERSIFICATION IN NONPROFIT ORGANIZATIONS 8
by using a before-after study approach, whereby nonprofit organizations’ revenue data was
examined before and after the global financial collapse of 2008.
For the purposes of this study, the independent variable was the global financial collapse
of 2008. The nominal definition of the independent variable is profound global economic stress
in 2008 indicated by increased levels of unemployment, devaluing of investment values, and
reductions in spending by corporations and individuals. Operationally, this variable was
measured by collecting and using participant organizations’ data, before and after 2008,
specifically from the years 2006, 2007, 2009, and 2010. The years 2006 and 2007 were selected
to provide a baseline prior to the events of 2008. The years 2009 and 2010 were selected to
isolate the nonprofits’ true circumstances immediately following the events of 2008, thereby
minimizing the effects of environmental forces and factors arising thereafter. By doing so, the
researcher attempted to measure, as closely as possible, the impact of the 2008 events on the
data.
The dependent variable is revenue diversification in American nonprofit organizations.
For the purposes of this study, the researcher operationally defined revenue diversification as the
mean earned income percentages, as compared to total revenue, of nonprofit organizations pre-
and post-2008. The process to measure this is as follows: divide earned income by total income
(for each year), sum the 2006 and 2007 quotients and sum the 2009 and 2010 quotients, then
divide each by two; the results are the mean earned income percentages for pre-2008 and post-
2008.
The control variables identified in this study included organizational location,
competition, and organizational size within the nonprofit organizations included in the sample.
Organizational locations were measured by assigning each organization to a census region, based
REVENUE DIVERSIFICATION IN NONPROFIT ORGANIZATIONS 9
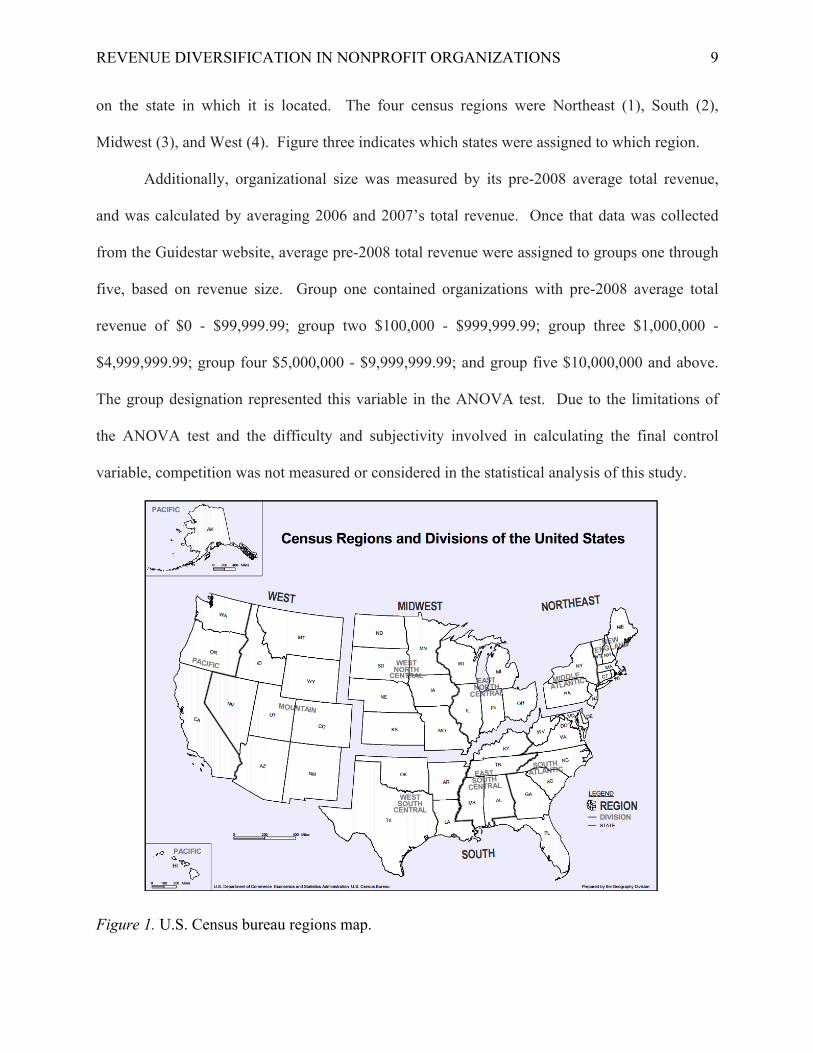
on the state in which it is located. The four census regions were Northeast (1), South (2),
Midwest (3), and West (4). Figure three indicates which states were assigned to which region.
Additionally, organizational size was measured by its pre-2008 average total revenue,
and was calculated by averaging 2006 and 2007’s total revenue. Once that data was collected
from the Guidestar website, average pre-2008 total revenue were assigned to groups one through
five, based on revenue size. Group one contained organizations with pre-2008 average total
revenue of $0 - $99,999.99; group two $100,000 - $999,999.99; group three $1,000,000 -
$4,999,999.99; group four $5,000,000 - $9,999,999.99; and group five $10,000,000 and above.
The group designation represented this variable in the ANOVA test. Due to the limitations of
the ANOVA test and the difficulty and subjectivity involved in calculating the final control
variable, competition was not measured or considered in the statistical analysis of this study.
Figure 1. U.S. Census bureau regions map.
REVENUE DIVERSIFICATION IN NONPROFIT ORGANIZATIONS 10
Participants
The setting for this study was the United States, which was appropriate as the researcher
sought to understand how American nonprofits were affected by the global financial collapse of
2008. The population of this study was all American nonprofit organizations listed on the
IRS.gov website and categorized as a Public Charity, as of November 18, 2015. All other IRS
classifications were excluded from the population, as they may not be able to collect tax-exempt
contributions from American donors. Using this population will ensure access to nonprofit
organizations of all sizes and geographical locations, as well as organizations subject to variant
levels of donor sophistication, competition, and financial volatility.
From this population of over 800,000 nonprofit organizations, the researcher utilized
spreadsheet software to select a simple random sample defined by Remler and Van Ryzin (2015)
as
Selecting people (or elements) from a population in such a way that each
individual has an equal chance, or probability, of selection…simple random
sampling involves assigning random numbers to people or units on a list and then
sorting the list by the random number (p. 160).
In order to maintain a confidence level of 95% and a confidence interval of 5%, the
researcher used a simple random sample of 384 nonprofit organizations for this study. Once the
simple random sample was determined, the revenue data (2006, 2007, 2009 & 2010 earned and
total revenue for each organization) was collected from the website www.GuideStar.org. This
website is maintained by Guidestar (2016), a charitable organization that collects and retains
historical financial data relating to American nonprofit organizations that is easy to locate and
understand, as a public service.
REVENUE DIVERSIFICATION IN NONPROFIT ORGANIZATIONS 11
Assumptions and Limitations
This quantitative study examined a random sample, drawn from all American public
charities, and assessed whether the global financial collapse of 2008, on average, changed
nonprofit revenue streams. The research initiated an inquiry into the impact of environmental
economic stress on the nonprofit sector in general and the potential implications of that stress on
nonprofit organizations’ revenue models in particular.
The limitations of the quantitative study included that, as a before-after study, it was not
performed in a lab and therefore did not account for other variables and factors that may have
influenced the result. Additionally, utilizing an ANOVA test, though appropriate for this study,
limits the researcher’s ability to include competition as a control variable in the statistical
analysis of the data collected.
Summary
Nonprofit organizations are vital to the social fabric of the United States. To that end,
studying and understanding the impact that global financial crises can have on nonprofits should
be of concern to all Americans. While this study only began the discussion, further research will
aid nonprofit executives across the country in better managing their organizations and in
preparing for challenging economic times. It is the hope of this researcher that more attention
will be given to these and similar issues and that nonprofits will continue to flourish and serve
their missions of feeding the hungry, healing the sick, providing education, arts, and culture, and
in all other ways contributing to the public good.
REVENUE DIVERSIFICATION IN NONPROFIT ORGANIZATIONS 12
Theory
In this chapter, the researcher describes the theory that the global financial collapse of
2008 on average changed American nonprofit organizations revenue streams. The researcher
assumes a postpositivist worldview, which Creswell (2014) describes as “a deterministic
philosophy in which causes probably determine effects or outcomes” (p. 7). A postpositive
worldview is appropriate for this study because of the cause-and-effect relationship described in
the theory. In order to accomplish this, the researcher conducted a before-after study, a kind of
natural experiment, which Remler and Van Ryzin (2015) also call “one-group pretest-posttest
design or just a pre-post comparison” (p. 478).
In this before-after study, the researcher observed what American nonprofits reported as
contributed, earned, and total revenue on their 2007 and 2010 IRS Forms 990. The researcher
will then measure the nonprofits’ revenue diversification by calculating the mean earned income
percentages before and after 2008 and compare the results. Additionally, the researcher used an
ANOVA test to determine the significance of the global collapse of 2008 on revenue
diversification in American nonprofit organizations.
In the ensuing pages the researcher will provide the study’s theoretical perspective and
framework, detailing its dependent, independent, and control variables. This study aimed to
provide nonprofit executives with information about how the global financial collapse of 2008
affected nonprofits and in doing so potentially aid their ability to better lead their organizations
in the future.
Theoretical Perspective
Historically, nonprofit organizations have provided for the public good for decades by
feeding, housing, and clothing the economically challenged, bringing arts programs to children,
REVENUE DIVERSIFICATION IN NONPROFIT ORGANIZATIONS 13
providing medicine and healthcare to the sick, and much more. For decades, nonprofit
organizations have principally relied on donations, or contributed revenue, to fund these kinds of
mission-driven activities. More recently, however, nonprofit organizations have started
diversifying their revenue streams to include earned revenue (income from program fees,
publications sales and advertising, and rent, just to name a few), as well as income derived from
their investments or endowments.
Mastering the balance of these three revenue streams is often the regular task of nonprofit
executives. Froelich (1999) stated, “In an ideal world, we might envision nonprofit organizations
(NPOs) as collections of committed individuals that fervently pursue a cause” (p. 246). Froelich
went on to say that, “we are troubled by the digressive efforts and peripheral activities associated
with revenue-seeking behavior….Yet, these are…the facts of life for a nonprofit organization”
(1999, p. 246).
Dart’s (2004) research corroborated this perspective. “Few would dispute that nonprofits
are both being asked and required to be more business-like in their operation and attitude” (p.
290). Dart (2004) defined business-like activities as “characterized by some blend of profit
motivation, the use of managerial and organization design tools developed in for-profit business
settings, and broadly framed business thinking to structure and organize activity” (p. 294).
Researchers have spent countless hours and pages debating the phenomenon of revenue
diversification in nonprofit institutions. Few, if any, have studied the impact that the global
economic decline of 2008 has had on these shifting models. Understanding if the economic
decline affected nonprofit revenue diversification and how prepared nonprofit organizations were
able to respond to the new economic conditions, speaks to the sectors’ sustainability.
REVENUE DIVERSIFICATION IN NONPROFIT ORGANIZATIONS 14
Just as for-profit organizations weather downturns or fail trying, nonprofits must navigate
difficult times or cease to exist. Prentice (2015) wrote, “Ever-changing social, political, and
economic forces affect the nonprofit sector, and a strong financial position is required to adapt to
these forces” (p. 2). The consequences of losing nonprofits unable to adapt could be dire, as
there is no governmental safety net to backfill the monumental tasks nonprofits undertake each
day.
Amagoh (2015) suggested that through revenue diversification, nonprofit organizations
improve their credibility and effectiveness. Amagoh (2015) wrote, “The changing socio-
economic-political environment demands that nonprofits diversify their funding sources, which
tend to be volatile….funding has implications for the ability to sustain…over the long run” (p.
230). Amagoh (2015) identified an emerging principle of nonprofit executives today: In order to
better serve the mission of the organization over the long term, they must adapt revenue models
that are less volatile and therefore more credible.
de Vericourt and Lobo (2009) furthered this idea, by theorizing that nonprofit
organization leaders who aggressively price profit-driving program services are better able to
serve their missions and sustain their organizations, either by conducting investing activities or
by using those profits to offset mission-driven program services that are financial loss leaders.
To this end, they asked the question: How do nonprofit leaders decide on resource allocation
between mission-driven activities and profit-driven activities (that may help fund future mission-
driven activities or sustain the organization in the long-term)? de Vericourt and Lobo concluded
that “this policy allows the organization to have a higher expected social impact by serving more
mission customers” (p. 1126).
REVENUE DIVERSIFICATION IN NONPROFIT ORGANIZATIONS 15
Carroll and Stater (2008) investigated the effect of revenue diversification on the
financial security of nonprofit organizations. In their article, the authors asserted that nonprofit
organizations that increase revenue diversification, especially away from reliance on contributed
revenue and towards earned revenue streams, become more stable over time. The research
question they sought to address is as follows: “Can nonprofit organizations reduce their volatility
by diversifying their revenue structures” (Carroll & Stater, 2008, p. 962).
Through regression analysis, Carroll and Stater (2008) found that increased revenue
diversification led to a decrease in financial volatility within nonprofit organizations.
Additionally, the authors were able to point specifically to a larger decrease in volatility for
organizations that had relied heavily on contributed revenue, and now have diversified revenue,
as opposed to organizations that had always had a mixed portfolio of contributed, earned, and
investment revenue. The authors stated, “Overall, we find that revenue diversification does
exhibit a significant influence over the volatility of revenue structures for nonprofit
organizations….if a nonprofit actively diversified its revenue structure, the organization could
expect an average reductions in revenue volatility over time” (Carroll & Stater, 2008, p. 964).
Theoretical Framework
Carroll and Stater (2008) found that “Nonprofits can indeed reduce their revenue
volatility through diversification, particularly by equalizing their reliance on earned income,
investments, and contributed income” (p. 947). With that in mind, this quantitative study sought
to investigate the theory that volatility created by the global economic collapse of 2008 caused
nonprofit organizations to diversify their revenue streams. For the purposes of this study, the
following variables were examined:
REVENUE DIVERSIFICATION IN NONPROFIT ORGANIZATIONS 16
Dependent variable
Nonprofit revenue diversification. Froelich (1999) defined revenue diversification for
nonprofits by stating, “Nonprofit organizations must rely on a variety of activities and resource
providers to support their mission-related work” (p. 247). For the purposes of this study,
“variety of activities” meant contributed, earned, and investment revenue streams.
Independent variable one
Economic decline of 2008. Economic performance indicators all identify profound global
economic stress in 2008. Some of these indicators included increased levels of unemployment,
devaluing of investment values, and reductions in spending by corporations and individuals.
Control variable one
Location. Where the organization was located geographically in the United States.
Control variable two
Competition. Competition, for nonprofit organizations, relates to the number of other
nonprofits servicing a similar mission. Additionally, it concerns the number of organizations
vying for the same contributed dollars, regardless of mission.
Control variable three
Organization size. For the purposes of this research, organization size was measured by
gross revenue.
REVENUE DIVERSIFICATION IN NONPROFIT ORGANIZATIONS 17
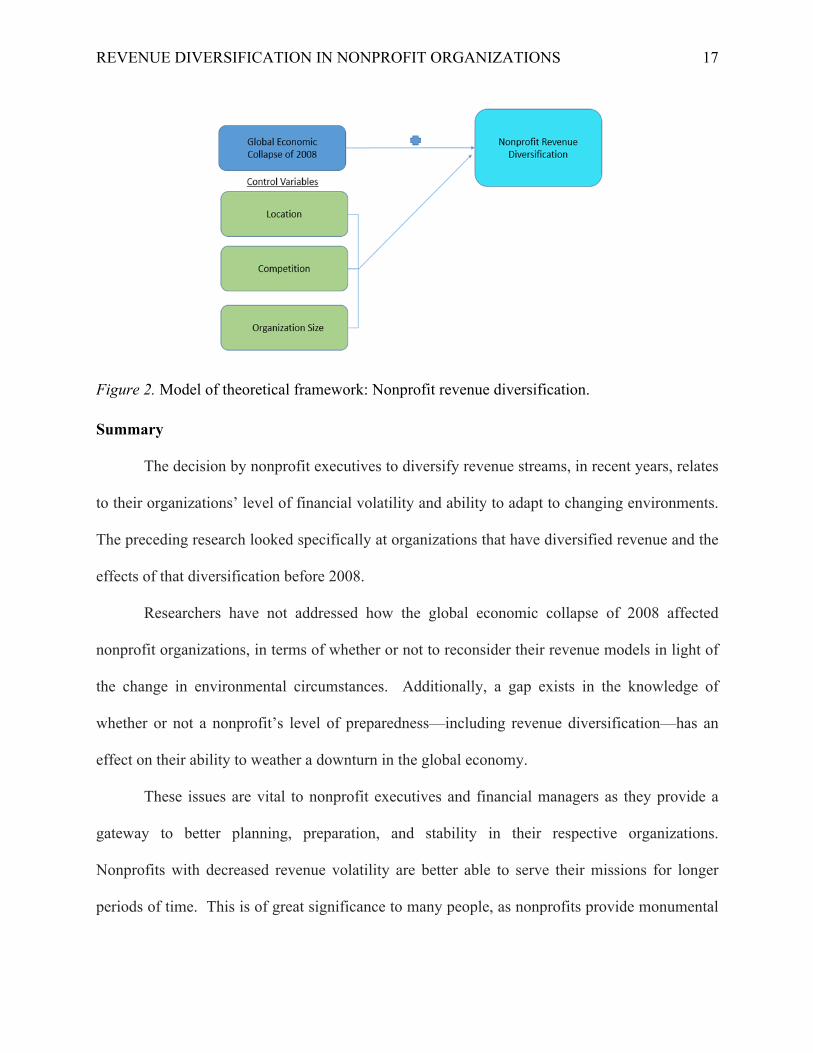
Figure 2. Model of theoretical framework: Nonprofit revenue diversification.
Summary
The decision by nonprofit executives to diversify revenue streams, in recent years, relates
to their organizations’ level of financial volatility and ability to adapt to changing environments.
The preceding research looked specifically at organizations that have diversified revenue and the
effects of that diversification before 2008.
Researchers have not addressed how the global economic collapse of 2008 affected
nonprofit organizations, in terms of whether or not to reconsider their revenue models in light of
the change in environmental circumstances. Additionally, a gap exists in the knowledge of
whether or not a nonprofit’s level of preparedness—including revenue diversification—has an
effect on their ability to weather a downturn in the global economy.
These issues are vital to nonprofit executives and financial managers as they provide a
gateway to better planning, preparation, and stability in their respective organizations.
Nonprofits with decreased revenue volatility are better able to serve their missions for longer
periods of time. This is of great significance to many people, as nonprofits provide monumental

REVENUE DIVERSIFICATION IN NONPROFIT ORGANIZATIONS 18
services to society, which has no “back-up plan” to manage the fallout, should nonprofits close
their doors.
REVENUE DIVERSIFICATION IN NONPROFIT ORGANIZATIONS 19
Analysis
In this chapter, the researcher outlines the data analysis and strategy of our quantitative
study of the impact of the global financial collapse of 2008 on revenue diversification in U.S.
nonprofit organizations. As part of this discussion, the researcher describes the statistical
analysis performed, identifies why specific tests were chosen over others, and indicates what can
be learned from those tests in general. As indicated above, the investigation assumes a
postpositivist worldview and takes the form of a natural experiment using a before-after study
approach. Additionally, this chapter will describe the study’s sample. The researcher will
discuss how the sample was obtained and identify key features that emerged in the sample as a
whole. Finally, this chapter will present the statistical results of the test performed.
Data Analysis and Strategy
The researcher took the straightforward approach in this quantitative before-after study’s
data analysis. Remler and Van Ryzin (2015) as “a basic comparison of means…and an
appropriate significance test of the difference” (p. 479). These tests were appropriate because
the independent variable, the global financial collapse of 2008, was a discrete or categorical
variable, which Szafran (2012) defines as having “a finite and usually small number of
attributes” (p. 12). Conversely, the dependent variable, revenue diversification in American
nonprofit organizations, was a continuous variable defined as having “a large, theoretically
infinite, number of attributes” (Szafran, 2012, p. 12).
In order to perform a comparison of the means, the researcher first calculated the pre-
2008 and post-2008 mean earned revenue percentages, as described above. The researcher then
completed a two-way ANOVA test comparing the change in earned revenue percentages
between pre and post-2008, organizational location and organizational size.
REVENUE DIVERSIFICATION IN NONPROFIT ORGANIZATIONS 20
An ANOVA test “reaches conclusions about differences in means among three or more
populations” (Szafran, 2012, p. 340). The result of this test indicates “the probability of getting
the sample result if the null hypothesis is true” (Szafran, 2012, p. 303). This study comports
with Szafran’s (2012) further direction relating to the conclusions drawn from this result when he
wrote, “we will not take on more than a 5% chance of making such an error. The probability
must be .05 or less for us to reject the null hypothesis” (p. 303). To that end, the researcher will
only reject the null hypothesis and issue a finding of statistical significance if the result of the
two-way ANOVA test is .05 or less.
Additionally, understanding the F statistic or F ratio is necessary when interpreting the
results of a two-way ANOVA test. Szafran (2012) describes the F ratio as,
A ratio of variances. The top number or numerator of the F ratio is an estimate of
the variance in the population on the dependent variable using what is known as
the “between groups” method of estimation. The bottom number or denominator
of the F ratio is an alternative estimate of the variance in the population on the
dependent variable using the “within-groups” method of estimation” (Szafran,
2012, p. 341).
With this in mind, when the populations that are being compared have similar means, the F
statistic will be one or very near one. When the means vary, the F statistic will be greater than
one.
In order to answer the research question, the researcher relied on the frequency with
which organizations experienced changes in earned income percentages before and after 2008.
The ANOVA test indicated whether or not revenue class and census region can be used to
predict whether a nonprofit’s earned income percentage changes, after the global recession.
REVENUE DIVERSIFICATION IN NONPROFIT ORGANIZATIONS 21
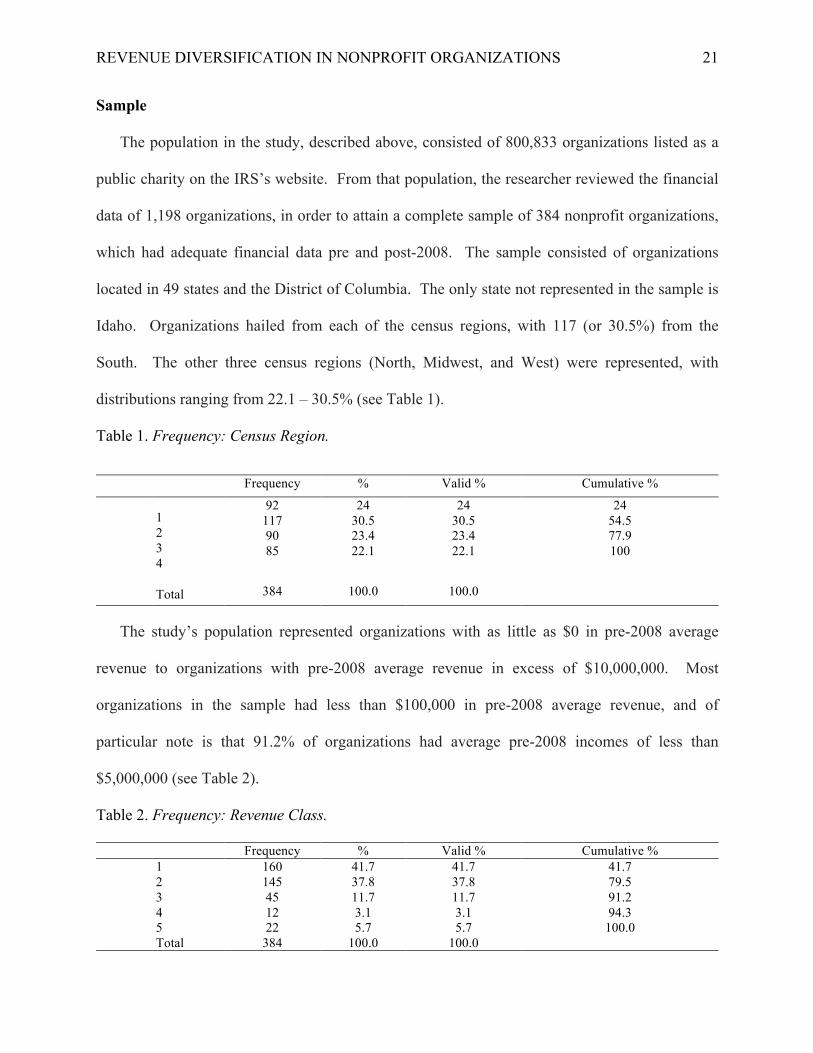
Sample
The population in the study, described above, consisted of 800,833 organizations listed as a
public charity on the IRS’s website. From that population, the researcher reviewed the financial
data of 1,198 organizations, in order to attain a complete sample of 384 nonprofit organizations,
which had adequate financial data pre and post-2008. The sample consisted of organizations
located in 49 states and the District of Columbia. The only state not represented in the sample is
Idaho. Organizations hailed from each of the census regions, with 117 (or 30.5%) from the
South. The other three census regions (North, Midwest, and West) were represented, with
distributions ranging from 22.1 – 30.5% (see Table 1).
Table 1. Frequency: Census Region.
Frequency % Valid % Cumulative %
1 2 3 4
92 117 90 85
24 30.5 23.4 22.1
24 30.5 23.4 22.1
24 54.5 77.9 100
Total 384 100.0 100.0
The study’s population represented organizations with as little as $0 in pre-2008 average
revenue to organizations with pre-2008 average revenue in excess of $10,000,000. Most
organizations in the sample had less than $100,000 in pre-2008 average revenue, and of
particular note is that 91.2% of organizations had average pre-2008 incomes of less than
$5,000,000 (see Table 2).
Table 2. Frequency: Revenue Class.
Frequency % Valid % Cumulative %
1 2 3 4
160 145 45 12
41.7 37.8 11.7 3.1
41.7 37.8 11.7 3.1
41.7 79.5 91.2 94.3
5 22 5.7 5.7 100.0 Total 384 100.0 100.0
REVENUE DIVERSIFICATION IN NONPROFIT ORGANIZATIONS 22
Data Analysis
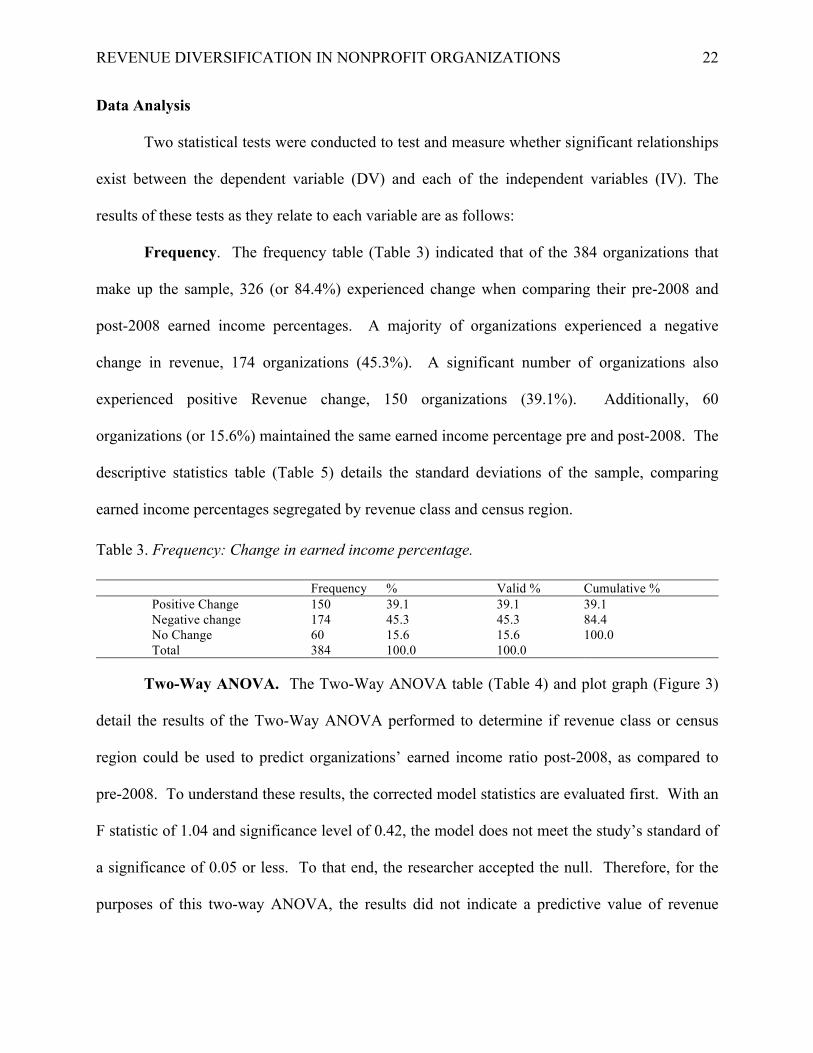
Two statistical tests were conducted to test and measure whether significant relationships
exist between the dependent variable (DV) and each of the independent variables (IV). The
results of these tests as they relate to each variable are as follows:
Frequency. The frequency table (Table 3) indicated that of the 384 organizations that
make up the sample, 326 (or 84.4%) experienced change when comparing their pre-2008 and
post-2008 earned income percentages. A majority of organizations experienced a negative
change in revenue, 174 organizations (45.3%). A significant number of organizations also
experienced positive Revenue change, 150 organizations (39.1%). Additionally, 60
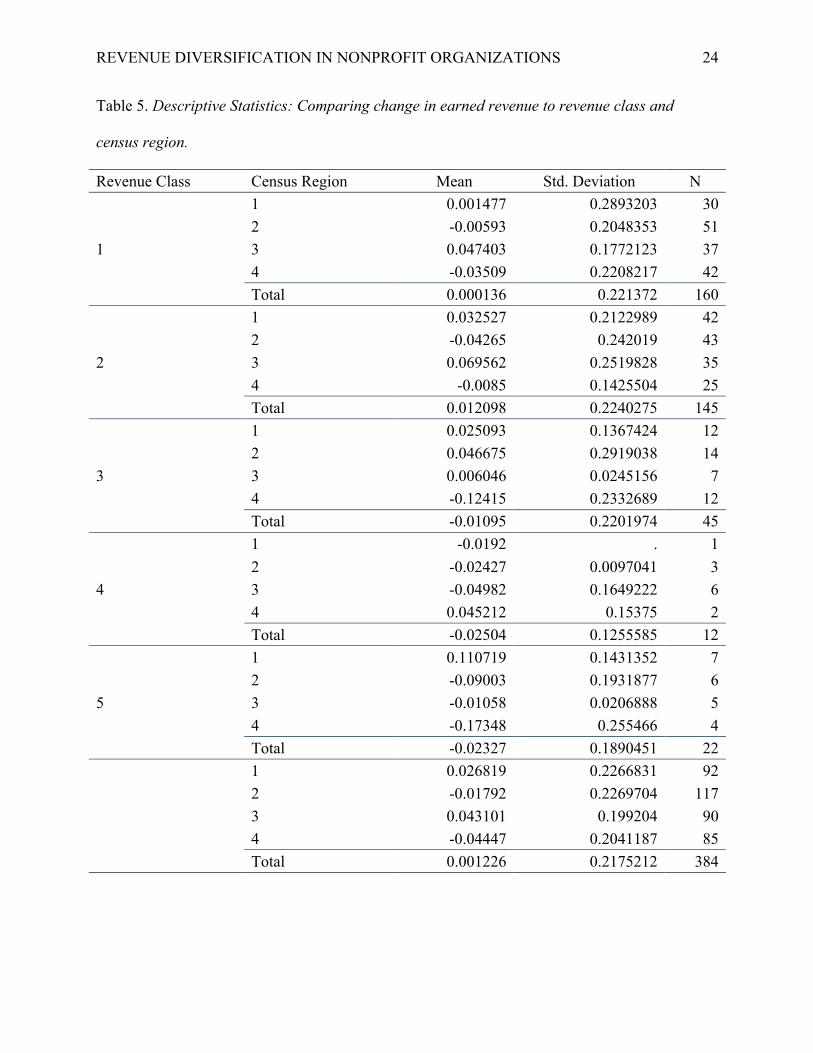
organizations (or 15.6%) maintained the same earned income percentage pre and post-2008. The
descriptive statistics table (Table 5) details the standard deviations of the sample, comparing
earned income percentages segregated by revenue class and census region.
Table 3. Frequency: Change in earned income percentage.
Frequency % Valid % Cumulative %
Positive Change Negative change
150 174
39.1 45.3
39.1 45.3
39.1 84.4
No Change 60 15.6 15.6 100.0 Total 384 100.0 100.0
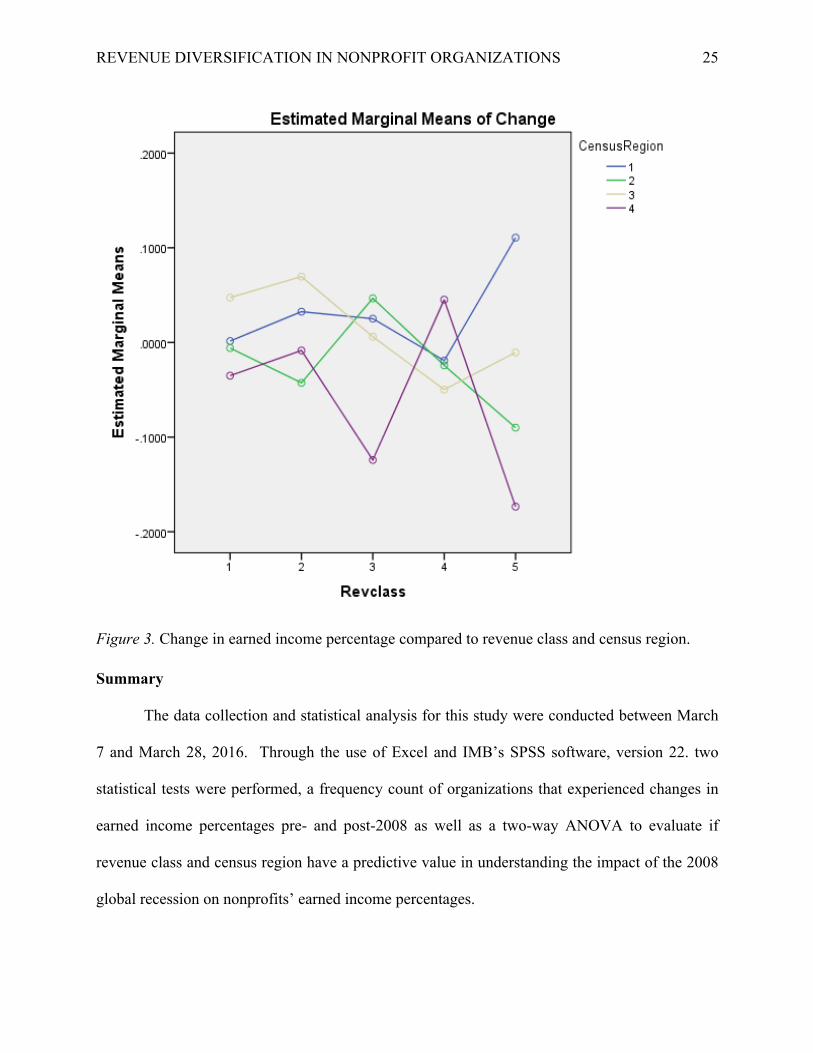
Two-Way ANOVA. The Two-Way ANOVA table (Table 4) and plot graph (Figure 3)
detail the results of the Two-Way ANOVA performed to determine if revenue class or census
region could be used to predict organizations’ earned income ratio post-2008, as compared to
pre-2008. To understand these results, the corrected model statistics are evaluated first. With an
F statistic of 1.04 and significance level of 0.42, the model does not meet the study’s standard of
a significance of 0.05 or less. To that end, the researcher accepted the null. Therefore, for the
purposes of this two-way ANOVA, the results did not indicate a predictive value of revenue
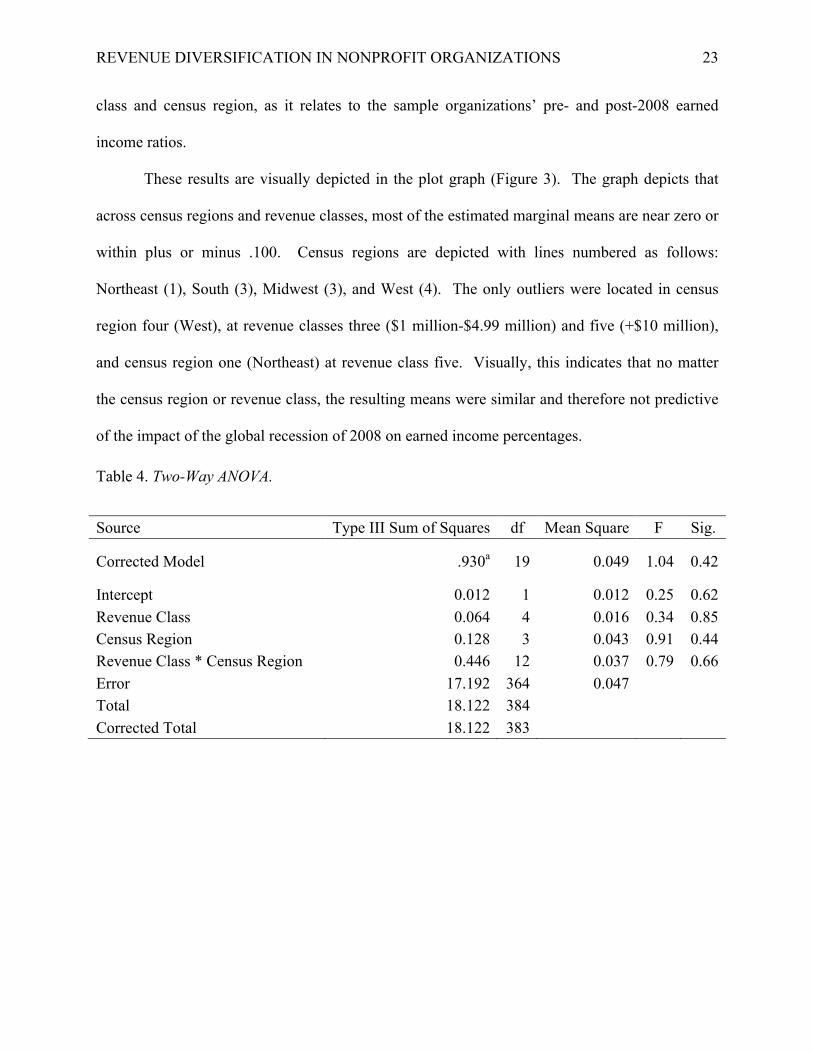
REVENUE DIVERSIFICATION IN NONPROFIT ORGANIZATIONS 23
class and census region, as it relates to the sample organizations’ pre- and post-2008 earned
income ratios.
These results are visually depicted in the plot graph (Figure 3). The graph depicts that
across census regions and revenue classes, most of the estimated marginal means are near zero or
within plus or minus .100. Census regions are depicted with lines numbered as follows:
Northeast (1), South (3), Midwest (3), and West (4). The only outliers were located in census
region four (West), at revenue classes three ($1 million-$4.99 million) and five (+$10 million),
and census region one (Northeast) at revenue class five. Visually, this indicates that no matter
the census region or revenue class, the resulting means were similar and therefore not predictive
of the impact of the global recession of 2008 on earned income percentages.
Table 4. Two-Way ANOVA.
Source Type III Sum of Squares df Mean Square F Sig.
Corrected Model .930a 19 0.049 1.04 0.42
Intercept 0.012 1 0.012 0.25 0.62 Revenue Class 0.064 4 0.016 0.34 0.85 Census Region 0.128 3 0.043 0.91 0.44 Revenue Class * Census Region 0.446 12 0.037 0.79 0.66 Error 17.192 364 0.047 Total 18.122 384 Corrected Total 18.122 383
REVENUE DIVERSIFICATION IN NONPROFIT ORGANIZATIONS 24
Table 5. Descriptive Statistics: Comparing change in earned revenue to revenue class and
census region.
Revenue Class Census Region Mean Std. Deviation N
1
1 0.001477 0.2893203 30 2 -0.00593 0.2048353 51 3 0.047403 0.1772123 37 4 -0.03509 0.2208217 42 Total 0.000136 0.221372 160
2
1 0.032527 0.2122989 42 2 -0.04265 0.242019 43 3 0.069562 0.2519828 35 4 -0.0085 0.1425504 25 Total 0.012098 0.2240275 145
3
1 0.025093 0.1367424 12 2 0.046675 0.2919038 14 3 0.006046 0.0245156 7 4 -0.12415 0.2332689 12 Total -0.01095 0.2201974 45
4
1 -0.0192 . 1 2 -0.02427 0.0097041 3 3 -0.04982 0.1649222 6 4 0.045212 0.15375 2 Total -0.02504 0.1255585 12
5
1 0.110719 0.1431352 7 2 -0.09003 0.1931877 6 3 -0.01058 0.0206888 5 4 -0.17348 0.255466 4 Total -0.02327 0.1890451 22
1 0.026819 0.2266831 92 2 -0.01792 0.2269704 117 3 0.043101 0.199204 90 4 -0.04447 0.2041187 85 Total 0.001226 0.2175212 384
REVENUE DIVERSIFICATION IN NONPROFIT ORGANIZATIONS 25
Figure 3. Change in earned income percentage compared to revenue class and census region.
Summary
The data collection and statistical analysis for this study were conducted between March
7 and March 28, 2016. Through the use of Excel and IMB’s SPSS software, version 22. two
statistical tests were performed, a frequency count of organizations that experienced changes in
earned income percentages pre- and post-2008 as well as a two-way ANOVA to evaluate if
revenue class and census region have a predictive value in understanding the impact of the 2008
global recession on nonprofits’ earned income percentages.
REVENUE DIVERSIFICATION IN NONPROFIT ORGANIZATIONS 26
Based on the findings presented in Table 3, it is clear that most (83.9%) organizations’
earned income percentages changed between the pre- and post-2008 periods. A decline in
earned income percentage was recorded for 45.3% of organizations experienced, while 39.1%
experienced an increase. Additionally, the results included in Table 4 and Figure 3 reveal that
revenue class and census region did not indicate a predictive value in understanding the impact
of the 2008 global recession on nonprofits’ earned income percentages.
REVENUE DIVERSIFICATION IN NONPROFIT ORGANIZATIONS 27
Discussion
Nonprofit organizations touch countless lives across the United States. Among other
things, they work to provide meals for the hungry, housing for the homeless, cures for the sick,
education and entertainment through the arts and sciences, as well as advance the civil rights of
those on the margins of society. Without the work of these more than 800,000 organizations, our
country would be less vibrant, innovative, empathetic and likely forced to find new ways to
address the contributions made by nonprofits. To that end, studying and understanding how a
global recession impacts these organizations is vital to informing and educating current and
future nonprofit executives regarding how best to lead their institutions through challenging
economic times.
This study was a significant first step, on what is likely a long journey, to understand the
impact of the global recession of 2008 on American nonprofit organizations’ revenue. This
chapter will answer the research question posed by this study, discuss the conclusions of the
findings, and outline recommendations for work by future researchers. The following research
question guided this study.
Research question one (RQ1)
Did the global financial collapse of 2008, on average, change American nonprofit
organizations revenue streams?
Null hypothesis one (Hₒ1)
The global financial collapse had no effect on the proportions of earned and contributed
revenue, as compared to total revenue, of American nonprofit organizations.
REVENUE DIVERSIFICATION IN NONPROFIT ORGANIZATIONS 28
Alternate hypothesis one (Hₐ1ₐ)
The global financial collapse of 2008 on average changed American nonprofit
organizations’ proportions of earned and contributed revenue, as compared to total revenue.
The frequency test performed indicated that most (84.4%) nonprofit organizations
sampled did experience a change in earned income when comparing the pre- and post-2008
results. To that end, the researcher rejected the null hypothesis, that the global recession of 2008
had no effect on American nonprofits’ earned income percentages. However, the results of the
two-way ANOVA did not indicate that revenue class and census region have predictive value, in
relation to the impact of the global recession of 2008 on earned income percentages.
Conclusions
Despite being able to reject the null hypothesis, this researcher recognizes that this study
does not provide much in the way of conclusions pertaining to how American nonprofit
organizations were affected by the global recession of 2008. Studies like that of Carroll and
Stater (2008), which indicated that nonprofits with diverse revenue streams are less volatile and
therefore less susceptible to environmental forces (like recession), influenced the design of this
study (and its supporting theoretical framework). If nonprofit executives followed Carroll and
Stater’s (2008) theory, it stands to reason that many would (or attempt to) diversify revenue
streams to balance an ebbing flow of contributed revenue that coincides with recessionary
periods. Based on the research conducted in this study, however, this conclusion cannot be
reached.
While it is true that 84.4% of organizations sampled experienced a change in earned
income after 2008, 45.3% of earned income percentages decreased after the 2008 recession.
This means that for nearly 40% of those organizations sampled, contributed income increased—
as compared to earned income—in 2009 and 2010. The notion that nonprofits’ contributed
REVENUE DIVERSIFICATION IN NONPROFIT ORGANIZATIONS 29
revenue would increase, as compared to earned income, in the wake of the 2008 global recession
refutes Carroll and Stater’s (2008) theory, and instead implies that in the midst of challenging
economic times, organizations can survive by continuing to rely, in many cases to an even
greater degree, on the generosity of donors.
Additionally, based on the results of the two-way ANOVA test, there is no indication of
predictive value of revenue size or census region as they pertain to the impact of the global
recession of 2008 on earned income percentages. Noticeably, the 2008 recession hit all
geographical regions of the U.S. With that in mind, it is reasonable that census region (location)
was not predictive of the impact of the recession on earned income percentages. However,
operationally, it is intuitive that nonprofits with larger average total revenue would be more
likely to attract and afford executives of significant talent whose management styles may be
informed by researchers like Carroll and Stater. To that end, this researcher expected
organizations with larger average total revenue to have larger increases in earned income
percentages and therefore to better withstand the global financial collapse of 2008. The
researcher acknowledges some bias in the assumption that better educated executives would have
knowledge of the importance of revenue diversification during challenging economic times.
That being said, the results of this study did not bear out that expectation, as larger organizations
(based on average revenue) were no more likely than smaller organizations to experience change
in earned income percentages as a result of the 2008 recession.
It is the belief of this researcher that the lack of predictive value found, regarding
organization size, may be the result of two limitations to this study. The first limitation pertains
to the diversity of the sample used. It is often the case that a diverse sample is beneficial when
conducting a research project. In this case, it is clear that there is so much diversity in size
REVENUE DIVERSIFICATION IN NONPROFIT ORGANIZATIONS 30
(organizations with average revenue of $0 to over $10,000,000) and mission that the impact of
recession and effective management strategies deployed to contend with the resulting economic
hardship may be so vastly different, that studying them all at the same time is too difficult.
A second limitation to this study is the assumption that the only reason for an
organization’s earned income percentage to change from 2006 to 2010, is the impact of the
global recession. It is common knowledge that American nonprofit executives often work
tirelessly to manage the earned/contributed mix of income for their respective organizations.
However, this study does not account for the possibility that other environmental or internal
factors might have positively or negatively impacted the earned income of sampled
organizations. Additionally, it is possible that the effects of the global recession may have offset
the other environmental or internal factors, resulting in no change to earned income percentages.
Recommendations
It is the belief of the researcher that this study was an important first step in better
understanding how American nonprofit organizations are impacted by recession. While
sweeping conclusions were not drawn from this research, it is clear that organizations across the
sector are very diverse and respond differently to external forces. The researcher believes that if
this study is repeated, very small volunteer-led organizations (for example parent-teacher groups,
little league baseball clubs, and band boosters) should be excluded from the sample. It is the
hope of the researcher that from this work, others will begin to distill best practices concerning
how to steer organizations through challenging times.
From this work, a next step to inform and enrich nonprofit executives’ ability to lead their
organizations and represent the sector may include a deeper understanding of fewer, similar
(size, mission, and location) organizations. Due to the limitations discussed above, the
REVENUE DIVERSIFICATION IN NONPROFIT ORGANIZATIONS 31
researcher believes that a mixed method case study of a smaller sample of organizations (for
example, five arts organizations from Washington, D.C. or three institutions of higher education
in California) may allow the researcher to interview executives to gain an in-depth understanding
of what their organizations may be experiencing both internally and externally, during the
recession. The results of the qualitative analysis, through use of in-depth interviews, could be
compared to deeper quantitative analysis (for example, comparing calculated volatility ratios or
comprehensive financial index ratios) of the sampled organizations. The researcher believes that
a deeper understanding of a smaller sample of organizations may provide situational—instead of
broad—insight for nonprofit executives. While this research approach is much longer and more
time consuming, the findings may be much better suited to inform industry-wide best practices.
Summary
Over the course of America’s history, nonprofit organizations have filled the void
between citizens’ needs and our government’s ability to meet those needs. When America or the
world encounter recessionary periods, the services provided by many nonprofits become more
important than ever. The purpose of this study was to begin a conversation about how to lead
nonprofits during challenging times, by first understanding the impact of the global recession of
2008 on nonprofit revenue.
While this study has not led to specific conclusions regarding how recession impacts
nonprofits, this researcher believes it was a vital first step in an important long-term process, of
developing best practices for the sector and dispelling anecdotal rumors propagated by some in
the field. What was made clear was that recession impacts nonprofits very differently and
further investigation is needed to better understand this phenomenon. It is the hope of the
researcher that work will continue to better understand how recession impacts nonprofits across
REVENUE DIVERSIFICATION IN NONPROFIT ORGANIZATIONS 32
industries, missions, size, and geographic location. As Hall (2004) wrote describing the work of
nonprofit organizations, “their impact is so far-reaching—touching on every aspect of our lives
and every level of institutions” (p. 4). The work of nonprofits is too vital to the United States not
to invest in further research and study so that executives may develop and rely on best practices,
lead their organizations, and fulfill their noble missions, no matter the economic climate.
REVENUE DIVERSIFICATION IN NONPROFIT ORGANIZATIONS 33
References
Amagoh, F. (2015). Improving the credibility and effectiveness of non-governmental
organizations. Progress in Development Studies, 15(3), 221-239.
Arvidson, M., & Lyon, F. (2014). Social impact measurement and non-profit organisations:
compliance, resistance, and promotion. Voluntas: International Journal of Voluntary &
Nonprofit Organizations, 25(4), 869-886.
Calabrese, T. (2013). Running on empty: the operating reserves of U.S. nonprofit
organizations. Nonprofit Management & Leadership, 23(3), 281-302.
Carroll, D. A., & Stater, K. J. (2009). Revenue diversification in nonprofit organizations: does it
lead to financial stability? Journal of Public Administration Research & Theory, 19(4),
947-966.
Chad, P. (2014). Organizational change within charities: improved performance via introduction
of market orientation and other strategic orientations. International Review on Public &
Non Profit Marketing, 11(1), 89.
Creswell, J. W. (2013). Research design: Qualitative, quantitative, and mixed methods
approaches (4th ed.). Thousand Oaks, CA: Sage Publications.
Dart, R. (2004). Being “business-like” in a nonprofit organization: a grounded and inductive
theory. Nonprofit and Voluntary Sector Quarterly, 33(2), 290-310.
de Vericourt, F. & Lobo, M. (2009). Resource and revenue management in nonprofit operations.
Operations Research, 57(5), 1114-1128.
Froelich, K. A. (1999). Diversification of revenue strategies: evolving resource dependence in
nonprofit organizations. Nonprofit and Voluntary Sector Quarterly, 28(3), 246-268.
Guidestar. (2016). Retrieved from, http://www.guidestar.org/rxg/about-us/index.aspx.
Hall, P. D. (2004). Historical perspectives on nonprofit organizations in the United States. In
R. Herman (Ed.), The Jossey-Bass Handbook of Nonprofit Management and Leadership
(pp. 1-38). San Francisco, CA: Jossey-Bass.
Hodge, M. M., & Piccolo, R. F. (2011). Nonprofit board effectiveness, private philanthropy, and
financial vulnerability. Public Administration Quarterly, 35(4), 520-550.
Merriam, S. B. (2009). Qualitative research: A guide to design and implementation. San
Francisco, CA: Jossey-Bass.
REVENUE DIVERSIFICATION IN NONPROFIT ORGANIZATIONS 34
Pfeffer, J. & Salancik, G. R. (1978). The external control of organizations. New York, NY:
Harper and Row.
Prentice, C. R. (2015). Understanding nonprofit financial health: exploring the effects of
organizational and environmental variables. Nonprofit and Voluntary Sector Quarterly,
22, 1-22.
Remler, D. K. & Van Ryzin, G. G. (2015). Research methods in practice: strategies for
description and causation. Thousand Oaks: SAGE Publications, Inc.
Szafran, R. F. (2012). Answering questions with statistics. Thousand Oaks: SAGE
Publications, Inc.
United States Census Bureau. (2015). Retrieved from, http://www2.census.gov/geo/pdfs/maps-
data/maps/reference/us_regdiv.pdf.