Embed Size (px)
Citation preview
JOINT LEGISLATIVE AUDIT AND REVIEW COMMISSION OF THE VIRGINIA GENERAL ASSEMBLY
Review of Factors and Practices Associated with
School Performance in Virginia
REPORT OF THE JOINT LEGISLATIVE AUDIT AND REVIEW COMMISSION
Review of Factors and Practices Associated with School Performance in Virginia
TO THE GOVERNOR AND THE GENERAL ASSEMBLY OF VIRGINIA
SENATE DOCUMENT NO. 8
COMMONWEALTH OF VIRGINIA RICHMOND 2004
Members of the Joint Legislative Audit and Review Commission
Chairman Senator Kevin G. Miller
Vice-Chairman Delegate Lacey E. Putney
Delegate Vincent F. Callahan, Jr. Senator John H. Chichester Senator Charles J. Colgan Delegate M. Kirkland Cox
Delegate Frank D. Hargrove, Sr. Delegate Johnny S. Joannou
Delegate Dwight C. Jones Senator Thomas K. Norment, Jr.
Delegate Harry J. Parrish Senator Walter A. Stosch
Delegate Leo C. Wardrup, Jr.
Mr. Walter J. Kucharski, Auditor of Public Accounts
Director Philip A. Leone
© COPYRIGHT 2004, COMMONWEALTH OF VIRGINIA
Preface
In 2003, the General Assembly enacted SJR 349 directing the Joint Legislative Audit and Review Commission (JLARC) to collect data and information regarding best practices at high-performing schools and divisions in the Commonwealth. The review was directed based on concerns that while most schools are meeting academic achievement goals, there remains a significant achievement gap between the best- and poorest-performing schools, and the recognition that some schools and divisions facing significant challenges have been able to overcome them. In addition to examining best practices, the study resolution requested that JLARC staff examine specific demographic and other factors that may influence academic success.
To examine the factors that may impact academic achievement, JLARC staff conducted an extensive quantitative analysis of variables potentially associated with Standards of Learning (SOL) test performance. To assess best practices in successful schools, JLARC staff conducted interviews with 61 principals and 11 superintendents and surveyed teachers in the schools visited.
The results of the quantitative analysis revealed strong statewide trends regarding factors that tend to be associated with SOL test scores. The level of student poverty, the proportion of black students, and the educational attainment of adults in the community are all strong predictors of school performance as measured by SOL test scores. The relationship between these three factors and SOL test scores can be partially explained by certain student, family, school, division, and local fiscal characteristics, as well as by teacher qualifications and experience.
Despite the strong trends identified, the results of the qualitative analysis revealed that individual schools can and do exceed predicted results by employing practices which allow them to overcome challenges and achieve higher than expected levels of success. In addition, the analysis revealed that some school divisions with challenges have exceeded predicted results by having strong and stable leadership, addressing ineffective teachers, and providing extensive professional development for teachers and principals.
The study also found that over the last several years SOL test scores and pass rates have increased substantially, and that principals interviewed and teachers surveyed generally believe that the SOLs have been helpful in improving the performance of their schools and students. However, the Commonwealth and its public schools still face a number of challenges for the future.
On behalf of the JLARC staff, I wish to express our appreciation for the assistance provided by the State Department of Education as well as by superintendents, principals, and teachers throughout the Commonwealth.
Philip A. Leone Director
January 21, 2004
JLARC Report Summary
January 2004
Joint Legislative Audit and Review
Commission
Review of Factors and Practices
Associated with School Performance
in Virginia
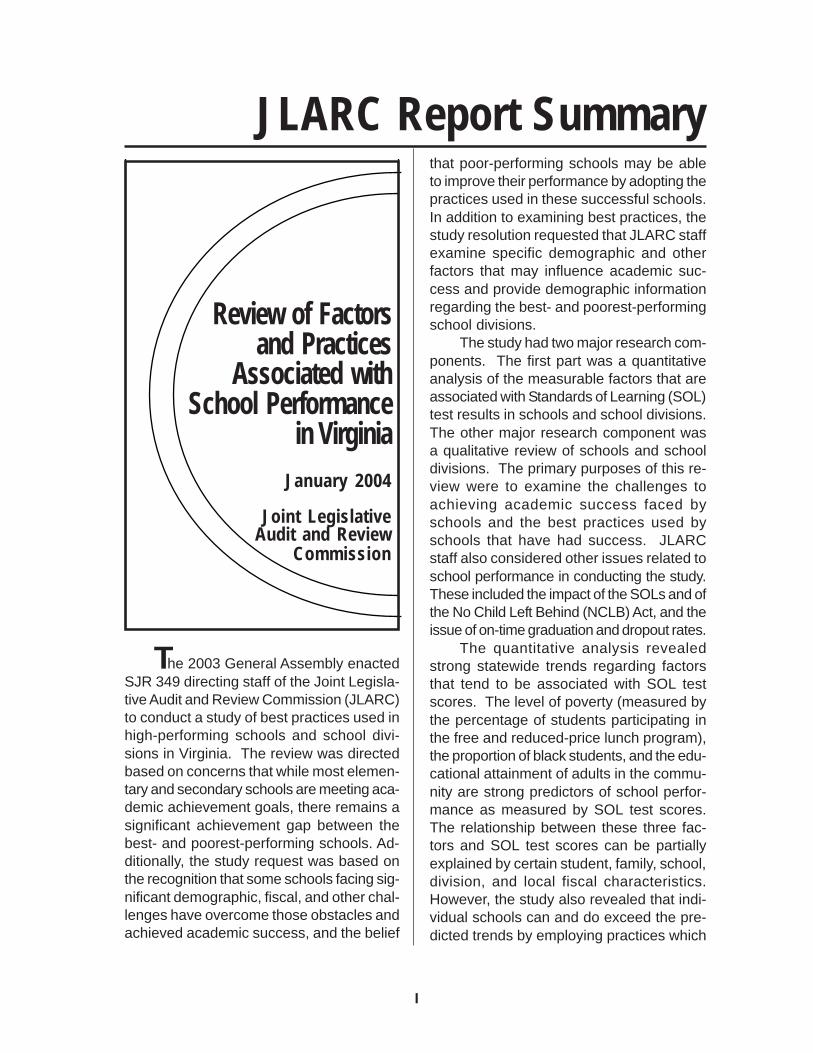
T he 2003 General Assembly enacted SJR 349 directing staff of the Joint Legislative Audit and Review Commission (JLARC) to conduct a study of best practices used in high-performing schools and school divisions in Virginia. The review was directed based on concerns that while most elementary and secondary schools are meeting academic achievement goals, there remains a significant achievement gap between the best- and poorest-performing schools. Additionally, the study request was based on the recognition that some schools facing significant demographic, fiscal, and other challenges have overcome those obstacles and achieved academic success, and the belief
that poor-performing schools may be able to improve their performance by adopting the practices used in these successful schools. In addition to examining best practices, the study resolution requested that JLARC staff examine specific demographic and other factors that may influence academic success and provide demographic information regarding the best- and poorest-performing school divisions.
The study had two major research components. The first part was a quantitative analysis of the measurable factors that are associated with Standards of Learning (SOL) test results in schools and school divisions. The other major research component was a qualitative review of schools and school divisions. The primary purposes of this review were to examine the challenges to achieving academic success faced by schools and the best practices used by schools that have had success. JLARC staff also considered other issues related to school performance in conducting the study. These included the impact of the SOLs and of the No Child Left Behind (NCLB) Act, and the issue of on-time graduation and dropout rates.
The quantitative analysis revealed strong statewide trends regarding factors that tend to be associated with SOL test scores. The level of poverty (measured by the percentage of students participating in the free and reduced-price lunch program), the proportion of black students, and the educational attainment of adults in the community are strong predictors of school performance as measured by SOL test scores. The relationship between these three factors and SOL test scores can be partially explained by certain student, family, school, division, and local fiscal characteristics. However, the study also revealed that individual schools can and do exceed the predicted trends by employing practices which
I
allow them to overcome challenges and achieve higher than expected levels of academic success.
Six major findings result from this review:
• Over the course of several years of SOL implementation, SOL test scores and pass rates have increased substantially.
• However, a large percentage of the difference in the SOL test performance of schools and school divisions is still explained by the demographic characteristics of students and their communities. Further analysis revealed that the relationships between these factors and test scores can be partially explained by differences in teacher qualifications and experience, family support and structure, school and division characteristics, and local fiscal conditions.
• Some of the schools challenged by these demographic factors have used best practices that have helped them to achieve success on the SOL tests, and these practices are identified in the report.
• Support provided at the division level has a direct bearing on the success of individual schools, and successful divisions generally provide more support to their schools. Effective division practices are identified in this report.
• In the divisions and schools visited for this review, superintendents, principals,
and teachers generally indicate a belief that the SOLs have been helpful in improving the performance of their schools and students.
• However, the Commonwealth and its public schools still face a number of challenges for the future, including addressing the needs of pupils served by schools where performance is not considered acceptable, responding to issues such as high dropout and retention rates, and meeting the expectations of the federal No Child Left Behind Act.
SOL Pass Rates and Scores Have Increased Substantially
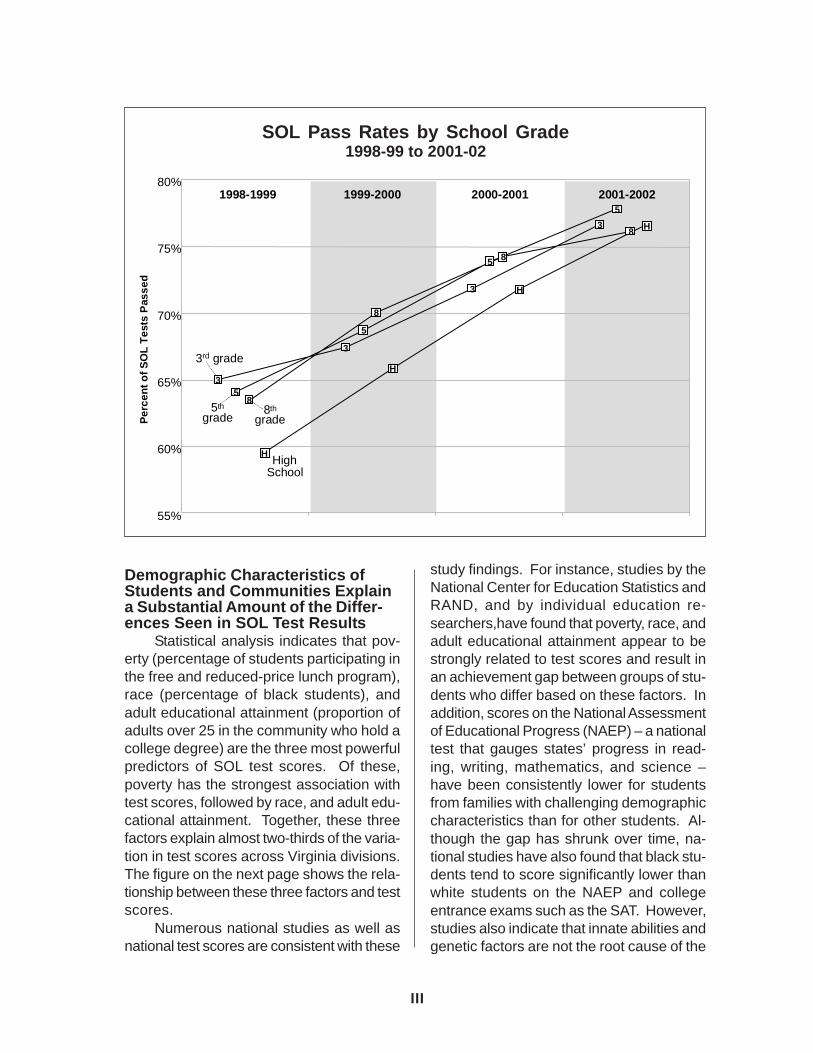
SOL pass rates of Virginia students have greatly increased in all grade levels over the last four years. The percentage of third, fifth, and eighth grade SOL tests passed, on average, has increased by 13 percent during that period. In addition, the percentage of high school end-of-course tests passed has increased by 17 percent since the 1998-1999 school year. The figure at right shows this upward trend over the last four years.
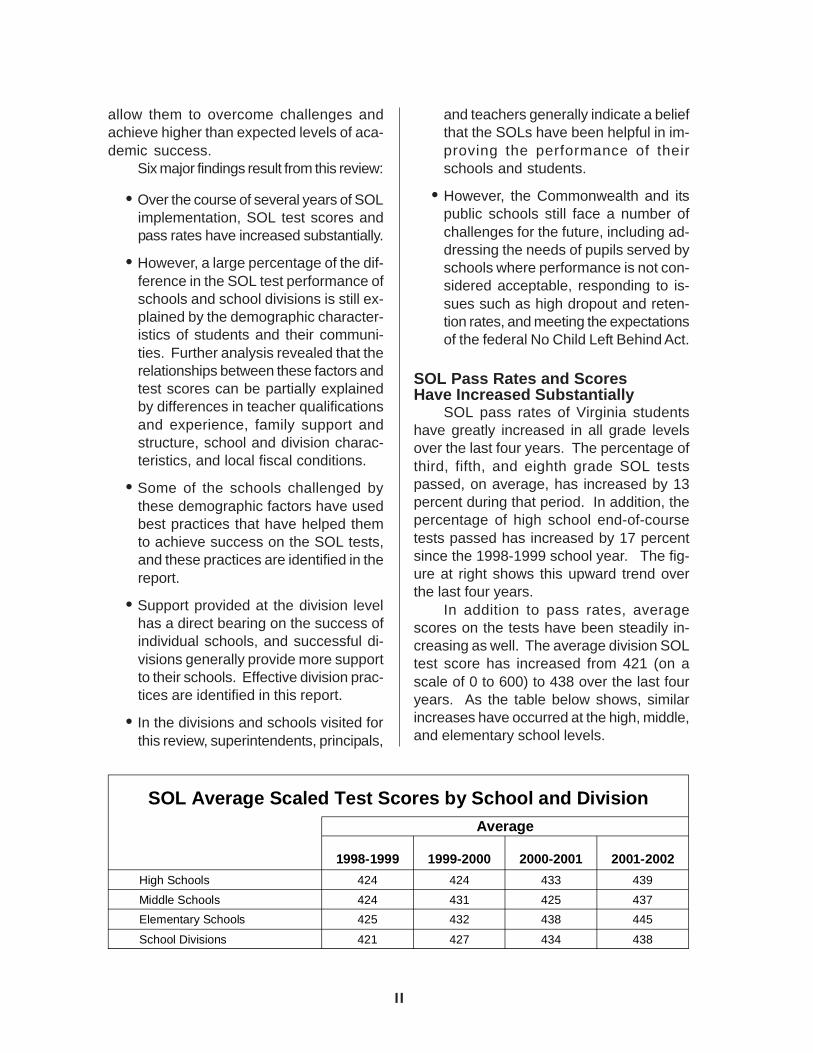
In addition to pass rates, average scores on the tests have been steadily increasing as well. The average division SOL test score has increased from 421 (on a scale of 0 to 600) to 438 over the last four years. As the table below shows, similar increases have occurred at the high, middle, and elementary school levels.
SOL Average Scaled Test Scores by School and Division Average
1998-1999 1999-2000 2000-2001 2001-2002
High Schools 424 424 433 439
Middle Schools 424 431 425 437
Elementary Schools 425 432 438 445
School Divisions 421 427 434 438
II
SOL Pass Rates by School Grade 1998-2001
SOL Pass Rates by School Grade P
erce
nt
of
SO
L T
ests
Pas
sed
1998-99 to 2001-02
80%
75%
70%
65%
60%
55%
Demographic Characteristics of Students and Communities Explain a Substantial Amount of the Differences Seen in SOL Test Results
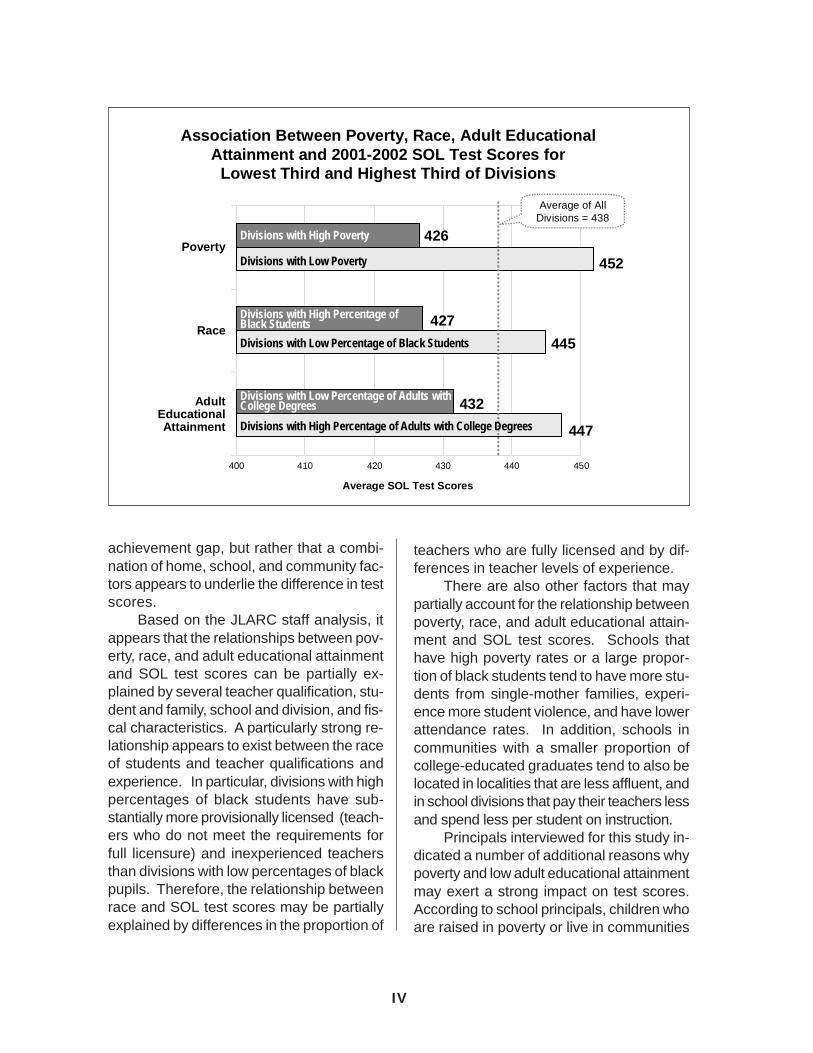
Statistical analysis indicates that poverty (percentage of students participating in the free and reduced-price lunch program), race (percentage of black students), and adult educational attainment (proportion of adults over 25 in the community who hold a college degree) are the three most powerful predictors of SOL test scores. Of these, poverty has the strongest association with test scores, followed by race, and adult educational attainment. Together, these three factors explain almost two-thirds of the variation in test scores across Virginia divisions. The figure on the next page shows the relationship between these three factors and test scores.
Numerous national studies as well as national test scores are consistent with these
1998-1999 1999-2000 2000-2001 2001-2002 5
3 8 H
5 8
3 H
8
5
3 3rd grade
H 3
5
5th
grade 8th
grade
8
High H
School
study findings. For instance, studies by the National Center for Education Statistics and RAND, and by individual education re-searchers,have found that poverty, race, and adult educational attainment appear to be strongly related to test scores and result in an achievement gap between groups of students who differ based on these factors. In addition, scores on the National Assessment of Educational Progress (NAEP) – a national test that gauges states’ progress in reading, writing, mathematics, and science – have been consistently lower for students from families with challenging demographic characteristics than for other students. Although the gap has shrunk over time, national studies have also found that black students tend to score significantly lower than white students on the NAEP and college entrance exams such as the SAT. However, studies also indicate that innate abilities and genetic factors are not the root cause of the
III
400 420 430 440
Di
Di
DiBl
Divisi lll
Di l ll
Di
ll Divi
Association Between Poverty, Race, Adult Educational Attainment and 2001-2002 SOL Test Scores for
Lowest Third and Highest Third of Divisions
410 450
Poverty
Race
Adult Educational Attainment
Average SOL Test Scores
visions with High Poverty
visions with Low Poverty
visions with High Percentage of ack Students
ons with Low Percentage of Adu ts with Co ege Degrees
visions with High Percentage of Adu ts with Co ege Degrees
visions with Low Percentage of Black Students
452
426
445
427
447
432
Average of Asions = 438
achievement gap, but rather that a combination of home, school, and community factors appears to underlie the difference in test scores.
Based on the JLARC staff analysis, it appears that the relationships between poverty, race, and adult educational attainment and SOL test scores can be partially explained by several teacher qualification, student and family, school and division, and fiscal characteristics. A particularly strong relationship appears to exist between the race of students and teacher qualifications and experience. In particular, divisions with high percentages of black students have substantially more provisionally licensed (teachers who do not meet the requirements for full licensure) and inexperienced teachers than divisions with low percentages of black pupils. Therefore, the relationship between race and SOL test scores may be partially explained by differences in the proportion of
teachers who are fully licensed and by differences in teacher levels of experience.
There are also other factors that may partially account for the relationship between poverty, race, and adult educational attainment and SOL test scores. Schools that have high poverty rates or a large proportion of black students tend to have more students from single-mother families, experience more student violence, and have lower attendance rates. In addition, schools in communities with a smaller proportion of college-educated graduates tend to also be located in localities that are less affluent, and in school divisions that pay their teachers less and spend less per student on instruction.
Principals interviewed for this study indicated a number of additional reasons why poverty and low adult educational attainment may exert a strong impact on test scores. According to school principals, children who are raised in poverty or live in communities
IV
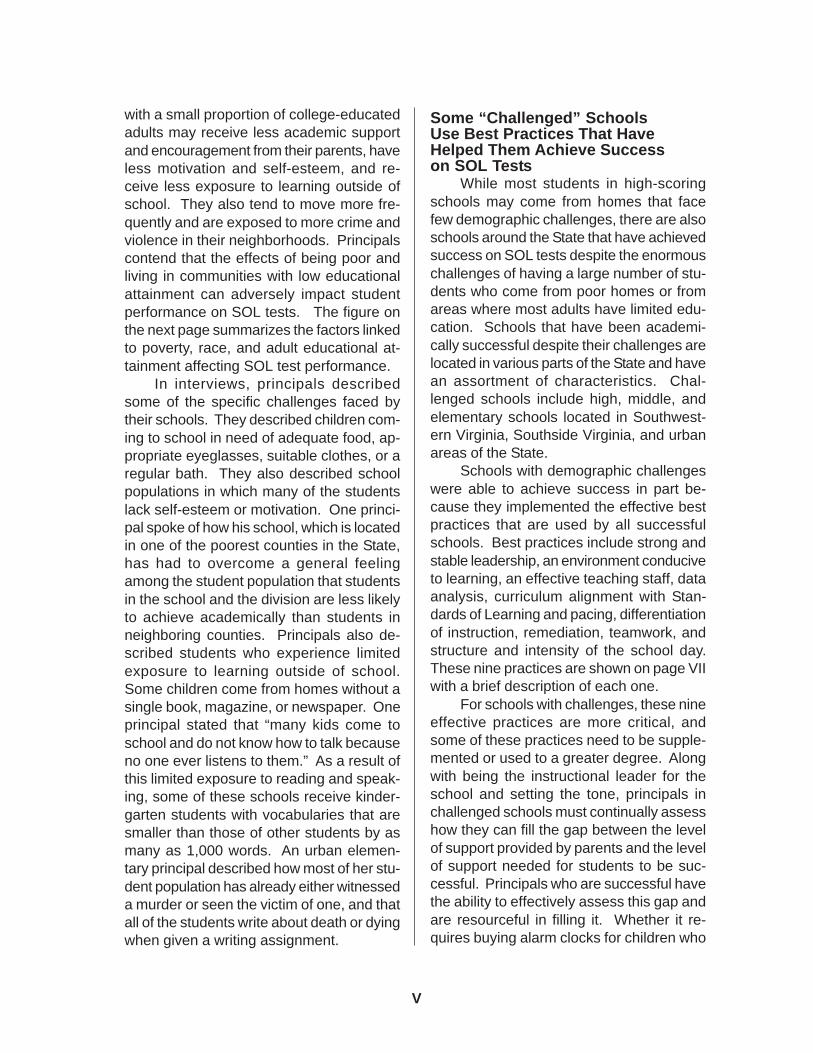
with a small proportion of college-educated adults may receive less academic support and encouragement from their parents, have less motivation and self-esteem, and receive less exposure to learning outside of school. They also tend to move more frequently and are exposed to more crime and violence in their neighborhoods. Principals contend that the effects of being poor and living in communities with low educational attainment can adversely impact student performance on SOL tests. The figure on the next page summarizes the factors linked to poverty, race, and adult educational attainment affecting SOL test performance.
In interviews, principals described some of the specific challenges faced by their schools. They described children coming to school in need of adequate food, appropriate eyeglasses, suitable clothes, or a regular bath. They also described school populations in which many of the students lack self-esteem or motivation. One principal spoke of how his school, which is located in one of the poorest counties in the State, has had to overcome a general feeling among the student population that students in the school and the division are less likely to achieve academically than students in neighboring counties. Principals also described students who experience limited exposure to learning outside of school. Some children come from homes without a single book, magazine, or newspaper. One principal stated that “many kids come to school and do not know how to talk because no one ever listens to them.” As a result of this limited exposure to reading and speaking, some of these schools receive kindergarten students with vocabularies that are smaller than those of other students by as many as 1,000 words. An urban elementary principal described how most of her student population has already either witnessed a murder or seen the victim of one, and that all of the students write about death or dying when given a writing assignment.
Some “Challenged” Schools Use Best Practices That Have Helped Them Achieve Success on SOL Tests
While most students in high-scoring schools may come from homes that face few demographic challenges, there are also schools around the State that have achieved success on SOL tests despite the enormous challenges of having a large number of students who come from poor homes or from areas where most adults have limited education. Schools that have been academically successful despite their challenges are located in various parts of the State and have an assortment of characteristics. Challenged schools include high, middle, and elementary schools located in Southwestern Virginia, Southside Virginia, and urban areas of the State.
Schools with demographic challenges were able to achieve success in part because they implemented the effective best practices that are used by all successful schools. Best practices include strong and stable leadership, an environment conducive to learning, an effective teaching staff, data analysis, curriculum alignment with Standards of Learning and pacing, differentiation of instruction, remediation, teamwork, and structure and intensity of the school day. These nine practices are shown on page VII with a brief description of each one.
For schools with challenges, these nine effective practices are more critical, and some of these practices need to be supplemented or used to a greater degree. Along with being the instructional leader for the school and setting the tone, principals in challenged schools must continually assess how they can fill the gap between the level of support provided by parents and the level of support needed for students to be successful. Principals who are successful have the ability to effectively assess this gap and are resourceful in filling it. Whether it requires buying alarm clocks for children who
V
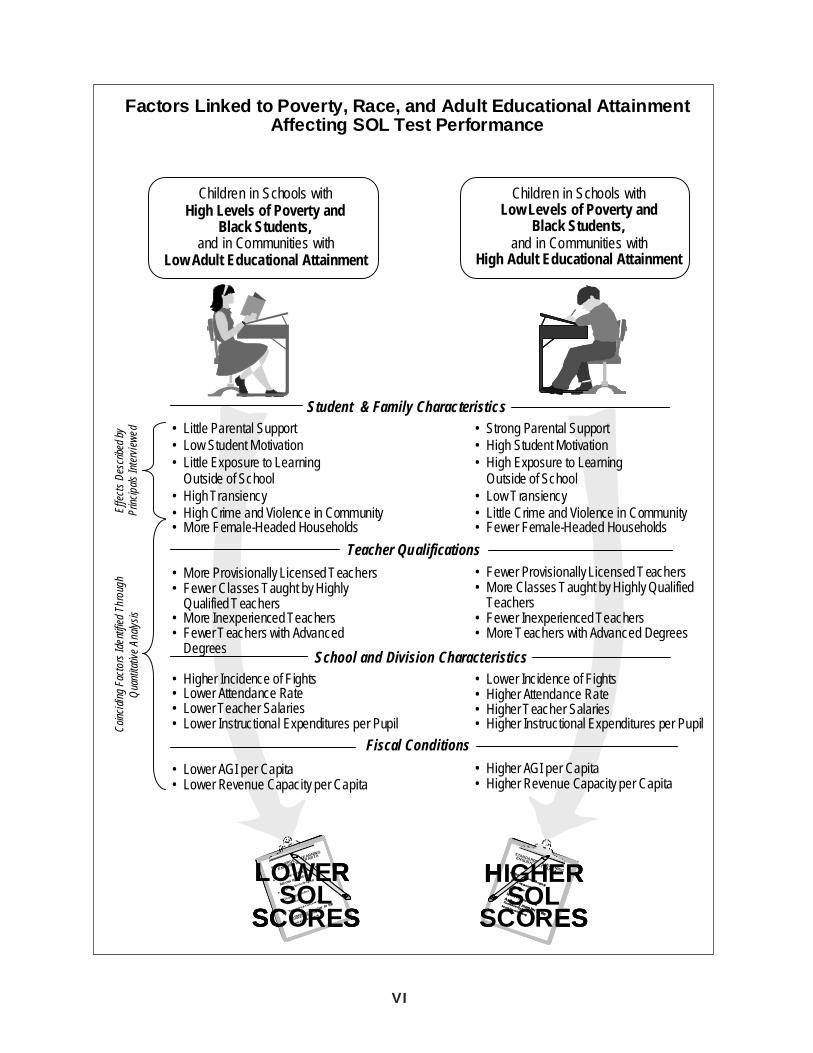
• Little Parental Support • Low Student Motivation • Little Exposure to Learning
Outside of School • High Transiency • High Crime and Violence in Community • More Female-Headed Households
Student & Family Characteristics
Children in Schools with High Levels of Poverty and
Black Students, and in Communities with
Low Adult Educational Attainment
• Strong Parental Support • High Student Motivation • High Exposure to Learning
Outside of School • Low T ransiency • Little Crime and Violence in Community • Fewer Female-Headed Households
• More Provisionally Licensed Teachers • Fewer Classes Taught by Highly
Qualified T eachers • More Inexperienced Teachers • Fewer T eachers with Advanced
Degrees
• Higher Incidence of Fights • Lower Attendance Rate • Lower Teacher Salaries • Lower Instructional Expenditures per Pupil
• Lower AGI per Capita • Lower Revenue Capacity per Capita
• Fewer Provisionally Licensed T eachers • More Classes T aught by Highly Qualified
Teachers • Fewer Inexperienced Teachers • More T eachers with Advanced Degrees
• Lower Incidence of Fights • Higher Attendance Rate • Higher T eacher Salaries • Higher Instructional Expenditures per Pupil
• Higher AGI per Capita • Higher Revenue Capacity per Capita
Teacher Qualifications
Fiscal Conditions
School and Division Characteristics
Children in Schools with Low Levels of Poverty and
Black Students, and in Communities with
High Adult Educational Attainment
Effe
cts
Des
crib
ed b
y Pr
inci
pals
Inte
rvie
wed
C
oinc
i di n
g Fa
ctor
s Id
entif
ied
Thro
ugh
Qua
ntita
tive
Ana
lysi
s
Fa ct or s L i n k e d t o Po v e r t y, R a c e , a n d A d ul t E d u c at i o n a l A t t a i n m e nt A f f ect i n g S O L T e st P e r f o r m a n c e
STANDARDS OF LEARNING
ENGLISH TESTPARTA
• Find the mistak e in the
foll owi ngs ent ence s:
• Appropria tionActla nguage
• Direct reques tofthe
Comm iss ion
•Spec ial re
que s tofGene ral
Assembly member to the
Comm iss ion(prim a rily
s pec ia linv es tigations)
SOL SC O R E S
LO W E R STANDARDS OF LEARNING
ENGLISH TESTPARTA• Appropria tionAc tlangua ge• Direct reques tofthe
Comm iss ion• Special re que stofGe neral
Assembly mem ber to the
Commiss ion(prim arily
specia linv estigations)
SO L SC O R ES
HI G H E RSTANDARDS OF LEARNING
ENGLISH TESTPARTA
• Find the mistak e in the
foll owi ngs ent ence s:
• Appropria tionActla nguage
• Direct reques tofthe
Comm iss ion
•Spec ial re que s tofGene ral
Assembly member to the
Comm iss ion(prim a rily
s pec ia linv es tigations)
SOLSCORES
LOWERSTANDARDS OF LEARNING
ENGLISH TESTPARTA• Appropria tionAc tlangua ge• Direct reques tofthe
Comm iss ion• Special re que stofGe neral
Assembly mem ber to the
Commiss ion(prim arily
specia linv estigations)
SOLSCORES
HIGHERSTANDARDS OF LEARNING
ENGLISH TESTPARTA
• Find the mistak e in the
foll owi ngs ent ence s:
• Appropria tionActla nguage
• Direct reques tofthe
Comm iss ion
•Spec ial re que s tofGene ral
Assembly member to the
Comm iss ion(prim a rily
s pec ia linv es tigations)
SOLSCORES
LOWERSTANDARDS OF LEARNING
ENGLISH TESTPARTA• Appropria tionAc tlangua ge• Direct reques tofthe
Comm iss ion• Special re que stofGe neral
Assembly mem ber to the
Commiss ion(prim arily
specia linv estigations)
• Appropria tionAc tlangua ge• Direct reques tofthe
Comm iss ion• Special re que stofGe neral
Assembly mem ber to the
Commiss ion(prim arily
specia linv estigations)
SOLSCORES
HIGHER
VI
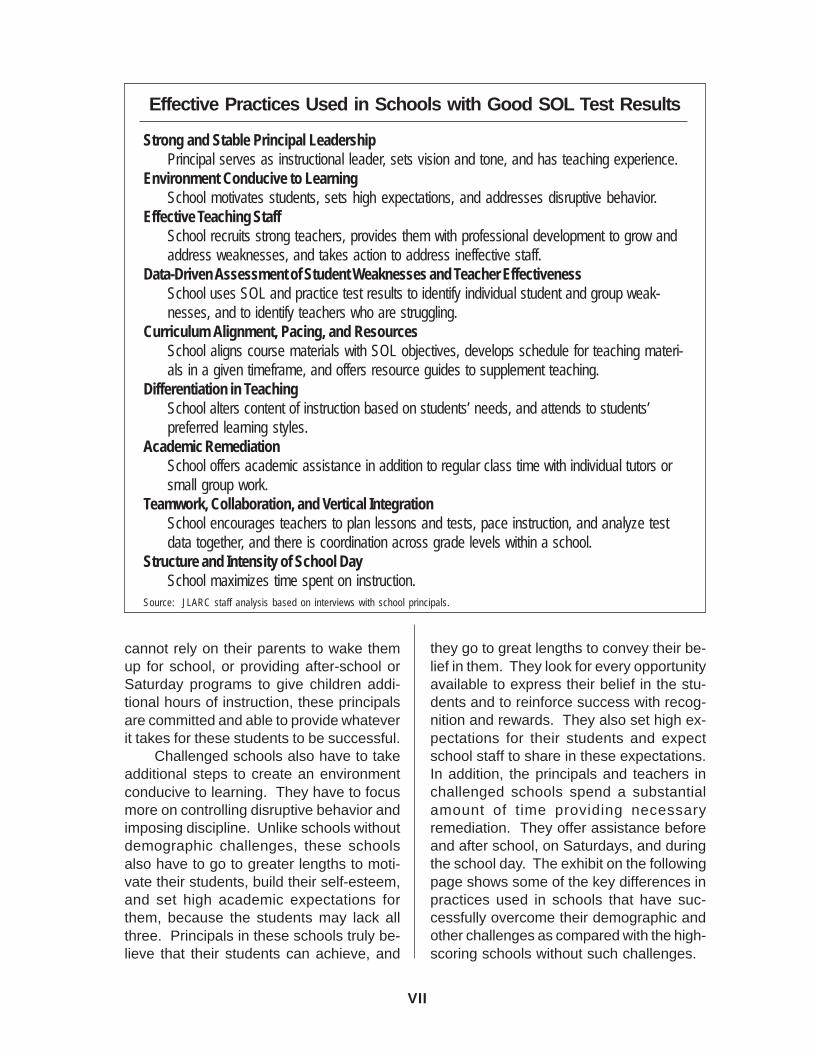
Effective Practices Used in Schools with Good SOL Test Results
Strong and Stable Principal Leadership Principal serves as instructional leader, sets vision and tone, and has teaching experience.
Environment Conducive to Learning School motivates students, sets high expectations, and addresses disruptive behavior.
Effective Teaching Staff School recruits strong teachers, provides them with professional development to grow and address weaknesses, and takes action to address ineffective staff.
Data-Driven Assessment of Student Weaknesses and Teacher Effectiveness School uses SOL and practice test results to identify individual student and group weaknesses, and to identify teachers who are struggling.
Curriculum Alignment, Pacing, and Resources School aligns course materials with SOL objectives, develops schedule for teaching materials in a given timeframe, and offers resource guides to supplement teaching.
Differentiation in Teaching School alters content of instruction based on students’ needs, and attends to students’ preferred learning styles.
Academic Remediation School offers academic assistance in addition to regular class time with individual tutors or small group work.
Teamwork, Collaboration, and Vertical Integration School encourages teachers to plan lessons and tests, pace instruction, and analyze test data together, and there is coordination across grade levels within a school.
Structure and Intensity of School Day School maximizes time spent on instruction.
Source: JLARC staff analysis based on interviews with school principals.
cannot rely on their parents to wake them up for school, or providing after-school or Saturday programs to give children additional hours of instruction, these principals are committed and able to provide whatever it takes for these students to be successful.
Challenged schools also have to take additional steps to create an environment conducive to learning. They have to focus more on controlling disruptive behavior and imposing discipline. Unlike schools without demographic challenges, these schools also have to go to greater lengths to motivate their students, build their self-esteem, and set high academic expectations for them, because the students may lack all three. Principals in these schools truly believe that their students can achieve, and
they go to great lengths to convey their belief in them. They look for every opportunity available to express their belief in the students and to reinforce success with recognition and rewards. They also set high expectations for their students and expect school staff to share in these expectations. In addition, the principals and teachers in challenged schools spend a substantial amount of time providing necessary remediation. They offer assistance before and after school, on Saturdays, and during the school day. The exhibit on the following page shows some of the key differences in practices used in schools that have successfully overcome their demographic and other challenges as compared with the high-scoring schools without such challenges.
VII
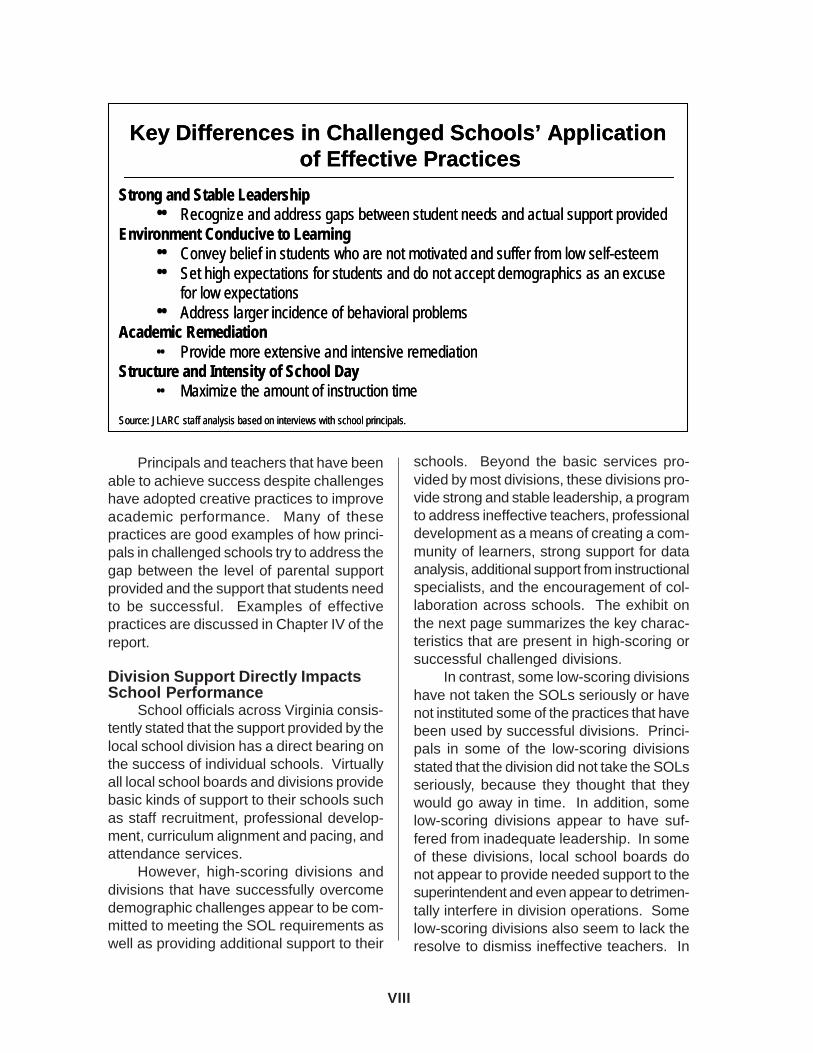
Key Differences in Challenged Schools’ ApplicationKey Differences in Challenged Schools’ Applicationof Effective Practicesof Effective Practices
Strong and Stable LeadershipStrong and Stable Leadership•• RReeccoogngniizzee anand ad addddrresesss gagapsps bebettwweeeenn ssttuuddeenntt neneededss aanndd acacttuuaall ssuuppppoorrtt pprrovoviidedded
Environment Conducive to LearningEnvironment Conducive to Learning•• CCoonnvveyey bebelliieeff inin ssttudeudentntss wwhhoo araree nnoott mmoottiivvaatteedd anandd ssuufffferer ffrromom lloow sw seellff--eesstteeeemm•• SSeett hhiighgh exexpepeccttatationionss ffoorr ssttuuddeennttss anand dod do nonott aacccceepptt ddeemmoogrgraapphhiiccss asas anan eexxccuussee
for low expectationsfor low expectations•• AAdddrdreessss lalarrggeerr inincciidedencncee ooff bebehahavviiororalal pprroboblemlemss
Academic RemediationAcademic Remediation•• PPrroovviidede mmoorree exextteennssiivvee andand iinntteennssiivvee rreemmeeddiiatatioionn
Structure and Intensity of School DayStructure and Intensity of School Day•• MMaxaxiimmiizzee tthhe ae ammouountnt ofof ininssttrruuccttiioon tn tiimmee
Source: JLARC staff analysis based on interviews with school principals.Source: JLARC staff analysis based on interviews with school principals.
Principals and teachers that have been able to achieve success despite challenges have adopted creative practices to improve academic performance. Many of these practices are good examples of how principals in challenged schools try to address the gap between the level of parental support provided and the support that students need to be successful. Examples of effective practices are discussed in Chapter IV of the report.
Division Support Directly Impacts School Performance
School officials across Virginia consistently stated that the support provided by the local school division has a direct bearing on the success of individual schools. Virtually all local school boards and divisions provide basic kinds of support to their schools such as staff recruitment, professional development, curriculum alignment and pacing, and attendance services.
However, high-scoring divisions and divisions that have successfully overcome demographic challenges appear to be committed to meeting the SOL requirements as well as providing additional support to their
schools. Beyond the basic services provided by most divisions, these divisions provide strong and stable leadership, a program to address ineffective teachers, professional development as a means of creating a community of learners, strong support for data analysis, additional support from instructional specialists, and the encouragement of collaboration across schools. The exhibit on the next page summarizes the key characteristics that are present in high-scoring or successful challenged divisions.
In contrast, some low-scoring divisions have not taken the SOLs seriously or have not instituted some of the practices that have been used by successful divisions. Principals in some of the low-scoring divisions stated that the division did not take the SOLs seriously, because they thought that they would go away in time. In addition, some low-scoring divisions appear to have suffered from inadequate leadership. In some of these divisions, local school boards do not appear to provide needed support to the superintendent and even appear to detrimentally interfere in division operations. Some low-scoring divisions also seem to lack the resolve to dismiss ineffective teachers. In
VIII
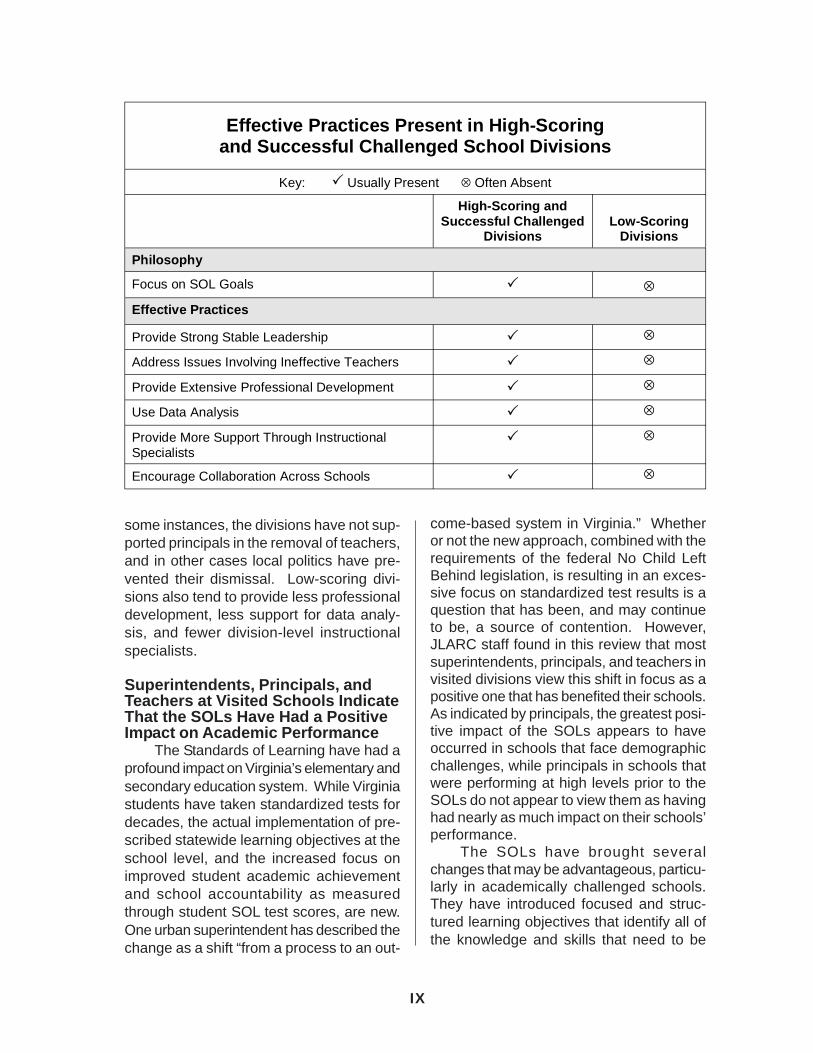
Effective Practices Present in High-Scoring and Successful Challenged School Divisions
Key: 3 Usually Present ⊗ Often Absent
High-Scoring and Successful Challenged
Divisions Low-Scoring
Divisions
Philosophy
Focus on SOL Goals 3 ⊗ Effective Practices
Provide Strong Stable Leadership 3 ⊗
Address Issues Involving Ineffective Teachers 3 ⊗
Provide Extensive Professional Development 3 ⊗
Use Data Analysis 3 ⊗
Provide More Support Through Instructional Specialists
3 ⊗
Encourage Collaboration Across Schools 3 ⊗
some instances, the divisions have not supported principals in the removal of teachers, and in other cases local politics have prevented their dismissal. Low-scoring divisions also tend to provide less professional development, less support for data analysis, and fewer division-level instructional specialists.
Superintendents, Principals, and Teachers at Visited Schools Indicate That the SOLs Have Had a Positive Impact on Academic Performance
The Standards of Learning have had a profound impact on Virginia’s elementary and secondary education system. While Virginia students have taken standardized tests for decades, the actual implementation of prescribed statewide learning objectives at the school level, and the increased focus on improved student academic achievement and school accountability as measured through student SOL test scores, are new. One urban superintendent has described the change as a shift “from a process to an out-
come-based system in Virginia.” Whether or not the new approach, combined with the requirements of the federal No Child Left Behind legislation, is resulting in an excessive focus on standardized test results is a question that has been, and may continue to be, a source of contention. However, JLARC staff found in this review that most superintendents, principals, and teachers in visited divisions view this shift in focus as a positive one that has benefited their schools. As indicated by principals, the greatest positive impact of the SOLs appears to have occurred in schools that face demographic challenges, while principals in schools that were performing at high levels prior to the SOLs do not appear to view them as having had nearly as much impact on their schools’ performance.
The SOLs have brought several changes that may be advantageous, particularly in academically challenged schools. They have introduced focused and structured learning objectives that identify all of the knowledge and skills that need to be
IX
taught. The SOLs have also created a new emphasis on using data analysis to identify school-wide, individual student, and teacher weaknesses. In addition, the SOLs have created an entirely new system of accountability. Superintendents and principals have indicated that the SOLs have been a useful tool for holding themselves as well as teachers accountable for effectively teaching the SOL educational objectives to their students. Additionally, the standards have encouraged greater collaboration among schools, between principals and teachers, and among teachers within schools, because these groups now have clearly defined goals that they are all trying to achieve. Finally, the SOLs are being used as a motivational tool for both students and teachers.
While most principals interviewed and teachers surveyed generally view the impact of the SOLs positively, there are varying viewpoints about their effectiveness and some concerns have been raised. Some of the concerns expressed by principals and teachers are that the SOLs reduce teaching creativity, reduce the opportunity for enrichment activities, create too much pressure for the students, and limit time available for teaching higher-level critical thinking skills.
Public Education Still Faces Several Challenges
While a number of schools have successfully overcome challenges, schools still face a number of challenges for the future. Out of about 1,800 schools, there remain 51 schools in the State that are accredited with warning and 294 that are classified as needing improvement as of this school year. Changes to the accreditation categories beginning with the results of the 2003-2004 school year may result in an increase in the number of schools accredited with warning. In addition, 2003-2004 is the first year in which unsatisfactory SOL test results will be used to potentially deny diplomas to students
who would otherwise qualify based on classes taken and grades received.
Other issues include graduation rates and dropout rates. An examination of State data over the last five years suggests that as many as one in four Virginia students may not have graduated from high school within four years. In some divisions, it appears that this may be 40 percent or more of the students.
Dropout rates may partially explain the low on-time graduation percentage. Almost 13 percent of the State’s ninth graders in 1998-1999 were reported as dropouts over the following four years. Several of the divisions with the lowest on-time graduation rates have high dropout rates.
Along with dropouts, student retentions may also partially explain the low on-time graduation percentage. Divisions with a low on-time graduation percentage tend to have high student retention rates and many overage students. About 13 percent of ninth grade students are retained statewide on average, but in three divisions with low on-time graduation rates, the ninth grade retention rate was greater than 20 percent in the 2001-2002 school year. The graduation, dropout, and retention rates raise issues that may warrant further study.
Finally, the federal No Child Left Behind requirements may affect performance as schools work to meet additional adequate-yearly-progress (AYP) requirements in addition to State SOL requirements. Unlike State accreditation standards, which are based on a set pass rate by school, AYP requirements focus on improvement in passing scores by school and by various sub-groups. As a result, it is possible that a school that meets the State’s pass rate requirements but does not improve from the previous year could meet State accreditation standards but not NCLB requirements. The appropriateness of some of the expectations and requirements of the NCLB Act has been subject to question, but at this time, the extent to which the Act may be modified is unclear.
X

XI
Page 1 Chapter I. Introduction
I. Introduction
Senate Joint Resolution 349 from the 2003 General Assembly Session directs the Joint Legislative Audit and Review Commission (JLARC) to examine best practices used by high-performing public schools in the Commonwealth. The review was directed based on the concern that although most elementary and secondary schools are meeting academic achievement goals, there remains a significant achievement gap between the best- and poorest-performing schools. Additionally, the study request was based on the recognition that some schools facing significant demographic, fiscal, or other challenges have overcome those challenges and achieved academic success, and the belief that poor-performing schools may be able to improve their performance by adopting the practices used in these successful schools.
The study resolution requests that JLARC examine the demographic factors that may explain differences in academic performance as well as the best practices that appear to be the key to academic success in the best-performing schools. It specifically directs JLARC to identify and examine: (i) those schools that have performed successfully in meeting the Standards of Accreditation and those that have achieved marked improvement in student and school performance, (ii) specific demographic and other factors that may influence academic success, (iii) practices and demographic information of the best-and poorest-performing school divisions, and (iv) successful practices in those high-performing school divisions with marked fiscal or other challenges. A copy of the resolution is attached in Appendix A.
Local decision-making substantially affects the operation of Virginia’s public schools and school divisions. However, public schools in Virginia operate within a constitutional and statutory framework that guides the educational decisions of localities and the State government. In recent years, the State has become increasingly involved with public school performance issues, and federal involvement has also been heightened with the passage of the No Child Left Behind Act. As part of the context for this review, this chapter describes the general framework for public education in Virginia, as well as recent State and federal activity related to academic performance. This chapter also addresses the research activities used in this review. Appendix B provides a glossary of terms and variables used in this report.
STATE STRUCTURE
The State and local governments play a critical role in public education. The Virginia Constitution establishes education as a fundamental right and provides for the State’s role in designing the Standards of Quality, known as the SOQ. Standard 1 of the SOQ requires the establishment of educational objectives, known as the Standards of Learning (SOL). The SOL test results have become Virginia’s primary performance measure of schools and students. In addition, Standard 3 of the SOQ provides that the State Board of Education is to prescribe requirements for school accreditation. These requirements are known as the Standards of Accredita
Page 2 Chapter I. Introduction
tion, or SOA. A key component of the SOA are the SOL educational objectives and testing program, which has become the primary basis for school accountability and accreditation. In addition to setting standards, the State also provides funding assistance to localities through the Standards of Quality funding formula and other funding activities, including special programs aimed to improve academic performance. The State and localities share responsibilities for governing education.
Constitutional and Statutory Framework
The Virginia Supreme Court has said that education is a fundamental right under the Virginia Constitution. Article I, section 15 of the Constitution states that:
free government rests, as does all progress, upon the broadest possible diffusion of knowledge, and that the Commonwealth should avail itself of these talents which nature has sown so liberally among its people by assuming the opportunity for their fullest development by an effective system of education throughout the Commonwealth.
The basic requirements for the State’s educational system are established in the Virginia Constitution. Article VIII, section 1 states: “The General Assembly shall provide for a system of free public elementary and secondary schools for all children of school age throughout the Commonwealth, and shall seek to ensure that an educational program of high quality is established and continually maintained.” The Constitution further states that “the General Assembly shall provide for the compulsory elementary and secondary education of every eligible child of appropriate age.” The Constitution also provides that standards of quality shall be determined.
Virginia’s Standards of Quality (SOQ) as adopted appear in the Code of Virginia in Title 22.1, chapter 13.2. The SOQ chapter addresses the responsibility of local school boards to provide the minimum programs and services required and the authority of the State Board to seek school division compliance with the SOQ.
The SOQ establish the foundation for the State’s role in elementary and secondary education. These standards are minimum requirements for school divisions in Virginia to provide a program of high quality for public elementary and secondary education. The SOQ include various quantified and non-quantified standards. One quantified standard includes instructional staff-to-pupil ratios at the classroom, school, and division level for basic education programs. In many other areas, however, such as support services, the standards are generally qualitative in nature. Under the State Constitution, the State Board prescribes these standards, subject to revision by the General Assembly.
The Standards of Learning (SOL) provide public schools with educational objectives, a standard curriculum, and a measurable set of outcome data for assessing student performance. The SOL are referred to in the first element of the SOQ, which states that the:
Page 3 Chapter I. Introduction
Board of Education shall establish educational objectives to implement the development of the skills that are necessary for success in school and for preparation for life in the years beyond. The current educational objectives [are] known as the Standards of Learning (Code of Virginia, Title 22.1-253.13:1).
The Standards of Accreditation (SOA) are referred to in the third standard of the SOQ, which states that the “Board of Education shall promulgate regulations establishing standards for accreditation…” The Standards of Learning are set forth in the third standard of the SOQ as a key component of the accreditation process, but the SOA include additional components, such as maximum ratios of pupils per staff member for certain types of school personnel.
Standards of Learning
While the Standards of Learning date back more than 20 years, only in the last several years have these standards been used as the basis for implementing a system of school accountability. Under the Standards of Accreditation, the accreditation of schools in Virginia is based primarily on SOL standards and student performance on SOL tests. These tests are designed to assess student comprehension and understanding of the skills and knowledge required to be taught based on the SOL.
History of the Standards of Learning. After the enactment of the Standards of Quality in 1972, the Commonwealth of Virginia began developing a basic skills curriculum and high school competency tests. This effort gained momentum during the 1970s, and the development of the SOL was first announced in 1980. At that time, the SOL were seen as an attempt to define the skills and knowledge that students were expected to acquire from kindergarten through high school. In addition, the SOL were expected to form the basis for student assessment in Virginia and to allow the Standards of Quality to be measured. The SOL were introduced through field tests and workshops during 1981 and 1982. At this point, no assessment tests were linked to the standards.
In 1988, new Standards of Quality were adopted that called for a performance indicator for public schools. The test instrument developed was the Literacy Passport Test, which measured basic reading, writing, and arithmetic skills. The test was designed for administration to all students in the sixth grade. Passing all three components of the test was required for promotion to the ninth grade.
In 1994, the Governor appointed a commission to develop revised Standards of Learning. The following year, the Board of Education met and approved revised SOL for every grade in mathematics, science, and language arts. The adoption of social studies standards was delayed because of concerns expressed about their proposed content.
Page 4 Chapter I. Introduction
After the introduction of the revised standards, the Board of Education began the development of an instrument to assess whether students were meeting the standards. During 1996, content review committees and a test development company created the assessment instruments. Then in April 1997, field tests of the new SOL exams were given to 350,000 students. The first official administration of the test was in the spring of 1998. After the tests had been administered and raw scores were received, eight standard-setting committees were established to develop recommended passing scores for the tests. Based on these recommendations, the Board then established passing scores for each test in the fall of 1998.
Along with the revision of the SOL, the other key aspect of the new accountability plan was the revision to the Standards of Accreditation. The revised SOA, which were adopted by the Board in the fall of 1997, created a new type of accountability for schools because it linked accreditation to SOL test performance.
Standards of Learning Structure. Standards of Learning have been developed for each grade from kindergarten through twelfth grade. The standards are intended to establish the minimum requirements for what needs to be taught and learned in each grade. Although there are standards established for each grade, students currently are formally tested on the SOL only in certain years. The SOL tests are administered to elementary school students in the third and fifth grades and to middle school students in the eighth grade. The SOL tests for these grades are divided into four core academic areas: English, mathematics, science, and history/social studies. High school students are required to take end-of-course SOL tests in certain high school subjects after they complete the coursework. The Standards of Accreditation as revised in 1997 have substantially elevated the importance of the SOL test results because school performance is now primarily based on SOL test performance, and graduation from high school is contingent upon passing at least six end-of-course SOL tests as of the 2003-2004 school year. The term “SOLs” is used in the remainder of this report to mean both the SOL learning objectives and the SOL tests.
Accreditation Requirements in Virginia
The Standards of Accreditation (SOA) outline specific requirements for schools and students in Virginia. Schools must meet specific SOL pass rate requirements in order to receive accreditation status. Schools that fail to meet these requirements may receive assistance from the State Department of Education through the academic review process or from the Governor’s Partnership for Achieving Successful Schools (PASS) initiative. The SOA also provide graduation requirements for students. Beginning in the 2003-2004 school year, students will be required to pass six SOL end-of-course tests in order to receive a standard diploma.
School Accreditation Requirements. SOL test performance has become the primary criterion for school accreditation. Accreditation is based on the achievement of specific school-wide pass rates on SOL tests in the four core subject areas: English, mathematics, science (except for third grade through 2002-2003), and his-tory/social science (except for third grade through 2002-2003). The Board established three phases for the implementation of the accreditation requirements. The
Page 5 Chapter I. Introduction
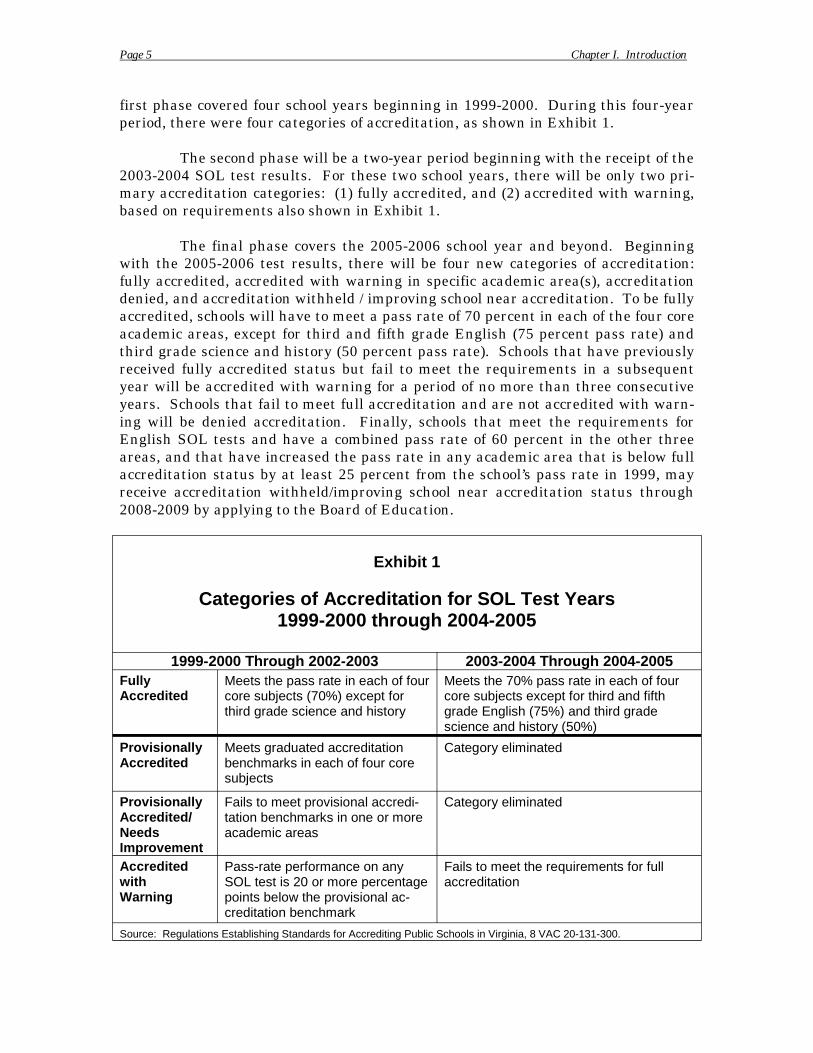
first phase covered four school years beginning in 1999-2000. During this four-year period, there were four categories of accreditation, as shown in Exhibit 1.
The second phase will be a two-year period beginning with the receipt of the 2003-2004 SOL test results. For these two school years, there will be only two primary accreditation categories: (1) fully accredited, and (2) accredited with warning, based on requirements also shown in Exhibit 1.
The final phase covers the 2005-2006 school year and beyond. Beginning with the 2005-2006 test results, there will be four new categories of accreditation: fully accredited, accredited with warning in specific academic area(s), accreditation denied, and accreditation withheld / improving school near accreditation. To be fully accredited, schools will have to meet a pass rate of 70 percent in each of the four core academic areas, except for third and fifth grade English (75 percent pass rate) and third grade science and history (50 percent pass rate). Schools that have previously received fully accredited status but fail to meet the requirements in a subsequent year will be accredited with warning for a period of no more than three consecutive years. Schools that fail to meet full accreditation and are not accredited with warning will be denied accreditation. Finally, schools that meet the requirements for English SOL tests and have a combined pass rate of 60 percent in the other three areas, and that have increased the pass rate in any academic area that is below full accreditation status by at least 25 percent from the school’s pass rate in 1999, may receive accreditation withheld/improving school near accreditation status through 2008-2009 by applying to the Board of Education.
Exhibit 1
Categories of Accreditation for SOL Test Years 1999-2000 through 2004-2005
1999-2000 Through 2002-2003 2003-2004 Through 2004-2005 Fully Accredited
Meets the pass rate in each of four core subjects (70%) except for third grade science and history
Meets the 70% pass rate in each of four core subjects except for third and fifth grade English (75%) and third grade science and history (50%)
Provisionally Accredited
Meets graduated accreditation benchmarks in each of four core subjects
Category eliminated
Provisionally Accredited/ Needs Improvement
Fails to meet provisional accreditation benchmarks in one or more academic areas
Category eliminated
Accredited with Warning
Pass-rate performance on any SOL test is 20 or more percentage points below the provisional accreditation benchmark
Fails to meet the requirements for full accreditation
Source: Regulations Establishing Standards for Accrediting Public Schools in Virginia, 8 VAC 20-131-300.
Page 6 Chapter I. Introduction
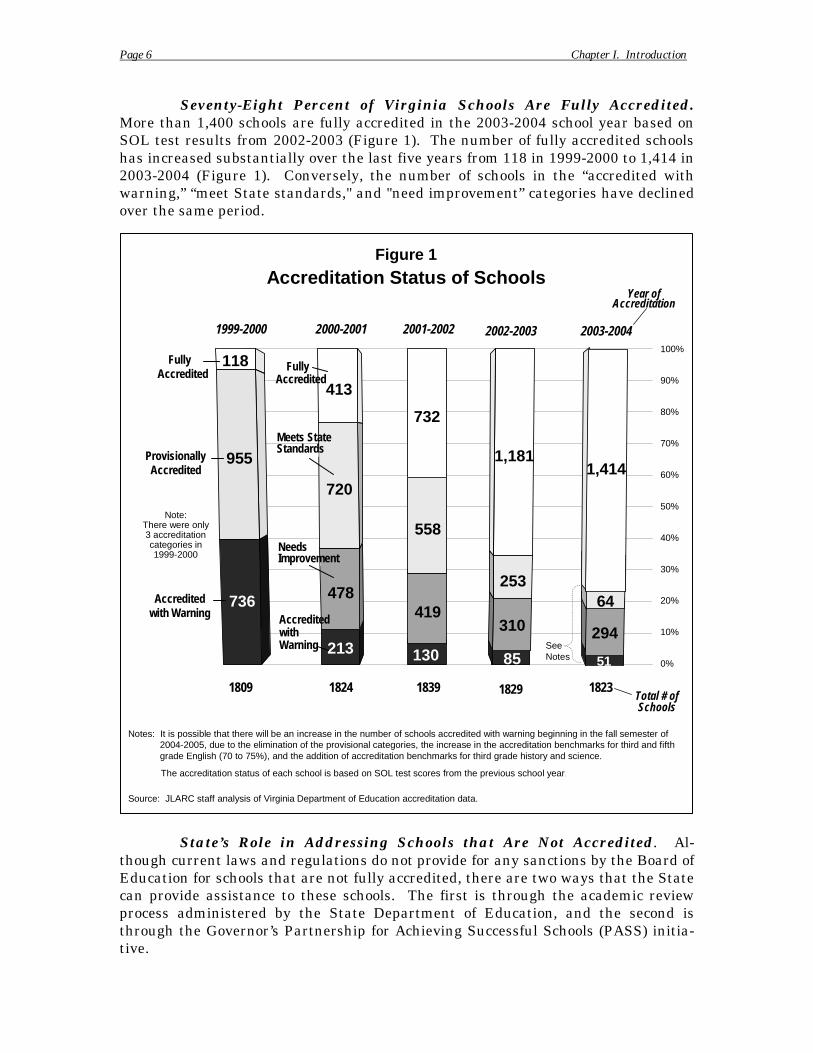
Seventy-Eight Percent of Virginia Schools Are Fully Accredited. More than 1,400 schools are fully accredited in the 2003-2004 school year based on SOL test results from 2002-2003 (Figure 1). The number of fully accredited schools has increased substantially over the last five years from 118 in 1999-2000 to 1,414 in 2003-2004 (Figure 1). Conversely, the number of schools in the “accredited with warning,” “meet State standards," and "need improvement” categories have declined over the same period.
736
118
213
478
720
413
130
419
558
732
0%
10%
20%
30%
40%
50%
60%
70%
80%
90%
100%
lly
Fully i
i i i i i
i ion
Year of i
85
310
253
l # of
wi
Fully i
i
i
ill i i i i i i i llimi isi i i i i i
i iti i i i i
i i i l .
51
294
64
See Notes
1999-2000 2000-2001 2001-2002 2002-2003
955
Figure 1
Accreditation Status of Schools
ProvisionaAccredited
Accred ted
Source: JLARC staff analys s of V rgin a Department of Education accred tat on data.
Note: There were only 3 accred tatcategories in 1999-2000
Accreditat on
1,181
1809 1824 1839 1829 TotaSchools
Accredited th Warning
Meets State Standards
Needs Improvement
Accred ted
Accred ted with Warn ng
Notes: It is possible that there w be an ncrease n the number of schools accred ted w th warn ng beg nning n the fa semester of 2004-2005, due to the el nation of the prov onal categor es, the ncrease n the accred tation benchmarks for third and f fth grade Engl sh (70 to 75%), and the add on of accred tat on benchmarks for th rd grade h story and science.
The accred tat on status of each school s based on SOL test scores from the previous schoo year
2003-2004
1,414
1823
State’s Role in Addressing Schools that Are Not Accredited. Although current laws and regulations do not provide for any sanctions by the Board of Education for schools that are not fully accredited, there are two ways that the State can provide assistance to these schools. The first is through the academic review process administered by the State Department of Education, and the second is through the Governor’s Partnership for Achieving Successful Schools (PASS) initiative.
Page 7 Chapter I. Introduction
According to the Virginia Administrative Code, schools that are accredited with warning are subject to academic review and monitoring by State DOE staff. In order to help them improve their accreditation status, these schools are also required to develop a three-year school improvement plan with the assistance of parents and teachers. In the improvement plan, schools must identify and develop specific measures for achieving academic improvement, remediation practices and strategies, staff development needs, strategies to involve parents, and a description of how local, State, and federal funds will be used to support the components of the plan. Under the No Child Left Behind (NCLB) Act, assistance is also to be provided to Title I schools that fail to meet annual benchmarks.
The academic review includes teams of educational experts that spend several days with the principal and faculty of schools that are accredited with warning identifying issues affecting student performance. Team members also observe classroom instruction and hold follow-up discussions with school staff to discuss their observations and findings. Follow-up visits are conducted with schools that continue to struggle.
In addition, schools that are accredited with warning are asked to participate in the Governor’s PASS initiative. Governor Warner established the PASS initiative in July 2002 to assist schools that were accredited with warning. The initiative has two major components. The first component uses intervention models to improve performance. The second component provides assistance in developing community and business support or partners for school success.
There are four intervention models used to help schools that are accredited with warning.
• Model I: Schools receive assistance through the academic review process.
• Model II: Schools that are classified as Pass Priority schools (schools that have a high percentage of students on free and reduced-price lunch and receive Title I federal assistance) receive assistance through the academic review process and instructional teams. Instructional teams include principals from other successful schools in Virginia who provide assistance in curriculum alignment and data analysis of SOL test scores.
• Model III: Schools receive assistance through the academic review process and a residential support team. The support team provides full-time assistance to specific PASS priority schools.
• Model IV: Divisions are provided support and assistance. A division-level coordinator helps to design and implement a division-wide plan to raise academic achievement. The Appalachian Educational Laboratory and the State DOE provide assistance in this model.
In the 2002-2003 school year 117 schools participated in Model I, 26 schools participated in Model II, four participated in Model III, and one division participated in Model IV.
Page 8 Chapter I. Introduction
In addition to these intervention models, the PASS initiative also includes assistance to schools in building community partnerships. Schools are paired with a partner from the business community, who recruits additional business and community organizations or “PASS Partners.” These partners provide financial and human capital resources.
Student Requirements. Along with school accountability requirements, the SOA also establish accountability requirements for individual students. Graduation from high school is now conditioned on passage of designated end-of-course SOL tests. Students are required to have 22 credits in order to receive a standard diploma. Beginning with the 2000-2001 ninth grade class (graduating class of 2004), six of these 22 credits must be verified credits. In order to receive verified credits, a student must take and pass an end-of-course SOL test. Of the six verified credits required to graduate, two verified credits must be in English and the remaining four credits may be in subjects of the student’s choosing. Beginning with the ninth grade class of 2003-2004 (graduating class of 2008) and beyond, each high school student must earn two verified credits in English, one each in math, science, and history, and one in a subject selected by the student. In order to receive an advanced diploma, a student must have 24 total credits, and nine of those must be verified through end-of-course SOL tests.
State Funding for Education
While the majority of funding for elementary and secondary education in Virginia is provided to help school divisions pay for SOQ costs that meet basic resource needs, there are some other State funds that are allocated specifically to improve academic performance. Many of these programs and funds are for the specific purpose of assisting high-poverty and other challenged schools in improving their performance.
In Virginia, State funding for education is generally divided into three major types of categories: Standards of Quality, incentive, and categorical funding. More than 80 percent of State funding for elementary and secondary education is used to fund the SOQ. These funds help to pay for the basic instructional programs in schools, instructional personnel, support services, and training and professional development.
The next largest category of funds is allocated for incentive-based programs. In FY 2003, the State spent $418 million on non-SOQ incentive-based programs, a decrease of approximately $72 million from FY 2001. Incentive programs are intended to target resources for specific educational needs. Many of these programs are designed to improve educational performance of some segment of the student population. These programs are not required by law. However, in order to receive State funds for incentive-based programs, school divisions must certify that they will offer the specific program, meet the requirements established for the program, and provide a local match of funds.
Page 9 Chapter I. Introduction
One of these programs is for Standards of Learning remediation. Funds are allocated to local school divisions to establish programs for students who are determined to require remediation based on their performance on the SOL assessments. The General Assembly allocated $15 million for this program in FY 2004. In addition to this program, the General Assembly also appropriated $8.3 million in FY 2004 for the purpose of providing math intervention services to students in sixth, seventh, eighth, and ninth grades who are at risk of failing the Algebra 1 SOL end-of-course test.
Another incentive-based program provides additional funds for students who are considered to be educationally at risk. These funds are disbursed based on the number of federal free and reduced-price lunch ("federal lunch") participants and must be used to support programs for at-risk students. The General Assembly appropriated $42.5 million for this program in FY 2004.
The General Assembly also funds an account to reduce primary class sizes. Funds from this account are designed as incentive payments to encourage schools to reduce class sizes in the primary grades. In order to be eligible to receive full funding, schools must have certain pupil-teacher ratios, depending on the percentage of students eligible for the federal lunch program. For example, in schools with between 16 and 29 percent of students eligible for the federal lunch program, the pu-pil-teacher ratio must be no higher than 20 to 1. In contrast, schools with 75 percent or more students eligible for the federal lunch program must have a ratio of 14 to 1. The amount appropriated for this program was $62.8 million for FY 2004.
In addition to these incentive-based programs, there are also categorical programs. These programs focus on special student populations and are typically required by State or federal law. Examples of categorical programs include special, adult, and vocational education programs.
Governance Structure for Education
The governance structure for education is described as a “cooperative venture” between the Commonwealth and localities. Under the present system, the State has the lead role in establishing overall policy and in providing financial and technical assistance. While the ultimate authority for public education in Virginia is vested in the General Assembly, Virginia’s educational system is administered and supervised by the Board of Education, the Department of Education (DOE), local school boards, and division superintendents.
Board of Education. The general supervision of public schools is vested in the State Board of Education. The Board consists of nine members, appointed by the Governor and confirmed by the General Assembly for four-year terms. The Board’s president is elected by its members for a two-year term. One of the Board’s primary roles is to develop the regulations that govern the school system, including the Standards of Accreditation and the standards for teacher and principal licensure. The Board is also responsible for developing the Standards of Learning and long-range planning for public education.
Page 10 Chapter I. Introduction
Department of Education. The other statewide entity with responsibility for education in Virginia is the Department of Education. The head of the department is the superintendent of public instruction, who is appointed by the governor. The department has multiple functions. For example, it has responsibility for implementing and monitoring the system of accreditation for public schools and for ensuring compliance with the Standards of Accreditation. In addition, DOE administers and oversees teacher licensure and education programs. The department also provides technical and professional support to school divisions regarding technology.
Local School Boards. The supervision of each school division is vested in a school board that is either appointed by the locality’s governing body, by a special selection commission, or elected by popular vote. The boards have primary authority to operate and maintain the schools. The Code of Virginia gives local school boards the authority to determine the coursework to be pursued and the methods of teaching and government to be employed in the schools. The school boards also have the authority to employ principals and assistant principals as well as teachers. In addition, the school boards have the authority to manage and control the federal, State, and local funds made available to the school divisions.
Division Superintendents. The superintendent of each school division is appointed by the local school board and has specific statutory duties and responsibilities. The superintendent is required to make recommendations to the school board for the employment of principals and the placement of teachers. The superintendent also has responsibility to provide recommendations for teacher discipline, and to participate in the employee grievance process. In addition, the superintendent prepares the division’s budget.
Teacher Requirements
In Virginia, there are several basic requirements that teachers must meet in order to be licensed to teach. Teachers must have a bachelor’s degree in a content area meeting endorsement requirements. In addition, teachers must pass the national teacher examination in reading, writing, and mathematics (Praxis I), and in a specified subject area (Praxis II). Teachers must also take 15 to 18 semester hours in specifically designated areas including curriculum and instructional procedures, foundations of education, and reading. Finally, teachers must have 300 hours of supervised classroom experience. Licenses must be renewed every five years, and teachers must meet specific professional development requirements in order to obtain license renewal.
Teachers who do not qualify for full licensure may be eligible for provisional or local licenses. A provisional license requires a teacher to have a baccalaureate degree and to satisfy the education requirements in one or more subject endorsement areas. A teacher may only teach with a provisional license for three years. The Code of Virginia also provides school divisions with the authority to issue local eligibility licenses. Like provisional license requirements, an individual must have a baccalaureate degree in order to be eligible for the local license. In addition, the
Page 11 Chapter I. Introduction
candidates must have training that the school board or superintendent deems appropriate for the subject area in which they will teach. A local license only qualifies an individual to teach in the school division that issues the license, and the license is valid for a maximum of three years.
FEDERAL ROLE IN PUBLIC EDUCATION
In recent decades, the federal government has played a substantial role in public education primarily through its requirements and guidelines in areas such as the provision of special education services. Federal funding support for public education, however, has not constituted a large portion of funding in most states. In Virginia, for example, annual federal funding from FY 1986 to FY 2000 typically accounted for about five to six percent of school division receipts.
The federal government has lately become more involved with public education and the issue of school performance. The recently established No Child Left Behind (NCLB) legislation creates several requirements that schools, school divisions, and states must meet. Schools and divisions are required to meet yearly progress indicators of performance and employ teachers and aides that are highly qualified. Federal funding has increased since the passage of NCLB. Federal funding in Virginia’s Appropriation Act for direct aid to public education, which was about $370 million per year from FY 1999 to FY 2002, totaled about $600 million in FY 2003 and FY 2004.
Federal Funding
The most significant federal program to address academic performance in schools is the Title I, Part A program. This program is the largest elementary and secondary education program and supplements State and local funding for low-achieving children, especially in high-poverty schools. The program finances additional academic support and learning opportunities to facilitate the progress of disadvantaged children. For example, Title I grants help to fund more individualized instruction, fundamental changes in schools to improve teaching and learning, and pre-school education.
In FY 2003, Congress allocated about $165 million to Virginia in Title I grants. The amount of Title I funds received by Virginia localities varies significantly based on differences in overall population and poverty levels. Title I grants are allocated to school divisions, who then allocate most of these funds to individual schools based on their proportion of economically deprived students. Schools with 50 percent or more of their students from low-income families are eligible to receive Title I funds for school-wide programs. Schools with less than 50 percent of students from low-income families are required to use Title I funds for targeted assistance to low-achieving students.
Another major federal program is the Reading First program. This program involves a comprehensive, nationwide effort to implement the findings of sci-entifically-based research on school reading instruction. The program also provides
Page 12 Chapter I. Introduction
funding to support activities in existing pre-school programs designed to enhance verbal skills.
In recent years, the federal government has also given a significant amount in the form of teacher quality grants. These grants provide states and school districts with a flexible source of funding to be used to strengthen the skills and knowledge of teachers and administrators so that they can improve student achievement in the core subject areas. These funds can be used for professional development and class size reduction. In addition, these funds can be used to recruit and retain teachers and principals, to provide merit pay, and to establish teacher mentoring programs. In FY 2002 the federal government allocated $48 million in teacher quality grants.
No Child Left Behind Legislation
In 2001, Congress enacted the No Child Left Behind (NCLB) Act. This act significantly increases the federal role in elementary and secondary education by establishing performance requirements and accountability, and by linking federal funds to school performance. The stated purpose of the act is “to close the achievement gap with accountability, flexibility, and choice, so that no child is left behind.” The ultimate goal is to establish a system in which 100 percent of children can meet high academic standards by the 2013-2014 school year. Two major components of the act are that states develop adequate yearly progress (AYP) accountability benchmarks toward the achievement of the ten-year goal for schools, divisions, and as a state, and that schools employ teachers and paraprofessionals who are highly qualified. These goals are in addition to the State’s SOL program.
However, under the legislation Virginia will be able to use the SOL system as the system of accountability to comply with NCLB. One modification that will be required involves the frequency at which the test will be administered. Currently, SOL tests are administered in grades three, five and eight, and after certain high school courses. NCLB requires that state tests also be administered in English and mathematics in grades four, six, and seven, and at least once in grades 10 through 12.
In addition to the SOL tests, Virginia will also increase the frequency of the National Assessment of Educational Progress (NAEP) test administration as required by NCLB. Virginia has been administering a test called the Stanford 9 and the NAEP to assess the academic progress of Virginia students relative to students nationwide. The State has dropped its requirement that divisions administer the Stanford 9 (although some divisions may continue to administer it by using local funds). However, with the enactment of the NCLB legislation, the NAEP test, which has been administered once every four years, will be required to be administered every other year. This test assesses reading, writing, mathematics, and science skills and is administered to a sample of students in the fourth and eighth grades.
Adequate Yearly Progress (AYP). One of the key requirements of NCLB is that annual progress be measured. Schools and divisions that meet annual objec
Page 13 Chapter I. Introduction
tives are considered to have met adequate yearly progress (AYP). States are required to set their own starting points and annual objectives in mathematics and reading to help reach the goal that 100 percent of students pass tests in reading and mathematics by 2014. In 2003, the State Board of Education set the initial pass rates in Virginia for reading at 60.7 percent and for mathematics at 58.4 percent. In addition to measuring progress in these two core areas, schools will also be measured based on graduation and attendance rates.
One of the significant requirements of NCLB is that annual academic progress be based on specific subgroups instead of the school as a whole. The subgroups for each school include students with disabilities, economically disadvantaged students, students with limited English proficiency, and racial or ethnic groups exceeding five percent of the total student population in the State. In Virginia there are three ethnic subgroups: black (non-Hispanic), white (non-Hispanic), and Hispanic.
Under NCLB, states are required to identify all schools that do not meet adequate yearly progress for two consecutive years in the same subject area. Title I schools are designated as Year One Title I School Improvement Status and must give students the choice to transfer to another school in the division for the following school year. Title I schools that do not make AYP for three consecutive years are designated as Year Two Title I School Improvement Status and must continue to provide students with the choice to transfer to another school as well as provide supplemental educational services to eligible students. These services are in addition to regular instruction provided during the school day. Priority for these services is required to be given to the lowest-performing students in the highest-poverty schools.
According to a preliminary State DOE status report on No Child Left Behind, 20 schools were identified as Year One Title I School Improvement Status for the 2003-2004 school year. In addition, 23 schools were identified as Year Two Title I Improvement Status. About 400 of the 19,030 students eligible to transfer exercised their choice option and transferred to another school. Another 1,300 out of 11,000 eligible students are expected to receive supplemental educational services.
Schools that are identified as needing improvement are expected to take corrective action to improve performance. In general, these schools are required to receive technical assistance that enables them to specifically address problems in academic achievement. Each of these schools is also required to develop a two-year school improvement plan. The plan is required to incorporate research-based strategies, set-aside ten percent of Title I funds for professional development, extend learning time, and have strategies to promote effective parental involvement and mentoring of new teachers. In the second year of school improvement status, a school must provide supplemental educational services to students from low-income families. After a school has been identified for a third year in school improvement status, it must take additional corrective action, which must include at least one of the following:
Page 14 Chapter I. Introduction
• Replace school staff responsible for continued failure to achieve adequate yearly progress,
• Implement a new curriculum based on scientific research,
• Significantly decrease management authority at the school level,
• Extend the school day or year,
• Appoint an outside expert to advise the school on progress toward achieving AYP, or
• Reorganize the school internally.
If a school continues to be in “needs improvement” status for four years, it is required to undergo major restructuring.
Highly Qualified Teachers and Paraprofessionals. Another major requirement of NCLB is that schools have highly qualified teachers in all core academic subjects by the end of the 2005-2006 year. In Virginia, “highly qualified” teachers are those who are fully licensed as teachers and who teach only in their area or areas of endorsement. In schools supported by Title I funds, new teachers hired beginning in the 2002-2003 school year must be “highly qualified” if they teach core academic subjects. These subjects include English, reading or language arts, mathematics, science, foreign language, civics and government, economics, arts, history, and geography. School districts are directed to use at least five percent of their Title I funds for professional development to help teachers become highly qualified. States are required to develop plans with annual measurable objectives to ensure that school divisions meet the 2005-2006 goal of having all highly qualified teachers. If a school division fails for two consecutive years to make progress toward meeting the annual objectives, then the division must develop an improvement plan.
In addition to teachers, NCLB establishes new requirements for paraprofessionals (teacher assistants). Paraprofessionals are employees who provide assistance in a program supported with Title I, Part A funds. All paraprofessionals hired after the date of enactment of NCLB must be “highly qualified.” Paraprofessionals hired before enactment must meet the “highly qualified” requirements within four years. Employees may establish that they are highly qualified through one of the following options: (1) completing two years of study at an institution of higher education, (2) obtaining an associate’s degree or higher, or (3) being able to demonstrate knowledge of and ability to assist in instructing reading, writing, or mathematics through a formal State or local academic assessment.
JLARC REVIEW
The JLARC review of education performance has involved the identification and examination of factors and practices that affect academic achievement in Virginia and best practices used by high-performing schools. Based on the study resolution, JLARC staff developed the following issues to be addressed:
Page 15 Chapter I. Introduction
• How should school performance be defined and measured, and what are the best- and poorest-performing schools based on identified measures?
• What quantifiable factors are most strongly associated with school performance?
• What other factors or practices at the classroom, school, or division level are related to school performance, and may distinguish the best- from the poor-est-performing schools and divisions?
• What practices do high-performing schools with marked challenges use to achieve success?
This study has examined these issues through a variety of research activities.
Research Activities
A number of research activities were undertaken to explore the study issues. These activities included: statistical analysis of factors that could have an impact on academic performance; structured interviews with DOE staff, division superintendents and school principals; school visits; a teacher survey; and a review of pertinent literature and documents.
Data Analysis. Several statistical techniques were employed to identify the factors strongly associated with trends in the academic performance of Virginia schools. JLARC staff first used correlation analysis to examine the relationships between multiple variables thought to be related to performance and SOL test scores. Regression analysis (using ordinary least squares) was then conducted to identify which factors have the strongest association with SOL test scores. Most of the data used for the analysis was from the 2001-2002 school year, because this was the most recent year for which data was consistently available. However, with the exception of teacher salary data, most of the teacher data used was from the 20022003 school year. In addition, the analysis was limited to conventional school data and did not include data from alternative, special education, charter, and Governor’s schools. Hierarchical Linear Modeling was also examined, as an alternative approach to the statistical analysis, and yielded results very similar to the ordinary least squares regression models.
Structured Interviews. Throughout the study, JLARC staff conducted numerous interviews with a variety of Department of Education and school officials. Interviews were conducted with 61 principals of high, middle, and elementary schools and superintendents of 11 divisions. The purpose of these interviews was to discuss the challenges to academic performance and the best practices used to achieve academic success in their schools. Interviews were also conducted with the President of the Board of Education, the Secretary of Education, and the Superintendent of Public Instruction. The purpose of these interviews was to discuss academic performance in Virginia schools and the role of the State in education.
School Visits. JLARC staff also visited the schools of the 61 principals interviewed. The purpose of the school visits was to gain a better understanding of the
Page 16 Chapter I. Introduction
environment in which students learn across the State. The schools visited were located in 35 divisions. Appendix C includes a map showing the divisions visited across the State.
Teacher Survey. Teachers in the first 56 of the 61 schools visited for this review were surveyed to supplement the input received from principals during interviews. (Time constraints meant that it was not feasible to administer the survey to teachers in the last five schools that were visited.) The survey requested that teachers provide input in the following areas: how academic achievement is influenced by student and school characteristics, and instructional practices; the sufficiency and quality of professional development received; the adequacy of financial resources in relation to academic achievement; and the impact of the SOLs. From the schools surveyed, 703 teachers in the four core subject areas responded to the survey.
Literature and Document Review. JLARC staff also conducted extensive literature and document reviews. Journal articles, studies, and education policy analyses were reviewed. In addition, federal and State laws and regulations affecting public education, as well as DOE policies and procedures, were examined.
Report Organization
This report is organized into five chapters. Chapter I provides background information on the Standards of Learning and other State and federal programs and regulations that affect public education. Chapter II provides a profile across Virginia public schools, including information on student and family demographics, teacher qualifications and experience, and school and division characteristics. These data help to provide a context for the profile data appearing in the third chapter on high-scoring and low-scoring schools and divisions.
Chapter III provides a quantitative analysis of the trends underlying academic performance across Virginia schools and discusses the factors found to be strongly associated with SOL test scores. The chapter also provides a profile of Virginia schools with the highest and lowest SOL test scores, and further illustrates the trends identified through the statistical analysis.
Chapter IV discusses how some schools with challenges that often result in lower SOL test scores have been able to overcome these challenges and achieve academic success through best practices. This chapter also discusses the role of school divisions in the instructional process.
Finally, Chapter V discusses the impact of the Standards of Learning on the educational process in Virginia schools. It also discusses the high number of students who may not graduate after four years of high school, as well as the high rates of dropouts and student retentions in some divisions. Possible explanations for these phenomena are presented in this chapter, as well as issues that may warrant further study. Finally, the chapter briefly discusses future issues the State will face with the continued requirements of the SOLs and the federal No Child Left Behind law.
Page 17 Chapter II. Background Information on Statewide SOL Test Scores and the Public School System
II. Background Information on Statewide SOL Test Scoresand the Public School System in Virginia
Student and family demographics, teacher qualifications and experience, and school and division characteristics all have the potential to influence academic success. This chapter illustrates the characteristics of typical Virginia schools and divisions, and provides a sense of the range of differences in these basic characteristics. These characteristics are shown as school or division averages, and are presented by division, as well as by each of the three conventional school types (elementary, middle, and high). Regional trends of certain characteristics are also highlighted. Chapter III of this report focuses on which of these factors may be associated with academic performance based on statistical trends.
Table 1 provides a summary profile across schools and divisions based on many of the characteristics discussed in more detail throughout this chapter. The data in this chapter help provide some context for Chapter III, which also offers summary profiles that describe and contrast the divisions in Virginia that have the highest and lowest SOL test scores.
SOL TEST SCORES, GRADUATES, AND DROPOUTS IN VIRGINIA PUBLIC SCHOOLS
This section provides a statewide summary of several performance measures and outcomes, including SOL scaled scores, the percentage of SOL tests passed by students, the number of graduates and dropouts as a percent of ninth grade enrollment four years prior, and the retention rates of schools in Virginia. SOL test scores are used throughout this report because they are the only standardized measure of academic achievement that is currently available across multiple grades and in all four core subject areas.
SOL scaled scores and pass rates are both measures that can be used to assess SOL test performance. On every SOL test, a student receives a score between 0 and 600, which is referred to as a scaled score. The percentage of students who score 400 or better on the SOL tests is referred to as the pass rate. A score of 400 to 499 is a proficient passing score, and 500 or above is an advanced passing score. A discussion of the JLARC staff methodology for calculating SOL test scores at the division and school level is located in Appendix D. The following sections discuss the findings of JLARC staff in more detail.
SOL Scaled Scores in Virginia
JLARC staff calculated a SOL mean (or average) scaled score for each of Virginia’s schools and divisions, and determined that the division average in 2001
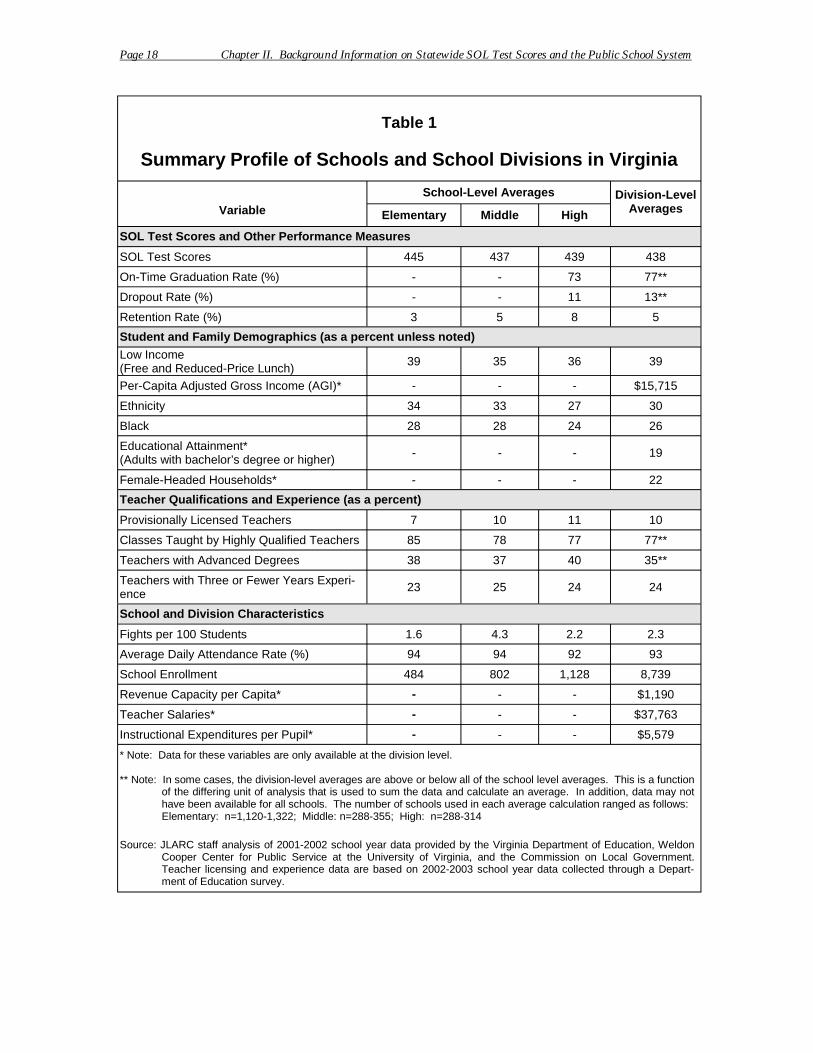
Page 18 Chapter II. Background Information on Statewide SOL Test Scores and the Public School System
Table 1
Summary Profile of Schools and School Divisions in Virginia
Variable
School-Level Averages Division-Level Averages Elementary Middle High
SOL Test Scores and Other Performance Measures
SOL Test Scores 445 437 439 438
On-Time Graduation Rate (%) - - 73 77**
Dropout Rate (%) - - 11 13**
Retention Rate (%) 3 5 8 5
Student and Family Demographics (as a percent unless noted)
Low Income (Free and Reduced-Price Lunch)
39 35 36 39
Per-Capita Adjusted Gross Income (AGI)* - - - $15,715
Ethnicity 34 33 27 30
Black 28 28 24 26
Educational Attainment* (Adults with bachelor’s degree or higher) - - - 19
Female-Headed Households* - - - 22
Teacher Qualifications and Experience (as a percent)
Provisionally Licensed Teachers 7 10 11 10
Classes Taught by Highly Qualified Teachers 85 78 77 77**
Teachers with Advanced Degrees 38 37 40 35**
Teachers with Three or Fewer Years Experience 23 25 24 24
School and Division Characteristics
Fights per 100 Students 1.6 4.3 2.2 2.3
Average Daily Attendance Rate (%) 94 94 92 93
School Enrollment 484 802 1,128 8,739
Revenue Capacity per Capita* - - - $1,190
Teacher Salaries* - - - $37,763
Instructional Expenditures per Pupil* - - - $5,579
* Note: Data for these variables are only available at the division level.
** Note: In some cases, the division-level averages are above or below all of the school level averages. This is a function of the differing unit of analysis that is used to sum the data and calculate an average. In addition, data may not have been available for all schools. The number of schools used in each average calculation ranged as follows: Elementary: n=1,120-1,322; Middle: n=288-355; High: n=288-314
Source: JLARC staff analysis of 2001-2002 school year data provided by the Virginia Department of Education, Weldon Cooper Center for Public Service at the University of Virginia, and the Commission on Local Government. Teacher licensing and experience data are based on 2002-2003 school year data collected through a Department of Education survey.
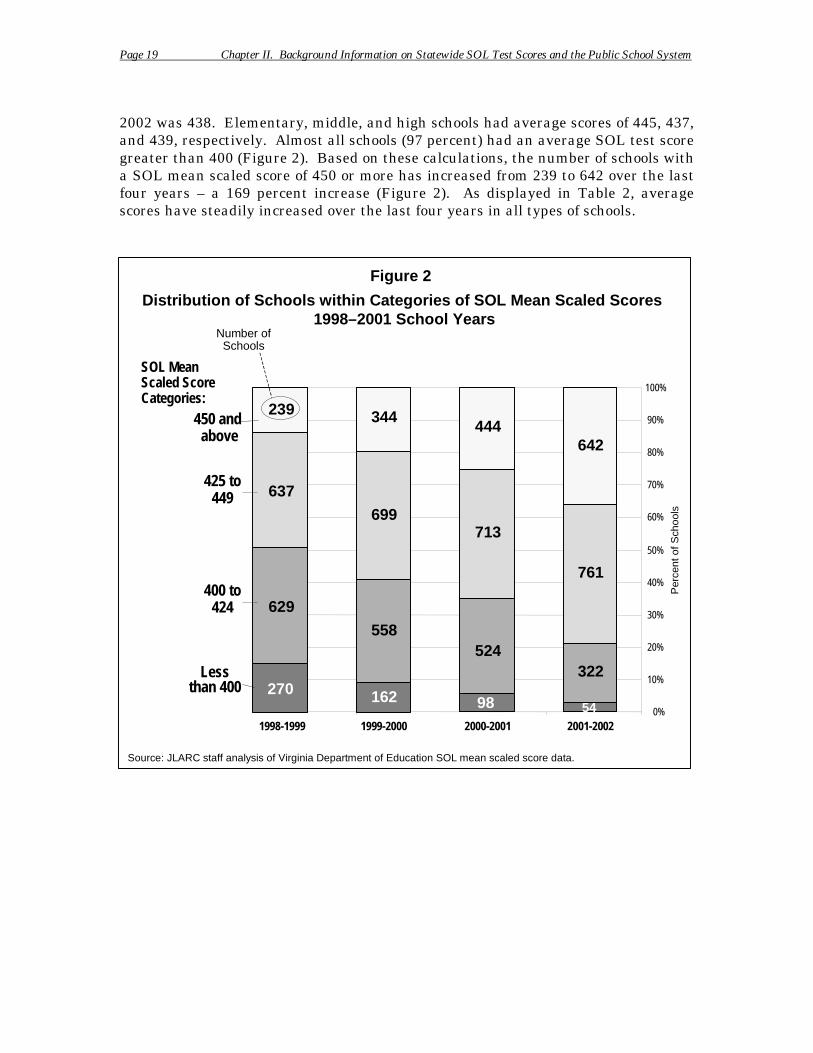
Page 19 Chapter II. Background Information on Statewide SOL Test Scores and the Public School System
2002 was 438. Elementary, middle, and high schools had average scores of 445, 437, and 439, respectively. Almost all schools (97 percent) had an average SOL test score greater than 400 (Figure 2). Based on these calculations, the number of schools with a SOL mean scaled score of 450 or more has increased from 239 to 642 over the last four years – a 169 percent increase (Figure 2). As displayed in Table 2, average scores have steadily increased over the last four years in all types of schools.
i l
0%
10%
20%
30%
40%
50%
60%
70%
80%
90%
Schools
344
642
699
761
558
322
162 98 54
Less than 400
424
449
450 and above
Figure 2
Distribution of Schools within Categories of SOL Mean Scaled Scores 1998–2001 School Years
Source: JLARC staff analys s of Virginia Department of Education SOL mean sca ed score data.
100%
1998-1999 1999-2000 2000-2001 2001-2002
Per
cent
of S
choo
ls
SOL Mean Scaled Score Categories:
Number of
239 444
637
713
629
524
270
400 to
425 to
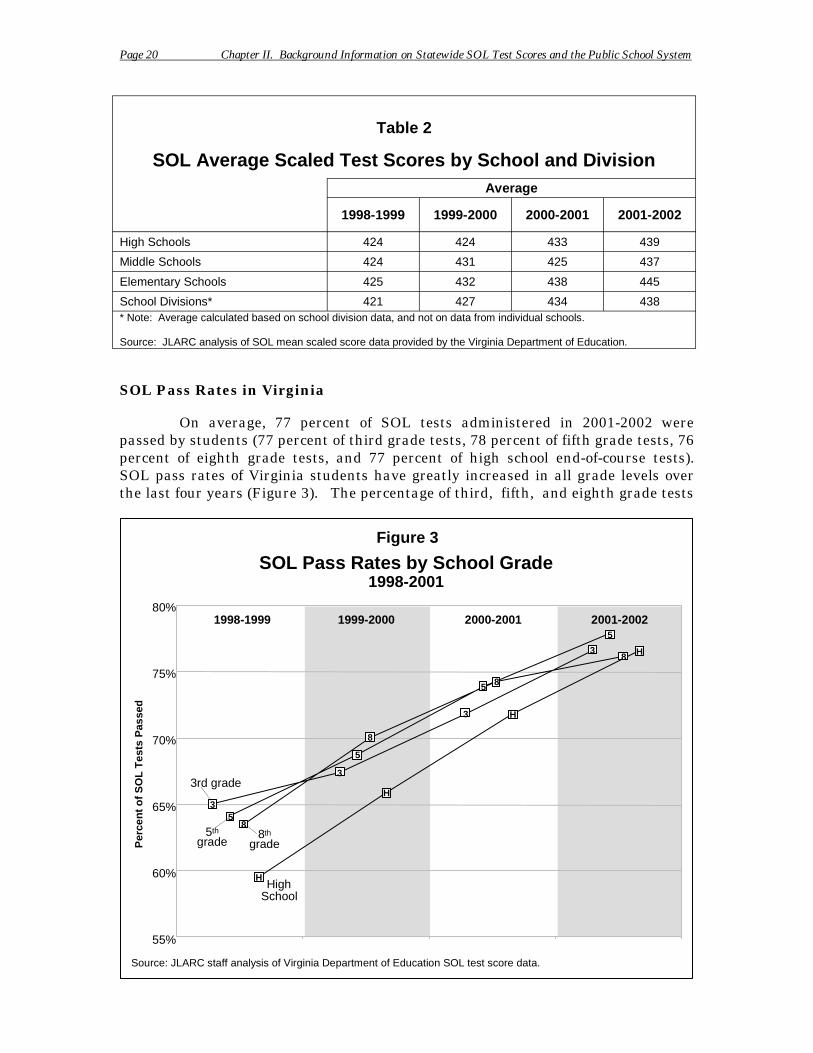
Page 20 Chapter II. Background Information on Statewide SOL Test Scores and the Public School System
Table 2
SOL Average Scaled Test Scores by School and Division Average
1998-1999 1999-2000 2000-2001 2001-2002
High Schools 424 424 433 439
Middle Schools 424 431 425 437
Elementary Schools 425 432 438 445
School Divisions* 421 427 434 438 * Note: Average calculated based on school division data, and not on data from individual schools.
Source: JLARC analysis of SOL mean scaled score data provided by the Virginia Department of Education.
SOL Pass Rates in Virginia
On average, 77 percent of SOL tests administered in 2001-2002 were passed by students (77 percent of third grade tests, 78 percent of fifth grade tests, 76 percent of eighth grade tests, and 77 percent of high school end-of-course tests). SOL pass rates of Virginia students have greatly increased in all grade levels over the last four years (Figure 3). The percentage of third, fifth, and eighth grade tests
i i
1998-2001
5th 8th
3
3
3
3
5
5
5
5
8
8
8
8
H
H
H
H
Source: JLARC staff analysis of V rginia Department of Educat on SOL test score data.
SOL Pass Rates by School Grade
Per
cen
t o
f S
OL
Tes
ts P
asse
d
55%
60%
65%
70%
75%
80%
3rd grade
grade grade
High School
1998-1999 1999-2000 2000-2001 2001-2002
Figure 3
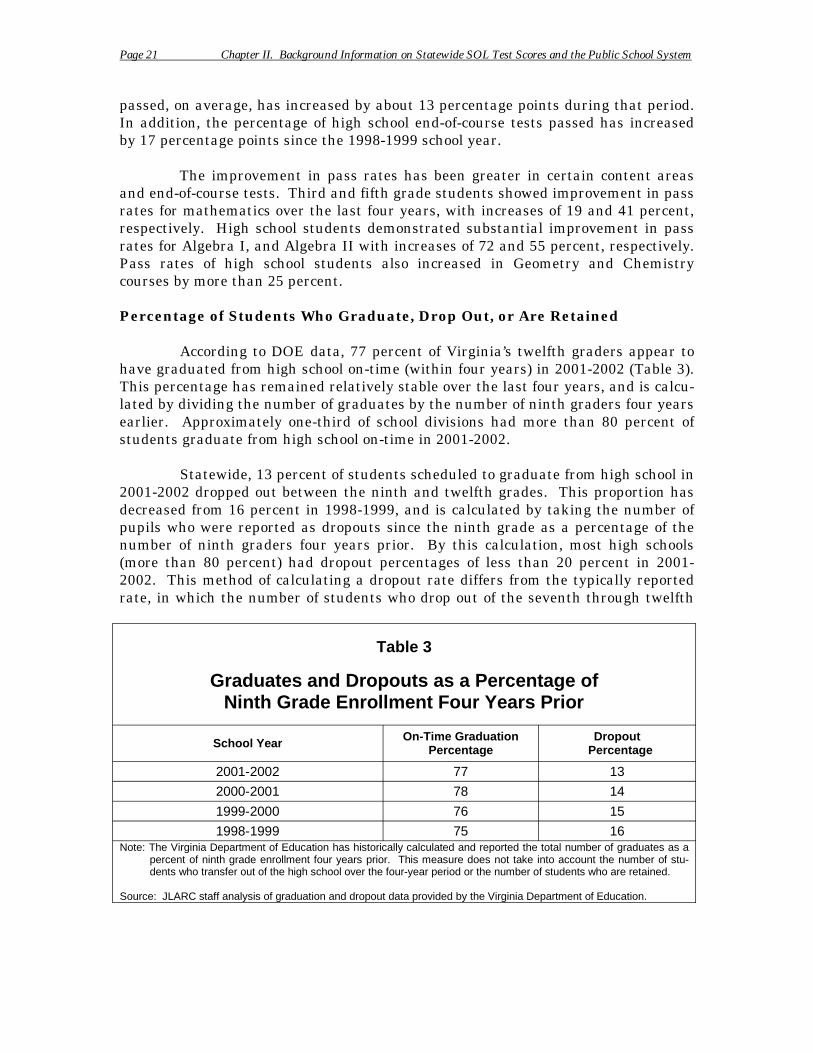
Page 21 Chapter II. Background Information on Statewide SOL Test Scores and the Public School System
passed, on average, has increased by about 13 percentage points during that period. In addition, the percentage of high school end-of-course tests passed has increased by 17 percentage points since the 1998-1999 school year.
The improvement in pass rates has been greater in certain content areas and end-of-course tests. Third and fifth grade students showed improvement in pass rates for mathematics over the last four years, with increases of 19 and 41 percent, respectively. High school students demonstrated substantial improvement in pass rates for Algebra I, and Algebra II with increases of 72 and 55 percent, respectively. Pass rates of high school students also increased in Geometry and Chemistry courses by more than 25 percent.
Percentage of Students Who Graduate, Drop Out, or Are Retained
According to DOE data, 77 percent of Virginia’s twelfth graders appear to have graduated from high school on-time (within four years) in 2001-2002 (Table 3). This percentage has remained relatively stable over the last four years, and is calculated by dividing the number of graduates by the number of ninth graders four years earlier. Approximately one-third of school divisions had more than 80 percent of students graduate from high school on-time in 2001-2002.
Statewide, 13 percent of students scheduled to graduate from high school in 2001-2002 dropped out between the ninth and twelfth grades. This proportion has decreased from 16 percent in 1998-1999, and is calculated by taking the number of pupils who were reported as dropouts since the ninth grade as a percentage of the number of ninth graders four years prior. By this calculation, most high schools (more than 80 percent) had dropout percentages of less than 20 percent in 20012002. This method of calculating a dropout rate differs from the typically reported rate, in which the number of students who drop out of the seventh through twelfth
Table 3
Graduates and Dropouts as a Percentage of Ninth Grade Enrollment Four Years Prior
School Year On-Time Graduation Percentage
Dropout Percentage
2001-2002 77 13
2000-2001 78 14
1999-2000 76 15
1998-1999 75 16 Note: The Virginia Department of Education has historically calculated and reported the total number of graduates as a
percent of ninth grade enrollment four years prior. This measure does not take into account the number of students who transfer out of the high school over the four-year period or the number of students who are retained.
Source: JLARC staff analysis of graduation and dropout data provided by the Virginia Department of Education.
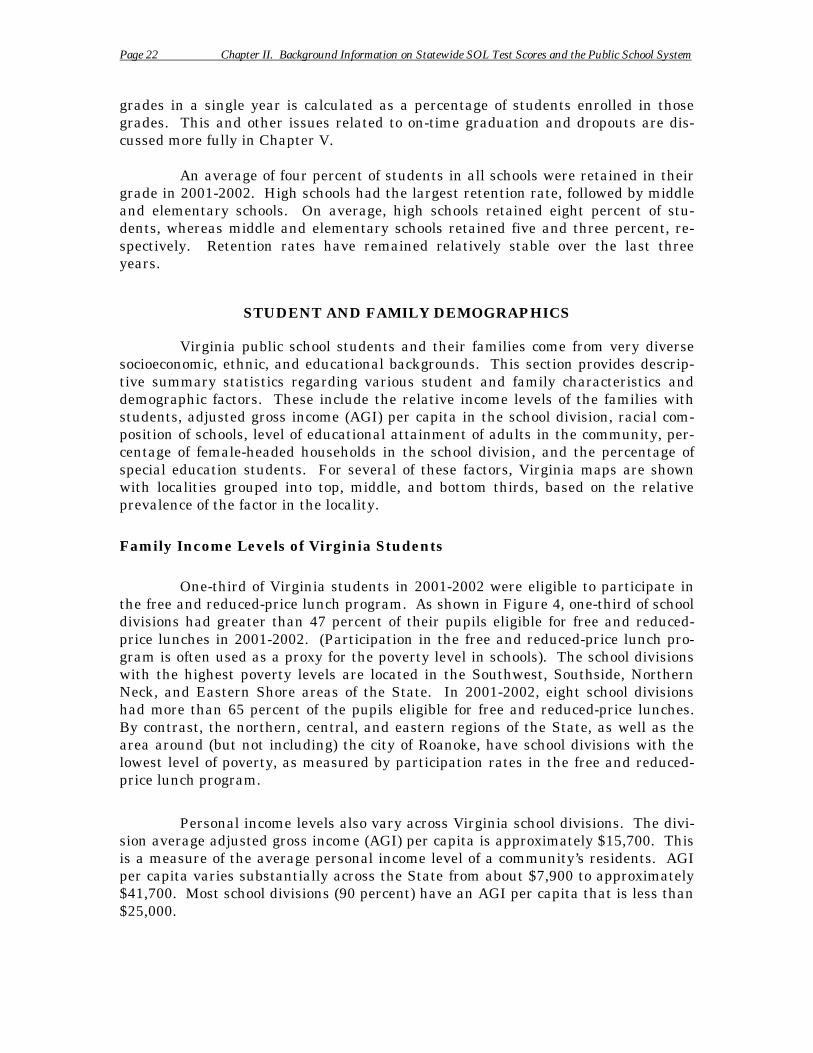
Page 22 Chapter II. Background Information on Statewide SOL Test Scores and the Public School System
grades in a single year is calculated as a percentage of students enrolled in those grades. This and other issues related to on-time graduation and dropouts are discussed more fully in Chapter V.
An average of four percent of students in all schools were retained in their grade in 2001-2002. High schools had the largest retention rate, followed by middle and elementary schools. On average, high schools retained eight percent of students, whereas middle and elementary schools retained five and three percent, respectively. Retention rates have remained relatively stable over the last three years.
STUDENT AND FAMILY DEMOGRAPHICS
Virginia public school students and their families come from very diverse socioeconomic, ethnic, and educational backgrounds. This section provides descriptive summary statistics regarding various student and family characteristics and demographic factors. These include the relative income levels of the families with students, adjusted gross income (AGI) per capita in the school division, racial composition of schools, level of educational attainment of adults in the community, percentage of female-headed households in the school division, and the percentage of special education students. For several of these factors, Virginia maps are shown with localities grouped into top, middle, and bottom thirds, based on the relative prevalence of the factor in the locality.
Family Income Levels of Virginia Students
One-third of Virginia students in 2001-2002 were eligible to participate in the free and reduced-price lunch program. As shown in Figure 4, one-third of school divisions had greater than 47 percent of their pupils eligible for free and reduced-price lunches in 2001-2002. (Participation in the free and reduced-price lunch program is often used as a proxy for the poverty level in schools). The school divisions with the highest poverty levels are located in the Southwest, Southside, Northern Neck, and Eastern Shore areas of the State. In 2001-2002, eight school divisions had more than 65 percent of the pupils eligible for free and reduced-price lunches. By contrast, the northern, central, and eastern regions of the State, as well as the area around (but not including) the city of Roanoke, have school divisions with the lowest level of poverty, as measured by participation rates in the free and reduced-price lunch program.
Personal income levels also vary across Virginia school divisions. The division average adjusted gross income (AGI) per capita is approximately $15,700. This is a measure of the average personal income level of a community’s residents. AGI per capita varies substantially across the State from about $7,900 to approximately $41,700. Most school divisions (90 percent) have an AGI per capita that is less than $25,000.
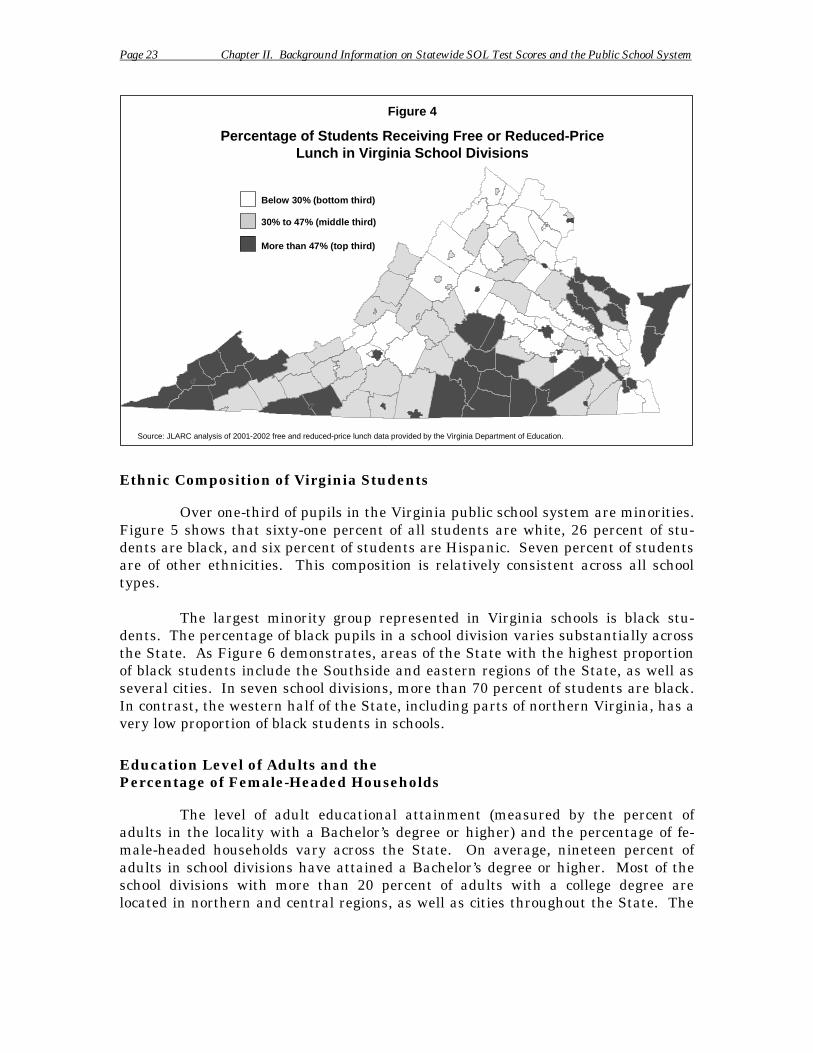
Page 23 Chapter II. Background Information on Statewide SOL Test Scores and the Public School System
i l i i ini ion.
Figure 4
Percentage of Students Receiving Free or Reduced-Price Lunch in Virginia School Divisions
Below 30% (bottom third)
30% to 47% (middle third)
More than 47% (top third)
Source: JLARC analys s of 2001-2002 free and reduced-price unch data prov ded by the V rg a Department of Educat
Ethnic Composition of Virginia Students
Over one-third of pupils in the Virginia public school system are minorities. Figure 5 shows that sixty-one percent of all students are white, 26 percent of students are black, and six percent of students are Hispanic. Seven percent of students are of other ethnicities. This composition is relatively consistent across all school types.
The largest minority group represented in Virginia schools is black students. The percentage of black pupils in a school division varies substantially across the State. As Figure 6 demonstrates, areas of the State with the highest proportion of black students include the Southside and eastern regions of the State, as well as several cities. In seven school divisions, more than 70 percent of students are black. In contrast, the western half of the State, including parts of northern Virginia, has a very low proportion of black students in schools.
Education Level of Adults and the Percentage of Female-Headed Households
The level of adult educational attainment (measured by the percent of adults in the locality with a Bachelor’s degree or higher) and the percentage of fe-male-headed households vary across the State. On average, nineteen percent of adults in school divisions have attained a Bachelor’s degree or higher. Most of the school divisions with more than 20 percent of adults with a college degree are located in northern and central regions, as well as cities throughout the State. The
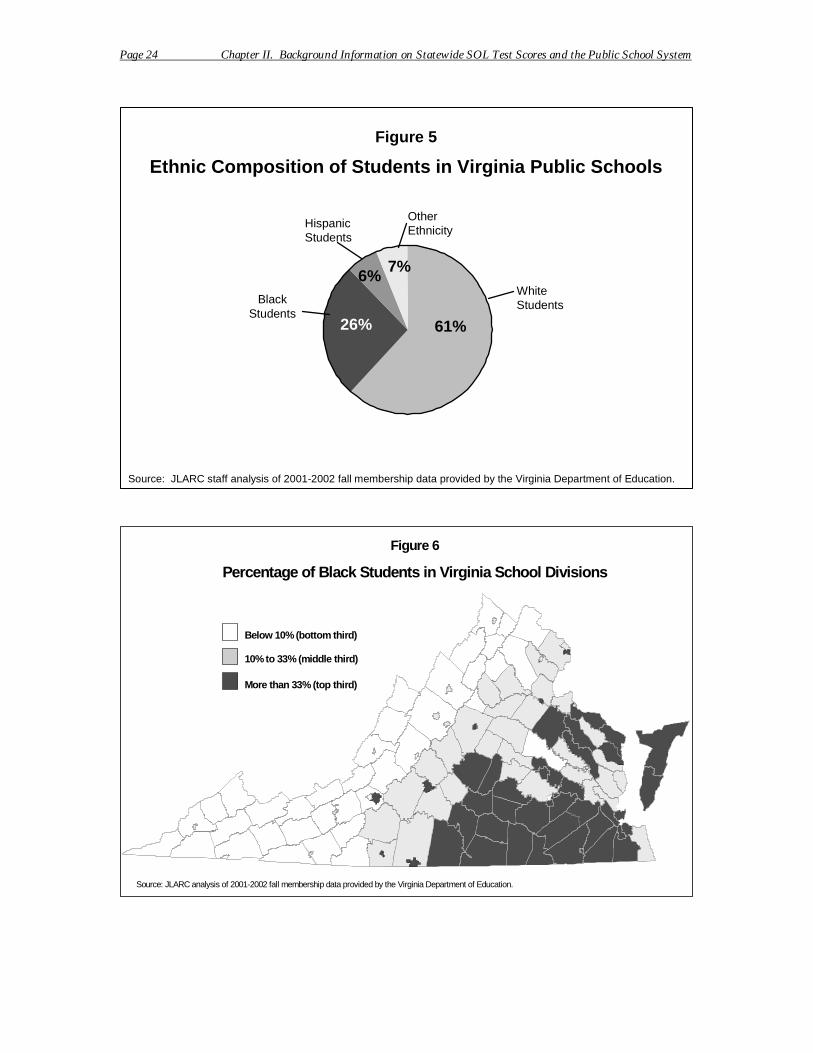
Page 24 Chapter II. Background Information on Statewide SOL Test Scores and the Public School System
Figure 5
Ethnic Composition of Students in Virginia Public Schools
7%6%
Whi
61% 26%
te Students Black
Students
Hispanic Students
Other Ethnicity
Source: JLARC staff analysis of 2001-2002 fall membership data provided by the Virginia Department of Education.
(
)
l ll i i ini ion.
Figure 6
Percentage of Black Students in Virginia School Divisions
Below 10% bottom third)
10% to 33% (middle third)
More than 33% (top third
Source: JLARC anaysis of 2001-2002 fa membership data prov ded by the V rg a Department of Educat
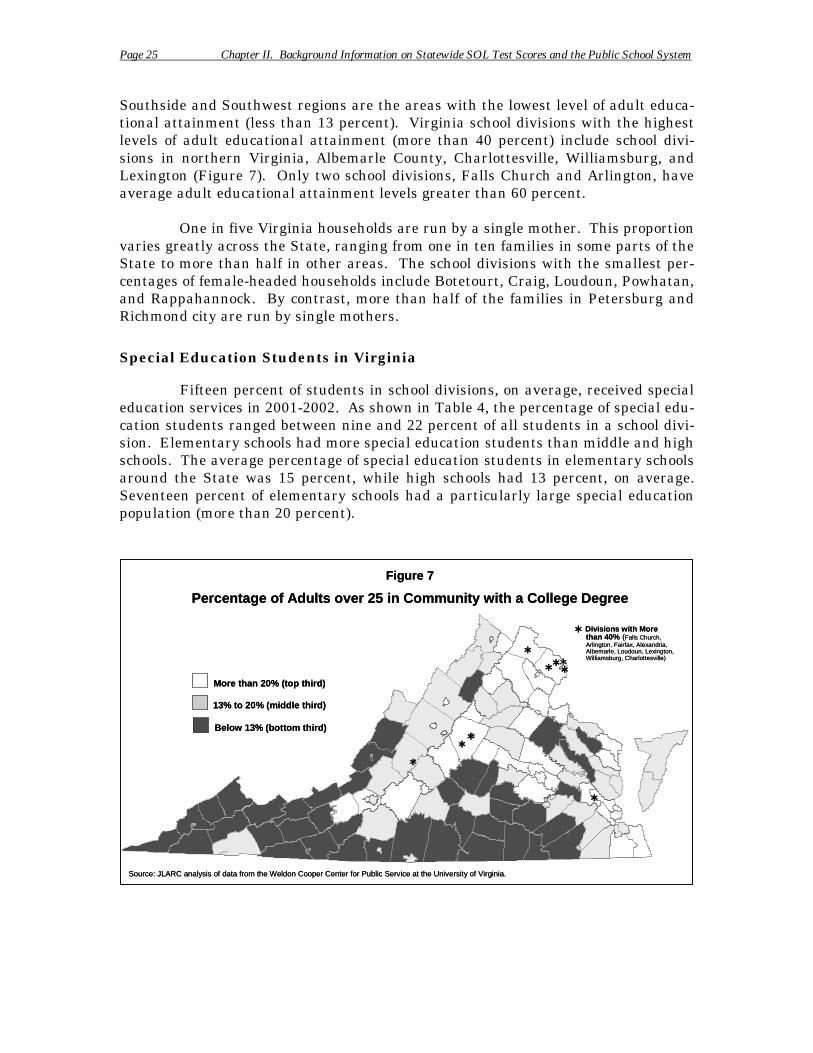
Page 25 Chapter II. Background Information on Statewide SOL Test Scores and the Public School System
Southside and Southwest regions are the areas with the lowest level of adult educational attainment (less than 13 percent). Virginia school divisions with the highest levels of adult educational attainment (more than 40 percent) include school divisions in northern Virginia, Albemarle County, Charlottesville, Williamsburg, and Lexington (Figure 7). Only two school divisions, Falls Church and Arlington, have average adult educational attainment levels greater than 60 percent.
One in five Virginia households are run by a single mother. This proportion varies greatly across the State, ranging from one in ten families in some parts of the State to more than half in other areas. The school divisions with the smallest percentages of female-headed households include Botetourt, Craig, Loudoun, Powhatan, and Rappahannock. By contrast, more than half of the families in Petersburg and Richmond city are run by single mothers.
Special Education Students in Virginia
Fifteen percent of students in school divisions, on average, received special education services in 2001-2002. As shown in Table 4, the percentage of special education students ranged between nine and 22 percent of all students in a school division. Elementary schools had more special education students than middle and high schools. The average percentage of special education students in elementary schools around the State was 15 percent, while high schools had 13 percent, on average. Seventeen percent of elementary schools had a particularly large special education population (more than 20 percent).
Figure 7
Percentage of Adults over 25 in Community with a College Degree
Below 13% (bottom third)
13% to 20% (middle third)
More than 20% (top third)
¾ than 40% (Falls Church, Arlington, Fairfax, Alexandria, Albemarle, Loudoun, Lexington, Williamsburg, Charlottesville)
¾ ¾ ¾¾
¾
¾ ¾
¾
¾
Source: JLARC analysis of data from the Weldon Cooper Center for Public Service at the University of Virginia.
Divisions with More
Figure 7
Percentage of Adults over 25 in Community with a College Degree
Below 13% (bottom third)
13% to 20% (middle third)
More than 20% (top third)
¾than 40% (Falls Church,Arlington, Fairfax, Alexandria,Albemarle, Loudoun, Lexington,Williamsburg, Charlottesville)
¾¾¾¾
¾
¾¾
¾
¾
Source: JLARC analysis of data from the Weldon Cooper Center for Public Service at the University of Virginia.
Divisions with More

Page 26 Chapter II. Background Information on Statewide SOL Test Scores and the Public School System
Table 4
Percentage of Special Education Students in Virginia Schools and Divisions (2001-2002)
(as a percentage)
Average Minimum Maximum High Schools 13 2 26 Middle Schools 14 0 32 Elementary Schools 15 0 44 School Divisions* 15 9 22 * Note: Average calculated based on school division data, and not on data from individual schools.
Source: Special education data provided by the Virginia Department of Education.
TEACHER CHARACTERISTICS
This section provides descriptive statistics regarding the qualifications, experience levels, and other characteristics of teachers in the State. These include the following: percentage of teachers with a provisional license, percentage of classes taught by highly qualified teachers, percentage of teachers with an advanced degree, percentage of teachers with three or fewer years of teaching experience, and total years of teaching experience. While the vast majority of teachers are qualified and have experience, a substantial number of teachers are provisionally licensed, or have taught for three or fewer years.
Qualifications of Teachers in Virginia Schools
The Department of Education collects data on three variables that measure teacher qualifications: percentage of teachers with a provisional license, percentage of classes taught by “highly qualified” teachers, and percentage of teachers with an advanced degree. This section provides statewide summary data regarding each of these three variables.
Percentage of Teachers with a Provisional License. In 2002-2003, ten percent of teachers in school divisions, on average, held a provisional license. Table 5 illustrates that elementary schools had a lower average percentage of teachers without a full license (seven percent) than middle or high schools. The majority of schools in Virginia had less than ten percent of teachers with a provisional license.
In Figure 8, divisions are placed in one of three groups, depending upon the percentage of teachers with a provisional license. The school divisions with a high percentage of provisionally licensed teachers (more than 11 percent) are located throughout the State. Most of the school divisions with a low percentage of provisionally licensed teachers are located in the western half of the State. In five school divisions, more than 25 percent of teachers do not have a full license. These divisions are: Brunswick County, King and Queen County, Petersburg City, Sussex County, and Westmoreland County.
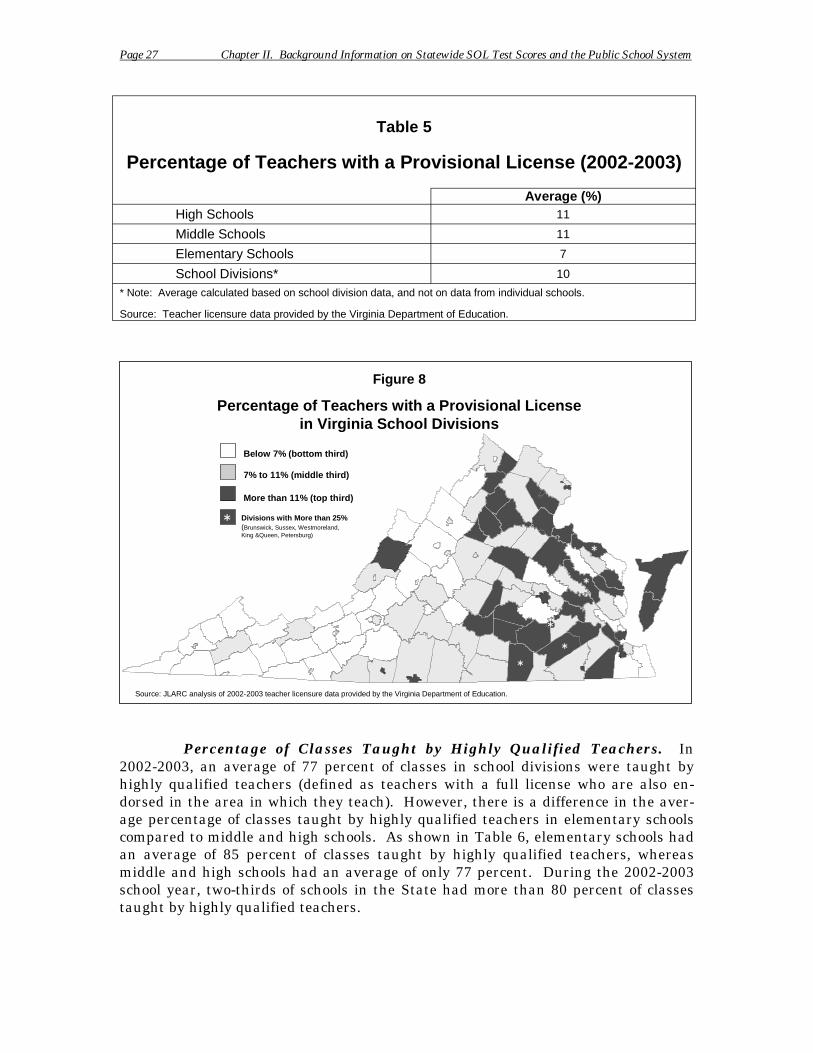
Page 27 Chapter II. Background Information on Statewide SOL Test Scores and the Public School System
Table 5
Percentage of Teachers with a Provisional License (2002-2003)
Average (%) High Schools 11
Middle Schools 11
Elementary Schools 7
School Divisions* 10
* Note: Average calculated based on school division data, and not on data from individual schools.
Source: Teacher licensure data provided by the Virginia Department of Education.
Figure 8
Percentage of Teachers with a Provisional License in Virginia School Divisions
¾ ( i lKi
¾
¾
¾
¾
¾
Below 7% (bottom third)
7% to 11% (middle third)
More than 11% (top third)
Divisions with More than 25% Brunsw ck, Sussex, Westmore and, ng &Queen, Petersburg)
Source: JLARC analysis of 2002-2003 teacher licensure data provided by the Virginia Department of Education.
Percentage of Classes Taught by Highly Qualified Teachers. In 2002-2003, an average of 77 percent of classes in school divisions were taught by highly qualified teachers (defined as teachers with a full license who are also endorsed in the area in which they teach). However, there is a difference in the average percentage of classes taught by highly qualified teachers in elementary schools compared to middle and high schools. As shown in Table 6, elementary schools had an average of 85 percent of classes taught by highly qualified teachers, whereas middle and high schools had an average of only 77 percent. During the 2002-2003 school year, two-thirds of schools in the State had more than 80 percent of classes taught by highly qualified teachers.
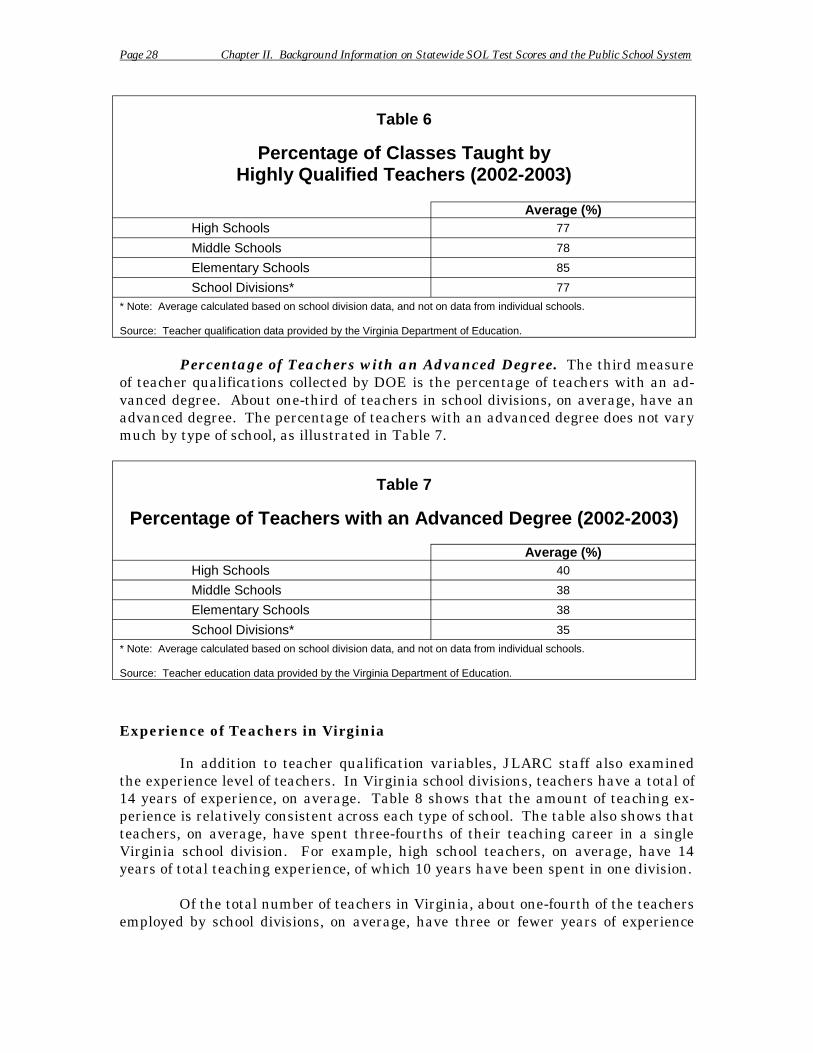
Page 28 Chapter II. Background Information on Statewide SOL Test Scores and the Public School System
Table 6
Percentage of Classes Taught by Highly Qualified Teachers (2002-2003)
Average (%) High Schools 77
Middle Schools 78
Elementary Schools 85
School Divisions* 77
* Note: Average calculated based on school division data, and not on data from individual schools.
Source: Teacher qualification data provided by the Virginia Department of Education.
Percentage of Teachers with an Advanced Degree. The third measure of teacher qualifications collected by DOE is the percentage of teachers with an advanced degree. About one-third of teachers in school divisions, on average, have an advanced degree. The percentage of teachers with an advanced degree does not vary much by type of school, as illustrated in Table 7.
Table 7
Percentage of Teachers with an Advanced Degree (2002-2003)
Average (%) High Schools 40
Middle Schools 38
Elementary Schools 38
School Divisions* 35
* Note: Average calculated based on school division data, and not on data from individual schools.
Source: Teacher education data provided by the Virginia Department of Education.
Experience of Teachers in Virginia
In addition to teacher qualification variables, JLARC staff also examined the experience level of teachers. In Virginia school divisions, teachers have a total of 14 years of experience, on average. Table 8 shows that the amount of teaching experience is relatively consistent across each type of school. The table also shows that teachers, on average, have spent three-fourths of their teaching career in a single Virginia school division. For example, high school teachers, on average, have 14 years of total teaching experience, of which 10 years have been spent in one division.
Of the total number of teachers in Virginia, about one-fourth of the teachers employed by school divisions, on average, have three or fewer years of experience
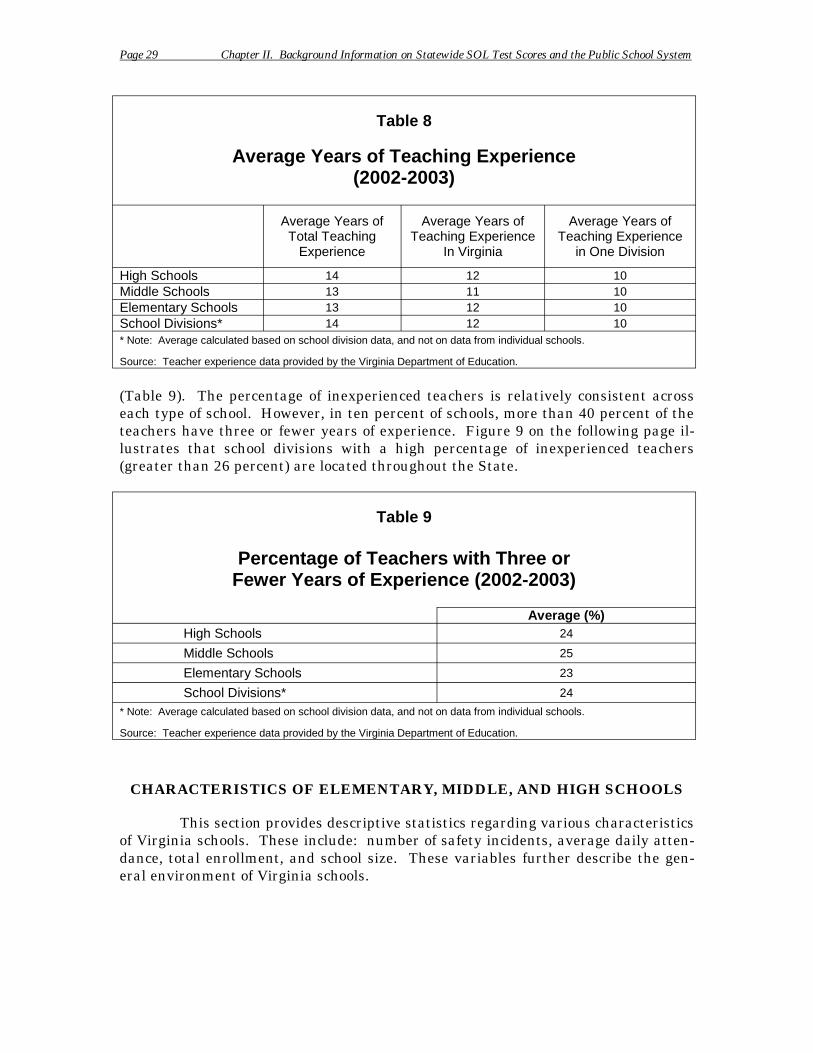
Page 29 Chapter II. Background Information on Statewide SOL Test Scores and the Public School System
Table 8
Average Years of Teaching Experience (2002-2003)
Average Years of Total Teaching
Experience
Average Years of Teaching Experience
In Virginia
Average Years of Teaching Experience
in One Division
High Schools 14 12 10 Middle Schools 13 11 10 Elementary Schools 13 12 10 School Divisions* 14 12 10 * Note: Average calculated based on school division data, and not on data from individual schools.
Source: Teacher experience data provided by the Virginia Department of Education.
(Table 9). The percentage of inexperienced teachers is relatively consistent across each type of school. However, in ten percent of schools, more than 40 percent of the teachers have three or fewer years of experience. Figure 9 on the following page illustrates that school divisions with a high percentage of inexperienced teachers (greater than 26 percent) are located throughout the State.
Table 9
Percentage of Teachers with Three or Fewer Years of Experience (2002-2003)
Average (%) High Schools 24
Middle Schools 25
Elementary Schools 23
School Divisions* 24
* Note: Average calculated based on school division data, and not on data from individual schools.
Source: Teacher experience data provided by the Virginia Department of Education.
CHARACTERISTICS OF ELEMENTARY, MIDDLE, AND HIGH SCHOOLS
This section provides descriptive statistics regarding various characteristics of Virginia schools. These include: number of safety incidents, average daily attendance, total enrollment, and school size. These variables further describe the general environment of Virginia schools.
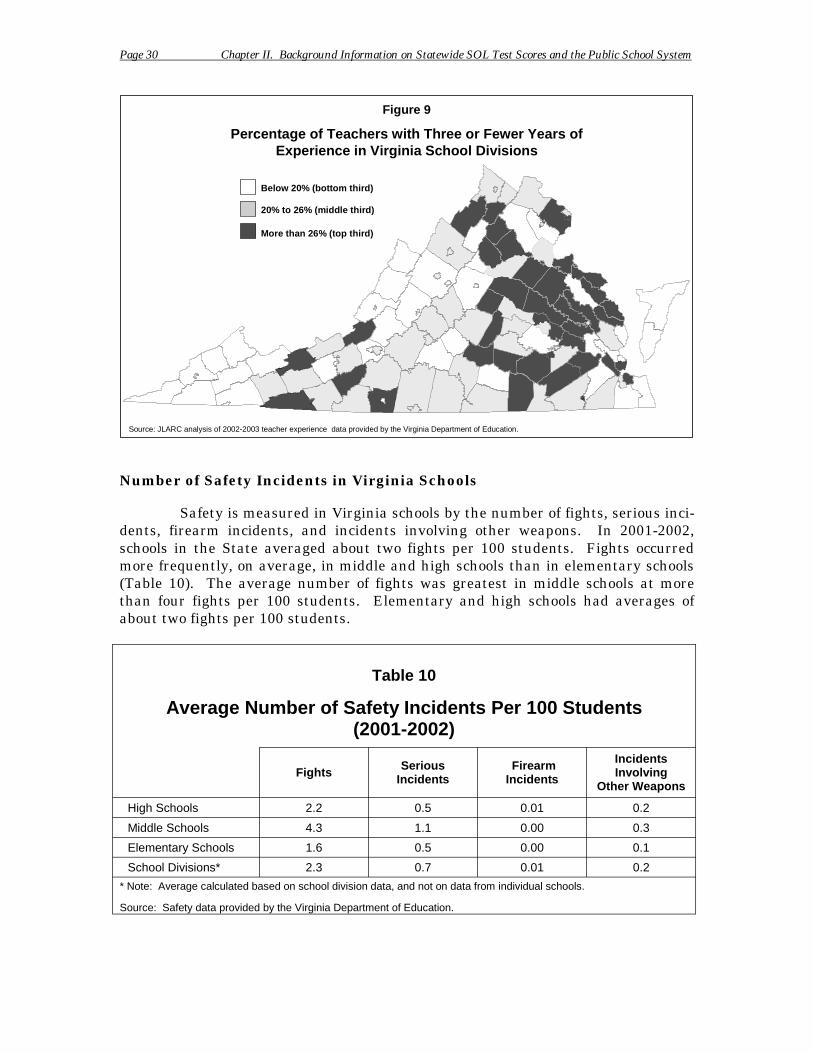
Page 30 Chapter II. Background Information on Statewide SOL Test Scores and the Public School System
Figure 9
Percentage of Teachers with Three or Fewer Years of Experience in Virginia School Divisions
Below 20% (bottom third)
20% to 26% (middle third)
More than 26% (top third)
Source: JLARC analysis of 2002-2003 teacher experience data provided by the Virginia Department of Education.
Number of Safety Incidents in Virginia Schools
Safety is measured in Virginia schools by the number of fights, serious incidents, firearm incidents, and incidents involving other weapons. In 2001-2002, schools in the State averaged about two fights per 100 students. Fights occurred more frequently, on average, in middle and high schools than in elementary schools (Table 10). The average number of fights was greatest in middle schools at more than four fights per 100 students. Elementary and high schools had averages of about two fights per 100 students.
Table 10
Average Number of Safety Incidents Per 100 Students (2001-2002)
Fights Serious Incidents
Firearm Incidents
Incidents Involving
Other Weapons
High Schools 2.2 0.5 0.01 0.2
Middle Schools 4.3 1.1 0.00 0.3
Elementary Schools 1.6 0.5 0.00 0.1
School Divisions* 2.3 0.7 0.01 0.2
* Note: Average calculated based on school division data, and not on data from individual schools.
Source: Safety data provided by the Virginia Department of Education.
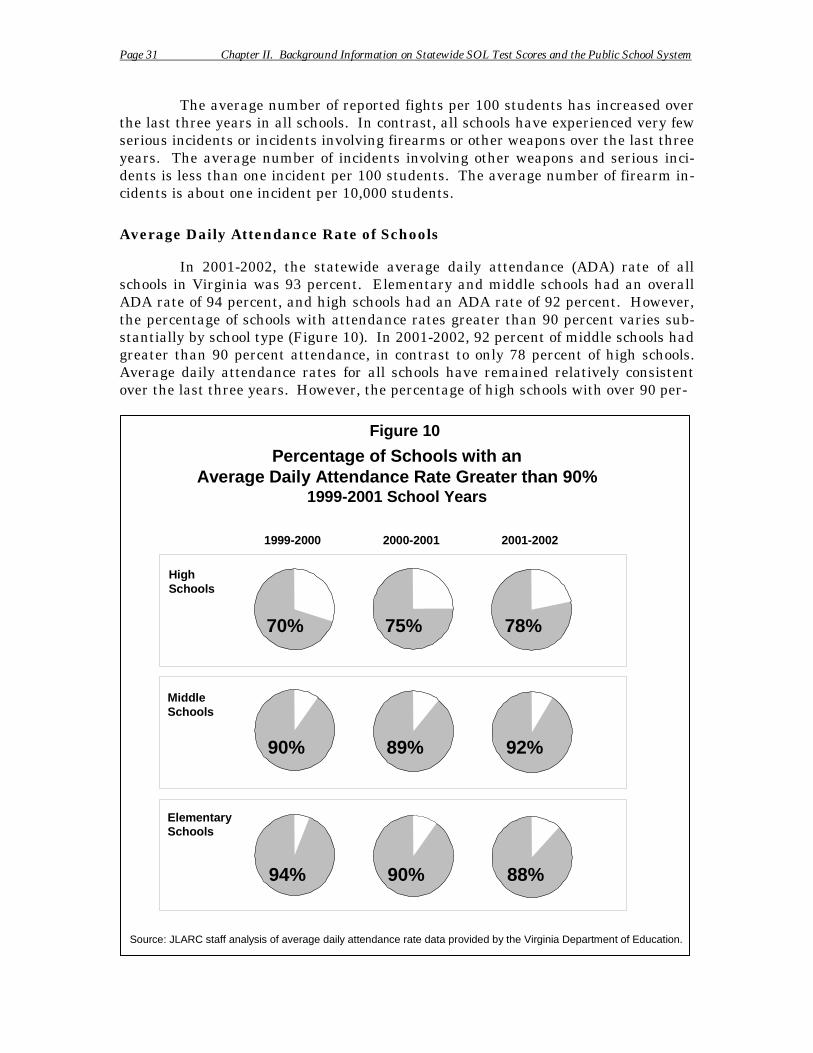
Page 31 Chapter II. Background Information on Statewide SOL Test Scores and the Public School System
The average number of reported fights per 100 students has increased over the last three years in all schools. In contrast, all schools have experienced very few serious incidents or incidents involving firearms or other weapons over the last three years. The average number of incidents involving other weapons and serious incidents is less than one incident per 100 students. The average number of firearm incidents is about one incident per 10,000 students.
Average Daily Attendance Rate of Schools
In 2001-2002, the statewide average daily attendance (ADA) rate of all schools in Virginia was 93 percent. Elementary and middle schools had an overall ADA rate of 94 percent, and high schools had an ADA rate of 92 percent. However, the percentage of schools with attendance rates greater than 90 percent varies substantially by school type (Figure 10). In 2001-2002, 92 percent of middle schools had greater than 90 percent attendance, in contrast to only 78 percent of high schools. Average daily attendance rates for all schools have remained relatively consistent over the last three years. However, the percentage of high schools with over 90 per-
Figure 10
Percentage of Schools with an Average Daily Attendance Rate Greater than 90%
1999-2001 School Years
1999-2000 2000-2001 2001-2002
94% 90% 88%
90% 89% 92%
70% 75% 78%
High Schools
Middle Schools
Elementary Schools
Source: JLARC staff analysis of average daily attendance rate data provided by the Virginia Department of Education.
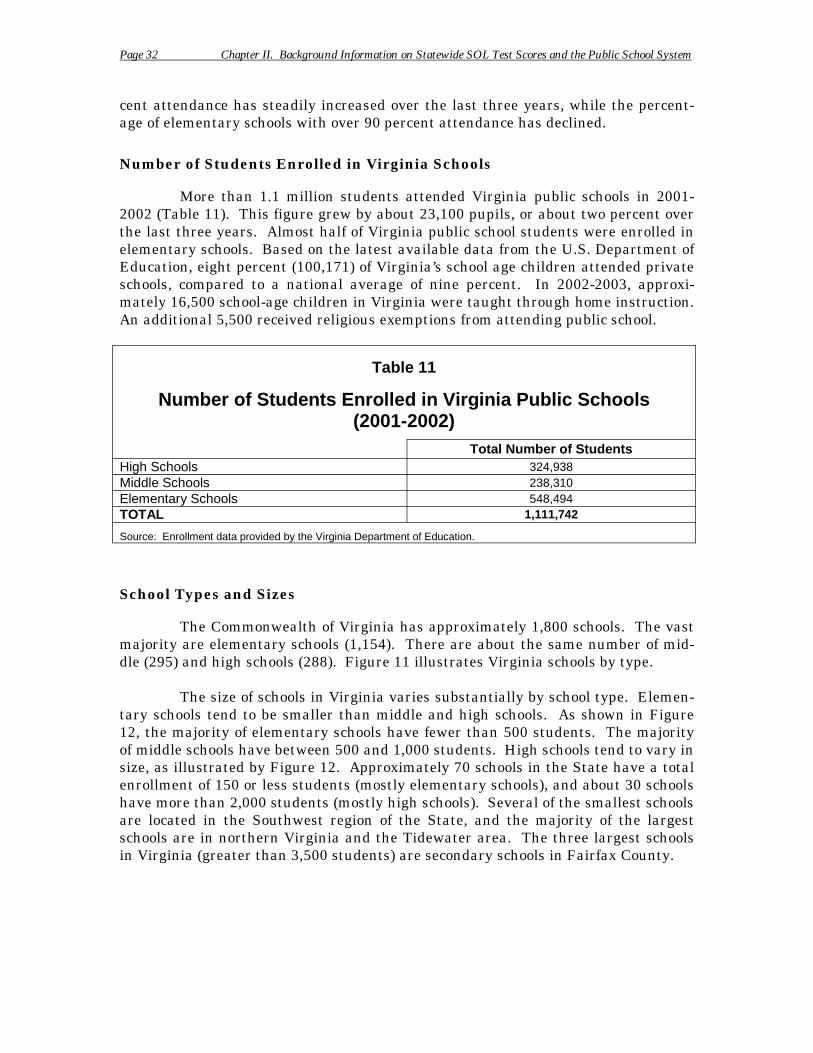
Page 32 Chapter II. Background Information on Statewide SOL Test Scores and the Public School System
cent attendance has steadily increased over the last three years, while the percentage of elementary schools with over 90 percent attendance has declined.
Number of Students Enrolled in Virginia Schools
More than 1.1 million students attended Virginia public schools in 20012002 (Table 11). This figure grew by about 23,100 pupils, or about two percent over the last three years. Almost half of Virginia public school students were enrolled in elementary schools. Based on the latest available data from the U.S. Department of Education, eight percent (100,171) of Virginia’s school age children attended private schools, compared to a national average of nine percent. In 2002-2003, approximately 16,500 school-age children in Virginia were taught through home instruction. An additional 5,500 received religious exemptions from attending public school.
Table 11
Number of Students Enrolled in Virginia Public Schools (2001-2002)
Total Number of Students 324,938
Middle Schools High Schools
238,310 Elementary Schools 548,494
1,111,742 TOTAL
Source: Enrollment data provided by the Virginia Department of Education.
School Types and Sizes
The Commonwealth of Virginia has approximately 1,800 schools. The vast majority are elementary schools (1,154). There are about the same number of middle (295) and high schools (288). Figure 11 illustrates Virginia schools by type.
The size of schools in Virginia varies substantially by school type. Elementary schools tend to be smaller than middle and high schools. As shown in Figure 12, the majority of elementary schools have fewer than 500 students. The majority of middle schools have between 500 and 1,000 students. High schools tend to vary in size, as illustrated by Figure 12. Approximately 70 schools in the State have a total enrollment of 150 or less students (mostly elementary schools), and about 30 schools have more than 2,000 students (mostly high schools). Several of the smallest schools are located in the Southwest region of the State, and the majority of the largest schools are in northern Virginia and the Tidewater area. The three largest schools in Virginia (greater than 3,500 students) are secondary schools in Fairfax County.
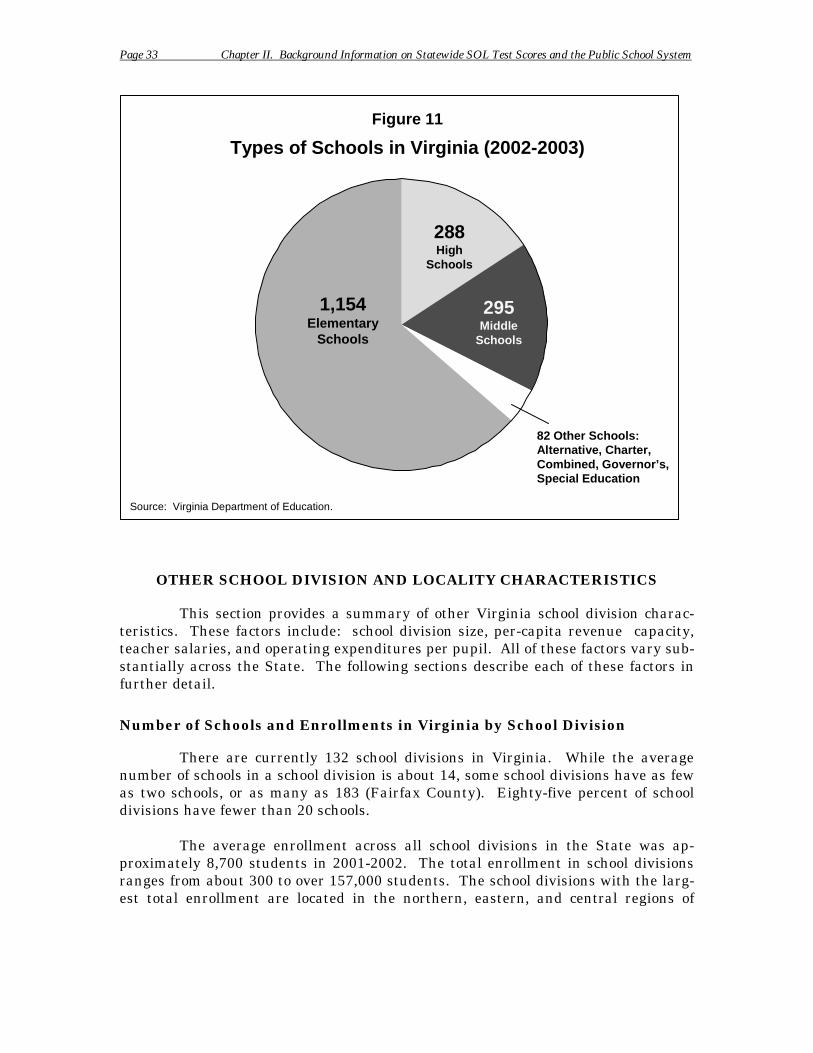
Page 33 Chapter II. Background Information on Statewide SOL Test Scores and the Public School System
Figure 11
Types of Schools in Virginia (2002-2003)
82 Other Schools: Alternative, Charter, Combined, Governor’s, Special Education
2951,154 Elementary
Schools
288 High
Schools
Middle Schools
Source: Virginia Department of Education.
OTHER SCHOOL DIVISION AND LOCALITY CHARACTERISTICS
This section provides a summary of other Virginia school division characteristics. These factors include: school division size, per-capita revenue capacity, teacher salaries, and operating expenditures per pupil. All of these factors vary substantially across the State. The following sections describe each of these factors in further detail.
Number of Schools and Enrollments in Virginia by School Division
There are currently 132 school divisions in Virginia. While the average number of schools in a school division is about 14, some school divisions have as few as two schools, or as many as 183 (Fairfax County). Eighty-five percent of school divisions have fewer than 20 schools.
The average enrollment across all school divisions in the State was approximately 8,700 students in 2001-2002. The total enrollment in school divisions ranges from about 300 to over 157,000 students. The school divisions with the largest total enrollment are located in the northern, eastern, and central regions of
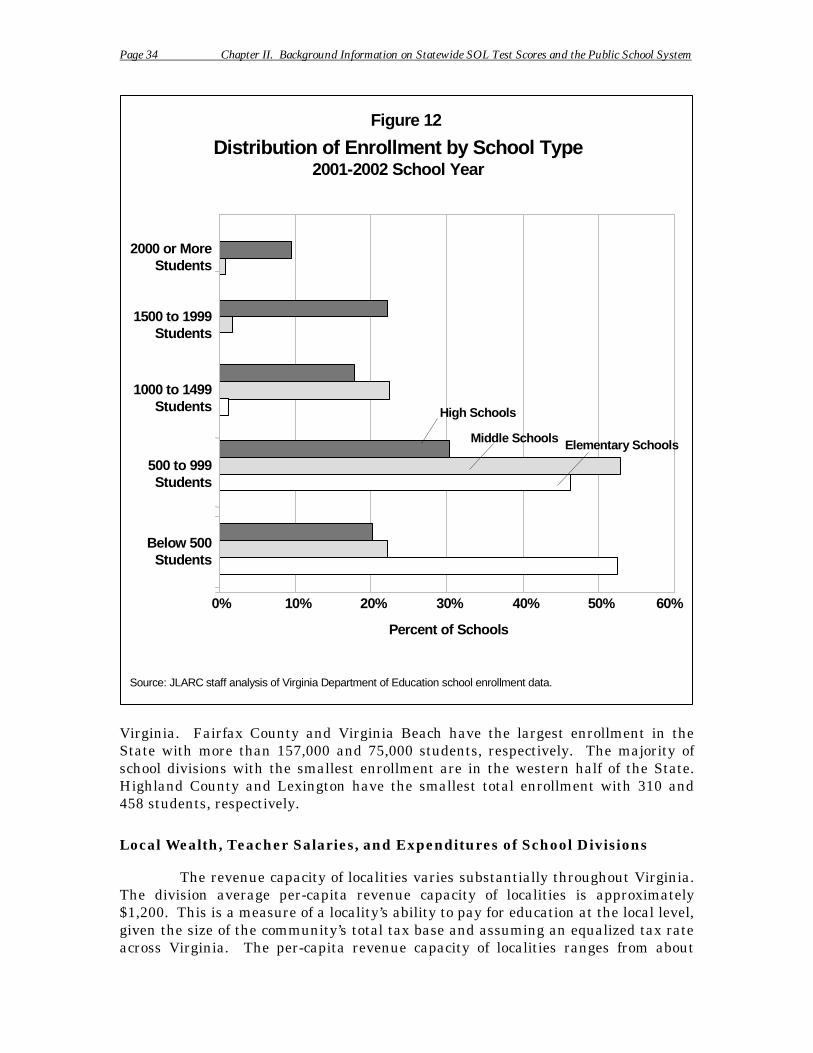
Page 34 Chapter II. Background Information on Statewide SOL Test Scores and the Public School System
20% 30% 40%
i ini i l l
Figure 12
Distribution of Enrollment by School Type 2001-2002 School Year
0% 10% 50% 60%
Below 500 Students
500 to 999 Students
1000 to 1499 Students
1500 to 1999 Students
2000 or More Students
Percent of Schools
High Schools
Middle Schools Elementary Schools
Source: JLARC staff analys s of Virg a Department of Educat on schoo enrol ment data.
Virginia. Fairfax County and Virginia Beach have the largest enrollment in the State with more than 157,000 and 75,000 students, respectively. The majority of school divisions with the smallest enrollment are in the western half of the State. Highland County and Lexington have the smallest total enrollment with 310 and 458 students, respectively.
Local Wealth, Teacher Salaries, and Expenditures of School Divisions
The revenue capacity of localities varies substantially throughout Virginia. The division average per-capita revenue capacity of localities is approximately $1,200. This is a measure of a locality’s ability to pay for education at the local level, given the size of the community’s total tax base and assuming an equalized tax rate across Virginia. The per-capita revenue capacity of localities ranges from about
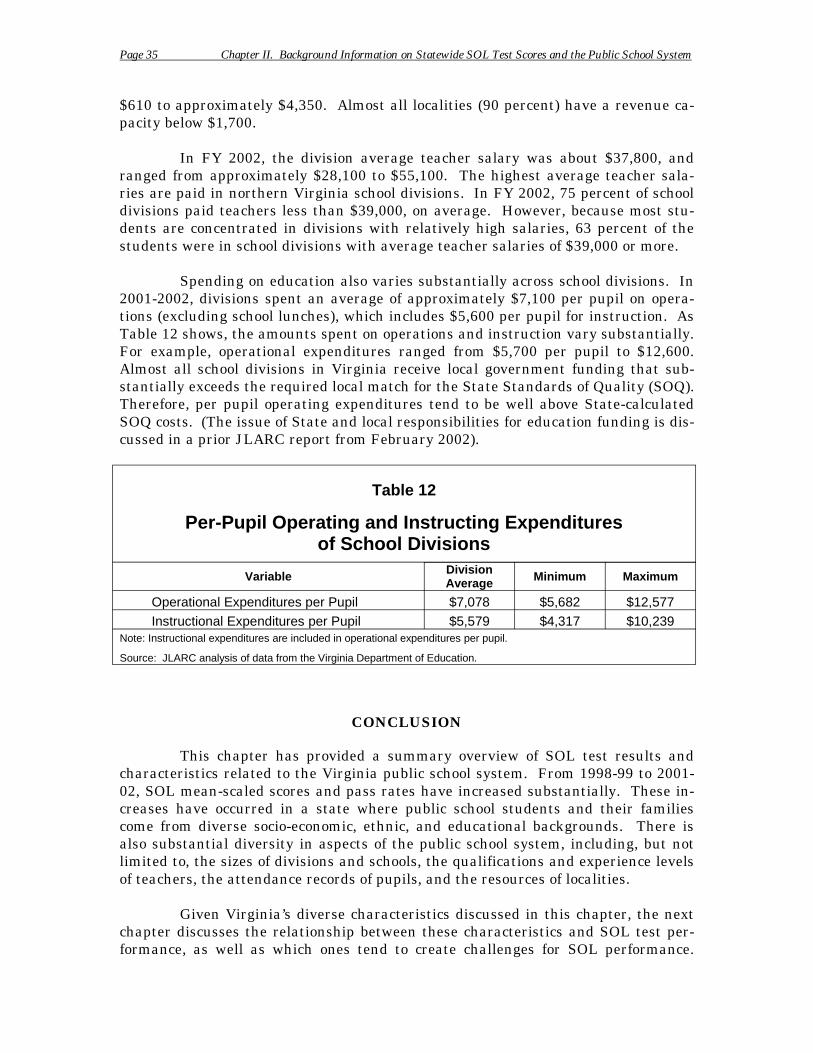
Page 35 Chapter II. Background Information on Statewide SOL Test Scores and the Public School System
$610 to approximately $4,350. Almost all localities (90 percent) have a revenue capacity below $1,700.
In FY 2002, the division average teacher salary was about $37,800, and ranged from approximately $28,100 to $55,100. The highest average teacher salaries are paid in northern Virginia school divisions. In FY 2002, 75 percent of school divisions paid teachers less than $39,000, on average. However, because most students are concentrated in divisions with relatively high salaries, 63 percent of the students were in school divisions with average teacher salaries of $39,000 or more.
Spending on education also varies substantially across school divisions. In 2001-2002, divisions spent an average of approximately $7,100 per pupil on operations (excluding school lunches), which includes $5,600 per pupil for instruction. As Table 12 shows, the amounts spent on operations and instruction vary substantially. For example, operational expenditures ranged from $5,700 per pupil to $12,600. Almost all school divisions in Virginia receive local government funding that substantially exceeds the required local match for the State Standards of Quality (SOQ). Therefore, per pupil operating expenditures tend to be well above State-calculated SOQ costs. (The issue of State and local responsibilities for education funding is discussed in a prior JLARC report from February 2002).
Table 12
Per-Pupil Operating and Instructing Expenditures of School Divisions
Variable Division Average Minimum Maximum
Operational Expenditures per Pupil $7,078 $5,682 $12,577
Instructional Expenditures per Pupil $5,579 $4,317 $10,239 Note: Instructional expenditures are included in operational expenditures per pupil.
Source: JLARC analysis of data from the Virginia Department of Education.
CONCLUSION
This chapter has provided a summary overview of SOL test results and characteristics related to the Virginia public school system. From 1998-99 to 200102, SOL mean-scaled scores and pass rates have increased substantially. These increases have occurred in a state where public school students and their families come from diverse socio-economic, ethnic, and educational backgrounds. There is also substantial diversity in aspects of the public school system, including, but not limited to, the sizes of divisions and schools, the qualifications and experience levels of teachers, the attendance records of pupils, and the resources of localities.
Given Virginia’s diverse characteristics discussed in this chapter, the next chapter discusses the relationship between these characteristics and SOL test performance, as well as which ones tend to create challenges for SOL performance.
Page 36 Chapter II. Background Information on Statewide SOL Test Scores and the Public School System
This in turns enables the identification of divisions and schools that appear to have overcome challenging characteristics and achieved success on SOL tests.
Page 37 Chapter III. Trends and Factors Underlying Performance on SOL Tests
III. Trends and Factors Underlying School and School Division Performance on SOL Tests
Statistical analysis indicates that poverty, race, and the adult educational attainment of a community are the strongest predictors of SOL test results in Virginia. The implication of this finding is that schools located in communities with a high concentration of poverty, a large proportion of black students, or a low percentage of college-educated adults tend to have lower average SOL test scores compared to schools in other communities. Similar findings have resulted from several national studies of trends in academic achievement. The relationships between poverty, race, adult educational attainment and SOL test scores can be partially explained by student and family, teacher qualification, school and division, and fiscal characteristics. A particularly strong relationship appears to exist between the race of students and teacher qualifications and experience. Profiles of the schools and divisions with the highest and lowest SOL test results presented at the end of this chapter demonstrate these trends. This chapter addresses the study mandate request for JLARC staff to examine “specific demographic and other factors that may influence academic success” as well as “demographic information of the best-and poorest-performing school divisions.”
Principals interviewed for this study indicated a number of reasons why poverty and low adult educational attainment may exert a strong impact on test scores, and a statistical analysis revealed that all three demographic factors also capture the impact of several other variables that may influence test scores. According to school principals, children who are raised in poverty or live in communities with a small population of college-educated adults may tend to receive less academic support and encouragement from their parents, and less exposure to learning outside of school. They may also change schools more frequently and be exposed to crime and violence in their neighborhoods. In addition, schools with a large proportion of these students frequently face disadvantages that stretch beyond the effects that poverty, race, or adult educational attainment may have on academic performance. Schools with a high percentage of students who are poor or black frequently employ fewer qualified and more inexperienced teachers. These schools also tend to serve more children in single-mother families, experience more student violence, and have lower attendance rates. School divisions located in communities with a low proportion of college-educated adults tend to be less affluent, offer lower teacher salaries, and spend less on education per pupil. The combination of these factors helps to explain why poverty, race, and adult educational attainment are the most powerful indicators of overall trends in SOL test performance. Figure 13 illustrates the relationship between poverty, race, and adult educational attainment, the characteristics that underlie these three factors, and SOL test scores.
The first section of this chapter describes the process by which SOL test scores were selected as the key measure of performance for this analysis. The chapter then outlines the variables that are correlated with test scores, and isolates
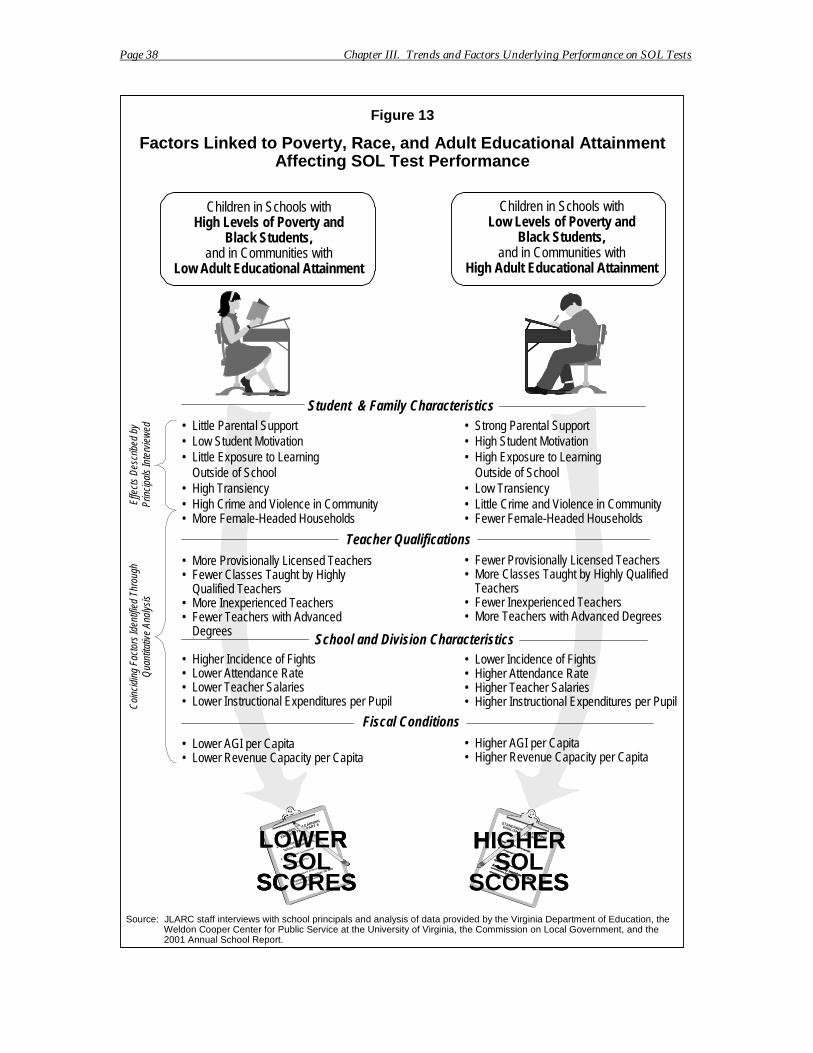
STANDARDS OF LEARNING
ENGLISH TEST PART A
• Find the mistake in the
following sentences:
• Appropriation Act language
• Direct request of the
Commission
• Special request of General
Assembly member to the
Commission (primarily
special investigations)
SOLOR
STANDARDS OF LEARNING
ENGLISH TEST PART A• Appropriation Act language• Direct request of the
Commission• Special request of General
Assembly member to the
Commission (primarily
special investigations)
SOLOR
GHSTANDARDS OF LEARNING
ENGLISH TEST PART A
• Find the mistake in the
following sentences:
• Appropriation Act language
• Direct request of the
Commission
• Special request of General
Assembly member to the
Commission (primarily
special investigations)
SOLOR
STANDARDS OF LEARNING
ENGLISH TEST PART A• Appropriation Act language• Direct request of the
Commission• Special request of General
Assembly member to the
Commission (primarily
special investigations)
SOLOR
GH
Page 38 Chapter III. Trends and Factors Underlying Performance on SOL Tests
Figur e 13
Fac t or s L i nk e d t o Po v e rt y , Ra ce , a n d A dul t E duc at ion a l A t t a i n m e nt A f f e c t i ng S O L T e st Pe r f or m a nc e
Children in Schools with High Levels of Poverty and
Black Students, and in Communities with
Low Adult Educational Attainment
Children in Schools with Low Levels of Poverty and
Black Students, and in Communities with
High Adult Educational Attainment
• Little Parental Support • Low Student Motivation • Little Exposure to Learning
Outside of School • High Transiency • High Crime and Violence in Community • More Female-Headed Households
Student & Fami
• More Provisionally Licensed Teachers • Fewer Classes Taught by Highly
Qualified Teachers • More Inexperienced Teachers • Fewer Teachers with Advanced
Degrees
• Higher Incidence of Fights • Lower Attendance Rate • Lower Teacher Salaries • Lower Instructional Expenditures per Pupil
• Lower AGI per Capita • Lower Revenue Capacity per Capita
School
Effe
cts
Des
crib
ed b
y Pr
inci
pals
Inte
rvie
wed
C
oinc
idin
g Fa
ctor
s Id
entif
ied
Thro
ugh
Qua
ntita
tive
Anal
ysis
Source: JLARC staff interviews with school principals and analysis of data provided by the Virginia Department of Education, the Weldon Cooper Center for Public Service at the University of Virginia, the Commission on Local Government, and the 2001 Annual School Report.
SC ES
LO WER
SC ES
LOWERSTANDARDS OF LEARNING
ENGLISH TEST PART A
• Find the mistake in the
following sentences:
• Appropriation Act language
• Direct request of the
Commission
• Special request of General
Assembly member to the
Commission (primarily
special investigations)
SO L SCOR ES
LOWER
ly Characteristics • Strong Parental Support • High Student Motivation • High Exposure to Learning
Outside of School • Low Transiency • Little Crime and Violence in Community • Fewer Female-Headed Households
• Fewer Provisionally Licensed Teachers • More Classes Taught by Highly Qualified
Teachers • Fewer Inexperienced Teachers • More Teachers with Advanced Degrees
• Lower Incidence of Fights • Higher Attendance Rate • Higher Teacher Salaries • Higher Instructional Expenditures per Pupil
• Higher AGI per Capita • Higher Revenue Capacity per Capita
Teacher Qualifications
Fiscal Conditions
and Division Characteristics
SC ES
HI ER
SC ES
HI ERSTANDARDS OF LEARNING
ENGLISH TEST PART A• Appropriation Act language• Direct request of the
Commission• Special request of General
Assembly member to the
Commission (primarily
special investigations)
• Appropriation Act language• Direct request of the
Commission• Special request of General
Assembly member to the
Commission (primarily
special investigations)
SOL SCOR ES
HIGH ER
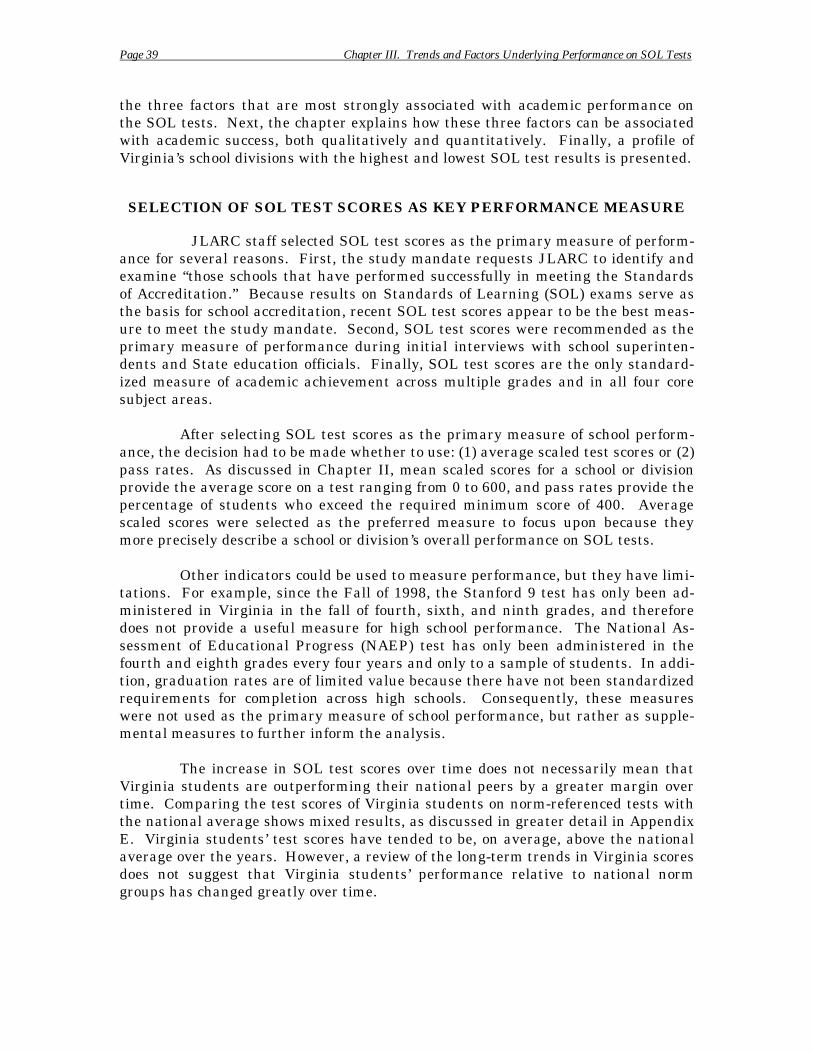
Page 39 Chapter III. Trends and Factors Underlying Performance on SOL Tests
the three factors that are most strongly associated with academic performance on the SOL tests. Next, the chapter explains how these three factors can be associated with academic success, both qualitatively and quantitatively. Finally, a profile of Virginia’s school divisions with the highest and lowest SOL test results is presented.
SELECTION OF SOL TEST SCORES AS KEY PERFORMANCE MEASURE
JLARC staff selected SOL test scores as the primary measure of performance for several reasons. First, the study mandate requests JLARC to identify and examine “those schools that have performed successfully in meeting the Standards of Accreditation.” Because results on Standards of Learning (SOL) exams serve as the basis for school accreditation, recent SOL test scores appear to be the best measure to meet the study mandate. Second, SOL test scores were recommended as the primary measure of performance during initial interviews with school superintendents and State education officials. Finally, SOL test scores are the only standardized measure of academic achievement across multiple grades and in all four core subject areas.
After selecting SOL test scores as the primary measure of school performance, the decision had to be made whether to use: (1) average scaled test scores or (2) pass rates. As discussed in Chapter II, mean scaled scores for a school or division provide the average score on a test ranging from 0 to 600, and pass rates provide the percentage of students who exceed the required minimum score of 400. Average scaled scores were selected as the preferred measure to focus upon because they more precisely describe a school or division’s overall performance on SOL tests.
Other indicators could be used to measure performance, but they have limitations. For example, since the Fall of 1998, the Stanford 9 test has only been administered in Virginia in the fall of fourth, sixth, and ninth grades, and therefore does not provide a useful measure for high school performance. The National Assessment of Educational Progress (NAEP) test has only been administered in the fourth and eighth grades every four years and only to a sample of students. In addition, graduation rates are of limited value because there have not been standardized requirements for completion across high schools. Consequently, these measures were not used as the primary measure of school performance, but rather as supplemental measures to further inform the analysis.
The increase in SOL test scores over time does not necessarily mean that Virginia students are outperforming their national peers by a greater margin over time. Comparing the test scores of Virginia students on norm-referenced tests with the national average shows mixed results, as discussed in greater detail in Appendix E. Virginia students’ test scores have tended to be, on average, above the national average over the years. However, a review of the long-term trends in Virginia scores does not suggest that Virginia students’ performance relative to national norm groups has changed greatly over time.
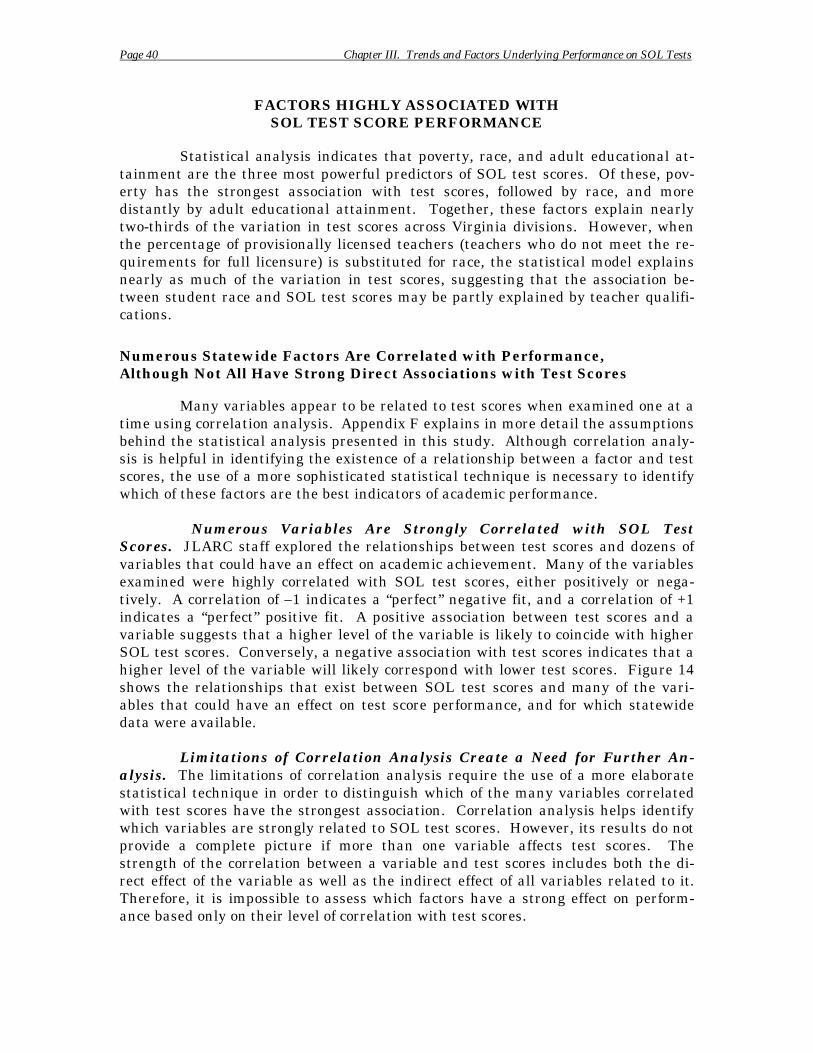
Page 40 Chapter III. Trends and Factors Underlying Performance on SOL Tests
FACTORS HIGHLY ASSOCIATED WITH SOL TEST SCORE PERFORMANCE
Statistical analysis indicates that poverty, race, and adult educational attainment are the three most powerful predictors of SOL test scores. Of these, poverty has the strongest association with test scores, followed by race, and more distantly by adult educational attainment. Together, these factors explain nearly two-thirds of the variation in test scores across Virginia divisions. However, when the percentage of provisionally licensed teachers (teachers who do not meet the requirements for full licensure) is substituted for race, the statistical model explains nearly as much of the variation in test scores, suggesting that the association between student race and SOL test scores may be partly explained by teacher qualifications.
Numerous Statewide Factors Are Correlated with Performance, Although Not All Have Strong Direct Associations with Test Scores
Many variables appear to be related to test scores when examined one at a time using correlation analysis. Appendix F explains in more detail the assumptions behind the statistical analysis presented in this study. Although correlation analysis is helpful in identifying the existence of a relationship between a factor and test scores, the use of a more sophisticated statistical technique is necessary to identify which of these factors are the best indicators of academic performance.
Numerous Variables Are Strongly Correlated with SOL Test Scores. JLARC staff explored the relationships between test scores and dozens of variables that could have an effect on academic achievement. Many of the variables examined were highly correlated with SOL test scores, either positively or negatively. A correlation of –1 indicates a “perfect” negative fit, and a correlation of +1 indicates a “perfect” positive fit. A positive association between test scores and a variable suggests that a higher level of the variable is likely to coincide with higher SOL test scores. Conversely, a negative association with test scores indicates that a higher level of the variable will likely correspond with lower test scores. Figure 14 shows the relationships that exist between SOL test scores and many of the variables that could have an effect on test score performance, and for which statewide data were available.
Limitations of Correlation Analysis Create a Need for Further Analysis. The limitations of correlation analysis require the use of a more elaborate statistical technique in order to distinguish which of the many variables correlated with test scores have the strongest association. Correlation analysis helps identify which variables are strongly related to SOL test scores. However, its results do not provide a complete picture if more than one variable affects test scores. The strength of the correlation between a variable and test scores includes both the direct effect of the variable as well as the indirect effect of all variables related to it. Therefore, it is impossible to assess which factors have a strong effect on performance based only on their level of correlation with test scores.
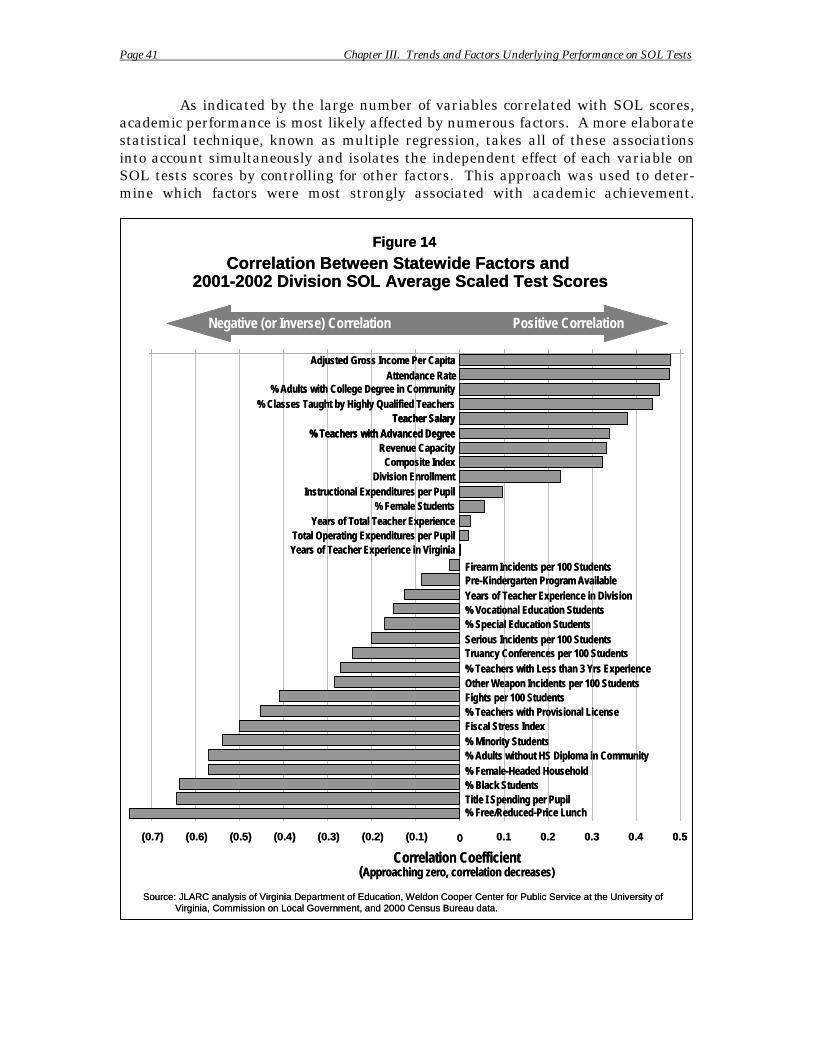
Page 41 Chapter III. Trends and Factors Underlying Performance on SOL Tests
As indicated by the large number of variables correlated with SOL scores, academic performance is most likely affected by numerous factors. A more elaborate statistical technique, known as multiple regression, takes all of these associations into account simultaneously and isolates the independent effect of each variable on SOL tests scores by controlling for other factors. This approach was used to determine which factors were most strongly associated with academic achievement.
Correlation Between Statewide Factors and 2001-2002 Division SOL Average Scaled Test Scores
Adjusted Gross Income Per Capita
% Adults with College Degree in Community % Classes Taught by Highly Qualified Teachers
% Teachers with Advanced Degree Teacher Salary
Revenue Capacity Composite Index
Division Enrollment
Attendance Rate
Instructional Expenditures per Pupil % Female Students
Years of Total Teacher Experience Total Operating Expenditures per Pupil Years of Teacher Experience in Virginia
Firearm Incidents per 100 Students Pre-Kindergarten Program Available Years of Teacher Experience in Division % Vocational Education Students % Special Education Students Serious Incidents per 100 Students
% Teachers with Less than 3 Yrs Experience Truancy Conferences per 100 Students
Other Weapon Incidents per 100 Students Fights per 100 Students
Fiscal Stress Index % Minority Students % Adults without HS Diploma in Community % Female-Headed Household % Black Students Title I Spending per Pupil % Free/Reduced-Price Lunch
% Teachers with Provisional License
(0.7) (0.6) (0.5) (0.4) (0.3) (0.2) (0.1) 0.1 0.2 0.3 0.4 0.5
Figure 14
0
Positive CorrelationNegative (or Inverse) Correlation
Correlation Coefficient (Approaching zero, correlation decreases)
Source: JLARC analysis of Virginia Department of Education, Weldon Cooper Center for Public Service at the University of Virginia, Commission on Local Government, and 2000 Census Bureau data.
Correlation Between Statewide Factors and 2001-2002 Division SOL Average Scaled Test Scores
Adjusted Gross Income Per Capita
% Adults with College Degree in Community% Classes Taught by Highly Qualified Teachers
% Teachers with Advanced Degree% Teachers with Advanced DegreeTeacher SalaryTeacher Salary
Revenue CapacityComposite Index
Division Enrollment
Attendance Rate
Instructional Expenditures per Pupil% Female Students
Years of Total Teacher ExperienceTotal Operating Expenditures per PupilYears of Teacher Experience in Virginia
Firearm Incidents per 100 StudentsPre-Kindergarten Program AvailableYears of Teacher Experience in Division% Vocational Education Students% Special Education StudentsSerious Incidents per 100 Students
% Teachers with Less than 3 Yrs ExperienceTruancy Conferences per 100 Students
Other Weapon Incidents per 100 StudentsFights per 100 Students
Fiscal Stress Index% Minority Students% Adults without HS Diploma in Community% Female-Headed Household% Black StudentsTitle I Spending per Pupil% Free/Reduced-Price Lunch
% Teachers with Provisional License
(0.7) (0.6) (0.5) (0.4) (0.3) (0.2) (0.1) 0.1 0.2 0.3 0.4 0.5
Figure 14
0
Positive CorrelationNegative (or Inverse) Correlation
Correlation Coefficient(Approaching zero, correlation decreases)
Source: JLARC analysis of Virginia Department of Education, Weldon Cooper Center for Public Service at the University ofVirginia, Commission on Local Government, and 2000 Census Bureau data.
Page 42 Chapter III. Trends and Factors Underlying Performance on SOL Tests
Poverty, Race and Adult Educational Attainment Have the Strongest Associations with SOL Test Scores
In Virginia, the three factors that explain the most variation in test scores are poverty (percentage of students participating in the free or reduced-price lunch program), race (percentage of black students), and adult educational attainment (proportion of adults over age 25 in the community who hold a college degree), based on regression analyses using combinations of factors highly correlated with SOL test scores. Regression results indicate that as poverty increases, average SOL test scores tend to decrease. Likewise, as the proportion of black students increases, average test scores are likely to decrease. A strong relationship appears to exist between race and teacher qualifications and levels of experience. Finally, as adult educational attainment decreases, SOL test scores also tend to decrease. These findings are largely consistent with those based on national studies of academic achievement.
Numerous national studies conducted by organizations such as the National Center for Education Statistics and RAND, and by individual education researchers, have found that poverty, race, and adult educational attainment appear to be strongly related to test scores, resulting in an achievement gap between different groups of students. Scores on the National Assessment of Educational Progress (NAEP) – a national test that gauges states’ progress in reading and mathematics – have been consistently lower for students from families with challenging demographic characteristics than for other students. The existence of this achievement gap is recognized by the No Child Left Behind Act, which directs states to analyze the achievement of students by race, ethnicity, economic background, and disabilities so that no group or child is left behind.
Although the gap has shrunk over time, national studies have also found that black students tend to score significantly lower than white students on the NAEP and college-entrance exams such as the SAT. Based on an examination of 1999 NAEP reading scores, the average score for black students at age 17 was roughly the same as that of white students at age 13. On the 1999 NAEP mathematics test, the average score for black 13-year-olds was more than 30 points below that of white 13-year-olds. In 2000, the gap between black and white students’ SAT scores was 123 points in mathematics and 95 points in verbal. While poverty, adult educational attainment, and race are frequently interrelated, education researchers have found that poverty and educational attainment do not completely explain the achievement gap that appears to exist between students of different ethnic backgrounds. In 1998, black students scored lower on the SAT tests than white students from families with comparable incomes. National studies indicate that innate abilities and genetic factors are not the root cause of the achievement gap, but rather that a combination of home, school, and community factors appears to underlie the difference in test scores.
In this study of Virginia SOL test performance, poverty appears to have the strongest association with test scores, followed by race and then adult educational attainment. Through all the regression analyses that were conducted, poverty always had the strongest association with SOL test scores. The second-strongest asso
Page 43 Chapter III. Trends and Factors Underlying Performance on SOL Tests
ciation with test scores is race. Likewise, adult educational attainment has a marked association with test scores, although the strength of its relationship with performance is somewhat weaker than the two previously described factors. Together, these three characteristics explain nearly two-thirds of the variation in SOL test scores when conducting a regression analysis at the division level.
Alternate regression models were examined to see how well other factors could predict SOL test scores. The model that explained the greatest amount of variation in test scores included poverty, race, and adult educational attainment. However, a model in which the percentage of provisionally licensed teachers was substituted for race explained nearly as much of the variation in test scores. This finding suggests that the relationship between race and SOL test scores can be partially explained by the qualifications of teachers. In particular, the effects that less qualified teachers may have on SOL test scores may, in large part, be reflected by the race variable. In other words, schools and school divisions with larger percentages of black pupils also tend to have higher proportions of provisionally licensed teachers, which may explain why SOL test scores tend to be lower.
After controlling for poverty, race, and adult educational attainment, most of the other variables previously found to be highly correlated with test scores showed only a weak association with SOL test performance. Because the inclusion of additional variables in the regression equation increased the predictive power of a model containing poverty, race, and adult educational attainment only slightly, the added complexity of including these factors in the model and controlling for them was not justified.
The implication of these results is that the presence of high poverty, high concentrations of black students, or low educational attainment in the community tends to coincide with lower SOL test performance. In general, schools and school divisions that experience high levels of any of these factors are likely to have lower SOL test scores than schools and divisions with a low or moderate level of these characteristics. However, there are exceptions to the general trend. Some schools with substantial challenges have students who perform well, while some schools with fewer challenges do not have students performing at the high levels that might be expected.
Figure 15 highlights that during the 2001-2002 school year, test scores in Virginia divisions with high levels of poverty, a large black student population, or a low level of educational attainment in the community tended to be, on average, significantly lower compared to other divisions. Divisions with a high concentration of poverty scored an average of 26 points lower on the SOL tests than did their low-poverty counterparts. Communities with a high percentage of black students scored, on average, 18 points lower on the SOL tests than divisions with a small black student population. Finally, divisions in areas with a low level of adult educational attainment scored, on average, 15 points lower than divisions in areas with a large proportion of college graduates.
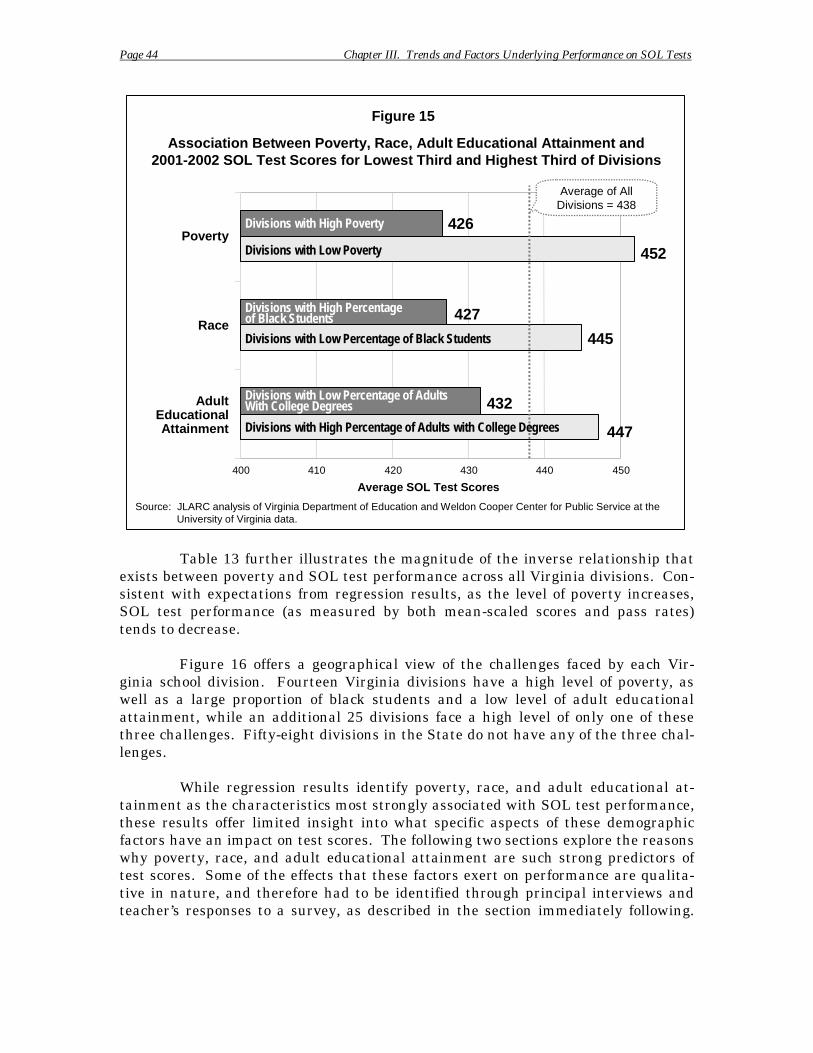
Page 44 Chapter III. Trends and Factors Underlying Performance on SOL Tests
l i i ini l i ii
Divi i i
i
Divi i i
Divi iWi
Divi i i ll
Divi i
427
447
l isi
Association Between Poverty, Race, Adult Educational Attainment and 2001-2002 SOL Test Scores for Lowest Third and Highest Third of Divisions
Source: JLARC ana ys s of V rg a Department of Education and We don Cooper Center for Publ c Serv ce at the University of V rginia data.
400 410 420 430 440 450
Poverty
Race
Adult Educational Attainment
Average SOL Test Scores
Figure 15
sions w th H gh Poverty
Divis ons with Low Poverty
sions w th H gh Percentage of Black Students
sions w th Low Percentage of Adults th College Degrees
sions w th H gh Percentage of Adults with Co ege Degrees
sions w th Low Percentage of Black Students
452
426
445
432
Average of AlDiv ons = 438
Table 13 further illustrates the magnitude of the inverse relationship that exists between poverty and SOL test performance across all Virginia divisions. Consistent with expectations from regression results, as the level of poverty increases, SOL test performance (as measured by both mean-scaled scores and pass rates) tends to decrease.
Figure 16 offers a geographical view of the challenges faced by each Virginia school division. Fourteen Virginia divisions have a high level of poverty, as well as a large proportion of black students and a low level of adult educational attainment, while an additional 25 divisions face a high level of only one of these three challenges. Fifty-eight divisions in the State do not have any of the three challenges.
While regression results identify poverty, race, and adult educational attainment as the characteristics most strongly associated with SOL test performance, these results offer limited insight into what specific aspects of these demographic factors have an impact on test scores. The following two sections explore the reasons why poverty, race, and adult educational attainment are such strong predictors of test scores. Some of the effects that these factors exert on performance are qualitative in nature, and therefore had to be identified through principal interviews and teacher’s responses to a survey, as described in the section immediately following.
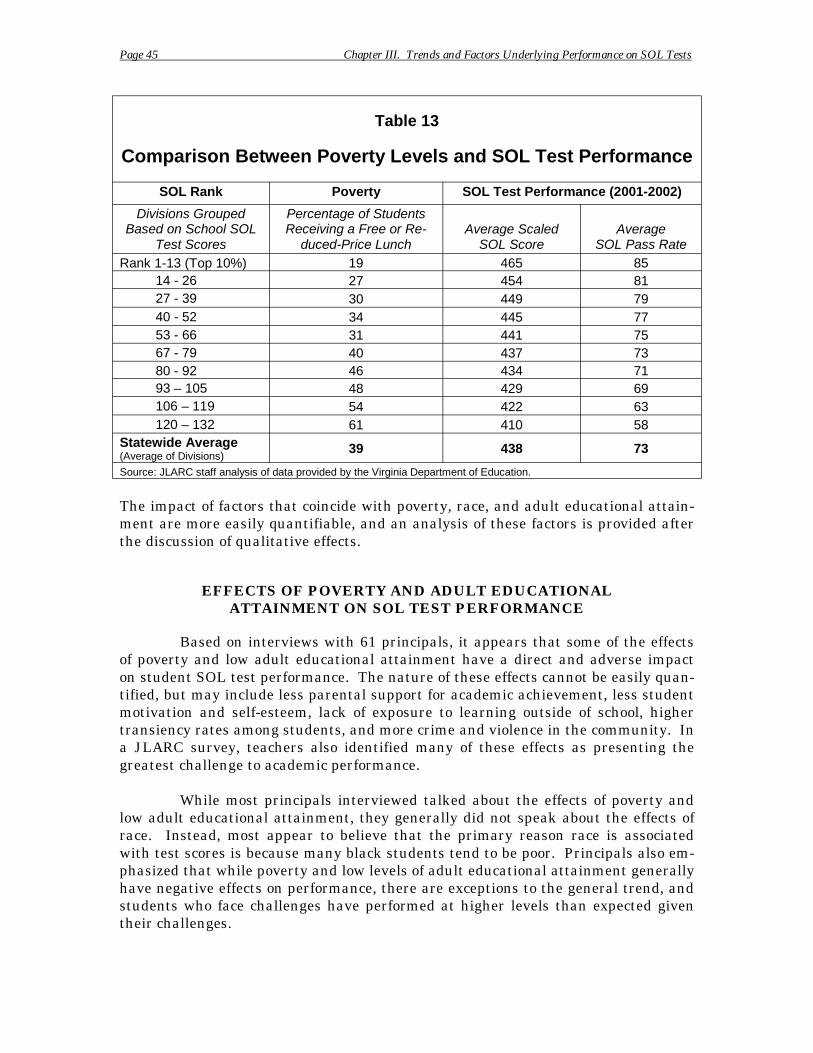
Page 45 Chapter III. Trends and Factors Underlying Performance on SOL Tests
Table 13
Comparison Between Poverty Levels and SOL Test Performance
SOL Rank Poverty SOL Test Performance (2001-2002)
Divisions Grouped Based on School SOL
Test Scores
Percentage of Students Receiving a Free or Re-
duced-Price Lunch Average Scaled
SOL Score Average
SOL Pass Rate Rank 1-13 (Top 10%) 19 465 85
14 - 26 27 454 81 27 - 39 30 449 79 40 - 52 34 445 77 53 - 66 31 441 75 67 - 79 40 437 73 80 - 92 46 434 71 93 – 105 48 429 69 106 – 119 54 422 63 120 – 132 61 410 58
Statewide Average (Average of Divisions)
39 438 73
Source: JLARC staff analysis of data provided by the Virginia Department of Education.
The impact of factors that coincide with poverty, race, and adult educational attainment are more easily quantifiable, and an analysis of these factors is provided after the discussion of qualitative effects.
EFFECTS OF POVERTY AND ADULT EDUCATIONAL ATTAINMENT ON SOL TEST PERFORMANCE
Based on interviews with 61 principals, it appears that some of the effects of poverty and low adult educational attainment have a direct and adverse impact on student SOL test performance. The nature of these effects cannot be easily quantified, but may include less parental support for academic achievement, less student motivation and self-esteem, lack of exposure to learning outside of school, higher transiency rates among students, and more crime and violence in the community. In a JLARC survey, teachers also identified many of these effects as presenting the greatest challenge to academic performance.
While most principals interviewed talked about the effects of poverty and low adult educational attainment, they generally did not speak about the effects of race. Instead, most appear to believe that the primary reason race is associated with test scores is because many black students tend to be poor. Principals also emphasized that while poverty and low levels of adult educational attainment generally have negative effects on performance, there are exceptions to the general trend, and students who face challenges have performed at higher levels than expected given their challenges.
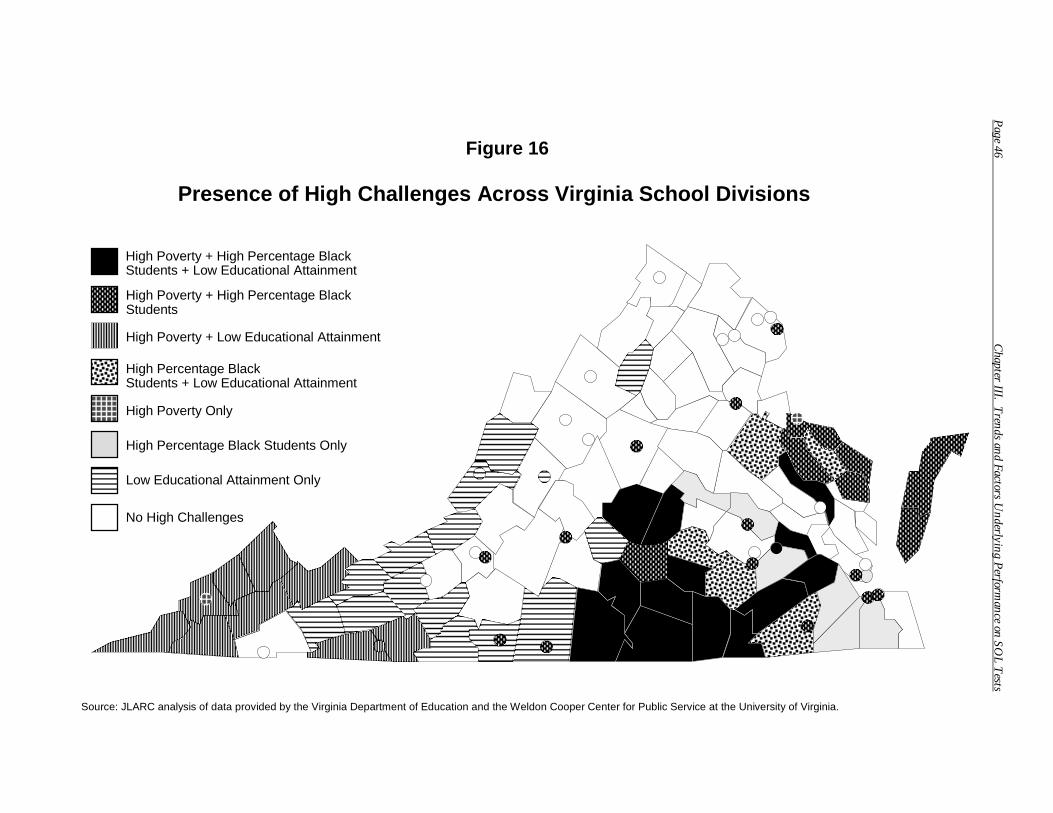
Page 46 C
hapter III. Trends and Factors U
nderlying Perform
ance on SOL T
ests
Figure 16
Source: JLARC analysis of data provided by the Virginia Department of Education and the Weldon Cooper Center for Public Service at the University of Virginia.
Presence of High Challenges Across Virginia School Divisions
High Poverty + High Percentage BlackStudents + Low Educational Attainment
High Poverty + High Percentage BlackStudents
High Poverty + Low Educational Attainment
High Percentage BlackStudents + Low Educational Attainment
High Poverty Only
Low Educational Attainment Only
High Percentage Black Students Only
No High Challenges
Page 47 Chapter III. Trends and Factors Underlying Performance on SOL Tests
Lack of Parental Support Is an Effect that Impacts Performance
According to principals interviewed, one of the effects of poverty and low adult educational attainment that impacts performance is the lack of parental support for academic achievement. Principals generally agree that unless a school compensates for this lack of parental support, the performance of students is likely to suffer.
Principals indicated that this lack of support results at least partially from the practical limitations of poverty and low adult educational attainment. Poor parents often work multiple jobs, which leaves them little time to provide needed support to their children. Many poor parents also ask their children to take on additional family responsibilities that conflict with school, such as baby-sitting younger siblings or working to supplement the family’s income. Moreover, parents with low educational attainment tend to have more difficulty assisting their children with their homework, because they may lack the knowledge needed to do so.
Teachers believe that this lack of parental support for academic achievement creates a significant obstacle to student performance. When asked in the JLARC survey to indicate the greatest challenges to student academic performance, the most frequently cited challenge was the level of parental support for academic achievement.
Lack of Student Motivation and Self-Esteem Are Effects that Impact Performance
Principals also indicated that the lack of student motivation or self-esteem is an effect of poverty and low adult educational attainment that could result in lower performance. Several principals mentioned that two of their greatest challenges to improving performance are motivating their students to want to excel in their schoolwork and getting the students to believe in themselves.
Principals indicated that the lack of student motivation sometimes results from the parents’ view of education. Parents may have had negative school experiences that prompted them to not complete their education, and therefore, they may not be inclined to provide positive support to their children as they pursue their own education. In other instances, many poor parents who did not complete college or high school may not place much priority on education. These parents who view education negatively, or place little value on it, tend to have low academic expectations for their children, which results in low student motivation.
Along with the lack of motivation, another effect of poverty and low adult educational attainment is low self-esteem. One principal from a division with a high rate of poverty and a low adult educational attainment level indicated that the major challenge to student performance was her students’ low self-esteem. She indicated that many students did not have the self-esteem to believe that they could achieve. Principals indicated that low self-esteem of individual students results from low parental and community expectations. One principal described how many
Page 48 Chapter III. Trends and Factors Underlying Performance on SOL Tests
of his students had low-self esteem because his school was in the poorest area of the county, and students there had never been expected to do well by the community.
Low motivation and lack of self-esteem may be further perpetuated by the peer environment in which these students live. In schools with large numbers of students from poor homes or with parents who have limited education, low expectations are reinforced among peers. One principal who had worked in a school with high poverty and low education levels discussed how many of the students did not view school as “cool.” This had a negative impact on school performance as a whole because students who were motivated and academically successful were looked down upon by their peers or discouraged from continuing to achieve.
Lack of Exposure to Learning Outside of School May Be Associated with Performance
Principals also emphasized that a lack of exposure to learning outside of the school can also result from poverty and low adult educational attainment. Examples of exposure to learning that were provided included: the presence of books and other academic materials in the home; trips to museums or areas outside of the community; and participation in other academic activities such as a preschool program.
During interviews, many principals indicated that students who lacked exposure to learning were at an academic disadvantage compared to students who had experienced this exposure. One elementary school principal discussed how the vocabularies of his students could vary by as much as 1,000 words simply because of the differences in exposure to learning. Another elementary school principal provided a specific example of how the lack of exposure to learning affected his students’ academic performance. On one test, some children could not answer a test question that asked about the colors on a stoplight, because there were no stoplights in the town, and the children had never traveled far enough to see one.
As with a lack of parental support, lack of exposure to learning may also result, at least partially, from the practical limitations of poverty and adult educational attainment. Poor parents often work multiple jobs and are not able to spend time with their children on activities that would expose them to learning. Additionally, poor parents tend to be less financially able to provide resources or afford activities that provide exposure to learning. For example, many principals indicated that poor students lack adequate books in their homes or the opportunity to take educational trips.
Transiency, and Crime and Violence in the Community May Impact Performance
Some principals also indicated that transiency, and crime and violence in the community are also effects of poverty that impact performance. Transient students face challenges because there is a natural adjustment period for students who are new to a school. In addition, new students may not be on the same academic
Page 49 Chapter III. Trends and Factors Underlying Performance on SOL Tests
level as their peers, and may not have had the same behavioral expectations in their former school.
Principals explained that poor students were more transient for two reasons. Many poor families do not own homes and cannot or choose not to enter into long-term leases. As a result, these families tend to move fairly often. In other instances, poor children do not have stable families and, instead, live with relatives. These children may move from one relative’s residence to another multiple times during the school year.
In addition, principals in some urban areas also explained that crime and violence in their community were effects of poverty that impacted their schools’ performance. Principals explained that regular exposure to crime and violence distracted students and also contributed to more disruptive behavior.
FACTORS COINCIDING WITH POVERTY, RACE, ADULT EDUCATIONAL ATTAINMENT, AND THEIR ASSOCIATION WITH PERFORMANCE
The relationship between poverty, race, adult educational attainment, and SOL test scores may be explained in part by student and family, teacher qualification, school and division, and fiscal characteristics. In addition to the disadvantages often linked to poverty and race, divisions with a high concentration of poverty and a large proportion of black students frequently face additional challenges related to academic achievement. Schools located in these divisions tend to employ teachers with fewer qualifications and less experience. They also frequently serve more students in single-mother families, have more violence, and have lower attendance rates. Communities with lower levels of adult educational attainment contend with a lower adjusted gross income per capita and lower revenue capacity, and spend less on average teacher salaries and instruction per pupil. The presence of these underlying factors helps to further explain why poverty, race, and adult educational attainment are such strong predictors of academic performance in regression analysis.
Regression Results Include the Impact of Factors that Coincide with Poverty, Race, and Adult Educational Attainment
As discussed in the previous section, the effects of poverty, race, and adult educational attainment can have an adverse impact on academic performance. In addition, it appears that certain factors that coincide with (but are not the same as) poverty, race, and adult educational attainment also have an impact on test scores. These underlying factors may account for part of the statistical association found between poverty, race, adult educational attainment, and test scores. These factors should, therefore, be identified in order to provide a more accurate interpretation of regression results and to better explain how poverty, race, and adult educational attainment predict performance. Appendix F provides a detailed description of the statistical rationale and methodology used to identify these underlying factors.
The following three sections describe the relationships that exist between poverty, race, and adult educational attainment and the 11 factors that most
Page 50 Chapter III. Trends and Factors Underlying Performance on SOL Tests
strongly coincide with them. These relationships result in marked differences between divisions with high concentrations of poverty, a high proportion of black students, or low levels of adult educational attainment, and other divisions. To illustrate these differences, the trends characterizing divisions with the highest levels of poverty, race, and low adult educational attainment are compared to the trends displayed in divisions with the lowest levels of poverty and race and the highest levels of adult educational attainment. One-third of divisions (44 out of 132) were categorized as having a high level of poverty (more than 47 percent of students in the free or reduced-price lunch program), a high proportion of black pupils (more than 33 percent), and a low level of adult educational attainment (less than 13 percent of college-educated adults). Conversely, one-third of divisions were categorized as having a low concentration of poverty (less than 32 percent of students in the free and reduced-price lunch program), a low proportion of black pupils (less than ten percent), and a high level of adult educational attainment (more than 20 percent of adults are college-educated).
In addition to presenting quantitative trends, the following sections also include feedback from principals interviewed and teachers surveyed by JLARC staff. Their perspectives help to explain why differences in the level of the underlying factors have, in their experience, had an impact on student achievement.
Factors Coinciding with Poverty
Several factors related to test scores strongly coincide with poverty and could help to explain the strong relationship between poverty and SOL test scores. Communities with a high concentration of poverty tend to have a larger proportion of female-headed households, teachers with fewer qualifications and less experience, a school environment that is less safe, and lower attendance rates, as shown in Figure 17. Principals interviewed and teachers surveyed by JLARC staff during the course of this study consistently indicated that these factors, while related to poverty, create further challenges to academic performance.
Percentage of Female-Headed Households Is Higher in High-Poverty Communities. The percentage of households run by single women is closely linked to poverty, and may help to explain the strong quantitative association between poverty and test scores. In Virginia, divisions with a high level of poverty have almost twice as many households run by single mothers as low-poverty divisions.
Principals interviewed by JLARC staff advanced three main reasons why having a large number of students coming from female-headed households may be associated with lower test scores. First, students (particularly boys) raised in fe-male-headed households may lack a positive male influence in the home, a factor that can lead to behavioral issues often associated with lower performance. In addition, single mothers frequently have less time to supervise their child’s academic progress and help with homework. Finally, schools may have to provide more
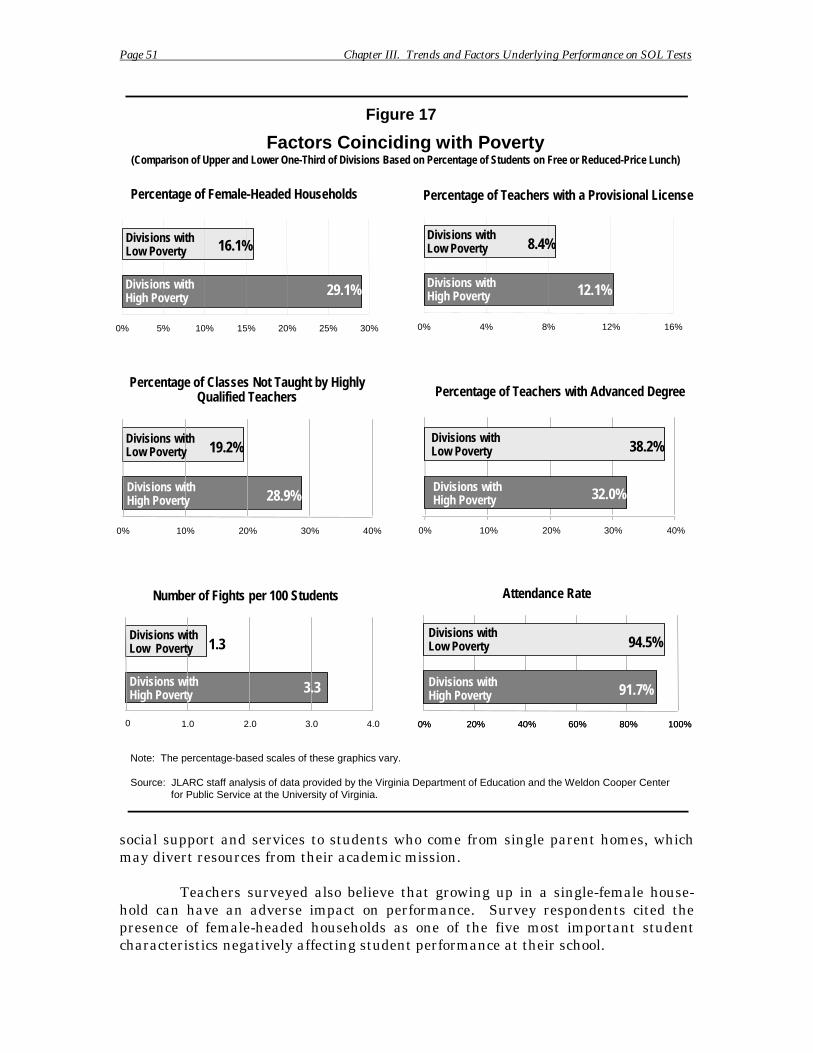
Divisions with Low Poverty
Divisions with High Poverty
0
Page 51 Chapter III. Trends and Factors Underlying Performance on SOL Tests
Figure 17
Factors Coinciding with Poverty (Comparison of Upper and Lower One-Third of Divisions Based on Percentage of Students on Free or Reduced-Price Lunch)
Percentage of Female-Headed Households Percentage of Teachers with a Provisional License
Divisions with Divisions with Low Poverty 8.4%Low Poverty 16.1%
Divisions withDivisions with 29.1% High Poverty 12.1%High Poverty
0% 5% 10% 15% 20% 25% 30% 0% 4% 8% 12% 16%
Percentage of Classes Not Taught by Highly Qualified Teachers Percentage of Teachers with Advanced Degree
28.9%
19.2%Divisions with Low Poverty
Divisions with High Poverty
38.2%
32.0%
Divisions with Low Poverty
Divisions with High Poverty
0% 10% 20% 30% 40% 0% 10% 20% 30% 40%
Number of Fights per 100 Students Attendance Rate
1.3
3.3
Divisions with Low Poverty
Divisions with High Poverty 91.7%
94.5%Divisions with Low Poverty
Divisions with High Poverty
1.0 2.0 3.0 4.0 0% 20% 40% 60% 80% 100%0% 20% 40% 60% 80% 100%
Note: The percentage-based scales of these graphics vary.
Source: JLARC staff analysis of data provided by the Virginia Department of Education and the Weldon Cooper Centerfor Public Service at the University of Virginia.
social support and services to students who come from single parent homes, which may divert resources from their academic mission.
Teachers surveyed also believe that growing up in a single-female household can have an adverse impact on performance. Survey respondents cited the presence of female-headed households as one of the five most important student characteristics negatively affecting student performance at their school.
Page 52 Chapter III. Trends and Factors Underlying Performance on SOL Tests
Fewer Qualified Teachers Are Employed in High-Poverty Areas. Three variables measuring teacher qualifications appear to coincide strongly with poverty and help to further explain why poverty is such a strong performance indicator. The first is the percentage of teachers who hold a provisional license. Teachers who are provisionally licensed have a three-year, non-renewable license to teach, because they lack the qualifications to obtain a renewable one. The second quantifiable measure of teacher qualifications is the percentage of classes taught by a teacher who is not “highly qualified.” Highly qualified teachers must possess both a full State license as well as an endorsement in the area in which they teach. Finally, the last measure of formal qualifications is the percentage of teachers who hold an advanced degree.
High-poverty divisions employ a larger proportion of teachers who are provisionally licensed, have more classes taught by teachers who are not highly qualified, and have fewer teachers who hold an advanced degree, compared to low-poverty areas. On average, divisions with high levels of poverty have over 40 percent more teachers who hold a provisional license than do low-poverty divisions (12.1 percent in high-poverty divisions compared to 8.4 percent in low-poverty areas). A similar trend emerges when comparing the proportion of classes taught by teachers who lack full licensure or endorsement (or both). The proportion of classes not taught by highly qualified teachers is over 50 percent greater in high-poverty divisions than in low-poverty divisions (28.9 percent in high-poverty compared to 19.2 percent in low-poverty divisions). Finally, high-poverty divisions have, on average, 20 percent fewer teachers who hold an advanced degree than do divisions with low poverty (32 percent in high-poverty divisions compared to 38 percent in low-poverty areas).
Principals interviewed by JLARC staff consistently stated that the presence of quality and effective teachers is a fundamental element of academic success. To facilitate strong academic performance, teachers must be highly knowledgeable in the subject that they teach, well-trained in classroom management, and also have the ability to recognize how to effectively convey the material to heterogeneous student groups. While quantitative analysis suggests that a lack of formal qualifications is related to lower test scores, many principals interviewed were able to mitigate potentially adverse effects by strategically placing provisionally licensed or non-endorsed teachers in a classroom where they could succeed. As a result, few principals of the schools visited reported that the use of teachers lacking formal qualifications had an impact on performance. In addition, several of them noted that formal qualifications such as licensure, endorsement, and advanced coursework might not always reflect the quality of the teacher. Teachers may lack formal qualifications for reasons that do not always reflect on their level of experience or ability to teach, such as having recently moved to Virginia from a state with different licensing requirements. Teachers who responded to the JLARC survey cited the presence of highly qualified/experienced teachers as the most important overall factor positively affecting the performance of students at their school.
Fights Occur More Often in High-Poverty Divisions. The incidence of fights, which can provide an indication of safety and order in the school environment, appears to strongly coincide with the presence of poverty. The relationship between school fights and poverty may help to further explain the strong association
Page 53 Chapter III. Trends and Factors Underlying Performance on SOL Tests
that exists between poverty and test scores. On average, fights occur nearly 2.5 times as often in high-poverty as in low-poverty divisions.
Interviews with principals indicate that a safe and orderly environment is a fundamental element of academic success. Several principals who had recently taken over schools with the lowest SOL test scores indicated that the lack of discipline and order was one of the primary causes of their schools’ past poor performance. They stated that an unsafe environment creates distractions from academics, disrupts teaching, and makes teacher recruitment difficult. For these principals, establishing order through a strong disciplinary system was one of their highest priorities.
Teachers who responded to the JLARC survey agreed that safety and order are important elements of academic performance. Respondents cited the incidence of misbehavior and classroom disruption as one of five school characteristics with the greatest adverse impact on student performance at their school.
Attendance Rates Are Lower in High-Poverty Divisions. The strength of the association between attendance and poverty may also offer some insight into the relationship that exists between poverty and test scores. In divisions with high concentrations of poverty, attendance rates are almost three percentage points lower, compared to low-poverty divisions. This equates to an absenteeism rate that is 50 percent greater in high-poverty divisions than in low-poverty ones.
Several principals interviewed by JLARC staff indicated that consistent student attendance is a fundamental prerequisite for strong academic performance. Principals emphasized that this time away from school can be costly because every scheduled school day is needed in order to cover the necessary materials and prepare students for the SOL tests. They further noted that absenteeism is particularly problematic for students raised in poverty because time at school is even more critical for them given the lack of parental support and exposure to academics that they receive at home.
Teachers who responded to the JLARC Teacher Survey supported the notion that attendance is related to test scores. Respondents listed poor attendance as the fourth most important school characteristic negatively impacting the performance of students at their school.
Factors Coinciding with Race
Several factors that may impact academic performance also tend to occur more frequently in places with higher concentrations of black students, and may largely explain the strong relationship that appears to exist between race and SOL test scores. Many of the factors previously described as coinciding with high levels of poverty also coincide with a high proportion of black pupils, which is to be expected because these two demographic characteristics frequently coexist. Some of the factors that are associated with both poverty and race occur roughly to the same extent in high-poverty areas as in areas with a large proportion of black students.
Page 54 Chapter III. Trends and Factors Underlying Performance on SOL Tests
However, disparities in teacher qualifications and levels of experience tend to be more pronounced in divisions with a high proportion of black students than in high-poverty divisions. This strong relationship between race and teacher qualifications and experience may help to explain why race shows an association with SOL test scores that is independent from poverty, given the similarities that areas with high poverty and a large proportion of black students share otherwise. Figure 18 shows the difference in these factors between divisions with high and low concentrations of black pupils.
Several Factors Coinciding with Poverty Also Coincide with Race to a Similar Extent. Some factors are present or occur roughly to the same extent in high poverty areas as in areas with a large proportion of black students, such as a high proportion of female-headed households, a high number of school fights, and low attendance rates.
• Divisions with a high proportion of black pupils have almost twice as many female-headed households as divisions with a low proportion of black pupils.
• Divisions with a high proportion of black pupils have, on average, twice as many fights as divisions with a low proportion of black pupils.
• Divisions with a high proportion of black pupils have, on average, attendance rates that are 2.3 percentage points lower than in divisions with a low proportion of black pupils. This trend indicates that absenteeism is roughly 40 percent higher.
More Teachers Lack Qualifications and Experience in Divisions with a Large Proportion of Black Students than in High-Poverty Divisions. Divisions with a high proportion of black pupils employ significantly more provisionally licensed teachers and have fewer classes taught by highly qualified teachers than do high-poverty divisions and divisions with a low proportion of black pupils. In addition, divisions with a large proportion of black students employ a significantly higher proportion of inexperienced teachers than do divisions with a low proportion of black pupils. In contrast, the percentage of teachers with three or fewer years of experience was not significantly different between high- and low-poverty divisions.
Divisions with a high proportion of black pupils have more than twice as many provisionally licensed teachers as divisions with a low proportion of black pupils. In contrast, high-poverty divisions employ only 1.4 times as many provisionally licensed teachers as low-poverty divisions.
In addition, divisions with a high proportion of black pupils have, on average, 65 percent more classes taught by teachers who are not highly qualified than divisions with a low proportion of black pupils. The disparity in the percentage of classes taught by highly qualified teachers is 40 percent between high- and low-poverty divisions.
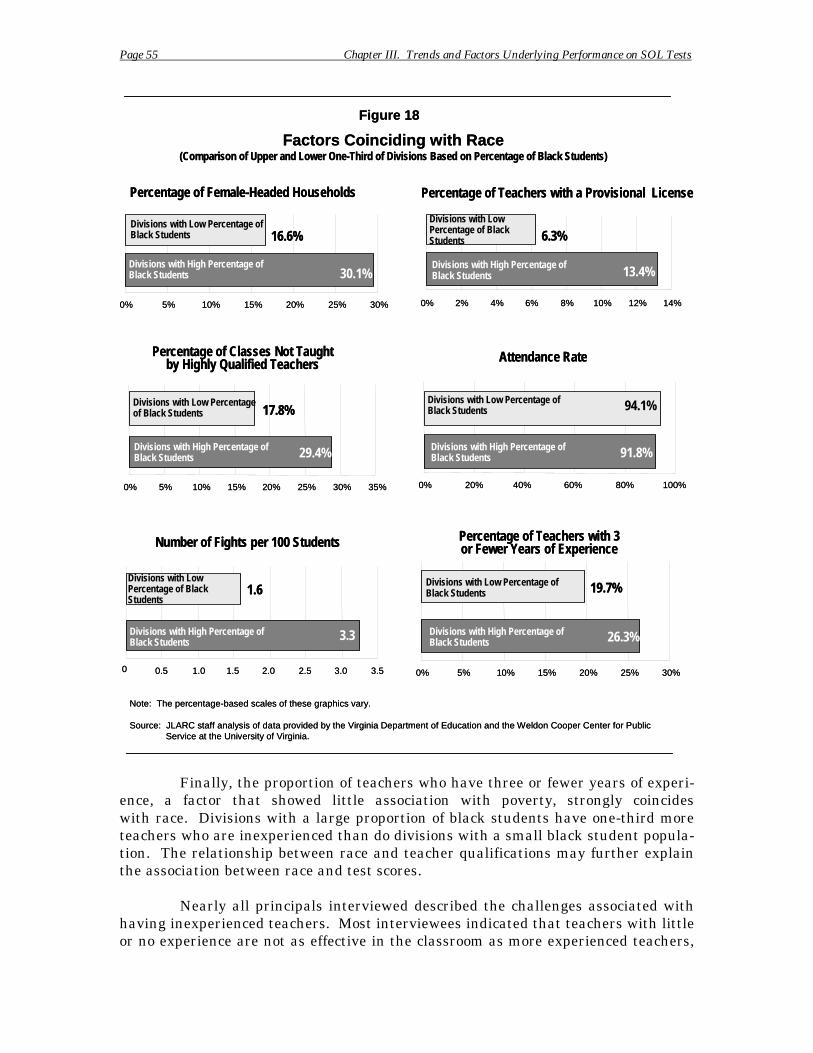
30.1%Divisions with High Percentage ofBlack Students 13.4%
Divisions with LowPercentage of Black Students
Divisions with High Percentage ofBlack Students
91.8%
94.1%Divisions with Low Percentage ofBlack Students
29.4%
Divisions with Low Percentageof Black Students
Divisions with High Percentage ofBlack Students
Divisions with High Percentage ofBlack Students
3.3
Divisions with LowPercentage of Black Students
Divisions with High Percentage ofBlack Students 26.3%
Divisions with Low Percentage ofBlack Students
Divisions with High Percentage ofBlack Students
Divisions with Low Percentage ofBlack Students
0 0
Page 55 Chapter III. Trends and Factors Underlying Performance on SOL Tests
Figure 18Figure 18
Factors Coinciding with RaceFactors Coinciding with Race(Comparison of Upper and Lower One-Third of Divisions Based on Percentage of Black Students)(Comparison of Upper and Lower One-Third of Divisions Based on Percentage of Black Students)
Percentage of Female-Headed Households Percentage of Teachers with a Provisional LicensePercentage of Female-Headed Households Percentage of Teachers with a Provisional License
16.6% 6.3%16.6%
30.1% Divisions with High Percentage of Black Students
6.3%
13.4%
Divisions with Low Percentage of Black Students
Divisions with High Percentage of Black Students
Divisions with Low Percentage of Black Students
0% 5% 10% 15% 20% 25% 30% 0% 2% 4% 6% 8% 10% 12% 14%0% 5% 10% 15% 20% 25% 30% 0% 2% 4% 6% 8% 10% 12% 14%
Percentage of Classes Not TaughtPercentage of Classes Not Taught Attendance RateAttendance Rateby Highly Qualified Teachersby Highly Qualified Teachers
17.8%
91.8%
94.1%Divisions with Low Percentage of Black Students17.8%
29.4%
Divisions with Low Percentage of Black Students
Divisions with High Percentage of Black Students
Divisions with High Percentage of Black Students
0% 5% 10% 15% 20% 25% 30% 35%0% 5% 10% 15% 20% 25% 30% 35% 0% 20% 40% 60% 80% 100%0% 20% 40% 60% 80% 100%
Number of Fights per 100 Students Percentage of Teachers with 3Number of Fights per 100 Students Percentage of Teachers with 3or Fewer Years of Experienceor Fewer Years of Experience
1.6 19.7%1.6
3.3
Divisions with Low Percentage of Black Students
Divisions with High Percentage of Black Students 26.3%
19.7%Divisions with Low Percentage of Black Students
Divisions with High Percentage of Black Students
0.50.5 11.0.0 1.51.5 22.0.0 2.52.5 33.0.0 3.53.5 0%0% 5%5% 1100%% 15%15% 20%20% 25%25% 30%30%
Note: The percentage-based scales of these graphics vary.Note: The percentage-based scales of these graphics vary.
Source: JLARC staff analysis of data provided by the Virginia Department of Education and the Weldon Cooper Center for PublicSource: JLARC staff analysis of data provided by the Virginia Department of Education and the Weldon Cooper Center for PublicService at the University of Virginia.Service at the University of Virginia.
Finally, the proportion of teachers who have three or fewer years of experience, a factor that showed little association with poverty, strongly coincides with race. Divisions with a large proportion of black students have one-third more teachers who are inexperienced than do divisions with a small black student population. The relationship between race and teacher qualifications may further explain the association between race and test scores.
Nearly all principals interviewed described the challenges associated with having inexperienced teachers. Most interviewees indicated that teachers with little or no experience are not as effective in the classroom as more experienced teachers,
Page 56 Chapter III. Trends and Factors Underlying Performance on SOL Tests
and that it can take several years for teachers to develop the skills necessary to reach their full potential. Furthermore, principals mentioned that having to spend a large amount of time mentoring and coaching new faculty creates a drain on resources. Several principals did indicate that, in some instances, new teachers could bring positive change to schools, particularly if the new teachers are replacing ineffective veteran teachers.
Factors Coinciding with Adult Educational Attainment
Like poverty and race, the percentage of college-educated adults in the community may include the impact of other factors that coincide with adult educational attainment and are also associated with test scores. Four factors most strongly coincide with low adult educational attainment, as depicted in Figure 19: lower Adjusted Gross Income (AGI) per capita, smaller per-capita revenue capacity, lower teacher salaries, and lower operating expenditures per pupil. This section describes the relationship between these factors in greater detail.
AGI Per Capita and Per-Capita Revenue Capacity Are Lower in Communities with Low Adult Educational Attainment. AGI per capita and revenue capacity per capita are two measures of local fiscal conditions that coincide with adult educational attainment and are also associated with test scores. AGI per capita is a measure of the average personal income level of a community’s residents. Although this variable does not provide a measure of parental income specifically, it is a good approximation of this factor, particularly in fairly homogenous communities. The per-capita AGI of divisions with low levels of adult educational attainment is roughly 60 percent of that in divisions where a high proportion of adults hold a college degree.
While AGI captures the income level of community members, revenue capacity measures a locality’s ability to pay for education, given the size of the com-munity’s total tax base and assuming an equalized tax rate across Virginia. The per-capita local revenue capacity of divisions with low levels of adult educational attainment is roughly 65 percent that of its more highly educated counterparts’.
Principals indicated that parental income has an effect on test scores and attributed this relationship to the level of resources available to supplement a child’s education in the home. They also referred to the affluence of the community at large as affecting opportunities available to complement education, such as access to museums, libraries, and cultural events.
Teacher Salaries Are Lower in Divisions with a Low Proportion of College-Educated Adults. The level of average teacher salaries highly coincides with a community’s educational attainment, and could help to further explain why adult educational attainment is linked to test scores. Teacher salaries in areas with a low number of college graduates are, on average, $5,300, or 13 percent, lower than those in communities where a large proportion of adults are college-educated.
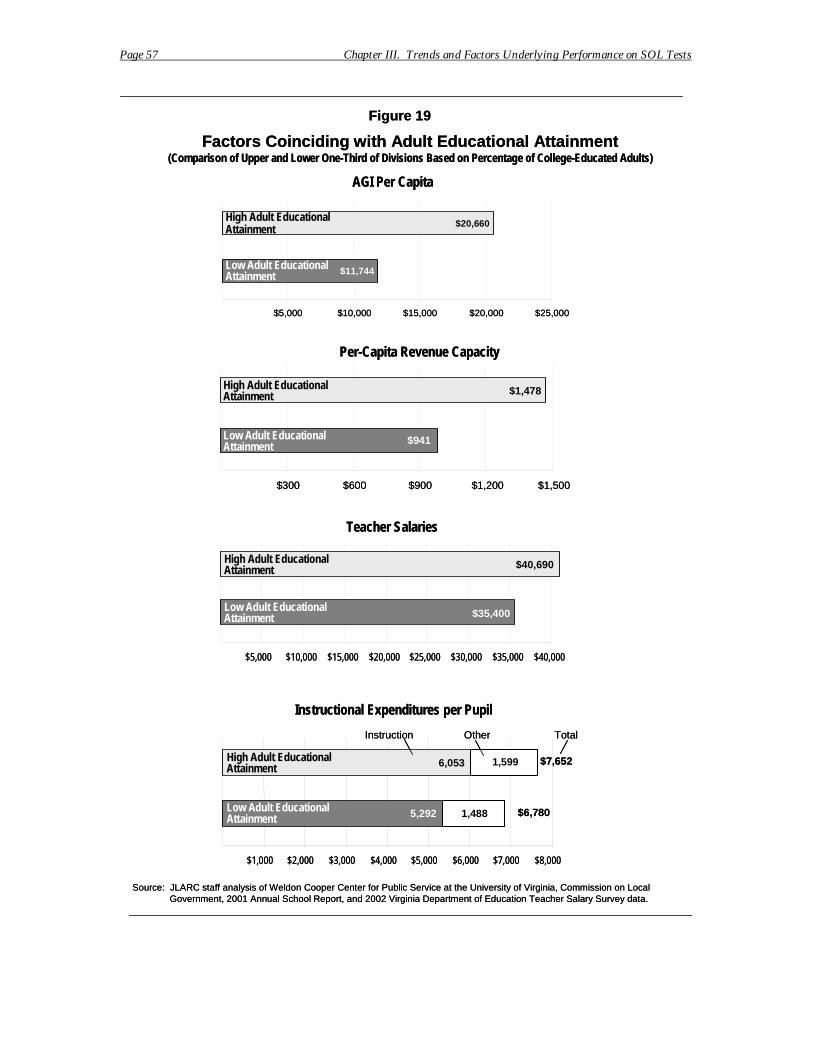
$11,744
$20,660High Adult Educational Attainment
Low Adult EducationalAttainment
$1,478
$941
High Adult EducationalAttainment
Low Adult EducationalAttainment
$40,690
$35,400
High Adult EducationalAttainment
Low Adult EducationalAttainment
5,292
6,053 1,599
1,488
High Adult EducationalAttainment
Low Adult EducationalAttainment
Page 57 Chapter III. Trends and Factors Underlying Performance on SOL Tests
Figure 19Figure 19
Factors Coinciding with Adult Educational AttainmentFactors Coinciding with Adult Educational Attainment(Comparison of Upper and Lower One-Third of Divisions Based on Percentage of College-Educated Adults)(Comparison of Upper and Lower One-Third of Divisions Based on Percentage of College-Educated Adults)
AGI Per CapitaAGI Per Capita
$11,744
$20,660High Adult Educational Attainment
Low Adult Educational Attainment
$5,000 $10,000 $15,000 $20,000 $25,000$5,000 $10,000 $15,000 $20,000 $25,000
Per-Capita Revenue CapacityPer-Capita Revenue Capacity
$1,478
$941
High Adult Educational Attainment
Low Adult Educational Attainment
$300 $600 $900 $1,200 $1,500$300 $600 $900 $1,200 $1,500
Teacher SalariesTeacher Salaries
$40,690
$35,400
High Adult Educational Attainment
Low Adult Educational Attainment
$5,000 $10,000 $15,000 $20,000 $25,000 $30,000 $35,000 $40,000$5,000 $10,000 $15,000 $20,000 $25,000 $30,000 $35,000 $40,000
Instructional Expenditures per PupilInstructional Expenditures per Pupil
Instruction Other Total
$7,652
$6,780
Instruction Other Total
5,292
6,053 1,599
1,488
$7,652
$6,780
High Adult Educational Attainment
Low Adult Educational Attainment
$1,000 $2,000 $3,000 $4,000 $5,000 $6,000 $7,000 $8,000$1,000 $2,000 $3,000 $4,000 $5,000 $6,000 $7,000 $8,000
Source: JLARC staff analysis of Weldon Cooper Center for Public Service at the University of Virginia, Commission on LocalSource: JLARC staff analysis of Weldon Cooper Center for Public Service at the University of Virginia, Commission on LocalGovernment, 2001 Annual School Report, and 2002 Virginia Department of Education Teacher Salary Survey data.Government, 2001 Annual School Report, and 2002 Virginia Department of Education Teacher Salary Survey data.
Page 58 Chapter III. Trends and Factors Underlying Performance on SOL Tests
Salary levels can have an impact on a division’s ability to recruit and retain teachers. Many principals indicated that having lower teacher salary levels than neighboring divisions or states makes it more difficult to recruit and retain qualified teachers. Furthermore, several principals believe that in divisions with challenges, offering comparable salaries may not be sufficient to compete with neighboring, higher-performing localities given the added pressures of accreditation, SOL test performance, greater demands for social services, and more violence encountered in challenged schools.
Instructional Expenditures Per Pupil Are Lower in Communities with Low Adult Educational Attainment. Divisions with a high proportion of college graduates tend to spend more money on instruction per pupil than divisions with a low proportion of college-educated adults. Instructional expenditures include all federal, State and local education funding for a division (excluding school lunch expenditures). These expenditures per pupil are nearly 13 percent lower in divisions with a low number of college-educated adults than in divisions with high adult educational attainment.
As previously indicated, most school divisions receive funds that go beyond SOQ cost levels, and some federal funds are provided in greater quantity to schools with high poverty levels. Most principals indicated that lack of funding for instruction did not significantly impact student SOL test performance. In fact, many principals from challenged schools cited the value of federal, State, and locally-targeted assistance in helping them each year to overcome the challenges that they face, and several indicated that additional funding would help them further. This funding is used to pay for resources such as additional mathematics and reading specialists, after-school tutors, teacher assistants, and supplemental learning materials.
PROFILES OF SCHOOL DIVISIONS WITH THE HIGHEST AND LOWEST SOL TEST SCORES
Comparative analysis of school divisions in Virginia with the highest and lowest SOL test scores further demonstrates some of the trends identified through the statistical analysis. As requested by the study mandate, this section provides profiles of divisions with the highest and lowest SOL test scores, and compares these divisions based on: SOL test scores and other performance indicators, student and family characteristics, teacher experience and qualifications, and school and division characteristics (Table 14). Appendix G provides similar profiles at the school level.
Large differences exist in SOL test scores and other performance indicators between the highest- and lowest-scoring divisions. The highest-scoring divisions have average SOL test scores that are 53 points higher than the lowest-scoring ones, as well as higher on-time graduation rates. Conversely, the lowest-scoring divisions have higher dropout and retention rates.
There are also substantial differences in student and family demographics between the highest and lowest scoring divisions. Divisions with the highest scores have much lower percentages of poverty and black students than divisions with the
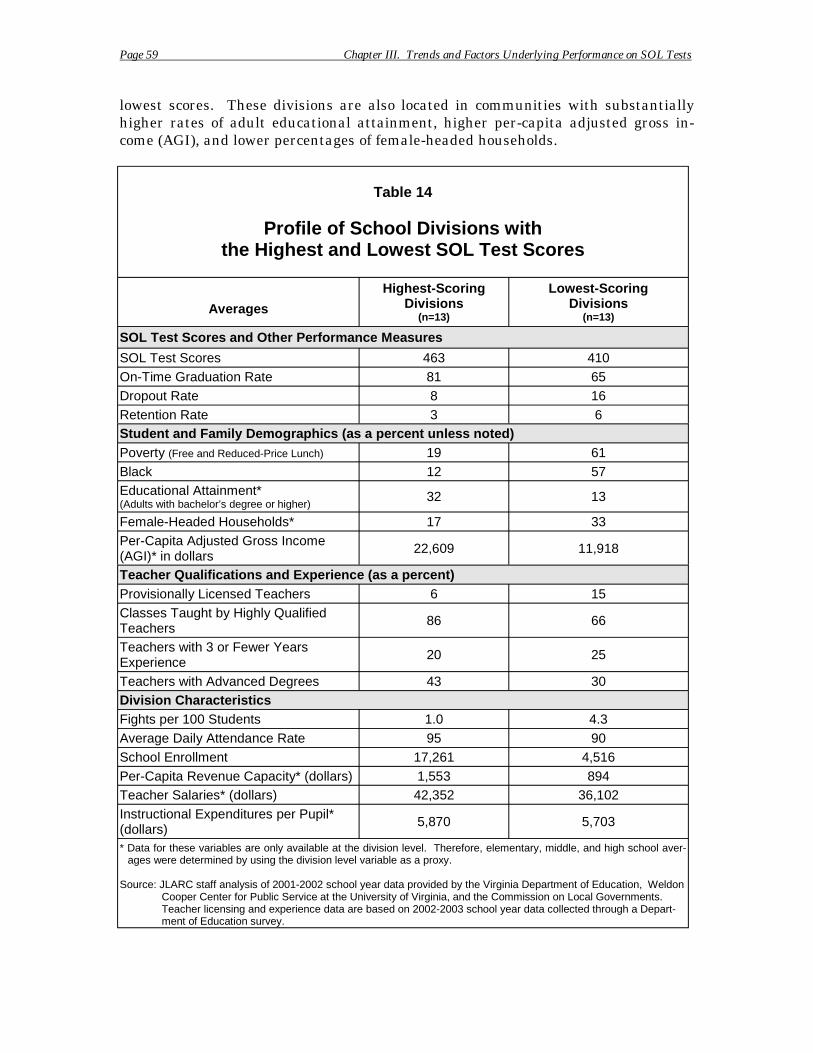
Page 59 Chapter III. Trends and Factors Underlying Performance on SOL Tests
lowest scores. These divisions are also located in communities with substantially higher rates of adult educational attainment, higher per-capita adjusted gross income (AGI), and lower percentages of female-headed households.
Table 14
Profile of School Divisions with the Highest and Lowest SOL Test Scores
Averages
Highest-Scoring Divisions
(n=13)
Lowest-Scoring Divisions
(n=13)
SOL Test Scores and Other Performance Measures
SOL Test Scores 463 410 On-Time Graduation Rate 81 65 Dropout Rate 8 16 Retention Rate 3 6 Student and Family Demographics (as a percent unless noted) Poverty (Free and Reduced-Price Lunch) 19 61 Black 12 57 Educational Attainment* (Adults with bachelor’s degree or higher)
32 13
Female-Headed Households* 17 33 Per-Capita Adjusted Gross Income (AGI)* in dollars
22,609 11,918
Teacher Qualifications and Experience (as a percent) Provisionally Licensed Teachers 6 15 Classes Taught by Highly Qualified Teachers
86 66
Teachers with 3 or Fewer Years Experience
20 25
Teachers with Advanced Degrees 43 30 Division Characteristics Fights per 100 Students 1.0 4.3 Average Daily Attendance Rate 95 90 School Enrollment 17,261 4,516 Per-Capita Revenue Capacity* (dollars) 1,553 894 Teacher Salaries* (dollars) 42,352 36,102 Instructional Expenditures per Pupil* (dollars)
5,870 5,703
* Data for these variables are only available at the division level. Therefore, elementary, middle, and high school averages were determined by using the division level variable as a proxy.
Source: JLARC staff analysis of 2001-2002 school year data provided by the Virginia Department of Education, Weldon Cooper Center for Public Service at the University of Virginia, and the Commission on Local Governments. Teacher licensing and experience data are based on 2002-2003 school year data collected through a Department of Education survey.
Page 60 Chapter III. Trends and Factors Underlying Performance on SOL Tests
The highest-scoring divisions have a lower percentage of teachers who are less-qualified and experienced than the lowest-scoring divisions. They have a lower proportion of provisionally licensed teachers and a lower percentage of teachers with three or fewer years teaching experience than those with the lowest scores. High-scoring divisions also have more classes taught by highly qualified teachers, as well as a higher percentage of teachers who hold advanced degrees.
Other characteristics also differ between the highest and lowest performing divisions. The highest-scoring divisions have fewer fights, higher attendance rates, and higher enrollment than those with the lowest scores. These divisions on average have higher revenue capacity per capita, teacher salaries, and instructional expenditures per student than the lowest-scoring ones.
Although the comparative and regression analyses described in this chapter establish which factors tend to be associated with lower test scores, these findings do not mean that all schools and divisions follow these trends. Schools and divisions can and do exceed expectations, and this appears to occur, at least in part, due to their use of practices that allow them to overcome challenges and experience higher levels of success on the SOL tests than might be expected. A qualitative review of schools and divisions is necessary to understand the practices that enable schools and divisions to achieve test scores that exceed the performance levels predicted by their demographic profile. The following chapter details JLARC staff findings.
Page 61 Chapter IV. Best Practices in Schools and Divisions Performing Well on the SOL Tests
IV. Best Practices in Schools and School DivisionsPerforming Well on the SOL Tests
The statistical trends discussed in Chapter III indicate that poverty, race, and adult educational attainment in the community are powerful predictors of SOL test performance in schools and divisions. However, in some schools, students are scoring better than might be expected based on these trends. Higher than expected scores of the students in these schools indicates that under certain conditions or circumstances, it is possible to overcome the challenges associated with poverty, race, and educational attainment. The strength of the overall pattern that is seen, on the other hand, suggests that this can be difficult to accomplish.
JLARC staff examined school and division practices in 61 schools located in 35 divisions (Appendix C) during the course of this study, and identified numerous practices that appear to have been most effective in fostering higher SOL test scores. Most of the schools with high student performance on SOL tests – both schools with high SOL test scores, and schools that have higher scores relative to the challenges they have had to overcome – share certain effective practices. Some of the practices that seem particularly critical to academic performance include strong leadership and the establishment of a team of effective teachers. Schools with the highest SOL test scores are called “high-scoring” schools in this chapter. Schools with at least one challenge (high poverty, high proportion of black students, or low adult educational attainment) that have higher test scores than might be expected based on the presence of one or more of these factors, or that have demonstrated marked improvement on SOL tests despite the challenges they face, are referred to as “successful challenged” schools. For ease of reference, in certain sections of Chapters IV and V, the high-scoring and successful challenged schools are jointly referred to as “successful” schools, to indicate their success on the SOL tests.
Most successful challenged schools that have overcome the challenges associated with poverty, race, and low adult educational attainment have gone beyond the effective practices used by high-scoring schools. In most cases, these schools have had to fill the gap between the level of support provided by parents and the additional level of support necessary for their students to score well on the SOL tests. Principals and teachers in these schools must work hard, and creatively, to produce an environment conducive to learning.
While much of the success of schools on the SOL tests results from practices employed at the school level, the amount of support provided at the division level can affect student test score performance. Although all divisions provide certain basic services, some divisions offer additional support that appears to contribute to the success of the schools in their divisions on the SOL tests. Many of these additional division services reinforce the best practices employed at the school level, by providing the schools with resources for initiatives such as staff development or pacing guides.
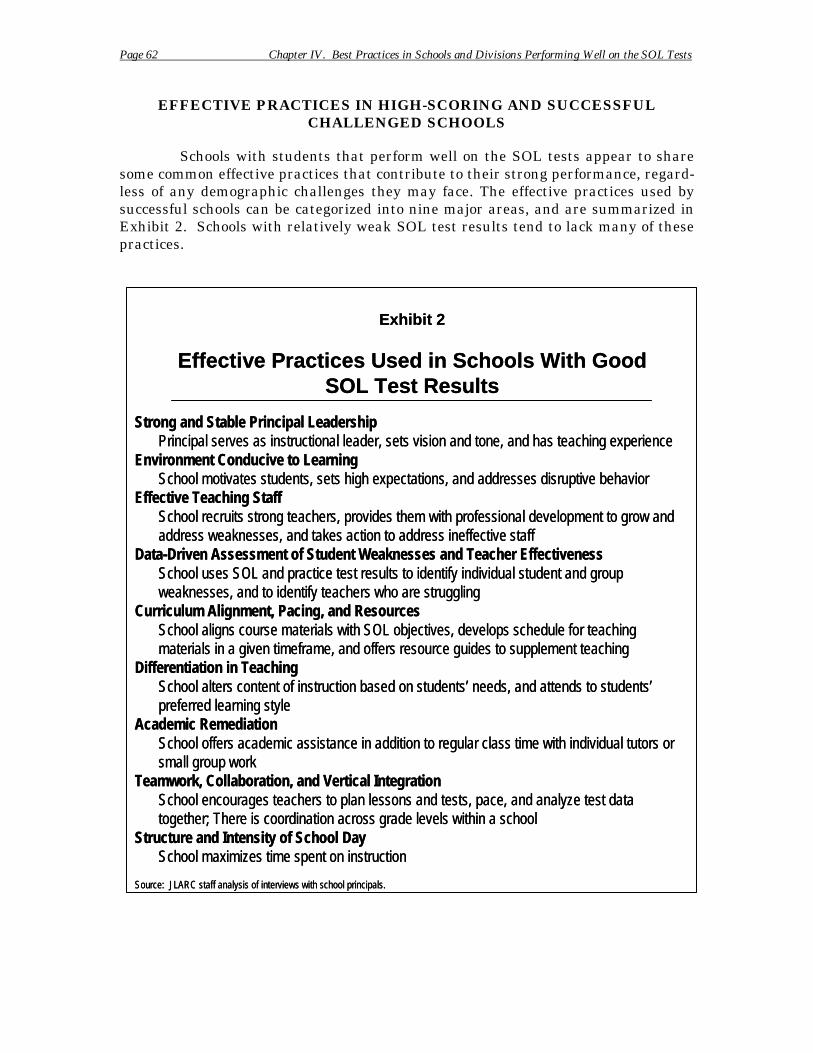
Page 62 Chapter IV. Best Practices in Schools and Divisions Performing Well on the SOL Tests
EFFECTIVE PRACTICES IN HIGH-SCORING AND SUCCESSFUL CHALLENGED SCHOOLS
Schools with students that perform well on the SOL tests appear to share some common effective practices that contribute to their strong performance, regardless of any demographic challenges they may face. The effective practices used by successful schools can be categorized into nine major areas, and are summarized in Exhibit 2. Schools with relatively weak SOL test results tend to lack many of these practices.
Exhibit 2Exhibit 2
Effective Practices Used in Schools With GoodEffective Practices Used in Schools With GoodSOL Test ResultsSOL Test Results
Strong and Stable Principal LeadershipStrong and Stable Principal LeadershipPrincipal serves as instructional leader, sets vision and tone, and has teaching experiencePrincipal serves as instructional leader, sets vision and tone, and has teaching experience
Environment Conducive to LearningEnvironment Conducive to LearningSchool motivates students, sets high expectations, and addresses disruptive behaviorSchool motivates students, sets high expectations, and addresses disruptive behavior
Effective Teaching StaffEffective Teaching StaffSchool recruits strong teachers, provides them with professional development to grow andSchool recruits strong teachers, provides them with professional development to grow andaddress weaknesses, and takes action to address ineffective staffaddress weaknesses, and takes action to address ineffective staff
Data-Driven Assessment of Student Weaknesses and Teacher EffectivenessData-Driven Assessment of Student Weaknesses and Teacher EffectivenessSchool uses SOL and practice test results to identify individual student and groupSchool uses SOL and practice test results to identify individual student and group weaknesses, and to identify teachers who are strugglingweaknesses, and to identify teachers who are struggling
Curriculum Alignment, Pacing, and ResourcesCurriculum Alignment, Pacing, and ResourcesSchool aligns course materials with SOL objectives, develops schedule for teachingSchool aligns course materials with SOL objectives, develops schedule for teachingmaterials in a given timeframe, and offers resource guides to supplement teachingmaterials in a given timeframe, and offers resource guides to supplement teaching
Differentiation in TeachingDifferentiation in TeachingSchool alters content of instruction based on students’ needs, and attends to students’School alters content of instruction based on students’ needs, and attends to students’ preferred learning stylepreferred learning style
Academic RemediationAcademic RemediationSchool offers academic assistance in addition to regular class time with individual tutors orSchool offers academic assistance in addition to regular class time with individual tutors or small group worksmall group work
Teamwork, Collaboration, and Vertical IntegrationTeamwork, Collaboration, and Vertical IntegrationSchool encourages teachers to plan lessons and tests, pace, and analyze test dataSchool encourages teachers to plan lessons and tests, pace, and analyze test data together; There is coordination across grade levels within a schooltogether; There is coordination across grade levels within a school
Structure and Intensity of School DayStructure and Intensity of School DaySchool maximizes time spent on instructionSchool maximizes time spent on instruction
Source: JLARC staff analysis of interviews with school principals.Source: JLARC staff analysis of interviews with school principals.
Page 63 Chapter IV. Best Practices in Schools and Divisions Performing Well on the SOL Tests
Best Practices Used by Schools with Higher SOL Test Results
Based on interviews with principals that have achieved academic success, in both high-scoring and successful challenged schools, there appear to be nine effective practices that help promote student achievement on the SOL tests. These practices are: (1) strong and stable leadership; (2) an environment conducive to learning; (3) an effective teaching staff; (4) data-driven assessment of student weaknesses and teacher effectiveness; (5) curriculum alignment and pacing; (6) the use of differentiation in teaching to meet the needs of all students; (7) an emphasis on academic remediation; (8) the use of teamwork and collaboration within grades and vertical integration across grade levels, and (9) the maximization of instructional time through attention to the structure and intensity of the school day. The remainder of this section discusses each of these practices in more detail.
Strong and Stable Principal Leadership. One of the keys to academic success for students appears to be strong leadership provided by the school principal. In successful schools, the principals have had extensive experience as teachers, and serve as the instructional leaders of their schools. They set the vision and tone in their schools, develop the overall instructional strategy, and ensure that academic achievement remains the school’s highest priority.
Environment Conducive to Learning. Successful schools also emphasize the importance of having an environment conducive to learning by creating order, motivation, and high expectations. Principals interviewed stressed that the first step for success is to eliminate classroom distractions by addressing disruptive behavior. Principals and teachers do this by establishing clear standards for student behavior, communicating behavioral expectations to students, and enforcing those standards through discipline.
Principals in successful schools also emphasized the importance of motivating students to want to achieve academically by instilling a belief in their students that they can succeed. Principals do this through school assemblies, as well as small group and one-on-one meetings with students. In addition, they recognize student achievement through awards assemblies, the honor roll, newsletters, and morning announcements. Teachers also motivate students at the classroom level by setting high expectations for their students and by constantly reinforcing their achievement.
Effective Teaching Staff. Successful schools also establish a team of teachers who are able to teach effectively. Teachers in these schools are provided with the professional development they need to advance professionally. Successful schools help their teachers develop professionally by sending them to conferences and workshops, by giving them the chance to observe other teachers, and by providing them with opportunities to pursue coursework and graduate degrees. In addition, these schools are able to recruit strong teachers based on the school’s reputation of success. They also work to retain teachers by supporting them and providing them with opportunities to grow professionally.
Principals in these schools also do not tolerate ineffective teachers and take action to address this issue. Principals provide ineffective teachers with opportuni
Page 64 Chapter IV. Best Practices in Schools and Divisions Performing Well on the SOL Tests
ties to address their weaknesses and improve their performance. If poor performance continues, they encourage teachers to retire or transfer, and if necessary, seek their removal. In instances in which schools are unable to remove these teachers, these schools have been creative in reassigning them so that they are not teaching a core subject course or in a SOL test grade level.
Data-Driven Assessment of Student Weaknesses and Teacher Effectiveness in Teaching the SOL Objectives. In schools that are successful on the SOL tests, school-wide assessments and data analysis have become key practices used to improve student performance and to assess teacher effectiveness in teaching the curriculum. These assessments include both formal SOL tests as well as practice tests. Test results are analyzed to identify areas of weakness for entire classes or grades as well as for individual students. Data can be analyzed down to the question level to identify specific student weaknesses. Data analysis helps teachers to adjust their instructional approach and to re-teach material that was not understood by a class or grade the first time. In addition, it is used to identify students who need remediation.
Test results can also be used to assess teacher performance and to help identify teachers who are not effectively teaching the material. This analysis allows principals to constructively address performance issues. Principals noted that one of the advantages of using this type of analysis is that it provides objective data regarding the performance of teachers, and can be used to demonstrate the need for teachers to improve their performance in teaching the SOL objectives.
Curriculum Alignment, Pacing, and Resources. Schools with students who perform well on the SOL tests also effectively align and pace their curriculum, and provide the necessary resources to teach. Curriculum alignment involves conforming the material that will be taught to students with the standards that have been established, in this case the SOLs. In other words, successful schools ensure that they cover the material that will be assessed on the tests. Successful schools also ensure that they have a detailed pacing guide, which provides a timeline that allows for all of the necessary material to be covered by the end of the school year.
Along with curriculum alignment and pacing, these schools also ensure that the teachers have the resources needed to teach their lessons. Curriculum resource guides are developed through collaborative efforts among grade-level teachers at the school level.
Differentiation in Teaching. Successful schools also emphasize the importance of differentiated instruction. These schools differentiate both in the content and in the process of instruction based on the diverse needs of their individual students. Teachers provide multiple ways for students to acquire new information by presenting tiered lessons that offer remediation, practice, or enrichment opportunities to students based on their individual needs.
Differentiated instruction also attends to a student’s preferred learning style, which is the process by which an individual best understands and retains information. For example, visual learners learn best when they can see the informa
Page 65 Chapter IV. Best Practices in Schools and Divisions Performing Well on the SOL Tests
tion, while auditory learners learn best when they can listen to and speak about new information. Kinesthetic learners prefer “hands-on” learning.
Teachers who differentiate instruction use continual assessments as a tool to determine the academic level of students, as well as flexible grouping practices. As a result, students may work in small or large groups, or individually, depending on their current needs. With this method, teachers pre-assess students at the beginning of a learning exercise in order to determine which learning objectives they already know and which ones they still need to learn. Teachers then group and instruct students according to their academic readiness levels. For some units, teachers may instead assess and group students according to their learning styles or personal interests. As students proceed through the exercise, teachers continue to assess their students’ progress and make necessary adjustments to the groupings. Finally, students are assessed based on what they have learned at the end of the lesson.
Academic Remediation. Successful schools effectively use remediation to supplement regular classroom instruction. Remediation may include one-on-one tutoring or small group work. It usually takes place before or after school, or during lunch. The general approach is to provide immediate assistance when student weaknesses are identified so that students do not fall further behind in the classroom.
Teamwork, Collaboration, and Vertical Integration. Another key practice for successful schools is an emphasis on teamwork, collaboration, and vertical integration. Teamwork and collaboration involve teachers working together to plan lessons, perform assessments, adjust instructional pacing, and analyze test results. In the elementary grades, teachers within the same grade level work together as a team in developing lessons and assessments. In the higher grades, collaboration occurs both by subject matter and by grade. Vertical integration involves communication and coordination across different grade levels.
Collaboration enables teachers to divide responsibilities and to share ideas about how to most effectively teach the curriculum. It also allows teachers to assess data together in order to identify and jointly develop strategies to address general student weaknesses. One principal in a successful school stated that their school motto is “If we are all pulling the wagon, the load is not as heavy.”
Principals in successful schools also emphasized the importance of vertical integration across grade levels. Teachers work together across grades to improve transitions from one grade to another and to ensure that students are adequately prepared for the requirements of the next grade level.
Structure and Intensity of the School Day. Successful schools also establish a school structure and schedule that meets the needs of their students and helps to further their academic success. They structure the schedule so that students will receive the instructional time they need in core subjects. They also prioritize instruction over other activities and develop schedules that maximize the time spent on instruction.
Page 66 Chapter IV. Best Practices in Schools and Divisions Performing Well on the SOL Tests
Many Effective Practices Are Absent in Schools with Low SOL Test Scores
Based on the schools visited for this review, it appears that these effective practices are often absent in schools with low SOL test scores. (References to “schools with low SOL test scores” or “low-scoring schools” include schools with some of the lowest scores, as well as schools with low scores that have shown the least amount of improvement.) Many of these schools have lacked strong or stable leadership because they have had multiple principals in a short period of time. One of the schools visited by JLARC staff had four principals in five years. In addition, some principals who recently arrived at schools with low scores indicated that their predecessors do not appear to have embraced the role of being an instructional leader. These principals had not been actively involved in guiding instruction and had served more as building managers.
Other schools visited that have had low scores have failed to create an environment conducive to learning. Some of these schools have not been able to effectively control disruptive behavior. Several principals recently hired at schools with low SOL test results have stated that their predecessors did not appear to have disruptive behavior under control.
Other schools appear to have struggled because they did not believe in the ability of their students to succeed. One principal described one of her major obstacles as “having low income families with children of low abilities.” At another school, the principal and teachers stated that they did not believe that all of their students could meet the State’s minimum standards.
In addition, some of these schools do not appear to have set high expectations for their students. One principal who was recently hired at a low-scoring school indicated that he was surprised to learn that most of the students were not familiar with the PSAT or SAT tests. In addition, he found that few students discussed the possibility of attending colleges with strong academic reputations, but instead talked about going to community colleges or four-year institutions with lower academic reputations. This principal speculated that his predecessor had not believed in the potential of his students and never set high expectations for them.
Low-scoring schools also appear to have more difficulty in building an effective teaching staff, and may be less successful in removing teachers that have not been effective. Some principals of schools with low SOL test results described the difficulty in recruiting qualified, effective teachers. Two primary reasons were cited. Some principals indicated that young professionals do not want to relocate to rural school divisions. Other rural principals pointed to the fact that salaries in their division are not competitive with neighboring school divisions in Virginia or North Carolina.
In addition to the difficulty in recruiting teachers in general, schools with low SOL test scores appear to hire teachers with less experience. While schools with strong reputations are often able to hire experienced teachers, schools with low SOL test scores often hire teachers with little or no experience. These teachers appear to then move to more successful divisions after acquiring teaching experience.
Page 67 Chapter IV. Best Practices in Schools and Divisions Performing Well on the SOL Tests
Some of the schools visited with low SOL test results appeared to tolerate poor performing teachers instead of either addressing their needs or dismissing them. One principal in a low-scoring school indicated that “they do not have the luxury of getting rid of poor performing teachers, especially if they are community people.” Several principals who have recently come to schools with low SOL test results noted that one of the biggest problems they found when they arrived at the school was that teachers were not fully committed. Principals have described them as “dead weight” or having “lost their fire.” Another principal described problems with having teachers who are teacher-centered rather than student-focused. At another school, the principal stated that the biggest problem facing the school when she was hired was having teachers who did not belong in the classroom, because they did not believe that their students could achieve. In one school visited, 25 percent of the teachers had provisional licenses. According to the principal, their lack of experience adversely impacted their teaching effectiveness and the school’s test scores.
Many of the schools visited that have had low SOL test results are not implementing other effective practices used in successful schools. Some of the schools do not appear to be effectively using data analysis. Several of the schools visited did not have curriculums that were aligned with the SOLs, or in other cases had textbooks that were not aligned with the curriculum. In addition, principals of some of these schools indicated that they have teachers who tend to teach using a traditional lecture style and do not differentiate their instruction. Teamwork and collaboration also appear to be absent in many of these schools, and some of these schools appear to schedule less time for instruction in core subject areas than schools with students who have performed well on SOL tests.
SOME CHALLENGED SCHOOLS HAVE BEEN SUCCESSFUL
While most of the high-scoring schools have students who come from mid-dle-income or affluent homes with parents who have college degrees, there are also schools that have achieved success on SOL tests despite the challenges of having students who come from poor homes and who have parents with a limited education. While the backgrounds of these students who receive little parental support or exposure to learning outside of school can create enormous challenges for the schools, some of these schools appear to overcome these challenges. Schools overcome these challenges by effectively implementing each of the nine practices discussed in the previous section, by using some of these practices to a greater degree, and by adopting some supplemental practices. Exhibit 3 illustrates the differences in the described characteristics between high-scoring schools, successful challenged schools, and low-scoring schools.
Some Schools Face Major Challenges to Academic Achievement
As discussed in Chapter III, there are certain effects of poverty, race, and educational attainment that can impact school performance. They include: (1) lack of parental support, (2) lack of student motivation, (3) lack of academic preparation, (4) transiency of students, and (5) presence of violence in the community. These are
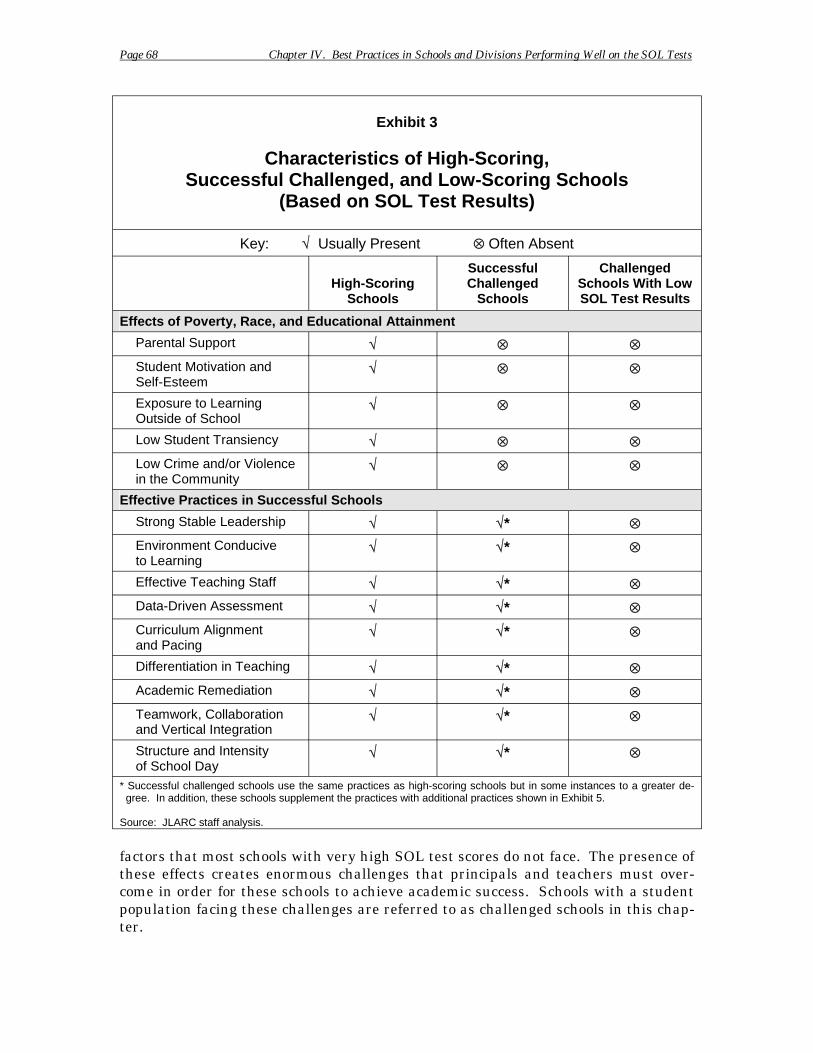
Page 68 Chapter IV. Best Practices in Schools and Divisions Performing Well on the SOL Tests
Exhibit 3
Characteristics of High-Scoring, Successful Challenged, and Low-Scoring Schools
(Based on SOL Test Results)
Key: √ Usually Present ⊗ Often Absent
High-Scoring Schools
Successful Challenged
Schools
Challenged Schools With Low SOL Test Results
Effects of Poverty, Race, and Educational Attainment
Parental Support √ ⊗ ⊗ Student Motivation and Self-Esteem
√ ⊗ ⊗
Exposure to Learning Outside of School
√ ⊗ ⊗
Low Student Transiency √ ⊗ ⊗ Low Crime and/or Violence in the Community
√ ⊗ ⊗
Effective Practices in Successful Schools
Strong Stable Leadership √ √* ⊗ Environment Conducive to Learning
√ √* ⊗
Effective Teaching Staff √ √* ⊗ Data-Driven Assessment √ √* ⊗ Curriculum Alignment and Pacing
√ √* ⊗
Differentiation in Teaching √ √* ⊗ Academic Remediation √ √* ⊗ Teamwork, Collaboration and Vertical Integration
√ √* ⊗
Structure and Intensity of School Day
√ √* ⊗
* Successful challenged schools use the same practices as high-scoring schools but in some instances to a greater degree. In addition, these schools supplement the practices with additional practices shown in Exhibit 5.
Source: JLARC staff analysis.
factors that most schools with very high SOL test scores do not face. The presence of these effects creates enormous challenges that principals and teachers must overcome in order for these schools to achieve academic success. Schools with a student population facing these challenges are referred to as challenged schools in this chapter.
Page 69 Chapter IV. Best Practices in Schools and Divisions Performing Well on the SOL Tests
Lack of Parental Support. In many of the challenged schools visited, principals indicated that they could not depend on parents to provide sufficient support. In some instances, parents are not even meeting the basic needs of their children. They described children coming to their schools who are in need of adequate food, appropriate eyeglasses, suitable clothes, or a regular bath. These challenged schools often have a substantial number of children who come from dysfunctional families and who need professional counseling or therapy. On a different level, principals in these challenged schools also described parents who are not even responsible for regularly waking their children for school.
In other instances, the children’s basic needs may have been met, but the parents provide limited support to their children for their schoolwork. Several principals interviewed said that some students have a poor home environment that limits their ability to do homework or anything related to school after school hours. These schools recognize that they must provide all of the instruction and support that these children need to succeed academically during the school day.
Lack of Motivation and Self-Esteem. Along with the lack of parental support, many of the schools have a large portion of students who lack the motivation to achieve academically. Often associated with this lack of motivation is a lack of confidence and self-esteem. Many of these children do not have role models in their lives who value education, and they receive little or no reinforcement for their academic successes. These schools are faced with the tasks of building the self-esteem of their students and motivating them to want to succeed academically. One principal described how his school, which is located in one of the poorest counties in the State, has had to overcome a lack of confidence among the student population and a belief that students in the school and division are less likely to achieve academically than students in neighboring counties.
Lack of Exposure to Learning. Challenged schools are also faced with students who receive limited exposure to learning outside of school. Principals described children who come from homes that do not contain a single book, magazine, or newspaper. They have never seen any type of written material or anyone reading. Not only do many of these children have limited exposure to reading, but they have limited experience communicating prior to kindergarten. They have spent much of their lives watching television and have had only minimal contact with adults. In describing this problem, one principal stated that “many kids come to school and do not know how to talk because no one ever listens to them.” Another principal explained that the difference in vocabulary between kindergartners in his school that had exposure to learning and those that did not may be as much as 1,000 words.
Many of these schools must also educate children who are behind developmentally. They must teach those students who are prepared for kindergarten at the level they need to be taught while simultaneously working with children who need supplemental assistance in order to perform at the kindergarten level.
Transiency. Another major obstacle faced by many of these schools is a high level of transiency in their student population. One of the principals inter

Page 70 Chapter IV. Best Practices in Schools and Divisions Performing Well on the SOL Tests
viewed estimated that more than one-third of her student population turns over during a single school year. A school superintendent described how he has a large number of families in his division living in hotels, and he said that it is not uncommon for students in these families to go to three or four different schools in a single school year.
Principals explained that high transiency rates create major obstacles for the schools. Many of these students who come in during the school year are not at the same academic level and immediately need remediation. These students often come from backgrounds with different behavioral expectations, which creates disciplinary issues for the schools as well.
Crime and Violence in the Community. Finally, some of the challenged schools face a substantial problem with crime and violence. These schools are typically located in very poor urban areas. Several principals in these challenged schools described how their students live in neighborhoods with both high crime and violence. One elementary school principal said that most of her students had already either witnessed a murder or seen the victim of one. Another principal told JLARC staff that many of his elementary students said they have been propositioned to work for drug dealers as runners.
Schools with students that experience violence in their daily lives are faced with additional challenges. Principals explained how the parents of children who live in violent neighborhoods often teach their children how to protect themselves forcefully through fighting or other means. These children are more inclined to address issues at school in ways that are more violent than are acceptable to principals and teachers. In addition, these children may tend to be distracted by their home environment. The principal who described most of her student population as having witnessed a murder or seen a murder victim said that her students end up writing about death and dying regardless of the topic given to them.
Along with having students who face violence in their lives on a regular basis, some of the challenged schools are impacted directly by violence. One of the schools visited occasionally has to go into “lockdown status” because of violence in the area of the school. At another school visited, a police officer was murdered on the street in front of the school. A principal at another challenged school described seeing prostitutes walking the sidewalk in front of the school regularly when he arrived early in the morning, and the existence of a crack house across the street from his school.
Some Schools Around the State Are Overcoming Their Challenges
This study revealed that some schools around the State have been able to meet the challenges associated with poverty, race, and low adult educational attainment and have achieved academic success despite the odds. Based on statistical trends, many of these schools would be predicted to perform poorly on the SOL tests, yet they are performing at relatively higher levels.
Page 71 Chapter IV. Best Practices in Schools and Divisions Performing Well on the SOL Tests
It appears that the schools that have been academically successful despite their challenges are located in different parts of the State and have an assortment of unique characteristics. JLARC staff visited a variety of these schools that are consistently performing well on SOL tests. These schools include high, middle, and elementary schools located in:
• Southwestern Virginia, in areas in which a large proportion of students are poor and a large portion of the adults in the community have limited education,
• Southside Virginia and the Eastern Shore, in areas in which a large proportion of students in the school are poor and black, and a large portion of the adults in the community have limited education, and
• Urban areas of the State, in which a large proportion of children are poor and black.
Effective Practices Are More Critical for the Successful Challenged Schools, and Some of These Practices Need to Be Supplemented or Used to a Greater Degree
One of the common patterns for challenged schools that are successful in their student SOL test results is that they use all of the effective practices discussed in the previous section and illustrated in Exhibit 2. However, there are two major differences between these successful challenged schools and high-scoring schools` (schools that do not have demographic challenges). First, successful challenged schools must use supplemental practices or use these practices to a greater degree, in order to overcome their challenges. Some of these key differences are illustrated in Exhibit 4. Second, the importance of implementing these practices can be much greater for the challenged schools, and the consequences of failing to effectively implement them is likely to be poor student performance on the SOL tests.
Strong and Stable Leadership. Along with being the instructional leader for the school and setting the tone, principals in the successful challenged schools must continually assess how they can fill the gap between the level of support provided by the parents and the additional level of support needed for their students to be successful. The principals in the challenged schools who are successful have the ability to effectively assess this gap and are resourceful in determining what they need to do in order to fill it. Whether it requires buying alarm clocks for children who cannot rely on their parents to wake them up for school, or providing an after-school or Saturday program to give these children additional hours of instruction, these principals are committed and able to provide whatever it takes for these students to be successful. On the JLARC survey of teachers, teachers in successful challenged schools identified strong leadership and support provided by the principal as one of the top three greatest positive influences on academic performance in their school.
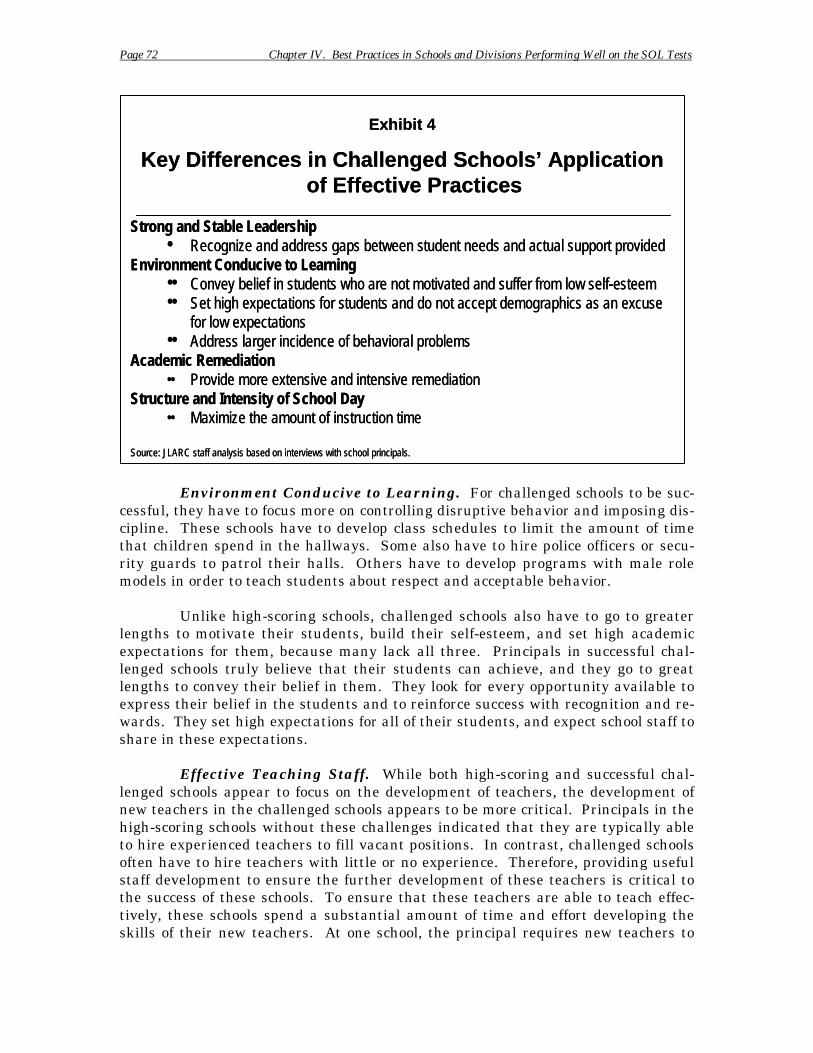
Page 72 Chapter IV. Best Practices in Schools and Divisions Performing Well on the SOL Tests
Exhibit 4Exhibit 4
Key Differences in Challenged Schools’ ApplicationKey Differences in Challenged Schools’ Application of Effective Practicesof Effective Practices
Strong and Stable LeadershipStrong and Stable Leadership•• RReecocognignizzee and aand addrddressess gapsgaps betwbetween seen sttudenudent needst needs and aand acctualtual suppsupporort prt provoviidedded
Environment Conducive to LearningEnvironment Conducive to Learning•• CConvonvey beey belliieef if inn stustudentsdents whowho arare note not motimotivvaated ated and sund sufferffer frfrom lom looww selselff--eesteemsteem•• Set hSet hiigh exgh expecpectatitationsons forfor ssttudentsudents and dand doo not anot accepcceptt demodemoggrraphiaphiccss asas an exan excuscusee
for low expectationsfor low expectations•• AddrAddresess ls laarrgerger iinncciidendence ofce of behavbehaviioorraall prprobloblememss
Academic RemediationAcademic Remediation •• PPrroovviide mode morree exteextensinsivve ande and iinntentenssiivve re reemedimediatiatioonn
Structure and Intensity of School DayStructure and Intensity of School Day•• MMaxiaximmiizzee the amothe amount of iunt of innstrstruuccttiioonn titimeme
Source: JLARC staff analysis based on interviews with school principals.Source: JLARC staff analysis based on interviews with school principals.
Environment Conducive to Learning. For challenged schools to be successful, they have to focus more on controlling disruptive behavior and imposing discipline. These schools have to develop class schedules to limit the amount of time that children spend in the hallways. Some also have to hire police officers or security guards to patrol their halls. Others have to develop programs with male role models in order to teach students about respect and acceptable behavior.
Unlike high-scoring schools, challenged schools also have to go to greater lengths to motivate their students, build their self-esteem, and set high academic expectations for them, because many lack all three. Principals in successful challenged schools truly believe that their students can achieve, and they go to great lengths to convey their belief in them. They look for every opportunity available to express their belief in the students and to reinforce success with recognition and rewards. They set high expectations for all of their students, and expect school staff to share in these expectations.
Effective Teaching Staff. While both high-scoring and successful challenged schools appear to focus on the development of teachers, the development of new teachers in the challenged schools appears to be more critical. Principals in the high-scoring schools without these challenges indicated that they are typically able to hire experienced teachers to fill vacant positions. In contrast, challenged schools often have to hire teachers with little or no experience. Therefore, providing useful staff development to ensure the further development of these teachers is critical to the success of these schools. To ensure that these teachers are able to teach effectively, these schools spend a substantial amount of time and effort developing the skills of their new teachers. At one school, the principal requires new teachers to
Page 73 Chapter IV. Best Practices in Schools and Divisions Performing Well on the SOL Tests
attend an intensive training program on teaching strategies during the month of September in order to speed up the learning process. Another principal described a comprehensive mentoring program for new teachers as a key element of the school’s success.
In addition, while both high-scoring and successful challenged schools utilize reading and math specialists (teachers who have received an additional license or endorsement in their academic specialty and who provide additional instructional support for teachers and students), the need for this practice appears to be greater in the challenged schools. These schools rely on the specialists to supplement the instruction and remediation provided by the regular teachers. These specialists work one-on-one and with small groups of students. They are also used to teach entire classes and to model effective teaching strategies/practices for the regular classroom teachers. According to some of the principals interviewed, these specialists are a critical part of their schools’ success.
Data-Driven Assessment of Student Weaknesses and Teacher Effectiveness. While most schools with good student SOL test results use data analysis, successful challenged schools must rely more heavily on it. In these schools, a large portion of students are likely to have difficulty with their school work and need supplemental assistance. Data analysis has become the key tool to assess the academic level of students and to identify their areas of weakness. This enables challenged schools to effectively identify students who need remediation and then to design the remediation to address specific weaknesses.
Academic Remediation. Compared to the group of schools with the highest SOL test results, successful challenged schools also provide more extensive and intensive remediation. They rely on data analysis, because a large proportion of students need remediation. The principals and teachers in these schools appear to be committed to do whatever it takes to provide the necessary remediation. In addition, teachers and other staff provide remedial assistance before and after school, on Saturdays, and during the school day. In many of the schools, the entire staff is used to conduct the remediation. One principal described how she personally tutors a child every day during the lunch period. In addition, professionals and university students are sometimes brought in to supplement the school staff.
Structure and Intensity of the School Day. Successful challenged schools also appear to focus more on the schedule and the structure of the school day. One principal described how her school has a sense of urgency. She stated, “We have to use every minute of every day.” These schools make special efforts to maximize instruction time. They also appear to be focused on setting schedules and allocating time to address potential weaknesses or to provide for remediation. For example, one principal indicated that ensuring that children read on grade level by third grade is the school’s primary focus. Consequently, the school allocates the first three hours of every day to reading. Some middle and high schools have adopted an alternate block schedule in order to have a class period for remediation every other day without having to pull children out of their regular classes. With an alternate block schedule, a student has eight class periods every two days. This structure allows for schools to designate one of the eight blocks as an intervention block and to
Page 74 Chapter IV. Best Practices in Schools and Divisions Performing Well on the SOL Tests
provide remedial assistance to the students who need it on a regular basis every other day.
Schools Have Developed Creative Practices to Overcome Challenges
There are many examples of creative practices developed by resourceful principals to help improve academic performance in successful challenged schools. Many of the practices described illustrate how principals in these schools try to address the gap between parental support provided and the additional support students need to be successful. Exhibit 5 provides examples of some of these practices.
Communicating Expectations. At Baker Elementary School in Henrico County, the principal expressed that she was concerned that some of her students did not seem to have much focus or a real understanding of why they were attending school each day. To respond to this, she instituted the practice of boarding each bus every morning when it arrives at school to reinforce for the students their purpose for being at school. After she boards the bus, she greets the children and asks them the following question: “Why did you come to school today?” She expects them to answer that they have come to learn.
Recognizing Student Achievement. At Craigsville Elementary School in Augusta County, which serves the poorest children in the division, the principal has developed a creative program to recognize and celebrate student academic achievement. This principal recognized that most of his students were not receiving much reinforcement or recognition at home and that performance expectations for the students in his school were generally low. In an effort to celebrate the success of those students who had passed the SOL tests, he established the practice of having the teachers personally deliver SOL trophies to the homes of students who passed the test. According to the principal, who sometimes accompanies the teachers to the students’ homes, many of these children had never received much recognition, and the excitement and pride in their faces when they opened the door was apparent.
Ninth Grade Transition Programs. Some schools have recognized the challenges created by the transition from middle to high school and have developed ninth grade transition programs. Prince Edward County High School has developed a comprehensive program to address this issue. This program has several major components. The program begins in the spring of the eighth grade, at which point the high school staff conducts an orientation at the middle school with eighth grade students and their parents. Then in the summer prior to the start of the ninth grade school year, new students are asked to attend a three-day orientation program. This program focuses on the rules and expectations for high school.
During the first semester of ninth grade, each ninth grade student attends one block that is called the freshman seminar. The purpose of this seminar is to provide the students with instruction in areas in which ninth graders generally have been weak in the past and that are important to be successful in high school. Examples of skills covered include scientific measurements, pre-algebra skills, and
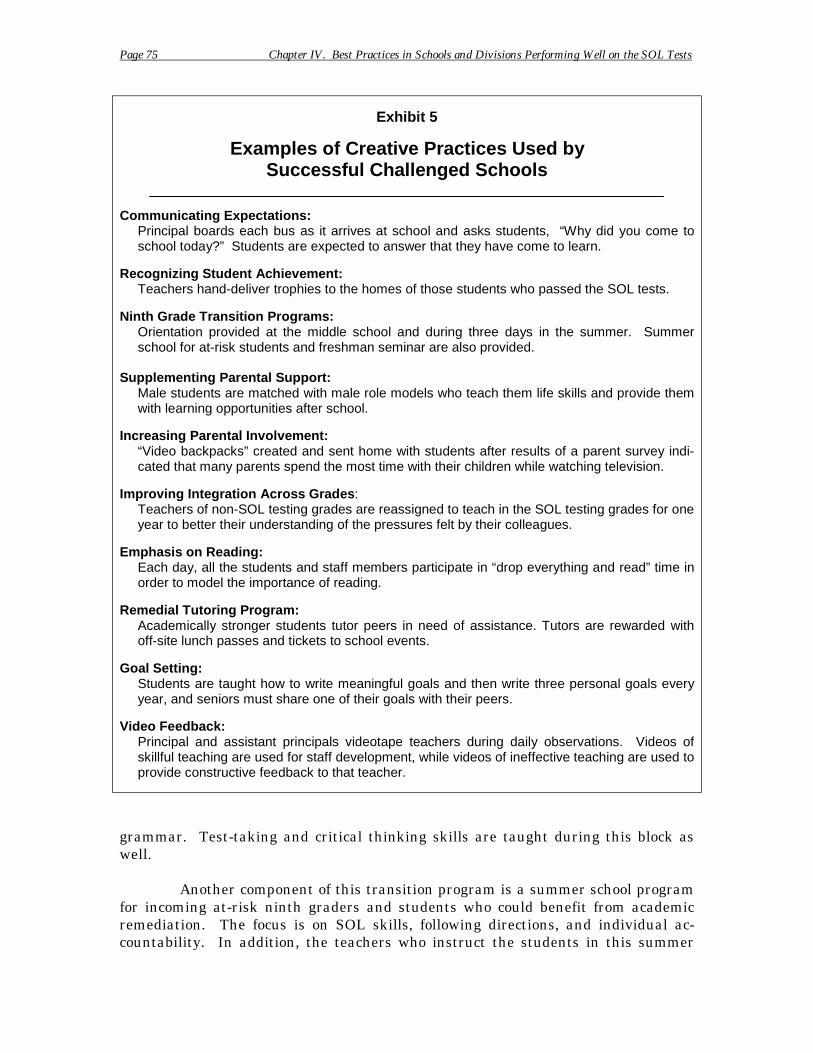
Page 75 Chapter IV. Best Practices in Schools and Divisions Performing Well on the SOL Tests
Exhibit 5
Examples of Creative Practices Used by Successful Challenged Schools
Communicating Expectations: Principal boards each bus as it arrives at school and asks students, “Why did you come to school today?” Students are expected to answer that they have come to learn.
Recognizing Student Achievement: Teachers hand-deliver trophies to the homes of those students who passed the SOL tests.
Ninth Grade Transition Programs: Orientation provided at the middle school and during three days in the summer. Summer school for at-risk students and freshman seminar are also provided.
Supplementing Parental Support: Male students are matched with male role models who teach them life skills and provide them with learning opportunities after school.
Increasing Parental Involvement: “Video backpacks” created and sent home with students after results of a parent survey indicated that many parents spend the most time with their children while watching television.
Improving Integration Across Grades: Teachers of non-SOL testing grades are reassigned to teach in the SOL testing grades for one year to better their understanding of the pressures felt by their colleagues.
Emphasis on Reading: Each day, all the students and staff members participate in “drop everything and read” time in order to model the importance of reading.
Remedial Tutoring Program: Academically stronger students tutor peers in need of assistance. Tutors are rewarded with off-site lunch passes and tickets to school events.
Goal Setting: Students are taught how to write meaningful goals and then write three personal goals every year, and seniors must share one of their goals with their peers.
Video Feedback: Principal and assistant principals videotape teachers during daily observations. Videos of skillful teaching are used for staff development, while videos of ineffective teaching are used to provide constructive feedback to that teacher.
grammar. Test-taking and critical thinking skills are taught during this block as well.
Another component of this transition program is a summer school program for incoming at-risk ninth graders and students who could benefit from academic remediation. The focus is on SOL skills, following directions, and individual accountability. In addition, the teachers who instruct the students in this summer
Page 76 Chapter IV. Best Practices in Schools and Divisions Performing Well on the SOL Tests
program are the same teachers who teach them during the school year. By allowing these teachers to form a bond with these students during the summer, this program helps teachers to connect more quickly with these students and to forego an adaptation period when the school year begins.
Two other successful challenged high schools also had programs specifically designed to address ninth grade transition. Norview High School in Norfolk focuses on leadership training. The school identifies potential leaders as the students are entering ninth grade, and gives them leadership training. Colonial Heights High School has developed an extensive mentoring program for ninth graders. Each freshman is assigned to a teacher who serves as that student’s counselor and advocate for the school year.
Increasing Parental Involvement. Patrick Copeland Elementary School in Hopewell wanted to increase parental involvement so the school conducted a survey of parents to find out how parents spent their time with children. The survey revealed that parents and children spent the largest portion of time together watching television. In response, the school developed a “video backpack” with academic materials so that parents could participate in their children’s’ school work through videos.
Supplementing Parental Support. At Swansboro Elementary School in the City of Richmond, some of the teachers have organized an after school club for boys. The club is led by male teachers as well as male volunteers from the community. The purpose of the club is to provide boys in the school with male role models who can teach them life skills and manners, as well as expose them to learning opportunities outside of school.
Improving Integration Across Grades. Some schools have recognized the importance of vertical integration across grades. One principal who was concerned that the teachers in the grades preceding third and fifth grade were not working hard enough to prepare their students for the SOL test grades began moving teachers around. Certain lower grade teachers were reassigned to third and fifth grade for a year. The primary purpose of this reassignment was for the lower grade teachers to develop a better appreciation for the pressure that the third and fifth grade teachers were under and to reinforce the necessity for those teachers to fully prepare their students for the third and fifth grade.
At Coeburn Primary School in Wise County, the principal, who was concerned that there was not sufficient coordination across grades, established a formal process for vertical team meetings. Kindergarten through third grade teachers meet on a regular basis to ensure that there is adequate integration and coordination across grade levels.
Emphasis on Reading. In several of the schools visited, challenged schools developed creative practices to improve their students’ reading skills. At Tidewater Park Elementary School in Norfolk, a school in which all of the students are poor, the principal spoke of the need to model the importance of reading in the school, given that most of the students do not observe adults reading in their home

Page 77 Chapter IV. Best Practices in Schools and Divisions Performing Well on the SOL Tests
environment. Therefore, the principal established the practice of having regular “drop everything and read” sessions. All students are required to stop what they are doing and read a book for 15 minutes. In addition, all of the staff in the school, from the principal to the custodian, also stop what they are doing and read.
At Craigsville Elementary School in Augusta County, a school in which the majority of students are poor, the principal explained that teaching children to read on grade level by third grade has been a substantial challenge and is the school’s highest priority. As a result, the school has implemented an intensive reading program and makes reading on grade level by third grade the primary goal of the school. This program begins in kindergarten and continues through third grade. In this program, students receive three hours a day of language instruction. Students are broken into small groups and spend 90 minutes practicing reading, sounds, and writing activities. The students then spend 45 minutes every day with a reading specialist and the same amount of time doing hands-on reading activities.
Blair Middle School in Norfolk has also placed a major emphasis on reading. The school has hired nine reading teachers, three for each grade. With the assistance of these reading teachers, teachers in each subject area are trained on how to integrate reading into their lesson plans and assess students in reading.
Remedial Tutoring Program. Nandua High School in Accomack County has developed a tutoring program that relies on the academically stronger students in the school to provide after-school tutoring to those in need of assistance. The principal estimated that as many as 80 students have participated as tutors at one time. With this many tutors, the principals says that he can provide at least one tutor for every two students who need assistance. This is also a relatively low cost program for the school because the only compensation paid to the tutors is off-site lunch passes and tickets to school events.
Goal Setting. Norview High School in Norfolk has focused on goal-setting skills for its students. Beginning in ninth grade, the teachers and staff train students in goal setting and how to write meaningful goals. All students have to set three goals for the year – two that are academic, and one of the student’s choosing. Guidance counselors monitor how successful students are in achieving their goals, and seniors have to share one of their goals with their peers. In order to reinforce the importance of this practice, members of the school’s instructional team also develop goals and post them.
Video Feedback. Along with requiring goal-setting, Norview High School relies on video feedback as a professional development tool. The principal and assistant principals perform daily observations using a video camera. When they go into classrooms to observe teachers informally, they videotape them as they are teaching. According to the principal, the videos serve two useful purposes. Videos taken of exemplary teaching are used as a professional development tool with other teachers. Videos that capture teachers using ineffective or problematic teaching techniques are used to give the teacher timely, constructive feedback.
Page 78 Chapter IV. Best Practices in Schools and Divisions Performing Well on the SOL Tests
Successful Schools Have Benefited from Supplemental Funding
One of the factors that appears to contribute to the strong performance of successful challenged schools is the effective use of supplemental funding that they receive. Schools with high levels of poor children receive supplemental funds from several sources. The Federal Title I program provides a substantial amount of federal funding to schools with high numbers of poor children. The State also provides supplemental funds based on similar formulas as well as remediation funds targeted at schools with low performance on the SOL tests. Also, there are some challenged schools that rely on supplemental assistance from their division. Some of the divisions provide targeted assistance to schools that have greater challenges through division formulas. One school visited has an informal agreement with the division that it will provide the school with additional funds every year, because the school faces more challenging demographics than other schools in the division. Further, some of the challenged schools have relied upon foundation grants to supplement their activities. A substantial amount of grant funding is available through foundations to address performance in challenged schools.
These supplemental resources are used by these challenged schools in a variety of ways. The Title I funds are often used to hire reading and math specialists to supplement the core classroom teachers. In addition, Title I and other funds may be used to fund instructional assistant positions. The funds are also used to pay teachers and other tutors who provide remediation after school and on Saturdays. Funds may also be used to pay for transportation home for students who stay after school for remediation or to buy supplemental materials as needed.
DIVISION SUPPORT DIRECTLY IMPACTS SCHOOL PERFORMANCE
School officials across Virginia have consistently stated that the support provided by the local school division has a direct bearing on the success of individual schools. Local school boards and divisions provide many kinds of support to their schools such as staff recruitment, professional development, curriculum alignment and pacing, and attendance services. Some of these services are explicitly required by the Code of Virginia, while others are generally understood to be a division-level responsibility. Exhibit 6 provides a description of the types of basic services provided by most divisions, as well as the additional practices of successful divisions.
Successful divisions are characterized by a commitment to meeting the Standards of Learning (SOL) requirements, as well as the provision of additional support to their schools. Beyond the basic services provided by most divisions, there are other division practices that contribute to the success of high-scoring and challenged schools. These practices include strong and stable leadership, the presence of a program to address ineffective teachers, the use of professional development as a means of creating a community of learners, strong support for data analysis, additional support from specialists, and the encouragement of collaboration across schools.
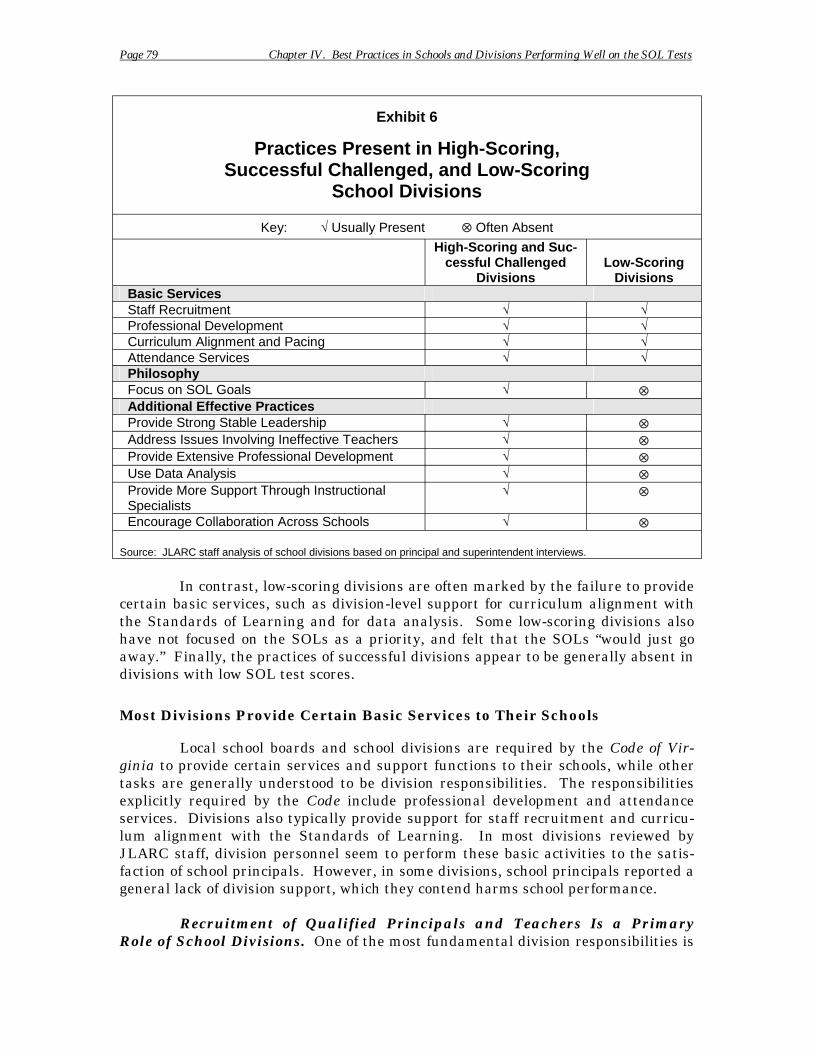
Page 79 Chapter IV. Best Practices in Schools and Divisions Performing Well on the SOL Tests
Exhibit 6
Practices Present in High-Scoring, Successful Challenged, and Low-Scoring
School Divisions
Key: √ Usually Present ⊗ Often Absent
High-Scoring and Successful Challenged Low-Scoring
Divisions Divisions Basic Services Staff Recruitment √ √ Professional Development √ √ Curriculum Alignment and Pacing √ √ Attendance Services √ √ Philosophy Focus on SOL Goals √ ⊗ Additional Effective Practices Provide Strong Stable Leadership √ ⊗ Address Issues Involving Ineffective Teachers √ ⊗ Provide Extensive Professional Development √ ⊗ Use Data Analysis √ ⊗ Provide More Support Through Instructional Specialists
√ ⊗
Encourage Collaboration Across Schools √ ⊗
Source: JLARC staff analysis of school divisions based on principal and superintendent interviews.
In contrast, low-scoring divisions are often marked by the failure to provide certain basic services, such as division-level support for curriculum alignment with the Standards of Learning and for data analysis. Some low-scoring divisions also have not focused on the SOLs as a priority, and felt that the SOLs “would just go away.” Finally, the practices of successful divisions appear to be generally absent in divisions with low SOL test scores.
Most Divisions Provide Certain Basic Services to Their Schools
Local school boards and school divisions are required by the Code of Virginia to provide certain services and support functions to their schools, while other tasks are generally understood to be division responsibilities. The responsibilities explicitly required by the Code include professional development and attendance services. Divisions also typically provide support for staff recruitment and curriculum alignment with the Standards of Learning. In most divisions reviewed by JLARC staff, division personnel seem to perform these basic activities to the satisfaction of school principals. However, in some divisions, school principals reported a general lack of division support, which they contend harms school performance.
Recruitment of Qualified Principals and Teachers Is a Primary Role of School Divisions. One of the most fundamental division responsibilities is
Page 80 Chapter IV. Best Practices in Schools and Divisions Performing Well on the SOL Tests
to ensure that instructional positions are filled with qualified individuals. Principals play a key role in school performance by serving as the instructional leaders of their schools. Many principals and superintendents indicated that principals have been valued in the past for their ability to manage the school building and enforce discipline. However, in almost every division visited by JLARC staff, school officials stated that the job of principal has changed from having a primary focus on management to having a focus on instructional leadership. As a result, a division’s recruitment of principals with instructional experience has become a more important aspect of school performance.
In the majority of divisions reviewed by JLARC staff, school division personnel are responsible for the recruitment of principals and teachers, although principals are often involved in the process of teacher recruitment to some degree. In the typical division reviewed, teacher recruitment is performed by the division’s central office staff, who send prospective candidates to the principals for interviews. Principals then make hiring recommendations to division staff. In several other divisions, it appears that central office staff recruit new teachers and then give principals a list from which to choose. In one division that uses this approach, principals are members of the interview team and may refuse a candidate.
Although superintendents and principals reported mixed success in recruitment, most principals reported excellent to satisfactory support from the division. In some divisions, principals reported that recruiting difficulties in earlier years were caused by problems at the division level, but that the central office is now beginning to provide good support for recruiting. However, principals in another division have taken on the responsibility for recruitment because the central office staff are reportedly slow to make final offers to candidates.
Instructional staffing assignments are generally made at the school level, and principals may have a significant amount of discretion in this area. In at least two of the divisions visited, central office staff use a formula to determine the amount of personnel funding allocated to each school, and then allow the principals to decide what types of positions are best suited for their building. This practice allows the principal to choose between an assistant principal or an instructional specialist, for example.
Divisions Are Responsible for Providing Staff Development to School Personnel. Local school boards are charged by the Code of Virginia with providing teachers and principals with periodic in-service training (§ 22.1-253.13:3 through 22.1-253.13:5). Staff development activities usually take the form of training on topics such as data analysis, instructional practices, health and safety issues, and team planning. Most divisions appear to have central office personnel that either provide staff development directly, or else inform schools of opportunities for staff development through conferences and workshops. Larger divisions often have a staff development department that performs sophisticated staff development. This may include direct modeling of best practices in classrooms by division personnel or outside experts who are retained to consult with specific schools. Smaller divisions tend to provide more limited staff development. These divisions may send a representa
Page 81 Chapter IV. Best Practices in Schools and Divisions Performing Well on the SOL Tests
tive group of teachers to conferences and workshops, or else provide them with centralized training which they “turn around” and teach to their colleagues.
In most divisions, principals reported that central office staff provide either sufficient training in the schools or else access to training opportunities such as conferences or workshops. In a few divisions, however, principals reported that the division does not provide a sufficient amount of staff development, or that financial constraints and distances from training sites limit the division’s ability to bring in outside speakers or send teachers to training outside of the division. In these divisions, the majority of staff development is performed at the school level.
Division Staff Typically Coordinate Curriculum Alignment and Pacing. In almost all divisions visited, division staff aligned and paced their curriculum according to the Standards of Learning. This began when the SOLs were released, or shortly thereafter. In most divisions, the central office developed pacing guides and often created curriculum guides for specific content areas. Curriculum expectations are centrally developed, but teachers prepare their own lesson plans. In some divisions, however, teachers are still presently responsible for developing their own pacing and curriculum guides without any division support.
Divisions Are Responsible for Providing Attendance Services. The Code of Virginia holds school divisions responsible for maintaining attendance records and enforcing the State’s compulsory school attendance law (§22.1-254 to §22.1-269.1). While no data are available on the number of attendance personnel in each division, interviews with division staff indicate that there is a wide variation in the number of attendance staff in the school divisions. Principals in most divisions reviewed by JLARC staff expressed satisfaction with their division’s support for attendance, and indicated that they followed division policies on tardies and absences. Principals in several divisions reported that the division has created incentives for good attendance, such as exam exemptions or discounts at local merchants.
Divisions with High-Scoring and Successful Challenged Schools Are Committed to Meeting SOL Requirements and Providing Additional Support to Schools
Divisions with students that have performed well on SOL tests responded quickly to the requirements of the SOLs, provided all necessary support to their schools, and have maintained a focus on the SOLs as a primary objective of the division. This support and focus has contributed to the success of the schools in these divisions on the SOL tests. Some of these divisions had already adopted the concepts that appear to contribute to success on the SOL tests, such as curriculum pacing, or else had a curriculum in place that closely matched the SOLs. In other divisions with strong student performance on the SOL tests, curriculum alignment began immediately after the SOLs were introduced. A principal in one successful challenged division stated that the superintendent “jumped on the SOLs when they came out and made everyone responsible for them.”
Page 82 Chapter IV. Best Practices in Schools and Divisions Performing Well on the SOL Tests
Overall, divisions experiencing success on the SOL tests have generally pursued continuous improvement, by analyzing data and making regular adjustments to the curriculum. These divisions appear to have taken SOL requirements seriously and have continued to take all necessary steps to ensure success. One principal noted that after the division aligned the curriculum, central office staff continued to support the schools through visits by instructional specialists and regular updates to the division’s curriculum and pacing guides.
Moreover, while most divisions appear to provide certain basic support services to their schools, the most successful divisions provide additional kinds of support. In many high-scoring and successful challenged divisions, the superintendent and the school board tend to provide strong and stable leadership to the division, including support to principals in dealing with ineffective teachers. Successful divisions also provide instructional specialists who serve as in-house experts on instruction. These divisions also appear to have a strong commitment to the professional growth of their teachers and aggressively provide staff development opportunities as well as programs that encourage the collaboration of teachers in different schools.
Strong, Stable Leadership at All Levels Is a Key to Success. One of the key factors that appears to set divisions apart is the presence of a superintendent and school board that provide strong and stable leadership. Successful divisions seem to have strong superintendents who emphasize the importance of classroom instruction.
For example, in a successful challenged division (Norfolk), the principals noted that the superintendent has been instrumental in their success by setting a tone and spirit of achievement. One principal stated that the superintendent “has more of a grasp on instruction” than previous superintendents. Each of the principals interviewed in this division stated that the superintendent has been instrumental in identifying priorities and providing solutions in a variety of ways, such as instituting a new middle school reading curriculum, and creating a division-wide student dress code as a means of enforcing discipline.
Another component of strong division leadership in successful divisions is the presence of a committed school board that supports the superintendent. In successful divisions, the school board appears to give the superintendent the degree of authority that is necessary for leadership, and then supports the actions taken by the superintendent. Staff in one successful challenged division with high scores (Scott) noted that they “have been really lucky to get people [on the school board] who are interested in education but also leave them alone. In other counties it’s political and their systems stay torn up.”
High-Scoring and Successful Challenged Divisions Are Able to Support or Dismiss Ineffective Teachers. Another key distinguishing characteristic of many high-scoring and successful challenged divisions is the presence of an effective program for evaluating the needs of ineffective teachers, and dismissing teachers who do not improve. One high-scoring suburban division (Henrico) has created a centralized program to address ineffective teachers. Under this program, the divi
Page 83 Chapter IV. Best Practices in Schools and Divisions Performing Well on the SOL Tests
sion uses data analysis to identify low-performing teachers, and then requires these teachers to undergo intensive review and observation. Teachers are then provided detailed feedback, and those who do not successfully respond can be dismissed within 90 days.
In an urban division that has experienced substantial improvement in school performance (Norfolk), principals reported that a key reason has been the di-vision’s ability to address the needs of struggling teachers and to terminate the contracts of teachers who do not perform. The division developed a professional review process for principals to use as a means of documenting the needs of underperforming teachers. Part of this process involved giving principals standards to use in evaluating a teacher’s ability and quality, which allowed the superintendent to more effectively support principals in their decisions to recommend non-renewal or termination of teachers. In addition, the division created staff development that was designed to meet the needs of any under-performing teacher, both provisional and tenured. Division officials and school principals reported that this process has received support from the school board, and has contributed to the improvement in test scores and the learning environment in the division.
Successful Divisions Use Professional Development to Encourage Learning at All Levels. High-scoring and successful challenged divisions appear to be committed to providing all necessary staff development, and in many cases provide an extensive array of opportunities. A common theme among divisions that are successful on the SOL tests is a belief that success comes in part through the creation of a community of learners at all levels. The superintendent in Wise County stated that “there are lots of opportunities for staff development. Our teachers can have a staff development program by just asking, and that’s one of the reasons our test scores have increased.” In two divisions, one high-scoring (Henrico) and one which has had success despite challenges (Norfolk), division staff provide many opportunities for professional development, and also pay teachers an hourly supplement for time spent in training sessions. Other divisions provide opportunities for teachers, and sometimes paraprofessionals, to earn college credits toward a Master’s degree at no cost.
Successful Divisions Use Data Analysis to Improve Performance and to Ensure Accountability. High-scoring and successful challenged divisions use data from test results to target resources and provide support to teachers and students. Additionally, these divisions ensure that principals and teachers use data analysis effectively. Although principals reported differing opinions regarding whether the division or school staff should perform data analysis, principals in successful divisions reported that the central office provides a greater level of support and training for data analysis. In many of these divisions, central office staff disaggregate and analyze test result data and then provide the analysis to principals. In other successful divisions, the central office has provided extensive training on data analysis and school staff are able to perform it effectively.
Successful Divisions Provide More Support to Schools from Instructional Specialists. School staff in successful divisions receive greater support from division-level instructional and curriculum specialists than in other divisions. Ac
Page 84 Chapter IV. Best Practices in Schools and Divisions Performing Well on the SOL Tests
cording to the superintendent of a successful challenged division (Wise), “What makes us different is we are large enough to have a department of instruction.” The superintendent attributes the success of their schools in large part to the fact that these staff are focused solely on identifying new instructional practices and providing training to teachers. In some larger divisions, lead teachers meet on a regular basis with division curriculum specialists, and the division specialists make presentations in schools and teach in the classrooms. These divisions often have content or other specialists that are assigned to groups of teachers or schools. In successful divisions with smaller enrollments, principals reported that the division employs coordinators for each of the four core content areas, and that this aides alignment and instruction.
Successful Divisions Encourage Collaboration Across Schools to Improve Instruction. High-scoring and successful challenged divisions tend to encourage collaboration among teachers and principals across the division so that all teachers can benefit from best practices that are successfully used in particular schools. This collaboration occurs both horizontally among schools with the same grade levels, and vertically among schools that serve the same group of students. Divisions foster horizontal collaboration through division-wide grade-level meetings to share best practices and lesson plans. A principal in one of these divisions (Mecklenburg) stated that this kind of collaboration across schools “is the best staff development.” In one division (Norfolk), vertical collaboration takes the form of meetings between elementary school teachers and middle school teachers to see what areas need improvement in the elementary school. Finally, instructional specialists in another division (Wise) created vertical teams who work together on instructional practices across grade levels to coordinate instruction of certain subject areas.
Some Low-Scoring Divisions Fail to Provide Necessary Support
In contrast to the successful divisions, low-scoring divisions that were visited often reacted slowly to the requirements of the SOLs, and principals in some of these divisions stated that the division did not take the SOLs seriously and thought they would go away in time. One superintendent stated that “initially there were those from the top down that thought this would pass. There was not a sense of urgency in the beginning.”
The low SOL test performance of some schools also appears to be due in part to a low level of division support. Some low-scoring divisions appear to have suffered from inadequate leadership, and in some instances principals have not received the support from division leadership necessary to train or remove ineffective teachers. Low-scoring divisions also tend to have fewer division-level instructional specialists, provide less support for data analysis, and appear to offer less encouragement for collaboration among schools.
Lack of Effective Leadership Harms School Performance. Low-scoring divisions may also be impacted by a lack of effective leadership on the part of the superintendent. Several reasons for ineffective leadership were cited in low
Page 85 Chapter IV. Best Practices in Schools and Divisions Performing Well on the SOL Tests
scoring divisions, including a lack of division commitment to change, the inability of the central office to provide leadership, or instability in key leadership positions.
In some low-scoring divisions, local school boards do not appear to provide needed support to the superintendent, and in some cases appear to detrimentally interfere in division operations. Some school boards have apparently not supported SOL requirements and have instead pursued other priorities. Some superintendents reported that their school board has been comprised of factions that pursue individual agendas, and that this limits the superintendent’s ability to be a leader. One superintendent reported that “80 percent of my time is [spent] dealing with school board issues and political machinations, and that is not the way it is supposed to be.”
Low-Scoring Divisions Provided Limited Support for Curriculum Alignment and Pacing. Principals in some divisions reported that as recently as the 2001-2002 school year there was little concern for the SOLs, and that teachers had to depend upon staff in the best practice centers (regional centers that were established by DOE beginning in 1998 to provide academic assistance to school divisions across the State but were eliminated in 2003) instead of the division for support related to curriculum alignment and pacing. In one division, alignment occurred this past year, and the schools did not have access to a standard curriculum before then. Principals in many divisions also reported that the textbooks are not aligned and have some outdated data, and as a result individual teachers and schools have had to gather resources on their own and “put it in kid language.”
Some Low-Scoring Divisions Appear to Lack the Resolve to Dismiss Ineffective Teachers. In some low-scoring divisions, there is either no division-level program for addressing poor performing teachers, or local politics prevents their dismissal. As a result, it appears that poor performing teachers are allowed to remain or are reassigned to other schools rather than terminated. One principal noted that “we do not have the luxury of getting rid of poor performing teachers, especially if they are community people.” In one division, the superintendent indicated that one reason for the poor performance of some division schools has been the toleration of ineffective teachers by principals, and stated that the division itself needs to do a better job of getting “principals off their duffs.” In another division, the school board and the local teachers’ association have apparently made the process of dismissing ineffective teachers laborious, and the board has often blocked the removal of teachers.
Low-Scoring Divisions Often Do Not Provide Sufficient Professional Development or Support for Data Analysis. In some low-scoring divisions, principals reported that the central office until recently did not have an organized professional development program, or that the only staff development available to their teachers is what the schools provide. Principals in these divisions do not feel that they can provide sufficient professional development at the school level, and want the division to provide more.
In addition, many principals reported that the central office either does not provide any support for data analysis, or that the schools have not received suffi
Page 86 Chapter IV. Best Practices in Schools and Divisions Performing Well on the SOL Tests
cient training. In many of those divisions where principals reported insufficient central office support, it appears that the best practice centers were relied upon to provide data disaggregation and training in data analysis, and that central office staff have not filled that role since the centers were closed.
Low-Scoring Divisions Provide Fewer Instructional Specialists and Have Less Collaboration Among Schools. Some low-scoring divisions appear to have an insufficient number of instructional specialists, or else do not employ any specialists in some areas. In one low-scoring division, the central office has one staff member with elementary expertise, but no staff member has any training in secondary instruction. In another division, principals stated that the division had previously employed two elementary reading specialists and two elementary math specialists, but that the division now has only one reading and one math specialist for more than 30 elementary schools.
In general, low-scoring divisions also appear to take fewer steps to encourage sharing of ideas or resources. Some principals stated that they do not know what occurs in other grades, and that the central office needs to provide more support for collaboration.
Division support, as well as school and classroom-level practices, are critical to success on the SOL tests. Divisions that provide strong support to their schools improve the opportunity for the schools to be successful. Similarly, schools that adopt best practices can be successful on the SOL tests even if they face substantial socio-economic challenges. The next chapter discusses the general belief expressed by the superintendents, principals, and teachers in the divisions visited for this review that the SOLs have been helpful in improving school performance. In addition, the chapter discusses other challenges for Virginia schools, including the needs of pupils in schools that are not performing well on the SOL tests, issues relating to dropout and retention rates, and the expectations of the federal No Child Left Behind Act.
Page 87 Chapter V. Impact of the SOLs and Other Issues
V. Impact of the SOLs and Other Issues
Three additional issues emerged during this study. The first of these issues is the impact of the SOLs upon the academic performance of schools. In the schools visited for this review, principals and teachers appear to share a generally positive view about the impact of the SOLs upon academic performance in their schools. Principals in the visited schools indicated a general belief that the SOLs have provided better-defined academic goals. Superintendents and principals interviewed also stated that the SOLs have provided greater accountability at the division, school, and classroom levels. Additionally, the prevailing view among teachers surveyed appears to be that the SOLs have “moderately” increased the ability of their schools to identify and address the individual academic weaknesses of students, identify and address school-wide academic weaknesses, help each student maximize their academic potential, and complete all course or grade-level subject matter.
A second issue that emerged during this study is the high number of students who may not graduate after four years of high school, as well as the high rates of dropouts and student retentions in some divisions. Possible explanations for these phenomena are presented in this chapter, as well as issues that may warrant further study.
Finally, this chapter discusses changes to State and federal educational requirements that may affect the academic performance of Virginia’s schools and divisions in the future. SOL accreditation requirements will change in coming years, and the continuing requirements of the federal No Child Left Behind legislation create several issues that the State will have to face in future years.
PRINCIPALS AND TEACHERS OF VISITED SCHOOLS INDICATE THAT THE SOLS HAVE HAD A
POSITIVE IMPACT ON ACADEMIC PERFORMANCE
The Standards of Learning (SOLs) have had a profound impact on Vir-ginia’s elementary and secondary education systems. While Virginia students have taken standardized tests for decades, the actual implementation at the school level of prescribed statewide educational objectives and the increased focus upon improving test scores are new. One urban school superintendent has described the change as a shift “from a process to an outcome-based system in Virginia.” Whether or not the new approach, combined with the requirements of the federal No Child Left Behind (NCLB) legislation, is resulting in an excessive focus on standardized test results is a question that has been, and may continue to be, a source of some contention. In this review, however, JLARC staff found that for the most part, superintendents, principals, and teachers in visited divisions view this shift in focus as a positive one that has benefited their schools. As indicated by principals, the greatest positive impact of the SOLs appears to have occurred in schools that face demographic and other challenges, and which have struggled to achieve academic success.
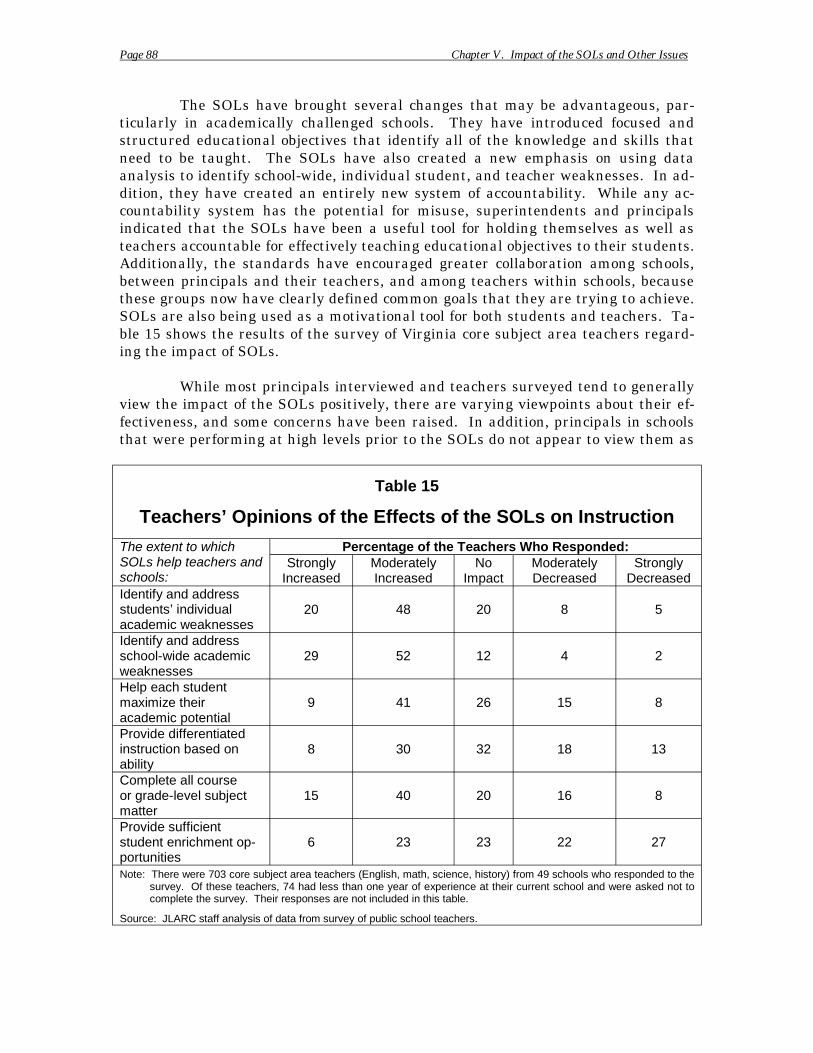
Page 88 Chapter V. Impact of the SOLs and Other Issues
The SOLs have brought several changes that may be advantageous, particularly in academically challenged schools. They have introduced focused and structured educational objectives that identify all of the knowledge and skills that need to be taught. The SOLs have also created a new emphasis on using data analysis to identify school-wide, individual student, and teacher weaknesses. In addition, they have created an entirely new system of accountability. While any accountability system has the potential for misuse, superintendents and principals indicated that the SOLs have been a useful tool for holding themselves as well as teachers accountable for effectively teaching educational objectives to their students. Additionally, the standards have encouraged greater collaboration among schools, between principals and their teachers, and among teachers within schools, because these groups now have clearly defined common goals that they are trying to achieve. SOLs are also being used as a motivational tool for both students and teachers. Table 15 shows the results of the survey of Virginia core subject area teachers regarding the impact of SOLs.
While most principals interviewed and teachers surveyed tend to generally view the impact of the SOLs positively, there are varying viewpoints about their effectiveness, and some concerns have been raised. In addition, principals in schools that were performing at high levels prior to the SOLs do not appear to view them as
Table 15
Teachers’ Opinions of the Effects of the SOLs on Instruction
The extent to which SOLs help teachers and schools:
Percentage of the Teachers Who Responded: Strongly
Increased Moderately Increased
No Impact
Moderately Decreased
Strongly Decreased
Identify and address students’ individual academic weaknesses
20 48 20 8 5
Identify and address school-wide academic weaknesses
29 52 12 4 2
Help each student maximize their academic potential
9 41 26 15 8
Provide differentiated instruction based on ability
8 30 32 18 13
Complete all course or grade-level subject matter
15 40 20 16 8
Provide sufficient student enrichment opportunities
6 23 23 22 27
Note: There were 703 core subject area teachers (English, math, science, history) from 49 schools who responded to the survey. Of these teachers, 74 had less than one year of experience at their current school and were asked not to complete the survey. Their responses are not included in this table.
Source: JLARC staff analysis of data from survey of public school teachers.
Page 89 Chapter V. Impact of the SOLs and Other Issues
having had nearly as much positive impact on school performance as principals in challenged schools.
Increased Focus and Structure
According to principals of the schools visited for this review, one of the most significant positive impacts of the SOLs in their schools has been to bring more focus and structure to instruction. The SOLs provide clear targets and measurable goals to schools, some of which may have lacked structure or focus in the past. For example, one principal stated that the SOLs have “made schools determine what is important and what is fluff.”
Principals also indicated that another benefit of the structure provided by the SOLs is that it helps to ensure that students receive well-balanced instruction in all required subject areas and not just in the areas that the teachers prefer to teach. Numerous principals told JLARC staff that the SOLs have reduced the amount of “hobby teaching.” This term refers to the past tendency of some teachers to select topics for instruction based on what they are most interested in teaching rather than on what the students most need to learn. One of the principals interviewed illustrated the point well. He stated, “although the Battle of Five Forks was fought in two days, it was taught for two months.”
Along with reducing hobby teaching, principals indicated that the SOLs have also helped to ensure that teachers are able to complete their curriculum during the semester or school year. Prior to the SOLs, teachers may not have completed the curriculum that needed to be covered in the school year, because they did not have a framework by which to pace themselves. Principals indicated that this problem has been reduced because the SOLs have encouraged the development of pacing guides that help to ensure that all necessary material is covered by the end of a the semester or school year. In the JLARC survey of teachers, 56 percent of responding teachers indicated that the SOLs increased their school’s ability to cover required course material.
Increased Accountability
Another major impact of the SOLs is that it has provided a means of holding all levels of leadership accountable for effectively teaching students the curriculum. Superintendents, principals, and teachers are all held accountable for performance, because division, school, and classroom performance can be measured through the use of SOL test data. In the divisions and schools visited, the superintendents and principals generally indicated that this increased accountability appears to be have had positive impacts at all three leadership levels in their divisions.
Superintendents in the visited divisions now appear to be focused on ensuring the performance of all of the schools in their division. For example, one superintendent told JLARC staff that the division has recently begun providing targeted supplemental assistance for low-scoring schools to address challenges. Apparently,
Page 90 Chapter V. Impact of the SOLs and Other Issues
in the past, these struggling schools were given no more central staff assistance than high performing schools.
Superintendents in struggling divisions are also making greater efforts to ensure that they have effective principals in their schools. Many schools visited by JLARC staff that had struggled in the past had new principals in place. These new principals believe that their students can achieve academic success and that their schools can become fully accredited.
In addition to increasing the focus of superintendents on improving struggling schools, the SOLs have also caused principals to increase their focus on academic performance. Superintendents made clear in interviews that principals whose schools do not achieve satisfactory progress in SOL test results will be held accountable. As a result, principals in the visited schools appear to be completely focused on ensuring that their school is successful in SOL test performance. They are focused on recruiting and retaining quality teachers, providing them the support and professional development they need, and ensuring that they are effectively teaching their students. One principal commented that the SOLs have forced principals to understand the importance of academic rigor. According to this principal, “now principals are forced to focus more on academics and less on athletics.”
The SOLs also provide outcome measures that are being used to assess teacher performance. The SOL tests provide a strong incentive for principals to address the issue of ineffective teachers. In smaller schools, one ineffective teacher can jeopardize the accreditation status of the entire school. Therefore, principals expect all of their teachers to effectively teach the curriculum. Principals in the visited schools generally indicated that the SOL tests provide a useful means of identifying teachers who are not effective. SOL test results also give principals tangible evidence to support efforts to seek the dismissal of teachers who are performing below expectations.
Data Analysis to Identify Student and Teacher Weaknesses
The SOLs also appear to be leading school personnel to an increased emphasis on the use of data as the basis for decision-making. As discussed in Chapter IV, principals have reported that data analysis has enabled schools to better identify individual student weaknesses as well as broader class or grade-level deficiencies. One principal described the positive impact of using SOL test data in her school this way: “Disaggregating the SOLs data was an eye-opener. There were problems in our school, and the data showed the brutal facts.”
Teachers of the visited schools appear to agree that increased data analysis has positively impacted the SOLs. As Table 15 shows, 81 percent of teachers who responded to the survey thought that SOLs either strongly or moderately increased the ability of schools to identify and address school-wide weaknesses. Similarly, 67 percent of teachers responded that SOLs had increased their school’s ability to address students’ individual weaknesses.
Page 91 Chapter V. Impact of the SOLs and Other Issues
SOLs Are Also Being Used to Motivate Students and Teachers
Another impact of the SOLs appears to be that test results are being used to motivate students and teachers. Several principals described how they used SOL test results to motivate their students. According to one principal, the power of competition can be a huge motivator. This principal reports the scores of other surrounding schools and divisions and challenges her students to beat their scores. Other principals have used the SOLs to improve the confidence of their students. They report the data of other schools that face similar challenges and then suggest to their students that if these students in other schools can be successful, they can too.
The SOLs have also been used to motivate teachers. One principal who was concerned with teacher performance ranked each of his teachers based on their students’ SOL test scores and posted the list at the school. According to this principal, posting the results immediately motivated many of the teachers of low-scoring students to improve their teaching.
Increased Teamwork and Collaboration
In schools visited by JLARC staff, the SOLs also appear to have led to an increased focus on teamwork and collaboration between schools, and among teachers. Divisions are focused on the success of their overall division and tend to encourage collaboration among schools. Principals in struggling schools are monitoring successful schools and communicating with them to learn the keys to their success. There also appears to be more communication between receiving and feeder schools. With the success of middle and high schools affected by the degree of preparation their students have before they enter those schools, receiving schools and their feeder schools are articulating more with each other in order to improve the instructional alignment between schools.
In addition to collaboration among schools, SOLs appear to have encouraged more collaboration within the visited schools. Teachers are encouraged to communicate across grade levels to ensure that children in the lower grades are being adequately prepared for the higher grades. In addition, principals tend to encourage collaboration, because they have a strong interest in having their teachers of high-scoring students share their practices with teachers who have less successful results.
Some Concerns Were Expressed About the SOLs
While the vast majority of principals interviewed made positive comments about the SOLs, a few principals and some teachers who responded to the survey raised concerns. One of the concerns raised is that the SOLs reduce the creativity of teachers. Some principals commented that teachers have to teach to the test, and consequently their ability to be creative is limited. However, in other interviews, some principals dismissed this criticism, explaining that teachers still have complete freedom over how to teach the material, just not what to teach.

Page 92 Chapter V. Impact of the SOLs and Other Issues
Some other concerns were raised as well. In the survey of teachers, about half of respondents indicated that the SOLs reduced the opportunity for enrichment activities. However, principals in interviews generally did not appear to be concerned about this impact. They indicated that enrichment activities still take place, but they must now be related to SOL objectives. A few principals and some teachers also raised the concern that the fun has been taken out of school. These principals and teachers are concerned that the SOLs create too much intensity and pressure, especially at the elementary level. Additionally, some teachers raised the concern that the emphasis on facts and the amount of material required to be covered limits the time available to teach higher-level critical thinking skills.
A SIGNIFICANT NUMBER OF STUDENTS MAY NOT GRADUATE ON TIME
During the course of research for this report, JLARC staff discovered some areas of concern with respect to graduation, dropout, and retention rates. A substantial number of high school students statewide do not graduate in four years, and in some localities, it appears that this may be 40 percent or more of the students. In addition, the current dropout rate does not fully reflect the dropout rate at individual grade levels, and it appears that some localities may not be able to account for the status of all of their students, which may result in the under-reporting of dropouts. Also, a significant number of Virginia high school students are retained and not promoted to the next grade. These issues were not the primary focus of this study, and JLARC staff were not able to fully examine them. The concerns that are raised appear to pre-date the SOLs, and it is not yet clear what impact, if any, the SOLs have had or will have on these issues. However, based on the seriousness of the issues raised by an initial review of the data, further study of these areas may be warranted.
It is generally thought that most students entering a Virginia high school will graduate from that high school after four years. However, in some divisions this does not appear to be the case. A substantial number of students either drop out of high school, or are retained one or more times, such that the number of graduating seniors is substantially less than the number of freshmen that began four years earlier. In these divisions, graduation rates are lower than in divisions with fewer dropouts and retentions. The remainder of this section discusses concerns with respect to the on-time graduation rate in Virginia, as well as related concerns with dropout and retention rates.
A Substantial Number of Virginia Students May Not Graduate within Four Years
Since 1983, the number of Virginia twelfth graders has been consistently smaller than the number of Virginia ninth grade students four years earlier. As a result, it appears that, historically, a substantial number (as many as 20 percent) of Virginia ninth graders, on average, have not been graduating on time (twelfth grade enrollment is used in the 20-year calculation because graduation information is not available for the entire period.)
Page 93 Chapter V. Impact of the SOLs and Other Issues
Until recently, the State has not calculated a graduation rate for each division. Instead, the Virginia Department of Education (DOE) provided an estimate of each division’s graduation rate by comparing the number of graduates in a given year to the number of freshmen four years earlier. This estimate is referred to in this section as the on-time graduation percentage. Currently, available State data do not track individual students, and the State does not collect information on transfers among divisions. Therefore, the on-time graduation percentage cannot be adjusted for transfers or retentions. However, transfers between Virginia schools are unlikely to explain the high number of students who do not graduate on time at the State level. As a result, this measure provides the best available picture of on-time graduation, and this section will use the on-time graduation percentage as the primary estimate of graduation rates.
Table 16 presents information for the seven divisions with the lowest and highest on-time graduation percentages over a five-year period (1997-2002), and Figure 20 presents information for each division in the State. As shown in Table 16, Virginia had an on-time graduation percentage of 75 percent over the last five years and 77 percent in 2001-2002.
At the direction of the federal Department of Education, DOE recently adopted a new method of calculating a graduation rate. This new method resulted in a seven-point increase over the on-time graduation percentage (85 percent, compared to 77 percent). Table 16 also presents information on the new graduation rate. This new calculation does not compare the number of graduates to the starting number of freshmen, and therefore does not indicate what percentage of students graduated on time.
Higher Dropout Rates than Reported May Partially Explain Low On-Time Graduation
Divisions with high dropout rates tend to have low on-time graduation rates. However, the current method of calculating the dropout rate does not appear to provide an accurate perspective on how many students drop out during their high school years. Additionally, the dropout rate for any individual grade level – or for a graduating class – cannot be determined from the State dropout rate. Each year, DOE collects information on the number of students who dropped out between the seventh and twelfth grades during that year, and then calculates a dropout rate as a percentage of students enrolled in those grades. DOE calculates dropout rates in this manner at the direction of the federal Department of Education. For 2001-2002, the State dropout rate was 2.0 percent. However, because the majority of dropouts occur at the high school level, including seventh and eighth grade student counts and dropouts in the calculation may substantially understate this annual dropout rate.
An alternative way of calculating dropout rates is to take the number of pupils who dropped out in the four-year period after they began ninth grade, as a percentage of the starting number of ninth graders. As presented in Table 17, using this alternative method, 12.7 percent of the State’s ninth graders in 1998-1999 were
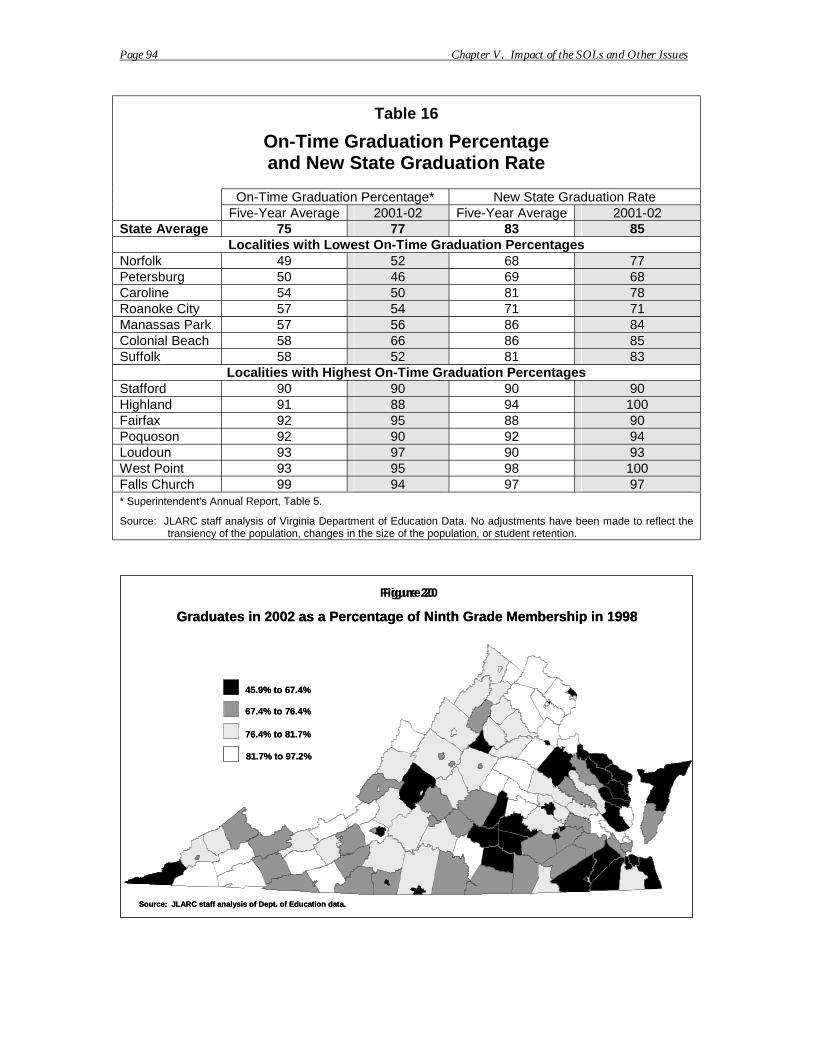
Page 94 Chapter V. Impact of the SOLs and Other Issues
Table 16
On-Time Graduation Percentage and New State Graduation Rate
On-Time Graduation Percentage* New State Graduation Rate Five-Year Average 2001-02 Five-Year Average 2001-02 State Average 75 77 83 85
Localities with Lowest On-Time Graduation Percentages Norfolk 49 52 68 77 Petersburg 50 46 69 68 Caroline 54 50 81 78 Roanoke City 57 54 71 71 Manassas Park 57 56 86 84 Colonial Beach 58 66 86 85 Suffolk 58 52 81 83
Localities with Highest On-Time Graduation Percentages Stafford 90 90 90 90 Highland 91 88 94 100 Fairfax 92 95 88 90 Poquoson 92 90 92 94 Loudoun 93 97 90 93 West Point 93 95 98 100 Falls Church 99 94 97 97 * Superintendent’s Annual Report, Table 5.
Source: JLARC staff analysis of Virginia Department of Education Data. No adjustments have been made to reflect the transiency of the population, changes in the size of the population, or student retention.
Figure 20Figure 20
Graduates in 2002 as a Percentage of Ninth Grade Membership in 1998Graduates in 2002 as a Percentage of Ninth Grade Membership in 1998
45.9% to 67.4%
67.4% to 76.4%
76.4% to 81.7%
81.7% to 97.2%
45.9% to 67.4%
67.4% to 76.4%
76.4% to 81.7%
81.7% to 97.2%
Source: JLARC staff analysis of Dept. of Education data.Source: JLARC staff analysis of Dept. of Education data.
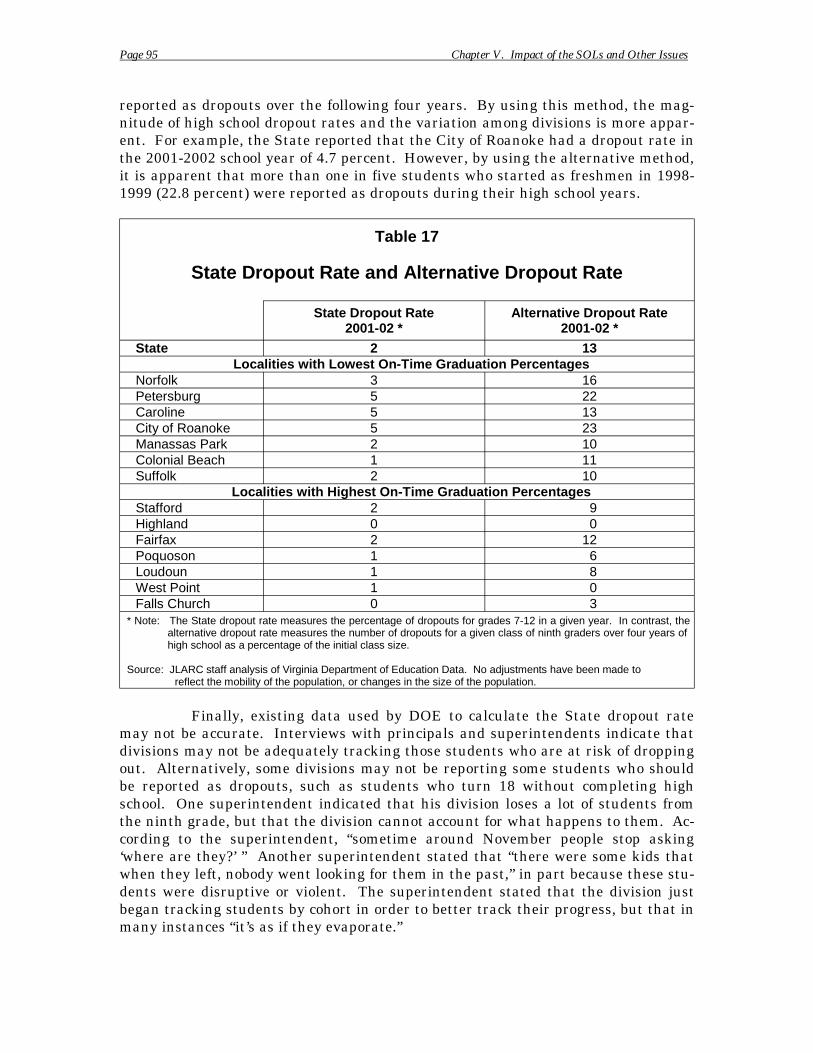
Page 95 Chapter V. Impact of the SOLs and Other Issues
reported as dropouts over the following four years. By using this method, the magnitude of high school dropout rates and the variation among divisions is more apparent. For example, the State reported that the City of Roanoke had a dropout rate in the 2001-2002 school year of 4.7 percent. However, by using the alternative method, it is apparent that more than one in five students who started as freshmen in 19981999 (22.8 percent) were reported as dropouts during their high school years.
Table 17
State Dropout Rate and Alternative Dropout Rate
State Dropout Rate Alternative Dropout Rate 2001-02 * 2001-02 *
State 2 13 Localities with Lowest On-Time Graduation Percentages
Norfolk 3 16 Petersburg 5 22 Caroline 5 13 City of Roanoke 5 23 Manassas Park 2 10 Colonial Beach 1 11 Suffolk 2 10
Localities with Highest On-Time Graduation Percentages Stafford 2 9 Highland 0 0 Fairfax 2 12 Poquoson 1 6 Loudoun 1 8 West Point 1 0 Falls Church 0 3
* Note: The State dropout rate measures the percentage of dropouts for grades 7-12 in a given year. In contrast, the alternative dropout rate measures the number of dropouts for a given class of ninth graders over four years of high school as a percentage of the initial class size.
Source: JLARC staff analysis of Virginia Department of Education Data. No adjustments have been made to reflect the mobility of the population, or changes in the size of the population.
Finally, existing data used by DOE to calculate the State dropout rate may not be accurate. Interviews with principals and superintendents indicate that divisions may not be adequately tracking those students who are at risk of dropping out. Alternatively, some divisions may not be reporting some students who should be reported as dropouts, such as students who turn 18 without completing high school. One superintendent indicated that his division loses a lot of students from the ninth grade, but that the division cannot account for what happens to them. According to the superintendent, “sometime around November people stop asking ‘where are they?’ ” Another superintendent stated that “there were some kids that when they left, nobody went looking for them in the past,” in part because these students were disruptive or violent. The superintendent stated that the division just began tracking students by cohort in order to better track their progress, but that in many instances “it’s as if they evaporate.”
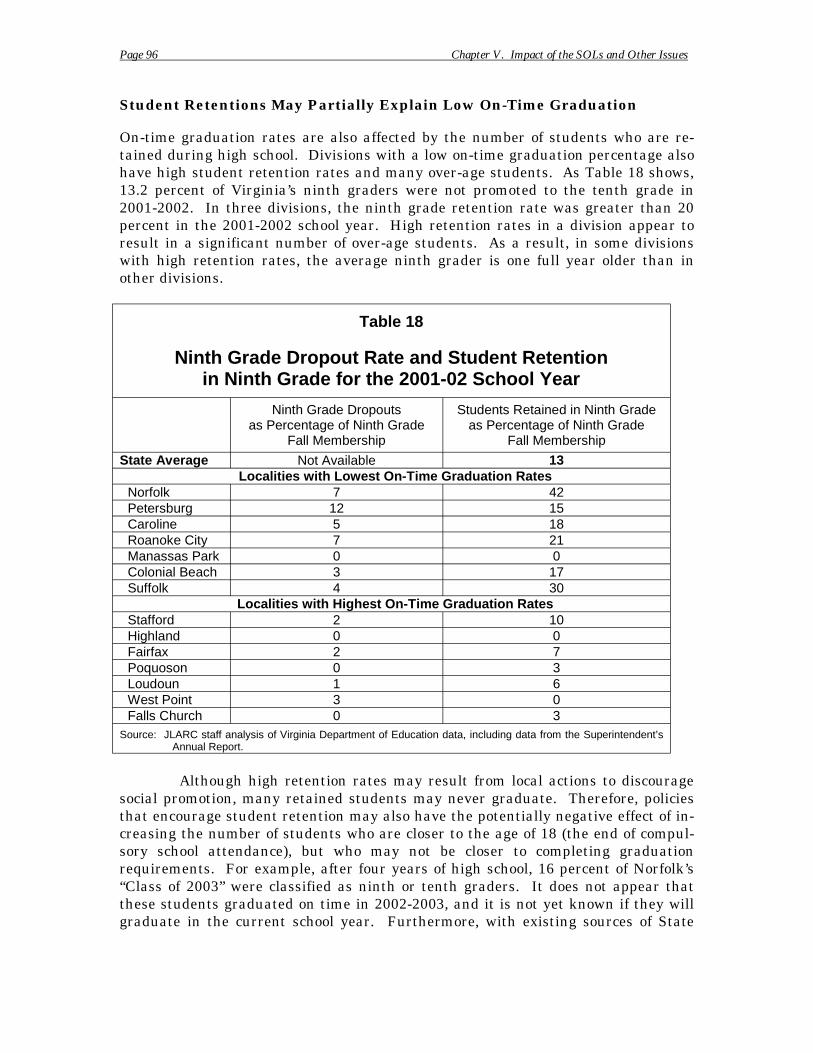
Page 96 Chapter V. Impact of the SOLs and Other Issues
Student Retentions May Partially Explain Low On-Time Graduation
On-time graduation rates are also affected by the number of students who are retained during high school. Divisions with a low on-time graduation percentage also have high student retention rates and many over-age students. As Table 18 shows, 13.2 percent of Virginia’s ninth graders were not promoted to the tenth grade in 2001-2002. In three divisions, the ninth grade retention rate was greater than 20 percent in the 2001-2002 school year. High retention rates in a division appear to result in a significant number of over-age students. As a result, in some divisions with high retention rates, the average ninth grader is one full year older than in other divisions.
Table 18
Ninth Grade Dropout Rate and Student Retention in Ninth Grade for the 2001-02 School Year
Ninth Grade Dropouts as Percentage of Ninth Grade
Fall Membership
Students Retained in Ninth Grade as Percentage of Ninth Grade
Fall Membership
State Average Not Available 13 Localities with Lowest On-Time Graduation Rates
Norfolk 7 42 Petersburg 12 15 Caroline 5 18 Roanoke City 7 21 Manassas Park 0 0 Colonial Beach 3 17 Suffolk 4 30
Localities with Highest On-Time Graduation Rates Stafford 2 10 Highland 0 0 Fairfax 2 7 Poquoson 0 3 Loudoun 1 6 West Point 3 0 Falls Church 0 3
Source: JLARC staff analysis of Virginia Department of Education data, including data from the Superintendent’s Annual Report.
Although high retention rates may result from local actions to discourage social promotion, many retained students may never graduate. Therefore, policies that encourage student retention may also have the potentially negative effect of increasing the number of students who are closer to the age of 18 (the end of compulsory school attendance), but who may not be closer to completing graduation requirements. For example, after four years of high school, 16 percent of Norfolk’s “Class of 2003” were classified as ninth or tenth graders. It does not appear that these students graduated on time in 2002-2003, and it is not yet known if they will graduate in the current school year. Furthermore, with existing sources of State
Page 97 Chapter V. Impact of the SOLs and Other Issues
data, it is not possible in any division to track individual students who have been retained and determine when, or if, they graduated.
Issues that Need to Be Addressed
The initial review of graduation, dropout, and retention rates, as well as interviews with principals raise issues that may warrant further study. These issues are:
• Why are on-time graduation percentages low in some divisions, and at the state level?
• Why are dropout and retention rates high in some divisions?
• Are divisions exerting sufficient effort in enforcing the state compulsory attendance law?
• Are existing ninth grade transition programs effective, and are more needed?
• Are existing alternative education programs effective, and are more needed?
• Are local student information systems adequate?
Low On-Time Graduation in Some Divisions. Several factors discussed above may explain why some divisions have low on-time graduation percentages. The presence of high dropout rates, coupled with high percentages of transfers and retained students, may account for most of the students who do not graduate on time. However, it is not clear if these explanations fully account for the low on-time graduation percentages. Additional study may be necessary to determine if these or additional factors are preventing some students from graduating on time.
High Dropout and Retention Rates in Some Divisions. The dropout and retention rates in some divisions are substantially higher than in other divisions, but the reasons for these high rates are not presently evident. There are several possible explanations for dropouts. Regression analysis reported earlier in this report indicates that dropout rates are higher in divisions with a high proportion of poor students, black students, or low adult educational attainment. Additionally, high retention rates may indicate a local effort to reduce social promotions. However, as discussed earlier, high retention rates may increase the number of over-age students, which may in turn increase the number of students at risk of dropping out. A closer examination of dropout and retention rates may be necessary to determine why these rates are substantially higher in some divisions.
Division Enforcement of Compulsory Attendance Law. As described in Chapter IV, the Code of Virginia holds school divisions responsible for enforcing the State’s compulsory school attendance law. Given the differences in local circumstances, and the limitations in existing data, it is difficult to determine whether di
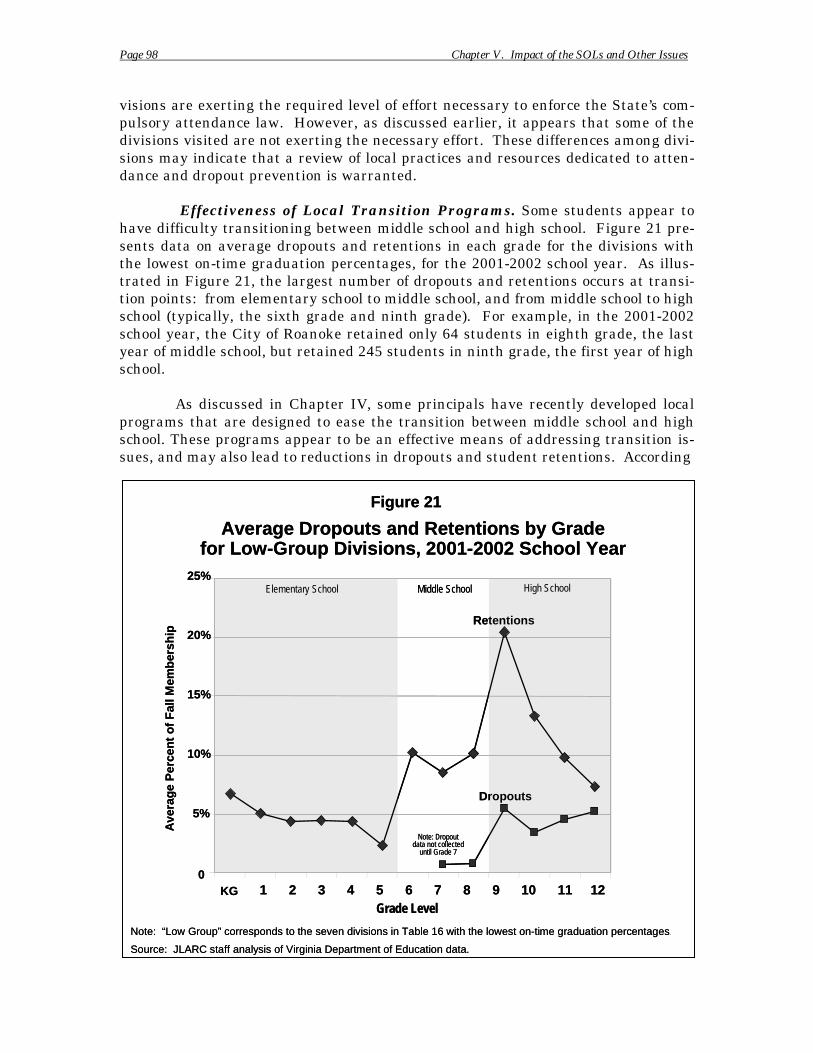
High SchoolElementary School
opouts
ntions
Page 98 Chapter V. Impact of the SOLs and Other Issues
visions are exerting the required level of effort necessary to enforce the State’s compulsory attendance law. However, as discussed earlier, it appears that some of the divisions visited are not exerting the necessary effort. These differences among divisions may indicate that a review of local practices and resources dedicated to attendance and dropout prevention is warranted.
Effectiveness of Local Transition Programs. Some students appear to have difficulty transitioning between middle school and high school. Figure 21 presents data on average dropouts and retentions in each grade for the divisions with the lowest on-time graduation percentages, for the 2001-2002 school year. As illustrated in Figure 21, the largest number of dropouts and retentions occurs at transition points: from elementary school to middle school, and from middle school to high school (typically, the sixth grade and ninth grade). For example, in the 2001-2002 school year, the City of Roanoke retained only 64 students in eighth grade, the last year of middle school, but retained 245 students in ninth grade, the first year of high school.
As discussed in Chapter IV, some principals have recently developed local programs that are designed to ease the transition between middle school and high school. These programs appear to be an effective means of addressing transition issues, and may also lead to reductions in dropouts and student retentions. According
Middle School
Figure 21
Average Dropouts and Retentions by Grade for Low-Group Divisions, 2001-2002 School Year
Ave
rag
e P
erce
nt
of
Fal
l Mem
ber
ship
Note: “Low Group” corresponds to the seven divisions in Table 16 with the lowest on-time graduation percentages.
Source: JLARC staff analysis of Virginia Department of Education data.
0
5%
10%
15%
20%
25%
KG 1 2 3 4 5 6 7 8 9 10 11 12 Grade Level
Dr
Rete
Note: Dropout data not collected
until Grade 7
High SchoolMiddle SchoolElementary School
Figure 21
Average Dropouts and Retentions by Gradefor Low-Group Divisions, 2001-2002 School Year
Ave
rag
e P
erce
nt
of
Fal
l Mem
ber
ship
Note: “Low Group” corresponds to the seven divisions in Table 16 with the lowest on-time graduation percentages.
Source: JLARC staff analysis of Virginia Department of Education data.
0
5%
10%
15%
20%
25%
KG 1 2 3 4 5 6 7 8 9 10 11 12Grade Level
Dropouts
Retentions
Note: Dropoutdata not collected
until Grade 7
Page 99 Chapter V. Impact of the SOLs and Other Issues
to one superintendent, the local transition program was necessary because “some [students] have dropped out long ago and they are just waiting to get to an age where they can.” Additional study of local transition programs to determine their effectiveness may reveal some best practices that could be more widely adopted, or the need for a greater State role in this area.
Sufficiency of Alternative Education. A majority of high school principals interviewed by JLARC staff report that their school division provides insufficient alternative education opportunities. Alternative education is a key approach to addressing the needs of students who are at risk of dropping out. Many of these principals report a need for greater alternatives for educating non-violent pupils, and state that they need assistance addressing the needs of overage students, in order to reduce social promotions and dropouts. Other principals report a need for night school for those students who have work or family responsibilities during the school day. Principals report that while regional programs are available, seats are limited, which forces many students to go on homebound instruction. One principal stated that it is “sometimes harder to get into the alternative schools than Harvard.” Given the role of alternative education in providing additional support for students at risk of dropping out, a review of local practices may be necessary to ascertain the effectiveness of existing approaches.
Adequacy of Local Student Information Systems. As part of the State effort to comply with federal No Child Left Behind (NCLB) legislation, DOE is in the process of developing a new State student information system which will be better able to track students. Until this system is developed, State graduation and dropout statistics will not reflect transfers or retentions. This new system will assign each student enrolled in Virginia schools a unique testing identification number which will stay with them in each grade. The system is expected to be completed by July 2006.
Although the new DOE information system may improve State data, inaccuracies at the local level may need to be addressed. The chief information officer of one division indicated that because their current system does not assign trackable student identification numbers, a single student may be included in their database in multiple instances. This may occur if a student changes residences, or is recorded with slight variations in their name such as the absence of a middle initial. Given the reliance of the proposed State student information system on the accuracy of division level data, a selective review of division data systems and data collection policies may be necessary.
Further study of the low on-time graduation rate at the State level and in some school divisions may be warranted. Additional areas of study might include the following: high dropout and retention rates in some divisions; enforcement of the State compulsory attendance law; adequacy of local ninth grade transition programs; adequacy of alternative education opportunities; and the adequacy of division student information systems.
Page 100 Chapter V. Impact of the SOLs and Other Issues
ISSUES WHICH MAY AFFECT FUTURE PERFORMANCE
During the review of education performance, JLARC staff encountered several issues that may affect performance in the coming years. Changes to the accreditation standards beginning in the 2003-2004 school year may result in an increase in the number of schools accredited with warning, as well as a decrease in the number of students graduating. Accreditation changes include: an increase in the school percent pass rates required in the third and fifth grade, a new science and history pass requirement for third grade, and making graduation contingent upon passing certain SOL end-of-course tests. In addition, a recent study of SOL effectiveness suggested that advanced pass rates should be reported to ensure that schools focus on overall academic performance and not just on meeting minimum requirements. Finally, federal No Child Left Behind (NCLB) requirements may affect performance as schools work to meet additional adequate-yearly-progress requirements in addition to State SOL requirements.
Changes in SOL Accreditation Standards in 2004
Changes in the Standards of Accreditation (SOA) in 2003-2004 may affect the number of schools accredited and the percent of students graduating. As discussed in Chapter I, school accreditation ratings will decrease from four to two categories beginning with the 2003-2004 school year SOL test results. The new ratings will only include the fully accredited and accredited with warning categories. In addition, third and fifth grade pass requirements will increase from 70 to 75 percent in English, and third grade science and history pass rates will now be 50 percent whereas no requirement existed in prior years. With the decrease in the number of accreditation categories and the increase in the pass rate requirements for elementary grades, the number of schools accredited with warning may increase in 2004.
In addition, graduation rates may decrease as a result of the changes in the SOA. For the 2003-2004 school year, high school seniors are required to have passed six SOL tests to earn a Standard Diploma: two in English, and four other tests of their choice. In prior years, students were required to receive only 22 standard credits to graduate without having to pass any SOL tests.
Education Experts Recommend Implementing Additional Reporting Requirements to Raise Expectations for Academic Achievement
Several education experts have raised the concern that focusing strictly on SOL pass rates may lead schools to concentrate primarily on students whose scores fall close to the pass rate rather than on improving the overall academic achievement of all students. A recent study commissioned by the State Board of Education that reviewed the effectiveness of the SOL reforms raised this concern for Virginia schools, and recommended that the Virginia Department of Education also collect and report data on advanced pass rates (students scoring 500 or above on SOL tests). The report stated, “the failure to separate out advanced scores from passing scores could be depressing overall performance.” It also emphasized that if the State did not focus on advanced performance, then neither would schools nor students.
Page 101 Chapter V. Impact of the SOLs and Other Issues
At a meeting in the fall of 2002, the State Board of Education met to review the study and discuss the proposed recommendations. Many board members shared the concern that schools may tend to focus on students’ ability to pass SOL tests rather than maximizing the performance of all students. As a result of these concerns, DOE indicated that it will begin reporting advanced pass rates beginning with the 2003 spring test results.
Several school principals and division superintendents also acknowledged the issue. They noted that current accreditation requirements are only a minimum, and that schools and students should continue to improve upon their performance even if they have met the State’s standards. In some cases, divisions and schools developed standards for educational objectives that were higher than current SOL requirements, because these standards encourage students to perform above the minimum requirements.
Requiring schools to report average scaled scores in addition to pass rates may also be beneficial. Such a reporting requirement might encourage schools to focus more on improving the scores of all students rather than only on increasing the proportion of students who pass the test. This data would also provide the public with a more informative assessment of how well a school is performing.
Effects of Federal No Child Left Behind Legislation
One effect of the No Child Left Behind (NCLB) legislation is that schools may have to improve their performance even if they have met State accreditation standards, because of differences in State and federal requirements. Unlike State accreditation standards, which are based on a set pass rate by school, adequate yearly-progress (AYP) requirements focus on improvement in passing scores by school and by various sub-groups. As a result, it is possible that a school that meets the State’s set pass rate but does not improve from the previous year could meet State accreditation standards and not NCLB requirements. Therefore, it appears that schools may need to continue to improve test scores even after meeting State accreditation standards in order to meet the requirements of the NCLB legislation.
In September 2003, the Virginia Department of Education released preliminary data on schools that did not meet the federal No Child Left Behind requirements of adequate-yearly-progress (AYP). Based on the data, 55 percent of schools and 14 percent of divisions did not meet AYP goals in 2002-2003 (Table 19). In contrast, only 35 percent of schools did not meet the State’s accreditation requirements in the same year.
Officials in a number of states, including Virginia, have raised concerns about the reasonableness and appropriateness of the NCLB requirements. Although observers in the education field anticipate that NCLB will be modified somewhat in the future, at least in the short-term, many schools can expect differences between their status under the State’s accreditation standards and their status under NCLB.
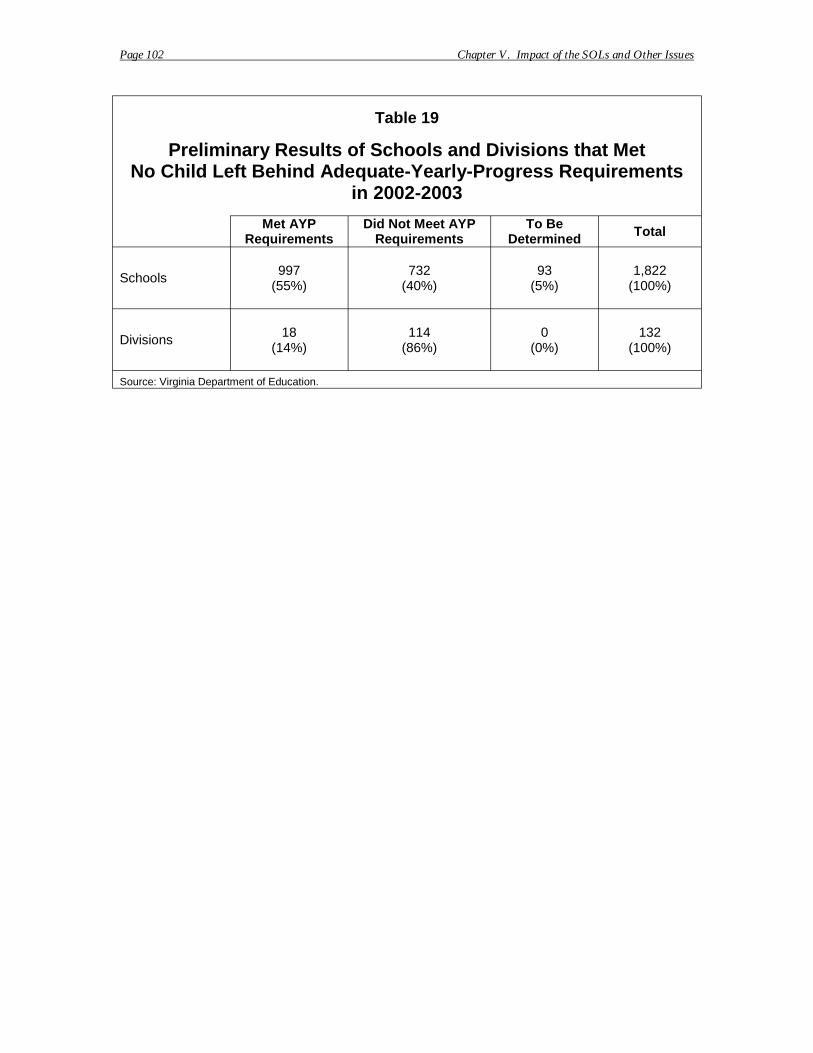
Page 102 Chapter V. Impact of the SOLs and Other Issues
Table 19
Preliminary Results of Schools and Divisions that Met No Child Left Behind Adequate-Yearly-Progress Requirements
in 2002-2003
Met AYP Did Not Meet AYP To Be Total Requirements Requirements Determined
997 732 93 1,822 Schools (55%) (40%) (5%) (100%)
18 114 0 132Divisions (14%) (86%) (0%) (100%)
Source: Virginia Department of Education.
Page 103 Appendixes
Appendixes
Page
Appendix A: Study Mandate ........................................................................... A-1
Appendix B: Glossary of Terms and Variables............................................. B-1
Appendix C: Schools and Divisions Selected for Review .......................... C-1
Appendix D: Calculations of SOL Scale Scores and Pass Rates for Schools and Divisions..........................................................D-1
Appendix E: Virginia Student Performance on Norm-Referencedand Criterion-Referenced Tests ............................................. E-1
Appendix F: Statistical Methodology and Results ..................................... F-1
Appendix G: Profiles of the Schools with the Highest and Lowest SOL Scores .................................................................................. G-1
Appendix H: School Divisions in Virginia with the Greatest Level of Challenge .................................................................................H-1

Page 104 Appendixes
Appendix A: Study Mandate
Senate Joint Resolution No. 349
2003 Session
Directing the Joint Legislative Audit and Review Commission to collect data and information regarding best practices at high-performing public schools in the Commonwealth. Report.
WHEREAS, in 1998, the first year of the SOL assessment administration, 39 schools (2 percent) of Virginia public schools achieved "fully accredited" status, and in 2001, that number increased to 731, or 40 percent, with 558 schools (30 percent) meeting state progress benchmarks; and
WHEREAS, that, after 5 years of the SOL assessments, state scores have dramatically improved, evidencing a 17 percent gain in third-grade English scores since 1998 and a 22 percent increase in the scores of African-American students on this third-grade assessment; and
WHEREAS, gains in mathematics scores have been more dramatic overall than those for reading at the various grade levels, with Algebra I scores statewide improving from a 40 percent passing rate in 1998 to a 78 percent passing rate in 2002; and
WHEREAS, however, also in 2001, 117 schools (7 percent) remained "accredited with warning"; 34 of these are Title I schools (those with a high percentage of students eligible for the free and reduced price lunch program) receiving warnings in English or mathematics, or both, for the second consecutive year; and
WHEREAS, curriculum misalignment plagued 90 percent of those schools accredited with warning, and academic review teams observed that 75 percent of the warned schools do not use student achievement data to make instructional decisions; and
WHEREAS, while significant gains have been realized by many schools in ensuring that Virginia students are effectively prepared to meet the challenges of the 21st century workplace and higher education, gaps remain between the performance of majority students and that of certain minority student groups; and
WHEREAS, although challenged by the presence of special student populations, fiscal constraints, and other concerns, some school divisions in Virginia and across
A-1
the nation have nonetheless managed to improve dramatically student performance and narrow the achievement gap; and
WHEREAS, identification of those effective academic practices employed by successful school divisions, and, more specifically, by those facing particular challenges will facilitate the dissemination of best practices among Virginia school divisions; and
WHEREAS, in addition, identification of any correlation between best practices, available services and resources, instructional quality, community involvement, and other factors that may influence academic success will assist in the development and implementation of effective educational initiatives throughout the Commonwealth; now, therefore, be it
RESOLVED by the Senate, the House of Delegates concurring, That the Joint Legislative Audit and Review Commission be directed to collect data and information regarding best practices at high-performing public schools in the Commonwealth.
In collecting such data and information, the Commission shall identify and examine (i) those schools that have performed successfully in meeting the Standards of Accreditation and those who have achieved marked improvement in student and school performance; (ii) specific demographic and other factors that may influence academic success; (iii) practices and demographic information of the best- and poorest-performing school divisions; (iv) successful practices in those high-performing school divisions with marked fiscal or other challenges; and (v) such related issues as it deems appropriate.
All agencies of the Commonwealth shall provide assistance to the Commission in collecting the information, upon request.
The Commission shall submit to the Division of Legislative Automated Systems an executive summary and the data and information collected on such best practices no later than the first day of the 2004 Regular Session of the General Assembly.
A-2
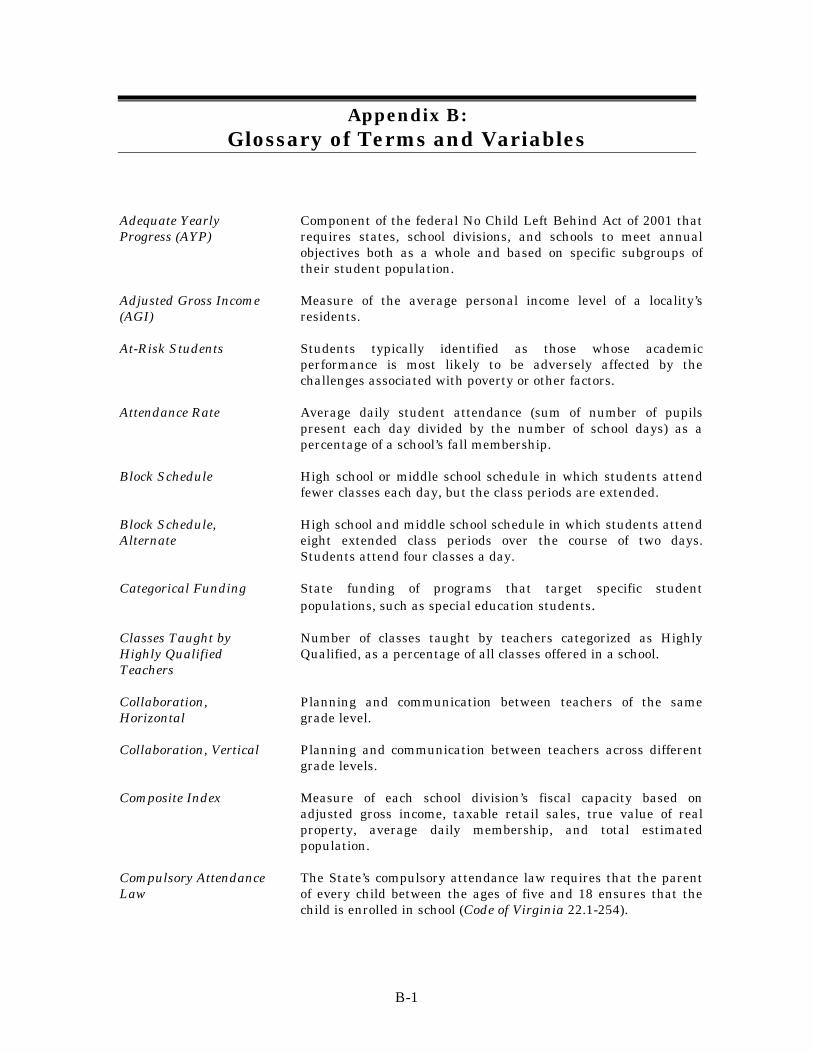
Appendix B:Glossary of Terms and Variables
Adequate Yearly Component of the federal No Child Left Behind Act of 2001 that Progress (AYP) requires states, school divisions, and schools to meet annual
objectives both as a whole and based on specific subgroups of their student population.
Adjusted Gross Income Measure of the average personal income level of a locality’s (AGI) residents.
At-Risk Students Students typically identified as those whose academic performance is most likely to be adversely affected by the challenges associated with poverty or other factors.
Attendance Rate Average daily student attendance (sum of number of pupils present each day divided by the number of school days) as a percentage of a school’s fall membership.
Block Schedule High school or middle school schedule in which students attend fewer classes each day, but the class periods are extended.
Block Schedule, High school and middle school schedule in which students attend Alternate eight extended class periods over the course of two days.
Students attend four classes a day.
Categorical Funding State funding of programs that target specific student populations, such as special education students.
Classes Taught by Number of classes taught by teachers categorized as Highly Highly Qualified Qualified, as a percentage of all classes offered in a school. Teachers
Collaboration, Planning and communication between teachers of the same Horizontal grade level.
Collaboration, Vertical Planning and communication between teachers across different grade levels.
Composite Index Measure of each school division’s fiscal capacity based on adjusted gross income, taxable retail sales, true value of real property, average daily membership, and total estimated population.
Compulsory Attendance The State’s compulsory attendance law requires that the parent Law of every child between the ages of five and 18 ensures that the
child is enrolled in school (Code of Virginia 22.1-254).
B-1
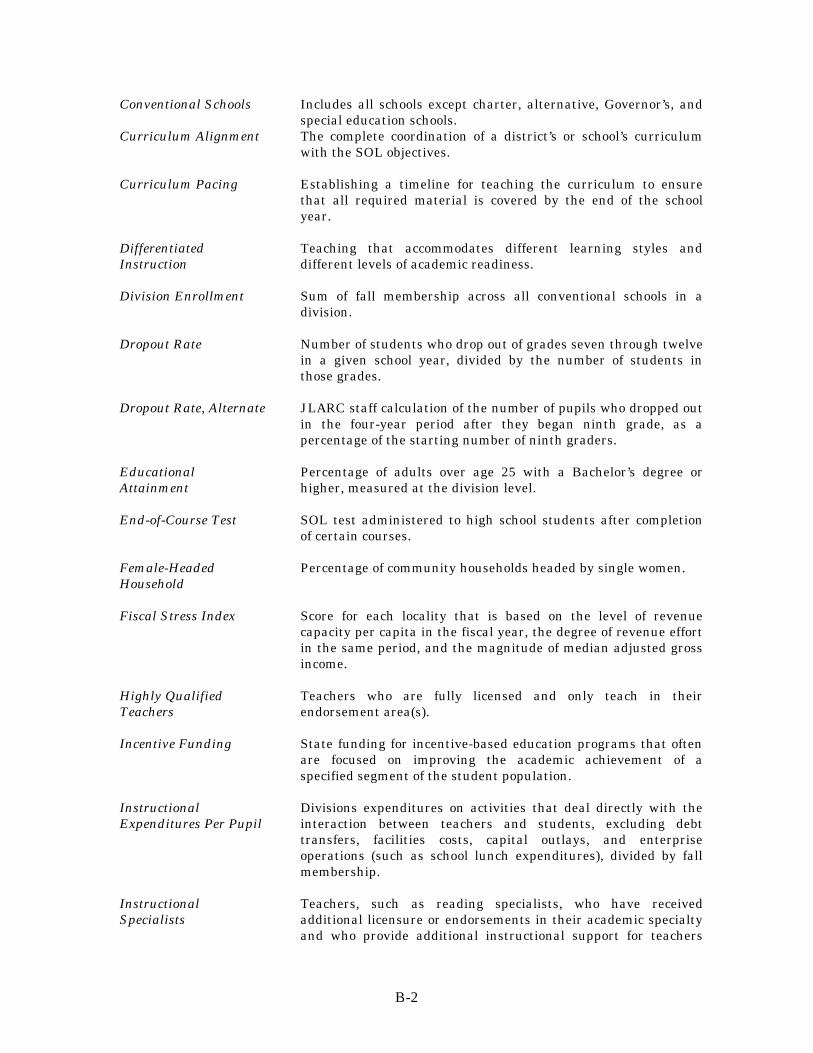
Conventional Schools Includes all schools except charter, alternative, Governor’s, and special education schools.
Curriculum Alignment The complete coordination of a district’s or school’s curriculum with the SOL objectives.
Curriculum Pacing Establishing a timeline for teaching the curriculum to ensure that all required material is covered by the end of the school year.
Differentiated Teaching that accommodates different learning styles and Instruction different levels of academic readiness.
Division Enrollment Sum of fall membership across all conventional schools in a division.
Dropout Rate Number of students who drop out of grades seven through twelve in a given school year, divided by the number of students in those grades.
Dropout Rate, Alternate JLARC staff calculation of the number of pupils who dropped out in the four-year period after they began ninth grade, as a percentage of the starting number of ninth graders.
Educational Percentage of adults over age 25 with a Bachelor’s degree or Attainment higher, measured at the division level.
End-of-Course Test SOL test administered to high school students after completion of certain courses.
Female-Headed Percentage of community households headed by single women. Household
Fiscal Stress Index Score for each locality that is based on the level of revenue capacity per capita in the fiscal year, the degree of revenue effort in the same period, and the magnitude of median adjusted gross income.
Highly Qualified Teachers who are fully licensed and only teach in their Teachers endorsement area(s).
Incentive Funding State funding for incentive-based education programs that often are focused on improving the academic achievement of a specified segment of the student population.
Instructional Divisions expenditures on activities that deal directly with the Expenditures Per Pupil interaction between teachers and students, excluding debt
transfers, facilities costs, capital outlays, and enterprise operations (such as school lunch expenditures), divided by fall membership.
Instructional Teachers, such as reading specialists, who have received Specialists additional licensure or endorsements in their academic specialty
and who provide additional instructional support for teachers
B-2
National Assessment of Educational Progress (NAEP)
No Child Left Behind Act (NCLB)
On-Time Graduation Percentage
Operating Expenditures Per Pupil
Poverty
Race
Reading First Program
Remediation
Retention Rate
Revenue Capacity Per Capita
Safety Incident
SOL Pass Rates
and students.
National assessment that is administered to a representative sample of fourth and eighth grade students historically administered once every four years in Virginia. Under current No Child Left Behind legislation, states are now required to administer the test every other year.
Federal legislation amending the Elementary and Secondary Education Act and establishing greater accountability standards for states, divisions, and schools as well as greater options for parents regarding their children’s education.
JLARC staff calculation of the number of students who obtain a high school diploma or GED as a percentage of a school’s ninth grade fall membership four years prior.
Total operating expenditures of a division excluding debt transfers, facilities costs, capital outlays, and enterprise operations (such as school lunch expenditures) divided by fall membership. These expenditures can be reported in total or categories (i.e. instructional only).
Number of students receiving a free or reduced-price lunch through the National School Lunch Program as a percentage of a school’s fall membership.
Number of black students as a percentage of a school’s fall membership.
Federally funded program authorized under No Child Left Behind that is designed to implement scientifically-based and high-quality reading programs in kindergarten through third grade.
Additional instructional support for students with academic weaknesses.
Total number of students retained (held back) in a school each year divided by the number of students enrolled in the same time period.
Revenue that a locality could expect from its various resource bases at statewide average rates of return.
Measures the number of incidents involving a fight, serious incident, firearm, or non-firearm weapon per 100 students in a school.
Percentage of students who score 400 or better on the SOL tests. A score of 400 or above is considered passing, and 500 or above is considered advanced.
B-3
SOL Scaled Scores Score between 0 and 600 assigned to every SOL test taken that measures SOL test performance.
Standards of Requirements schools must meet in order to be accredited. Accreditation (SOA) Requirements are based primarily on whether or not schools
achieve pass rates on SOL tests in specified grades and subject areas. Several categories of accreditation exist and vary by school year.
Standards of Learning Statewide educational objectives that define the skills and (SOL) knowledge students in Virginia are expected to acquire and know
from elementary through high school.
Standards of Quality Minimum requirements for school divisions in Virginia to (SOQ) provide a program of high quality for public elementary and
secondary education.
Stanford 9 Test Norm-referenced standardized achievement test previously administered annually in Virginia to all students in grades four, six, and nine. Funding was cut for administration of the Stanford 9 test in fiscal year 2004.
Teacher Quality Grants Federal grants designed to be used to increase the knowledge and skills of teachers and administrators.
Teachers With 3 or Number of teachers in a school with three or fewer years of Fewer Years of teaching experience divided by that school’s total faculty. Experience
Teaching License, Full Teacher who has a bachelor's degree and the required amount of methods coursework and clinical experiences, and who has passed the Praxis I and Praxis II tests. (Teachers who have two years of teaching experience in an accredited school in another state are not required to take the Praxis.) Although alternate routes to licensure exist, the basic requirements described above are the same.
Teaching License, Local Teaching license granted by a local school division that is valid only in the school division that issues the license. Individuals must have a baccalaureate degree and training that is approved by the school board or superintendent. Local licenses expire after three years.
Teaching License, Nonrenewable teaching license provided to individuals who hold Provisional a baccalaureate degree and meet the education requirements in
at least one endorsement area, but who fail to meet the requirements for full licensure. A provisional license expires after three years.
Title I per Pupil Title I, Part A federal funding to each division divided by division total fall membership.
B-4
Title I, Part A Program Federal program that provides states and localities with formula-based supplemental funding to provide further support to high poverty students.
Transiency The movement of students in and out of schools during the school year.
Truancy Conferences Number of truancy conferences conducted by each division during the school year per 100 students enrolled.
Verified Credits Credits received after passing an end-of-course SOL test. Graduating seniors must have six verified credits to graduate as of the 2003-2004 school year.
Years of Teaching Average number of years of experience across all teachers in a Experience school, measured through years of experience in total, in
Virginia, and in the current division.
B-5

B-6
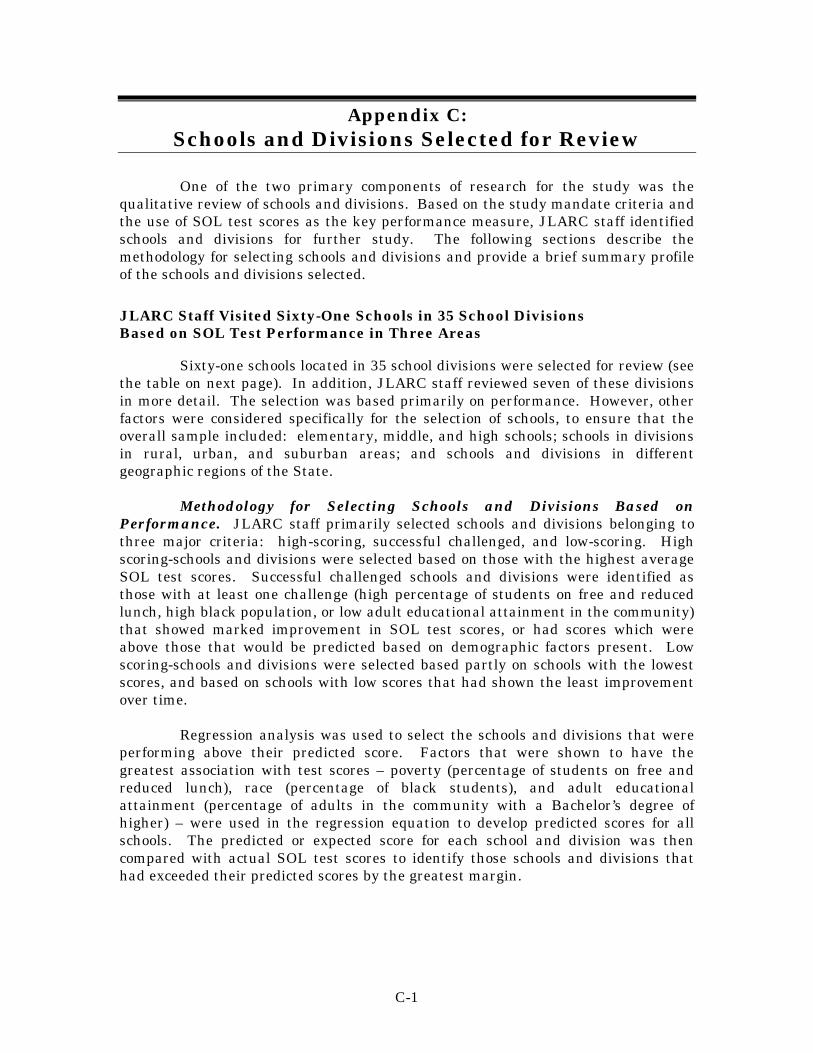
Appendix C:Schools and Divisions Selected for Review
One of the two primary components of research for the study was the qualitative review of schools and divisions. Based on the study mandate criteria and the use of SOL test scores as the key performance measure, JLARC staff identified schools and divisions for further study. The following sections describe the methodology for selecting schools and divisions and provide a brief summary profile of the schools and divisions selected.
JLARC Staff Visited Sixty-One Schools in 35 School Divisions Based on SOL Test Performance in Three Areas
Sixty-one schools located in 35 school divisions were selected for review (see the table on next page). In addition, JLARC staff reviewed seven of these divisions in more detail. The selection was based primarily on performance. However, other factors were considered specifically for the selection of schools, to ensure that the overall sample included: elementary, middle, and high schools; schools in divisions in rural, urban, and suburban areas; and schools and divisions in different geographic regions of the State.
Methodology for Selecting Schools and Divisions Based on Performance. JLARC staff primarily selected schools and divisions belonging to three major criteria: high-scoring, successful challenged, and low-scoring. High scoring-schools and divisions were selected based on those with the highest average SOL test scores. Successful challenged schools and divisions were identified as those with at least one challenge (high percentage of students on free and reduced lunch, high black population, or low adult educational attainment in the community) that showed marked improvement in SOL test scores, or had scores which were above those that would be predicted based on demographic factors present. Low scoring-schools and divisions were selected based partly on schools with the lowest scores, and based on schools with low scores that had shown the least improvement over time.
Regression analysis was used to select the schools and divisions that were performing above their predicted score. Factors that were shown to have the greatest association with test scores – poverty (percentage of students on free and reduced lunch), race (percentage of black students), and adult educational attainment (percentage of adults in the community with a Bachelor’s degree of higher) – were used in the regression equation to develop predicted scores for all schools. The predicted or expected score for each school and division was then compared with actual SOL test scores to identify those schools and divisions that had exceeded their predicted scores by the greatest margin.
C-1
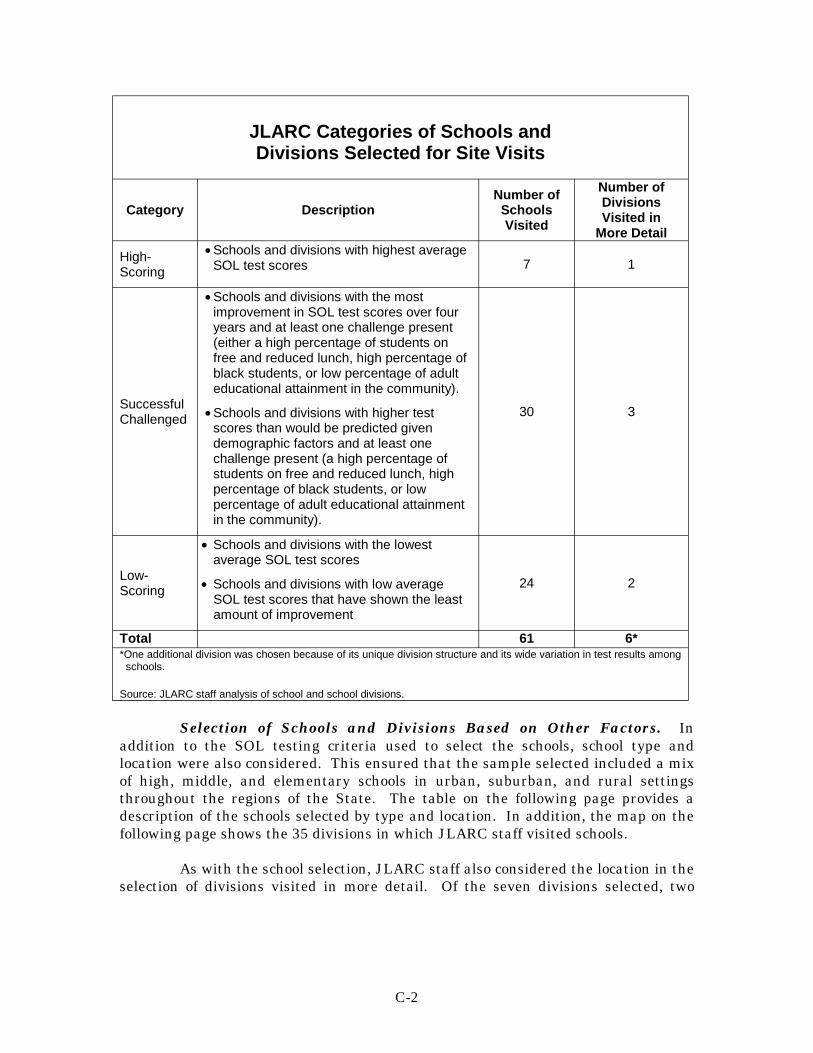
JLARC Categories of Schools and Divisions Selected for Site Visits
Category Description Number of Schools Visited
Number of Divisions Visited in
More Detail
High-Scoring
• Schools and divisions with highest average SOL test scores 7 1
• Schools and divisions with the most improvement in SOL test scores over four years and at least one challenge present (either a high percentage of students on free and reduced lunch, high percentage of black students, or low percentage of adult educational attainment in the community).
Successful Challenged • Schools and divisions with higher test
scores than would be predicted given demographic factors and at least one challenge present (a high percentage of students on free and reduced lunch, high percentage of black students, or low percentage of adult educational attainment in the community).
30 3
• Schools and divisions with the lowest
Low-Scoring
average SOL test scores
• Schools and divisions with low average SOL test scores that have shown the least
24 2
amount of improvement
Total 61 6* *One additional division was chosen because of its unique division structure and its wide variation in test results among
schools.
Source: JLARC staff analysis of school and school divisions.
Selection of Schools and Divisions Based on Other Factors. In addition to the SOL testing criteria used to select the schools, school type and location were also considered. This ensured that the sample selected included a mix of high, middle, and elementary schools in urban, suburban, and rural settings throughout the regions of the State. The table on the following page provides a description of the schools selected by type and location. In addition, the map on the following page shows the 35 divisions in which JLARC staff visited schools.
As with the school selection, JLARC staff also considered the location in the selection of divisions visited in more detail. Of the seven divisions selected, two
C-2
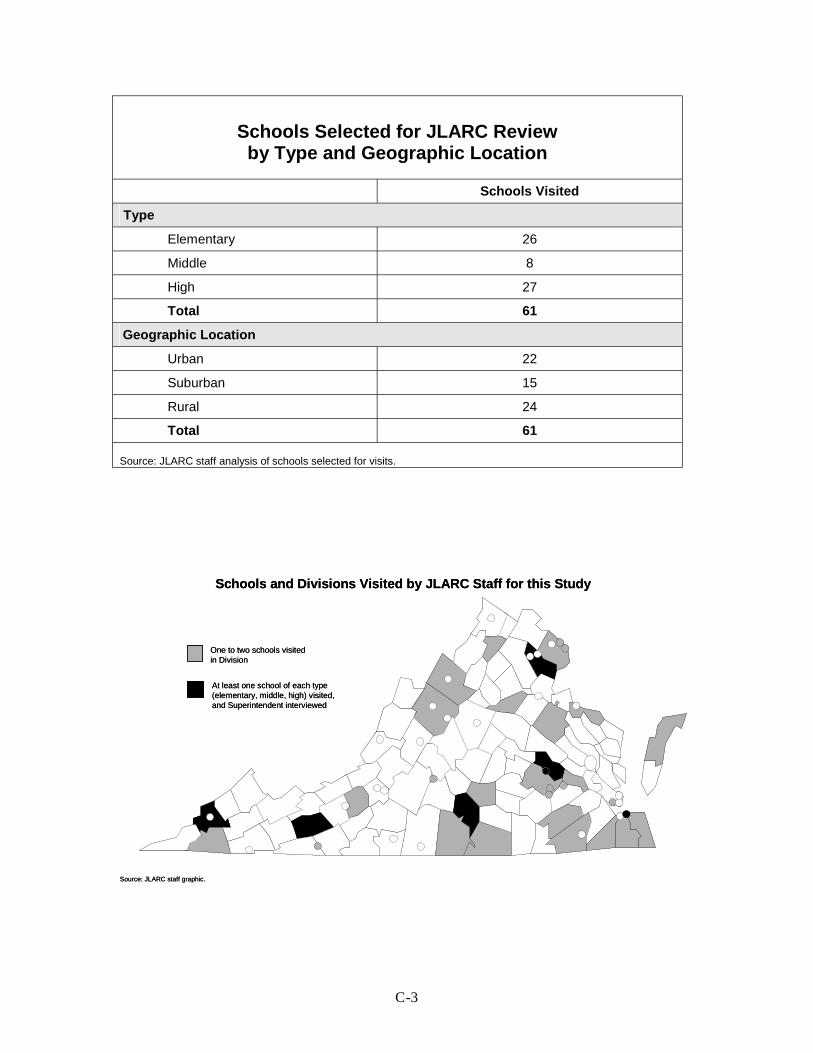
C-3
Schools Selected for JLARC Review by Type and Geographic Location
Schools Visited
Type
Elementary 26
Middle 8
High 27
Total 61
Geographic Location
Urban 22
Suburban 15
Rural 24
Total 61 Source: JLARC staff analysis of schools selected for visits.
Schools and Divisions Visited by JLARC Staff for this Study
One to two schools visited in Division
Source: JLARC staff graphic.
At least one school of each type (elementary, middle, high) visited, and Superintendent interviewed
Schools and Divisions Visited by JLARC Staff for this Study
One to two schools visited in Division
Source: JLARC staff graphic.
At least one school of each type (elementary, middle, high) visited, and Superintendent interviewed
were in urban areas, two in suburban areas, and three in rural areas. In addition, the divisions selected were in the northern, central, Southside, eastern, and southwestern regions of the State (see map on previous page).
School and Division Review
In schools selected for review, JLARC staff conducted a structured interview with the school principal and toured the school. Several principals had their assistant principals and/or their leadership team present during the interview to provide additional input. In addition, JLARC staff surveyed all of the teachers in core subject areas (English, mathematics, history and science) in 49 of the 61 schools, seeking their input in the following areas: how academic achievement is influenced by student characteristics, school characteristics, and instructional practices; the sufficiency and quality of professional development received; the adequacy of financial resources in relation to academic achievement; and the impact of the SOLs.
The division review included a structured interview with the school superintendent and a review of at least three schools in the division (one elementary, one middle, and one high school). The schools selected for the division-level analysis were a subset of the schools selected for the school-level analysis. The division-level review was also based on the structural interviews with the principals of the selected schools.
Demographic Profile of Schools and Divisions Selected for JLARC Site Visits
Over 70 percent of the schools visited by JLARC staff had at least one major demographic challenge that data analysis for this study showed to be strongly associated with lower SOL test scores. These demographic challenges were: a high percentage of students on free and reduced-priced lunch, a high percentage of black students, or a low percentage of adult educational attainment in the community. As the figure on the next page illustrates, 51 percent of schools had high rates of poverty. Fifty-six percent had a high proportion of black students, and 43 percent had a low level of adult educational attainment in the community. Forty-three percent of the schools visited had at least two of these challenges.
JLARC staff also focused on school divisions that had a range of challenges present when compared to other school divisions in Virginia. Six of the seven divisions visited by JLARC staff had a high proportion of students on free and reduced priced-lunch, a high percentage of black students, or were in a community with low adult educational attainment levels. Four of the seven divisions had a high
C-4
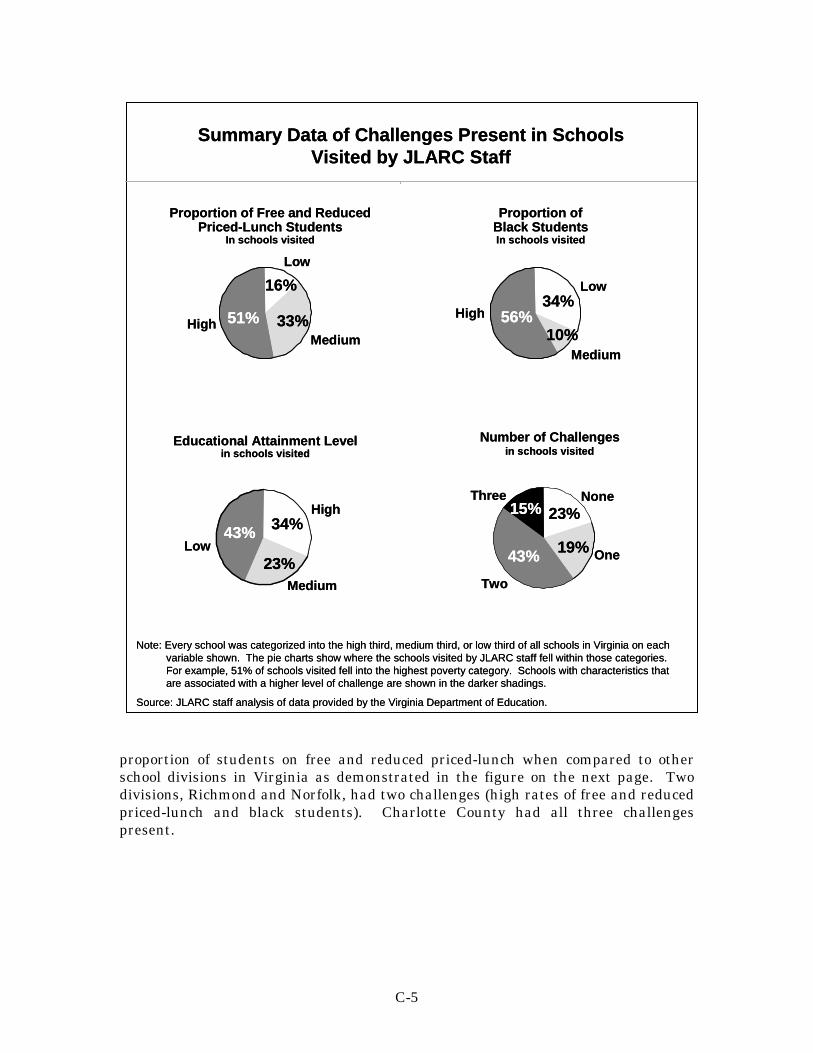
Summary Data of Challenges Present in SchoolsSummary Data of Challenges Present in Schools Visited by JLARC StaffVisited by JLARC Staff
Proportion of Free and ReducedProportion of Free and ReducedPriced-Lunch StudentsPriced-Lunch Students
In schools visitedIn schools visited
16%16%
33%33%51%51%
LowLow
HighHighMediumMedium
Proportion ofProportion ofBlack StudentsBlack StudentsIn schools visitedIn schools visited
34%34%
10%10%56%56%
LowLow
HighHigh
MediumMedium
MediumMedium
43%43%
23%23%
34%34%LowLow
HighHigh
Educational Attainment LevelEducational Attainment Levelin schools visitedin schools visited
Number of ChallengesNumber of Challengesin schools visitedin schools visited
NoneNone
OneOne
TwoTwo
23%23%
19%19%
15%15%
43%43%
ThreeThree
Note: Every school was categorNote: Every school was categoriized into the high third, medium third, orzed into the high third, medium third, or llow third of all schooow third of all schoollss iin Vn Viirginrginiia on eacha on each variabvariablle shown. The pe shown. The piie charts show where the schooe charts show where the schoolls vs viisited by JLARC staff fesited by JLARC staff fellll wwiithin those categories.thin those categories.For example, 51% of schools vFor example, 51% of schools viisited fellsited fell iinto the highest poverty category. Schoonto the highest poverty category. Schoolls ws wiith characteristth characteristiics thatcs thatare associated ware associated wiith a higher leveth a higher levell of chaof challlenge are shown in the darker shadlenge are shown in the darker shadiings.ngs.
Source: JLARC staff anaSource: JLARC staff anallysis of data provided by the Vysis of data provided by the Viirginia Department of Educatrginia Department of Educatiion.on.
proportion of students on free and reduced priced-lunch when compared to other school divisions in Virginia as demonstrated in the figure on the next page. Two divisions, Richmond and Norfolk, had two challenges (high rates of free and reduced priced-lunch and black students). Charlotte County had all three challenges present.
C-5
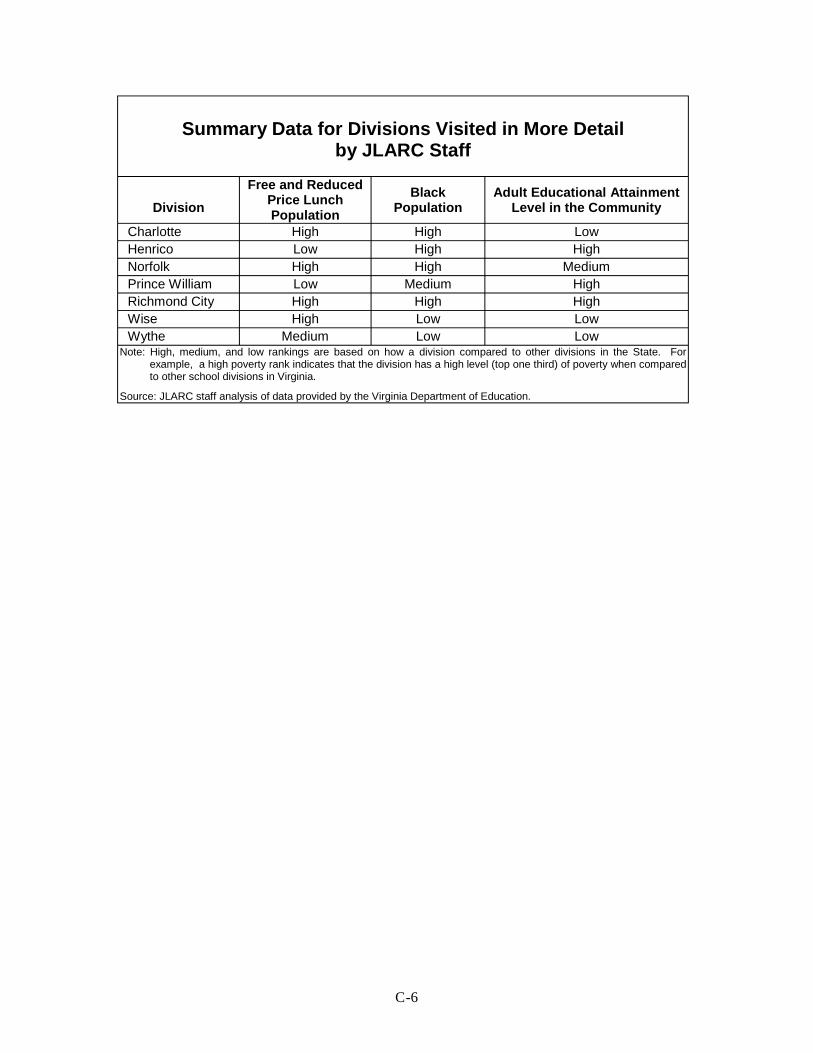
Summary Data for Divisions Visited in More Detail by JLARC Staff
Division
Free and Reduced Price Lunch Population
Black Population
Adult Educational Attainment Level in the Community
Charlotte High High Low Henrico Low High High Norfolk High High Medium Prince William Low Medium High Richmond City High High High Wise High Low Low Wythe Medium Low Low
Note: High, medium, and low rankings are based on how a division compared to other divisions in the State. For example, a high poverty rank indicates that the division has a high level (top one third) of poverty when compared to other school divisions in Virginia.
Source: JLARC staff analysis of data provided by the Virginia Department of Education.
C-6
Appendix D:Calculations of SOL Scaled Scores and Pass Rates
for Schools and Divisions
Each SOL test taken by a student is assigned a scaled score of 0 to 600 based on the number of correct answers. The exhibit on the bottom of the page explains what SOL scaled scores are and how they are determined. JLARC staff calculated an overall average, or mean, SOL scaled score for each school based on the average scale scores in each content area. A list of the content area SOL tests is provided in the exhibit on the following page. In order to calculate an overall average test score for each school, JLARC staff used weighted averages. This was necessary because the number of students tested in each content area varied within each school. A weighted average SOL mean scaled score was calculated for each school based on the total number of students tested in each content area. JLARC staff also calculated a weighted average score for each school division using the same methodology.
In addition, JLARC staff calculated SOL pass rates, or the percent of SOL tests passed by students, using the SOL scaled score data provided by the Virginia Department of Education (DOE). The SOL pass rate calculated for each school or division was the total number of students who passed divided by the total number of students tested. It should be noted that this pass rate is not the percent of students who passed all SOL tests. It was not possible to determine the total number of students who passed all SOL tests, because the SOL scaled score data was not provided to JLARC staff at the student-level. In order to determine the total number of students who passed all SOL tests, a student-level database with corresponding identification numbers would need to be available.
SOL Scaled ScoresSOL Scaled Scores
SOL scaled scores are established by the Department of EducationSOL scaled scores are established by the Department of Education(DOE) during the development of SOL tests each school year, and are(DOE) during the development of SOL tests each school year, and are based on a specific set of questions. A cut score or pass rate for each testbased on a specific set of questions. A cut score or pass rate for each testis determined based on the test questions. For example, DOE staff mayis determined based on the test questions. For example, DOE staff may determine that 27 or more correct questions out of 50 is a passing scoredetermine that 27 or more correct questions out of 50 is a passing scorefor a specific test. Given that 400 is considered the lowest passingfor a specific test. Given that 400 is considered the lowest passing scaled score, a test with 27 correct answers would then be assigned ascaled score, a test with 27 correct answers would then be assigned a scaled score of 400. A mean scaled score is the average of all scaledscaled score of 400. A mean scaled score is the average of all scaled scores for a school.scores for a school.
D-1
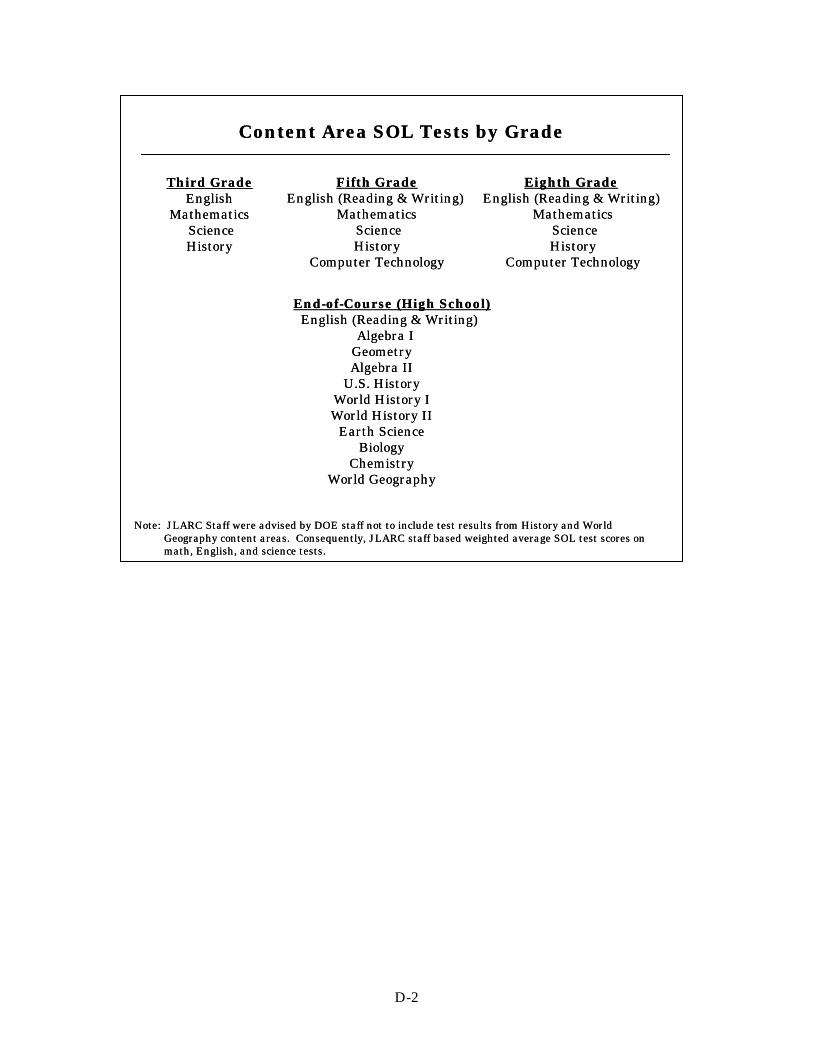
Content Area SOL Tests by GradeContent Area SOL Tests by Grade
Third GradeThird Grade Fifth GradeFifth Grade Eighth GradeEighth GradeEnglishEnglish English (Reading & Writing)English (Reading & Writing) English (Reading & WritingEnglish (Reading & Writing))
MathematicsMathematics MathematicsMathematics MathematicsMathematicsScienceScience ScienceScience ScienceScienceHistoryHistory HistoryHistory HistoryHistory
Computer TechnologyComputer Technology Computer TechnologyComputer Technology
End-of-Course (High School)End-of-Course (High School)English (Reading & Writing)English (Reading & Writing)
Algebra IAlgebra IGeometryGeometryAlgebra IIAlgebra II
U.S. HistoryU.S. HistoryWorld History IWorld History IWorld History IIWorld History II
Earth ScienceEarth ScienceBiologyBiology
ChemistryChemistryWorld GeographyWorld Geography
Note: JLARC Staff were advised by DOE staff not to include test results from History and WorldNote: JLARC Staff were advised by DOE staff not to include test results from History and WorldGeography content areas. Consequently, JLARC staff based weighted average SOL test scores onGeography content areas. Consequently, JLARC staff based weighted average SOL test scores onmath, English, and science tests.math, English, and science tests.
D-2
Appendix E:Virginia Student Performance on Norm-Referenced
and Criterion-Referenced Tests
For several decades, Virginia students have taken various standardized tests that are also taken by students in other parts of the country, permitting some comparisons of Virginia student performance with national results. Every year since at least 1974-75, Virginia has administered a nationally norm-referenced test and obtained statewide results. The specific tests have changed over time (the SRA tests, the Iowa Test of Basic Skills, TAP, and the Stanford 9, for example). The commonality of these tests, however, is that Virginia students are measured against the performance of a national test-taking sample group, where the average performance of the national group is assigned a 50 point score. Student performance below 50 indicates below average performance, while performance above 50 indicates above average performance.
In addition, over the years, a sample of students in various states and at certain grades have taken “NAEP” tests in some subjects. The NAEP (National Assessment of Educational Progress) test is criterion-referenced, meaning that student performance is measured against a given set of criteria reflecting what it is thought that students should learn. While long-term NAEP data at the national level are available for several decades, since 1990, NAEP state-level sample sizes were increased and state-level results for some tests are available. With the NAEP, data on national average student performance are available for comparison purposes. However, each State’s score is not adjusted in any way with regard to national performance. The remainder of this appendix describes the historical results of Virginia students in taking the norm-referenced tests and the NAEP tests.
Virginia Student Performance on Norm-Referenced Tests. The table on the next page of this appendix shows the average performance of Virginia students on the norm-referenced tests that have been administered since 1974-75. The table shows reading and math results at the earliest and latest grades at which the test was administered to Virginia students in each year. As can be seen in the table, over time the particular standardized tests employed changed. Also, since the fall of 1998, the last grade that is tested (on the Stanford 9) is the ninth grade, rather than the 11th grade as on previous tests. Conclusions using the data need to be drawn cautiously. However, certain patterns or tendencies in Virginia’s data appear to be worth noting.
First, over the past 20 years or so, the scores of Virginia’s students have exceeded the national average with great consistency. As can be seen in the table on the next page, since 1981-82, the score of Virginia’s students has exceeded the national average:
• in 19 of 21 years tested in grade 4 reading, • in 21 of 21 years tested in grade 4 math, • in 21 of 21 years tested in grade 9 or 11 reading, and • in 21 of 21 years tested in grade 9 or 11 math.
E-1
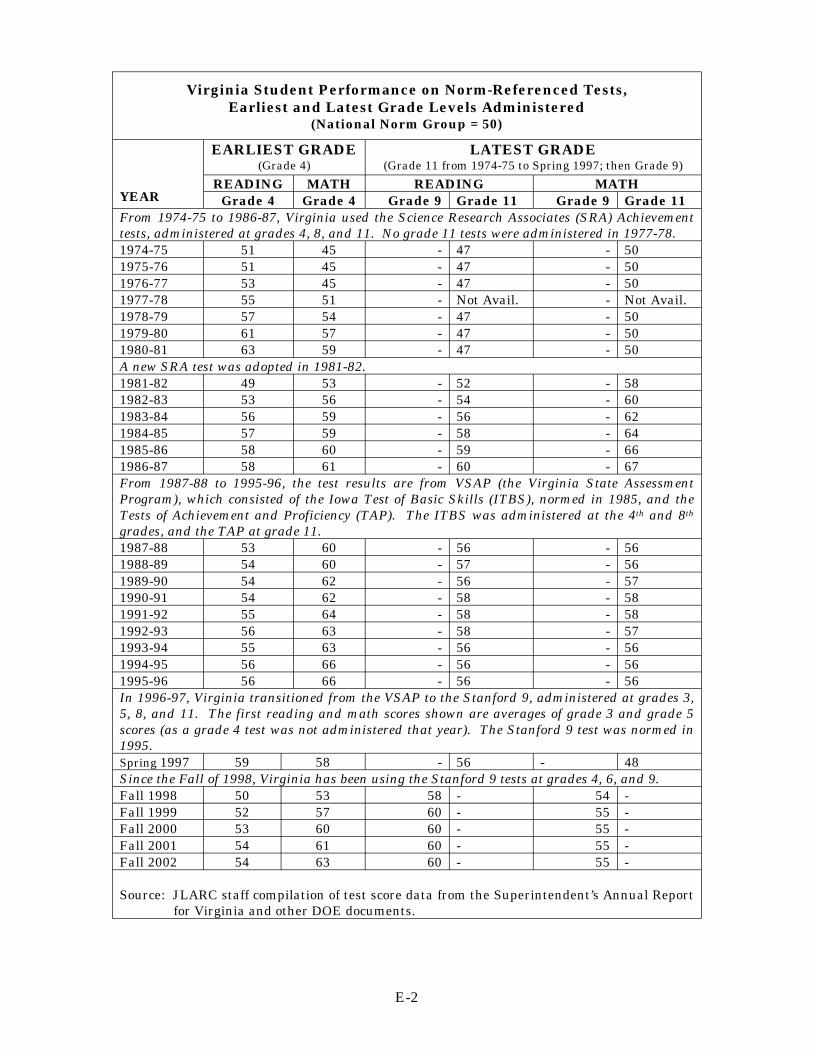
Virginia Student Performance on Norm-Referenced Tests, Earliest and Latest Grade Levels Administered
(National Norm Group = 50)
YEAR
EARLIEST GRADE (Grade 4)
LATEST GRADE (Grade 11 from 1974-75 to Spring 1997; then Grade 9)
READING MATH READING MATH Grade 4 Grade 4 Grade 9 Grade 11 Grade 9 Grade 11
From 1974-75 to 1986-87, Virginia used the Science Research Associates (SRA) Achievement tests, administered at grades 4, 8, and 11. No grade 11 tests were administered in 1977-78. 1974-75 51 45 - 47 - 50 1975-76 51 45 - 47 - 50 1976-77 53 45 - 47 - 50 1977-78 55 51 - Not Avail. - Not Avail. 1978-79 57 54 - 47 - 50 1979-80 61 57 - 47 - 50 1980-81 63 59 - 47 - 50 A new SRA test was adopted in 1981-82. 1981-82 49 53 - 52 - 58 1982-83 53 56 - 54 - 60 1983-84 56 59 - 56 - 62 1984-85 57 59 - 58 - 64 1985-86 58 60 - 59 - 66 1986-87 58 61 - 60 - 67 From 1987-88 to 1995-96, the test results are from VSAP (the Virginia State Assessment Program), which consisted of the Iowa Test of Basic Skills (ITBS), normed in 1985, and the Tests of Achievement and Proficiency (TAP). The ITBS was administered at the 4th and 8th
grades, and the TAP at grade 11. 1987-88 53 60 - 56 - 56 1988-89 54 60 - 57 - 56 1989-90 54 62 - 56 - 57 1990-91 54 62 - 58 - 58 1991-92 55 64 - 58 - 58 1992-93 56 63 - 58 - 57 1993-94 55 63 - 56 - 56 1994-95 56 66 - 56 - 56 1995-96 56 66 - 56 - 56 In 1996-97, Virginia transitioned from the VSAP to the Stanford 9, administered at grades 3, 5, 8, and 11. The first reading and math scores shown are averages of grade 3 and grade 5 scores (as a grade 4 test was not administered that year). The Stanford 9 test was normed in 1995. Spring 1997 59 58 - 56 - 48 Since the Fall of 1998, Virginia has been using the Stanford 9 tests at grades 4, 6, and 9. Fall 1998 50 53 58 - 54 -Fall 1999 52 57 60 - 55 -Fall 2000 53 60 60 - 55 -Fall 2001 54 61 60 - 55 -Fall 2002 54 63 60 - 55 -
Source: JLARC staff compilation of test score data from the Superintendent’s Annual Report for Virginia and other DOE documents.
E-2
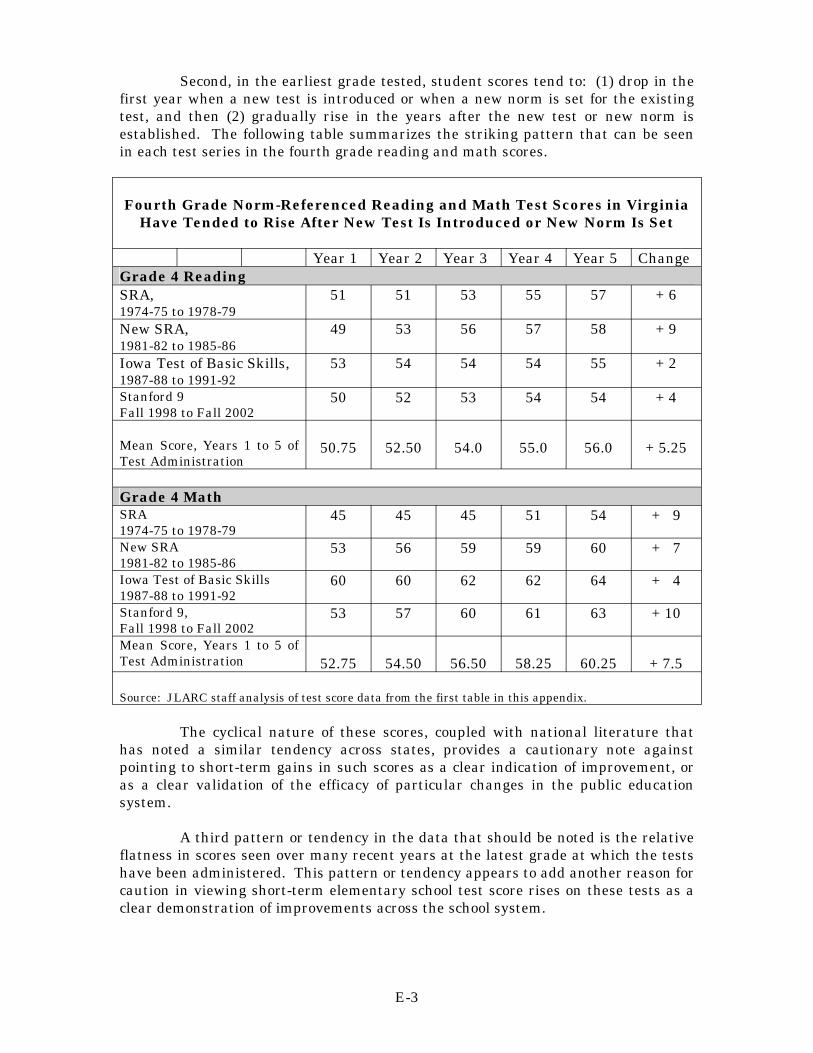
Second, in the earliest grade tested, student scores tend to: (1) drop in the first year when a new test is introduced or when a new norm is set for the existing test, and then (2) gradually rise in the years after the new test or new norm is established. The following table summarizes the striking pattern that can be seen in each test series in the fourth grade reading and math scores.
Fourth Grade Norm-Referenced Reading and Math Test Scores in Virginia Have Tended to Rise After New Test Is Introduced or New Norm Is Set
Year 1 Year 2 Year 3 Year 4 Year 5 Change Grade 4 Reading SRA, 1974-75 to 1978-79
51 51 53 55 57 + 6
New SRA, 1981-82 to 1985-86
49 53 56 57 58 + 9
Iowa Test of Basic Skills, 1987-88 to 1991-92
53 54 54 54 55 + 2
Stanford 9 Fall 1998 to Fall 2002
50 52 53 54 54 + 4
Mean Score, Years 1 to 5 of Test Administration
50.75 52.50 54.0 55.0 56.0 + 5.25
Grade 4 Math SRA 1974-75 to 1978-79
45 45 45 51 54 + 9
New SRA 1981-82 to 1985-86
53 56 59 59 60 + 7
Iowa Test of Basic Skills 1987-88 to 1991-92
60 60 62 62 64 + 4
Stanford 9, Fall 1998 to Fall 2002
53 57 60 61 63 + 10
Mean Score, Years 1 to 5 of Test Administration 52.75 54.50 56.50 58.25 60.25 + 7.5
Source: JLARC staff analysis of test score data from the first table in this appendix.
The cyclical nature of these scores, coupled with national literature that has noted a similar tendency across states, provides a cautionary note against pointing to short-term gains in such scores as a clear indication of improvement, or as a clear validation of the efficacy of particular changes in the public education system.
A third pattern or tendency in the data that should be noted is the relative flatness in scores seen over many recent years at the latest grade at which the tests have been administered. This pattern or tendency appears to add another reason for caution in viewing short-term elementary school test score rises on these tests as a clear demonstration of improvements across the school system.
E-3
More specifically, as seen earlier, in the first table of this appendix:
• reading scores have been within a four-point range (56 to 60) over the last 19 years, and have been at “60” the last four years in a row, and
• math scores have also been within a four-point range (54 to 58) in 14 of the last 15 years, and have been at “55” the last four years in a row. (The one year in which the Virginia math score was outside of this range was a test transition year in 1997).
At the 2003 General Assembly, State funding for norm-based testing was eliminated. School divisions may but are not required to administer such a test. It is not clear whether State and local actions will lead to a temporary discontinuation of widespread administration of the test, or whether State support for norm-based testing may be seen at a later date.
Virginia Student Performance on Criterion-Referenced Tests (the NAEP). Another independent indicator of Virginia’s standing in student performance is the NAEP, which is administered to a sample of students in the various states. (NAEP results are reported on a national and state basis, but due to some of the limitations of the sample approach, including the fact that many divisions and schools are not included, the results of the test are not available at the school division or school level). Unlike the Stanford 9 and the other tests that have been used in the Virginia State Assessment program, the NAEP is a criterion-referenced rather than norm-referenced test, meaning that students are measured against a set of criteria to be learned, rather than compared to a national norm group where a “50” score is equal to the national norm. However, it is possible to see how each state compares to the national average score, and to see how trends in the State data may compare to trends in the national data
The NAEP has somewhat limited use for the purpose addressed by this appendix -- a review of historical trends in Virginia’s student performance. State-level test results for Virginia are not available prior to 1990 for any subject, and there is a relatively limited set of data points for the 1990s (see table on the next page for NAEP test score data for reading, writing, math and science). In addition, before 1998, accommodations were not made in the test for certain students; these data are therefore reported by the National Center for Education Statistics (NCES) with the caveat that “comparative performance results may be affected by changes in exclusion rates for students with disabilities and limited-English-proficient students in the NAEP samples.” Further, only Virginia’s fourth grade and eighth grade results are available. There are no results available to indicate the performance of Virginia’s students at the secondary school level, when students are closest to leaving the school system.
Although the data are limited, some findings from the NAEP data emerge. Both the norm-referenced test scores discussed earlier and the NAEP test scores indicate that Virginia’s students have tended to perform above the national average.
E-4
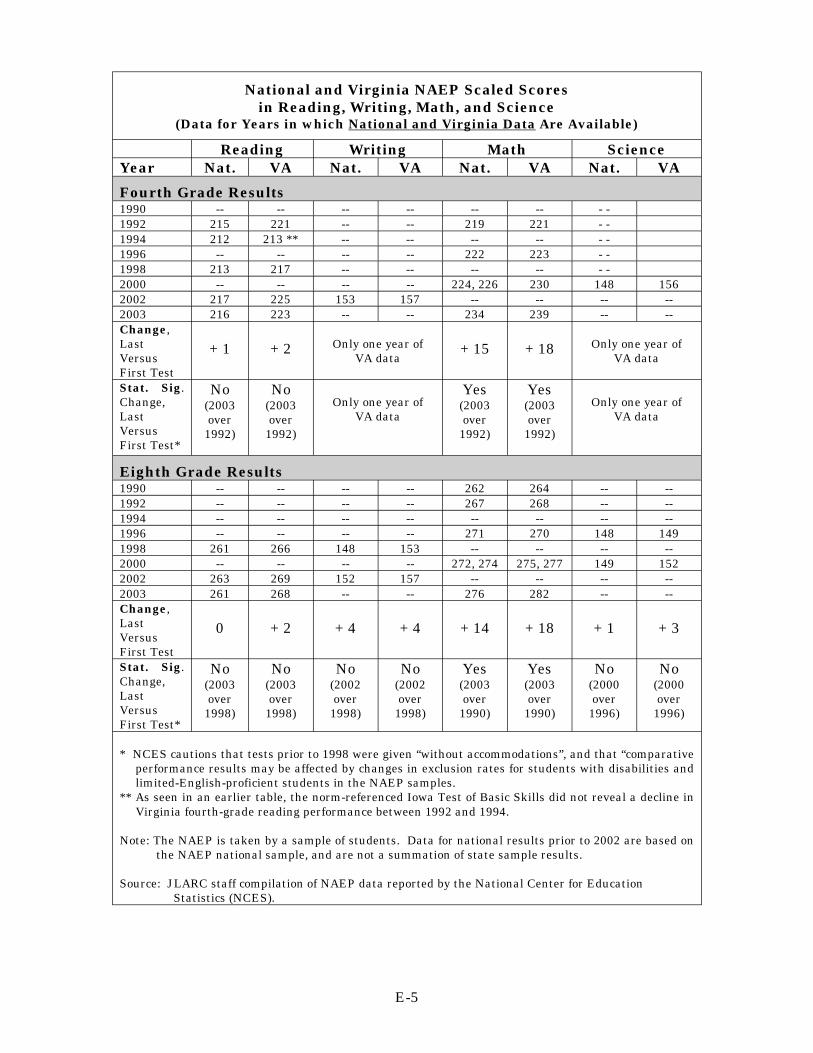
-- -- -- -- -- -- -- -- -- -- -- --
-- -- -- -- -- -- -- --
-- -- -- -- -- -- -- --
-- -- -- --
-- -- -- -- -- -- -- -- -- -- -- -- -- -- -- -- -- -- -- -- -- -- -- --
-- -- -- -- -- -- -- --
-- -- -- -- -- -- -- --
- - - - - - - - - -
National and Virginia NAEP Scaled Scores in Reading, Writing, Math, and Science
(Data for Years in which National and Virginia Data Are Available)
Reading Writing Math Science Year Nat. VA Nat. VA Nat. VA Nat. VA
Fourth Grade Results 1990 1992 215 221 219 221 1994 212 213 ** 1996 222 223 1998 213 217 2000 224, 226 230 148 156 2002 217 225 153 157 2003 216 223 234 239 Change, Last Versus First Test
+ 1 + 2 Only one year of VA data
+ 15 + 18 Only one year of VA data
Stat. Sig. Change, Last Versus First Test*
No (2003 over
1992)
No (2003 over
1992)
Only one year of VA data
Yes (2003 over
1992)
Yes (2003 over
1992)
Only one year of VA data
Eighth Grade Results 1990 262 264 1992 267 268 1994 1996 271 270 148 149 1998 261 266 148 153 2000 272, 274 275, 277 149 152 2002 263 269 152 157 2003 261 268 276 282 Change, Last Versus First Test
0 + 2 + 4 + 4 + 14 + 18 + 1 + 3
Stat. Sig. Change, Last Versus First Test*
No (2003 over
1998)
No (2003 over
1998)
No (2002 over
1998)
No (2002 over
1998)
Yes (2003 over
1990)
Yes (2003 over
1990)
No (2000 over
1996)
No (2000 over
1996)
* NCES cautions that tests prior to 1998 were given “without accommodations”, and that “comparative performance results may be affected by changes in exclusion rates for students with disabilities and limited-English-proficient students in the NAEP samples.
** As seen in an earlier table, the norm-referenced Iowa Test of Basic Skills did not reveal a decline in Virginia fourth-grade reading performance between 1992 and 1994.
Note: The NAEP is taken by a sample of students. Data for national results prior to 2002 are based on the NAEP national sample, and are not a summation of state sample results.
Source: JLARC staff compilation of NAEP data reported by the National Center for Education Statistics (NCES).
E-5
That is, Virginia’s scores on the NAEP have mostly been above the national average scores for the years during which Virginia data are available. Thus, performances by Virginia students that are above the national average appear to be the norm, and are not unusual.
In addition, comparisons of Virginia’s most recent scores with the earliest scores available from NAEP indicate a statistically significant increase (according to NCES) in mathematics scores. However, from the earliest to the most recent score, there is not a statistically significant increase in reading, writing, and science.
With regard to mathematics, recent NAEP results for Virginia and the nation for fourth and eighth grade mathematics appear to be encouraging, in terms of increases in scaled scores. Specifically, Virginia’s scaled scores in mathematics for 2003 at both grade levels are 18 points higher than in the first year where data are available, and this is statistically significant. The national average is also 15 and 14 points higher on the fourth and eighth grade math tests, which is also a statistically significant advance, according to NCES.
There is some concern that the upward trend in results that is seen in Virginia’s eighth grade math NAEP results is not also evident in the Stanford 9 results from the 11th and 9th grade levels. As indicated earlier in this appendix, Stanford 9 results in Virginia at the 11th and 9th grade levels in math as well as reading have been relatively flat for many years.
Also, according to NCES, Virginia’s 2003 fourth and eighth grade reading scores are not statistically different from the first year in which these tests were given, the 2002 8th grade writing score is not statistically different from the 1998 score, and the 2000 8th grade science score is not statistically different from the 1996 science score.
Conclusions. The various limitations and caveats regarding the available test data, and the mixed nature of the findings that appear to stem from the data, means that caution should be exercised in reaching conclusions about Virginia’s student performance. A review of the long-term trends in Virginia’s norm-referenced tests does not suggest that Virginia student performance relative to national norm groups has changed greatly over time. Since 1981-82, Virginia’s scores relative to a national norm group have mostly been above average, starting from the year that each new test was administered, and have fluctuated within a generally similar range over many recent years.
The criterion-referenced NAEP results indicate that students in Virginia are scoring more highly on given criteria in 4th and 8th grade mathematics in 2000, and even more so in 2003, than used to be the case. Increases in math scores are also seen in the national average data, albeit to a somewhat lesser extent. State-level NAEP scores to date have not suggested a significant change in Virginia student performance in other subject areas such as reading, writing, and science, as compared to the results from the first year for which Virginia NAEP test data are available in these subjects. NAEP test results do not address Virginia student performance in any of the upper grades (beyond grade 8).
E-6
Assessing the impact of the SOLs on student performance has been an area of continuing interest on the part of the State Board of Education. The fact that the NAEP will be administered in the future on a regular two-year cycle may be helpful in the future for assessing changes in student performance in Virginia and the ongoing impact of the SOLs, as compared to changes in student performance nationally and in other states. It may also be useful to obtain data in the future that measures the performance of Virginia students in the upper-level grades relative to nationally-based norms and / or criteria.
E-7

E-8
Appendix F:Statistical Methodology and Results
This appendix provides a more technical explanation of the quantitative analyses conducted to identify the factors most strongly associated with SOL test scores. Specifically, this section describes the statistical techniques utilized. Additionally, it provides an explanation for the segment of data emphasized in the main report, and presents a comparison of regression results across all segments of data. Finally, this appendix offers greater details on the need to explore factors underlying the main variables identified in regression analysis, and the process by which these underlying factors were identified.
Statistical Methods Employed
The two primary statistical techniques used in this study include bivariate correlation analysis and multivariate regression analysis. The exhibit presented on the following page provides a definition of these two methods. In addition to ordinary least squares (OLS) regression (these results are provided in the report), a more sophisticated multivariate analysis method called hierarchical linear modeling (HLM) was used. Hierarchical linear modeling explicitly takes into account the “nesting” of schools within divisions, and has been applied to predict students’ SOL test scores according to educational literature. While the quantitative results generated by HLM were slightly different from OLS regression, the two approaches implied the same conclusions regarding which variables explain more of the variation in SOL test scores. Consequently, the decision was made to focus on the more manageable OLS method.
Report Findings Based Primarily on 2001-2002 Division-Level SOL Test Scores
Correlation and regression analysis results described in Chapter III focus on division-level test scores for the most recent school year, although the trends discussed are applicable at the school level and for all years of data analyzed. While the magnitude of the associations between poverty, race, educational attainment, and SOL test scores of conventional schools varies somewhat across multiple years of data (1999-2000, 2000-2001, 2001-2002) and between the division and school levels, they lead to the same conclusion that these three factors are consistently the strongest indicators of school performance (as shown in the table on page F-3). Consequently, a choice had to be made on which analysis would best and most easily portray the JLARC staff findings.
The decision was made to use 2001-2002 data to capture the most current trends in the academic performance of Virginia schools. The variation in SOL test scores explained by regression analysis as well as the standardized estimates for poverty, race, and educational attainment are relatively stable over the years of data examined. Across all years, poverty shows the strongest association with SOL test scores, as measured by its standardized estimate, which changes only slightly from
F-1
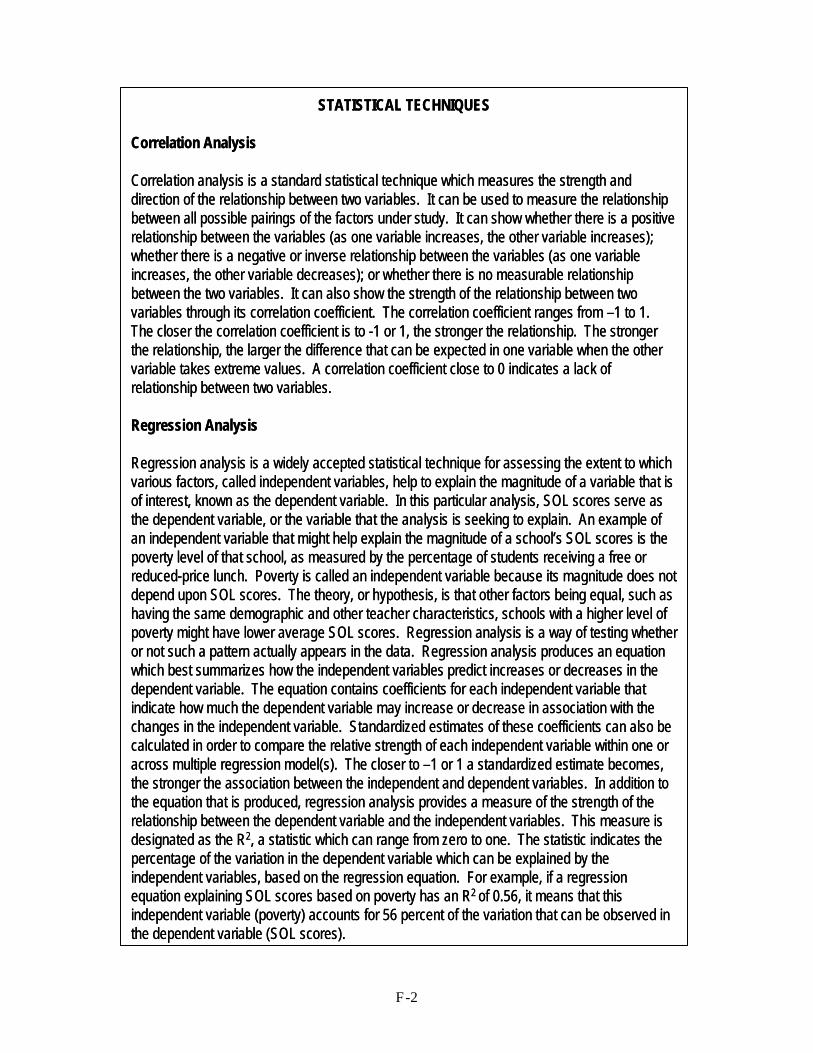
STATISTICAL TECHNIQUESSTATISTICAL TECHNIQUES
Correlation AnalysisCorrelation Analysis
Correlation analysis is a standard statistical technique which measures the strength andCorrelation analysis is a standard statistical technique which measures the strength and direction of the relationship between two variables. It can be used to measure the relationshipdirection of the relationship between two variables. It can be used to measure the relationshipbetween all possible pairings of the factors under study. It can show whether there is a positivebetween all possible pairings of the factors under study. It can show whether there is a positiverelationship between the variables (as one variable increases, the other variable increases);relationship between the variables (as one variable increases, the other variable increases);whether there is a negative or inverse relationship between the variables (as one variablewhether there is a negative or inverse relationship between the variables (as one variable increases, the other variable decreases); or whether there is no measurable relationshipincreases, the other variable decreases); or whether there is no measurable relationship between the two variables. It can also show the strength of the relationship between twobetween the two variables. It can also show the strength of the relationship between two variables through its correlation coefficient. The correlation coefficient ranges from –1 to 1.variables through its correlation coefficient. The correlation coefficient ranges from –1 to 1. The closer the correlation coefficient is to -1 or 1, the stronger the relationship. The strongerThe closer the correlation coefficient is to -1 or 1, the stronger the relationship. The stronger the relationship, the larger the difference that can be expected in one variable when the otherthe relationship, the larger the difference that can be expected in one variable when the other variable takes extreme values. A correlation coefficient close to 0 indicates a lack ofvariable takes extreme values. A correlation coefficient close to 0 indicates a lack ofrelationship between two variables.relationship between two variables.
Regression AnalysisRegression Analysis
Regression analysis is a widely accepted statistical technique for assessing the extent to whichRegression analysis is a widely accepted statistical technique for assessing the extent to which various factors, called independent variables, help to explain the magnitude of a variable that isvarious factors, called independent variables, help to explain the magnitude of a variable that isof interest, known as the dependent variable. In this particular analysis, SOL scores serve asof interest, known as the dependent variable. In this particular analysis, SOL scores serve as the dependent variable, or the variable that the analysis is seeking to explain. An example ofthe dependent variable, or the variable that the analysis is seeking to explain. An example ofan independent variable that might help explain the magnitude of a school’s SOL scores is thean independent variable that might help explain the magnitude of a school’s SOL scores is thepoverty level of that school, as measured by the percentage of students receiving a free orpoverty level of that school, as measured by the percentage of students receiving a free or reduced-price lunch. Poverty is called an independent variable because its magnitude does notreduced-price lunch. Poverty is called an independent variable because its magnitude does not depend upon SOL scores. The theory, or hypothesis, is that other factors being equal, such asdepend upon SOL scores. The theory, or hypothesis, is that other factors being equal, such as having the same demographic and other teacher characteristics, schools with a higher level ofhaving the same demographic and other teacher characteristics, schools with a higher level ofpoverty might have lower average SOL scores. Regression analysis is a way of testing whetherpoverty might have lower average SOL scores. Regression analysis is a way of testing whether or not such a pattern actually appears in the data. Regression analysis produces an equationor not such a pattern actually appears in the data. Regression analysis produces an equation which best summarizes how the independent variables predict increases or decreases in thewhich best summarizes how the independent variables predict increases or decreases in the dependent variable. The equation contains coefficients for each independent variable thatdependent variable. The equation contains coefficients for each independent variable that indicate how much the dependent variable may increase or decrease in association with theindicate how much the dependent variable may increase or decrease in association with the changes in the independent variable. Standardized estimates of these coefficients can also bechanges in the independent variable. Standardized estimates of these coefficients can also be calculated in order to compare the relative strength of each independent variable within one orcalculated in order to compare the relative strength of each independent variable within one or across multiple regression model(s). The closer to –1 or 1 a standardized estimate becomes,across multiple regression model(s). The closer to –1 or 1 a standardized estimate becomes, the stronger the association between the independent and dependent variables. In addition tothe stronger the association between the independent and dependent variables. In addition tothe equation that is produced, regression analysis provides a measure of the strength of thethe equation that is produced, regression analysis provides a measure of the strength of the relationship between the dependent variable and the independent variables. This measure isrelationship between the dependent variable and the independent variables. This measure is designated as the R2, a statistic which can range from zero to one. The statistic indicates thedesignated as the R2, a statistic which can range from zero to one. The statistic indicates thepercentage of the variation in the dependent variable which can be explained by thepercentage of the variation in the dependent variable which can be explained by the independent variables, based on the regression equation. For example, if a regressionindependent variables, based on the regression equation. For example, if a regression equation explaining SOL scores based on poverty has an R2 of 0.56, it means that thisequation explaining SOL scores based on poverty has an R2 of 0.56, it means that thisindependent variable (poverty) accounts for 56 percent of the variation that can be observed inindependent variable (poverty) accounts for 56 percent of the variation that can be observed in the dependent variable (SOL scores).the dependent variable (SOL scores).
F-2
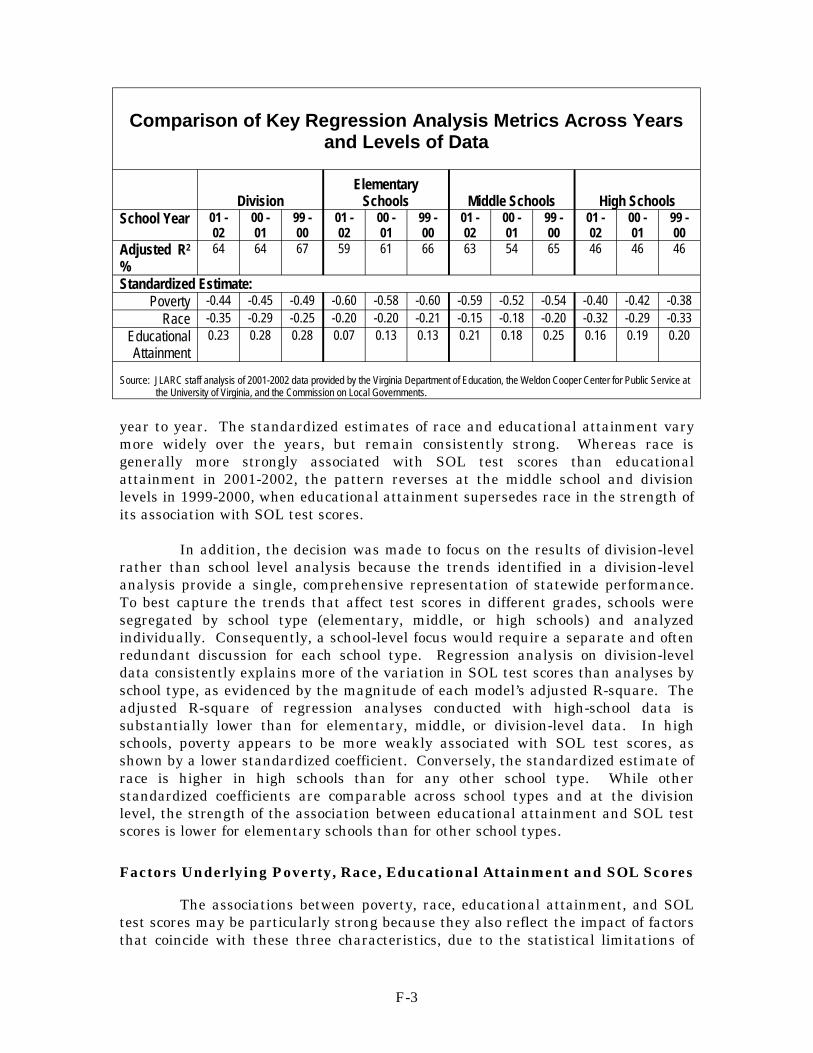
Comparison of Key Regression Analysis Metrics Across Years and Levels of Data
Division Elementary
Schools Middle Schools High Schools School Year 01 -
02 00 01
99 00
01 02
00 01
99 00
01 02
00 01
99 00
01 02
00 01
99 00
Adjusted R2
% 64 64 67 59 61 66 63 54 65 46 46 46
Standardized Estimate: Poverty -0.44 -0.45 -0.49 -0.60 -0.58 -0.60 -0.59 -0.52 -0.54 -0.40 -0.42 -0.38
Race -0.35 -0.29 -0.25 -0.20 -0.20 -0.21 -0.15 -0.18 -0.20 -0.32 -0.29 -0.33 Educational Attainment
0.23 0.28 0.28 0.07 0.13 0.13 0.21 0.18 0.25 0.16 0.19 0.20
Source: JLARC staff analysis of 2001-2002 data provided by the Virginia Department of Education, the Weldon Cooper Center for Public Service at the University of Virginia, and the Commission on Local Governments.
year to year. The standardized estimates of race and educational attainment vary more widely over the years, but remain consistently strong. Whereas race is generally more strongly associated with SOL test scores than educational attainment in 2001-2002, the pattern reverses at the middle school and division levels in 1999-2000, when educational attainment supersedes race in the strength of its association with SOL test scores.
In addition, the decision was made to focus on the results of division-level rather than school level analysis because the trends identified in a division-level analysis provide a single, comprehensive representation of statewide performance. To best capture the trends that affect test scores in different grades, schools were segregated by school type (elementary, middle, or high schools) and analyzed individually. Consequently, a school-level focus would require a separate and often redundant discussion for each school type. Regression analysis on division-level data consistently explains more of the variation in SOL test scores than analyses by school type, as evidenced by the magnitude of each model’s adjusted R-square. The adjusted R-square of regression analyses conducted with high-school data is substantially lower than for elementary, middle, or division-level data. In high schools, poverty appears to be more weakly associated with SOL test scores, as shown by a lower standardized coefficient. Conversely, the standardized estimate of race is higher in high schools than for any other school type. While other standardized coefficients are comparable across school types and at the division level, the strength of the association between educational attainment and SOL test scores is lower for elementary schools than for other school types.
Factors Underlying Poverty, Race, Educational Attainment and SOL Scores
The associations between poverty, race, educational attainment, and SOL test scores may be particularly strong because they also reflect the impact of factors that coincide with these three characteristics, due to the statistical limitations of
F-3
regression analysis. The relationship between these underlying factors and SOL test scores may help to explain why poverty, race, and educational attainment are such strong performance indicators. These underlying factors help to provide a more complete explanation of the effects that poverty, race, and educational attainment may exert on SOL test scores.
The effectiveness of regression analysis is limited when several variables are correlated with one another. Most of the variables examined in this study are not only associated with SOL test scores, but they are also strongly correlated with one another. For instance, race and the percentage of inexperienced teachers are both highly associated with SOL test scores and with each other. In many cases, using more than one related variable in a regression model produces unreliable results because the statistical model cannot meaningfully represent the effect of all the highly related variables at the same time. In order to effectively use regression analysis when this issue exists, only one of the correlated variables can be used in the regression model. In this analysis, the variables selected were those displaying the strongest association with SOL test scores: the percentage of students on free or reduced-price lunch, the percentage of black students, and the proportion of adults in the community who have a college degree.
A problem stemming from this approach is that the association between the three variables selected for the regression and SOL test scores includes the effect of other factors not included in the regression model. In this analysis, the percentage of students on free or reduced-price lunch, the proportion of black pupils, and the percentage of college-educated adults in the community are used to represent poverty, race, and educational attainment, as well as all the factors that coincide with these three variables. While these factors are not part of the regression analysis presented in Chapter III, their strong association with poverty, race, and educational attainment suggests that these other factors account for some of the association of these three regression variables with performance. However, it is not possible to separate out the effect that these coinciding factors exert on SOL test scores from the association directly attributable to poverty, race, and educational attainment.
A final analytical step is necessary to identify the factors that coincide with poverty, race, and educational attainment, and are also related to SOL test scores. Ten factors were found to highly coincide with these three characteristics and were also strongly correlated with SOL test scores. As a result of this strong correlation, the presence of these factors is substantially different between areas with a high concentration of poverty, race, or low educational attainment, compared to other areas. Because the goal is to better understand why poverty, race, and educational attainment so strongly predict SOL test scores, only the disparities in variables that are also strongly correlated with SOL test scores should be explored. The figure on the following page shows the ten variables that have the strongest correlation with poverty, race and educational attainment as well as with SOL test scores.
F-4
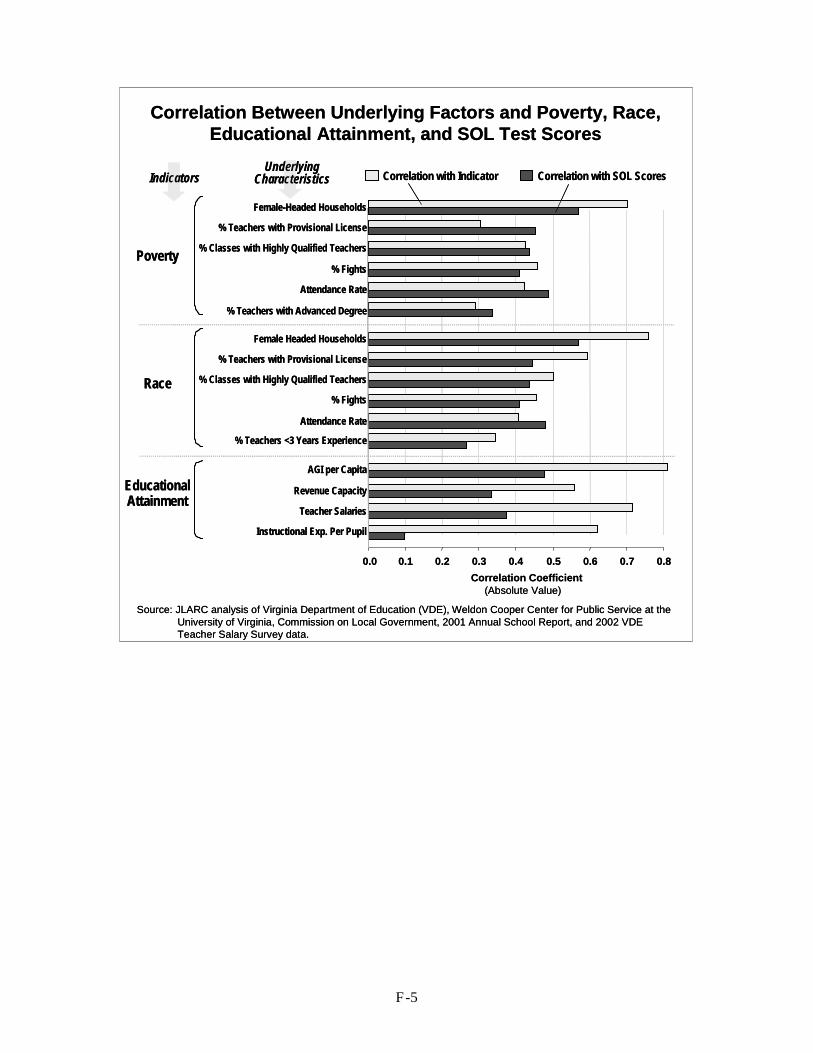
F-5
0.0 0.1 0.2 0.3 0.4 0.5 0.6 0.7 0.8
Instructional Exp. Per Pupil
Teacher Salaries
Revenue Capacity
AGI per Capita
% Teachers with Advanced Degree
Attendance Rate
% Fights
% Classes with Highly Qualified Teachers
% Teachers with Provisional License
Female Headed Households
% Teachers <3 Years Experience
Attendance Rate
% Fights
% Classes with Highly Qualified Teachers
% Teachers with Provisional License
Female-Headed Households
Correlation with SOL ScoresCorrelation with Indicator
Correlation Between Underlying Factors and Poverty, Race, Educational Attainment, and SOL Test Scores
Poverty
Race
EducationalAttainment
Correlation Coefficient (Absolute Value)
UnderlyingCharacteristicsIndicators
Source: JLARC analysis of Virginia Department of Education (VDE), Weldon Cooper Center for Public Service at the University of Virginia, Commission on Local Government, 2001 Annual School Report, and 2002 VDE Teacher Salary Survey data.

F-6
Appendix G:Profiles of the Schools with the
Highest and Lowest SOL Test Scores
G-1
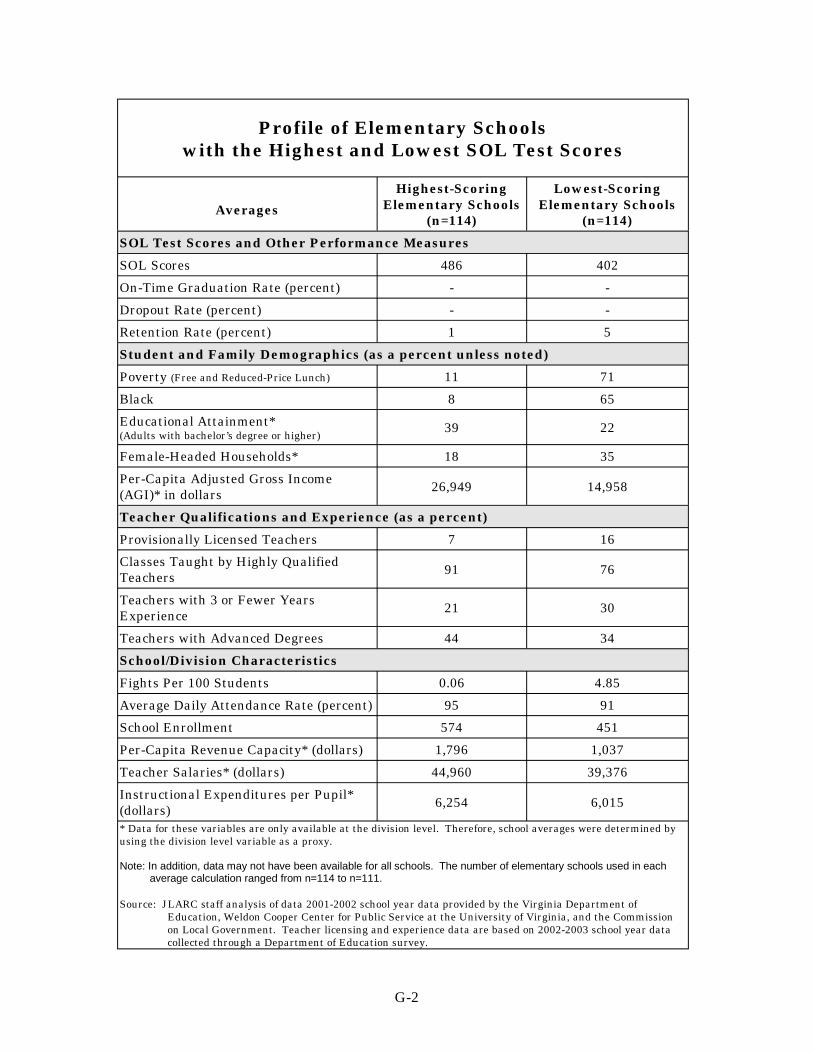
Profile of Elementary Schools with the Highest and Lowest SOL Test Scores
Averages
Highest-Scoring Elementary Schools
(n=114)
Lowest-Scoring Elementary Schools
(n=114)
SOL Test Scores and Other Performance Measures
SOL Scores 486 402
On-Time Graduation Rate (percent) - -
Dropout Rate (percent) - -
Retention Rate (percent) 1 5
Student and Family Demographics (as a percent unless noted)
Poverty (Free and Reduced-Price Lunch) 11 71
Black 8 65
Educational Attainment* (Adults with bachelor’s degree or higher)
39 22
Female-Headed Households* 18 35
Per-Capita Adjusted Gross Income (AGI)* in dollars 26,949 14,958
Teacher Qualifications and Experience (as a percent)
Provisionally Licensed Teachers 7 16
Classes Taught by Highly Qualified Teachers 91 76
Teachers with 3 or Fewer Years Experience 21 30
Teachers with Advanced Degrees 44 34
School/Division Characteristics
Fights Per 100 Students 0.06 4.85
Average Daily Attendance Rate (percent) 95 91
School Enrollment 574 451
Per-Capita Revenue Capacity* (dollars) 1,796 1,037
Teacher Salaries* (dollars) 44,960 39,376
Instructional Expenditures per Pupil* (dollars) 6,254 6,015
* Data for these variables are only available at the division level. Therefore, school averages were determined by using the division level variable as a proxy.
Note: In addition, data may not have been available for all schools. The number of elementary schools used in each average calculation ranged from n=114 to n=111.
Source: JLARC staff analysis of data 2001-2002 school year data provided by the Virginia Department of Education, Weldon Cooper Center for Public Service at the University of Virginia, and the Commission on Local Government. Teacher licensing and experience data are based on 2002-2003 school year data collected through a Department of Education survey.
G-2
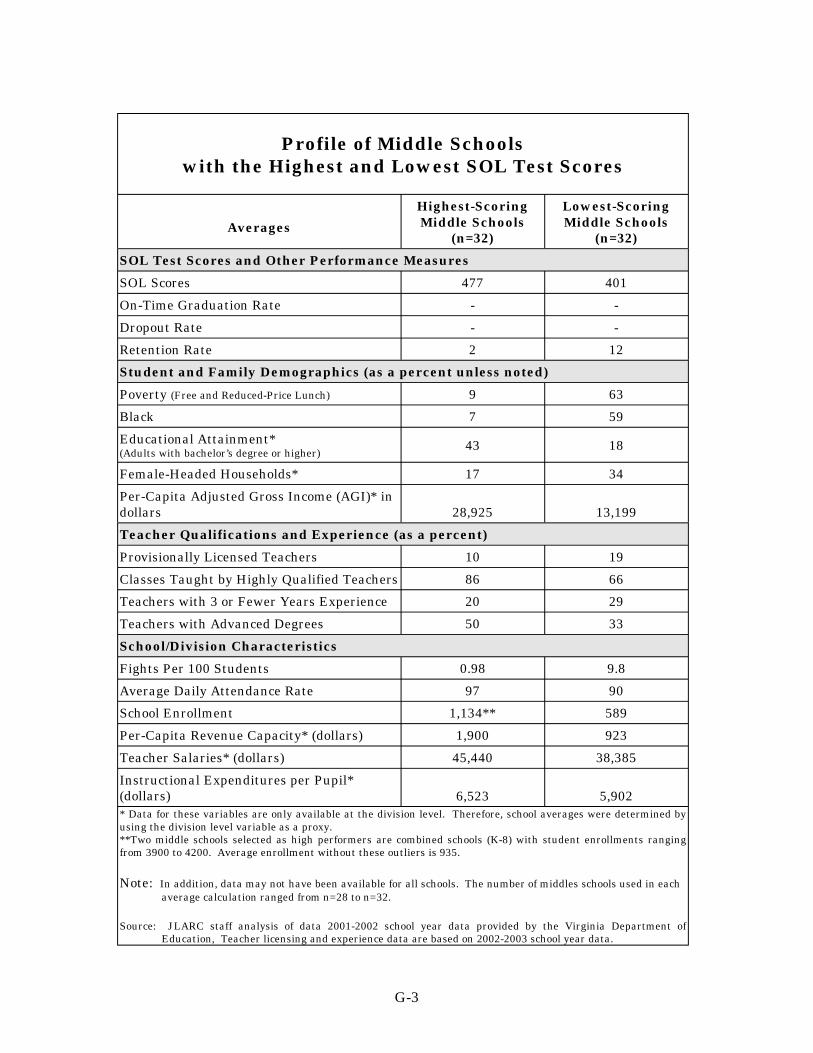
Profile of Middle Schools with the Highest and Lowest SOL Test Scores
Averages
Highest-Scoring Middle Schools
(n=32)
Lowest-Scoring Middle Schools
(n=32)
SOL Test Scores and Other Performance Measures
SOL Scores 477 401
On-Time Graduation Rate - -
Dropout Rate - -
Retention Rate 2 12
Student and Family Demographics (as a percent unless noted)
Poverty (Free and Reduced-Price Lunch) 9 63
Black 7 59
Educational Attainment* (Adults with bachelor’s degree or higher)
43 18
Female-Headed Households* 17 34
Per-Capita Adjusted Gross Income (AGI)* in dollars 28,925 13,199
Teacher Qualifications and Experience (as a percent)
Provisionally Licensed Teachers 10 19
Classes Taught by Highly Qualified Teachers 86 66
Teachers with 3 or Fewer Years Experience 20 29
Teachers with Advanced Degrees 50 33
School/Division Characteristics
Fights Per 100 Students 0.98 9.8
Average Daily Attendance Rate 97 90
School Enrollment 1,134** 589
Per-Capita Revenue Capacity* (dollars) 1,900 923
Teacher Salaries* (dollars) 45,440 38,385
Instructional Expenditures per Pupil* (dollars) 6,523 5,902 * Data for these variables are only available at the division level. Therefore, school averages were determined by using the division level variable as a proxy. **Two middle schools selected as high performers are combined schools (K-8) with student enrollments ranging from 3900 to 4200. Average enrollment without these outliers is 935.
Note: In addition, data may not have been available for all schools. The number of middles schools used in each average calculation ranged from n=28 to n=32.
Source: JLARC staff analysis of data 2001-2002 school year data provided by the Virginia Department of Education, Teacher licensing and experience data are based on 2002-2003 school year data.
G-3
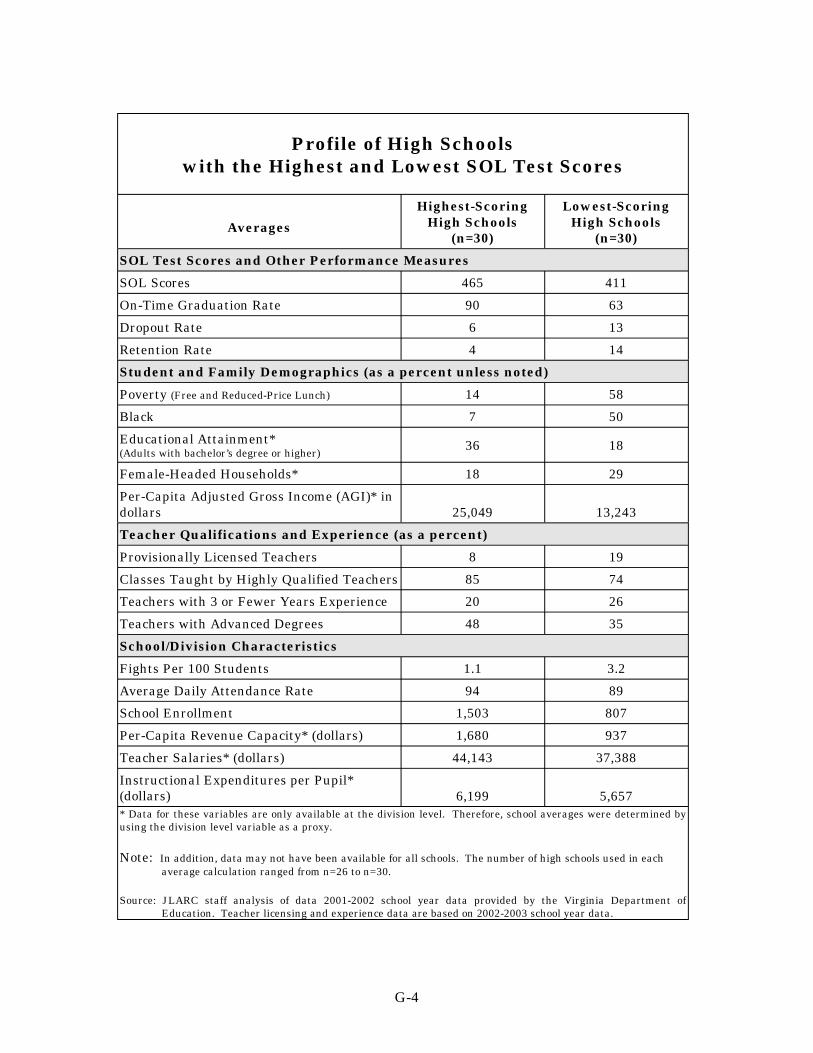
Profile of High Schools with the Highest and Lowest SOL Test Scores
Averages
Highest-Scoring High Schools
(n=30)
Lowest-Scoring High Schools
(n=30)
SOL Test Scores and Other Performance Measures
SOL Scores 465 411
On-Time Graduation Rate 90 63
Dropout Rate 6 13
Retention Rate 4 14
Student and Family Demographics (as a percent unless noted)
Poverty (Free and Reduced-Price Lunch) 14 58
Black 7 50
Educational Attainment* (Adults with bachelor’s degree or higher)
36 18
Female-Headed Households* 18 29
Per-Capita Adjusted Gross Income (AGI)* in dollars 25,049 13,243
Teacher Qualifications and Experience (as a percent)
Provisionally Licensed Teachers 8 19
Classes Taught by Highly Qualified Teachers 85 74
Teachers with 3 or Fewer Years Experience 20 26
Teachers with Advanced Degrees 48 35
School/Division Characteristics
Fights Per 100 Students 1.1 3.2
Average Daily Attendance Rate 94 89
School Enrollment 1,503 807
Per-Capita Revenue Capacity* (dollars) 1,680 937
Teacher Salaries* (dollars) 44,143 37,388
Instructional Expenditures per Pupil* (dollars) 6,199 5,657 * Data for these variables are only available at the division level. Therefore, school averages were determined by using the division level variable as a proxy.
Note: In addition, data may not have been available for all schools. The number of high schools used in each average calculation ranged from n=26 to n=30.
Source: JLARC staff analysis of data 2001-2002 school year data provided by the Virginia Department of Education. Teacher licensing and experience data are based on 2002-2003 school year data.
G-4
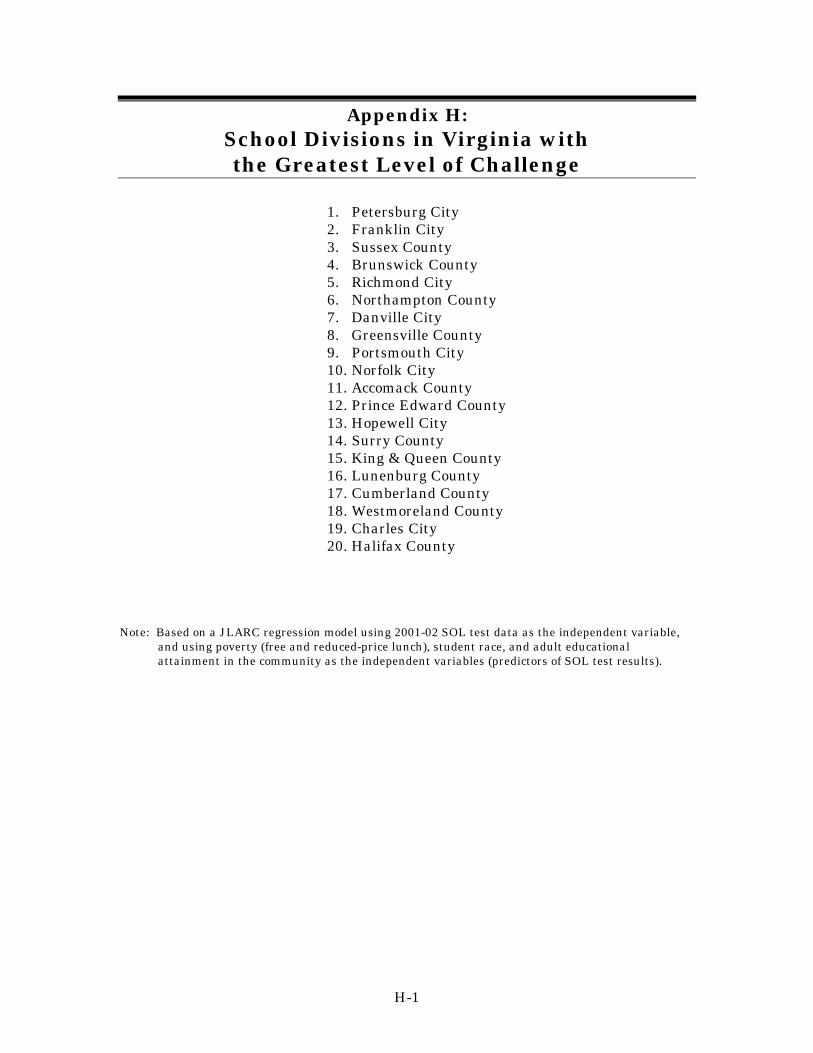
Appendix H: School Divisions in Virginia with the Greatest Level of Challenge
1. Petersburg City 2. Franklin City 3. Sussex County 4. Brunswick County 5. Richmond City 6. Northampton County 7. Danville City 8. Greensville County 9. Portsmouth City 10. Norfolk City 11. Accomack County 12. Prince Edward County 13. Hopewell City 14. Surry County 15. King & Queen County 16. Lunenburg County 17. Cumberland County 18. Westmoreland County 19. Charles City 20. Halifax County
Note: Based on a JLARC regression model using 2001-02 SOL test data as the independent variable, and using poverty (free and reduced-price lunch), student race, and adult educational attainment in the community as the independent variables (predictors of SOL test results).
H-1
JLARC Staff
DIRECTOR: PHILIP A. LEONE DIVISION I CHIEF: GLEN S. TITTERMARY DEPUTY DIRECTOR: R. KIRK JONAS DIVISION II CHIEF: ROBERT B. ROTZ
SECTION MANAGERS: PATRICIA S. BISHOP, FISCAL & ADMINISTRATIVE SERVICES GREGORY J. REST, RESEARCH METHODS JOHN W. LONG, PUBLICATIONS & GRAPHICS WALTER L. SMILEY, FISCAL ANALYSIS
PROJECT TEAM LEADERS: ARIS W. BEARSE ERIC H. MESSICK LINDA B. FORD KIMBERLY A. SARTE HAROLD E. GREER, III
PROJECT TEAM STAFF: WENDY N. BROWN ASHLEY S. COLVIN GERALD A. CRAVER EILEEN T. FLECK MICHELLE HEBERT-GIFFEN ELLEN M. JACKSON
NATHALIE MOLLIET-RIBET JASON W. POWELL TRACEY R. SMITH LAURA C. WHITELEY CHRISTINE D. WOLFE
ADMINISTRATIVE AND RESEARCH SUPPORT STAFF: JOAN M. IRBY PAULA C. LAMBERT BETSY M. JACKSON
Indicates JLARC staff with primary assignment to this project
Recent JLARC Reports
Review of the Impact of State-Owned Ports on Local Governments, December 1999 Review of the Use of Grievance Hearing Officers, December 1999 Review of the Performance and Management of the Virginia Department of Health, January 2000 Virginia’s Medicaid Reimbursement to Nursing Facilities, January 2000 Final Report: Review of the Virginia Housing Development Authority, August 2000 Technical Status Report: An Overview of Expenditure Forecasting in Four Major State Programs, August 2000 Virginia’s Welfare Reform Initiative: Follow-Up of Participant Outcomes, October 2000 Final Report: Child Support Enforcement, November 2000 Technical Report: The Cost of Raising Children, November 2000 Review of the Medicaid Inpatient Hospital Reimbursement System, December 2000 Special Inquiry: A Review of Child Support Enforcement and the Judicial Process, December 2000 Review of the Virginia Distribution Center, January 2001 Review of Construction Costs and Time Schedules for Virginia Highway Projects, January 2001 Review of RMA and Powhite Parkway Extension Toll Facility Operations, January 2001 Review of VDOT’s Administration of the Interstate Asset Management Contract, January 2001 Review of Elementary and Secondary School Funding: Interim Status Report, January 2001 Special Report: Preservation of Revolutionary War Veteran Gravesites in Virginia, February 2001 Indigent Participation in Medical Research at Virginia’s Medical Schools, July 2001 Review of State Aid to Public Libraries, July 2001 2001 Report to the General Assembly, October 2001 Review of the Virginia Small Business Development Center Program, December 2001 Equity and Efficiency of Highway Construction and Transit Funding, December 2001 Adequacy and Management of VDOT’s Highway Maintenance Program, December 2001 Review of Virginia’s System of Capital Punishment, January 2002 Interim Report: Review of State Spending, January 2002 Review of Selected Programs in the Department of Medical Assistance Services, January 2002 Review of Secondary and Elementary School Funding, February 2002 Review of State Spending: June 2002 Update VRS Oversight Report No. 18: VRS Biennial Status and Semi-Annual Investment Report, July 2002 Special Report: Tax Compliance (October 2002) Special Report: The Secretarial System (October 2002) Special Report: State Business Incentive Grant Programs (November 2002) Interim Report: Best Practices for the Support Service of School Divisions (December 2002) Special Report: Higher Education (November 2002) Special Report: Medical Supplies and Pharmaceuticals (December 2002) VRS Semi-Annual Investment Report No. 19 (December 2002) The Future of the Chesapeake Bay Bridge-Tunnel, January 2003 Review of Information Technology Systems Development, January 2003 Review of the Virginia Birth-Related Neurological Injury Compensation Program, January 2003 Review of Workforce Training in Virginia, January 2003 Review of the Charitable Gaming Commission, January 2003 Implementation of the Chesapeake Bay Preservation Act, January 2003 Special Report: State Spending on Regional Health Planning Agencies (June 2003) VRS Semi-Annual Investment Report No. 20 (July 2003) 2003 Report to the General Assembly (September 2003) Technical Report: State Funding Formula for Educational Technology (September 2003) Review of State Spending: December 2003 Update Implementation Review: Virginia Information Technologies Agency, December 2003 Status Report Review of Virginia’s Activity in Maximizing Federal Grant Funding (December 2003) Semi-Annual VRS Investment Report No. 21 (December 2003) Best Practices for the Support Services of School Divisions (January 2004) Acclimation of Virginia’s Foreign-Born Population (January 2004) Review of the State’s Passenger Vehicle Fleet (January 2004) Review of Factors and Practices Associated with School Performance in Virginia (January 2004)
JLARC Home Page: http://jlarc.state.va.us

JLARCSuite 1100
General Assembly BuildingCapitol Square
Richmond, Virginia 23219(804) 786-1258 Fax: 371-0101
http://jlarc.state.va.us