Embed Size (px)
Citation preview
Helsinki CommissionBaltic Marine Environment Protection Commission
Baltic Sea Environment Proceedings No. 141
Review of the Fifth Baltic Sea Pollution Load Compilation for the 2013 HELCOM Ministerial Meeting

Review of the Fifth Baltic Sea Pollution Load Compilation for the 2013 HELCOM Ministerial Meeting
Baltic Sea Environment Proceedings No. 141
Helsinki Commission
Baltic Marine Environment Protection Commission
2
Published by:
Helsinki CommissionKatajanokanlaituri 6 BFI-00160 Helsinki, Finlandhttp://www.helcom.fi
Authors: Lars M. Svendsen1, Håkan Staaf2, Bo Gustafsson3, Minna Pyhälä4, Pekka Kotilainen5, Jerzy Bartnicki6, Seppo Knuuttila5, Mikhail Durkin4.
1 DCE - Danish Centre for Environment and Energy2 Swedish Agency for Marine and Water Management3 Baltic Nest Institute, Stockholm University4 Secretariat of the Helsinki Commission5 Finnish Environment Institute6 Meteorological Synthesizing Centre-West of EMEP
For bibliographic purposes this document should be cited as:HELCOM, 2013. Review of the Fifth Baltic Sea Pollution Load Compilation for the 2013 HELCOM Ministerial Meeting. Balt. Sea Environ. Proc. No. 141
Information included in this publication or extracts thereof is free for citing on the condition that the complete reference of the publication is given as stated above
Photo credit (front and back covers): Seppo Knuuttila
Copyright 2013 by the Baltic Marine Environment Protection Commission - Helsinki Commission -
Language revision: Howard McKeeDesign and Layout: Bitdesign, Vantaa, FinlandNumber of pages: 49Printed by: Erweko OyISSN 0357-2994
Content
Preface . . . . . . . . . . . . . . . . . . . . . . . . . . . . . . . . . . . . . . . . . . . . . . . . . . . . . . . . . . . . . . . 4
1 Introduction . . . . . . . . . . . . . . . . . . . . . . . . . . . . . . . . . . . . . . . . . . . . . . . . . . . . . . . 61.1 Pathways and sources of nutrient inputs . . . . . . . . . . . . . . . . . . . . . . . . . . . . . . . . . . . . . . . . . . . .7
1.2 Data basis . . . . . . . . . . . . . . . . . . . . . . . . . . . . . . . . . . . . . . . . . . . . . . . . . . . . . . . . . . . . . . . . . . . . . .8
2 Long-term trends in emissions and inputs . . . . . . . . . . . . . . . . . . . . . . . . . . . . . . 102.1 Nitrogen and phosphorus inputs in the reference period 1997-2003 . . . . . . . . . . . . . . . . . . . .10
2.2 Development in air emissions and atmospheric depositions of nitrogen . . . . . . . . . . . . . . . . . 11
2.3 Development in waterborne inputs of nutrients . . . . . . . . . . . . . . . . . . . . . . . . . . . . . . . . . . . . . 13
2.4 Trend analysis for water- and airborne inputs . . . . . . . . . . . . . . . . . . . . . . . . . . . . . . . . . . . . . . . 19
3 Total nutrient inputs to the Baltic Sea in 2010 . . . . . . . . . . . . . . . . . . . . . . . . . . . 28
4 Nutrient sources in 2010 . . . . . . . . . . . . . . . . . . . . . . . . . . . . . . . . . . . . . . . . . . . . 364.1 Sources of airborne inputs in 2010 . . . . . . . . . . . . . . . . . . . . . . . . . . . . . . . . . . . . . . . . . . . . . . . .36
4.2 Sources of waterborne inputs in 2010 . . . . . . . . . . . . . . . . . . . . . . . . . . . . . . . . . . . . . . . . . . . . . .38
5 Discussion and Conclusions . . . . . . . . . . . . . . . . . . . . . . . . . . . . . . . . . . . . . . . . . 40
6 Acknowledgements . . . . . . . . . . . . . . . . . . . . . . . . . . . . . . . . . . . . . . . . . . . . . . . . 45
7 References . . . . . . . . . . . . . . . . . . . . . . . . . . . . . . . . . . . . . . . . . . . . . . . . . . . . . . . . 46
8 List of defi nitions and abbreviations . . . . . . . . . . . . . . . . . . . . . . . . . . . . . . . . . . 47
3
Revi
ew o
f th
e Fi
fth
Balti
c Se
a Po
llutio
n Lo
ad C
ompi
latio
n
cation and hence water- and airborne inputs of nutrients can only be done if the sources and mag-nitude of nutrient pollution are known. This is why HELCOM’s pollution load compilation (PLC) data are of such great importance.
In BSAP 2007, it was acknowledged that the decided environmental and nutrient reduction targets for the Contracting Parties were provi-sional. Pursuing the adaptive management prin-ciples, it was agreed that all fi gures related to environmental status and maximum allowable inputs should be periodically reviewed. Revised maximum allowable inputs and new country-wise allocated reduction targets were adopted at the HELCOM Ministerial Meeting in October 2013 (HELCOM 2013a). Complete, consistent, updated and high quality water- and airborne input data are a pre-requisite for determining reduction schemes, for example, to make a fair share of the nutrient reductions between the Contracting Parties and to follow up progress upon fulfi llment of the reduc-tion requirements. It was for this reason that the PLC-5.5 project1 was established. It has updated the PLC-5 report (HELCOM 2011 & HELCOM 2012) by updating, correcting, gap-fi lling and quality assuring the PLC data set2, and by including water- and airborne data for 2009 and 2010. The PLC-5.5 data set, including estimates made by the project to fi ll in data gaps, has been approved by the HELCOM Contracting Parties for use in this Review of the PLC-5 for the 2013 HELCOM Ministerial Meeting, the PLC-5.5 report and for revised calcu-lations of the BSAP maximum allowable nutrient inputs (MAI) and country-wise allocation of reduc-tion targets (CART). The latest changes in the data set were made in July 2013.
This report was prepared as supporting material for the 2013 HELCOM Ministerial Meeting which was
1 Project for the review of the Fifth Baltic Sea Pollution Load Compilation for the 2013 HELCOM Ministerial Meeting (HELCOM PLC-5.5) – imple-mented during 2012-2013.
2 HELCOM 33/2012 noted the implications of missing data for HELCOM assessment purposes as well as the recalculation of maximum allow-able nutrient inputs and country-wise nutrient reduction allocations and stressed that remaining gaps in data will be fi lled with estimates determined by the PLC-5.5 project group unless this missing data is provided by the Contracting Parties (paragraph 4.23, LD 41 Minutes of the Meeting).
Since the establishment of the Convention for the Protection of the Marine Environment of the Baltic Sea Area (Helsinki Convention) in 1974, the Com-mission for the Protection of the Marine Environ-ment of the Baltic Sea Area (HELCOM) has been working to reduce the inputs of nutrients to the sea. Through coordinated monitoring, HELCOM has, since the mid-1980s, been compiling informa-tion on the magnitude and sources of nutrient inputs into the Baltic Sea. By regularly compiling and reporting input data, HELCOM is able to follow the progress towards reaching politically agreed goals. The fi rst Baltic Sea Pollution Load Compila-tion (PLC-1) was published in 1987 and the latest (PLC-5) in 2011 (HELCOM, 2011).
In 2007, the HELCOM Baltic Sea Action Plan (BSAP 2007) was adopted by the Baltic Sea coastal countries and the European Community (HELCOM 2007). The BSAP has the overall objective of reach-ing a Baltic Sea in good environmental status by 2021 by addressing the issues of eutrophication, hazardous substances, biodiversity and maritime activities. The BSAP has estimated the maximum annual waterborne nutrient input to the Baltic Sea that can be allowed and still make it possible to reach good environmental status with regard to eutrophication, based on modeled calculations by the Baltic Nest Institute (BNI), Sweden. The BNI also estimated the necessary waterborne nutrient reductions at the sub-basin level. To reach these reduction targets, responsibility has been divided between the HELCOM countries through a nutri-ent reduction allocation scheme based on the polluter pays principle. The EU Water Framework Directive, WFD (2000/60/EC), and the EU Marine Strategy Framework Directive, MSFD (2008/56/EC), also require ‘good ecological status’ / ‘good environmental status’ of coastal and open sea areas in Europe, respectively. Reducing eutrophi-
Preface
4
5
Revi
ew o
f th
e Fi
fth
Balti
c Se
a Po
llutio
n Lo
ad C
ompi
latio
n
held in Copenhagen, Denmark on 3 October 2013. It is a review and update of the Fifth Baltic Sea Pol-lution Load Compilation (HELCOM 2011 & 2012) covering water- and airborne inputs to the sea. The focus in this report is on time series; trends in inputs from 1994 to 2010; the comparison of nor-malized inputs during 2008-2010 compared with the corresponding inputs during the BSAP refer-ence period (1997-2003); and the status of inputs in 2010. Source apportionment from the PLC-5 report (based on data from 2006) has not been updated as this will be covered by the next PLC assessment (PLC-6).
It should be noted that the fi gures presented are rounded (although not necessarily to the number of digits that corresponds to the level of accuracy) in order to avoid confusion when summing differ-ent numbers.
A PLC-5.5 report (HELCOM, in prep), although in general covering nutrient inputs during the same period as in this report, will include more detailed information as well as information about follow-up of progress toward reaching the revised nutrient reduction targets agreed on in the 2013 HELCOM Copenhagen Declaration.
1 Introduction
Eutrophication is one of the main environmental problems facing the Baltic Sea. Since the early 1900s, the Baltic Sea has become increasingly eutrophied as a result of increasing inputs of the nutrients nitrogen and phosphorus from anthropo-genic activities in the catchment area and at sea.
Nitrogen and phosphorus are the main growth limiting nutrients - high nutrient concentrations in the aquatic environment stimulate the growth of algae, which leads to an imbalanced functioning of the ecosystem. The intense algal growth is mani-fested as an excess of fi lamentous algae and phy-toplankton blooms and generally a production of excess organic matter. At the end of summer, the algae die and are decomposed by oxygen consum-ing bacteria, resulting in oxygen depleted waters and consequently the death of benthic organisms, including fi sh.
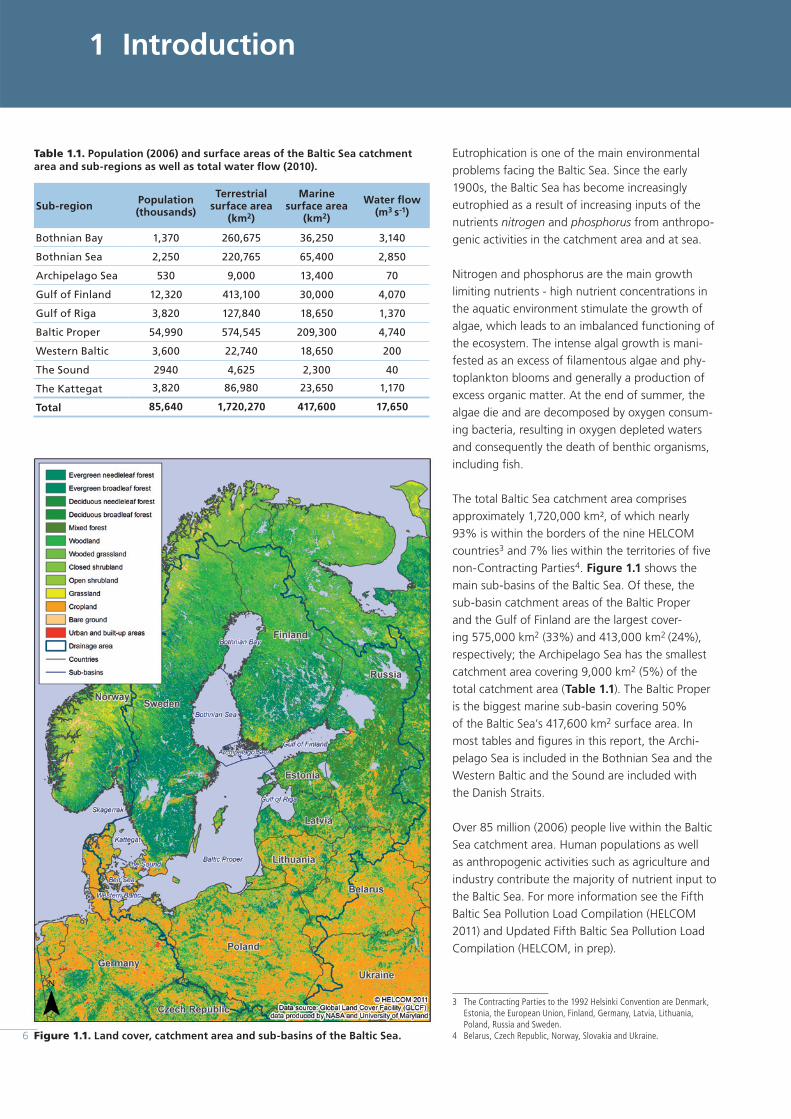
The total Baltic Sea catchment area comprises approximately 1,720,000 km², of which nearly 93% is within the borders of the nine HELCOM countries3 and 7% lies within the territories of fi ve non-Contracting Parties4. Figure 1.1 shows the main sub-basins of the Baltic Sea. Of these, the sub-basin catchment areas of the Baltic Proper and the Gulf of Finland are the largest cover-ing 575,000 km2 (33%) and 413,000 km2 (24%), respectively; the Archipelago Sea has the smallest catchment area covering 9,000 km2 (5%) of the total catchment area (Table 1.1). The Baltic Proper is the biggest marine sub-basin covering 50% of the Baltic Sea’s 417,600 km2 surface area. In most tables and fi gures in this report, the Archi-pelago Sea is included in the Bothnian Sea and the Western Baltic and the Sound are included with the Danish Straits.
Over 85 million (2006) people live within the Baltic Sea catchment area. Human populations as well as anthropogenic activities such as agriculture and industry contribute the majority of nutrient input to the Baltic Sea. For more information see the Fifth Baltic Sea Pollution Load Compilation (HELCOM 2011) and Updated Fifth Baltic Sea Pollution Load Compilation (HELCOM, in prep).
3 The Contracting Parties to the 1992 Helsinki Convention are Denmark, Estonia, the European Union, Finland, Germany, Latvia, Lithuania, Poland, Russia and Sweden.
4 Belarus, Czech Republic, Norway, Slovakia and Ukraine.
Table 1.1. Population (2006) and surface areas of the Baltic Sea catchment area and sub-regions as well as total water fl ow (2010).
Sub-region Population (thousands)
Terrestrial surface area
(km2)
Marine surface area
(km2)
Water fl ow (m3 s-1)
Bothnian Bay 1,370 260,675 36,250 3,140
Bothnian Sea 2,250 220,765 65,400 2,850
Archipelago Sea 530 9,000 13,400 70
Gulf of Finland 12,320 413,100 30,000 4,070
Gulf of Riga 3,820 127,840 18,650 1,370
Baltic Proper 54,990 574,545 209,300 4,740
Western Baltic 3,600 22,740 18,650 200
The Sound 2940 4,625 2,300 40
The Kattegat 3,820 86,980 23,650 1,170
Total 85,640 1,720,270 417,600 17,650
Figure 1.1. Land cover, catchment area and sub-basins of the Baltic Sea.6
7
Revi
ew o
f th
e Fi
fth
Balti
c Se
a Po
llutio
n Lo
ad C
ompi
latio
n
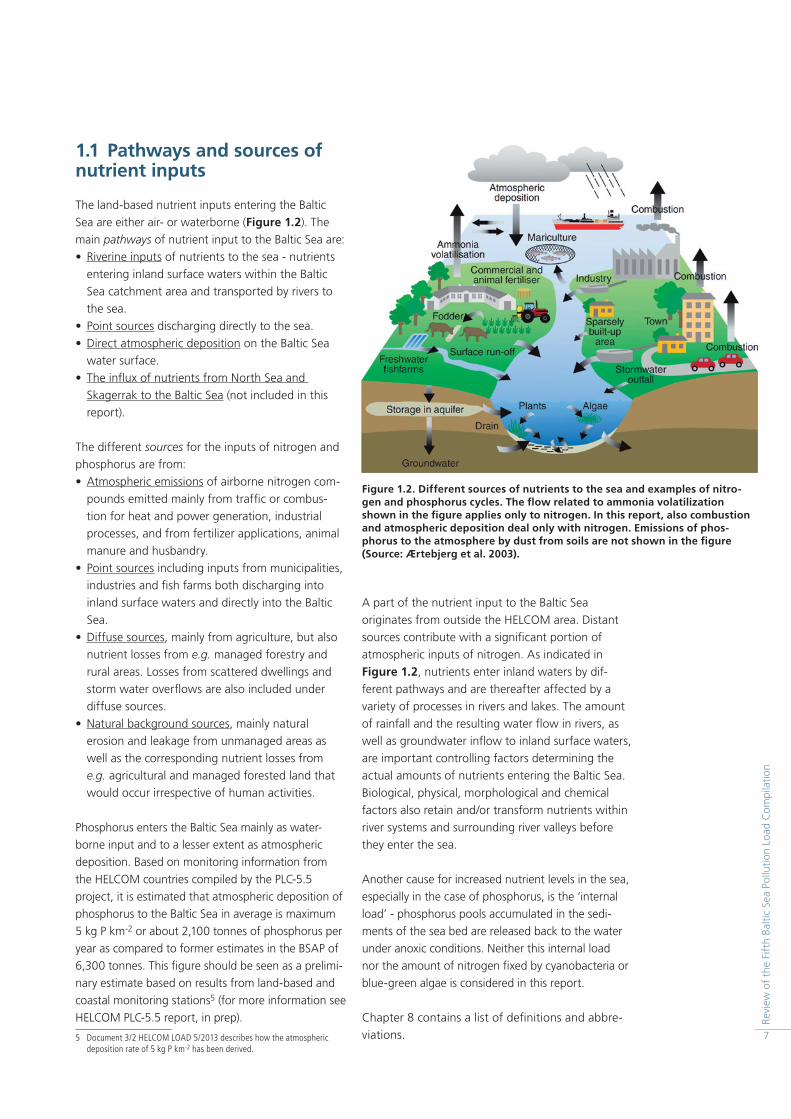
1.1 Pathways and sources of nutrient inputs
The land-based nutrient inputs entering the Baltic Sea are either air- or waterborne (Figure 1.2). The main pathways of nutrient input to the Baltic Sea are: • Riverine inputs of nutrients to the sea - nutrients
entering inland surface waters within the Baltic Sea catchment area and transported by rivers to the sea.
• Point sources discharging directly to the sea.• Direct atmospheric deposition on the Baltic Sea
water surface.• The infl ux of nutrients from North Sea and
Skagerrak to the Baltic Sea (not included in this report).
The different sources for the inputs of nitrogen and phosphorus are from:• Atmospheric emissions of airborne nitrogen com-
pounds emitted mainly from traffi c or combus-tion for heat and power generation, industrial processes, and from fertilizer applications, animal manure and husbandry.
• Point sources including inputs from municipalities, industries and fi sh farms both discharging into inland surface waters and directly into the Baltic Sea.
• Diffuse sources, mainly from agriculture, but also nutrient losses from e.g. managed forestry and rural areas. Losses from scattered dwellings and storm water overfl ows are also included under diffuse sources.
• Natural background sources, mainly natural erosion and leakage from unmanaged areas as well as the corresponding nutrient losses from e.g. agricultural and managed forested land that would occur irrespective of human activities.
Phosphorus enters the Baltic Sea mainly as water-borne input and to a lesser extent as atmospheric deposition. Based on monitoring information from the HELCOM countries compiled by the PLC-5.5 project, it is estimated that atmospheric deposition of phosphorus to the Baltic Sea in average is maximum 5 kg P km-2 or about 2,100 tonnes of phosphorus per year as compared to former estimates in the BSAP of 6,300 tonnes. This fi gure should be seen as a prelimi-nary estimate based on results from land-based and coastal monitoring stations5 (for more information see HELCOM PLC-5.5 report, in prep).
5 Document 3/2 HELCOM LOAD 5/2013 describes how the atmospheric deposition rate of 5 kg P km-2 has been derived.
A part of the nutrient input to the Baltic Sea originates from outside the HELCOM area. Distant sources contribute with a signifi cant portion of atmospheric inputs of nitrogen. As indicated in Figure 1.2, nutrients enter inland waters by dif-ferent pathways and are thereafter affected by a variety of processes in rivers and lakes. The amount of rainfall and the resulting water fl ow in rivers, as well as groundwater infl ow to inland surface waters, are important controlling factors determining the actual amounts of nutrients entering the Baltic Sea. Biological, physical, morphological and chemical factors also retain and/or transform nutrients within river systems and surrounding river valleys before they enter the sea.
Another cause for increased nutrient levels in the sea, especially in the case of phosphorus, is the ‘internal load’ - phosphorus pools accumulated in the sedi-ments of the sea bed are released back to the water under anoxic conditions. Neither this internal load nor the amount of nitrogen fi xed by cyanobacteria or blue-green algae is considered in this report.
Chapter 8 contains a list of defi nitions and abbre-viations.
Figure 1.2. Different sources of nutrients to the sea and examples of nitro-gen and phosphorus cycles. The fl ow related to ammonia volatilization shown in the fi gure applies only to nitrogen. In this report, also combustion and atmospheric deposition deal only with nitrogen. Emissions of phos-phorus to the atmosphere by dust from soils are not shown in the fi gure (Source: Ærtebjerg et al. 2003).
8
for Luga River during 1994-2000. Nitrogen data from unmonitored areas and 16 small rivers to the Gulf of Finland and to the Baltic Proper are missing.
• Phosphorus: e.g. all Latvian data from 2009-2010. Russia has reported dissolved phosphorus for four rivers, but total phosphorus is missing from Pregolya and Seleznevka during 1994-2010, and for Luga River during 1994-2000. Phosphorus data from unmonitored areas and 16 small rivers to the Gulf of Finland and to the Baltic Proper are missing.
• Some countries are missing data from direct waste water treatment plants and direct indus-try partly or fully for one or several years (water fl ow, nitrogen, phosphorus).
The following main challenges have been dealt with in order to complete the PLC-5.5 dataset (further details are given in HELCOM 2013b):• Some countries only monitored and reported
inorganic (dissolved) nutrient fractions for some years.
• Nemunas 1994: Nitrogen and phosphorus inputs were exceptionally high. Further, it has been clear that inputs from Matrosovka (a channel from the River Nemunas that enters from Lithu-ania into Kaliningrad region) were included into the total Nemunas inputs for some years and in other years excluded from it.
• There was no obvious explanation for very high inputs for some years in some rivers (the Odra and Vistula in Poland and the Neva in Russia).
• As mentioned above, total nitrogen and total phosphorus was missing for some or all years for the four monitored Russian rivers during 1994-2010, although total phosphorus was reported for Neva during all years. The reported total phosphorus input from Neva was for several years very high and reduced signifi cantly by the LOAD Core Group and BNI based on additional information. For the four rivers, loads of inor-ganic, dissolved fractions were reported during 1994-2010, and total nitrogen and total phos-phorus inputs estimated.
• Direct point source loads are included in unmoni-tored or coastal loads for some years; the report-ing of direct point sources in many cases does not cover all point sources. Further, some coun-tries sometimes include direct loads in unmoni-tored areas/coastal areas or even in monitored loads. This has not been solved completely,
1.2 Data basis
The HELCOM countries annually report inputs from riverine and direct point sources to Baltic Sea sub-basins. Since the Fifth Pollution Load Compilation (HELCOM 2011) which included waterborne data from 1994 to 2008, data from 2009 and 2010 have been added. Most countries have updated or revised old PLC data covering the period 1994-2008 by providing missing data and/or correcting previously reported data. Further, the PLC-5.5 project, HELCOM LOAD6 Core Group and BNI Sweden have made great efforts to fi ll in missing data and provide proposals for correcting of suspicious (HELCOM 2013b). By this, the most complete, consistent and quality assured PLC data set has been developed covering 1994-2010 waterborne inputs to the Baltic Sea. Filling in data gaps/missing data was considered necessary as no monitoring or modeling results were available or provided to HELCOM for some catchments. All changes, including fi lling in data gaps, have been discussed with the HELCOM countries; moreover, the PLC-5.5 data set has been approved by all the HELCOM Contracting Parties for use in the PLC-5.5 report and for revised calculations of the BSAP maximum allowable nutrient inputs (MAI) and the country-wise allocation of the reduction targets (CART). It should be noted, however, that Russia has not accepted to include the present Russian PLC-5.5 data in the PLC-database as offi -cial Russian data.
The most important data gaps and challenges that had to be solved to obtain a complete and consist-ent PLC-5.5 data set are summarized below (further details are given in HELCOM 2013b).
Missing data:• Flow: e.g. all water fl ows from Latvia from 2009-
2010 and unmonitored areas from 1994-2003 and 2007-2010. All Russian water fl ows from unmonitored areas and 16 small rivers.
• Nitrogen: e.g. all Latvian data from 2009-2010 and unmonitored areas from 1994-2003 and 2007-2010. Russia has reported nitrogen frac-tions for four rivers, but total nitrogen is missing from Pregolya and Seleznevka during 1994-2010, for Neva during 1994-1999 and 2006 and
6 Expert Group on follow-up of national progress towards reaching BSAP nutrient reduction targets (HELCOM LOAD)
9
Revi
ew o
f th
e Fi
fth
Balti
c Se
a Po
llutio
n Lo
ad C
ompi
latio
n
Waterborne transboundary inputs from other Contracting Parties and non-Contracting Parties are included in the inputs from the Contracting Party where these inputs enter the Baltic Sea. For example, the waterborne inputs to Gulf of Riga at the outlet of Daugava (in Latvia) include transbound-ary inputs from Russia and Belarus, and a minor contribution from Lithuania and Estonia; however, the inputs are included as part of the waterborne values from Latvia. The Lithuanian inputs to the Baltic Proper are based on the reported Lithuanian data and estimated inputs via the Matrosovka Canal, calculated by the PLC-5.5 Project. The esti-mated net transboundary waterborne inputs from non- Contracting and Contracting Parties, taking into account retention within surface waters, are included in Tables 3.3a and 3.3b.
It should be noted that the fi gures presented are rounded (although not necessarily to the number of digits that corresponds to the level of accuracy) in order to avoid confusion when summing differ-ent numbers.
which mainly affects the statistical analyses on trends on direct inputs from some countries to some Baltic Sea sub-basins, but does not affect total waterborne inputs.
Data on atmospheric inputs cover 1995-2010, where 1995-2008 data have been updated and recalculated compared with the PLC-5 Executive summary (HELCOM 2012). Emissions and moni-tored atmospheric deposition data are submitted by the countries to the Cooperative Programme for Monitoring and Evaluation of the Long-range Transmission of Air Pollutants in Europe (EMEP), which subsequently compiles and reports this information to HELCOM. To smooth the effects of changing weather conditions, riverine data have been fl ow normalized and the EMEP has developed a methodology and calculated normalized deposi-tion data (HELCOM, in prep). Direct point source input to the Baltic Sea is not normalized as it is generally not affected by weather conditions. It is indicated in this report when the fi gures and tables are based on normalized data.
2 Long-term trends in emissions and inputs
inputs for the reference period (Table 2.2). This data set has then been used for calculating the revised nutrient reduction scheme which was adopted by the 2013 HELCOM Copenhagen Min-isterial Meeting (HELCOM 2013a). Also, nitrogen deposition has been recalculated and normal-ized for the reference period (Table 2.2). In the calculation of the revised MAI and new CART for the HELCOM Ministerial Meeting in 2013, contri-butions from Contracting Parties to atmospheric nitrogen deposition was taken into account when allocating the nitrogen reduction require-ments between the HELCOM Contracting Parties. Further reduction is assumed on transboundary atmospheric nitrogen deposition originating from non-HELCOM sources and for waterborne nitro-gen and phosphorus inputs from non-Contracting Parties (HELCOM 2013c). Only phosphorus depo-sition is considered as an input for which the sources are not identifi ed and for which there is no expected reduction requirement.
The revised maximum allowable inputs calculated by BNI using the PLC-5.5 data set are 792,200 tonnes of nitrogen and 21,700 tonnes of phospho-rus, leading to a reduction requirement of 118,100 tonnes of nitrogen and 15,200 tonnes of phospho-rus compared to the inputs during the reference period 1997-2003 (HELCOM 2013a).
In order to evaluate the progress of countries in reaching their nutrient reduction targets and to assess the effectiveness of measures to reduce nutrient inputs, it is important to evaluate the long-term trends in emissions and inputs of nutrients. Thus, the development from 1994 to 2010 and
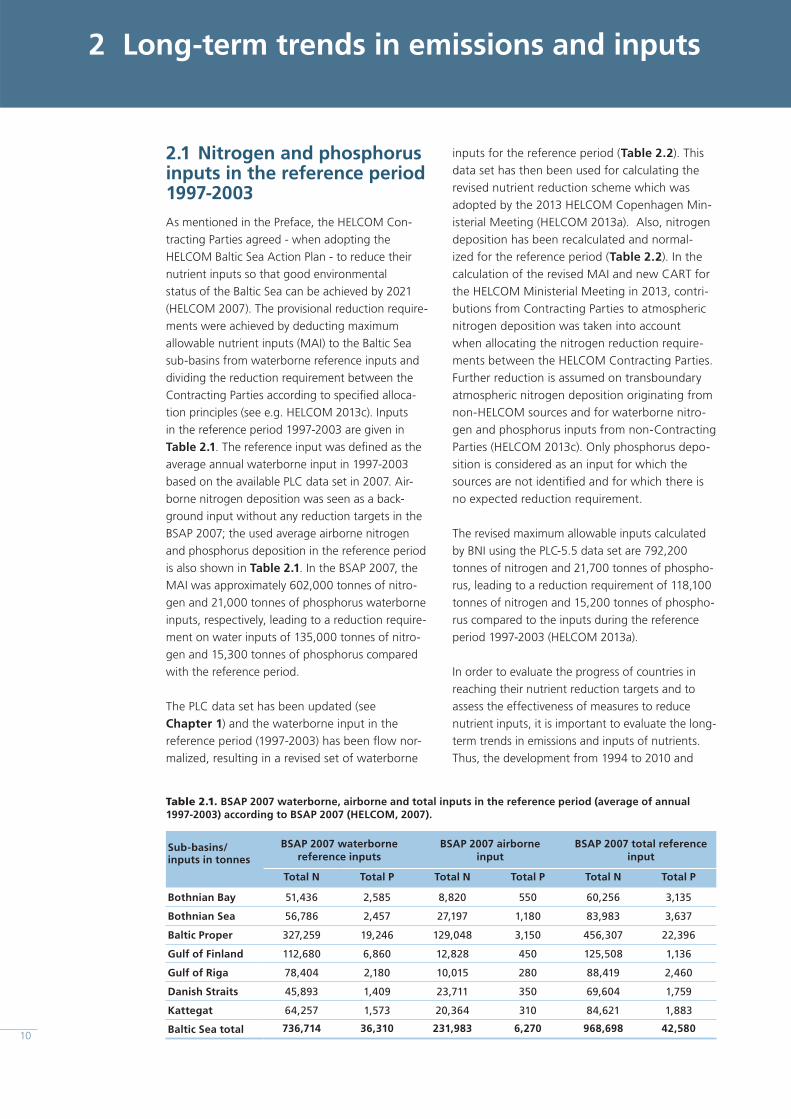
2.1 Nitrogen and phosphorus inputs in the reference period 1997-2003 As mentioned in the Preface, the HELCOM Con-tracting Parties agreed - when adopting the HELCOM Baltic Sea Action Plan - to reduce their nutrient inputs so that good environmental status of the Baltic Sea can be achieved by 2021 (HELCOM 2007). The provisional reduction require-ments were achieved by deducting maximum allowable nutrient inputs (MAI) to the Baltic Sea sub-basins from waterborne reference inputs and dividing the reduction requirement between the Contracting Parties according to specifi ed alloca-tion principles (see e.g. HELCOM 2013c). Inputs in the reference period 1997-2003 are given in Table 2.1. The reference input was defi ned as the average annual waterborne input in 1997-2003 based on the available PLC data set in 2007. Air-borne nitrogen deposition was seen as a back-ground input without any reduction targets in the BSAP 2007; the used average airborne nitrogen and phosphorus deposition in the reference period is also shown in Table 2.1. In the BSAP 2007, the MAI was approximately 602,000 tonnes of nitro-gen and 21,000 tonnes of phosphorus waterborne inputs, respectively, leading to a reduction require-ment on water inputs of 135,000 tonnes of nitro-gen and 15,300 tonnes of phosphorus compared with the reference period.
The PLC data set has been updated (see Chapter 1) and the waterborne input in the reference period (1997-2003) has been fl ow nor-malized, resulting in a revised set of waterborne
Table 2.1. BSAP 2007 waterborne, airborne and total inputs in the reference period (average of annual 1997-2003) according to BSAP 2007 (HELCOM, 2007).
Sub-basins/ inputs in tonnes
BSAP 2007 waterborne reference inputs
BSAP 2007 airborne input
BSAP 2007 total reference input
Total N Total P Total N Total P Total N Total P
Bothnian Bay 51,436 2,585 8,820 550 60,256 3,135
Bothnian Sea 56,786 2,457 27,197 1,180 83,983 3,637
Baltic Proper 327,259 19,246 129,048 3,150 456,307 22,396
Gulf of Finland 112,680 6,860 12,828 450 125,508 1,136
Gulf of Riga 78,404 2,180 10,015 280 88,419 2,460
Danish Straits 45,893 1,409 23,711 350 69,604 1,759
Kattegat 64,257 1,573 20,364 310 84,621 1,883
Baltic Sea total 736,714 36,310 231,983 6,270 968,698 42,58010
11
Revi
ew o
f th
e Fi
fth
Balti
c Se
a Po
llutio
n Lo
ad C
ompi
latio
n
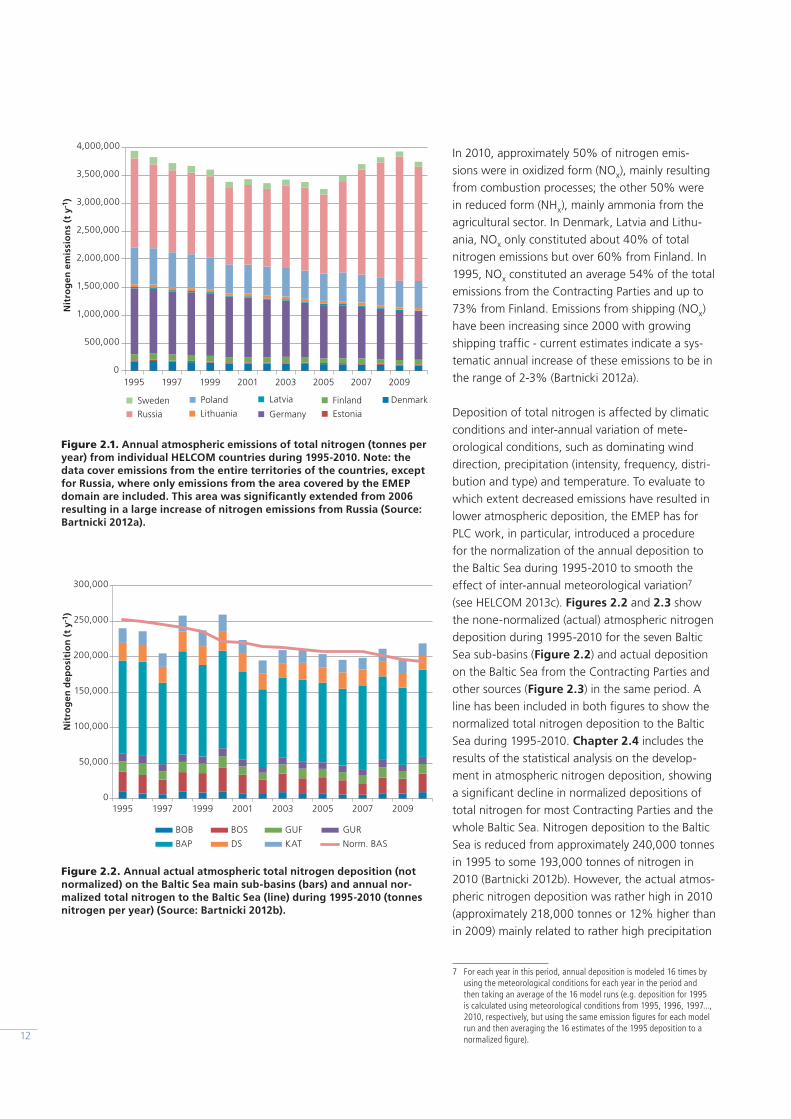
and shipping) are available from 1995. Emissions are compiled from the whole territory of the countries, but for Russia only a part of the terri-tory is included. The area of the Russian territory was considerably extended in 2006, leading to higher emissions from Russia. Emissions from non-Contracting Parties also contribute signifi cantly to nitrogen deposition on the Baltic Sea (see below). Annual emissions of total nitrogen from seven HELCOM countries have decreased from 1995-2010, (Figure 2.1). According to the EMEP (EMEP 2012), emissions have decreased signifi cantly since 1995. The largest reductions have been achieved by Denmark and Sweden, with 41% and 32% lower total nitrogen emissions to air in 2010 compared to 1995, respectively. Emissions from Estonia, Finland, Germany, Lithuania and Poland were 10-28% lower and the emissions from Latvia unchanged compared with 1995. Emissions from Russia increased with 28%, partly explained by the extension of the EMEP domain within the Russian territory which resulted in increased emis-sions after 2006 (Bartnicki 2012a). Also, some marked increases in emissions from Russia have been reported in 2007-2009. It should be pointed out, however, that the methodology of how emis-sions are calculated has changed between 1995 and 2010. Overall, the reduction of NOx emissions was higher than the corresponding reduction in NHx emissions from most HELCOM Contracting Parties.
a comparison between inputs during 2008-2010 (the most recent three-year average for a robust comparison) compared with the reference period (1997-2003) has been calculated and is summa-rized in this chapter.
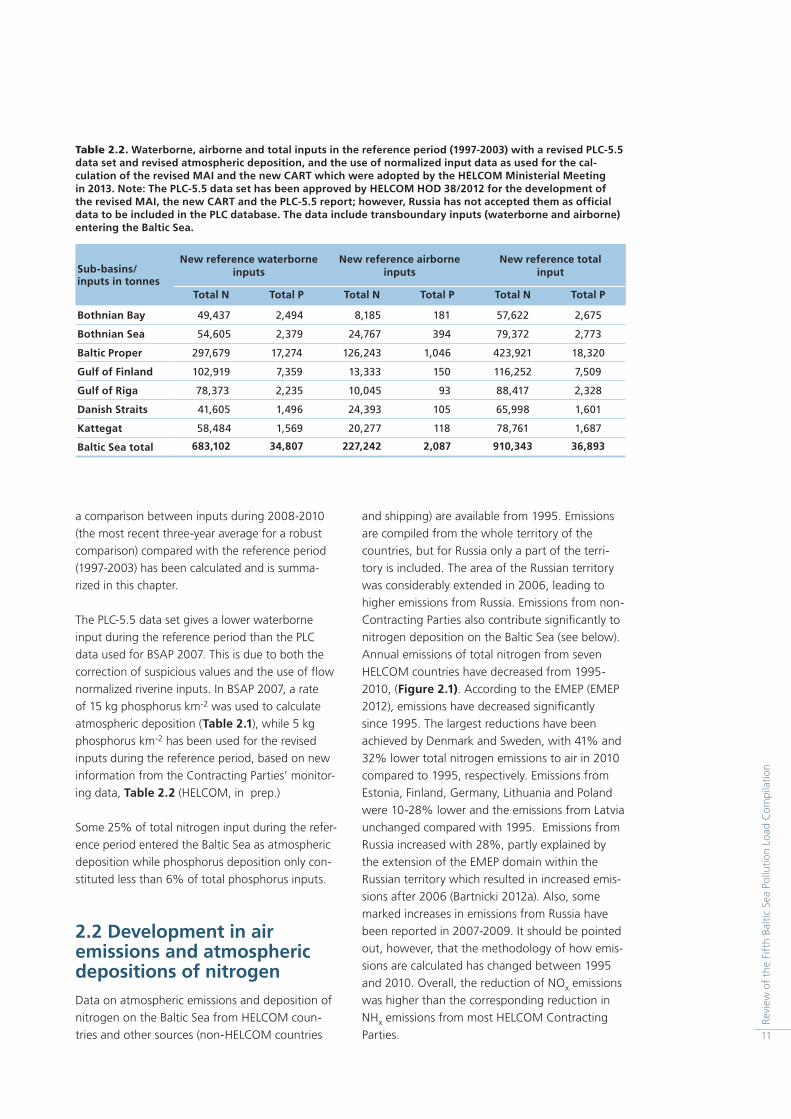
The PLC-5.5 data set gives a lower waterborne input during the reference period than the PLC data used for BSAP 2007. This is due to both the correction of suspicious values and the use of fl ow normalized riverine inputs. In BSAP 2007, a rate of 15 kg phosphorus km-2 was used to calculate atmospheric deposition (Table 2.1), while 5 kg phosphorus km-2 has been used for the revised inputs during the reference period, based on new information from the Contracting Parties’ monitor-ing data, Table 2.2 (HELCOM, in prep.)
Some 25% of total nitrogen input during the refer-ence period entered the Baltic Sea as atmospheric deposition while phosphorus deposition only con-stituted less than 6% of total phosphorus inputs.
2.2 Development in air emissions and atmospheric depositions of nitrogenData on atmospheric emissions and deposition of nitrogen on the Baltic Sea from HELCOM coun-tries and other sources (non-HELCOM countries
Table 2.2. Waterborne, airborne and total inputs in the reference period (1997-2003) with a revised PLC-5.5 data set and revised atmospheric deposition, and the use of normalized input data as used for the cal-culation of the revised MAI and the new CART which were adopted by the HELCOM Ministerial Meeting in 2013. Note: The PLC-5.5 data set has been approved by HELCOM HOD 38/2012 for the development of the revised MAI, the new CART and the PLC-5.5 report; however, Russia has not accepted them as offi cial data to be included in the PLC database. The data include transboundary inputs (waterborne and airborne) entering the Baltic Sea.
Sub-basins/ inputs in tonnes
New reference waterborne inputs
New reference airborne inputs
New reference total input
Total N Total P Total N Total P Total N Total P
Bothnian Bay 49,437 2,494 8,185 181 57,622 2,675
Bothnian Sea 54,605 2,379 24,767 394 79,372 2,773
Baltic Proper 297,679 17,274 126,243 1,046 423,921 18,320
Gulf of Finland 102,919 7,359 13,333 150 116,252 7,509
Gulf of Riga 78,373 2,235 10,045 93 88,417 2,328
Danish Straits 41,605 1,496 24,393 105 65,998 1,601
Kattegat 58,484 1,569 20,277 118 78,761 1,687
Baltic Sea total 683,102 34,807 227,242 2,087 910,343 36,893
12
In 2010, approximately 50% of nitrogen emis-sions were in oxidized form (NOx), mainly resulting from combustion processes; the other 50% were in reduced form (NHx), mainly ammonia from the agricultural sector. In Denmark, Latvia and Lithu-ania, NOx only constituted about 40% of total nitrogen emissions but over 60% from Finland. In 1995, NOx constituted an average 54% of the total emissions from the Contracting Parties and up to 73% from Finland. Emissions from shipping (NOx) have been increasing since 2000 with growing shipping traffi c - current estimates indicate a sys-tematic annual increase of these emissions to be in the range of 2-3% (Bartnicki 2012a).
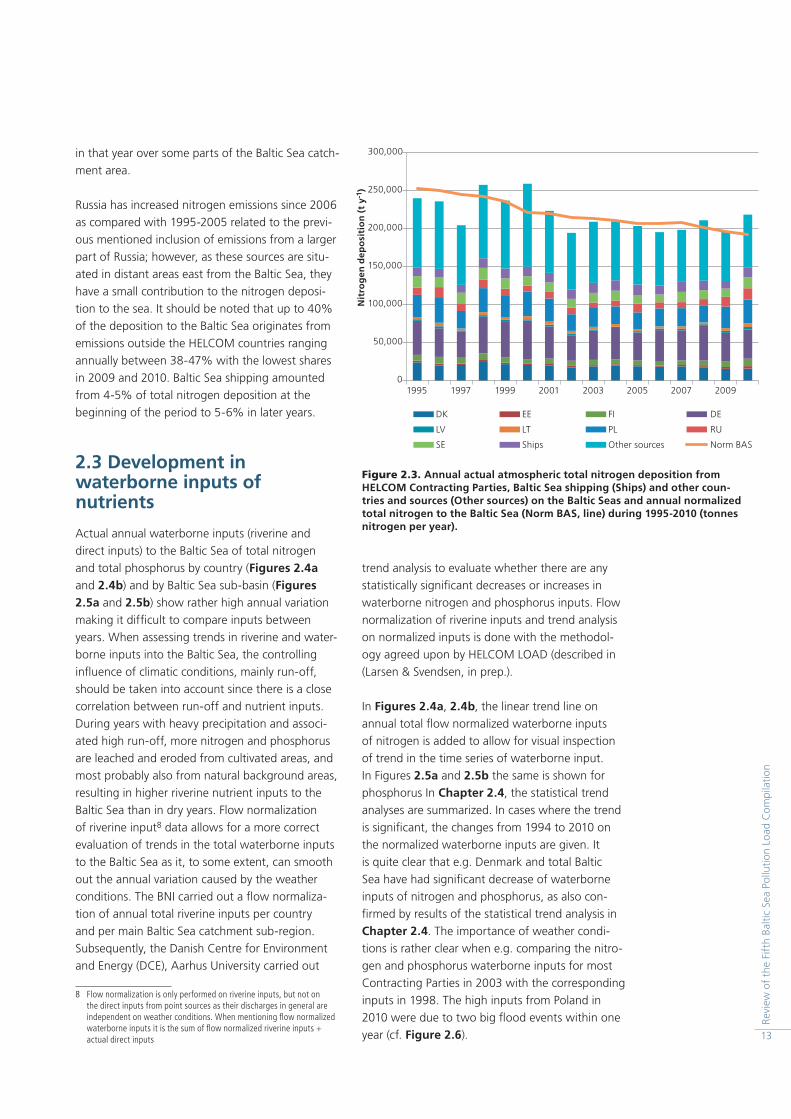
Deposition of total nitrogen is affected by climatic conditions and inter-annual variation of mete-orological conditions, such as dominating wind direction, precipitation (intensity, frequency, distri-bution and type) and temperature. To evaluate to which extent decreased emissions have resulted in lower atmospheric deposition, the EMEP has for PLC work, in particular, introduced a procedure for the normalization of the annual deposition to the Baltic Sea during 1995-2010 to smooth the effect of inter-annual meteorological variation7 (see HELCOM 2013c). Figures 2.2 and 2.3 show the none-normalized (actual) atmospheric nitrogen deposition during 1995-2010 for the seven Baltic Sea sub-basins (Figure 2.2) and actual deposition on the Baltic Sea from the Contracting Parties and other sources (Figure 2.3) in the same period. A line has been included in both fi gures to show the normalized total nitrogen deposition to the Baltic Sea during 1995-2010. Chapter 2.4 includes the results of the statistical analysis on the develop-ment in atmospheric nitrogen deposition, showing a signifi cant decline in normalized depositions of total nitrogen for most Contracting Parties and the whole Baltic Sea. Nitrogen deposition to the Baltic Sea is reduced from approximately 240,000 tonnes in 1995 to some 193,000 tonnes of nitrogen in 2010 (Bartnicki 2012b). However, the actual atmos-pheric nitrogen deposition was rather high in 2010 (approximately 218,000 tonnes or 12% higher than in 2009) mainly related to rather high precipitation
7 For each year in this period, annual deposition is modeled 16 times by using the meteorological conditions for each year in the period and then taking an average of the 16 model runs (e.g. deposition for 1995 is calculated using meteorological conditions from 1995, 1996, 1997..., 2010, respectively, but using the same emission fi gures for each model run and then averaging the 16 estimates of the 1995 deposition to a normalized fi gure).
0
500,000
1,000,000
1,500,000
2,000,000
2,500,000
3,000,000
3,500,000
4,000,000
1995 1997 1999 2001 2003 2005 2007 2009
Nit
rog
en e
mis
sio
ns
(t y
-1)
Sweden
Russia
Poland
Lithuania
Latvia
Germany
Finland
Estonia
Denmark
0
50,000
100,000
150,000
200,000
250,000
300,000
1995 1997 1999 2001 2003 2005 2007 2009
Nit
rog
en d
epo
siti
on
(t
y-1 )
BOB BOS GUF GUR
BAP DS KAT Norm. BAS
Figure 2.1. Annual atmospheric emissions of total nitrogen (tonnes per year) from individual HELCOM countries during 1995-2010. Note: the data cover emissions from the entire territories of the countries, except for Russia, where only emissions from the area covered by the EMEP domain are included. This area was signifi cantly extended from 2006 resulting in a large increase of nitrogen emissions from Russia (Source: Bartnicki 2012a).
Figure 2.2. Annual actual atmospheric total nitrogen deposition (not normalized) on the Baltic Sea main sub-basins (bars) and annual nor-malized total nitrogen to the Baltic Sea (line) during 1995-2010 (tonnes nitrogen per year) (Source: Bartnicki 2012b).
13
Revi
ew o
f th
e Fi
fth
Balti
c Se
a Po
llutio
n Lo
ad C
ompi
latio
n
trend analysis to evaluate whether there are any statistically signifi cant decreases or increases in waterborne nitrogen and phosphorus inputs. Flow normalization of riverine inputs and trend analysis on normalized inputs is done with the methodol-ogy agreed upon by HELCOM LOAD (described in (Larsen & Svendsen, in prep.).
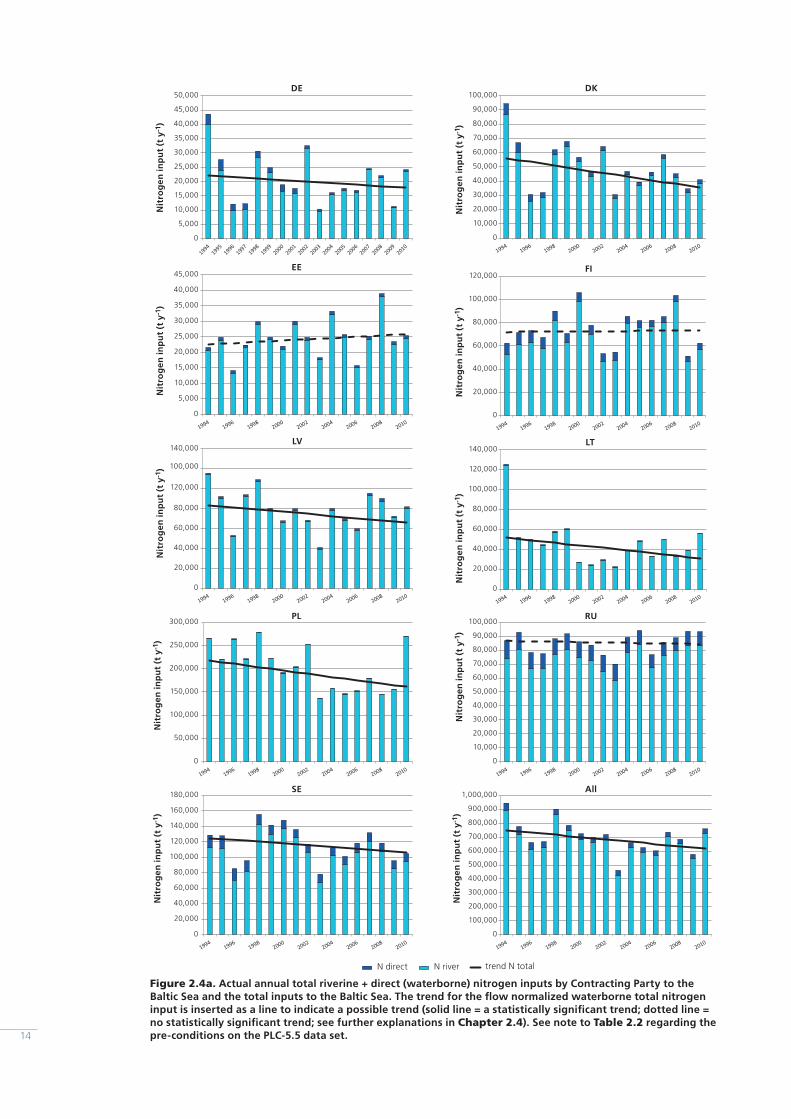
In Figures 2.4a, 2.4b, the linear trend line on annual total fl ow normalized waterborne inputs of nitrogen is added to allow for visual inspection of trend in the time series of waterborne input. In Figures 2.5a and 2.5b the same is shown for phosphorus In Chapter 2.4, the statistical trend analyses are summarized. In cases where the trend is signifi cant, the changes from 1994 to 2010 on the normalized waterborne inputs are given. It is quite clear that e.g. Denmark and total Baltic Sea have had signifi cant decrease of waterborne inputs of nitrogen and phosphorus, as also con-fi rmed by results of the statistical trend analysis in Chapter 2.4. The importance of weather condi-tions is rather clear when e.g. comparing the nitro-gen and phosphorus waterborne inputs for most Contracting Parties in 2003 with the corresponding inputs in 1998. The high inputs from Poland in 2010 were due to two big fl ood events within one year (cf. Figure 2.6).
in that year over some parts of the Baltic Sea catch-ment area.
Russia has increased nitrogen emissions since 2006 as compared with 1995-2005 related to the previ-ous mentioned inclusion of emissions from a larger part of Russia; however, as these sources are situ-ated in distant areas east from the Baltic Sea, they have a small contribution to the nitrogen deposi-tion to the sea. It should be noted that up to 40% of the deposition to the Baltic Sea originates from emissions outside the HELCOM countries ranging annually between 38-47% with the lowest shares in 2009 and 2010. Baltic Sea shipping amounted from 4-5% of total nitrogen deposition at the beginning of the period to 5-6% in later years.
2.3 Development in waterborne inputs of nutrients
Actual annual waterborne inputs (riverine and direct inputs) to the Baltic Sea of total nitrogen and total phosphorus by country (Figures 2.4a and 2.4b) and by Baltic Sea sub-basin (Figures 2.5a and 2.5b) show rather high annual variation making it diffi cult to compare inputs between years. When assessing trends in riverine and water-borne inputs into the Baltic Sea, the controlling infl uence of climatic conditions, mainly run-off, should be taken into account since there is a close correlation between run-off and nutrient inputs. During years with heavy precipitation and associ-ated high run-off, more nitrogen and phosphorus are leached and eroded from cultivated areas, and most probably also from natural background areas, resulting in higher riverine nutrient inputs to the Baltic Sea than in dry years. Flow normalization of riverine input8 data allows for a more correct evaluation of trends in the total waterborne inputs to the Baltic Sea as it, to some extent, can smooth out the annual variation caused by the weather conditions. The BNI carried out a fl ow normaliza-tion of annual total riverine inputs per country and per main Baltic Sea catchment sub-region. Subsequently, the Danish Centre for Environment and Energy (DCE), Aarhus University carried out
8 Flow normalization is only performed on riverine inputs, but not on the direct inputs from point sources as their discharges in general are independent on weather conditions. When mentioning fl ow normalized waterborne inputs it is the sum of fl ow normalized riverine inputs + actual direct inputs
Figure 2.3. Annual actual atmospheric total nitrogen deposition from HELCOM Contracting Parties, Baltic Sea shipping (Ships) and other coun-tries and sources (Other sources) on the Baltic Seas and annual normalized total nitrogen to the Baltic Sea (Norm BAS, line) during 1995-2010 (tonnes nitrogen per year).
0
50,000
100,000
150,000
200,000
250,000
300,000
1995 1997 1999 2001 2003 2005 2007 2009
Nit
rog
en d
epo
siti
on
(t
y-1 )
DK EE FI DE
LV LT PL RU
SE Ships Other sources Norm BAS
14
0
5,000
10,000
15,000
20,000
25,000
30,000
35,000
40,000
45,000
50,000
Nit
rog
en in
pu
t (t
y-1
)
DE
0
10,000
20,000
30,000
40,000
50,000
60,000
70,000
80,000
90,000
100,000
Nit
rog
en in
pu
t (t
y-1
)
DK
0
5,000
10,000
15,000
20,000
25,000
30,000
35,000
40,000
45,000
Nit
rog
en in
pu
t (t
y-1
)
EE
0
20,000
40,000
60,000
80,000
100,000
120,000
Nit
rog
en in
pu
t (t
y-1
)
FI
0
20,000
40,000
60,000
80,000
100,000
120,000
140,000N
itro
gen
inp
ut
(t y
-1)
LT
0
20,000
40,000
60,000
80,000
100,000
120,000
140,000
Nit
rog
en in
pu
t (t
y-1
)
LV
0
50,000
100,000
150,000
200,000
250,000
300,000
Nit
rog
en in
pu
t (t
y-1
)
PL
0
10,000
20,000
30,000
40,000
50,000
60,000
70,000
80,000
90,000
100,000
Nit
rog
en in
pu
t (t
y-1
)
RU
0
20,000
40,000
60,000
80,000
100,000
120,000
140,000
160,000
180,000
Nit
rog
en in
pu
t (t
y-1
)
SE
0
100,000
200,000
300,000
400,000
500,000
600,000
700,000
800,000
900,000
1,000,000
Nit
rog
en in
pu
t (t
y-1
)
All
N direct N river trend N total
Figure 2.4a. Actual annual total riverine + direct (waterborne) nitrogen inputs by Contracting Party to the Baltic Sea and the total inputs to the Baltic Sea. The trend for the fl ow normalized waterborne total nitrogen input is inserted as a line to indicate a possible trend (solid line = a statistically signifi cant trend; dotted line = no statistically signifi cant trend; see further explanations in Chapter 2.4). See note to Table 2.2 regarding the pre-conditions on the PLC-5.5 data set.
15
Revi
ew o
f th
e Fi
fth
Balti
c Se
a Po
llutio
n Lo
ad C
ompi
latio
n
0
200
400
600
800
1,000
1,200Ph
osp
ho
rus
inp
ut
(t y
-1)
DE
0
500
1,000
1,500
2,000
2,500
3,000
3,500
4,000
4,500
Pho
sph
oru
s in
pu
t (t
y-1
)
DK
0
200
400
600
800
1,000
1,200
Pho
sph
oru
s in
pu
t (t
y-1
)
EE
0
1,000
2,000
3,000
4,000
5,000
6,000
Pho
sph
oru
s in
pu
t (t
y-1
)
FI
0
500
1,000
1,500
2,000
2,500
3,000
3,500
4,000
4,500
Pho
sph
oru
s in
pu
t (t
y-1
)
LT
0
1,000
2,000
3,000
4,000
5,000
6,000
7,000
8,000
9,000
Pho
sph
oru
s in
pu
t (t
y-1
)
RU
0
500
1,000
1,500
2,000
2,500
3,000
3,500
Pho
sph
oru
s in
pu
t (t
y-1
)
LV
0
2,000
4,000
6,000
8,000
10,000
12,000
14,000
16,000
18,000
Pho
sph
oru
s in
pu
t (t
y-1
)
PL
0
500
1,000
1,500
2,000
2,500
3,000
3,500
4,000
4,500
5,000
Pho
sph
oru
s in
pu
t (t
y-1
)
SE
0
5,000
10,000
15,000
20,000
25,000
30,000
35,000
40,000
45,000
50,000
Pho
sph
oru
s in
pu
t (t
y-1
)
All
P direct P river trend P total
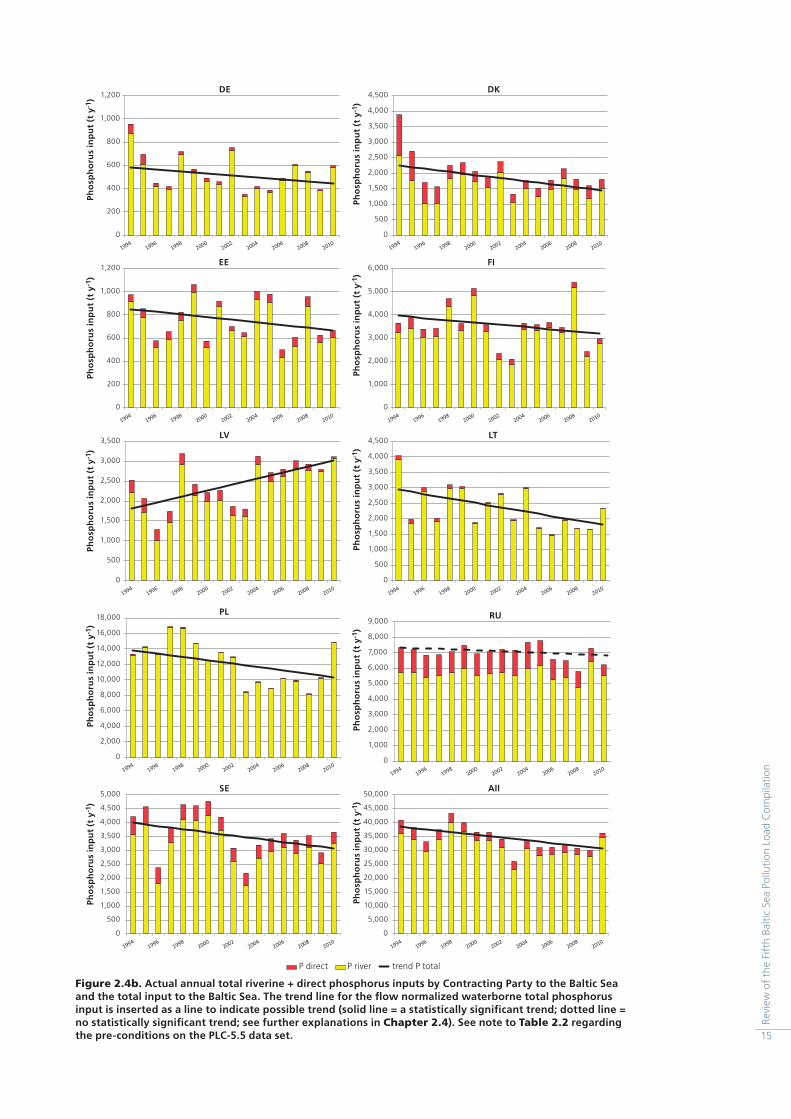
Figure 2.4b. Actual annual total riverine + direct phosphorus inputs by Contracting Party to the Baltic Sea and the total input to the Baltic Sea. The trend line for the fl ow normalized waterborne total phosphorus input is inserted as a line to indicate possible trend (solid line = a statistically signifi cant trend; dotted line = no statistically signifi cant trend; see further explanations in Chapter 2.4). See note to Table 2.2 regarding the pre-conditions on the PLC-5.5 data set.
16
0
10,000
20,000
30,000
40,000
50,000
60,000
70,000
80,000
90,000
Nit
rog
en in
pu
t (t
y-1
)
DS
0
20,000
40,000
60,000
80,000
100,000
120,000
Nit
rog
en in
pu
t (t
y-1
)
GUR
0
10,000
20,000
30,000
40,000
50,000
60,000
70,000
80,000
90,000
Nit
rog
en in
pu
t (t
y-1
)
KAT
0
100,000
200,000
300,000
400,000
500,000
600,000
700,000
800,000
900,000
1,000,000
Nit
rog
en in
pu
t (t
y-1
)
All
N direct N river trend N total
0
10,000
20,000
30,000
40,000
50,000
60,000
70,000
80,000
Nit
rog
en in
pu
t (t
y-1
)
BOB
0
10,000
20,000
30,000
40,000
50,000
60,000
70,000
80,000
90,000
Nit
rog
en in
pu
t (t
y-1
)
BOS
0
100,000
200,000
300,000
400,000
500,000
600,000
Nit
rog
en in
pu
t (t
y-1
)
BAP
0
20,000
40,000
60,000
80,000
100,000
120,000
140,000
Nit
rog
en in
pu
t (t
y-1
)
GUF
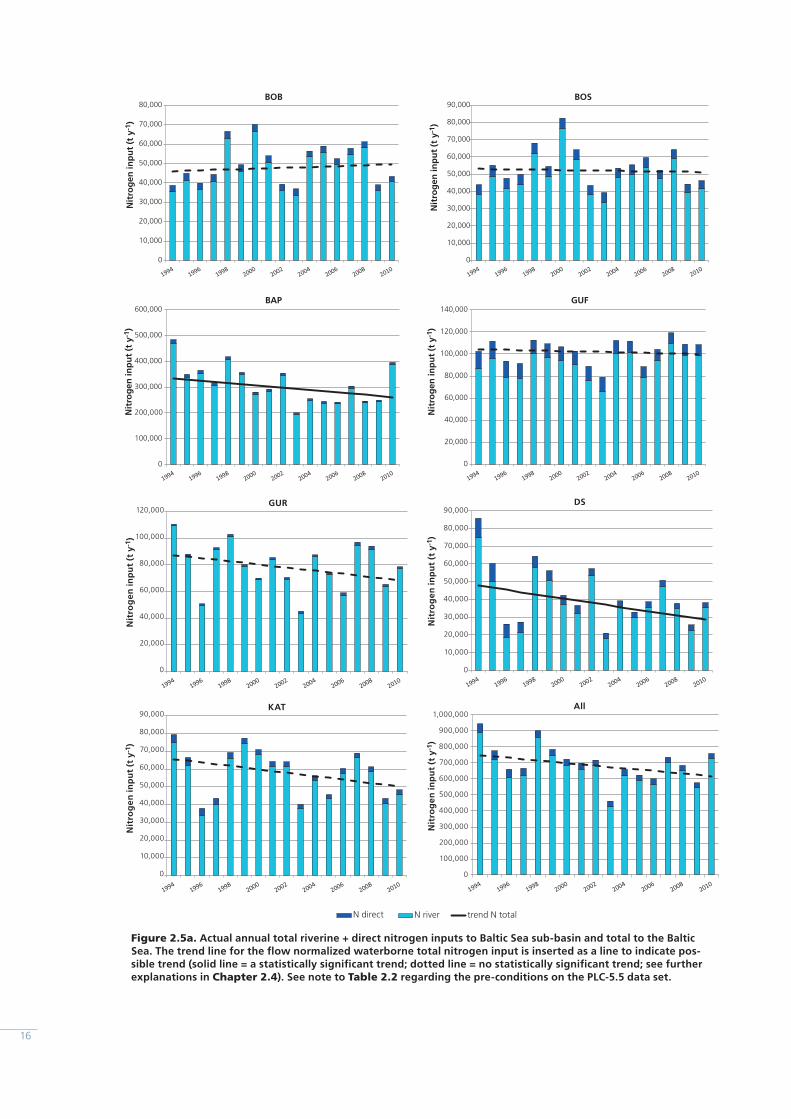
Figure 2.5a. Actual annual total riverine + direct nitrogen inputs to Baltic Sea sub-basin and total to the Baltic Sea. The trend line for the fl ow normalized waterborne total nitrogen input is inserted as a line to indicate pos-sible trend (solid line = a statistically signifi cant trend; dotted line = no statistically signifi cant trend; see further explanations in Chapter 2.4). See note to Table 2.2 regarding the pre-conditions on the PLC-5.5 data set.
17
Revi
ew o
f th
e Fi
fth
Balti
c Se
a Po
llutio
n Lo
ad C
ompi
latio
n
0
500
1,000
1,500
2,000
2,500
3,000
3,500
4,000
Pho
sph
oru
s in
pu
t (t
y-1
)
BOB
0
500
1,000
1,500
2,000
2,500
3,000
3,500
4,000
Pho
sph
oru
s in
pu
t (t
y-1
)
BOS
0
5,000
10,000
15,000
20,000
25,000
Pho
sph
oru
s in
pu
t (t
y-1
)
BAP
0
500
1,000
1,500
2,000
2,500
3,000
3,500
Pho
sph
oru
s in
pu
t (t
y-1
)
DS
0
1,000
2,000
3,000
4,000
5,000
6,000
7,000
8,000
9,000
Pho
sph
oru
s in
pu
t (t
y-1
)
GUF
0
500
1,000
1,500
2,000
2,500
3,000
3,500
Pho
sph
oru
s in
pu
t (t
y-1
)
GUR
0
500
1,000
1,500
2,000
2,500
Pho
sph
oru
s in
pu
t (t
y-1
)
KAT
0
5,000
10,000
15,000
20,000
25,000
30,000
35,000
40,000
45,000
50,000
Pho
sph
oru
s in
pu
t (t
y-1
)
All
P direct P river trend P total
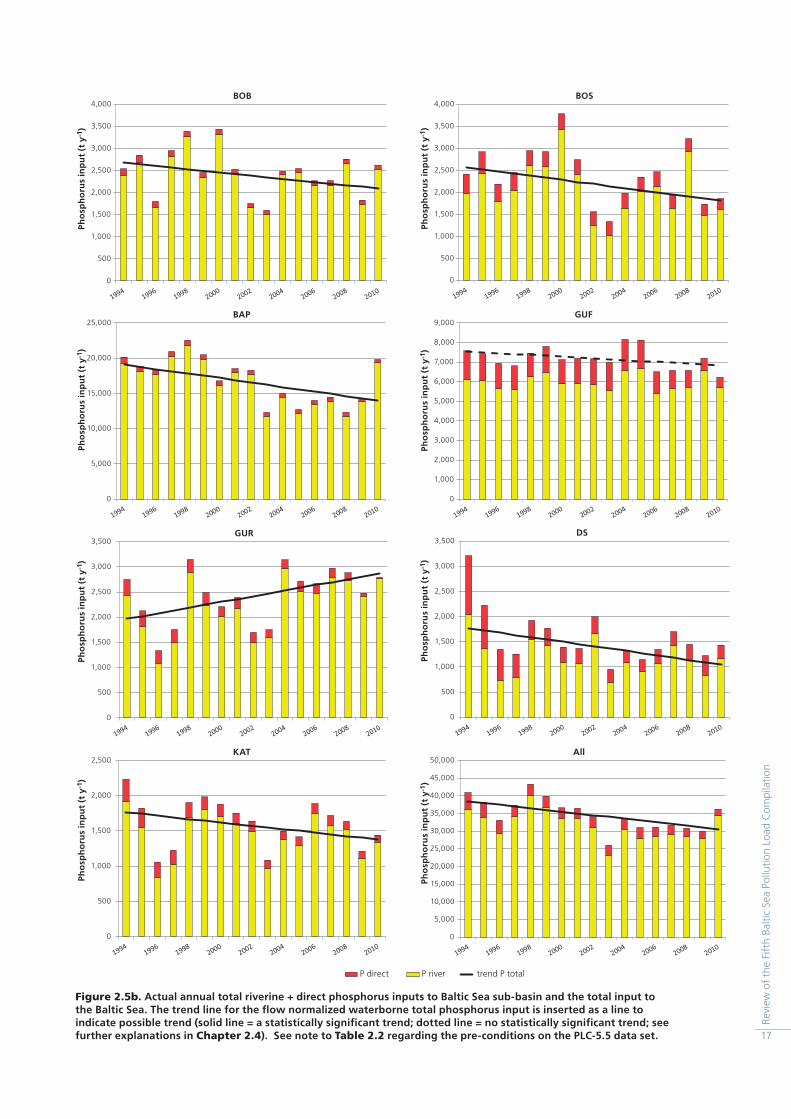
Figure 2.5b. Actual annual total riverine + direct phosphorus inputs to Baltic Sea sub-basin and the total input to the Baltic Sea. The trend line for the fl ow normalized waterborne total phosphorus input is inserted as a line to indicate possible trend (solid line = a statistically signifi cant trend; dotted line = no statistically signifi cant trend; see further explanations in Chapter 2.4). See note to Table 2.2 regarding the pre-conditions on the PLC-5.5 data set.
18
Contracting Party will be included in the PLC-5.5 report (HELCOM, in prep).
The proportion of direct inputs to the Baltic Sea constitutes only a small share of the total input to the Baltic Sea sub-basins (7% of total nitrogen and 11% of total phosphorus at the beginning of the period and 5% and 7%, respectively at the end of the period). Comparison between the Contracting Parties and between years for some of the given
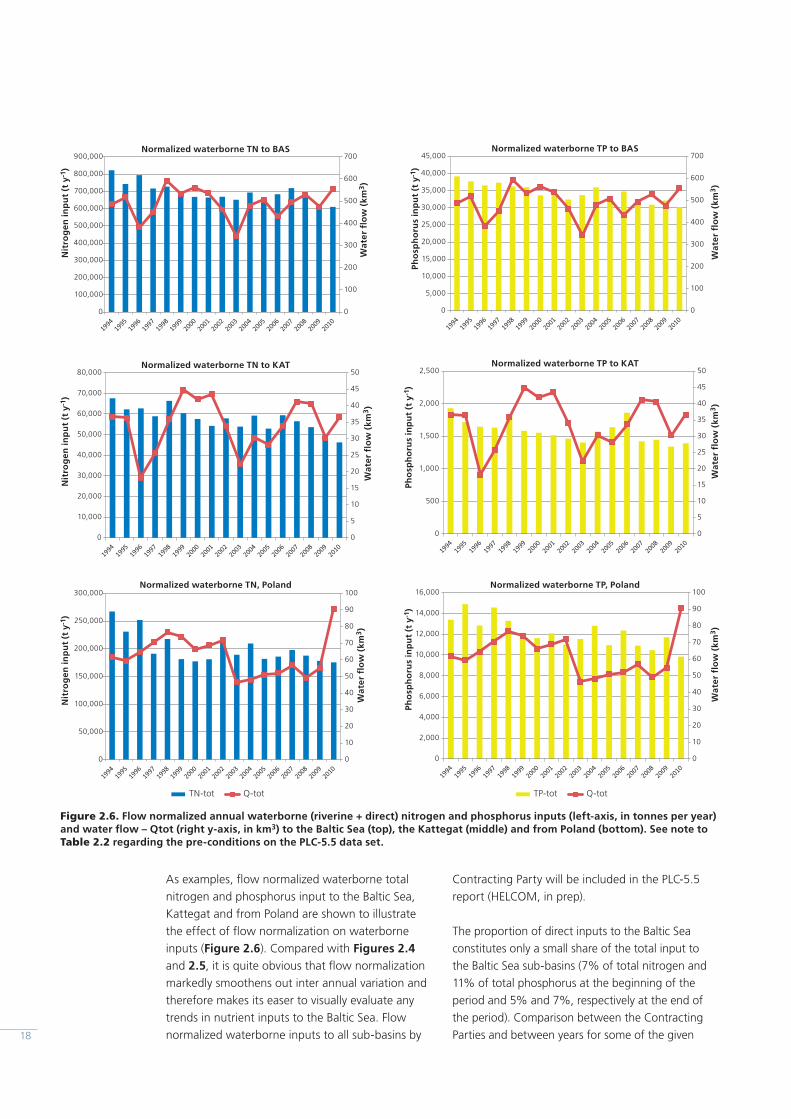
As examples, fl ow normalized waterborne total nitrogen and phosphorus input to the Baltic Sea, Kattegat and from Poland are shown to illustrate the effect of fl ow normalization on waterborne inputs (Figure 2.6). Compared with Figures 2.4 and 2.5, it is quite obvious that fl ow normalization markedly smoothens out inter annual variation and therefore makes its easer to visually evaluate any trends in nutrient inputs to the Baltic Sea. Flow normalized waterborne inputs to all sub-basins by
0
100
200
300
400
500
600
700
0
100,000
200,000
300,000
400,000
500,000
600,000
700,000
800,000
900,000
Wat
er f
low
(km
3 )
Nit
rog
en in
pu
t (t
y-1
)
Normalized waterborne TN to BAS
0
100
200
300
400
500
600
700
0
5,000
10,000
15,000
20,000
25,000
30,000
35,000
40,000
45,000
Wat
er f
low
(km
3 )
Pho
sph
oru
s in
pu
t (t
y-1
)
Normalized waterborne TP to BAS
0
5
10
15
20
25
30
35
40
45
50
0
10,000
20,000
30,000
40,000
50,000
60,000
70,000
80,000W
ater
flo
w (
km3 )
Nit
rog
en in
pu
t (t
y-1
)
Normalized waterborne TN to KAT
0
5
10
15
20
25
30
35
40
45
50
0
500
1,000
1,500
2,000
2,500
Wat
er f
low
(km
3 )
Pho
sph
oru
s in
pu
t (t
y-1
)
Normalized waterborne TP to KAT
0
10
20
30
40
50
60
70
80
90
100
0
50,000
100,000
150,000
200,000
250,000
300,000
Wat
er f
low
(km
3 )
Nit
rog
en in
pu
t (t
y-1
)
Normalized waterborne TN, Poland
0
10
20
30
40
50
60
70
80
90
100
0
2,000
4,000
6,000
8,000
10,000
12,000
14,000
16,000
Wat
er f
low
(km
3 )
Pho
sph
oru
s in
pu
t (t
y-1
)
Normalized waterborne TP, Poland
TN-tot Q-tot TP-tot Q-tot
Figure 2.6. Flow normalized annual waterborne (riverine + direct) nitrogen and phosphorus inputs (left-axis, in tonnes per year) and water fl ow – Qtot (right y-axis, in km3) to the Baltic Sea (top), the Kattegat (middle) and from Poland (bottom). See note to Table 2.2 regarding the pre-conditions on the PLC-5.5 data set.
19
Revi
ew o
f th
e Fi
fth
Balti
c Se
a Po
llutio
n Lo
ad C
ompi
latio
n
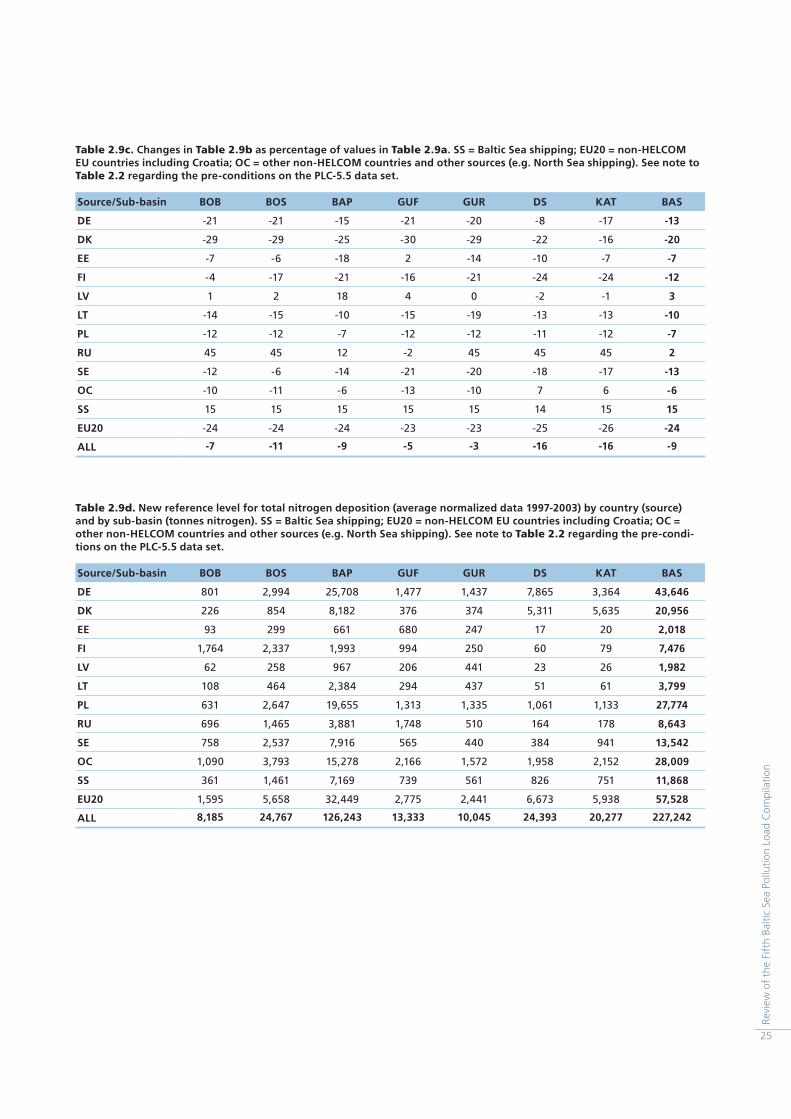
Normalized annual total nitrogen atmospheric deposition is reduced with statistical signifi cance (confi dence < 5%) for six Contracting Parties and from non-HELCOM EU countries (EU20), and other countries and sources (OC) (Table 2.3). The reduction to the Baltic Sea is 24% from 1995-2010 or more than 50,000 tonnes of nitro-gen. Denmark has the highest relative reduc-tion (40%), but also Finland, Germany, Poland, Sweden and the EU20 show marked reductions of between 23-34%. Atmospheric total nitrogen deposition from Russia and Baltic Sea shipping (SS) increased signifi cantly, with 34% and 44% respectively, during the period.
Denmark, Germany, Poland and Sweden reduced their fl ow normalized total waterborne (riverine + direct) nitrogen input considerably (36%, 19%, 26% and 15%, respectively) from 1994 to 2010. These reductions are all statistically signifi cant10 as was the total input to the Baltic Sea (17%). Latvia and Lithuania also showed signifi cant decreases but only with a confi dence of between 5-10%; the Latvian data, however, must be interpreted with caution as the data from later years have been estimated due to the lack of reported data. The results from Lithuania are also infl uenced by very high fl ow normalized nitrogen inputs in 1994. Only Denmark (32%), Poland (26%) and Sweden (12%) show signifi cant decreases with less than 5% con-fi dence for fl ow normalized riverine inputs. Results of the trend analyses on direct inputs are included in Chapter 4. The total normalized nitrogen (waterborne + atmospheric) inputs to the Baltic Sea were signifi cantly reduced with 16% from 1994 to 2010; Denmark (34%), Germany (23%), Poland (19%) and Sweden (15%) have also signifi cantly reduced their combined airborne and waterborne inputs.
Flow normalized total phosphorus waterborne (riverine + direct) inputs were signifi cantly reduced from all Contracting Parties and to the Baltic Sea (20%), except for Latvia where it increased signifi -cantly with 69%. As mentioned above, Latvian data are rather uncertain for 2008-2010 (Table 2.4). Denmark (34%), Lithuania (38%) and Poland (25%)
10 Changes in percentages have been calculated on normalized inputs as ((value 2010 – value 1994)/value 1994)*100% (for atmospheric input 1995 instead of 1994) when the statistical analysis indicated signifi cant trend. The trends are statistically signifi cant while the change in percentages should be interpreted as an estimated change from the beginning to the end the period 1994 (1995)-2010 on the normalized data series.
time series must be made with caution (Figures 2.4 and 2.5). The Contracting Parties have not com-piled direct inputs in the same way and changes in methodology during the period 1994-2010 cannot be ruled out, e.g. including some point sources as a part of the riverine inputs some years and in the direct inputs in other years. Poland and Latvia are examples of countries that have a very low propor-tion of direct inputs of nitrogen and phosphorus (for both 0-1% only). Chapter 4 provides further details on direct inputs and Chapter 2.4 elaborates on the trends in direct inputs.
2.4 Trend analysis for water- and airborne inputs
A trend analysis study has been carried out by DCE, Aarhus University (Denmark), using Mann-Kendall methodology (Hirsch et al, 1982) on annual fl ow normalized riverine inputs (A); direct inputs (B); fl ow normalized waterborne inputs (C=A+B); normalized airborne inputs (D); and the total normalized inputs (E=C+D) of nitrogen and phosphorus for all relevant combinations of Con-tracting Parties and main sub-basins of the Baltic Sea. Where there is a signifi cant trend, the annual changes were deducted with a Theil-Sen slope estimator (Hirsch et al., 1982) and the change from 1994 to 2010 was calculated (1995-2010 for airborne inputs). The methodology follows agreements by HELCOM LOAD (more information on trend analysis and determining the changes in input can be found in Larsen & Svendsen, in prep). The results of these statistical analyses for the Contracting Parties and main sub-basins are summarized in Tables 2.3 to 2.6. The graphs give the estimated slopes and percentage changes in inputs of nitrogen and phosphorus from 1994 to 2010 (for airborne input 1995-2010) for cases with a statistically signifi cant trend with a confi dence value less than 5%.9 The fi gures in parentheses indicate results with confi dence levels between 5-10%. No trend analyses were carried out on airborne phosphorus inputs as the same value (deposition rate) is used throughout the period 1995-2010.
9 The null hypothesis tested whether there is no linear trend in a data series. This means that if the test shows a low confi dence (< 5%), the hypothesis is rejected and there is a high statistical certainty of a linear trend.
20
malized waterborne phosphorus inputs to the Baltic Sea, as these are reduced with 49% compared with the 16% reduction on fl ow normalized riverine phosphorus inputs.
have the highest reductions in total fl ow normalized waterborne phosphorus inputs from 1994 to 2010. Reductions in direct phosphorus inputs play a rather important role for the reduction of total fl ow nor-
Table 2.3. Estimates of slope (annual change in tonnes per year) and percentage of change (calculated on normalized values as (((value 2010 – value 1994)/value 1994)) *100%) for the analyzed period of annual normalized airborne inputs, fl ow normalized riverine inputs, waterborne inputs (= direct + riverine inputs) and total normalized inputs of total nitro-gen from the Contracting Parties and total inputs to the Baltic Sea (BAS) from 1994 to 2010 (airborne 1995 to 2010) based on a statistical trend analysis. Normalized airborne nitrogen deposition inputs from Baltic Sea shipping (SS), the EU20 (non-HELCOM EU countries including Croatia) and other sources such as other countries, North Sea shipping etc. (OC) are also included. Only the results where the trend is statistically signifi cant (confi dence < 5%) are shown (see footnotes 9 and 10); results are given in parentheses where the confi dence is between 5-10%. See note to Table 2.2 regarding the pre-conditions on the PLC-5.5 data set.
Airborne inputs Riverine inputs Waterborne inputs Total nitrogen inputs
Estimatedslope
Changesince 1995
Estimatedslope
Changesince 1994
Estimatedslope
Changesince 1994
EstimatedSlope
Changesince 1994
t N y-1 % t N y-1 % t N y-1 % t N y-1 %
DE -821 -25 - - -271 -19 -1,041 -23
DK -649 -40 -1,064 -32 -1291 -36 -1,851 -35
EE -15 -10 - - - - - -
FI -127 -23 - - - - - -
LV - - (-1,142) (-22) (-1,105) (-21) - -
LT - - (-1,263) (-39) (-1,309) (-39) - -
PL -599 -29 -3,525 -26 -3,550 -26 -3,128 -20
RU 212 44 - - - - - -
SE -313 -31 -872 -12 -1,163 -15 -1,422 -15
SS 230 34 230 34
EU20 -1,503 -34 -1,503 -34
OC -296 -15 -296 -15
BAS -3,895 -24 -7,207 -16 -8,139 -17 -10,428 -16
Table 2.4. Estimates of slope (annual change in tonnes per year) and percentage of change (see caption in Table 2.3) of the analyzed period of annual fl ow normalized riverine inputs, waterborne inputs (= riverine + direct inputs) and total normalized inputs of total phosphorus from the Contracting Parties and the total to the Baltic Sea (BAS) from 1994 to 2010 (airborne 1995 to 2010) from statistical trend analysis. As atmospheric phosphorus deposition is assumed constant during 1994-2010, the slope and change is zero and is thus not shown in the table (total deposition of phosphorus is nearly 2,100 tonnes). Only the results where the trend is statistically signifi cant (confi dence < 5%) are shown (see footnotes 9 and 10); the results where the confi dence is between 5-10% are in parentheses. See note to Table 2.2 regarding the pre-conditions on the PLC-5.5 data set.
Airborne inputs Riverine inputs Waterborne inputs Total phosphorus inputs
Estimatedslope
Changesince 1995
Estimatedslope
Changesince 1994
EstimatedSlope
Changesince 1994
EstimatedSlope
Changesince 1994
t P y-1 % t P y-1 % t P y-1 % t P y-1 %
DE (-5.5) (-16) -8.55 -23 -7.5 -20
DK -23.2 -21 -49.2 -34 -41.8 -29
EE -12.9 -26 (-11.5) (-21) - -
FI (-32) (-15) -48.2 -19 -45.1 -17
LV 85.6 100 74.9 69 86 75
LT -63.4 -36 -71 -38 (-61) (-33)
PL -215 -24 -220 -25 -224 -24
RU - - - - - -
SE -48.6 -22 -57.5 -23 -48.2 -18
BAS -354 -16 -499 -20 -476 -18
21
Revi
ew o
f th
e Fi
fth
Balti
c Se
a Po
llutio
n Lo
ad C
ompi
latio
n
For total normalized waterborne phosphorus inputs, signifi cant decreases were calculated for the Bothnian Sea (28%), the Baltic Proper (26%), the Danish Straits (40%), and the Kattegat (22%). A signifi cant decrease was also calculated for the Bothnian Bay (21%) but here the confi dence level was between 5-10%. On the other hand, inputs increased with more than 50% to the Gulf of Riga (Latvia data are rather uncertain, especially for 2008-2010) and no signifi cant trends were detected for the Gulf of Finland (Table 2.6.)
Normalized total nitrogen atmospheric deposition decreased signifi cantly to all seven Baltic Sea sub-basins (18-27%) from 1995 to 2010 (Table 2.5) and with 24% to the Baltic Sea. The Kattegat, the Danish Straits and the Baltic Proper also show a statistically signifi cant decrease for both fl ow normalized riverine (21-29%) and waterborne (22-39%) nitrogen inputs from 1994 to 2010, while all sub-basins, except the Bothnian Sea and the Gulf of Riga, show a signifi cant reduction in total nor-malized nitrogen inputs from 1994 to 2010.
Table 2.5. Estimates of slope (annual change in tonnes per year) and percentage of change (calculated on normalized values as (((value 2010 – value 1994)/value 1994) *100%) for the analyzed period of annual normalized airborne inputs, fl ow normalized riverine inputs, waterborne inputs (= direct + riverine inputs) and total normalized inputs of total nitro-gen by sub-basin and total inputs to the Baltic Sea (BAS) from 1994 to 2010 (airborne 1995 to 2010) based on a statistical trend analysis (see caption of Table 2.3). Only results where the trend is statistically signifi cant (confi dence < 5%) are shown (see footnotes 9 and 10); results where the confi dence is between 5-10% are given in parentheses. See note to Table 2.2 regarding the pre-conditions on the PLC-5.5 data set.
Airborne inputs Riverine inputs Waterborne inputs Total nitrogen inputs
Estimatedslope
Changesince 1995
Estimatedslope
Changesince 1994
Estimatedslope
Changesince 1994
Estimatedslope
Changesince 1994
t N y-1 % t N y-1 % t N y-1 % t N y-1 %
BOB -114 -20 - - - - - -
BOS -391 -22 - - - - -654 -12
BAP -2206 -24 -4,256 -21 -4,655 -22 -6,077 -20
GUF -177 -18 - - - - -516 -6
GUR -160 -22 - - - - - -
DS -461 -26 -750 -29 -1,200 -39 -1,594 -32
KAT -410 -27 -874 -22 -968 -23 -1,358 -23
BAS -3,895 -24 -7,207 -16 -8,139 -17 -10,428 -16
Table 2.6. Estimates of slope (annual change in tonnes per year) and percentage of change (see caption in Table 2.3) of the analyzed period of annual fl ow normalized riverine inputs, waterborne inputs (= riverine + direct inputs) and total normalized inputs of total phosphorus by sub-basin and the total to the Baltic Sea (BAS) from 1994 to 2010 (airborne 1995 to 2010) from statistical trend analysis (see caption of Table 2.4). Only results where the trend is statistically signifi cant (confi dence < 5%) are shown (see footnotes 9 and 10); results where the confi dence is between 5-10% are given in paren-theses. See note to Table 2.2 regarding the pre-conditions on the PLC-5.5 data set.
Airborne inputs Riverine inputs Waterborne inputs Total phosphorus inputs
Estimatedslope
Changesince 1995
Estimatedslope
Changesince 1994
EstimatedSlope
Changesince 1994
Estimatedslope
Changesince 1994
t P y-1 % t P y-1 % t P y-1 % t P y-1 %
BOB (-33) (-21) (-36,3) (-21) - -
BOS -35 -25 -45.8 -28 -47.1 -24
BAP -297 -25 -321 -26 -331 -24
GUF - - - - - -
GUR 68.8 69 56.2 47 76.2 63
DS -17.8 -23 -44.9 -40 -35.9 -30
KAT -14.4 -15 -24.2 -22 -21.2 -17
BAS -354 -16 -499 -20 -476 -18
22
Denmark has the highest reduction in nitrogen and phosphorus input to different Baltic Sea sub-basins.
Atmospheric nitrogen deposition from Baltic Sea shipping has signifi cantly increased to all sub-basins, but has signifi cantly decreased from the EU20. For other countries (OC), there is a decrease to fi ve sub-basins. There is an increase in deposi-tion to the Kattegat and the Danish Straits, which partly might relate to higher deposition caused by North Sea shipping.
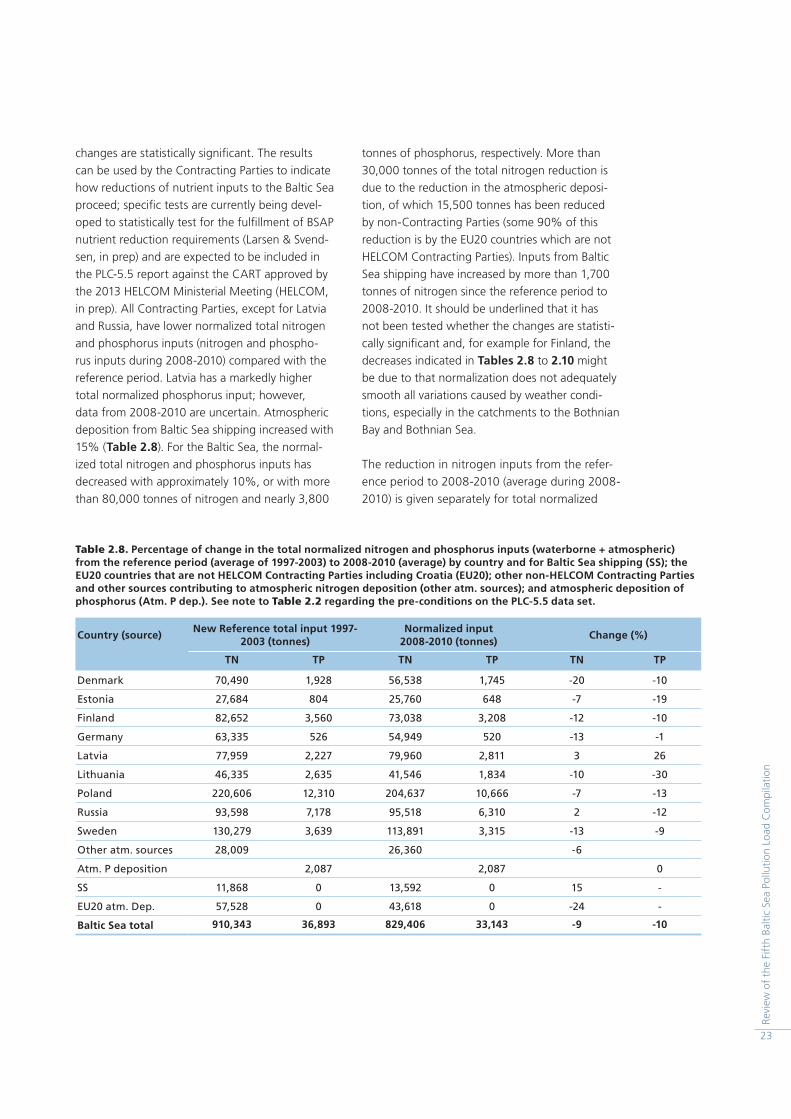
The average normalized total airborne plus water-borne inputs of total nitrogen and phosphorus during 2008-2010 are compared with the cor-responding normalized reference inputs from Table 2.2 and aggregated by country in Table 2.8, and by country and sub-basin in Table 2.9 (total nitrogen) and Table 2.10 (total phosphorus). The percentage of change since the reference period is calculated; however, it is not tested whether these
Table 2.7 shows statistically signifi cant changes in the total inputs of nitrogen and phosphorus from 1994 to 2010 for all relevant countries by sub-basin. The results of the trend test, slope estimator and changes from 1994 to 2010 for all country by sub-basin combinations are included in the PLC-5.5 report (HELCOM, in prep). Denmark, Germany (with exception of total phosphorus to the Baltic Proper) and Poland are the only Contracting Parties with sig-nifi cant reductions of total nitrogen and total phos-phorus to all the main Baltic Sea sub-basins they have inputs to. Finland and Sweden have signifi cant reductions of total nitrogen and phosphorus inputs to most sub-basins, but only partly to the Bothnian Bay and the Bothnian Sea; for Sweden, the reduc-tion in total phosphorus inputs to the Kattegat is not signifi cant. Latvia and Russia have either signifi cant increases or no trends in total nitrogen and phos-phorus inputs to Baltic Sea sub-basins; Lithuania has no trend in nitrogen and phosphorus inputs except for total phosphorus to the Baltic Proper. Overall,
Table 2.7. Signifi cant changes in total normalized nitrogen and phosphorus inputs (waterborne + atmospheric) to the Baltic Sea by country and by sub-basin from 1994 to 2010. For phosphorus, results are only given for cases when a country has waterborne inputs entering to a sub-basin. Only results where the trend is statistically signifi cant (confi dence < 5%) are shown (see footnotes 9 and 10); results where the confi dence is between 5-10% are given in parentheses. See note to Table 2.2 regarding the pre-conditions on the PLC-5.5 data set. (SS = Baltic Sea shipping, EU20 = non-HELCOM EU coun-tries including Croatia, OC = and other sources such as other countries, North Sea shipping etc., n.i. = no inputs from the Contracting Party to this sub-basin.)
BOB BOS BAP GUF GUR DS KAT
N % P % N % P % N % P% N % P % N % P % N % P % N % P %
DE -29 n.i -29 n.i. -19 - -29 n.i. -29 n.i. -26 -23 -26 n.i.
DK -42 n.i -42 n.i. -40 -27 -42 n.i. -42 n.i. -38 -32 -29 -23
EE -11 n.i -11 n.i. (-18) - - - - - -11 n.i. -7.7 n.i.
FI - -18 - (-19) -32 n.i. -20 - -33 n.i. -37 n.i. -37 n.i.
LV - n.i. - n.i - 88 - n.i. - 72 - n.i. - n.i.
LT - n.i. - n.i. - (-33) - n.i. - n.i. - n.i. - n.i.
PL -28 n.i. -29 n.i. -19 -24 -28 n.i -29 n.i. -27 n.i. -28 n.i
RU 41 n.i 44 n.i. 10 - - - 44 n.i. 44 n.i. 43 n.i.
SE - - - -28 -19 -20 -37 n.i. -39 n.i. -38 -26 -18 -
SS 34 34 34 34 34 34 34
EU20 -34 -33 -34 -33 -33 -33 -36
OC -21 -23 -16 -28 -24 10 8.8
23
Revi
ew o
f th
e Fi
fth
Balti
c Se
a Po
llutio
n Lo
ad C
ompi
latio
n
tonnes of phosphorus, respectively. More than 30,000 tonnes of the total nitrogen reduction is due to the reduction in the atmospheric deposi-tion, of which 15,500 tonnes has been reduced by non-Contracting Parties (some 90% of this reduction is by the EU20 countries which are not HELCOM Contracting Parties). Inputs from Baltic Sea shipping have increased by more than 1,700 tonnes of nitrogen since the reference period to 2008-2010. It should be underlined that it has not been tested whether the changes are statisti-cally signifi cant and, for example for Finland, the decreases indicated in Tables 2.8 to 2.10 might be due to that normalization does not adequately smooth all variations caused by weather condi-tions, especially in the catchments to the Bothnian Bay and Bothnian Sea.
The reduction in nitrogen inputs from the refer-ence period to 2008-2010 (average during 2008-2010) is given separately for total normalized
changes are statistically signifi cant. The results can be used by the Contracting Parties to indicate how reductions of nutrient inputs to the Baltic Sea proceed; specifi c tests are currently being devel-oped to statistically test for the fulfi llment of BSAP nutrient reduction requirements (Larsen & Svend-sen, in prep) and are expected to be included in the PLC-5.5 report against the CART approved by the 2013 HELCOM Ministerial Meeting (HELCOM, in prep). All Contracting Parties, except for Latvia and Russia, have lower normalized total nitrogen and phosphorus inputs (nitrogen and phospho-rus inputs during 2008-2010) compared with the reference period. Latvia has a markedly higher total normalized phosphorus input; however, data from 2008-2010 are uncertain. Atmospheric deposition from Baltic Sea shipping increased with 15% (Table 2.8). For the Baltic Sea, the normal-ized total nitrogen and phosphorus inputs has decreased with approximately 10%, or with more than 80,000 tonnes of nitrogen and nearly 3,800
Table 2.8. Percentage of change in the total normalized nitrogen and phosphorus inputs (waterborne + atmospheric) from the reference period (average of 1997-2003) to 2008-2010 (average) by country and for Baltic Sea shipping (SS); the EU20 countries that are not HELCOM Contracting Parties including Croatia (EU20); other non-HELCOM Contracting Parties and other sources contributing to atmospheric nitrogen deposition (other atm. sources); and atmospheric deposition of phosphorus (Atm. P dep.). See note to Table 2.2 regarding the pre-conditions on the PLC-5.5 data set.
Country (source)New Reference total input 1997-
2003 (tonnes)Normalized input
2008-2010 (tonnes)Change (%)
TN TP TN TP TN TP
Denmark 70,490 1,928 56,538 1,745 -20 -10
Estonia 27,684 804 25,760 648 -7 -19
Finland 82,652 3,560 73,038 3,208 -12 -10
Germany 63,335 526 54,949 520 -13 -1
Latvia 77,959 2,227 79,960 2,811 3 26
Lithuania 46,335 2,635 41,546 1,834 -10 -30
Poland 220,606 12,310 204,637 10,666 -7 -13
Russia 93,598 7,178 95,518 6,310 2 -12
Sweden 130,279 3,639 113,891 3,315 -13 -9
Other atm. sources 28,009 26,360 -6
Atm. P deposition 2,087 2,087 0
SS 11,868 0 13,592 0 15 -
EU20 atm. Dep. 57,528 0 43,618 0 -24 -
Baltic Sea total 910,343 36,893 829,406 33,143 -9 -10
24
detailed information on nutrient reductions and the data can be compared with the input ceilings for Contracting Parties and sub-basins which are calculated based on the MAI and CART which were agreed on by the 2013 HELCOM Ministerial Meeting. Overall the development in nitrogen and phosphorus inputs is rather comparable with the corresponding development from 1994 to 2010.
inputs (Table 2.9c) and for atmospheric deposi-tion (Table 2.9e).
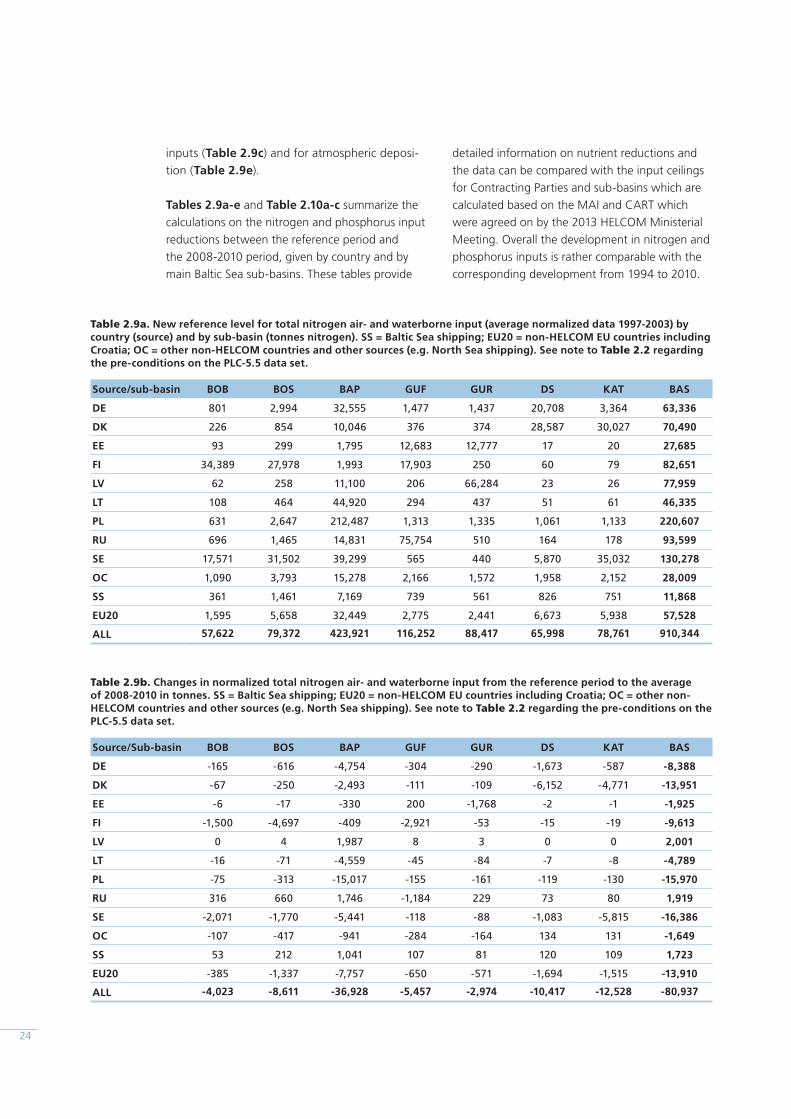
Tables 2.9a-e and Table 2.10a-c summarize the calculations on the nitrogen and phosphorus input reductions between the reference period and the 2008-2010 period, given by country and by main Baltic Sea sub-basins. These tables provide
Table 2.9a. New reference level for total nitrogen air- and waterborne input (average normalized data 1997-2003) by country (source) and by sub-basin (tonnes nitrogen). SS = Baltic Sea shipping; EU20 = non-HELCOM EU countries including Croatia; OC = other non-HELCOM countries and other sources (e.g. North Sea shipping). See note to Table 2.2 regarding the pre-conditions on the PLC-5.5 data set.
Source/sub-basin BOB BOS BAP GUF GUR DS KAT BAS
DE 801 2,994 32,555 1,477 1,437 20,708 3,364 63,336
DK 226 854 10,046 376 374 28,587 30,027 70,490
EE 93 299 1,795 12,683 12,777 17 20 27,685
FI 34,389 27,978 1,993 17,903 250 60 79 82,651
LV 62 258 11,100 206 66,284 23 26 77,959
LT 108 464 44,920 294 437 51 61 46,335
PL 631 2,647 212,487 1,313 1,335 1,061 1,133 220,607
RU 696 1,465 14,831 75,754 510 164 178 93,599
SE 17,571 31,502 39,299 565 440 5,870 35,032 130,278
OC 1,090 3,793 15,278 2,166 1,572 1,958 2,152 28,009
SS 361 1,461 7,169 739 561 826 751 11,868
EU20 1,595 5,658 32,449 2,775 2,441 6,673 5,938 57,528
ALL 57,622 79,372 423,921 116,252 88,417 65,998 78,761 910,344
Table 2.9b. Changes in normalized total nitrogen air- and waterborne input from the reference period to the average of 2008-2010 in tonnes. SS = Baltic Sea shipping; EU20 = non-HELCOM EU countries including Croatia; OC = other non-HELCOM countries and other sources (e.g. North Sea shipping). See note to Table 2.2 regarding the pre-conditions on the PLC-5.5 data set.
Source/Sub-basin BOB BOS BAP GUF GUR DS KAT BAS
DE -165 -616 -4,754 -304 -290 -1,673 -587 -8,388
DK -67 -250 -2,493 -111 -109 -6,152 -4,771 -13,951
EE -6 -17 -330 200 -1,768 -2 -1 -1,925
FI -1,500 -4,697 -409 -2,921 -53 -15 -19 -9,613
LV 0 4 1,987 8 3 0 0 2,001
LT -16 -71 -4,559 -45 -84 -7 -8 -4,789
PL -75 -313 -15,017 -155 -161 -119 -130 -15,970
RU 316 660 1,746 -1,184 229 73 80 1,919
SE -2,071 -1,770 -5,441 -118 -88 -1,083 -5,815 -16,386
OC -107 -417 -941 -284 -164 134 131 -1,649
SS 53 212 1,041 107 81 120 109 1,723
EU20 -385 -1,337 -7,757 -650 -571 -1,694 -1,515 -13,910
ALL -4,023 -8,611 -36,928 -5,457 -2,974 -10,417 -12,528 -80,937
25
Revi
ew o
f th
e Fi
fth
Balti
c Se
a Po
llutio
n Lo
ad C
ompi
latio
n
Table 2.9c. Changes in Table 2.9b as percentage of values in Table 2.9a. SS = Baltic Sea shipping; EU20 = non-HELCOM EU countries including Croatia; OC = other non-HELCOM countries and other sources (e.g. North Sea shipping). See note to Table 2.2 regarding the pre-conditions on the PLC-5.5 data set.
Source/Sub-basin BOB BOS BAP GUF GUR DS KAT BAS
DE -21 -21 -15 -21 -20 -8 -17 -13
DK -29 -29 -25 -30 -29 -22 -16 -20
EE -7 -6 -18 2 -14 -10 -7 -7
FI -4 -17 -21 -16 -21 -24 -24 -12
LV 1 2 18 4 0 -2 -1 3
LT -14 -15 -10 -15 -19 -13 -13 -10
PL -12 -12 -7 -12 -12 -11 -12 -7
RU 45 45 12 -2 45 45 45 2
SE -12 -6 -14 -21 -20 -18 -17 -13
OC -10 -11 -6 -13 -10 7 6 -6
SS 15 15 15 15 15 14 15 15
EU20 -24 -24 -24 -23 -23 -25 -26 -24
ALL -7 -11 -9 -5 -3 -16 -16 -9
Table 2.9d. New reference level for total nitrogen deposition (average normalized data 1997-2003) by country (source) and by sub-basin (tonnes nitrogen). SS = Baltic Sea shipping; EU20 = non-HELCOM EU countries including Croatia; OC = other non-HELCOM countries and other sources (e.g. North Sea shipping). See note to Table 2.2 regarding the pre-condi-tions on the PLC-5.5 data set.
Source/Sub-basin BOB BOS BAP GUF GUR DS KAT BAS
DE 801 2,994 25,708 1,477 1,437 7,865 3,364 43,646
DK 226 854 8,182 376 374 5,311 5,635 20,956
EE 93 299 661 680 247 17 20 2,018
FI 1,764 2,337 1,993 994 250 60 79 7,476
LV 62 258 967 206 441 23 26 1,982
LT 108 464 2,384 294 437 51 61 3,799
PL 631 2,647 19,655 1,313 1,335 1,061 1,133 27,774
RU 696 1,465 3,881 1,748 510 164 178 8,643
SE 758 2,537 7,916 565 440 384 941 13,542
OC 1,090 3,793 15,278 2,166 1,572 1,958 2,152 28,009
SS 361 1,461 7,169 739 561 826 751 11,868
EU20 1,595 5,658 32,449 2,775 2,441 6,673 5,938 57,528
ALL 8,185 24,767 126,243 13,333 10,045 24,393 20,277 227,242
26
Table 2.9e. Percentage change in the normalized total nitrogen deposition from the reference period to the average dep-osition of 2008-2010 in tonnes. SS = Baltic Sea shipping; EU20 = non-HELCOM EU countries including Croatia; OC = other non-HELCOM countries and other sources (e.g. North Sea shipping). See note to Table 2.2 regarding the pre-conditions on the PLC-5.5 data set.
Source/Sub-basin BOB BOS BAP GUF GUR DS KAT BAS
DE -21 -21 -18 -21 -20 -14 -17 -17
DK -29 -29 -26 -30 -29 -23 -23 -25
EE -7 -6 -6 -1 0 -10 -7 -4
FI -9 -12 -21 -17 -21 -24 -24 -15
LV 1 2 5 4 13 -2 -1 6
LT -14 -15 -19 -15 -19 -13 -13 -18
PL -12 -12 -13 -12 -12 -11 -12 -13
RU 45 45 45 45 45 45 45 45
SE -20 -19 -16 -21 -20 -18 -16 -17
OC -10 -11 -6 -13 -10 7 6 -6
SS 15 15 15 15 15 14 15 15
EU20 -24 -24 -24 -23 -23 -25 -26 -24
ALL -9 -12 -14 -7 -11 -16 -17 -13
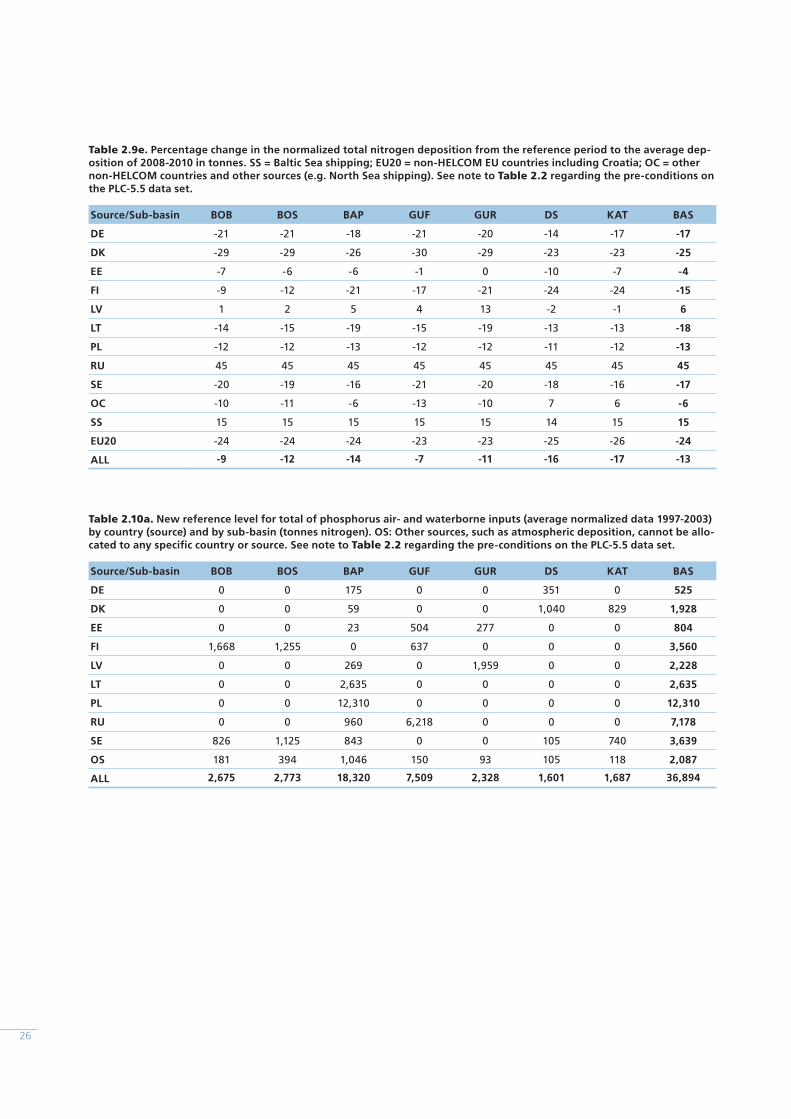
Table 2.10a. New reference level for total of phosphorus air- and waterborne inputs (average normalized data 1997-2003) by country (source) and by sub-basin (tonnes nitrogen). OS: Other sources, such as atmospheric deposition, cannot be allo-cated to any specifi c country or source. See note to Table 2.2 regarding the pre-conditions on the PLC-5.5 data set.
Source/Sub-basin BOB BOS BAP GUF GUR DS KAT BAS
DE 0 0 175 0 0 351 0 525
DK 0 0 59 0 0 1,040 829 1,928
EE 0 0 23 504 277 0 0 804
FI 1,668 1,255 0 637 0 0 0 3,560
LV 0 0 269 0 1,959 0 0 2,228
LT 0 0 2,635 0 0 0 0 2,635
PL 0 0 12,310 0 0 0 0 12,310
RU 0 0 960 6,218 0 0 0 7,178
SE 826 1,125 843 0 0 105 740 3,639
OS 181 394 1,046 150 93 105 118 2,087
ALL 2,675 2,773 18,320 7,509 2,328 1,601 1,687 36,894
27
Revi
ew o
f th
e Fi
fth
Balti
c Se
a Po
llutio
n Lo
ad C
ompi
latio
n
Table 2.10b. Changes in the normalized total phosphorus air- and waterborne inputs from the reference period to the average of 2008-2010 in tonnes. OS: Other sources, such as atmospheric deposition, cannot be allocated to any specifi c country or source. See note to Table 2.2 regarding the pre-conditions on the PLC-5.5 data set.
Source/Sub-basin BOB BOS BAP GUF GUR DS KAT BAS
DE 0 0 8 0 0 -14 0 -5
DK 0 0 -8 0 0 -72 -103 -184
EE 0 0 0 -99 -57 0 0 -156
FI -184 -135 0 -32 0 0 0 -352
LV 0 0 145 0 438 0 0 583
LT 0 0 -801 0 0 0 0 -801
PL 0 0 -1,644 0 0 0 0 -1,644
RU 0 0 0 -868 0 0 0 -868
SE 76 -171 -135 0 0 -22 -72 -324
OS 0 0 0 0 0 0 0 0
ALL -108 -306 -2,435 -1,000 381 -108 -175 -3,751
Table 2.10c. Changes in Table 2.10b as percentage of values in Table 2.10a. OS: Other sources, such as atmospheric depo-sition, cannot be allocated to any specifi c country or source. See note to Table 2.2 regarding the pre-conditions on the PLC-5.5 data set.
Source/Sub-basin BOB BOS BAP GUF GUR DS KAT BAS
DE -5 -4 -1
DK -14 -7 -12 -10
EE 0 -20 -20 -19
FI -11 -11 -5 -10
LV 54 22 26
LT -30 -30
PL -13 -13
RU 0 -14 -12
SE 9 -15 -16 -21 -10 -9
OS 0 0 0 0 0 0 0 0
ALL -4 -11 -13 -13 16 -7 -10 -10
3 Total nutrient inputs to the Baltic Sea in 2010
The total nutrient input to the Baltic Sea can vary signifi cantly depending on whether it is a wet or dry year. For example, 2010 was a very wet year in the southern part of the Baltic Sea catchment and the actual (not normalized) nutrient input fi gures presented in the PLC-5.5 report are therefore very high for some countries. Further, actual atmos-pheric deposition was also rather high in 2010. In this chapter, the status of actual nutrient inputs in 2010 is summarized with further details included in the PLC-5.5 report (HELCOM, in prep).
In 2010, the total water- and airborne inputs of nitrogen and phosphorus to the Baltic Sea were
The annual nutrient inputs to the sea are often reported as total amounts by country and sub-basin. In addition to the total supply of nutrients to the sea, the environmental effects of the nutrients are also determined by their chemical form and the pathway of entering. Inorganic forms of nitrogen and phosphorus are normally readily available for algae, whereas organic nitrogen leached from coniferous forest areas, for example, is considered to have low direct bioavailability. Another aspect to consider is that considerable amounts of water-borne nutrients may be retained or transformed in coastal waters and thus not reach the open sea, as opposed to nitrogen deposited via the atmosphere.
Tables 3.1a and 3.1b. Water fl ow as well as actual (non-normalized) waterborne and airborne inputs of phospho-rus and nitrogen to the Baltic Sea in 2010 by a) country and b) sub-basin. EU20 = non-HELCOM EU countries, includ-ing Croatia; ‘other atm. Sources’ and ‘atmospheric phosphorus sources’ = other countries and sources contributing to atmospheric deposition on the Baltic Sea. See note to Table 2.2 regarding the pre-conditions on the PLC-5.5 data set.
Table 3.1a
Country
Flow Nitrogen (t) Phosphorus (t)
m3/s Waterborne Airborne Total Waterborne Airborne Total
Denmark 313 40,881 15,914 56,795 1,797 1,797
Estonia 452 25,362 3,180 28,542 667 667
Finland 2,326 62,255 9,722 71,977 2,973 2,973
Germany 128 24,145 38,327 62,472 596 596
Latvia 1,369 81,539 3,457 84,996 3,109 3,109
Lithuania 790 55,980 4,969 60,949 2,326 2,326
Poland 2,880 270,287 31,278 301,565 14,845 14,845
Russia 3,577 93,186 14,813 107,999 6,208 6,208
Sweden 5,863 104,702 14,207 118,909 3,649 3,649
Baltic Shipping 13,523 13,523
EU20 39,987 39,987
Other atm. sources 29,227 29,227
Atm. P sources 2,087 2,087
Total 17,698 758,337 218,604 976,941 36,168 2,087 38,255
Table 3.1b
Country Flow Nitrogen (t) Phosphorus (t)
m3/s Waterborne Airborne Total Waterborne Airborne Total
Bothnian Bay 3,136 43,267 9,140 52,407 2,618 181 2,799
Bothnian Sea 2,926 46,247 26,143 72,390 1,861 394 2,255
Gulf of Finland 4,068 108,347 13,600 121,947 6,220 150 6,370
Gulf of Riga 1,372 78,602 9,973 88,575 2,790 93 2,883
Baltic Proper 4,784 395,568 122,843 518,411 19,806 1,046 20,852
Danish Straits 238 38,110 19,341 57,451 1433 105 1,538
Kattegat 1,173 48,197 17,564 65,761 1,442 118 1,560
Total 17,698 758,337 218,604 976,941 36,168 2,087 38,255
28
29
Revi
ew o
f th
e Fi
fth
Balti
c Se
a Po
llutio
n Lo
ad C
ompi
latio
n
of nitrogen (18% lower) and 32,200 tonnes of phosphorus (16% lower)). The normalized nitro-gen atmospheric deposition was 193,000 tonnes nitrogen or 24% of the total nitrogen input to the Baltic Sea. Normalized total nitrogen inputs, especially from Poland, Lithuania and Russia, is considerably lower than the actual total inputs, while they are higher for Finland. See also note to Table 2.2 regarding the preconditions on the PLC-5.5 data set.
977,000 tonnes of nitrogen and 38,300 tonnes of phosphorus, respectively (Tables 3.1a and 3.1b). Atmospheric nitrogen deposition amounted to 218,600 tonnes, or 22% of the total nitrogen input. Atmospheric phosphorus deposition, which is assumed to be the same every year, constituted 5% of the total phosphorus input to the Baltic Sea (Table 3.1a). To take into account the infl u-ence of weather conditions, the fl ow normalized waterborne and normalized airborne inputs to the Baltic Sea has also been calculated (Tables 3.2a and 3.2b). The total normalized nitrogen and phosphorus inputs in 2010 were considerably lower than the actual inputs (802,000 tonnes
Table 3.2a and 3.2b. Flow normalized waterborne and normalized airborne inputs of phosphorus and nitrogen to the Baltic Sea in 2010 by a) country and b) sub-basin. EU20 = non-HELCOM EU countries (including Croatia); ‘other atm. sources’ and ‘atmospheric phosphorus sources’ = other countries and sources contributing to atmospheric deposition on the Baltic Sea. See note to Table 2.2 regarding the pre-conditions on the PLC-5.5 data set.
Table 3.2a
Country Flow Nitrogen (t) Phosphorus (t)
m3/s Waterborne Airborne Total Waterborne Airborne Total
Denmark 313 38,095 15,334 53,429 1,706 1,706
Estonia 452 22,491 1,993 24,484 612 612
Finland 2,326 67,213 6,411 73,624 3,297 3,297
Germany 128 21,991 35,090 57,081 564 564
Latvia 1,369 67,315 2,165 69,480 2,548 2,548
Lithuania 790 38,428 3,233 41,661 2,015 2,015
Poland 2,880 175,475 24,396 199,871 9,842 9,842
Russia 3,577 81,182 11,491 92,673 6,050 6,050
Sweden 5,863 97,713 11,330 109,043 3,527 3,527
Baltic Shipping 13,840 13,840
EU20 42,046 42,046
Other atm. sources 25,226 25,226
Atm. P sources 2,087 2,087
Total 17,698 609,903 192,555 802,458 30,161 2,087 32,248
Table 3.2b
Country Flow Nitrogen (t) Phosphorus (t)
m3/s Waterborne Airborne Total Waterborne Airborne Total
Bothnian Bay 3,136 44,582 7,258 51,840 2,748 181 2,929
Bothnian Sea 2,926 48,635 21,347 69,982 2,045 394 2, 439
Gulf of Finland 4,068 95,536 12,015 107,551 6,114 150 6,264
Gulf of Riga 1,372 66,240 8,691 74,931 2,303 93 2,396
Baltic Proper 4,784 271,695 106,589 378,284 14,190 1,046 15,236
Danish Straits 238 36,955 20,091 57,046 1,369 105 1,474
Kattegat 1,173 46,260 16,564 62,824 1,392 118 1,510
Total 17,698 609,903 192,555 802,458 30,161 2,087 32,301
30
transboundary input entering the Baltic Sea is included in the waterborne inputs from the receiv-ing Contracting Parties. Transboundary inputs from other HELCOM Contracting Parties entering the Baltic Sea - as from Lithuania to Latvia and Russia, Poland to Russia, Germany to Poland, and Finland to Russia - are also included in the riverine inputs of the downstream Contracting Parties unless otherwise indicated. Two rivers, the Torne and Narva are border rivers where the inputs to the Baltic Sea have been divided according to agreed proportions between the bordering countries. For the Odra, which is a border river between Poland and Germany at its outlet and also receives riverine inputs from the Czech Republic, the total inputs are included as the waterborne input from Poland.
In Tables 3.3a and 3.3b, the waterborne trans-boundary net nitrogen and phosphorus inputs from non-Contracting Parties (Table 3.3a) and from Contracting Parties as given (Table 3.3b) as compiled by BNI (Gustavsson & Mörth, in prep) and additional information is included in the HELCOM PLC-5.5 report (HELCOM, in prep). The largest amounts of transboundary waterborne nutrient inputs to the Baltic Sea originate from Belarus and drain via Latvia and Lithuania.
In total, more than 10% of the total nitrogen and more than 5% of the total phosphorus inputs
The contributions of the HELCOM Contracting Parties to the actual total inputs of nitrogen and phosphorus to the Baltic Sea in 2010 are given in Figure 3.1. For total water and airborne inputs of nitrogen to the Baltic Sea in 2010, the greatest contributors were Poland (30%), Sweden (12%) and Russia (11%). For phosphorus, Poland is the greatest contributor with 37%, followed by Russia (16%) and Sweden (9%). The shares are markedly affected by the unusually high amount of precipita-tion in the Polish catchment in 2010, which gives Poland a high proportion of total actual inputs in 2010. Calculated as normalized inputs, Poland’s contribution of nitrogen and phosphorus to the Baltic Sea is 24% and 30%, respectively. Trans-boundary atmospheric nitrogen deposition inputs from non-Contracting Parties (EU20 and other atmospheric sources) and from Baltic Sea shipping constituted more than 8% of the total nitrogen inputs to the Baltic Sea in 2010 (Figure 3.1).
The Baltic Sea also receives transboundary water-borne nitrogen and phosphorus inputs originating from fi ve non-HELCOM countries: Belarus, Czech Republic, Norway, Slovakia and Ukraine. In 2010, these inputs constituted 2% of total nitrogen and 5% of phosphorus inputs to the Baltic Sea; for some basins, they play a greater role such as for phosphorus inputs to the Gulf of Riga. In most tables and fi gures in the report, the waterborne
DK 6 %
EE 3 %
FI 7 %
DE 7 %
LT 6 %
LV 8 %
PL 30 %
RU 11 %
SE 12 %
Other air 3%
Other water 2%
EU20 4% Baltic shipping 1%
Nitrogen (977,000 tonnes)
DK 5 %
EE 2 %
FI 8 %
DE 2 %
LT 5 %
LV 6 %
PL 37 %
RU 16 %
SE 9 %
Other air 5 %Other water 5 %
Phosphorus (38,300 tonnes)
Figures 3.1a and 3.1b. Total actual water- and airborne inputs of nitrogen and phosphorus to the Baltic Sea in 2010 by HELCOM Contracting Parties and other sources. Atmospheric nitrogen deposition is divided into Baltic shipping, EU20 (the 20 non-HELCOM EU countries including Croatia) and ‘other air’ - which for nitrogen is other non-HELCOM countries and other distant sources (such as North Sea shipping) and for phosphorus all atmos-pheric sources. ‘Other water’ is transboundary waterborne inputs from non-HELCOM Contracting Parties entering the Baltic Sea (see Table 3.3a). See also note to Table 2.2 regarding the pre-conditions on the PLC-5.5 data set.
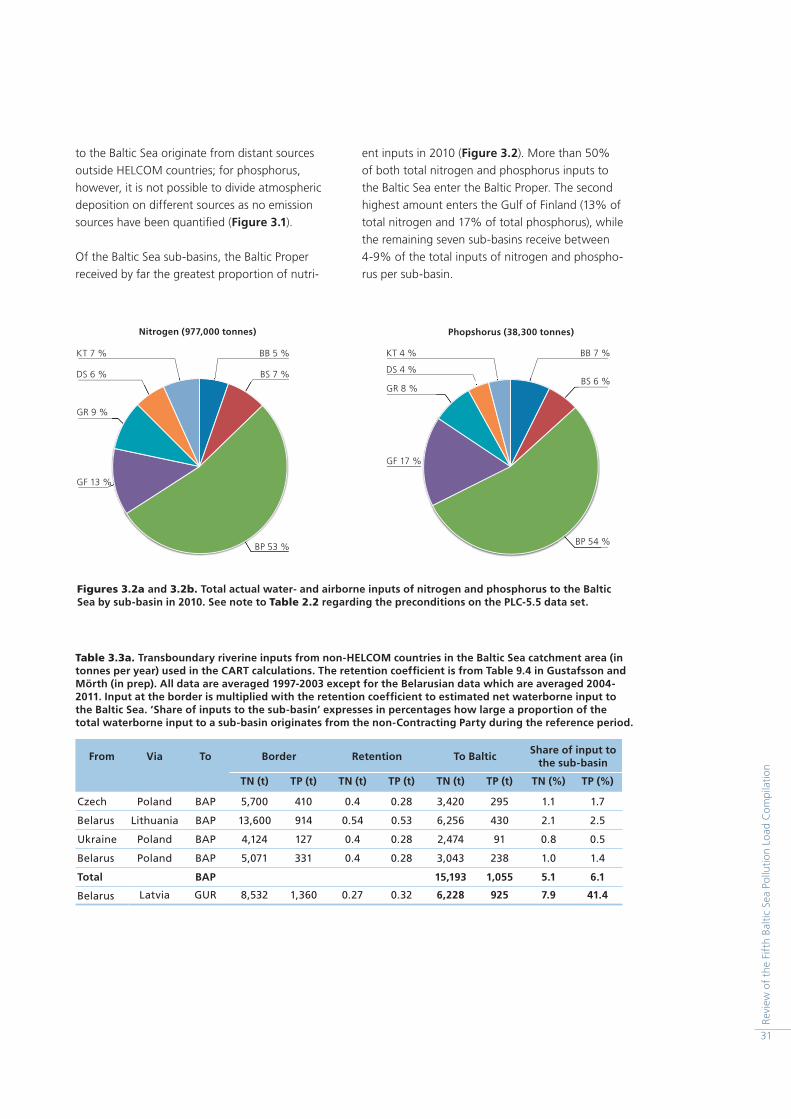
31
Revi
ew o
f th
e Fi
fth
Balti
c Se
a Po
llutio
n Lo
ad C
ompi
latio
n
ent inputs in 2010 (Figure 3.2). More than 50% of both total nitrogen and phosphorus inputs to the Baltic Sea enter the Baltic Proper. The second highest amount enters the Gulf of Finland (13% of total nitrogen and 17% of total phosphorus), while the remaining seven sub-basins receive between 4-9% of the total inputs of nitrogen and phospho-rus per sub-basin.
to the Baltic Sea originate from distant sources outside HELCOM countries; for phosphorus, however, it is not possible to divide atmospheric deposition on different sources as no emission sources have been quantifi ed (Figure 3.1).
Of the Baltic Sea sub-basins, the Baltic Proper received by far the greatest proportion of nutri-
BB 5 %
BS 7 %
BP 53 %
GF 13 %
GR 9 %
DS 6 %
KT 7 %
Nitrogen (977,000 tonnes)
BB 7 %
BS 6 %
BP 54 %
GF 17 %
GR 8 %
DS 4 %
KT 4 %
Phopshorus (38,300 tonnes)
Figures 3.2a and 3.2b. Total actual water- and airborne inputs of nitrogen and phosphorus to the Baltic Sea by sub-basin in 2010. See note to Table 2.2 regarding the preconditions on the PLC-5.5 data set.
Table 3.3a. Transboundary riverine inputs from non-HELCOM countries in the Baltic Sea catchment area (in tonnes per year) used in the CART calculations. The retention coeffi cient is from Table 9.4 in Gustafsson and Mörth (in prep). All data are averaged 1997-2003 except for the Belarusian data which are averaged 2004-2011. Input at the border is multiplied with the retention coeffi cient to estimated net waterborne input to the Baltic Sea. ‘Share of inputs to the sub-basin’ expresses in percentages how large a proportion of the total waterborne input to a sub-basin originates from the non-Contracting Party during the reference period.
From Via To Border Retention To BalticShare of input to
the sub-basin
TN (t) TP (t) TN (t) TP (t) TN (t) TP (t) TN (%) TP (%)
Czech Poland BAP 5,700 410 0.4 0.28 3,420 295 1.1 1.7
Belarus Lithuania BAP 13,600 914 0.54 0.53 6,256 430 2.1 2.5
Ukraine Poland BAP 4,124 127 0.4 0.28 2,474 91 0.8 0.5
Belarus Poland BAP 5,071 331 0.4 0.28 3,043 238 1.0 1.4
Total BAP 15,193 1,055 5.1 6.1
Belarus Latvia GUR 8,532 1,360 0.27 0.32 6,228 925 7.9 41.4
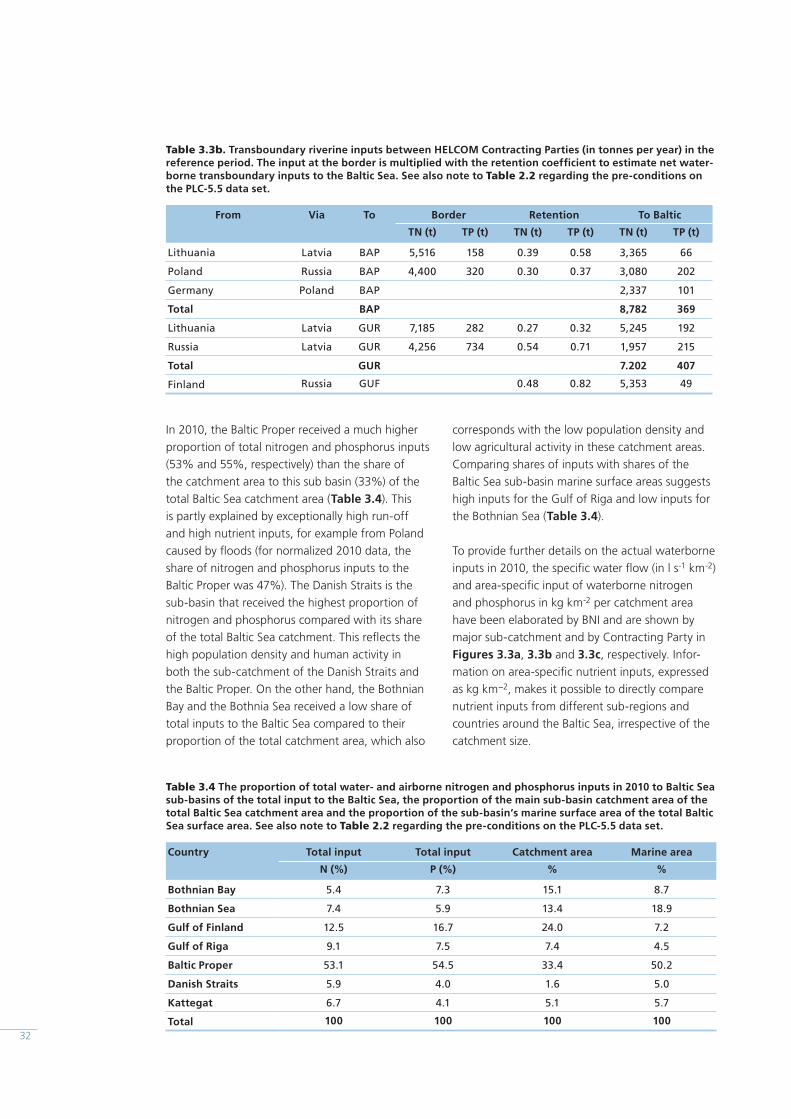
32
corresponds with the low population density and low agricultural activity in these catchment areas. Comparing shares of inputs with shares of the Baltic Sea sub-basin marine surface areas suggests high inputs for the Gulf of Riga and low inputs for the Bothnian Sea (Table 3.4).
To provide further details on the actual waterborne inputs in 2010, the specifi c water fl ow (in l s-1 km-2) and area-specifi c input of waterborne nitrogen and phosphorus in kg km-2 per catchment area have been elaborated by BNI and are shown by major sub-catchment and by Contracting Party in Figures 3.3a, 3.3b and 3.3c, respectively. Infor-mation on area-specifi c nutrient inputs, expressed as kg km−2, makes it possible to directly compare nutrient inputs from different sub-regions and countries around the Baltic Sea, irrespective of the catchment size.
In 2010, the Baltic Proper received a much higher proportion of total nitrogen and phosphorus inputs (53% and 55%, respectively) than the share of the catchment area to this sub basin (33%) of the total Baltic Sea catchment area (Table 3.4). This is partly explained by exceptionally high run-off and high nutrient inputs, for example from Poland caused by fl oods (for normalized 2010 data, the share of nitrogen and phosphorus inputs to the Baltic Proper was 47%). The Danish Straits is the sub-basin that received the highest proportion of nitrogen and phosphorus compared with its share of the total Baltic Sea catchment. This refl ects the high population density and human activity in both the sub-catchment of the Danish Straits and the Baltic Proper. On the other hand, the Bothnian Bay and the Bothnia Sea received a low share of total inputs to the Baltic Sea compared to their proportion of the total catchment area, which also
Table 3.3b. Transboundary riverine inputs between HELCOM Contracting Parties (in tonnes per year) in the reference period. The input at the border is multiplied with the retention coeffi cient to estimate net water-borne transboundary inputs to the Baltic Sea. See also note to Table 2.2 regarding the pre-conditions on the PLC-5.5 data set.
From Via To Border Retention To Baltic
TN (t) TP (t) TN (t) TP (t) TN (t) TP (t)
Lithuania Latvia BAP 5,516 158 0.39 0.58 3,365 66
Poland Russia BAP 4,400 320 0.30 0.37 3,080 202
Germany Poland BAP 2,337 101
Total BAP 8,782 369
Lithuania Latvia GUR 7,185 282 0.27 0.32 5,245 192
Russia Latvia GUR 4,256 734 0.54 0.71 1,957 215
Total GUR 7.202 407
Finland Russia GUF 0.48 0.82 5,353 49
Table 3.4 The proportion of total water- and airborne nitrogen and phosphorus inputs in 2010 to Baltic Sea sub-basins of the total input to the Baltic Sea, the proportion of the main sub-basin catchment area of the total Baltic Sea catchment area and the proportion of the sub-basin’s marine surface area of the total Baltic Sea surface area. See also note to Table 2.2 regarding the pre-conditions on the PLC-5.5 data set.
Country Total input Total input Catchment area Marine area
N (%) P (%) % %
Bothnian Bay 5.4 7.3 15.1 8.7
Bothnian Sea 7.4 5.9 13.4 18.9
Gulf of Finland 12.5 16.7 24.0 7.2
Gulf of Riga 9.1 7.5 7.4 4.5
Baltic Proper 53.1 54.5 33.4 50.2
Danish Straits 5.9 4.0 1.6 5.0
Kattegat 6.7 4.1 5.1 5.7
Total 100 100 100 100
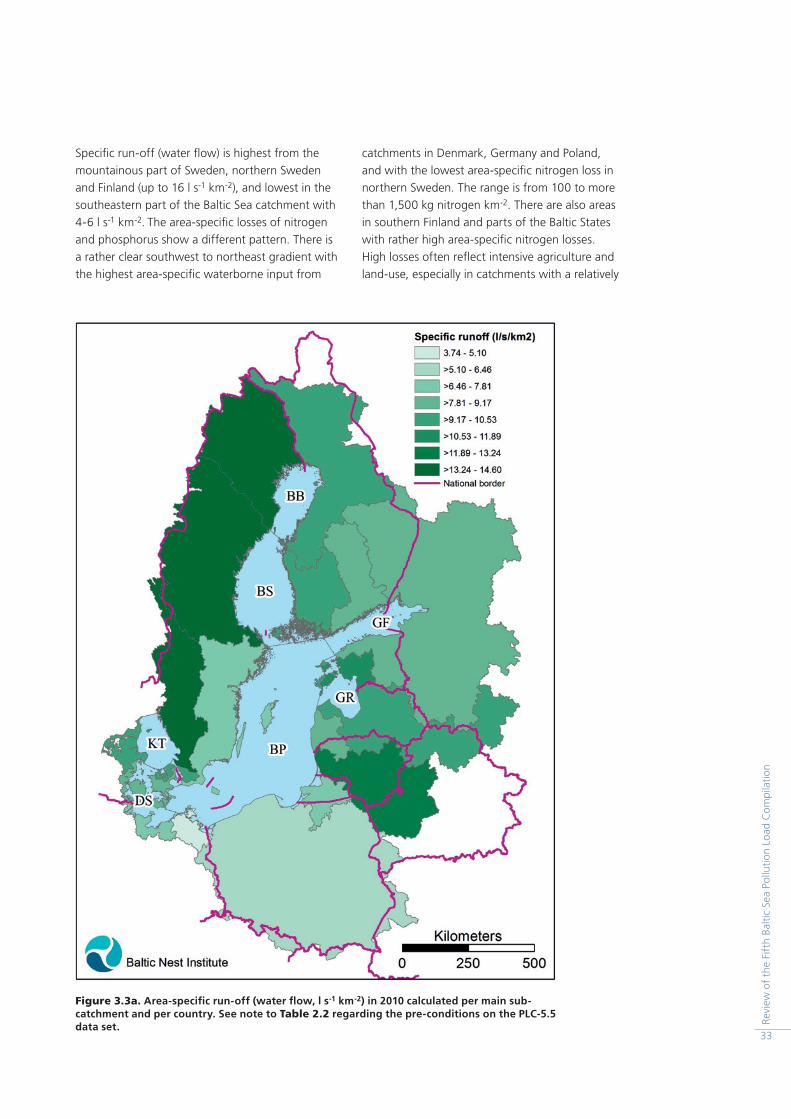
33
Revi
ew o
f th
e Fi
fth
Balti
c Se
a Po
llutio
n Lo
ad C
ompi
latio
n
catchments in Denmark, Germany and Poland, and with the lowest area-specifi c nitrogen loss in northern Sweden. The range is from 100 to more than 1,500 kg nitrogen km-2. There are also areas in southern Finland and parts of the Baltic States with rather high area-specifi c nitrogen losses. High losses often refl ect intensive agriculture and land-use, especially in catchments with a relatively
Specifi c run-off (water fl ow) is highest from the mountainous part of Sweden, northern Sweden and Finland (up to 16 l s-1 km-2), and lowest in the southeastern part of the Baltic Sea catchment with 4-6 l s-1 km-2. The area-specifi c losses of nitrogen and phosphorus show a different pattern. There is a rather clear southwest to northeast gradient with the highest area-specifi c waterborne input from
Figure 3.3a. Area-specifi c run-off (water fl ow, l s-1 km-2) in 2010 calculated per main sub-catchment and per country. See note to Table 2.2 regarding the pre-conditions on the PLC-5.5 data set.
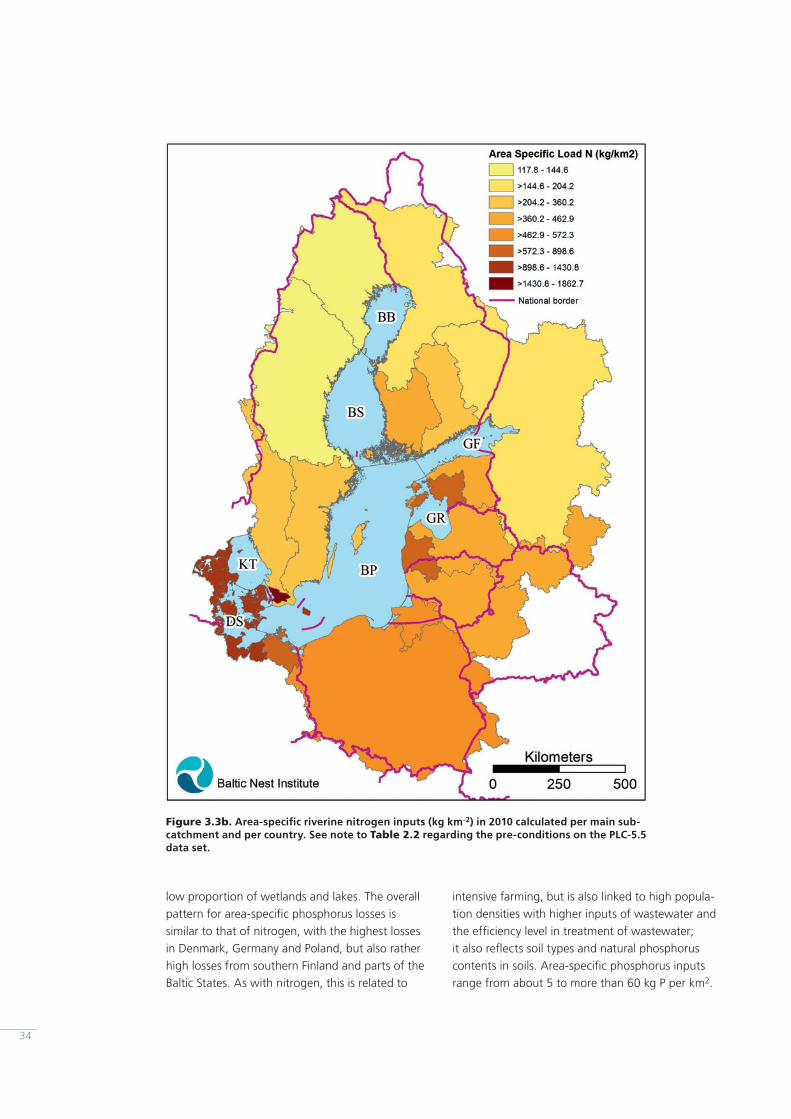
34
intensive farming, but is also linked to high popula-tion densities with higher inputs of wastewater and the effi ciency level in treatment of wastewater; it also refl ects soil types and natural phosphorus contents in soils. Area-specifi c phosphorus inputs range from about 5 to more than 60 kg P per km2.
low proportion of wetlands and lakes. The overall pattern for area-specifi c phosphorus losses is similar to that of nitrogen, with the highest losses in Denmark, Germany and Poland, but also rather high losses from southern Finland and parts of the Baltic States. As with nitrogen, this is related to
Figure 3.3b. Area-specifi c riverine nitrogen inputs (kg km-2) in 2010 calculated per main sub-catchment and per country. See note to Table 2.2 regarding the pre-conditions on the PLC-5.5 data set.
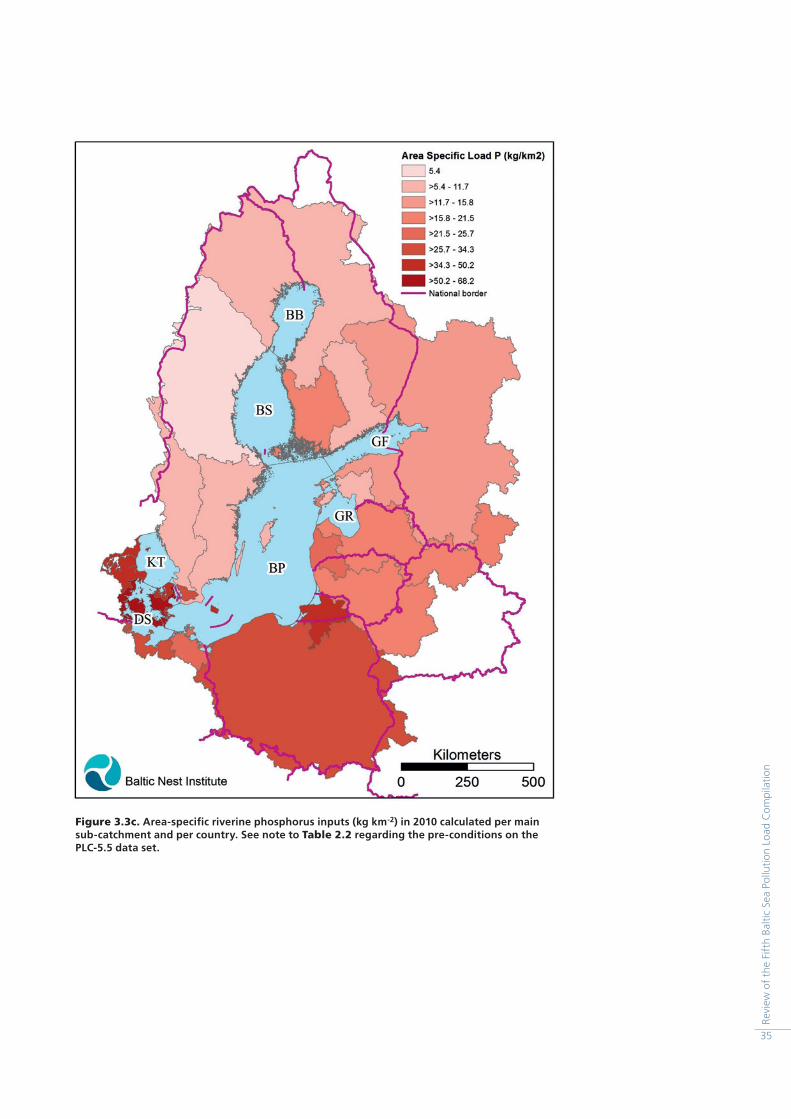
35
Revi
ew o
f th
e Fi
fth
Balti
c Se
a Po
llutio
n Lo
ad C
ompi
latio
n
Figure 3.3c. Area-specifi c riverine phosphorus inputs (kg km-2) in 2010 calculated per main sub-catchment and per country. See note to Table 2.2 regarding the pre-conditions on the PLC-5.5 data set.
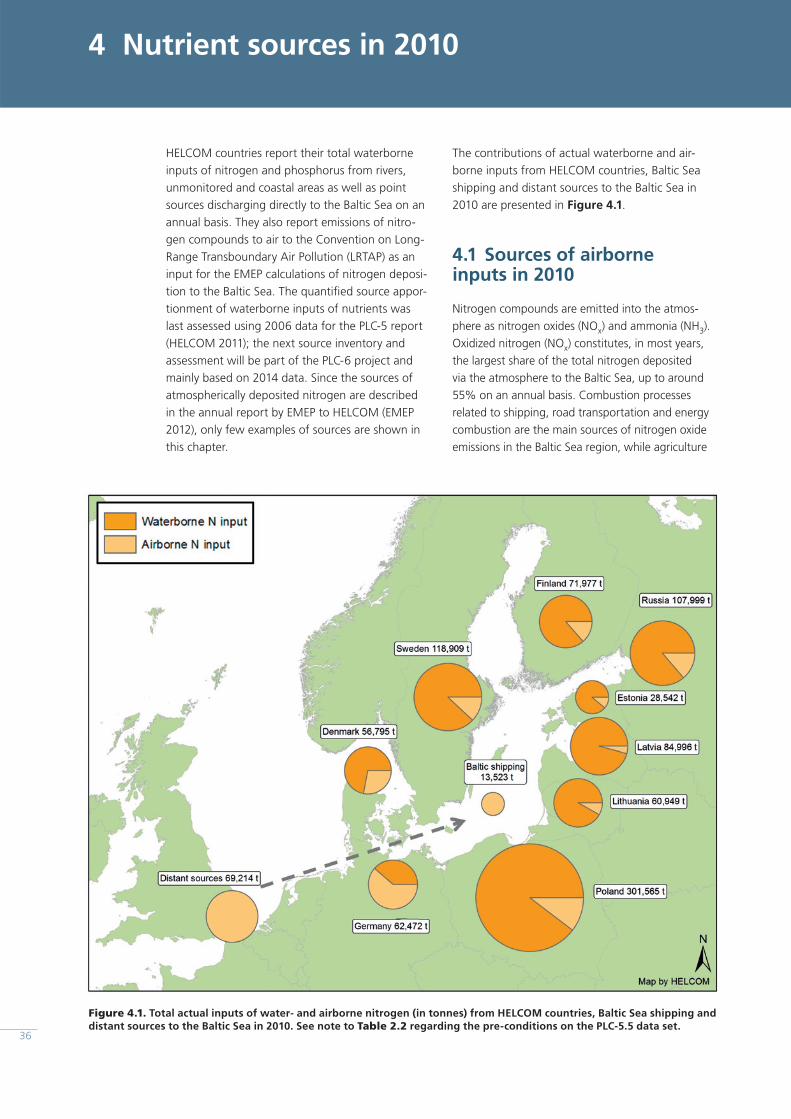
4 Nutrient sources in 2010
The contributions of actual waterborne and air-borne inputs from HELCOM countries, Baltic Sea shipping and distant sources to the Baltic Sea in 2010 are presented in Figure 4.1.
4.1 Sources of airborne inputs in 2010
Nitrogen compounds are emitted into the atmos-phere as nitrogen oxides (NOx) and ammonia (NH3). Oxidized nitrogen (NOx) constitutes, in most years, the largest share of the total nitrogen deposited via the atmosphere to the Baltic Sea, up to around 55% on an annual basis. Combustion processes related to shipping, road transportation and energy combustion are the main sources of nitrogen oxide emissions in the Baltic Sea region, while agriculture
HELCOM countries report their total waterborne inputs of nitrogen and phosphorus from rivers, unmonitored and coastal areas as well as point sources discharging directly to the Baltic Sea on an annual basis. They also report emissions of nitro-gen compounds to air to the Convention on Long-Range Transboundary Air Pollution (LRTAP) as an input for the EMEP calculations of nitrogen deposi-tion to the Baltic Sea. The quantifi ed source appor-tionment of waterborne inputs of nutrients was last assessed using 2006 data for the PLC-5 report (HELCOM 2011); the next source inventory and assessment will be part of the PLC-6 project and mainly based on 2014 data. Since the sources of atmospherically deposited nitrogen are described in the annual report by EMEP to HELCOM (EMEP 2012), only few examples of sources are shown in this chapter.
Figure 4.1. Total actual inputs of water- and airborne nitrogen (in tonnes) from HELCOM countries, Baltic Sea shipping and distant sources to the Baltic Sea in 2010. See note to Table 2.2 regarding the pre-conditions on the PLC-5.5 data set.
36
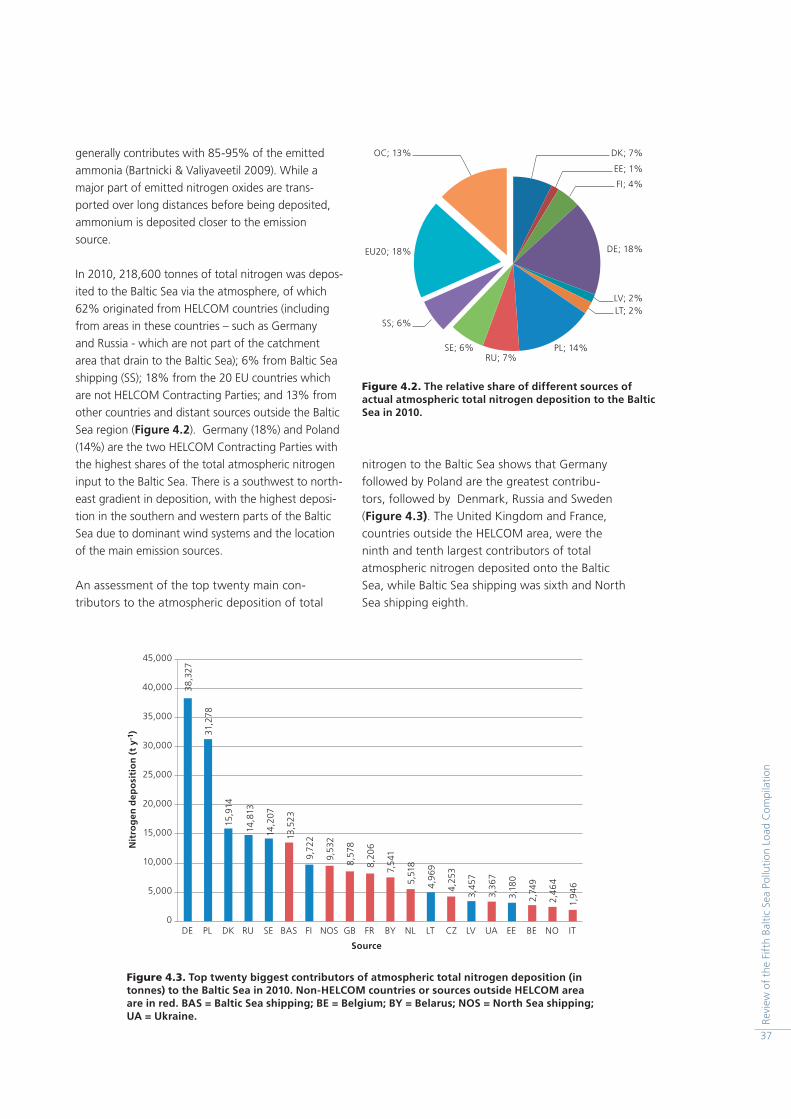
37
Revi
ew o
f th
e Fi
fth
Balti
c Se
a Po
llutio
n Lo
ad C
ompi
latio
n
nitrogen to the Baltic Sea shows that Germany followed by Poland are the greatest contribu-tors, followed by Denmark, Russia and Sweden (Figure 4.3). The United Kingdom and France, countries outside the HELCOM area, were the ninth and tenth largest contributors of total atmospheric nitrogen deposited onto the Baltic Sea, while Baltic Sea shipping was sixth and North Sea shipping eighth.
generally contributes with 85-95% of the emitted ammonia (Bartnicki & Valiyaveetil 2009). While a major part of emitted nitrogen oxides are trans-ported over long distances before being deposited, ammonium is deposited closer to the emission source.
In 2010, 218,600 tonnes of total nitrogen was depos-ited to the Baltic Sea via the atmosphere, of which 62% originated from HELCOM countries (including from areas in these countries – such as Germany and Russia - which are not part of the catchment area that drain to the Baltic Sea); 6% from Baltic Sea shipping (SS); 18% from the 20 EU countries which are not HELCOM Contracting Parties; and 13% from other countries and distant sources outside the Baltic Sea region (Figure 4.2). Germany (18%) and Poland (14%) are the two HELCOM Contracting Parties with the highest shares of the total atmospheric nitrogen input to the Baltic Sea. There is a southwest to north-east gradient in deposition, with the highest deposi-tion in the southern and western parts of the Baltic Sea due to dominant wind systems and the location of the main emission sources.
An assessment of the top twenty main con-tributors to the atmospheric deposition of total
DK; 7%
EE; 1%
FI; 4%
DE; 18%
LV; 2%LT; 2%
PL; 14%RU; 7%
SE; 6%
SS; 6%
EU20; 18%
OC; 13%
38,3
27
31,2
78
15,9
14
14,8
13
14,2
07
13,5
23
9,72
2
9,53
2
8,57
8
8,20
6
7,5
41
5,51
8
4,9
69
4,25
3
3,45
7
3,36
7
3,18
0
2,74
9
2,4
64
1,9
46
0
5,000
10,000
15,000
20,000
25,000
30,000
35,000
40,000
45,000
DE PL DK RU SE BAS FI NOS GB FR BY NL LT CZ LV UA EE BE NO IT
Nit
rog
en d
epo
siti
on
(t
y-1 )
Source
Figure 4.2. The relative share of different sources of actual atmospheric total nitrogen deposition to the Baltic Sea in 2010.
Figure 4.3. Top twenty biggest contributors of atmospheric total nitrogen deposition (in tonnes) to the Baltic Sea in 2010. Non-HELCOM countries or sources outside HELCOM area are in red. BAS = Baltic Sea shipping; BE = Belgium; BY = Belarus; NOS = North Sea shipping; UA = Ukraine.
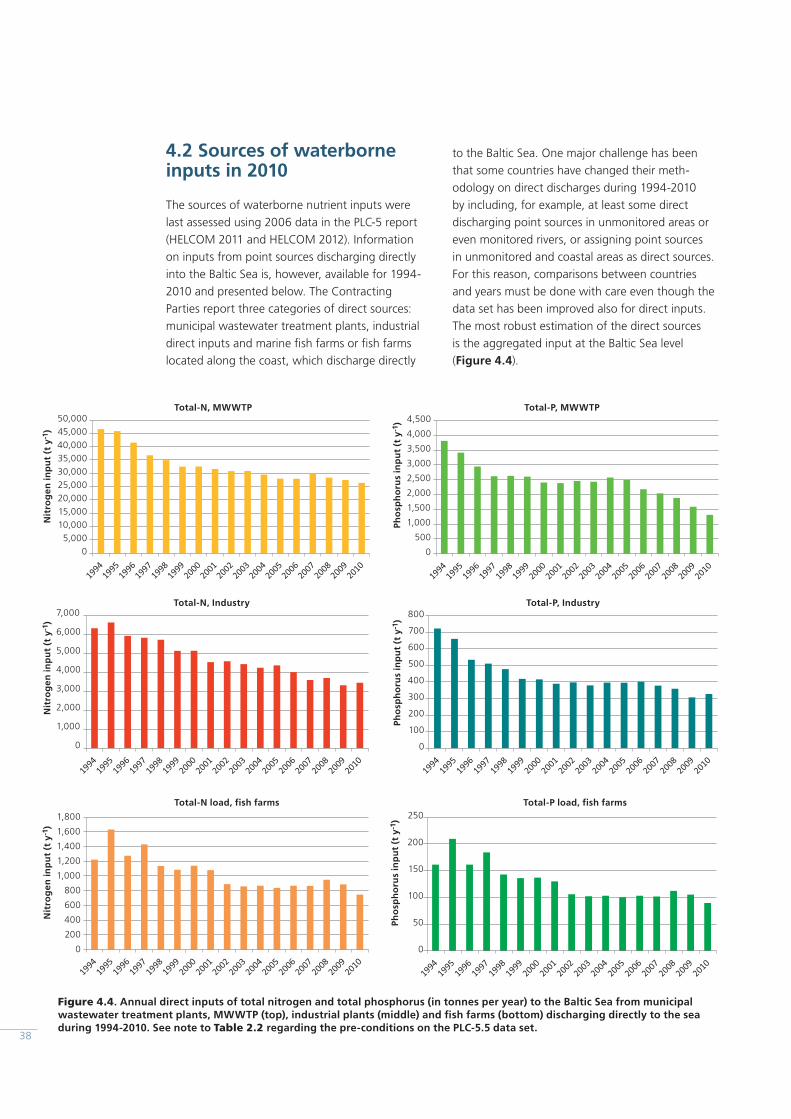
38
to the Baltic Sea. One major challenge has been that some countries have changed their meth-odology on direct discharges during 1994-2010 by including, for example, at least some direct discharging point sources in unmonitored areas or even monitored rivers, or assigning point sources in unmonitored and coastal areas as direct sources. For this reason, comparisons between countries and years must be done with care even though the data set has been improved also for direct inputs. The most robust estimation of the direct sources is the aggregated input at the Baltic Sea level (Figure 4.4).
4.2 Sources of waterborne inputs in 2010
The sources of waterborne nutrient inputs were last assessed using 2006 data in the PLC-5 report (HELCOM 2011 and HELCOM 2012). Information on inputs from point sources discharging directly into the Baltic Sea is, however, available for 1994-2010 and presented below. The Contracting Parties report three categories of direct sources: municipal wastewater treatment plants, industrial direct inputs and marine fi sh farms or fi sh farms located along the coast, which discharge directly
0
500
1,000
1,500
2,000
2,500
3,000
3,500
4,000
4,500
Pho
sph
oru
s in
pu
t (t
y-1
)Total-P, MWWTP
05,000
10,00015,00020,00025,00030,00035,00040,00045,00050,000
Nit
rog
en in
pu
t (t
y-1
)
Total-N, MWWTP
0
100
200
300
400
500
600
700
800
Pho
sph
oru
s in
pu
t (t
y-1
)
Total-P, Industry
0
1,000
2,000
3,000
4,000
5,000
6,000
7,000
Nit
rog
en in
pu
t (t
y-1
)
Total-N, Industry
0
50
100
150
200
250
Pho
sph
oru
s in
pu
t (t
y-1
)
Total-P load, fish farms
0
200
400
600
800
1,000
1,200
1,400
1,600
1,800
Nit
rog
en in
pu
t (t
y-1
)
Total-N load, fish farms
Figure 4.4. Annual direct inputs of total nitrogen and total phosphorus (in tonnes per year) to the Baltic Sea from municipal wastewater treatment plants, MWWTP (top), industrial plants (middle) and fi sh farms (bottom) discharging directly to the sea during 1994-2010. See note to Table 2.2 regarding the pre-conditions on the PLC-5.5 data set.
39
Revi
ew o
f th
e Fi
fth
Balti
c Se
a Po
llutio
n Lo
ad C
ompi
latio
n
sions been included in the riverine inputs by some Contracting Parties. It should also be noted that municipal nitrogen and phosphorus inputs from the Nordic Contracting Parties decreased signifi cantly already before the 1988 HELCOM Ministerial Dec-laration (HELCOM 1988) was agreed upon due to measures taken already during the 1970s and 1980s, and also because reductions in some countries took place from 1990-1993. Trend estimates are based on an assumption of a linear trend which is not always fulfi lled and thus might affect the estimated changes in direct inputs from 1994 to 2010.
In 2010, total direct inputs of nitrogen constituted between 5-10% of the total actual waterborne nitrogen inputs in Denmark, Finland, Russia and Sweden, but only from 0.3% to less than 2.3% in Germany, Latvia, Lithuania and Poland. Correspond-ing shares for phosphorus were between 7% and nearly 16% for Denmark, Estonia, Finland, Russia and Sweden, but only 0.2-2.3% for Germany, Latvia, Lithuania and Poland. The shares from Latvia, Lithu-ania and Poland seem very low, even though riverine fl ow was very high from Poland in 2010.
Direct discharges of nitrogen and phosphorus from coastal municipal wastewater treatment plants (MWWTP), industries and fi sh farms into the Baltic Sea (Figure 4.4) are generally independent of vari-ations in precipitation, although some municipal wastewater treatment plants may allow untreated overfl ows during heavy stormwater events. For all these sources, there is an overall statistically signifi cant decrease for both nitrogen and phos-phorus inputs to the Baltic Sea from 1994 to 2010. There is generally a marked decrease from 1994 to about year 2000. Further, there is a decrease for MWWTPs (phosphorus) and for industries from 2005 to 2010. For fi sh farms, reductions are seen until 2000 and then no major changes in the total input to the Baltic Sea can be noted (see Figure 4.4). For fi sh farms, this might be a com-bined result of improved feed usage and better cleaning on fi sh farms despite current higher pro-duction and higher feed consumption.
All Contracting Parties, except Estonia and Poland, have a statistically signifi cant decrease in total direct point source inputs for phosphorus, and all countries, except Estonia and Latvia, have a sta-tistically signifi cant decrease in total direct point source inputs for nitrogen. Latvia shows a signifi -cant increase in direct nitrogen inputs, but the data are rather uncertain (Table 4.1a). Chapter 2.4 describes statistical trend analysis in more detail.
The direct point source inputs of nitrogen and phos-phorus to the Baltic Sea have decreased markedly by 43% and 63%, respectively, from 1994 to 2010. Some Contracting Parties have reduced much more, such as Denmark and Germany as well as Lithuania for phosphorus. The real decrease might be higher for some countries mainly due to some methodol-ogy changes at the beginning of the period and because direct point sources have on some occa-
Tables 4.1a and 4.1b. Results of the Mann-Kendall test for signifi cant trends on direct nitrogen and phosphorus inputs to the Baltic Sea (sum of inputs from municipal wastewater treatment plants, indus-tries and fi sh farms discharging directly to the sea) by country (Table 4.1a) and by sub-basin (Table 4.1b). Estimated annual change (with a Theil-Sen slope estimator) in tonnes per year and estimated percent-age of change in inputs from 1994 to 2010 where the trend is signifi -cant (confi dence < 5%) (see footnotes 9 and 10). The results where the confi dence level is between 5-10% are given in parentheses. See note to Table 2.2 regarding the pre-conditions on the PLC-5.5 data set.
Table 4.1a
Direct point sources
Estimatedslope
Changesince 1994
Estimatedslope
Changesince 1994
t N y-1 % t P y-1 %
DE -173 -85 -1.68 -83
DK -140 -72 -22.1 -79
EE - - - -
FI -337 -48 -11.7 -51
LV 30.4 38 -13.1 -90
LT -44.6 -77 -6.51 -91
PL (-30) (-44) -
RU -177 -23 (-35) (-56)
SE -345 -37 -13.5 -39
BAS -1,163 -43 -125 -63
Table 4.1 b
Direct point sources
Estimatedslope
Changesince 1994
Estimatedslope
Changesince 1994
t N y-1 % t P y-1 %
BOB -49.4 -24 -3.51 -42
BOS -87.2 -16 -10.1 -41
BAP -253 -47 -19.6 -41
GUF -369 -36 -36 -63
GUR 40.6 63 -12.5 -90
DS -335 -75 -18.3 -77
KAT -112 -49 -9.69 -68
BAS -1,163 -43 -125 -63
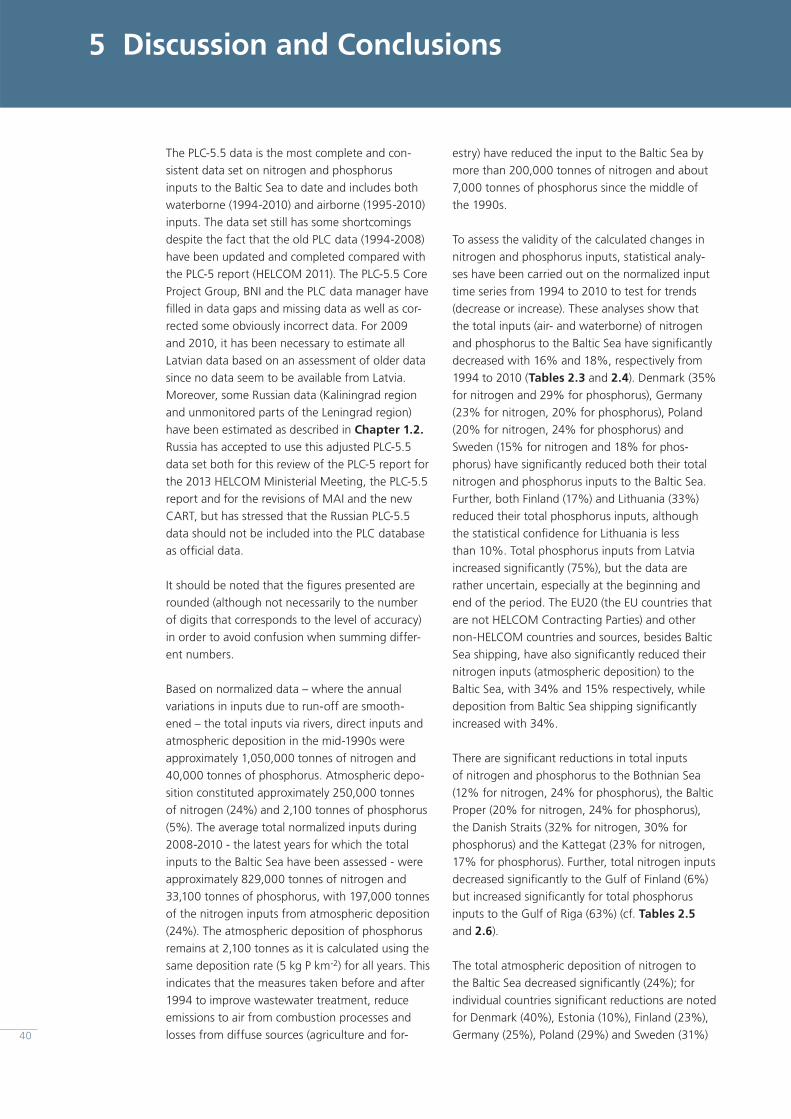
5 Discussion and Conclusions
estry) have reduced the input to the Baltic Sea by more than 200,000 tonnes of nitrogen and about 7,000 tonnes of phosphorus since the middle of the 1990s.
To assess the validity of the calculated changes in nitrogen and phosphorus inputs, statistical analy-ses have been carried out on the normalized input time series from 1994 to 2010 to test for trends (decrease or increase). These analyses show that the total inputs (air- and waterborne) of nitrogen and phosphorus to the Baltic Sea have signifi cantly decreased with 16% and 18%, respectively from 1994 to 2010 (Tables 2.3 and 2.4). Denmark (35% for nitrogen and 29% for phosphorus), Germany (23% for nitrogen, 20% for phosphorus), Poland (20% for nitrogen, 24% for phosphorus) and Sweden (15% for nitrogen and 18% for phos-phorus) have signifi cantly reduced both their total nitrogen and phosphorus inputs to the Baltic Sea. Further, both Finland (17%) and Lithuania (33%) reduced their total phosphorus inputs, although the statistical confi dence for Lithuania is less than 10%. Total phosphorus inputs from Latvia increased signifi cantly (75%), but the data are rather uncertain, especially at the beginning and end of the period. The EU20 (the EU countries that are not HELCOM Contracting Parties) and other non-HELCOM countries and sources, besides Baltic Sea shipping, have also signifi cantly reduced their nitrogen inputs (atmospheric deposition) to the Baltic Sea, with 34% and 15% respectively, while deposition from Baltic Sea shipping signifi cantly increased with 34%.
There are signifi cant reductions in total inputs of nitrogen and phosphorus to the Bothnian Sea (12% for nitrogen, 24% for phosphorus), the Baltic Proper (20% for nitrogen, 24% for phosphorus), the Danish Straits (32% for nitrogen, 30% for phosphorus) and the Kattegat (23% for nitrogen, 17% for phosphorus). Further, total nitrogen inputs decreased signifi cantly to the Gulf of Finland (6%) but increased signifi cantly for total phosphorus inputs to the Gulf of Riga (63%) (cf. Tables 2.5 and 2.6).
The total atmospheric deposition of nitrogen to the Baltic Sea decreased signifi cantly (24%); for individual countries signifi cant reductions are noted for Denmark (40%), Estonia (10%), Finland (23%), Germany (25%), Poland (29%) and Sweden (31%)
The PLC-5.5 data is the most complete and con-sistent data set on nitrogen and phosphorus inputs to the Baltic Sea to date and includes both waterborne (1994-2010) and airborne (1995-2010) inputs. The data set still has some shortcomings despite the fact that the old PLC data (1994-2008) have been updated and completed compared with the PLC-5 report (HELCOM 2011). The PLC-5.5 Core Project Group, BNI and the PLC data manager have fi lled in data gaps and missing data as well as cor-rected some obviously incorrect data. For 2009 and 2010, it has been necessary to estimate all Latvian data based on an assessment of older data since no data seem to be available from Latvia. Moreover, some Russian data (Kaliningrad region and unmonitored parts of the Leningrad region) have been estimated as described in Chapter 1.2. Russia has accepted to use this adjusted PLC-5.5 data set both for this review of the PLC-5 report for the 2013 HELCOM Ministerial Meeting, the PLC-5.5 report and for the revisions of MAI and the new CART, but has stressed that the Russian PLC-5.5 data should not be included into the PLC database as offi cial data.
It should be noted that the fi gures presented are rounded (although not necessarily to the number of digits that corresponds to the level of accuracy) in order to avoid confusion when summing differ-ent numbers.
Based on normalized data – where the annual variations in inputs due to run-off are smooth-ened – the total inputs via rivers, direct inputs and atmospheric deposition in the mid-1990s were approximately 1,050,000 tonnes of nitrogen and 40,000 tonnes of phosphorus. Atmospheric depo-sition constituted approximately 250,000 tonnes of nitrogen (24%) and 2,100 tonnes of phosphorus (5%). The average total normalized inputs during 2008-2010 - the latest years for which the total inputs to the Baltic Sea have been assessed - were approximately 829,000 tonnes of nitrogen and 33,100 tonnes of phosphorus, with 197,000 tonnes of the nitrogen inputs from atmospheric deposition (24%). The atmospheric deposition of phosphorus remains at 2,100 tonnes as it is calculated using the same deposition rate (5 kg P km-2) for all years. This indicates that the measures taken before and after 1994 to improve wastewater treatment, reduce emissions to air from combustion processes and losses from diffuse sources (agriculture and for-40
41
Revi
ew o
f th
e Fi
fth
Balti
c Se
a Po
llutio
n Lo
ad C
ompi
latio
n
Sweden) took many measures in the 1970s, 1980s and early 1990s and reduced especially nitrogen and phosphorus losses to surfaces from municipal wastewater (and also diffuse losses) before 1994 when the PLC assessment period begins. They have also since 1994 implemented further measures to reduce inputs. Poland, the Baltic States and Russia implemented advanced wastewater treatment later, the effects of which are mainly refl ected in reduced inputs from these countries after the ref-erence period 1997-2003. It should also be noted that many measures taken to reduce diffuse losses to inland surface waters, will take several years before they result in reduced nutrient inputs to both coastal and open waters of the Baltic Sea. Moreover, in some catchments, retention in soils, groundwater and inland surface waters are so high that it can require a factor of 5-10 times higher reductions to obtain a given absolute reduction to the Baltic Sea.
Comparison of the average normalized inputs of total nitrogen and phosphorus during 2008-2010 with the similar total input during the BSAP refer-ence period (1997-2003) show a decrease from all HELCOM Contracting Parties except for Latvia (nitrogen and phosphorus), Germany (phosphorus and Russia (nitrogen) (cf. Table 2.8). The reduc-tion of total nitrogen and phosphorus inputs to the Baltic Sea was 9% and 10%, respectively, cor-responding to more than 80,000 tonnes of nitro-gen and nearly 3,800 tonnes of phosphorus. The reduction was higher for some Contracting Parties such as Denmark (nitrogen), Estonia (phosphorus), Finland (nitrogen), Germany (nitrogen), Lithuania (phosphorus), Poland (nitrogen and phosphorus), Russia (phosphorus) and Sweden (nitrogen). The EU20 and other non-HELCOM countries reduced atmospheric deposition of nitrogen with 24% (14,000 tonnes) and 6% (1,600 tonnes) respec-tively, while Baltic Sea Shipping increased with 15% (approximately 1,800 tonnes). It should be underlined that the changes have not been tested for statistical signifi cance and that, for example for Finland, the decrease might be due to that normali-zation of inputs has not adequately smoothened all variations imposed by weather, especially for inputs entering the Bothnian Bay and Bothnian Sea.
Regarding inputs from countries to the different sub-basins, changes in total inputs of nitrogen from the reference period to 2008-2010 indicate
(cf. Table 2.3). A signifi cant increase in atmos-pheric deposition of nitrogen from Russia (44%) is noted; however this is due to the inclusion of emis-sions from a bigger area of the country since 2006.
With regard to waterborne nitrogen inputs to the Baltic Sea (riverine + direct inputs from point sources), only Denmark (36%), Poland (26%), Germany (19%) and Sweden (15%) have signifi -cant reductions with a high statistical confi dence (> 5%); Latvia and Lithuania also have a decrease, but with a confi dence of < 10% (cf. Table 2.3). The total waterborne inputs of phosphorus have been reduced by 19-38% from all countries except Russia and Latvia; from Latvia it increased signifi -cantly with nearly 70% (cf. Table 2.4).
Inputs of nitrogen and phosphorus from direct sources (point sources discharging directly to the Baltic Sea) to the Baltic Sea have signifi cantly decreased from 1994 to 2010 with 43% and 63%, respectively (cf. Table 4.1a). All countries have signifi cantly (confi dence < 5%) reduced their direct nitrogen and phosphorus losses, except Estonia, Poland and Russia whose reductions were not statistically signifi cant. Russia, although had signifi -cant reduction in direct nitrogen inputs. Further, direct inputs of nitrogen increased by 38% from Latvia. The overall reduction in nitrogen and phos-phorus inputs is certain, even though the results of the trend analysis for some countries are uncertain due to changed methodology for defi ning direct point sources. The methodology for estimat-ing changes from 1994 to 2010 assumes a linear development in direct inputs which is not always fulfi lled; to this end, a revised methodology should be implemented for these estimates in future.
Nitrogen and phosphorus inputs for all HELCOM countries and main sub-basins have been tested for trends and signifi cant changes from 1994 to 2010 - the results follow the trends given above for individual countries (cf. Table 2.7). As an example, Denmark has signifi cantly reduced total nitrogen and phosphorus inputs to all sub-basins to which Denmark supplies nitrogen and phospho-rus. Sweden, which has inputs to fi ve sub-basins, has signifi cantly reduced total inputs of nitrogen and phosphorus to the Baltic Sea while there are no signifi cant reductions to the Bothnian Bay or of total phosphorus to the Kattegat. Some Con-tracting Parties (such as Denmark, Finland and
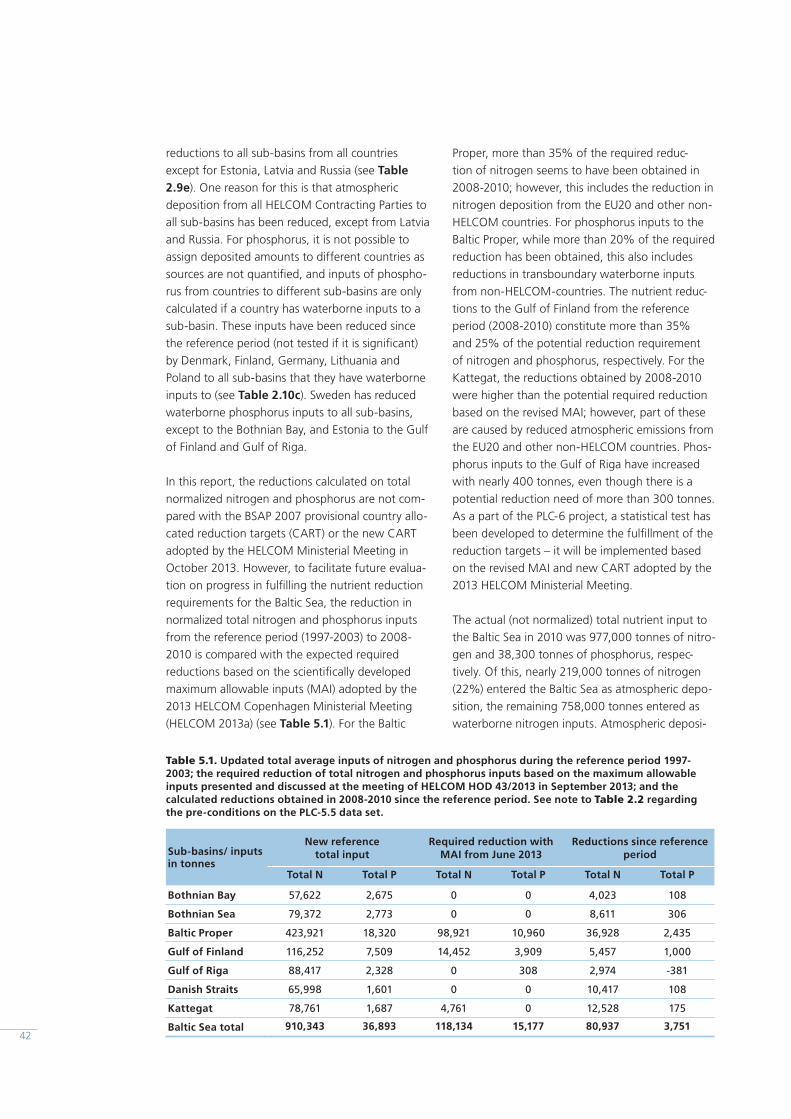
42
Proper, more than 35% of the required reduc-tion of nitrogen seems to have been obtained in 2008-2010; however, this includes the reduction in nitrogen deposition from the EU20 and other non-HELCOM countries. For phosphorus inputs to the Baltic Proper, while more than 20% of the required reduction has been obtained, this also includes reductions in transboundary waterborne inputs from non-HELCOM-countries. The nutrient reduc-tions to the Gulf of Finland from the reference period (2008-2010) constitute more than 35% and 25% of the potential reduction requirement of nitrogen and phosphorus, respectively. For the Kattegat, the reductions obtained by 2008-2010 were higher than the potential required reduction based on the revised MAI; however, part of these are caused by reduced atmospheric emissions from the EU20 and other non-HELCOM countries. Phos-phorus inputs to the Gulf of Riga have increased with nearly 400 tonnes, even though there is a potential reduction need of more than 300 tonnes. As a part of the PLC-6 project, a statistical test has been developed to determine the fulfi llment of the reduction targets – it will be implemented based on the revised MAI and new CART adopted by the 2013 HELCOM Ministerial Meeting.
The actual (not normalized) total nutrient input to the Baltic Sea in 2010 was 977,000 tonnes of nitro-gen and 38,300 tonnes of phosphorus, respec-tively. Of this, nearly 219,000 tonnes of nitrogen (22%) entered the Baltic Sea as atmospheric depo-sition, the remaining 758,000 tonnes entered as waterborne nitrogen inputs. Atmospheric deposi-
reductions to all sub-basins from all countries except for Estonia, Latvia and Russia (see Table 2.9e). One reason for this is that atmospheric deposition from all HELCOM Contracting Parties to all sub-basins has been reduced, except from Latvia and Russia. For phosphorus, it is not possible to assign deposited amounts to different countries as sources are not quantifi ed, and inputs of phospho-rus from countries to different sub-basins are only calculated if a country has waterborne inputs to a sub-basin. These inputs have been reduced since the reference period (not tested if it is signifi cant) by Denmark, Finland, Germany, Lithuania and Poland to all sub-basins that they have waterborne inputs to (see Table 2.10c). Sweden has reduced waterborne phosphorus inputs to all sub-basins, except to the Bothnian Bay, and Estonia to the Gulf of Finland and Gulf of Riga.
In this report, the reductions calculated on total normalized nitrogen and phosphorus are not com-pared with the BSAP 2007 provisional country allo-cated reduction targets (CART) or the new CART adopted by the HELCOM Ministerial Meeting in October 2013. However, to facilitate future evalua-tion on progress in fulfi lling the nutrient reduction requirements for the Baltic Sea, the reduction in normalized total nitrogen and phosphorus inputs from the reference period (1997-2003) to 2008-2010 is compared with the expected required reductions based on the scientifi cally developed maximum allowable inputs (MAI) adopted by the 2013 HELCOM Copenhagen Ministerial Meeting (HELCOM 2013a) (see Table 5.1). For the Baltic
Table 5.1. Updated total average inputs of nitrogen and phosphorus during the reference period 1997-2003; the required reduction of total nitrogen and phosphorus inputs based on the maximum allowable inputs presented and discussed at the meeting of HELCOM HOD 43/2013 in September 2013; and the calculated reductions obtained in 2008-2010 since the reference period. See note to Table 2.2 regarding the pre-conditions on the PLC-5.5 data set.
Sub-basins/ inputs in tonnes
New reference total input
Required reduction with MAI from June 2013
Reductions since reference period
Total N Total P Total N Total P Total N Total P
Bothnian Bay 57,622 2,675 0 0 4,023 108
Bothnian Sea 79,372 2,773 0 0 8,611 306
Baltic Proper 423,921 18,320 98,921 10,960 36,928 2,435
Gulf of Finland 116,252 7,509 14,452 3,909 5,457 1,000
Gulf of Riga 88,417 2,328 0 308 2,974 -381
Danish Straits 65,998 1,601 0 0 10,417 108
Kattegat 78,761 1,687 4,761 0 12,528 175
Baltic Sea total 910,343 36,893 118,134 15,177 80,937 3,751
43
Revi
ew o
f th
e Fi
fth
Balti
c Se
a Po
llutio
n Lo
ad C
ompi
latio
n
PLC-5 report (HELCOM 2011 and HELCOM 2012). The next source inventory will be based on 2014 data and assessed in the PLC-6 report, which is expected in 2017. It is, however, possible to make an overall assessment for some of the inputs sources in 2010. Approximately 55% of the air emissions of nitrogen are NOx, which overall origi-nate from combustion processes such as energy consumption, transport sector, and industrial processes. The remaining 45% are NHx emissions where the main source is ammonia from agricul-ture. Atmospheric deposition constituted 22% of the actual total nitrogen supply to the Baltic Sea in 2010. The top three contributors to atmospheric nitrogen deposition in 2010 were Germany (18%), Poland (14%) and Denmark (7%); however, the EU20 contributed with 18%, other non-HELCOM countries and sources more than 13% and Baltic Sea shipping 6%, meaning that approximately 38% of the nitrogen deposition on the Baltic Sea arrives from emissions outside the HELCOM coun-tries (Figure 4.2). Of the top ten contributors to the nitrogen deposition on the Baltic Sea, four are non-Contracting Parties (Baltic Sea shipping, North Sea shipping, the United Kingdom and France) (Figure 4.3). It is not possible to allocate phospho-rus deposition to sources.
Net transboundary waterborne nitrogen and phosphorus inputs to the Baltic Sea from non- Contracting Parties (Czech, Belarus, Ukraine and Slovakia), taking into account retention within catchments, are only important for some rivers entering the Baltic Proper and the Gulf of Riga (Table 3.3a). In total, 5% of waterborne nitrogen and 6% of total phosphorus that enters Baltic Proper originates from non-Contracting Parties. The corresponding fi gures to the Gulf of Riga for waterborne inputs are 8% nitrogen and 41% phosphorus, respectively.
The waterborne inputs to the Baltic Proper, the Gulf of Riga and the Gulf of Finland include net transboundary inputs from other Contracting Parties. These have been quantifi ed as a basis for discussions on burden-sharing of reduction requirements for sub-basins (Table 3.3b). The net transboundary inputs from HELCOM countries amounted to approximately 8,800 tonnes nitrogen and 370 tonnes phosphorus to Baltic Proper, 7,200 tonnes nitrogen and 410 tonnes phosphorus to the Gulf of Riga and 5,400 tonnes nitrogen and
tion of phosphorus has been calculated by a fi xed deposition rate and amounted to nearly 2,100 tonnes of phosphorus (5%). The Baltic Proper, which has one third of the Baltic Sea catchment area and covers 50% of the Baltic Sea surface area, received 53% of total nitrogen and 55% of total phosphorus input, followed by the Gulf of Finland (13% of total nitrogen and 17% of total phospho-rus inputs, but with 24% of the catchment area) (Table 3.4). The main countries contributing to nitrogen inputs were Poland (30%), Sweden (12%), and Russia (11%) (Figure 3.1a). The largest inputs of phosphorus originated from Poland (37%), Russia (16%) and Sweden (9%) (Figure 3.1b). In 2010, high precipitation occurred over southern and some eastern parts of the Baltic Sea catchment area, leading to very high run-off and nutrient inputs from Poland. The normalized total inputs in 2010 were also considerably lower than the actual total inputs: they amounted to 802,000 tonnes of nitrogen and 32,200 tonnes of phosphorous (Tables 3.2a and 3.2b).
The area-specifi c input of nitrogen into the Baltic Sea was typically highest in sub-regions with intensive agricultural activity and high population densities such as the Danish Straits, the Kattegat and the western part of Baltic Proper with 900-1,900 kg N km-2 (Figure 3.3b). Overall, specifi c inputs are highest in the southwestern and south-ern catchments of the Baltic Sea and lowest in the northern part, for example 100-200 kg N km-2 to the Bothnian Bay and the Bothnian Sea. Parts of southern Finland and the Baltic States also have net inputs over 600 kg N km-2. For phosphorus, the highest area-specifi c losses were found in catchment areas with high population densities, many industries and high agricultural activity, which are more or less the same catchments as for nitrogen (Figure 3.3c). The highest specifi c losses found in the southern and western parts of the catchment amounted to 50-60 kg P km-2. The lowest area-specifi c losses were from the Swedish sub- catchment to the Bothnian Sea with 5-10 kg P km-2. Furthermore, geology, climate, wastewater treatment effi ciency, the frequency of surface run-off and snow/ice cover have an impact on area-specifi c inputs of nutrients.
The PLC-5.5 assessment does not include a source inventory. The latest source apportionment was based on 2006 data and is documented in the
44
situation concerning the PLC data, most notably improved guidance on sampling, quantifi cation and statistical methodologies, standardized ana-lytical methods, and regular intercalibration and bilateral cooperation. While many of these initia-tives have been taken into account in the PLC-6 project, it has not been possible to apply them to already collected data. However, the validation of data, fi lling in data gaps/missing data, correcting suspicious data and the statistical methods are based on standardized methodologies that will be included in the revised PLC guidelines, which are being elaborated by the PLC-6 project. Moreover, intercalibration has been conducted in 2013 and the results will to be used in the PLC-6 project.
50 tonnes phosphorus to the Gulf of Finland. Only for the Gulf of Riga these inputs constitute 10% or more of the total inputs to the sub-basin.
The PLC-5 report (HELCOM 2011 and HELCOM 2012) identifi ed various limitations in the PLC water data. The most important of these have been addressed - signifi cant data gaps and missing data from some areas in the reported data, as well as data that were evaluated as not being valid. Incom-plete and inconsistent data makes trend analysis, the evaluation of input sources and the fulfi llment of the reduction targets more complicated and uncertain. The PLC-5 report also identifi ed several issues to be addressed in order to improve the
6 Acknowledgements
source apportionments and reported the informa-tion to the data consultants. Sincere thanks are due to representatives of all the Contracting Parties who have contributed to the work of the PLC-5.5 project, not only during the expert meetings but also in the collection, compilation, presentation and submission of national data as well as in the checking of the results and commenting on the drafts of this Review of the Fifth Baltic Sea Pollu-tion Load Compilation for the 2013 HELCOM Minis-terial Meeting.
Special thanks go to Pekka Kotilainen (PLC Data Consultant, Finnish Environment Institute), Jerzy Barnicki (EMEP Data Consultant), Bo Gustafsson and Magnus Mörth (BNI Sweden) for making the several fl ow normalization calculations, data aggre-gations and some maps and tables; and Søren E. Larsen (Danish Centre for Environment and Energy, Aarhus University) who carried out several of the statistical trend analyses.
The information presented in this report includes the main results to be presented in the HELCOM PLC-5.5 report (HELCOM, in prep). Data used include new data provided by the HELCOM Con-tracting Parties from 2008-2010, updates and cor-rections to old PLC data; new data provide by the Cooperative Programme for the Monitoring and Evaluation of the Long-Range Transmission of Air Pollutants in Europe (EMEP); and the Baltic Next Institute Stockholm (BNI). This Review of the PLC-5 report was prepared to serve as supporting infor-mation for the HELCOM Ministerial Meeting which was held in Copenhagen, Denmark, on 3 October 2013.
The PLC-5.5 work has only been possible with the close cooperation of the HELCOM Contract-ing Parties - Denmark, Estonia, Finland, Germany, Lithuania, Poland, Russia and Sweden - who carried out the measurements both in the rivers as well as at diffuse and point sources, performed
45
Revi
ew o
f th
e Fi
fth
Balti
c Se
a Po
llutio
n Lo
ad C
ompi
latio
n
7 References
HELCOM (2011). Fifth Baltic Sea Pollution Load Compilation. Baltic Sea Environment Pro-ceedings No. 128.
HELCOM (2012). Fifth Baltic Sea Pollution Load Compilation – An Executive Summary. Baltic Sea Environment Proceedings No. 128A.
HELCOM (2013a). HELCOM Copenhagen Ministe-rial Declaration. Taking further action to implement the Baltic Sea Action Plan – Reaching good environmental status for a healthy Baltic Sea. 3 October 2013, Copen-hagen, Denmark. Adopted on 3 October 2013.
HELCOM (2013b). How a complete PLC-5.5 water data set was obtained. Documentation prepared by the HELCOM PLC-5.5 project group. Available via the HELCOM PLC-5.5 project page on the HELCOM website: http://www.helcom.fi /helcom-at-work/projects/plc-5-5/.
HELCOM (2013c). Popular summary report on the development of revised maximum allowa-ble inputs (MAI) and new country allocated reduction targets (CART) of the Baltic Sea Action Plan. Supporting document of the 2013 HELCOM Copenhagen Ministerial Meeting.
HELCOM (in prep). Updated Fifth Baltic Sea Pollu-tion Load Compilation (PLC-5.5). Baltic Sea Environmental Proceedings xxx.
Hirsch, R.M. and Slack, J.R. and Smith, R.A. (1982). Techniques of trend analysis for monthly water quality data. Water Resources Research, 18, 107-121.
Larsen, S.E. and Svendsen, L.M. (in prep). Sta-tistical aspects in relation to Baltic Sea Pollution Load Compilation (task 1 under HELCOM PLC-6). Department of Bioscience and DCE - Danish Centre for Environment and Energy, Aarhus University.
Ærtebjerg, G., Andersen, J.H. & Hansen, O.S. (eds.) (2003). Nutrients and Eutrophication in Danish Marine Waters. A Challenge for Science and Management. National Envi-ronmental Research Institute. 126 pp.
Bartnicki, J. and Valiyaveetil, S. (2009). Estimation of atmospheric nitrogen deposition to the Baltic Sea in the periods 1997-2003 and 2000-2006. Summary Report for HELCOM. Meteorological Synthesizing Centre-West (MSC-W) of EMEP.
Bartnicki, J. (2012a). Nitrogen emissions to the air in the Baltic Sea area. HELCOM Baltic Sea Environment Fact Sheets 2012.
Bartnicki, J. (2012b). Atmospheric nitrogen deposi-tions to the Baltic Sea during 1995-2009. HELCOM Baltic Sea Environment Fact Sheets 2012.
EMEP (2012). Atmospheric Supply of Nitrogen, Lead, Cadmium, Mercury and Dioxines/ Furanes to the Baltic Sea in 2010.
European Commission (2000). Directive 2000/60/EC of the European Parliament and of the Council of 23 October 2000 establishing a framework for Community action in the fi eld of water policy (Water Framework Directive, WFD).
European Commission (2008). Directive 2008/56/EC of the European Parliament and of the Council of 17 June 2008 establish-ing a framework for community action in the fi eld of marine environmental policy (Marine Strategy Framework Directive, MSFD).
Gustafsson, B.G and Mörth, C.M. (in prep.). Revi-sion of the Maximum Allowable Inputs and CountryAllocation Scheme of the Baltic Sea Action Plan V. 3 with contributions from the BNI team: Bärbel Müller-Karulis, Erik Gustafsson, Bonghi Hong, Christoph Humborg, Steve Lyon, Marmar Nekoro, Miguel Rodriguez-Medina, Oleg Savchuk, Erik Smedberg, Alexander Sokolov, Dennis Swaney, and Fredrik Wulff. Baltic Nest Institute, Stockholm University.
HELCOM (1988). Declaration on the Protection of the Environment of the Baltic Sea. Adopted on 15 February 1988.
HELCOM (2007). Baltic Sea Action Plan. HELCOM Ministerial Meeting. Adopted in Krakow, Poland on 15 November 2007.
46
8 List of defi nitions and abbreviations
Airborne Nutrients carried or distributed by air.
Anthropogenic Caused by human activities.
Atmospheric deposition Airborne nutrients or other chemical substances originating from emissions to the air and deposited from the air on the surface (land and water sur-faces).
BAP Baltic Proper
BAS The entire Baltic Sea (as a sum of the Baltic Sea sub-basins). See the defi ni-tion of sub-basins.
Border river A river that has its outlet to the Baltic Sea at the border between two coun-tries. For these rivers, the inputs to the Baltic Sea are divided between the countries in relation to each country’s share of the total input.
BNI Baltic Nest Institute, Stockholm University, Sweden.
BOB Bothnian Bay
BOS Bothnian Sea
BSAP Baltic Sea Action Plan
Catchment area The area of land bounded by watersheds draining into a body of water (river, basin, reservoir, sea).
Contracting Parties Signatories of the Helsinki Convention (Denmark, Estonia, European Com-mission, Finland, Germany, Latvia, Lithuania, Poland, Russia and Sweden).
Country-Allocated Reduc-tion Targets (CART)
Country-wise requirements to reduce waterborne and airborne nutrient inputs (in tonnes per year) to reach the maximum allowable nutrient input levels in accordance to the Baltic Sea Action Plan.
DCE Danish for the Environment and Energy, Aarhus University, Denmark.
DE Germany
Diffuse sources Sources without distinct points of emission, e.g. agricultural and forest land, natural background sources, scattered dwellings, atmospheric deposition (mainly in rural areas).
DIN and DIP Dissolved inorganic nitrogen and dissolved inorganic phosphorus com-pounds.
Direct Sources Point sources discharging directly to coastal or transitional waters.
DK Denmark
DS Danish Straits
EE Estonia
EMEP Cooperative Programme for Monitoring and Evaluation of the Long-range Transmission of Air Pollutants in Europe.
Eutrophication Condition in an aquatic ecosystem where increased nutrient concentrations stimulate excessive primary production, which leads to an imbalanced func-tion of the ecosystem.
47
Revi
ew o
f th
e Fi
fth
Balti
c Se
a Po
llutio
n Lo
ad C
ompi
latio
n
48
FI Finland
Flow normalization A statistical method that adjusts a data time series by removing the infl uence of variations imposed by river fl ow, e.g. to facilitate assessment of develop-ment in, e.g. nitrogen or phosphorus inputs.
GUF Gulf of Finland
GUR Gulf of Riga
Input ceiling The allowable amount of nitrogen and phosphorus inputs per country and sub-basin. It is calculated by subtracting the CART from the inputs of nitro-gen and phosphorus during the reference period of the BSAP (1997-2003).
KAT Kattegat
HELCOM LOAD HELCOM Expert Group on follow-up of national progress towards reaching BSAP nutrient reduction targets.
LT Lithuania
LV Latvia
Maximum Allowable Input (MAI)
The maximum annual amount of a substance that a Baltic Sea sub-basin may receive and still fulfi ll HELCOM’s ecological objectives for a Baltic Sea unaf-fected by eutrophication.
Monitored areas The catchment area upstream the river monitored point. The chemical moni-toring decides the monitored area in cases where the locations of chemical and hydrological monitoring stations do not coincide.
Monitoring stations Stations where hydrographic and/or chemical parameters are monitored.
MSFD EU Marine Strategy Framework Directive
MWWTP Municipal wastewater treatment plant
Non-Contracting Parties Countries that are not partners to the Helsinki Convention 1992, but that have an indirect effect on the Baltic Sea by contributing with inputs of nutri-ents or other substances via water and/or air.
PL Poland
PLC Pollution Load Compilation
Point sources Municipalities, industries and fi sh farms that discharge (defi ned by location of the outlet) into monitored areas, unmonitored areas or directly to the sea (coastal or transitional waters).
Reference period 1997-2003
Reference input The average normalized water + airborne inputs of nitrogen and phosphorus during 1997-2003 used to calculate the CART and input ceilings.
Retention The amount of a substance lost/retained during transport in soil and/or water including groundwater from the source to a recipient water body. Often, retention is only related to inland surface waters in these guidelines.
49
Revi
ew o
f th
e Fi
fth
Balti
c Se
a Po
llutio
n Lo
ad C
ompi
latio
n
Riverine inputs The amount of a substance carried to the maritime area by a watercourse (natural or man-made) per unit of time.
RU Russia
Statistically signifi cant In statistics, a result is called ‘statistically signifi cant’ if it is unlikely to have occurred by chance. The degree of signifi cance is expressed by the prob-ability, P. P< 0.05 means that the probability for a result to occur by chance is less than 5%.
Sub-basins Sub-division units of the Baltic Sea: the Kattegat (KAT); the Belt Sea (BES); the Western Baltic (WEB); the Danish Straits (DS) which include the Belt Sea (BES) and Western Baltic (WEB); the Baltic Proper (BAP); the Gulf of Riga (GUR); the Gulf of Finland (GUF); the Archipelago Sea (ARC); the Bothnian Sea (BOS); and the Bothnian Bay (BOB). The whole Baltic Sea is abbreviated BAS.
SE Sweden
Transboundary input Transport of an amount of a substance (via air or water) across a country border.
TN and TP Total nitrogen and total phosphorus which includes all fractions of nitrogen and phosphorus.
Unmonitored area Any sub-catchment(s) located downstream of the (riverine) chemical moni-toring point within the catchment and further all unmonitored catchments. It also includes the coastal areas that have been used in former versions of the guidelines.
Waterborne Substances carried or distributed by water.


www.helcom.fi