Embed Size (px)
Citation preview

STORMWATER DESIGN STANDARDS
CITY OF ROLLA STORMWATER DESIGN STANDARDS
Prepared by:
NTEGRITY Engineering, Inc.
1714 East 10th Street P.O. Box 700
Rolla, MO 65402-0700 Phone: (573) 341-2100
Fax: (573) 341-2111
For:
City of Rolla Public Works Department
102 West 9th Street Rolla, Missouri 65402 Phone: (573) 364-5333
Fax: (573) 364-2161
1
Revised Nov 07, 2017 4:28 p.m.
STORMWATER DESIGN STANDARDS
TABLE OF CONTENTS
ARTICLE 1. PLAN REQUIREMENTS ........................................................................................ 8 1.1. DRAWING SIZES..................................................................................................................... 8 1.2. REQUIRED SUBMITTALS ........................................................................................................ 8
ARTICLE 2. GENERAL REQUIREMENTS FOR STORM SEWER CONSTRUCTION ........ 10 2.1. SIZE ..................................................................................................................................... 10 2.2. MATERIALS ......................................................................................................................... 10 2.3. BEDDING AND BACKFILL..................................................................................................... 10 2.4. JOINTS ................................................................................................................................. 11 2.5. CONCRETE PIPE OR CONDUIT STRENGTHS........................................................................... 11 2.6. MONOLITHIC STRUCTURES.................................................................................................. 11 2.7. ALIGNMENT......................................................................................................................... 11 2.8. LOCATION ........................................................................................................................... 12 2.9. FLOWLINE............................................................................................................................ 13 2.10. JUNCTION BOXES AND INLETS ........................................................................................... 13 2.12. OVERFLOW SYSTEM .......................................................................................................... 14
ARTICLE 3. STORM SEWER DESIGN CRITERIA ................................................................. 16 3.1. GENERAL............................................................................................................................. 16 3.2. METHODS FOR COMPUTING PEAK RUNOFF RATES.............................................................. 16
3.2.1. Drainage areas less than 200 acres.............................................................................................................16 3.2.2. Urban drainage areas equal to or greater than 200 acres ...........................................................................19 3.2.3. Rural drainage areas equal to or greater than 200 acres.............................................................................20
3.3. METHODS FOR COMPUTING RUNOFF VOLUMES .................................................................. 20 3.4. METHODS FOR COMPUTING RUNOFF RATES WITH RESPECT TO TIME.................................. 20 3.5. IMPERVIOUS PERCENTAGES AND LAND USE........................................................................ 20 3.6. TIME OF CONCENTRATION................................................................................................... 21
3.6.1. Kerby-Hathaway Formula .........................................................................................................................21 3.6.2. Kirpich Formula.........................................................................................................................................22 3.6.3. Soil Conservation Service Method ............................................................................................................22
3.7. CLOSED CONDUIT CAPACITY............................................................................................... 23 3.7.1. Design Storm .............................................................................................................................................23 3.7.2. Pipe Capacity .............................................................................................................................................23
3.8. HYDRAULIC GRADE LINE FOR CLOSED CONDUITS .............................................................. 26 3.8.1. Friction Loss ..............................................................................................................................................26 3.8.2. Bend Loss and Entrance Loss ....................................................................................................................26 3.8.3. Transition Loss ..........................................................................................................................................27 3.8.4. Junction Loss .............................................................................................................................................27
3.9. HYDRAULIC GRADE LINE LIMITS ........................................................................................ 27 3.10. GUTTER FLOW................................................................................................................... 33 3.11. INLETS ............................................................................................................................... 36
3.11.1. Curb Inlets ...............................................................................................................................................36 3.11.2. Inverts and Pipes......................................................................................................................................38
ARTICLE 4. OPEN CHANNEL DESIGN CRITERIA............................................................... 40 4.1. GENERAL............................................................................................................................. 40 4.2. GENERAL DESIGN REQUIREMENTS ...................................................................................... 40
2
STORMWATER DESIGN STANDARDS
4.3. HYDRAULIC DESIGN OF CHANNEL FLOW ............................................................................ 42 4.3.1. Definitions .................................................................................................................................................42 4.3.2. Manning’s Equation...................................................................................................................................43 4.3.3. Water Surface Profiles ...............................................................................................................................45 4.3.4. Treatment of Rapidly Varied Flow Conditions..........................................................................................46
4.4. CONSTRUCTION REQUIREMENTS ......................................................................................... 46 4.4.1. Restrictions on Alteration of Natural Channels .........................................................................................46 4.4.2. Grass Channels ..........................................................................................................................................46 4.4.3. Trickle Channels........................................................................................................................................46 4.4.4. Geotextile Fabric Reinforced Channel Linings........................................................................................47 4.4.5. Concrete Channels .....................................................................................................................................47 4.4.6. Drop Structures..........................................................................................................................................48
ARTICLE 5. CULVERTS............................................................................................................ 49 5.1. GENERAL............................................................................................................................. 49 5.2. BASIC DESIGN REQUIREMENTS ........................................................................................... 49 5.3. DESIGN CONSIDERATIONS ................................................................................................... 50 5.4. OUTLET VELOCITIES............................................................................................................ 50 5.5. OUTLET PROTECTION .......................................................................................................... 50 5.6. HYDRAULIC DESIGN............................................................................................................ 51
ARTICLE 6. STORMWATER DETENTION............................................................................. 63 6.1. GENERAL............................................................................................................................. 63 6.2. DESIGN CONSIDERATIONS ................................................................................................... 63 6.3. HYDRAULIC / HYDROLOGIC DESIGN ................................................................................... 64 6.4. MAXIMUM DEPTH ............................................................................................................... 65 6.5. LIMITS OF MAXIMUM PONDING........................................................................................... 65 6.6. OUTLET STRUCTURES.......................................................................................................... 65
6.6.1. Principal Outlet Structure ..........................................................................................................................65 6.6.2. Emergency Spillway..................................................................................................................................66
6.7. EASEMENT REQUIRED ......................................................................................................... 67 6.8. MAINTENANCE .................................................................................................................... 67 6.9. REQUIRED SUBMITTALS ...................................................................................................... 67
ARTICLE 7. DAM PERMIT REQUIREMENTS........................................................................ 68
ARTICLE 8. DESIGN EXAMPLE .............................................................................................. 69 8.1. PROJECT CONDITIONS.......................................................................................................... 69 8.2. SOLUTION............................................................................................................................ 69
8.2.1. Stormwater Conveyance System ...............................................................................................................70 8.2.2. Choose a design storm for detention basin design .....................................................................................78 8.2.3. Pick location for detention basin................................................................................................................79 8.2.4. Size detention basin and outlet structure....................................................................................................79 8.2.5. Design Erosion and Sediment Control Plan...............................................................................................79
ARTICLE 9. REFERENCES........................................................................................................ 80
3
STORMWATER DESIGN STANDARDS
LIST OF TABLES
Table 2-1. Allowable storm sewer construction materials and standards................................... 10
Table 2-2. Watertight Pipe Joints................................................................................................. 11
Table 3-1. Runoff coefficients for use in the Rational Method. From Chow, Maidement and Mays, Applied Hydrology, p. 498, McGraw-Hill, 1988. Also from American Society of Civil Engineers, Manuals and Reports of Engineering Practice No. 77 “Design and Construction of Urban Stormwater Management Systems”, p.144, 1992. ............................................................................ 17
Table 3-2. Rational method dimensionless coefficient, k, for various return periods. ................ 18
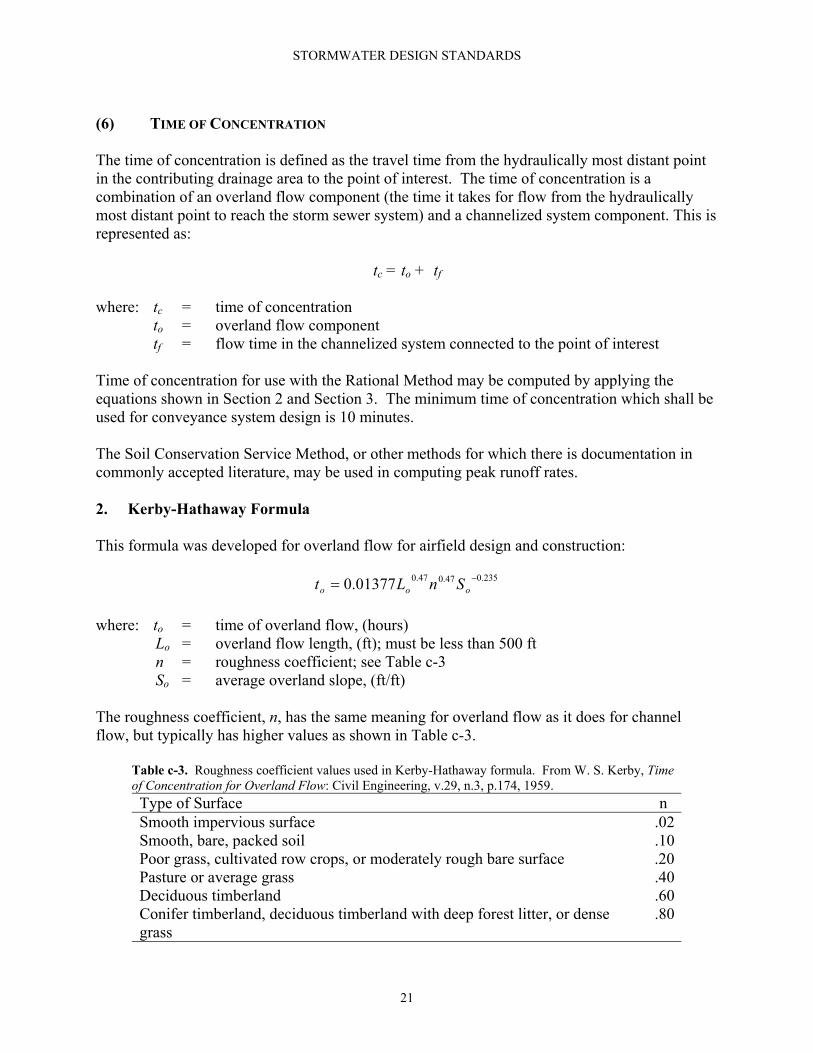
Table 3-3. Roughness coefficient values used in Kerby-Hathaway formula. From W. S. Kerby, Time of Concentration for Overland Flow: Civil Engineering, v.29, n.3, p.174, 1959. ................................................................................................... 21
Table 3-4. Entrance loss coefficients for pipes and culverts; outlet control, full or partly full entrance head loss. From Federal Highway Administration, Hydraulic Design Series No. 5, Report No. FHWA-IP-85-15, “Hydraulic Design of Highway Culverts,” Washington, DC, 1985. ............................................... 30
Table 3-5. Storm sewer energy loss coefficient, expansion and contraction. From Linsley and Franzini Water Resources Engineering. McGraw-Hill, New York, 1964..................................................................................................................... 32
Table 3-6. Limits for flow width in street gutters at the time of peak discharge. From American Public Works Association, Standard Specifications and Design Criteria, Section 5600, APWA, 1985. .......................................................................... 34
Table 4-1. Maximum average allowable channel velocities......................................................... 41
Table 4-2. Value of Manning Coefficient for Various Materials. From American Society of Civil Engineers, Manuals and Reports of Engineering Practice No. 77 “Design and Construction of Urban Stormwater Management Systems”, p.144, 1992................................................................................................... 45
Table 5-1. Culvert discharge velocity limitations........................................................................ 50
4
STORMWATER DESIGN STANDARDS
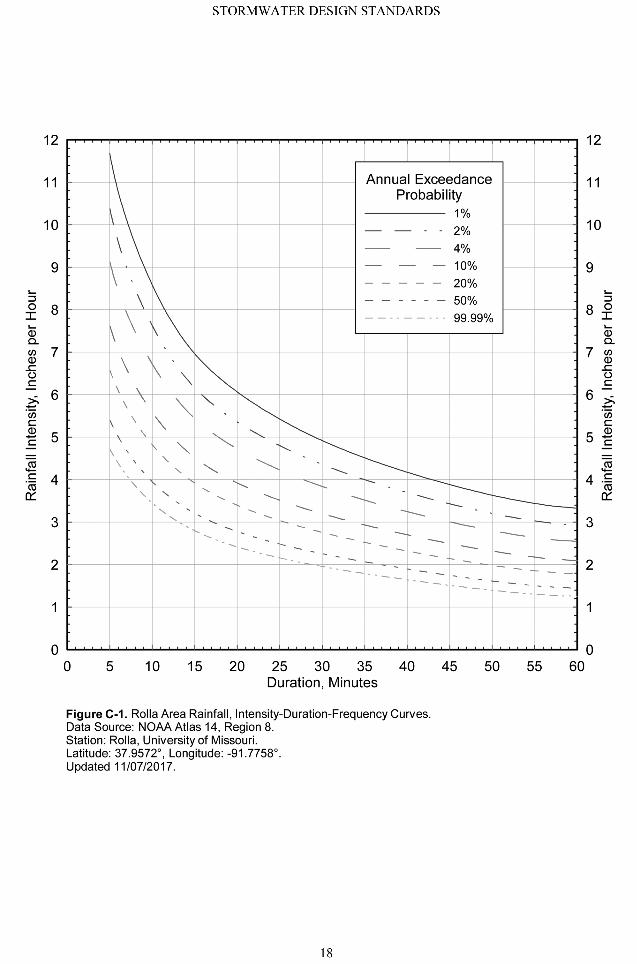
LIST OF FIGURES Figure 3-1. Rolla area Intensity-Duration-Frequency curves. Constructed by Joseph
P. Wilson, Wilson Hydro, LLC. Data from (1) Frederick, Ralph H. Myers, Vance A. Auciello, Eugene P. NOAA Technical Memorandum NWS Hydro-35, “Five-to 60-Minute Precipitation Frequency For the Eastern and Central United States,” Silver Spring, MD, 1977. (2) Huff, Floyd A. Angel, James R. Rainfall Frequency Atlas Of The Midwest, Illinois State Water Survey, Champaign, Bulletin 71, 1992....................................................................................... 18
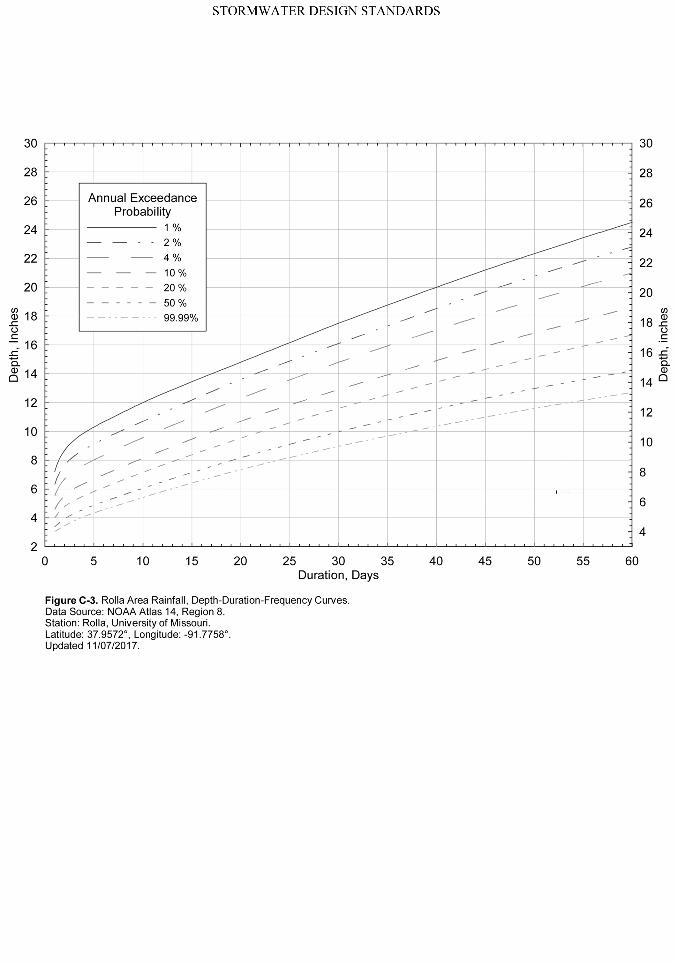
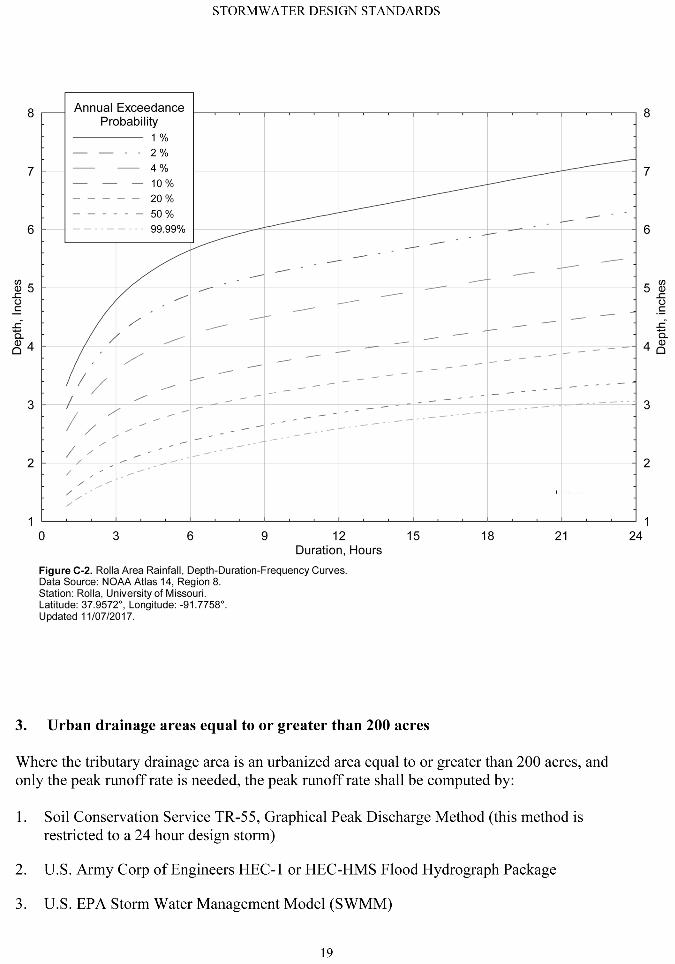
Figure 3-2. Rolla area Depth-Duration-Frequency curves. Constructed by Joseph P. Wilson, Wilson Hydro, LLC. Data from (1) Frederick, Ralph H. Myers, Vance A. Auciello, Eugene P. NOAA Technical Memorandum NWS Hydro-35, “Five-to 60-Minute Precipitation Frequency For the Eastern and Central United States,” Silver Spring, MD, 1977. (2) Huff, Floyd A. Angel, James R. Rainfall Frequency Atlas Of The Midwest, Illinois State Water Survey, Champaign, Bulletin 71, 1992....................................................................................... 19
Figure 3-3. Full flow pipe capacity charts for Manning's n=0.013. Chart (a) shows pipe capacity up to 70 cfs for pipes 12 to 36 inches in diameter. Chart (b) shows pipe capacity from 50 to 550 cfs for pipes 30 to 60 inches in diameter............. 24
Figure 3-4. Full flow pipe capacity charts for Manning's n=0.024. Chart (a) shows pipe capacity up to 40 cfs for pipes 12 to 36 inches in diameter. Chart (b) shows pipe capacity from 40 to 340 cfs for pipes 30 to 60 inches in diameter............. 25
Figure 3-5. Bend loss: Case VII – conduit on 90o curves, Case VIII – bends where radius is equal to diameter of pipe. From City of Austin, Austin Drainage Criteria Manual, 2nd Ed., Watershed Management Division, Austin, TX, 1987. .............................................................................................................................. 28
Figure 3-6. Sewer bend loss coefficient. From K.K. Wright, Urban Storm Drainage Criteria Manual, Volume I, Wright-McLaughlin Engineers, Denver, 1969................. 29
Figure 3-7. Minor head loss due to turbulence at structures: Case I – inlet on main line (a) plan and (b) section , Case II – inlet on main line with branch lateral (a) plan and (b) section, Case III – manhole on main line with 45o branch lateral (a) plan and (b) section, Case IV – manhole on main line with 90o branch lateral (a) plan (b) section, Case V – 45o Wye connection or cut in (a) plan and (b) section, Case VI – inlet or manhole at beginning of line (a) plan and (b) section. From City of Austin, Austin Drainage Criteria Manual, 2nd Ed., Watershed Management Division, Austin, TX, 1987. .................................................. 31
Figure 3-8. Composite Curb and Gutter Cross Section. From Missouri Department of Transportation, Manual of Practice, Figure 9-07.1, Revised 2000............................... 34
Figure 3-9. Nomograph for flow in triangular channels. From American Iron and Steel Institute, Modern Sewer Design, AISI, Washington, D.C., 1985. ....................... 35
5
STORMWATER DESIGN STANDARDS
Figure 3-10. Depth of flow at curb face calculated for standard 30 ft. wide, 4 inch crown, City of Rolla street and gutter section. Calculated using Izzard’s equations for composite cross-section........................................................................... 36
Figure 3-11. Curb opening capacity per unit foot with respect to depth of flow at the curb face, d, and inlet depression, a. Inlet depressions of a = 0, 1, 2, 3 and 4 inches are shown. ....................................................................................................... 38
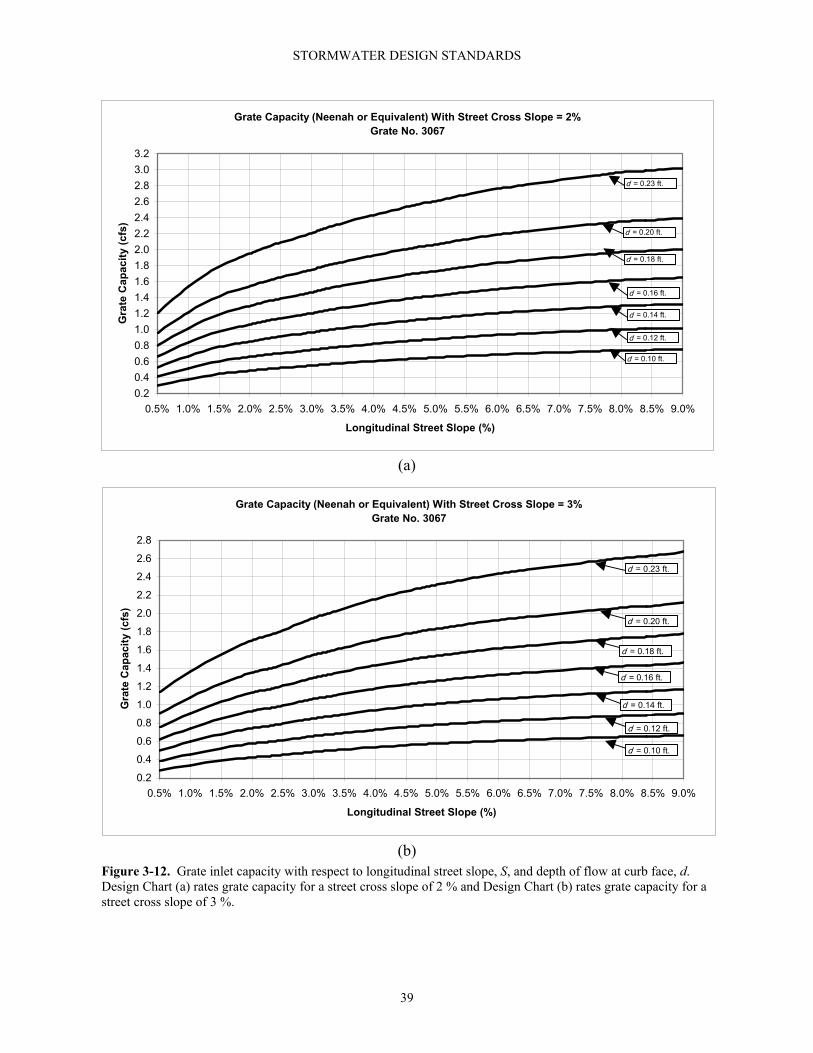
Figure 3-12. Grate inlet capacity with respect to longitudinal street slope, S, and depth of flow at curb face, d. Design Chart (a) rates grate capacity for a street cross slope of 2 % and Design Chart (b) rates grate capacity for a street cross slope of 3 %. ........................................................................................................................... 39
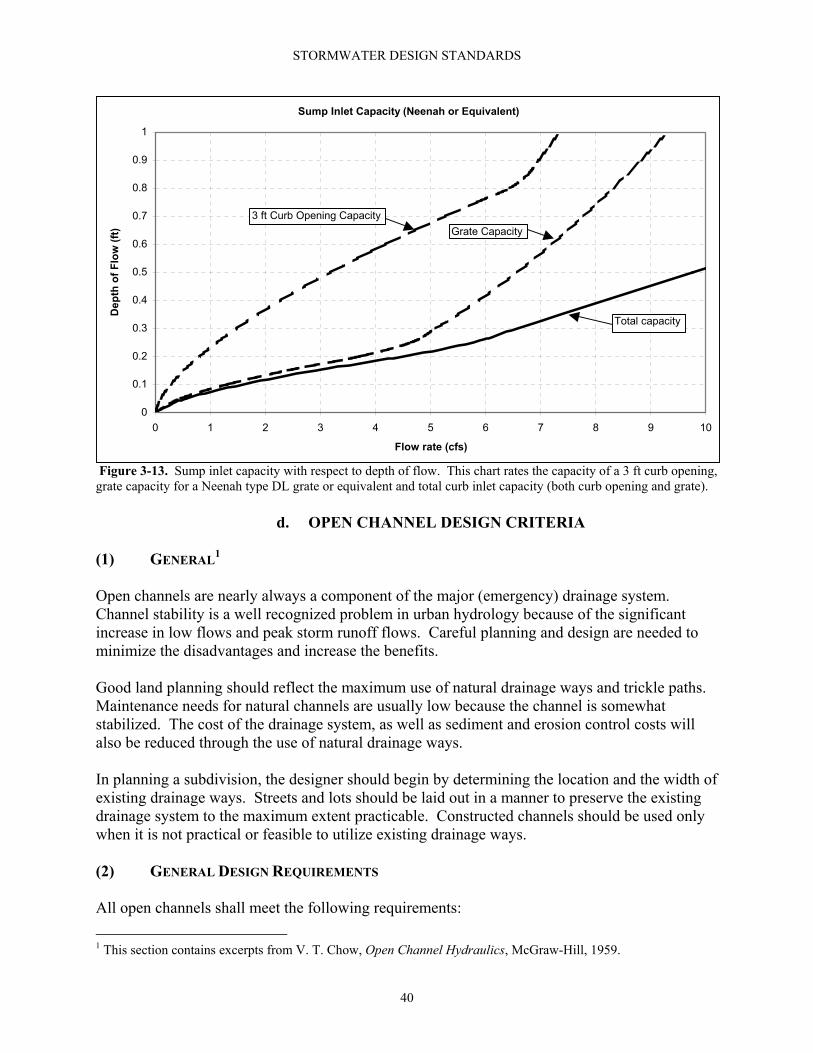
Figure 3-13. Sump inlet capacity with respect to depth of flow. This chart rates the capacity of a 3 ft curb opening, grate capacity for a Neenah type DL grate or equivalent and total curb inlet capacity (both curb opening and grate). ....................... 40
Figure 4-1. Typical grass lined channel with trickle channel. From American Society of Civil Engineers, Manuals and Reports of Engineering Practice No. 77 “Design and Construction of Urban Stormwater Management Systems”, p. 270, 1992. ..................................................................................................................... 47
Figure 5-1. U.S. Dept. of Transportation, Federal Highway Administration HDS No. 5, Hydraulic Design of Highway Culverts, Report No. FHWA-IP-85-15. ................... 52
Figure 5-2. U.S. Dept. of Transportation, Federal Highway Administration HDS No. 5, Hydraulic Design of Highway Culverts, Report No. FHWA-IP-85-15. ................... 53
Figure 5-3. U.S. Dept. of Transportation, Federal Highway Administration HDS No. 5, Hydraulic Design of Highway Culverts, Report No. FHWA-IP-85-15. ................... 54
Figure 5-4. U.S. Dept. of Transportation, Federal Highway Administration HDS No. 5, Hydraulic Design of Highway Culverts, Report No. FHWA-IP-85-15. ................... 55
Figure 5-5. U.S. Dept. of Transportation, Federal Highway Administration HDS No. 5, Hydraulic Design of Highway Culverts, Report No. FHWA-IP-85-15. ................... 56
Figure 5-6. U.S. Dept. of Transportation, Federal Highway Administration HDS No. 5, Hydraulic Design of Highway Culverts, Report No. FHWA-IP-85-15. ................... 57
Figure 5-7. U.S. Dept. of Transportation, Federal Highway Administration HDS No. 5, Hydraulic Design of Highway Culverts, Report No. FHWA-IP-85-15. ................... 58
Figure 5-8. U.S. Dept. of Transportation, Federal Highway Administration HDS No. 5, Hydraulic Design of Highway Culverts, Report No. FHWA-IP-85-15. ................... 59
Figure 5-9. U.S. Dept. of Transportation, Federal Highway Administration HDS No. 5, Hydraulic Design of Highway Culverts, Report No. FHWA-IP-85-15. ................... 60
6
STORMWATER DESIGN STANDARDS
Figure 5-10. U.S. Dept. of Transportation, Federal Highway Administration HDS No. 5, Hydraulic Design of Highway Culverts, Report No. FHWA-IP-85-15. ................... 61
Figure 5-11. U.S. Dept. of Transportation, Federal Highway Administration HDS No. 5, Hydraulic Design of Highway Culverts, Report No. FHWA-IP-85-15. ................... 62
Figure 6-1. Typical inlet arrangements for pond outlet structures. (a) shows a typical single outlet riser pipe for a retention basin. (b) (c) and (d) show several arrangements for detention basin outlet structures with S1, S2 and S3 marking the various outlet stages. From American Society of Civil Engineers, Manuals and Reports of Engineering Practice No. 77 “Design and Construction of Urban Stormwater Management Systems”, p. 270, 1992. .............................................................................................................................. 66
U.S. Soil Conservation Service, Handbook of Channel Design for Soil and Water Conservation. Publications No. SCS-TP-61, U.S. Government Printing Office. Washington, D.C. 1954.
7
STORMWATER DESIGN STANDARDS
a. PLAN REQUIREMENTS (1) DRAWING SIZES Plan sizes shall be uniform for each set. Where practical, plan and profile sheets 24” x 36” are preferred. Minimum drawing size shall be 11” x 17”. Maximum drawing size shall be 36” x 42”. White line prints on blue background will not be approved. Good drafting practice, either manual or automated, at a suitable scale to facilitate the plan review and field construction shall be followed. Scales used shall be limited to common engineering scales. The scale for a residential subdivision shall be a no smaller than 1 inch = 50 feet. The scale for drainage area maps shall be no smaller than 1 inch = 2,000 feet. (2) REQUIRED SUBMITTALS This section is in agreement with Section 15-22 of the Rolla City Code. All plans submitted to the City of Rolla must comply with the requirements of Section 15-22 of the Rolla City Code and this section. Plans submitted shall include: 1. All necessary construction specifications. 2. Basic design criteria including the rainfall intensity, percentage of imperviousness, runoff
coefficients for each tributary basin area in the drainage area, time of concentration, peak flow rates, and any other pertinent design criteria.
3. A vicinity map. 4. Key map of the entire project to scale, showing easements, sewer lines and facilities, both
existing and to be constructed.
5. A drainage area map showing the ridgeline of the area tributary to each inlet, sewer, and channel section in the system. The map shall be labeled with or accompanied by a table summarizing the basic design criteria. The established elevations, gradients and contours of the finished graded surfaces and streets shall be shown in support of the inlet drainage area lines and indicated directions of flow.
6. A subdivision plat, dimensioned and substantially complete.
7. Recorder of Deeds book and page from Phelps County Recorder of Deeds for existing recorded easements when not part of a recorded subdivision plat.
8. All existing and proposed easements and rights-of-way.
9. Plans and profiles of each storm drain, showing location, size, design flow, flowline elevations, gradients and materials; boring information; location, depths and sizes of adjacent or crossing sewer lines and utilities; and special construction requirements such as
8
STORMWATER DESIGN STANDARDS
concrete cradle or encasement, backfill, size and class of pipe. Typical cross sections of swales, ditches or open channels.
10. Summary design information for each component of the stormwater conveyance system shall be submitted on standard 8½” x 11” paper. Design information shall clearly coordinate drainage area, inlet or structure, pipe and design flow with the submitted plans.
11. All elevations shall be based upon U.S.G.S. datum with location of the benchmark indicated on the plans. Acceptable benchmarks include those established by the City of Rolla, Missouri Department of Transportation and the United States Geological Survey.
12. Details of special structures, channel improvements, culverts, transitions, headwalls, aprons and junction chambers, all adequately detailed and dimensioned, including placement of steel in reinforced concrete structures.
13. The location of all utilities anticipated to be encountered during construction shall be shown. Plans must be submitted to all utility companies for verification of conflicts. Storm and sanitary sewers shall be located to comply with State laws and regulations governing such placement.
14. Location of all existing and proposed building facilities with minimum floor elevations where buildings could be impacted by flood waters and location of all existing and proposed utilities on the site.
15. For design of detention facilities, calculations of peak runoff flows shall be provided for all areas which are tributary to the location of the proposed detention facility for both existing conditions and conditions after the planned development of the site. The information shall include the acreage of all areas contributing flow to the site and the present land use by acreage of those areas.
16. Final design and “as built” drawings shall be submitted at completion of the project and shall be compatible with current City CAD software.
9
STORMWATER DESIGN STANDARDS
B. GENERAL REQUIREMENTS FOR STORM SEWER CONSTRUCTION
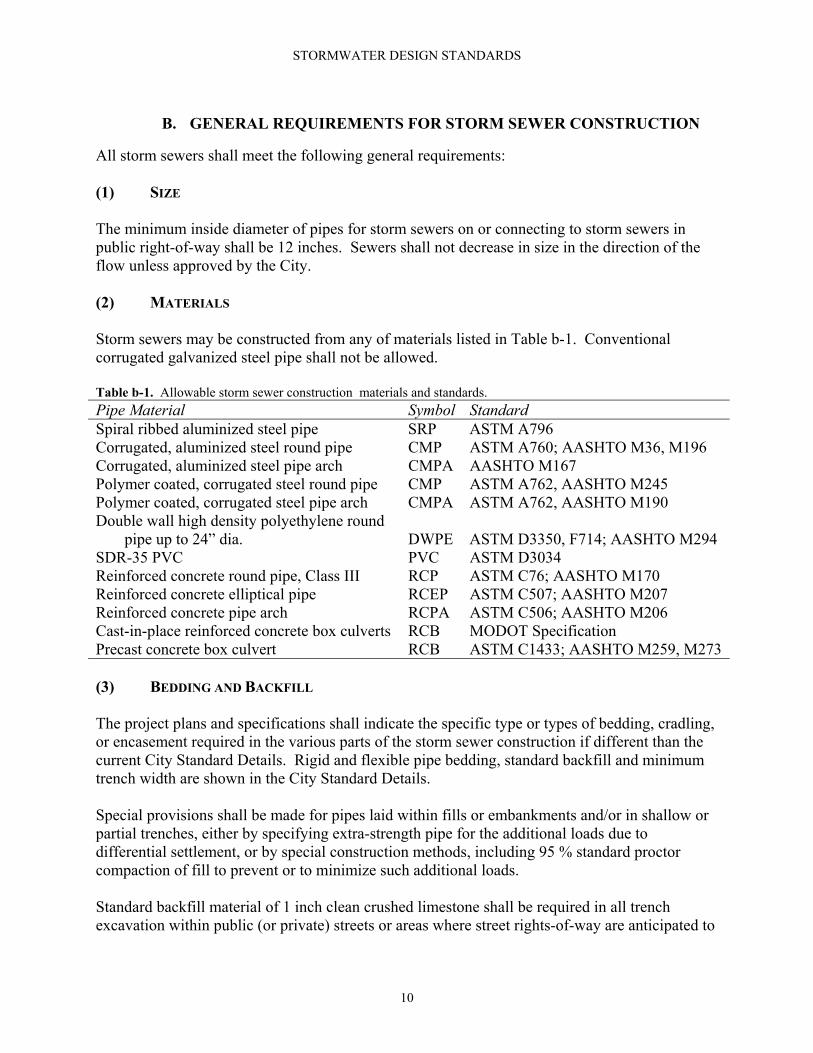
All storm sewers shall meet the following general requirements: (1) SIZE The minimum inside diameter of pipes for storm sewers on or connecting to storm sewers in public right-of-way shall be 12 inches. Sewers shall not decrease in size in the direction of the flow unless approved by the City. (2) MATERIALS Storm sewers may be constructed from any of materials listed in Table b-1. Conventional corrugated galvanized steel pipe shall not be allowed. Table b-1. Allowable storm sewer construction materials and standards. Pipe Material Symbol Standard Spiral ribbed aluminized steel pipe SRP ASTM A796 Corrugated, aluminized steel round pipe CMP ASTM A760; AASHTO M36, M196 Corrugated, aluminized steel pipe arch CMPA AASHTO M167 Polymer coated, corrugated steel round pipe CMP ASTM A762, AASHTO M245 Polymer coated, corrugated steel pipe arch CMPA ASTM A762, AASHTO M190 Double wall high density polyethylene round
pipe up to 24” dia. DWPE ASTM D3350, F714; AASHTO M294 SDR-35 PVC PVC ASTM D3034 Reinforced concrete round pipe, Class III RCP ASTM C76; AASHTO M170 Reinforced concrete elliptical pipe RCEP ASTM C507; AASHTO M207 Reinforced concrete pipe arch RCPA ASTM C506; AASHTO M206 Cast-in-place reinforced concrete box culverts RCB MODOT Specification Precast concrete box culvert RCB ASTM C1433; AASHTO M259, M273 (3) BEDDING AND BACKFILL The project plans and specifications shall indicate the specific type or types of bedding, cradling, or encasement required in the various parts of the storm sewer construction if different than the current City Standard Details. Rigid and flexible pipe bedding, standard backfill and minimum trench width are shown in the City Standard Details. Special provisions shall be made for pipes laid within fills or embankments and/or in shallow or partial trenches, either by specifying extra-strength pipe for the additional loads due to differential settlement, or by special construction methods, including 95 % standard proctor compaction of fill to prevent or to minimize such additional loads. Standard backfill material of 1 inch clean crushed limestone shall be required in all trench excavation within public (or private) streets or areas where street rights-of-way are anticipated to
10
STORMWATER DESIGN STANDARDS
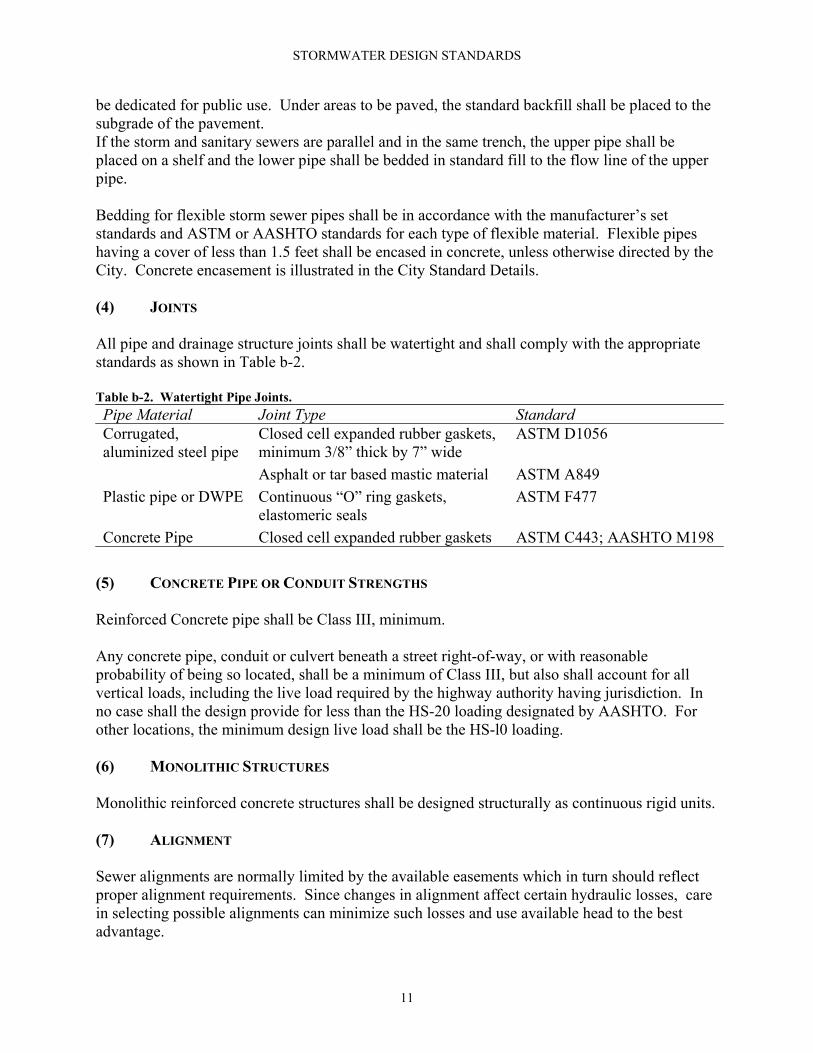
be dedicated for public use. Under areas to be paved, the standard backfill shall be placed to the subgrade of the pavement. If the storm and sanitary sewers are parallel and in the same trench, the upper pipe shall be placed on a shelf and the lower pipe shall be bedded in standard fill to the flow line of the upper pipe. Bedding for flexible storm sewer pipes shall be in accordance with the manufacturer’s set standards and ASTM or AASHTO standards for each type of flexible material. Flexible pipes having a cover of less than 1.5 feet shall be encased in concrete, unless otherwise directed by the City. Concrete encasement is illustrated in the City Standard Details. (4) JOINTS All pipe and drainage structure joints shall be watertight and shall comply with the appropriate standards as shown in Table b-2. Table b-2. Watertight Pipe Joints. Pipe Material Joint Type Standard Corrugated, aluminized steel pipe
Closed cell expanded rubber gaskets, minimum 3/8” thick by 7” wide Asphalt or tar based mastic material
ASTM D1056 ASTM A849
Plastic pipe or DWPE Continuous “O” ring gaskets, elastomeric seals
ASTM F477
Concrete Pipe Closed cell expanded rubber gaskets ASTM C443; AASHTO M198
(5) CONCRETE PIPE OR CONDUIT STRENGTHS Reinforced Concrete pipe shall be Class III, minimum. Any concrete pipe, conduit or culvert beneath a street right-of-way, or with reasonable probability of being so located, shall be a minimum of Class III, but also shall account for all vertical loads, including the live load required by the highway authority having jurisdiction. In no case shall the design provide for less than the HS-20 loading designated by AASHTO. For other locations, the minimum design live load shall be the HS-l0 loading. (6) MONOLITHIC STRUCTURES Monolithic reinforced concrete structures shall be designed structurally as continuous rigid units. (7) ALIGNMENT Sewer alignments are normally limited by the available easements which in turn should reflect proper alignment requirements. Since changes in alignment affect certain hydraulic losses, care in selecting possible alignments can minimize such losses and use available head to the best advantage.
11
STORMWATER DESIGN STANDARDS
Sewers shall be aligned: 1. To be in a straight line between structures, such as junction boxes, inlets, inlet junction
boxes and junction chambers, for all pipe sewers 30 inches in diameter and smaller.
2. To be parallel with or perpendicular to the centerlines of straight streets unless otherwise unavoidable. Deviations may be made only with approval of the City.
3. To avoid meandering, offsetting and unnecessary angular changes.
4. To make angular changes in alignment in a junction box located at the angle point.
5. Curves shall have a minimum radius of ten (10) times the pipe diameter and shall be approved by the City.
6. To avoid angular changes in direction of flow greater than necessary and any exceeding 90 degrees.
(8) LOCATION Storm sewer locations are determined primarily by the requirements of service and purpose. It is also necessary to consider accessibility for construction and maintenance, site availability and competing uses, and effects of easements on private property. Storm sewers shall be located: 1. In rights-of-way or sewer easements dedicated to the City of Rolla.
2. Crossing perpendicular to street, unless otherwise unavoidable.
3. On private property along property lines or immediately adjacent to public streets, avoiding diagonal crossings through the central areas of the property.
4. At a sufficient distance from existing and proposed buildings (including footings) and other sewers to avoid encroachments and reduce construction hazards.
5. A minimum clear distance of 12 inches to any underground utilities to avoid encroachments and reduce construction hazards.
6. To avoid interference between other stormwater sewers and house connections to sanitary sewers.
7. To serve all property conveniently and to best advantage.
12
STORMWATER DESIGN STANDARDS
(9) FLOWLINE The flowline of storm sewers shall meet the following requirements: 1. When changing pipe diameters, the inside tops of pipes shall be set at the same elevation. A
minimum vertical drop of 0.2 feet shall always be provided across a junction structure unless otherwise approved.
2. Gradient changes in successive reaches normally shall be consistent and regular. Gradient designations less than the nearest 0.01 %, except under special circumstances and for larger sewers, shall be avoided.
3. Sewer depths shall be determined primarily by the requirements of pipe or conduit size, utility obstructions, required connections, future extensions and adequate cover.
4. Stormwater pipes discharging into lakes shall have the discharge flowline a minimum of 3 feet above the lake bottom at the discharge point or no higher than the normal water line.
5. A concrete anchor is required when the grade of a sewer is 20 % or greater. A special design and specification is required for grades exceeding 50 %.
6. For sewers with a design grade less than 1 %, field verification of the sewer grade will be required for each installed reach of sewer, prior to any surface restoration or installation of any surface improvements.
7. The City may require the submittal of revised hydraulic calculations for any sewer reach having an as-built grade flatter than the design grade by more than 0.l %. Based on a review of this hydraulic information, the City may require the removal and replacement of any portion of the sewer required to ensure sufficient hydraulic capacity of the system.
(10) JUNCTION BOXES AND INLETS Junction boxes and inlets provide access to sewers for purposes of inspection, maintenance and repair. They also serve as junction structures for lines and as entry points for flow. Requirements of sewer maintenance determine the main construction characteristics of junction boxes and inlets. 1. Precast concrete junction boxes shall conform to the requirements of ASTM C478. Cast in
place circular junction boxes are not permitted.
2. Concrete block junction boxes shall be made of 8in x 8in x 16in heavy weight concrete masonry units with all cells being grouted and vertical reinforcing steel placed 16 inches on center.
3. For sewers 30 inches in diameter or smaller, junction boxes or inlets shall be located at changes in direction; changes in size of pipe; changes in flowline gradient of pipes, and at junction points with sewers and inlet lines.
13
STORMWATER DESIGN STANDARDS
For sewers 36 inches in diameter and larger, junction boxes or inlets shall be located on special structures at junction points with other sewers and at changes of size, alignment change and gradient. A junction box shall be located at one end of a short curve and at each end of a long curve.
4. Spacing of junction boxes or inlets shall not exceed 500 feet for pipe sewers 36 inches in diameter and smaller; 600 feet for pipe sewers 42 inches in diameter and larger, except under special approved conditions. Spacing shall be approximately equal, whenever possible.
5. When large volumes of stormwater are permitted to drop into a junction box from lines 21 inches or larger, the junction box bottom and walls below the top of such lines shall be of reinforced concrete.
6. Junction boxes and inlets shall be avoided in driveways or sidewalks.
7. Connections to existing structures may require rehabilitation or reconstruction of the structure being utilized. This work will be considered part of the project being proposed.
8. When a project requires a junction box or inlet to be adjusted to grade, a maximum of 12 inches of rise is allowed if not previously adjusted. When adjustments to raise or lower a junction box is required, the method of adjustment must be stated on the project plans and approved by the City.
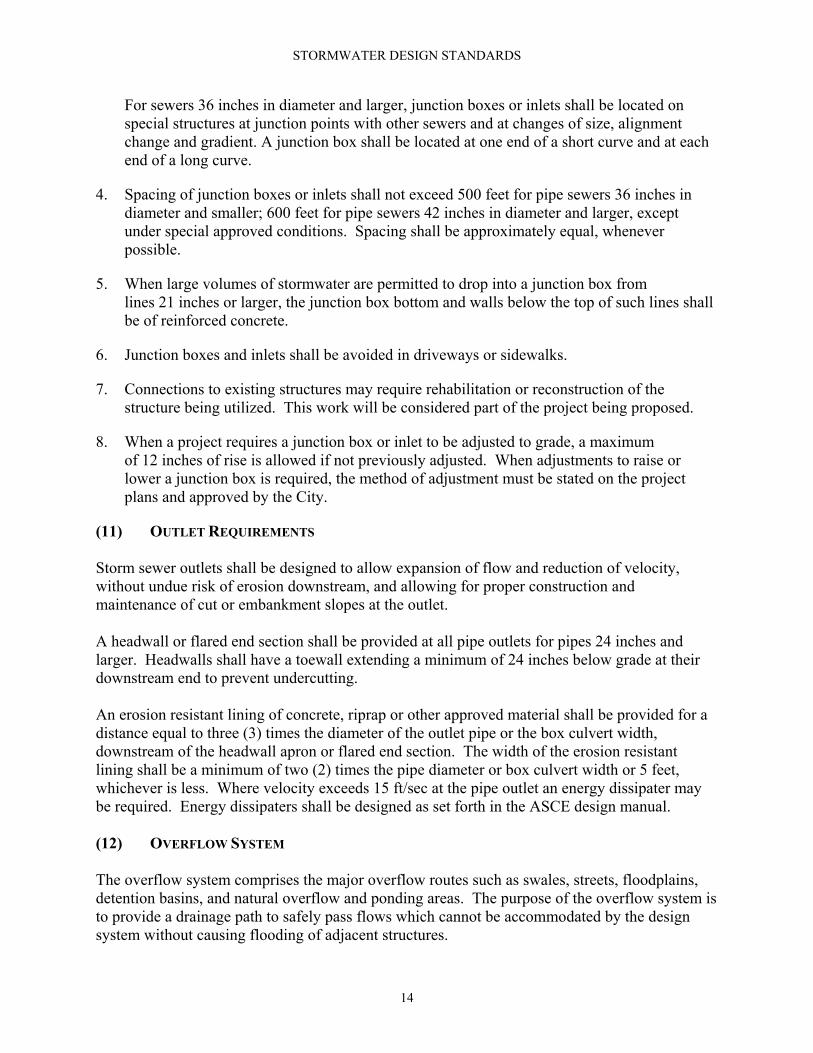
(11) OUTLET REQUIREMENTS Storm sewer outlets shall be designed to allow expansion of flow and reduction of velocity, without undue risk of erosion downstream, and allowing for proper construction and maintenance of cut or embankment slopes at the outlet. A headwall or flared end section shall be provided at all pipe outlets for pipes 24 inches and larger. Headwalls shall have a toewall extending a minimum of 24 inches below grade at their downstream end to prevent undercutting. An erosion resistant lining of concrete, riprap or other approved material shall be provided for a distance equal to three (3) times the diameter of the outlet pipe or the box culvert width, downstream of the headwall apron or flared end section. The width of the erosion resistant lining shall be a minimum of two (2) times the pipe diameter or box culvert width or 5 feet, whichever is less. Where velocity exceeds 15 ft/sec at the pipe outlet an energy dissipater may be required. Energy dissipaters shall be designed as set forth in the ASCE design manual. (12) OVERFLOW SYSTEM The overflow system comprises the major overflow routes such as swales, streets, floodplains, detention basins, and natural overflow and ponding areas. The purpose of the overflow system is to provide a drainage path to safely pass flows which cannot be accommodated by the design system without causing flooding of adjacent structures.
14

STORMWATER DESIGN STANDARDS
The criteria for the design of the overflow and design systems shall be as follows: 1. The overflow system shall be designed for the 100-year design storm. The capacity of the
overflow system shall be verified with hydraulic calculations at critical cross-sections. The overflow system shall be directed to the detention facility, or as approved by the City.
2. The lowest finished floor elevation of all structures adjacent to the overflow system swales shall be at least 1 foot above the 100-year design storm high water elevation.
3. Where the topography will not allow for an overland flow path the storm sewer shall be designed to carry the 100-year design storm.
4. The overflow system shall be designated on the drainage area map and on the grading plan.
5. All overflow systems will be considered on a site-specific basis.
15
STORMWATER DESIGN STANDARDS
C. STORM SEWER DESIGN CRITERIA
(1) GENERAL Stormwater conveyance systems provide the facility for removing and transporting surface runoff produced from rainfall. Design requirements differ from those for either sanitary or combined sewers. All stormwater conveyance systems shall be designed to accommodate peak flows from a 10-year design storm. The design storm shall have a rainfall intensity approximately equal to the time of concentration of the watershed or shall be of a duration which will produce the maximum runoff at the point of interest, depending on the method used to compute runoff. This section gives the minimum technical design requirements for the City of Rolla storm drainage facilities. In general, the equations and charts presented here for hydraulic design represent acceptable procedures not necessarily to the exclusion of other technically sound methods. Any departure from these design requirements should be discussed before submission of plans for approval and should be justified. (2) METHODS FOR COMPUTING PEAK RUNOFF RATES 2. Drainage areas less than 200 acres Where the tributary drainage area is less than 200 acres, and only the peak runoff rate is needed, the peak runoff rate may be computed by the Rational Method as described below. Peak flow rates for designing inlets and conveyance systems (storm drains and open channels) for most developments can be computed by this method. The Rational Method or variations of the Rational Method are not reliable for use in determining total runoff volumes. The Rational Equation is as follows:
Q = k C i A where: Q = peak runoff rate, (ft3/sec) k = dimensionless coefficient to account for antecedent precipitation for return
periods greater than 10 years; the product of k⋅C should not exceed 1.0; see Table c-2 for values
C = dimensionless runoff coefficient based on runoff from pervious and impervious surfaces; see Table c-1
i = average intensity of rainfall, (in/hr), for a given duration and frequency; the storm duration should be approximately equal to the time of concentration for the tributary watershed area; see Figure c-1and Figure c-2 for IDF and DDF curves
A = tributary watershed area, (acres)
16
STORMWATER DESIGN STANDARDS
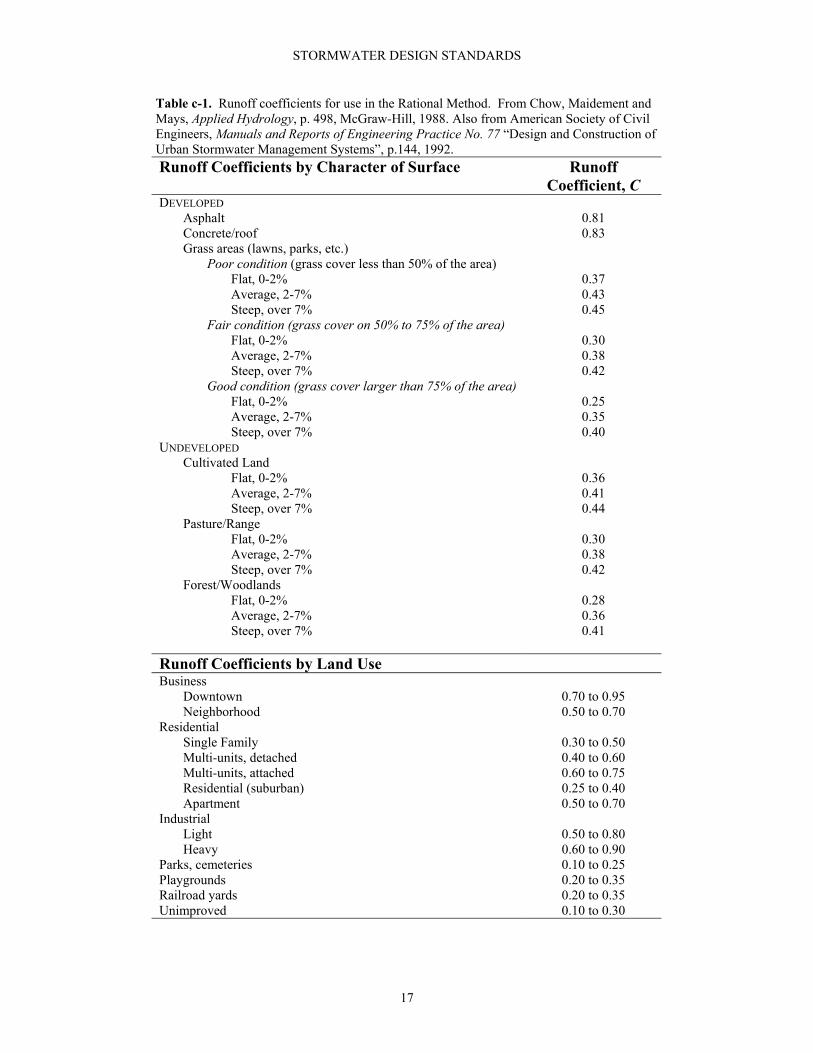
Table c-1. Runoff coefficients for use in the Rational Method. From Chow, Maidement and Mays, Applied Hydrology, p. 498, McGraw-Hill, 1988. Also from American Society of Civil Engineers, Manuals and Reports of Engineering Practice No. 77 “Design and Construction of Urban Stormwater Management Systems”, p.144, 1992. Runoff Coefficients by Character of Surface Runoff
Coefficient, C DEVELOPED
Asphalt 0.81 Concrete/roof 0.83 Grass areas (lawns, parks, etc.)
Poor condition (grass cover less than 50% of the area) Flat, 0-2% 0.37 Average, 2-7% 0.43 Steep, over 7% 0.45
Fair condition (grass cover on 50% to 75% of the area) Flat, 0-2% 0.30 Average, 2-7% 0.38 Steep, over 7% 0.42
Good condition (grass cover larger than 75% of the area) Flat, 0-2% 0.25 Average, 2-7% 0.35 Steep, over 7% 0.40
UNDEVELOPED Cultivated Land
Flat, 0-2% 0.36 Average, 2-7% 0.41 Steep, over 7% 0.44
Pasture/Range Flat, 0-2% 0.30 Average, 2-7% 0.38 Steep, over 7% 0.42
Forest/Woodlands Flat, 0-2% 0.28 Average, 2-7% 0.36 Steep, over 7% 0.41
Runoff Coefficients by Land Use Business
Downtown 0.70 to 0.95 Neighborhood 0.50 to 0.70
Residential Single Family 0.30 to 0.50 Multi-units, detached 0.40 to 0.60 Multi-units, attached 0.60 to 0.75 Residential (suburban) 0.25 to 0.40 Apartment 0.50 to 0.70
Industrial Light 0.50 to 0.80 Heavy 0.60 to 0.90
Parks, cemeteries 0.10 to 0.25 Playgrounds 0.20 to 0.35 Railroad yards 0.20 to 0.35 Unimproved 0.10 to 0.30
17
STORMWATER DESIGN STANDARDS
4. Rural drainage areas equal to or greater than 200 acres Where the tributary drainage area is a rural area equal to or greater than 200 acres, and only the peak runoff rate is needed, the peak runoff rate shall be computed by any of the methods mentioned in Section 3. In addition to the methods mentioned in Section 3, the U.S.G.S. Technique for Estimating the 2 to 500-year Flood Discharges on Unregulated Streams in Rural Missouri may be used. (3) METHODS FOR COMPUTING RUNOFF VOLUMES Runoff volumes shall be computed using any of the following methods: 1. Soil Conservation Service TR-55
2. U.S. Army Corp of Engineers HEC-1 or HEC-HMS Flood Hydrograph Package
3. U.S. EPA Storm Water Management Model (SWMM)
(4) METHODS FOR COMPUTING RUNOFF RATES WITH RESPECT TO TIME When runoff rates must be known as a function of time, such as for reservoir routing computations or when the limitations of the methods listed above are exceeded, hydrograph methods must be used. Commonly accepted hydrograph methods are: 1. Soil Conservation Service TR-55
2. U.S. Army Corp of Engineers HEC-1 or HEC-HMS Flood Hydrograph Package
3. U.S. EPA Storm Water Management Model (SWMM)
Other Methods may be used upon written approval of the City Engineer, provided that they are documented in accepted engineering literature and are used within the limitations stated. (5) IMPERVIOUS PERCENTAGES AND LAND USE The design Engineer shall provide adequate detailed computations for any proposed, expected or contingent increases in imperviousness and shall make adequate allowances for changes in zoning use. If consideration is to be given to any other value than the above for such development, the request must be made at the beginning of the project, must be reasonable, fully supported, and adequately presented, and must be approved in writing before its use is permitted. Although areas generally will be developed in accordance with current zoning requirements, recognition must be given to the fact that zoning ordinances can be amended to change the currently proposed types of development, and any existing use. Under these circumstances the possibility and the probability of residential areas haying lot sizes changed or rezoned to business, commercial, or light manufacturing uses should be given careful consideration.
20
STORMWATER DESIGN STANDARDS
(6) TIME OF CONCENTRATION The time of concentration is defined as the travel time from the hydraulically most distant point in the contributing drainage area to the point of interest. The time of concentration is a combination of an overland flow component (the time it takes for flow from the hydraulically most distant point to reach the storm sewer system) and a channelized system component. This is represented as:
tc = to + tf where: tc = time of concentration to = overland flow component tf = flow time in the channelized system connected to the point of interest Time of concentration for use with the Rational Method may be computed by applying the equations shown in Section 2 and Section 3. The minimum time of concentration which shall be used for conveyance system design is 10 minutes. The Soil Conservation Service Method, or other methods for which there is documentation in commonly accepted literature, may be used in computing peak runoff rates. 2. Kerby-Hathaway Formula This formula was developed for overland flow for airfield design and construction:
235.047.047.001377.0 −= ooo SnLt where: to = time of overland flow, (hours) Lo = overland flow length, (ft); must be less than 500 ft n = roughness coefficient; see Table c-3 So = average overland slope, (ft/ft) The roughness coefficient, n, has the same meaning for overland flow as it does for channel flow, but typically has higher values as shown in Table c-3.
Table c-3. Roughness coefficient values used in Kerby-Hathaway formula. From W. S. Kerby, Time of Concentration for Overland Flow: Civil Engineering, v.29, n.3, p.174, 1959. Type of Surface n Smooth impervious surface .02Smooth, bare, packed soil .10Poor grass, cultivated row crops, or moderately rough bare surface .20Pasture or average grass .40Deciduous timberland .60Conifer timberland, deciduous timberland with deep forest litter, or dense grass
.80
21
STORMWATER DESIGN STANDARDS
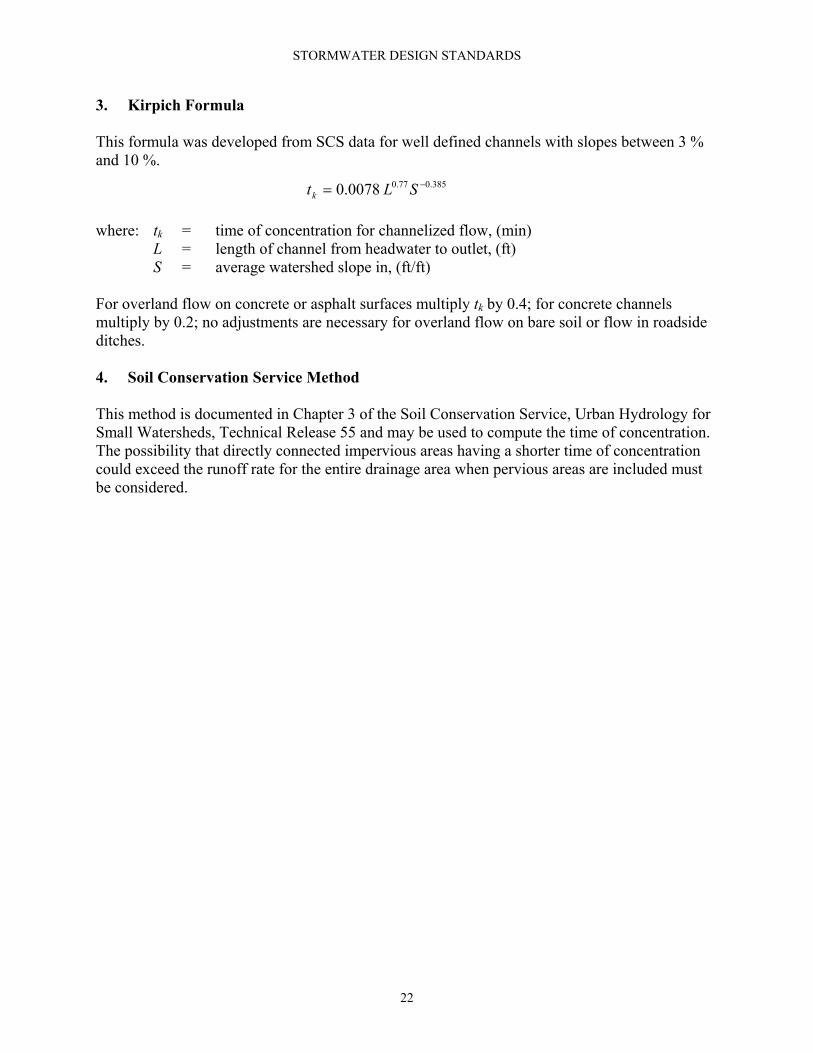
3. Kirpich Formula This formula was developed from SCS data for well defined channels with slopes between 3 % and 10 %.
385.077.00078.0 −= SLtk
where: tk = time of concentration for channelized flow, (min) L = length of channel from headwater to outlet, (ft) S = average watershed slope in, (ft/ft) For overland flow on concrete or asphalt surfaces multiply tk by 0.4; for concrete channels multiply by 0.2; no adjustments are necessary for overland flow on bare soil or flow in roadside ditches. 4. Soil Conservation Service Method This method is documented in Chapter 3 of the Soil Conservation Service, Urban Hydrology for Small Watersheds, Technical Release 55 and may be used to compute the time of concentration. The possibility that directly connected impervious areas having a shorter time of concentration could exceed the runoff rate for the entire drainage area when pervious areas are included must be considered.
22
STORMWATER DESIGN STANDARDS
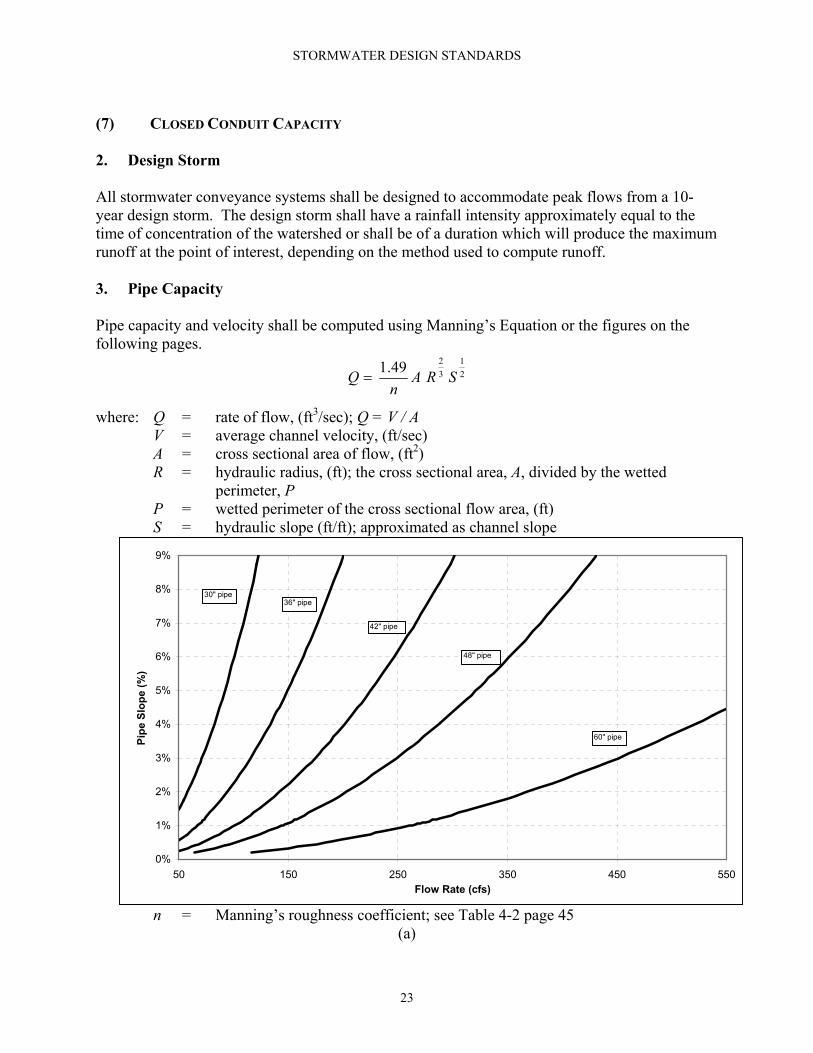
(7) CLOSED CONDUIT CAPACITY 2. Design Storm All stormwater conveyance systems shall be designed to accommodate peak flows from a 10-year design storm. The design storm shall have a rainfall intensity approximately equal to the time of concentration of the watershed or shall be of a duration which will produce the maximum runoff at the point of interest, depending on the method used to compute runoff. 3. Pipe Capacity Pipe capacity and velocity shall be computed using Manning’s Equation or the figures on the following pages.
21
3249.1 SRA
nQ =
where: Q = rate of flow, (ft3/sec); Q = V / A V = average channel velocity, (ft/sec) A = cross sectional area of flow, (ft2) R = hydraulic radius, (ft); the cross sectional area, A, divided by the wetted
perimeter, P P = wetted perimeter of the cross sectional flow area, (ft) S = hydraulic slope (ft/ft); approximated as channel slope
n = Manning’s roughness coefficient; see Table 4-2 page 45
0%
1%
2%
3%
4%
5%
6%
7%
8%
9%
50 150 250 350 450 550Flow Rate (cfs)
Pipe
Slo
pe (%
)
30" pipe
60" pipe
48" pipe
42" pipe
36" pipe
(a)
23
STORMWATER DESIGN STANDARDS
0%
1%
2%
3%
4%
5%
6%
7%
8%
9%
0 10 20 30 40 50 60 7Flow Rate (cfs)
Pipe
Slo
pe (%
)
12" pipe
24" pipe
21" pipe
18" pipe15" pipe
30" pipe
36" pipe
0
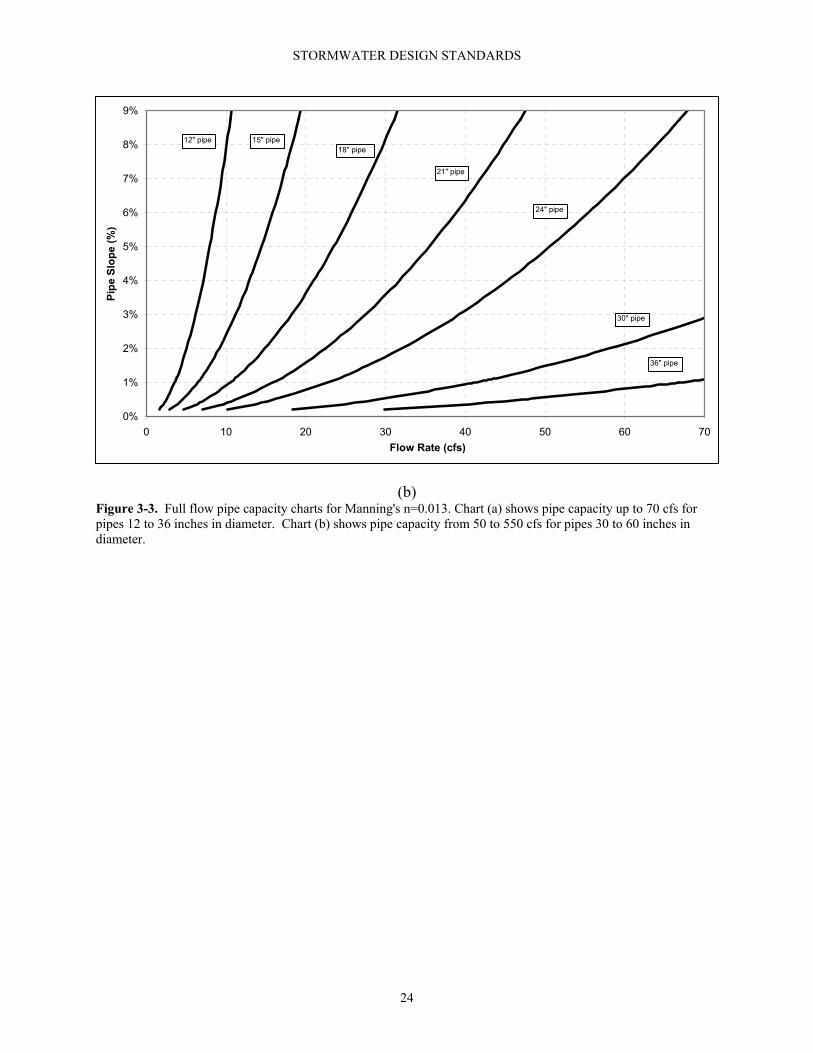
(b) Figure 3-3. Full flow pipe capacity charts for Manning's n=0.013. Chart (a) shows pipe capacity up to 70 cfs for pipes 12 to 36 inches in diameter. Chart (b) shows pipe capacity from 50 to 550 cfs for pipes 30 to 60 inches in diameter.
24
STORMWATER DESIGN STANDARDS
(a)
0%
1%
2%
3%
4%
5%
6%
7%
8%
9%
0 5 10 15 20 25 30 35 40
Flow Rate (cfs)
Pipe
Slo
pe (%
)
12" pipe
24" pipe
21" pipe
18" pipe
15" pipe
30" pipe
36" pipe
(b)
0%
1%
2%
3%
4%
5%
6%
7%
8%
9%
40 90 140 190 240 290 340
Flow Rate (cfs)
Pipe
Slo
pe (%
)
30" pipe
60" pipe
48" pipe
42" pipe36" pipe
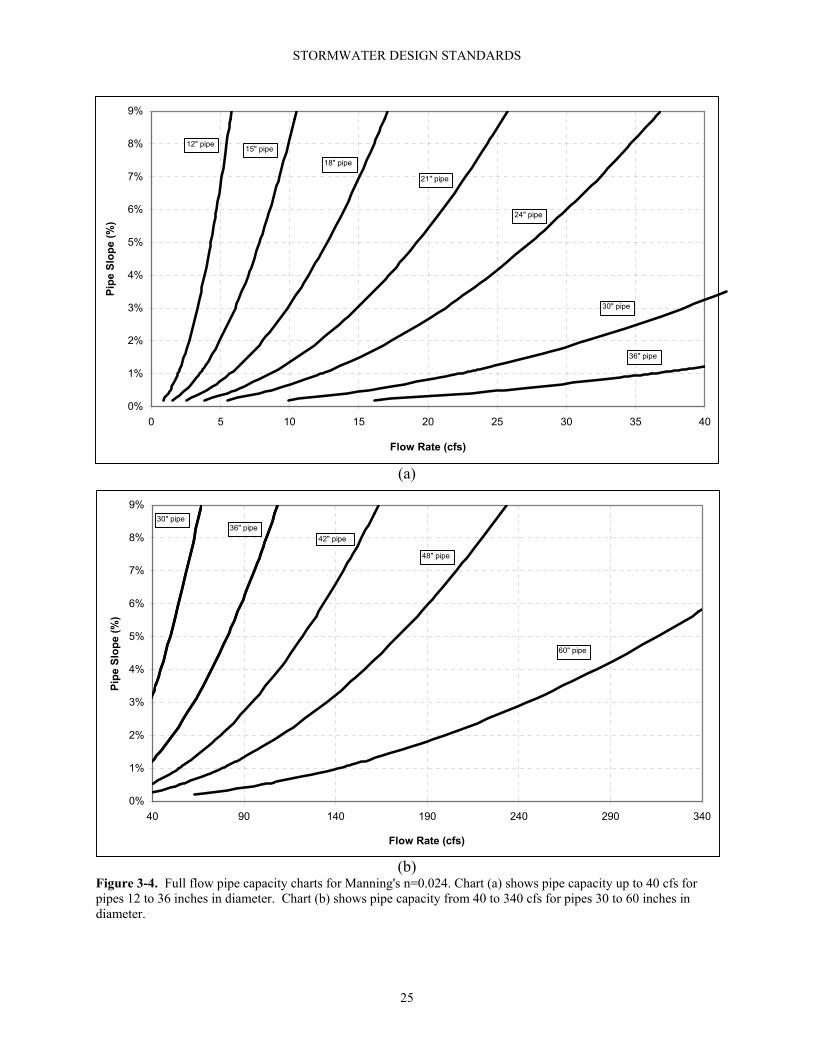
Figure 3-4. Full flow pipe capacity charts for Manning's n=0.024. Chart (a) shows pipe capacity up to 40 cfs for pipes 12 to 36 inches in diameter. Chart (b) shows pipe capacity from 40 to 340 cfs for pipes 30 to 60 inches in diameter.
25
STORMWATER DESIGN STANDARDS
(8) HYDRAULIC GRADE LINE FOR CLOSED CONDUITS The hydraulic grade line (HGL) is a line coinciding with (a) the level of flowing water at any given point along an open channel, or (b) the level to which water would rise in a vertical tube connected to any point along a pipe or closed conduit flowing under pressure. The HGL elevation shall be computed at all structures and junction points of flow in pipes, conduits and open channels. The storm sewer system design shall account for friction loss, as well as local energy losses, and resulting elevation changes in the HGL as required below. Since the HGL is based on design flow in a given size of pipe, conduit or channel, it is important in determining minimum acceptable pipe size within narrow limits. Sizes larger than the required minimum generally provide extra capacity, however consideration still must be given to respective pipe system losses. There are several methods of calculating losses in storm sewer design. The following procedures are presented for the Engineer’s information and consideration. 2. Friction Loss The HGL is affected by friction loss and local energy losses. Friction loss accounts for the pressure gradient or water surface slope necessary to maintain flow in a straight alignment against resistance because of pipe or channel roughness. Friction loss is determined by the equation:
hf = L x Sh where: hf = difference in water surface elevation along pipe or channel length, L, (ft) L = length of pipe or channel, (ft) Sh = hydraulic slope required for a pipe of given diameter or channel of given
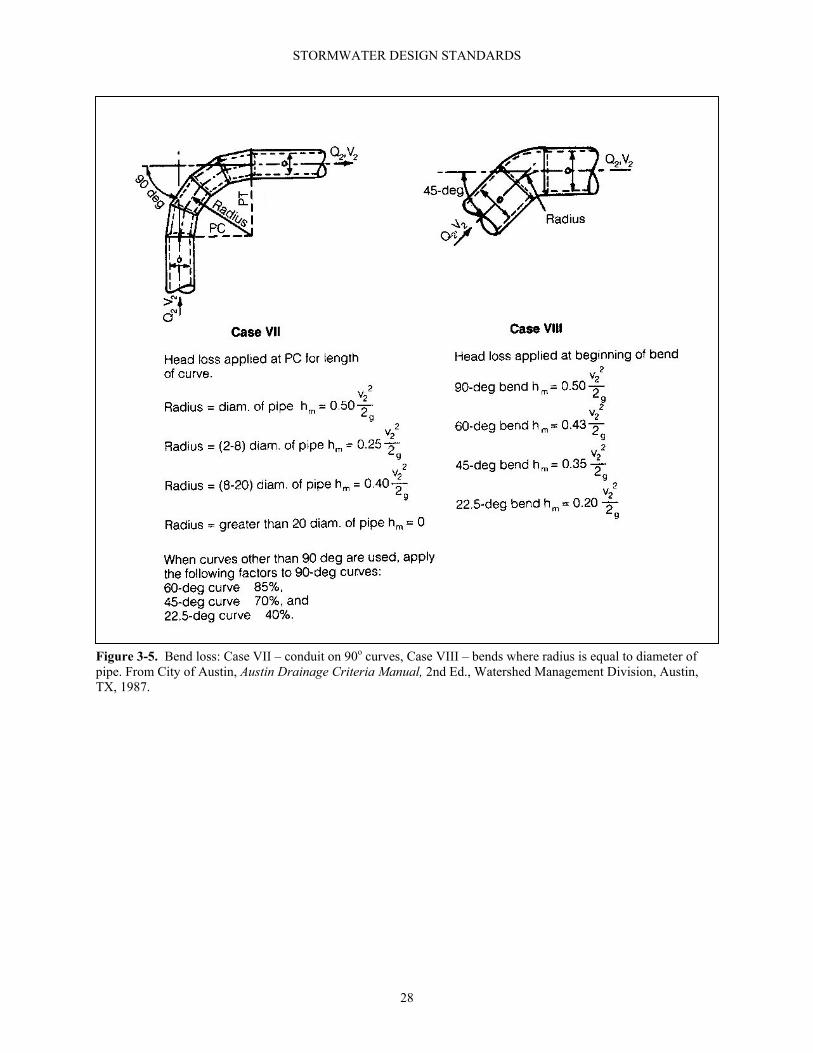
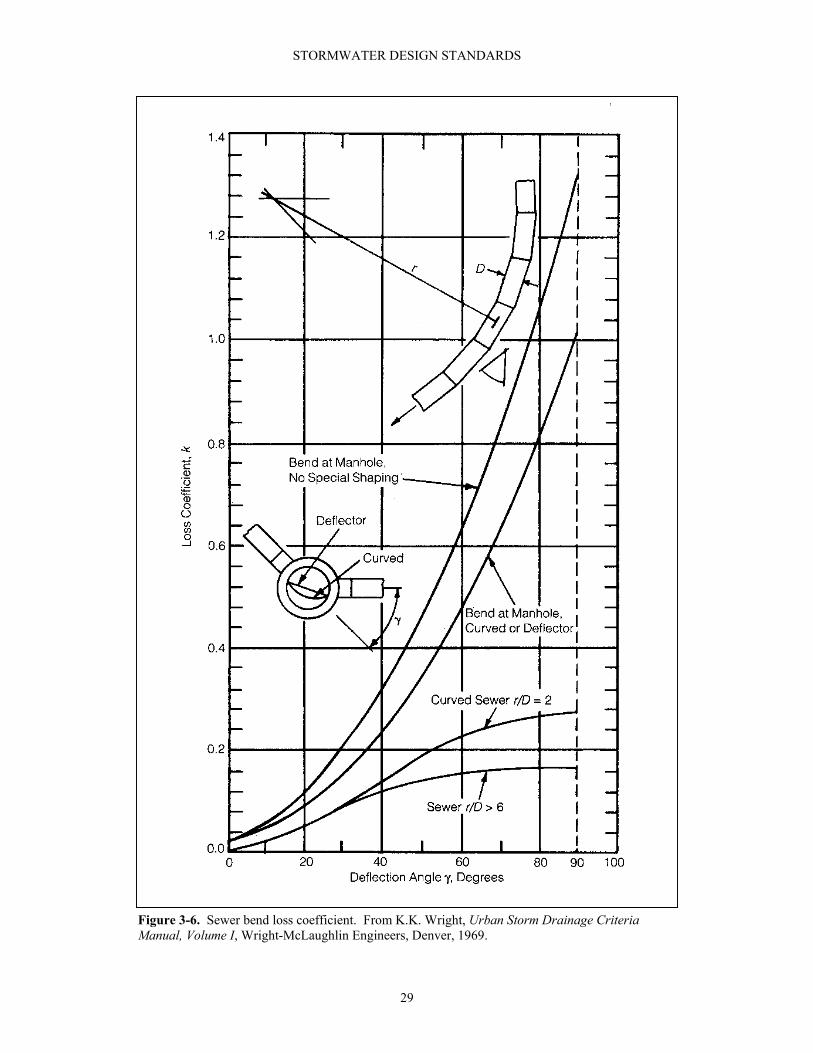
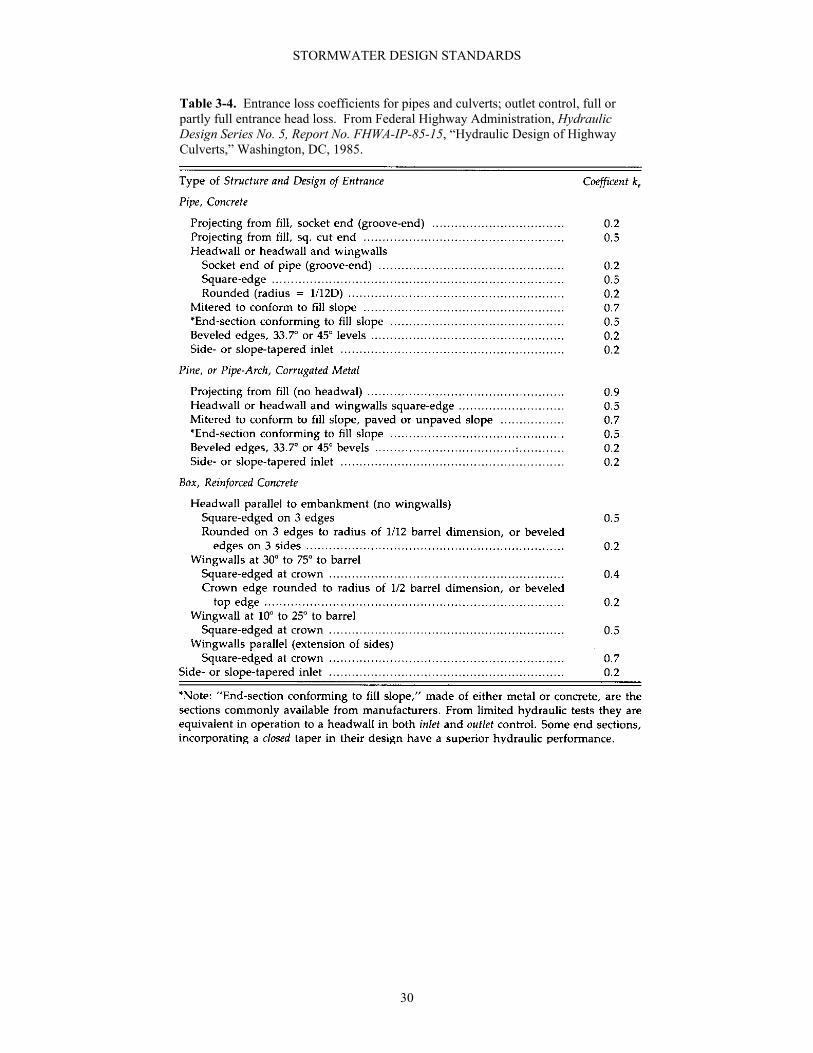
cross-section and for a given roughness, n, (ft/ft) 3. Bend Loss and Entrance Loss Bend loss accounts for the additional pressure gradient or water surface slope necessary to maintain required flow because of curved alignment, and is in addition to the friction loss of an equal length of straight alignment. See Figure 3-5 and Figure 3-6 for bend loss coefficients. Entrance loss accounts for the additional pressure gradient or water surface slope necessary to maintain required flow because of resistance at the entrance. See Table 3-4 for typical entrance loss coefficients for pipes and culverts.
26
STORMWATER DESIGN STANDARDS
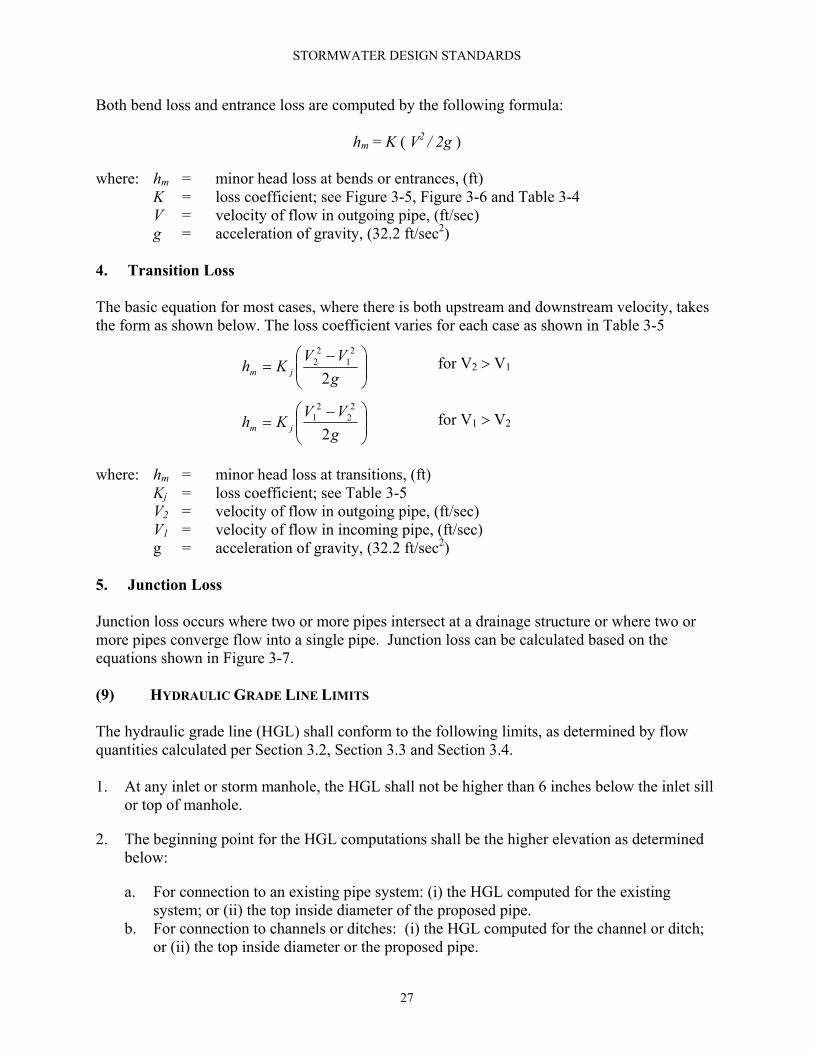
Both bend loss and entrance loss are computed by the following formula:
hm = K ( V2 / 2g ) where: hm = minor head loss at bends or entrances, (ft) K = loss coefficient; see Figure 3-5, Figure 3-6 and Table 3-4 V = velocity of flow in outgoing pipe, (ft/sec) g = acceleration of gravity, (32.2 ft/sec2) 4. Transition Loss The basic equation for most cases, where there is both upstream and downstream velocity, takes the form as shown below. The loss coefficient varies for each case as shown in Table 3-5
−=
gVVKh jm 2
21
22 for V2 > V1
−=
gVVKh jm 2
22
21 for V1 > V2
where: hm = minor head loss at transitions, (ft) Kj = loss coefficient; see Table 3-5 V2 = velocity of flow in outgoing pipe, (ft/sec) V1 = velocity of flow in incoming pipe, (ft/sec) g = acceleration of gravity, (32.2 ft/sec2) 5. Junction Loss Junction loss occurs where two or more pipes intersect at a drainage structure or where two or more pipes converge flow into a single pipe. Junction loss can be calculated based on the equations shown in Figure 3-7. (9) HYDRAULIC GRADE LINE LIMITS The hydraulic grade line (HGL) shall conform to the following limits, as determined by flow quantities calculated per Section 3.2, Section 3.3 and Section 3.4. 1. At any inlet or storm manhole, the HGL shall not be higher than 6 inches below the inlet sill
or top of manhole.
2. The beginning point for the HGL computations shall be the higher elevation as determined below:
a. For connection to an existing pipe system: (i) the HGL computed for the existing system; or (ii) the top inside diameter of the proposed pipe.
b. For connection to channels or ditches: (i) the HGL computed for the channel or ditch; or (ii) the top inside diameter or the proposed pipe.
27
STORMWATER DESIGN STANDARDS
Figure 3-5. Bend loss: Case VII – conduit on 90o curves, Case VIII – bends where radius is equal to diameter of pipe. From City of Austin, Austin Drainage Criteria Manual, 2nd Ed., Watershed Management Division, Austin, TX, 1987.
28
STORMWATER DESIGN STANDARDS
29
Figure 3-6. Sewer bend loss coefficient. From K.K. Wright, Urban Storm Drainage Criteria Manual, Volume I, Wright-McLaughlin Engineers, Denver, 1969.
STORMWATER DESIGN STANDARDS
Table 3-4. Entrance loss coefficients for pipes and culverts; outlet control, full or partly full entrance head loss. From Federal Highway Administration, Hydraulic Design Series No. 5, Report No. FHWA-IP-85-15, “Hydraulic Design of Highway Culverts,” Washington, DC, 1985.
30
STORMWATER DESIGN STANDARDS
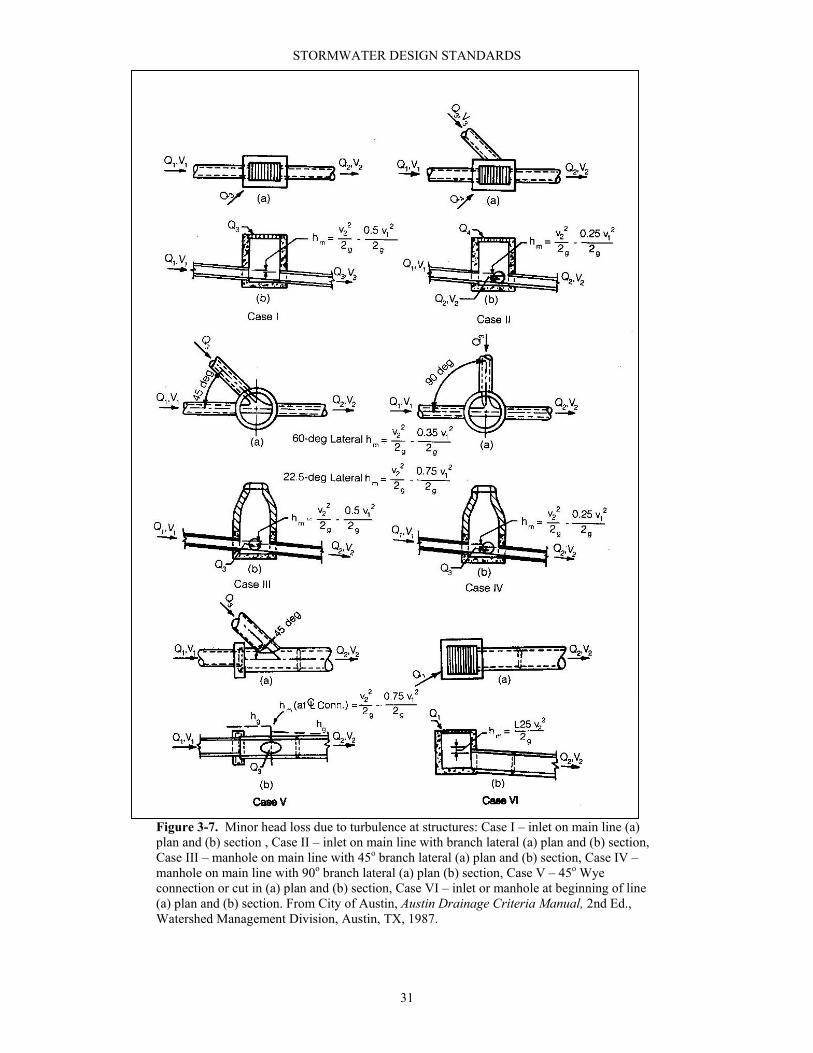
Figure 3-7. Minor head loss due to turbulence at structures: Case I – inlet on main line (a) plan and (b) section , Case II – inlet on main line with branch lateral (a) plan and (b) section, Case III – manhole on main line with 45o branch lateral (a) plan and (b) section, Case IV – manhole on main line with 90o branch lateral (a) plan (b) section, Case V – 45o Wye connection or cut in (a) plan and (b) section, Case VI – inlet or manhole at beginning of line (a) plan and (b) section. From City of Austin, Austin Drainage Criteria Manual, 2nd Ed., Watershed Management Division, Austin, TX, 1987.
31
STORMWATER DESIGN STANDARDS
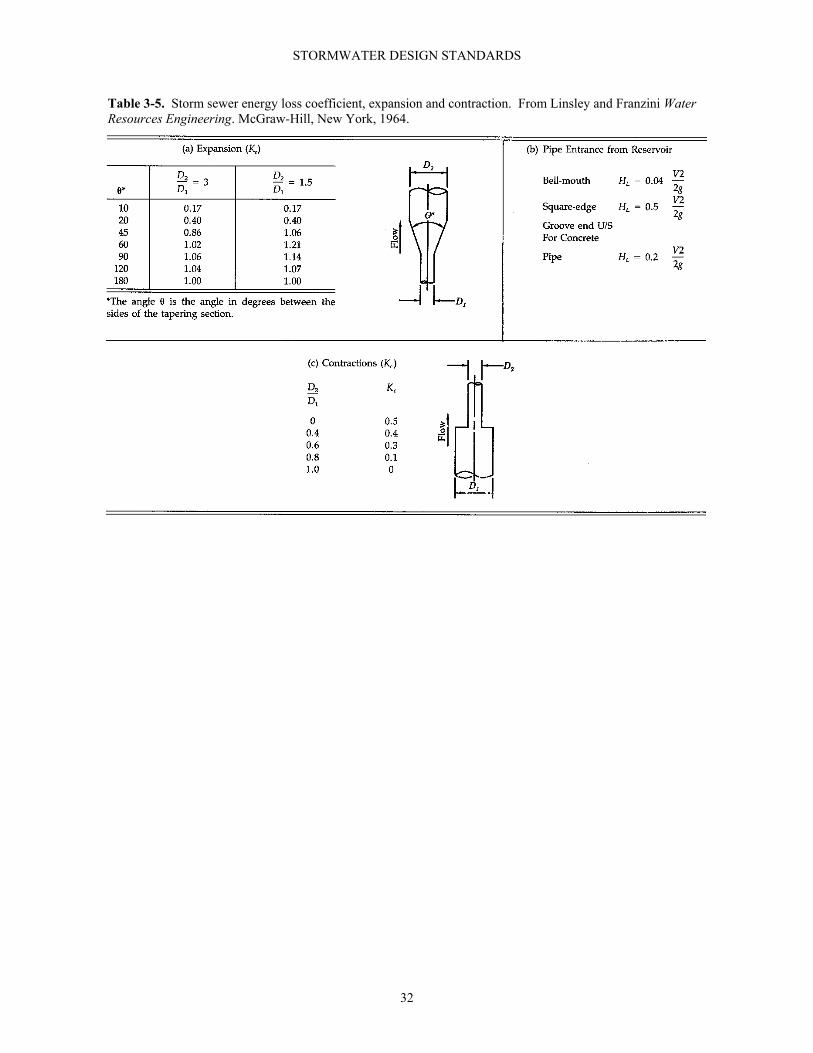
Table 3-5. Storm sewer energy loss coefficient, expansion and contraction. From Linsley and Franzini Water Resources Engineering. McGraw-Hill, New York, 1964.
32
STORMWATER DESIGN STANDARDS
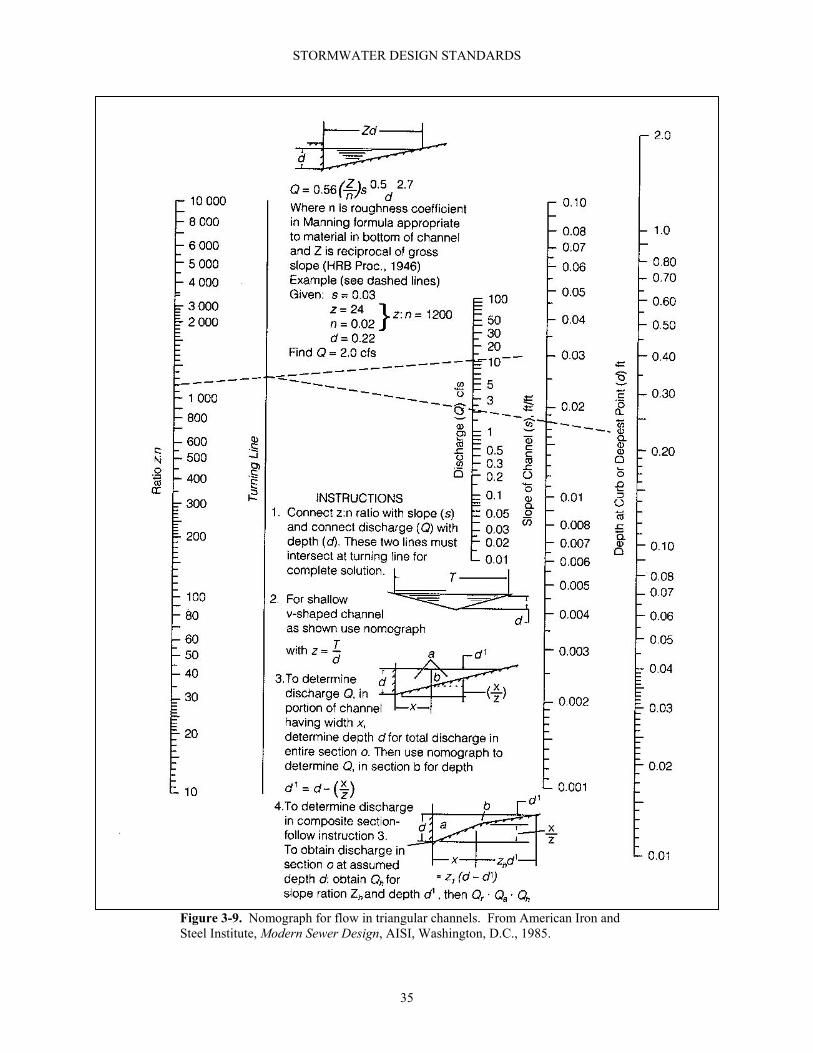
(10) GUTTER FLOW Gutter flow is basically flow in a triangular channel. Izzard’s equation, Figure 3-10 or the nomograph in Figure 3-9 may be used to determine gutter flow. Izzard’s equation is as follows:
38
2156.0 dSz
nQ =
where: Q = rate of flow, (ft3/sec) z = reciprocal of the average street cross-slope, including gutter section, (ft/ft) S = hydraulic slope, approximated as channel slope, (ft/ft) d = depth of flow at curb face, (ft) n = Manning’s roughness coefficient; see 4-2 on page 45
33
STORMWATER DESIGN STANDARDS
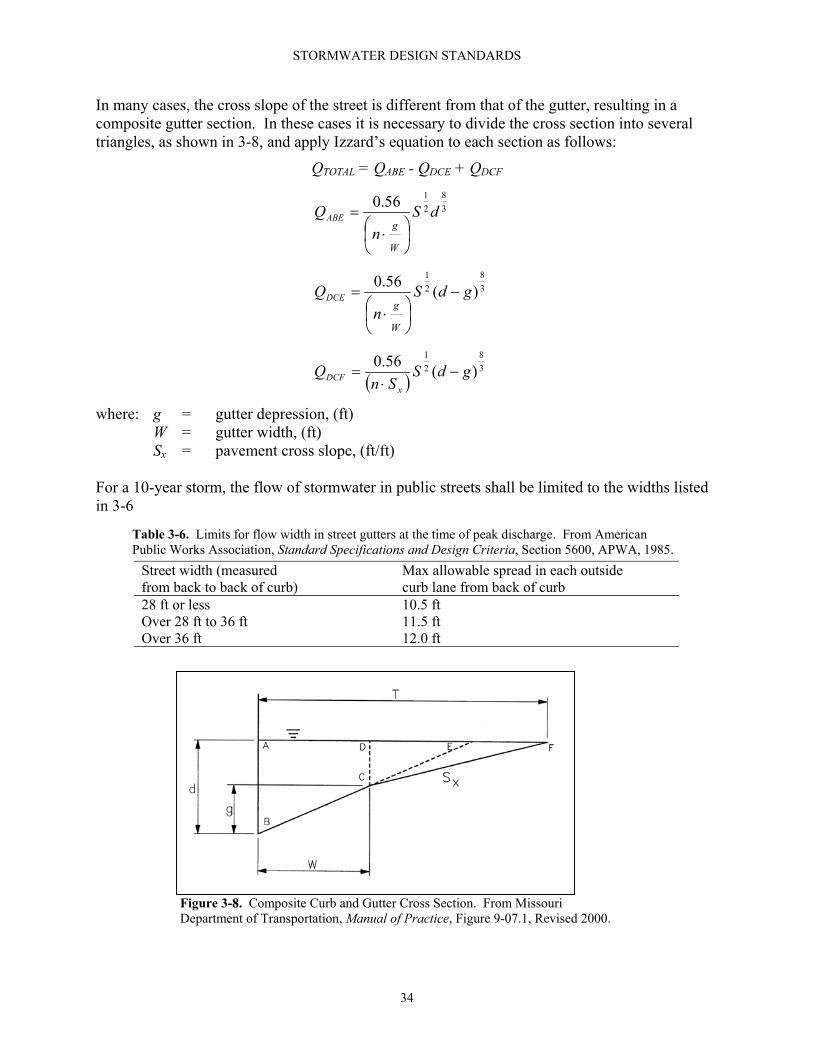
In many cases, the cross slope of the street is different from that of the gutter, resulting in a composite gutter section. In these cases it is necessary to divide the cross section into several triangles, as shown in 3-8, and apply Izzard’s equation to each section as follows:
QTOTAL = QABE - QDCE + QDCF
38
2156.0 dS
nQ
W
gABE
⋅
=
38
21
)(56.0 gdSn
Q
W
gDCE −
⋅
=
( )38
21
)(56.0 gdSSn
Qx
DCF −⋅
=
where: g = gutter depression, (ft) W = gutter width, (ft) Sx = pavement cross slope, (ft/ft) For a 10-year storm, the flow of stormwater in public streets shall be limited to the widths listed in 3-6
Table 3-6. Limits for flow width in street gutters at the time of peak discharge. From American Public Works Association, Standard Specifications and Design Criteria, Section 5600, APWA, 1985.
Street width (measured from back to back of curb)
Max allowable spread in each outside curb lane from back of curb
28 ft or less 10.5 ft Over 28 ft to 36 ft 11.5 ft Over 36 ft 12.0 ft
Figure 3-8. Composite Curb and Gutter Cross Section. From Missouri Department of Transportation, Manual of Practice, Figure 9-07.1, Revised 2000.
34
STORMWATER DESIGN STANDARDS
Figure 3-9. Nomograph for flow in triangular channels. From American Iron and Steel Institute, Modern Sewer Design, AISI, Washington, D.C., 1985.
35
STORMWATER DESIGN STANDARDS
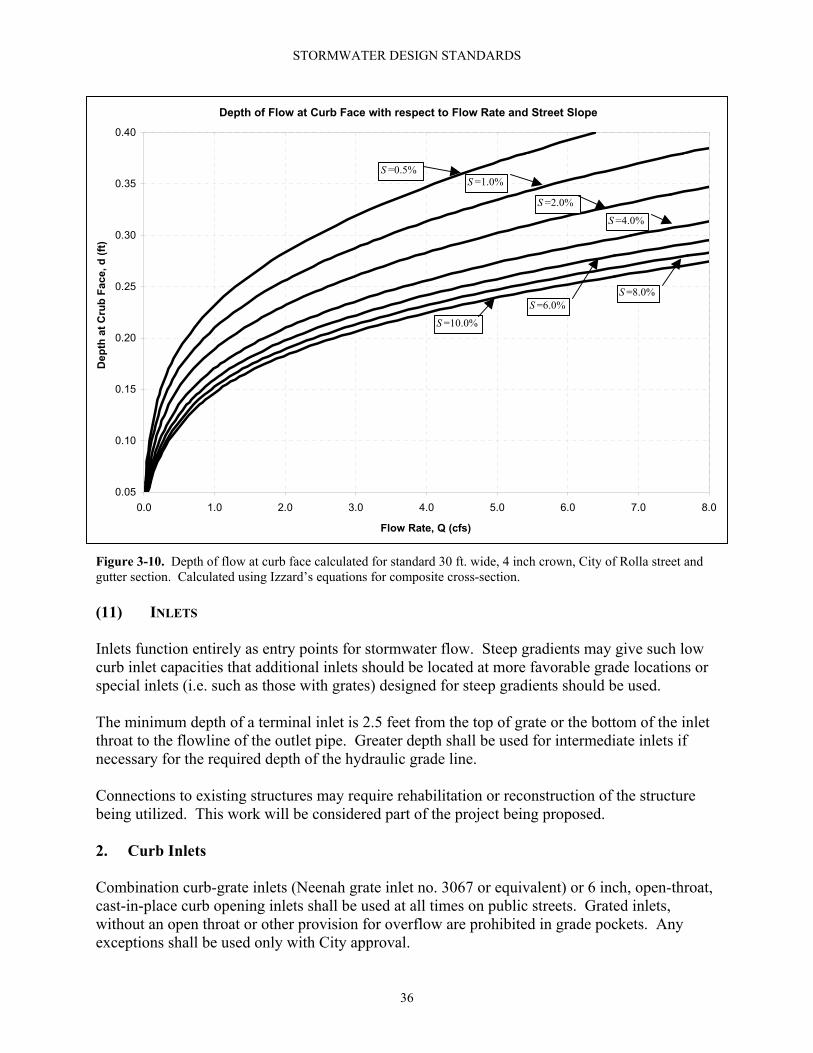
Depth of Flow at Curb Face with respect to Flow Rate and Street Slope
0.05
0.10
0.15
0.20
0.25
0.30
0.35
0.40
0.0 1.0 2.0 3.0 4.0 5.0 6.0 7.0 8.0
Flow Rate, Q (cfs)
Dep
th a
t Cru
b Fa
ce, d
(ft)
S =0.5%S =1.0%
S =2.0%
S =4.0%
S =6.0%
S =10.0%
S =8.0%
Figure 3-10. Depth of flow at curb face calculated for standard 30 ft. wide, 4 inch crown, City of Rolla street and gutter section. Calculated using Izzard’s equations for composite cross-section. (11) INLETS Inlets function entirely as entry points for stormwater flow. Steep gradients may give such low curb inlet capacities that additional inlets should be located at more favorable grade locations or special inlets (i.e. such as those with grates) designed for steep gradients should be used. The minimum depth of a terminal inlet is 2.5 feet from the top of grate or the bottom of the inlet throat to the flowline of the outlet pipe. Greater depth shall be used for intermediate inlets if necessary for the required depth of the hydraulic grade line. Connections to existing structures may require rehabilitation or reconstruction of the structure being utilized. This work will be considered part of the project being proposed. 2. Curb Inlets Combination curb-grate inlets (Neenah grate inlet no. 3067 or equivalent) or 6 inch, open-throat, cast-in-place curb opening inlets shall be used at all times on public streets. Grated inlets, without an open throat or other provision for overflow are prohibited in grade pockets. Any exceptions shall be used only with City approval.
36
STORMWATER DESIGN STANDARDS
Curb inlets shall be placed at street intersections or driveways such that no part of the curb transition, inlet structure or sump is within the curb rounding. Street and gutter stormwater flow should be controlled by inlet spacing and capacity so that flooding of the street will not occur beyond the limits set forth in Table 3-6 for a 10-year design storm. The design of sump inlets should account for by-pass flow of upstream inlets. The graphs in Figure 3-12 may be used as a guide for correct spacing of combination curb-grate inlets and Figure 3-11 may be used as a guide for correct spacing and sizing of open throat curb inlets approved for use by the City. In addition to the design chart presented in Figure 3-11, the equations presented below may also be used for curb inlet design. The following equation is used to determine the length of curb inlet required to intercept 100 % of the gutter flow:
6.03.042.0 16.0
=
xT Sn
SQL
where: LT = length of inlet required for 100 % intercept of gutter flow, (ft) Q = total gutter flow, (ft3/sec) S = longitudinal street slope, (ft/ft) n = Manning’s roughness coefficient; see Table 4-2 Sx = composite street and gutter cross slope, (ft/ft) The discharge per foot of inlet, q, may be calculated by dividing the total gutter flow, Q, by the inlet length required for 100 % intercept of flow, LT. This equation is:
TLQq =
The discharge per foot of inlet, q, may then be multiplied by the design inlet length, LD, to calculate the actual flow intercepted by the inlet, Qi, as follows:
37
STORMWATER DESIGN STANDARDS
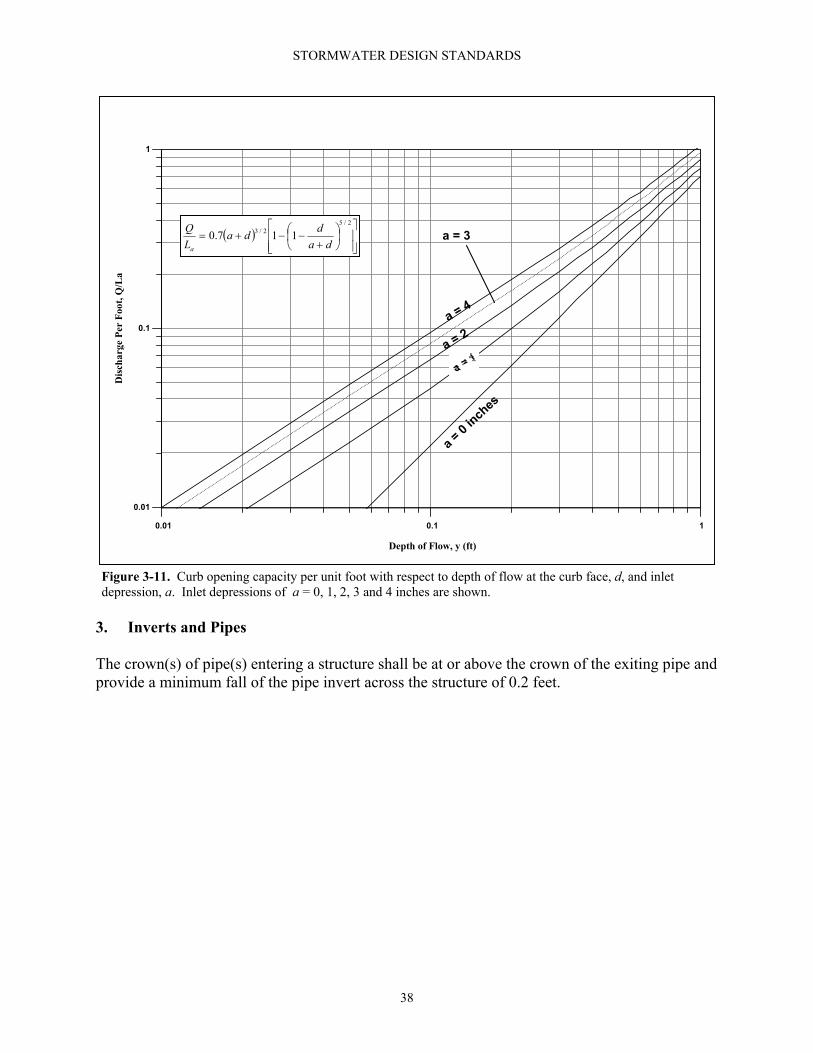
Di qLQ =Discharge Per Unit Foot of Curb Opening
0.01 0.1 1
Depth of Flow, y (ft)
0.01
0.1
1
Dis
char
ge P
er F
oot,
Q/L
a
a = 0
inches
a = 3
a = 4
a = 2
( )
+−−+=
2/52/3 117.0
dadda
LQ
a
Figure 3-11. Curb opening capacity per unit foot with respect to depth of flow at the curb face, d, and inlet depression, a. Inlet depressions of a = 0, 1, 2, 3 and 4 inches are shown.
3. Inverts and Pipes The crown(s) of pipe(s) entering a structure shall be at or above the crown of the exiting pipe and provide a minimum fall of the pipe invert across the structure of 0.2 feet.
38
STORMWATER DESIGN STANDARDS
Grate Capacity (Neenah or Equivalent) With Street Cross Slope = 2%Grate No. 3067
0.20.40.60.81.01.21.41.61.82.02.22.42.62.83.03.2
0.5% 1.0% 1.5% 2.0% 2.5% 3.0% 3.5% 4.0% 4.5% 5.0% 5.5% 6.0% 6.5% 7.0% 7.5% 8.0% 8.5% 9.0%
Longitudinal Street Slope (%)
Gra
te C
apac
ity (c
fs)
d = 0.23 ft.
d = 0.20 ft.
d = 0.18 ft.
d = 0.16 ft.
d = 0.14 ft.
d = 0.12 ft.
d = 0.10 ft.
(a)
Grate Capacity (Neenah or Equivalent) With Street Cross Slope = 3%Grate No. 3067
0.2
0.4
0.6
0.8
1.0
1.2
1.4
1.6
1.8
2.0
2.2
2.4
2.6
2.8
0.5% 1.0% 1.5% 2.0% 2.5% 3.0% 3.5% 4.0% 4.5% 5.0% 5.5% 6.0% 6.5% 7.0% 7.5% 8.0% 8.5% 9.0%
Longitudinal Street Slope (%)
Gra
te C
apac
ity (c
fs)
d = 0.23 ft.
d = 0.20 ft.
d = 0.18 ft.
d = 0.16 ft.
d = 0.14 ft.
d = 0.12 ft.
d = 0.10 ft.
(b) Figure 3-12. Grate inlet capacity with respect to longitudinal street slope, S, and depth of flow at curb face, d. Design Chart (a) rates grate capacity for a street cross slope of 2 % and Design Chart (b) rates grate capacity for a street cross slope of 3 %.
39
STORMWATER DESIGN STANDARDS
Figure 3-13. Sump inlet capacity with respect to depth of flow. This chart rates the capacity of a 3 ft curb opening, grate capacity for a Neenah type DL grate or equivalent and total curb inlet capacity (both curb opening and grate).
Sump Inlet Capacity (Neenah or Equivalent)
0
0.1
0.2
0.3
0.4
0.5
0.6
0.7
0.8
0.9
1
0 1 2 3 4 5 6 7 8 9
Flow rate (cfs)
Dep
th o
f Flo
w (f
t)
Total capacity
Grate Capacity3 ft Curb Opening Capacity
10
d. OPEN CHANNEL DESIGN CRITERIA
(1) GENERAL1 Open channels are nearly always a component of the major (emergency) drainage system. Channel stability is a well recognized problem in urban hydrology because of the significant increase in low flows and peak storm runoff flows. Careful planning and design are needed to minimize the disadvantages and increase the benefits. Good land planning should reflect the maximum use of natural drainage ways and trickle paths. Maintenance needs for natural channels are usually low because the channel is somewhat stabilized. The cost of the drainage system, as well as sediment and erosion control costs will also be reduced through the use of natural drainage ways. In planning a subdivision, the designer should begin by determining the location and the width of existing drainage ways. Streets and lots should be laid out in a manner to preserve the existing drainage system to the maximum extent practicable. Constructed channels should be used only when it is not practical or feasible to utilize existing drainage ways. (2) GENERAL DESIGN REQUIREMENTS All open channels shall meet the following requirements: 1 This section contains excerpts from V. T. Chow, Open Channel Hydraulics, McGraw-Hill, 1959.
40
STORMWATER DESIGN STANDARDS
1. Materials. Constructed channels may be constructed with riprap, geotextile reinforcement,
reinforced concrete or other approved erosion resistant material. The City shall have the right to approve or disapprove any channel lining material.
2. Bedding. Pipes extended to the channel in a fill area shall have compacted crushed limestone (1 inch clean) bedding for support. Special provisions shall be made for paved channels laid over fill on non-supportive soils.
3. Sanitary Sewer and Utility Clearance. A minimum clear distance of 12 inches vertically from any other utility line or sanitary sewer shall be maintained below the channel lining, unless otherwise approved. Utilities will not be permitted to cross through the channel flow area. Storm channels shall be located a sufficient horizontal distance from underground utilities or sanitary sewers.
4. Side Slope. Side slopes shall be no steeper than 3:1 for naturally vegetated channels. Rock, geotextile reinforced, concrete lined or other channels which do not require slope maintenance may have slopes as steep as 1.5:1 .
5. Depth. Deep channels are difficult to maintain and can be hazardous. Constructed channels shall have a maximum flow depth of 4 feet for the 25-year design storm unless otherwise approved by the City.
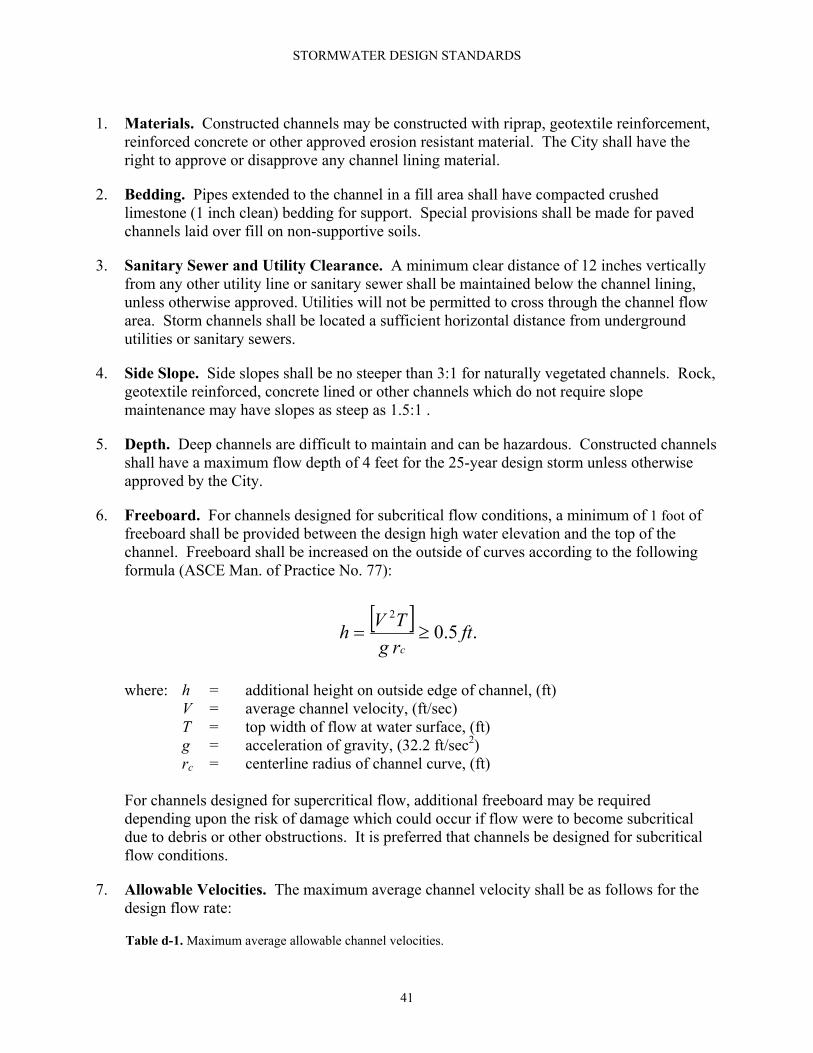
6. Freeboard. For channels designed for subcritical flow conditions, a minimum of 1 foot of freeboard shall be provided between the design high water elevation and the top of the channel. Freeboard shall be increased on the outside of curves according to the following formula (ASCE Man. of Practice No. 77):
[ ] .5.02
ftrgTVhc
≥=
where: h = additional height on outside edge of channel, (ft) V = average channel velocity, (ft/sec) T = top width of flow at water surface, (ft) g = acceleration of gravity, (32.2 ft/sec2) rc = centerline radius of channel curve, (ft)
For channels designed for supercritical flow, additional freeboard may be required depending upon the risk of damage which could occur if flow were to become subcritical due to debris or other obstructions. It is preferred that channels be designed for subcritical flow conditions.
7. Allowable Velocities. The maximum average channel velocity shall be as follows for the design flow rate:
Table d-1. Maximum average allowable channel velocities.
41
STORMWATER DESIGN STANDARDS
Channel Lining Maximum Average Velocity Grass or vegetation (established) 6 feet/second Riprap 10 feet/second Permanent geotextile fabric with vegetation 15 feet/second Geocell reinforcement with vegetation or gravel 15 feet/second Concrete or bedrock 15 feet/second
Where reduction in velocity due to a reduction in slope would allow a transition from a concrete channel to a grass or geotextile fabric lined channel, a riprap lining shall be provided from the point where the calculated average channel velocity would be 5 ft/sec or less, for a distance downstream equal to five (5) times the top width of the grass channel. The height for the riprap lining shall be equal to the height of the concrete lining upstream.
8. Grades. Gradient changes shall be kept to a minimum and be consistent and regular. Gradient designations less than the nearest 0.01 % shall be avoided. Channel grades in constructed channels shall not be greater than that which would cause the maximum allowable velocities to be exceeded. Where practicable, channels should have sufficient gradient to provide velocities that will prevent siltation, but will not be so great (in unlined channels) as to create erosion.
9. Alignment. Storm channel locations are determined primarily by natural drainage conditions. Natural channels draining 5 acres or more shall be located in drainage easements. All constructed storm channels shall be located:
a. To serve all adjacent property conveniently and to best advantage.
b. Within drainage easements and in easements on common ground when feasible.
c. On private property along property lines or immediately adjacent to public streets, avoiding crossings through the property.
d. At a sufficient distance from existing and proposed buildings (including footings) and to avoid future problems of flooding or erosion.
e. In unpaved or unimproved areas whenever possible.
f. Crossing perpendicular to streets, unless unavoidable.
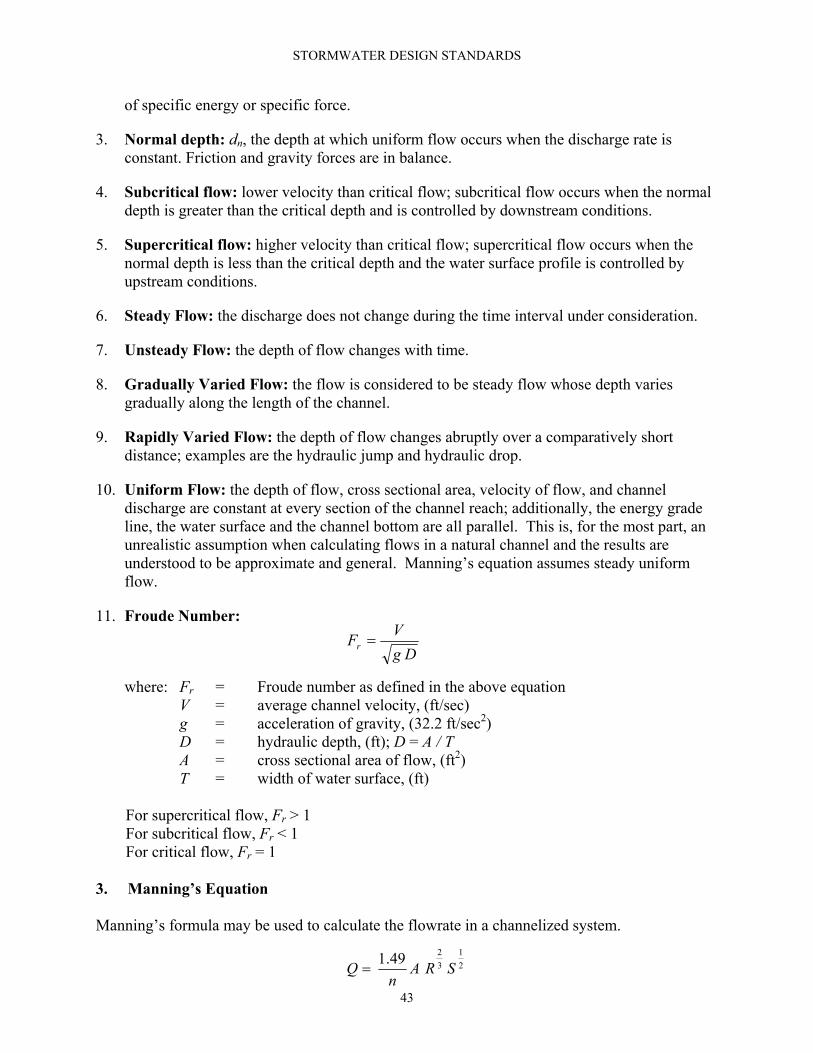
(3) HYDRAULIC DESIGN OF CHANNEL FLOW 2. Definitions 1. Critical depth: dc, the depth of flow at which the specific energy is at a minimum for a
given flow rate and channel cross section shape, and at which a unique relationship exists between depth and specific energy. Flow at or near critical depth is highly unstable and channel sections resulting in flow depth near critical depth should be avoided
2. Alternate depth: the corresponding subcritical or supercritical depth having the same value
42
STORMWATER DESIGN STANDARDS
of specific energy or specific force.
3. Normal depth: dn, the depth at which uniform flow occurs when the discharge rate is constant. Friction and gravity forces are in balance.
4. Subcritical flow: lower velocity than critical flow; subcritical flow occurs when the normal depth is greater than the critical depth and is controlled by downstream conditions.
5. Supercritical flow: higher velocity than critical flow; supercritical flow occurs when the normal depth is less than the critical depth and the water surface profile is controlled by upstream conditions.
6. Steady Flow: the discharge does not change during the time interval under consideration.
7. Unsteady Flow: the depth of flow changes with time.
8. Gradually Varied Flow: the flow is considered to be steady flow whose depth varies gradually along the length of the channel.
9. Rapidly Varied Flow: the depth of flow changes abruptly over a comparatively short distance; examples are the hydraulic jump and hydraulic drop.
10. Uniform Flow: the depth of flow, cross sectional area, velocity of flow, and channel discharge are constant at every section of the channel reach; additionally, the energy grade line, the water surface and the channel bottom are all parallel. This is, for the most part, an unrealistic assumption when calculating flows in a natural channel and the results are understood to be approximate and general. Manning’s equation assumes steady uniform flow.
11. Froude Number:
DgVFr =
where: Fr = Froude number as defined in the above equation V = average channel velocity, (ft/sec) g = acceleration of gravity, (32.2 ft/sec2) D = hydraulic depth, (ft); D = A / T A = cross sectional area of flow, (ft2) T = width of water surface, (ft)
For supercritical flow, Fr > 1 For subcritical flow, Fr < 1 For critical flow, Fr = 1
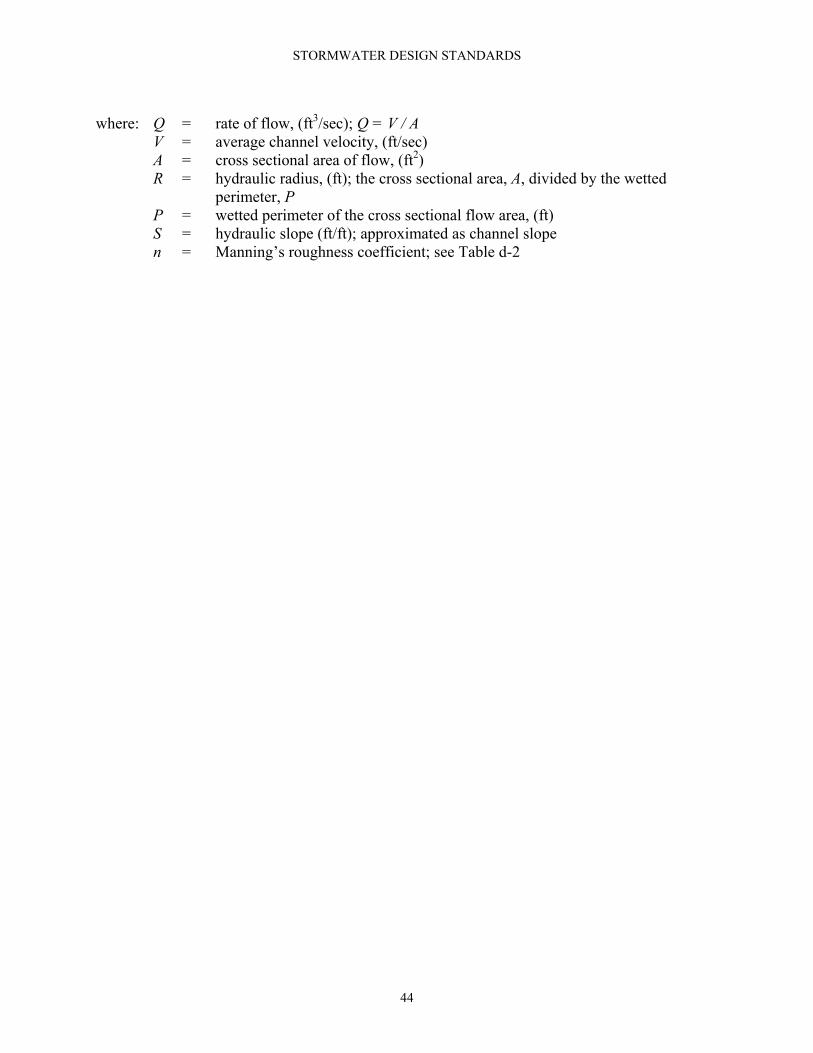
3. Manning’s Equation Manning’s formula may be used to calculate the flowrate in a channelized system.
21
3249.1 SRA
nQ =
43
STORMWATER DESIGN STANDARDS
where: Q = rate of flow, (ft3/sec); Q = V / A V = average channel velocity, (ft/sec) A = cross sectional area of flow, (ft2) R = hydraulic radius, (ft); the cross sectional area, A, divided by the wetted
perimeter, P P = wetted perimeter of the cross sectional flow area, (ft) S = hydraulic slope (ft/ft); approximated as channel slope n = Manning’s roughness coefficient; see Table d-2
44
STORMWATER DESIGN STANDARDS
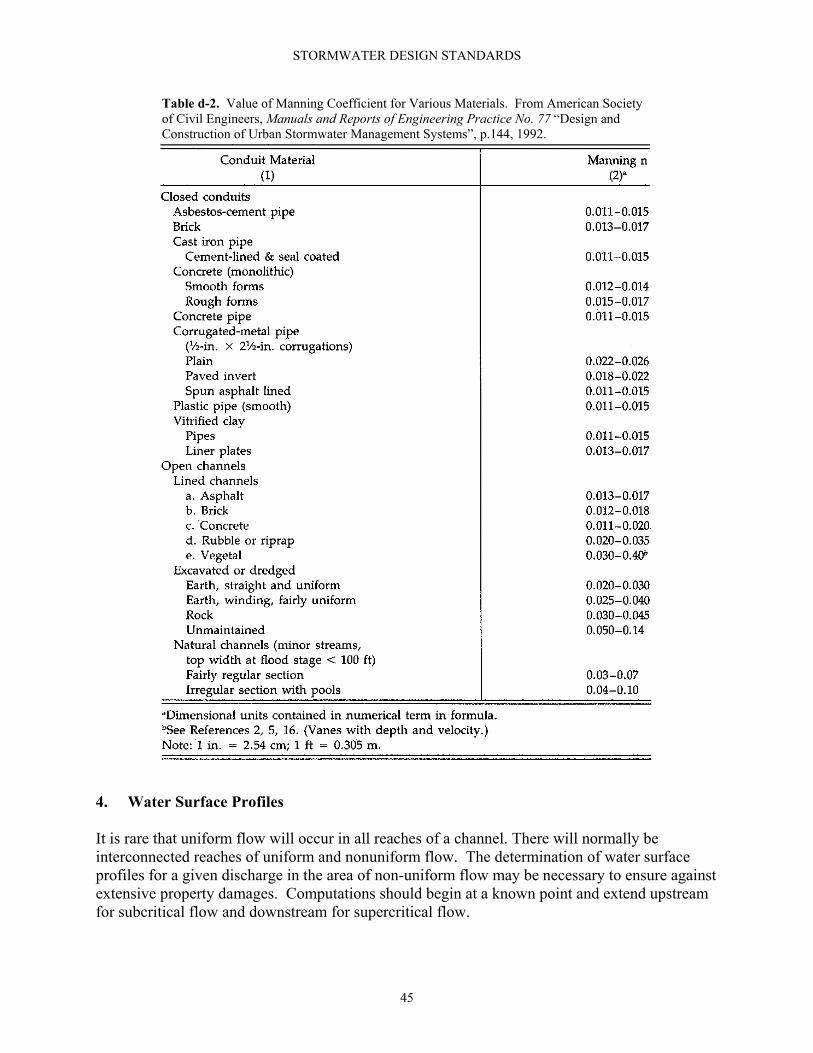
Table d-2. Value of Manning Coefficient for Various Materials. From American Society of Civil Engineers, Manuals and Reports of Engineering Practice No. 77 “Design and Construction of Urban Stormwater Management Systems”, p.144, 1992.
4. Water Surface Profiles It is rare that uniform flow will occur in all reaches of a channel. There will normally be interconnected reaches of uniform and nonuniform flow. The determination of water surface profiles for a given discharge in the area of non-uniform flow may be necessary to ensure against extensive property damages. Computations should begin at a known point and extend upstream for subcritical flow and downstream for supercritical flow.
45
STORMWATER DESIGN STANDARDS
Computed water surface profiles may be required to be shown on final drawings, at the discretion of the City. Computation of the water surface profile should utilize standard backwater methods or acceptable computer routines, taking into consideration all losses due to changes in velocity, drops, bridge openings and other obstructions. Acceptable computer routines are the U.S. Corps of Engineers HEC-RAS program, the Federal Highway Administration WSPRO program, or other industry standard software. 5. Treatment of Rapidly Varied Flow Conditions Rapidly varied flow conditions shall be avoided when possible. Where drop structures are required for grass lined or composite channels, the location of the hydraulic jump and the length of erosion protection to be provided shall be determined in accordance with the procedures set forth in Section (2). (4) CONSTRUCTION REQUIREMENTS 2. Restrictions on Alteration of Natural Channels 1. The stream channel of perennially flowing streams or intermittent streams classified as
losing streams in the Missouri Clean Water Laws shall not be modified or channelized except where unavoidable to construct road crossings or to repair erosion and stabilize the stream channel.
2. Intermittent streams which have a defined channel should not be modified or channelized except where unavoidable for road crossings or to repair erosion and stabilize the stream channel.
3. Natural watercourses in which flow is broad and shallow, and which have no defined channel should not be modified or channelized, except where unavoidable. Removal of trees and vegetation within the watercourse should be avoided as much as practical.
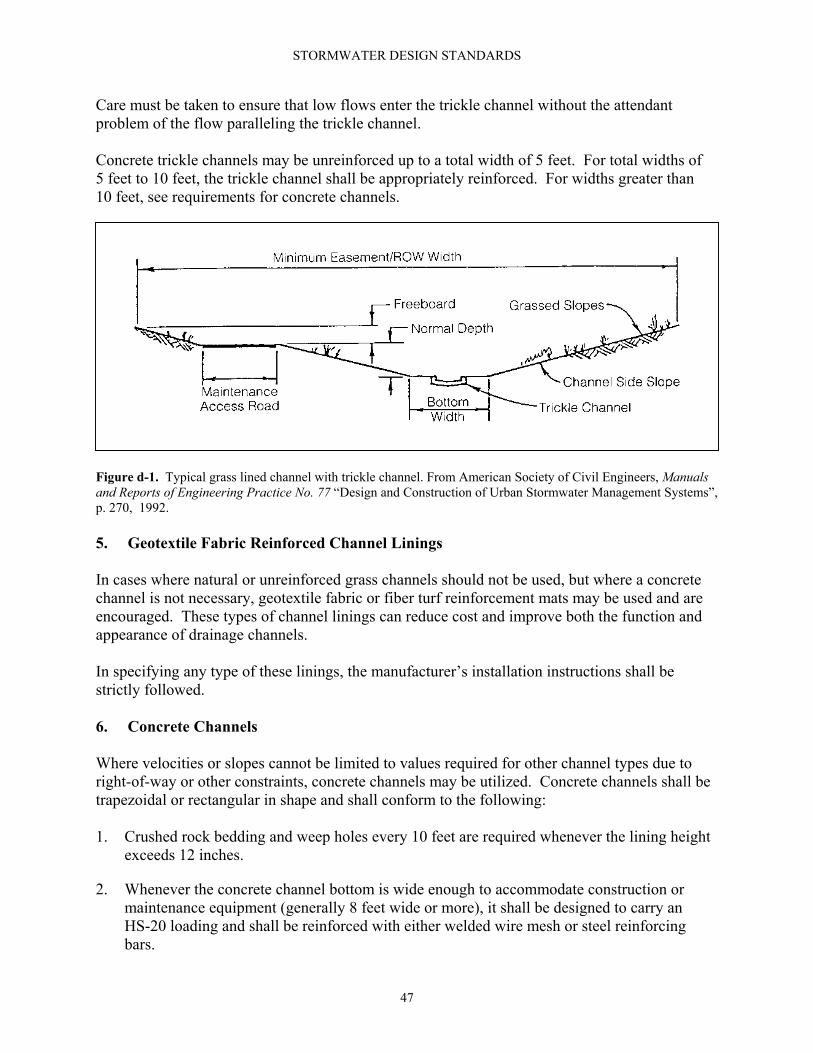
3. Grass Channels Grass lined channels shall have a minimum longitudinal slope of 1.0 %. The bottom slope may be decreased to 0.5 % if a trickle channel is provided. Maximum side slopes of grass lined channels shall be 3:1, with 4:1 preferred. In order to establish grass in the channel bottom, it may be required that the bottom 12 inches of the channel depth be seeded with temporary straw matting or lined with sod or other suitable erosion control blanket. 4. Trickle Channels The low flows and sometimes base flows, from urban areas must be given specific attention. Trickle channels shall be provided in constructed grass channels (not natural channels) where base flow prevents the establishment of a sod bottom. Low flows shall be carried in a trickle channel, such as that shown in Figure d-1, which has a capacity of 5.0 % of the design peak flow.
46
STORMWATER DESIGN STANDARDS
Care must be taken to ensure that low flows enter the trickle channel without the attendant problem of the flow paralleling the trickle channel. Concrete trickle channels may be unreinforced up to a total width of 5 feet. For total widths of 5 feet to 10 feet, the trickle channel shall be appropriately reinforced. For widths greater than 10 feet, see requirements for concrete channels.
Figure d-1. Typical grass lined channel with trickle channel. From American Society of Civil Engineers, Manuals and Reports of Engineering Practice No. 77 “Design and Construction of Urban Stormwater Management Systems”, p. 270, 1992. 5. Geotextile Fabric Reinforced Channel Linings In cases where natural or unreinforced grass channels should not be used, but where a concrete channel is not necessary, geotextile fabric or fiber turf reinforcement mats may be used and are encouraged. These types of channel linings can reduce cost and improve both the function and appearance of drainage channels. In specifying any type of these linings, the manufacturer’s installation instructions shall be strictly followed. 6. Concrete Channels Where velocities or slopes cannot be limited to values required for other channel types due to right-of-way or other constraints, concrete channels may be utilized. Concrete channels shall be trapezoidal or rectangular in shape and shall conform to the following: 1. Crushed rock bedding and weep holes every 10 feet are required whenever the lining height
exceeds 12 inches.
2. Whenever the concrete channel bottom is wide enough to accommodate construction or maintenance equipment (generally 8 feet wide or more), it shall be designed to carry an HS-20 loading and shall be reinforced with either welded wire mesh or steel reinforcing bars.
47
STORMWATER DESIGN STANDARDS
3. For trapezoidal channels of depths greater than 1 foot, the channel slopes shall be reinforced with steel reinforcement.
4. For rectangular concrete channels, vertical side walls shall be reinforced to withstand earth pressure and other anticipated loads. Design for hydrostatic pressure is not required if weep holes and drainage system are provided.
A toe wall extending a minimum of 24 inches below grade shall be provided at the downstream end of any concrete channel section, and should be provided at maximum intervals of about 100 feet along the channel. 7. Drop Structures Where the channel slope must be decreased to provide stability, maintain subcritical flow, or reduce velocity to acceptable levels, drop structures may be provided. Grass lined channels shall be provided with erosion resistant linings downstream to the point at which the average channel velocity has returned to the allowable rate for the type of channel lining provided. Drop structures for vertical wall channels shall be designed in accordance with either of the following references: 1. American Society of Civil Engineers, Water Environment Federation. ASCE Manuals and
Reports of Engineering Practice No. 77, Design and Construction of Urban Stormwater Management Systems. New York. 1992.
2. U.S. Dept. of the Interior, Bureau of Reclamation. Design of Small Canal Structures.
Denver, Colorado. 1974. Drop structures for trapezoidal channels shall be designed in accordance with either of the following references: 1. City of Tulsa Department of Public Works. Stormwater Management Criteria Manual.
Tulsa, Oklahoma. 1994. 2. E.F. Brater and King, H.W. Handbook of Hydraulics. McGraw-Hill Book Co. New York.
1976.
48
STORMWATER DESIGN STANDARDS
e. CULVERTS
(1) GENERAL The function of a drainage culvert is to pass the design flow under a roadway, railroad, or yard area without causing excessive backwater and without creating excessive downstream velocities. The designer shall keep energy losses and discharge velocities within reasonable limits when selecting a structure which will meet these requirements. (2) BASIC DESIGN REQUIREMENTS 1. Changes in direction, grade, size or material are not allowed within the culvert barrel, unless
approved in writing by the City.
2. Culverts shall be placed such that the vertical alignment of the invert matches the slope of the existing water course to the greatest extent practicable. The recommended minimum slope for culverts is 0.5 %. Maximum recommended grade is 10 %.
3. The minimum allowable inside diameter of least dimension for any culvert is 15 inches
4. Culvert construction materials shall be approved by the City.
5. Hydraulic computations will be carried out by standard methods based on pressure, energy, momentum and loss considerations and shall be in accordance with the standards set forth in this design manual.
6. End sections shall be the same material as the pipe on which they are placed. Concrete end sections shall have a toewall.
7. All headwalls and endwalls shall be reinforced concrete, and may be either straight parallel headwalls, flared headwalls, or warped headwalls with or without aprons as may be required by site conditions.
8. Where any portion of the culvert structure or approach road is located within a floodplain area designated on the Flood Insurance Rate Maps (FIRM) for the City, floodplain requirements (backwater requirements) set forth in ARTICLE VI of the Storm Water and Flood Control Ordinance of the Rolla City Codes must be met.
9. For drainage areas consisting of 1 square mile or more, culverts shall be designed to safely pass a 100-year design storm. For drainage areas less than 1 square mile but greater than 20 acres, culverts shall be designed to pass a 50-year design storm. For drainage areas less than 20 acres, culverts shall be designed to pass a 10 year storm.
10. Determination of peak flows shall be consistent with the methods set forth in ARTICLE 3.
49

STORMWATER DESIGN STANDARDS
(3) DESIGN CONSIDERATIONS 1. Entrance Conditions. It is important to recognize that the operational characteristics of a
culvert may be completely changed by the shape or condition at the inlet or entrance. Design of culverts must involve consideration of energy losses that may occur at the entrance.
2. Headwalls, Endwalls and Endsections. The normal function of properly designed headwalls, endwalls and end sections are to anchor the culvert to prevent movement due to lateral pressures, to control erosion and scour resulting from excessive velocities and turbulence, and to prevent adjacent soil from sloughing into the waterway opening.
3. Selection of Culvert Type. Culverts shall be selected based on based on hydraulic principals, economy of size and shape, and with a resulting headwater depth which will not cause damage to adjacent property. It is essential to the proper design of a culvert that the hydraulic conditions under which the culvert will operate are known.
(4) OUTLET VELOCITIES The velocity of discharge from culverts should be limited as shown in Table e-1 below. Consideration must be given to the effect of high velocities, eddies or other turbulence on the natural channel, downstream property and roadway embankment. Outlet velocity should be limited to a maximum of 15 ft/sec for the design storm. The maximum outlet velocity for the 2-year storm shall be 10 ft/sec. Where the outlet velocity for the design storm cannot be limited to 15 ft/sec, a stilling basin or energy dissipater must be provided. Energy dissipaters shall be MODOT standard impact type. Table e-1. Culvert discharge velocity limitations. Downstream Condition Maximum Allowable Discharge Velocity Grass or vegetation (established) 6 feet/second Riprap 10 feet/second Geotextile fabric or fiber turf reinforcement mats
with vegetation 15 feet/second Geocell reinforcement with gravel or vegetation 15 feet/second Concrete or bedrock 15 feet/second (5) OUTLET PROTECTION At the outlet of a culvert, an erosion resistant lining of concrete, grouted riprap or geotextile reinforcement shall be provided for a distance equal to 5 times the diameter of the culvert pipe or box culvert width, downstream of the headwall apron or flared end section.
The width of the erosion resistant material shall be a minimum of two (2) times the pipe diameter or box culvert width or 5 feet, whichever is less.
50

STORMWATER DESIGN STANDARDS
(6) HYDRAULIC DESIGN Hydraulic design shall be done in accordance ARTICLE 3 and with the procedures set forth in the Federal Highway Administration (FHWA) Hydraulic Design Series No. 5 (HDS-5), Hydraulic Design of Highway Culverts. The following pages contain design charts and nomographs from the above referenced manual. These are useful in culvert design. Please refer to Hydraulic Design of Highway Culverts for a complete explanation on culvert design. The HY8 Culvert Analysis computer program automates the design methods described in FHWA publications HDS-5, “Hydraulic Design of Highway Culverts,” HEC-14, “Hydraulic Design of Energy Dissipaters for Culverts and Channels,” and HEC-19, “Hydrology.” The HY8 software program is available for download at http://www.fhwa.dot.gov/bridge/hydsoft.htm.
51
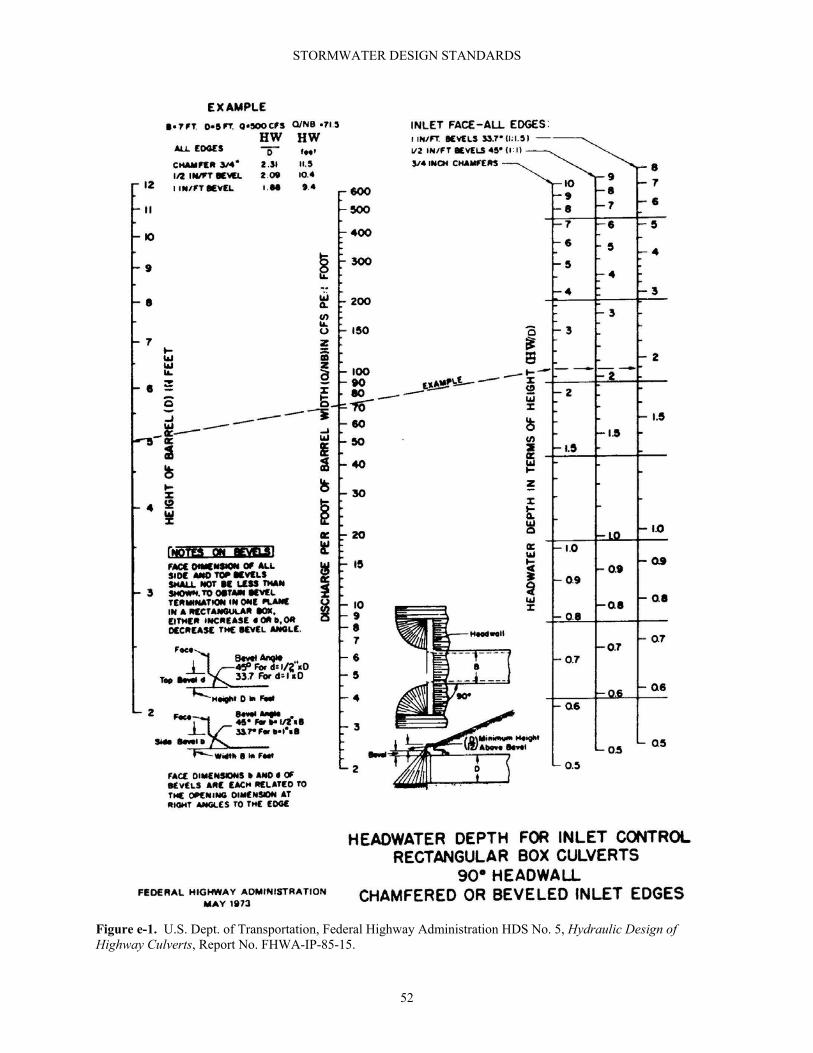
STORMWATER DESIGN STANDARDS
Figure e-1. U.S. Dept. of Transportation, Federal Highway Administration HDS No. 5, Hydraulic Design of Highway Culverts, Report No. FHWA-IP-85-15.
52
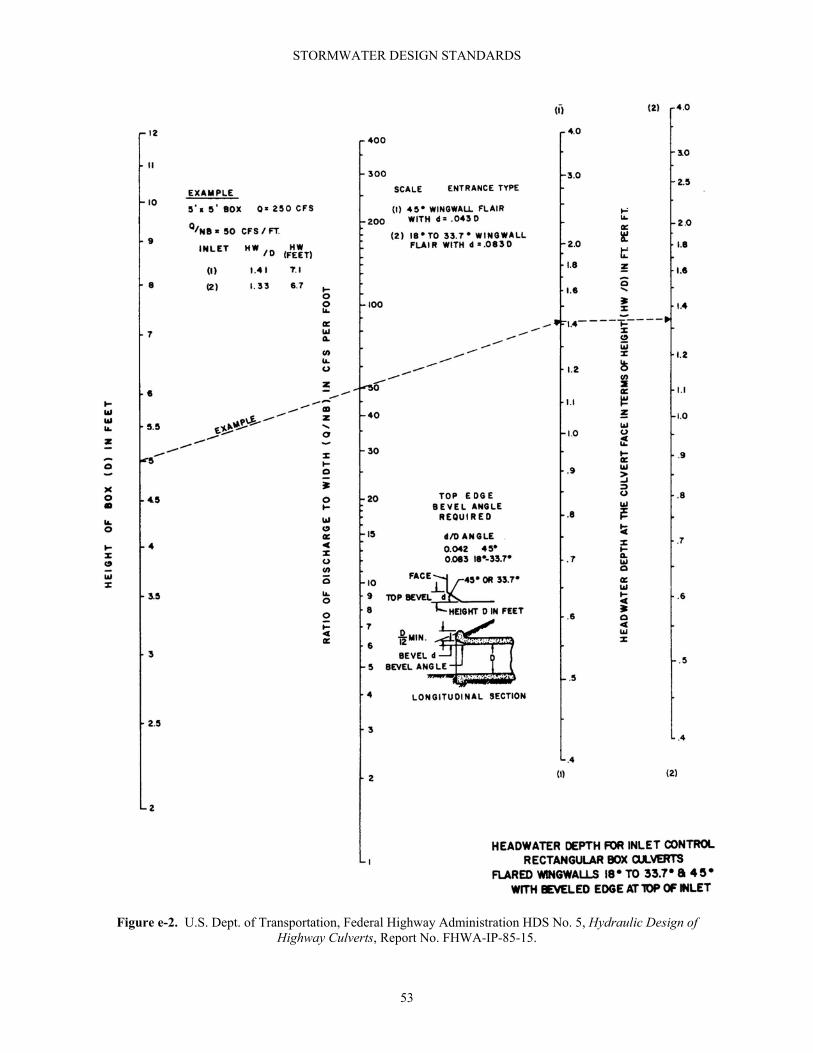
STORMWATER DESIGN STANDARDS
Figure e-2. U.S. Dept. of Transportation, Federal Highway Administration HDS No. 5, Hydraulic Design of Highway Culverts, Report No. FHWA-IP-85-15.
53
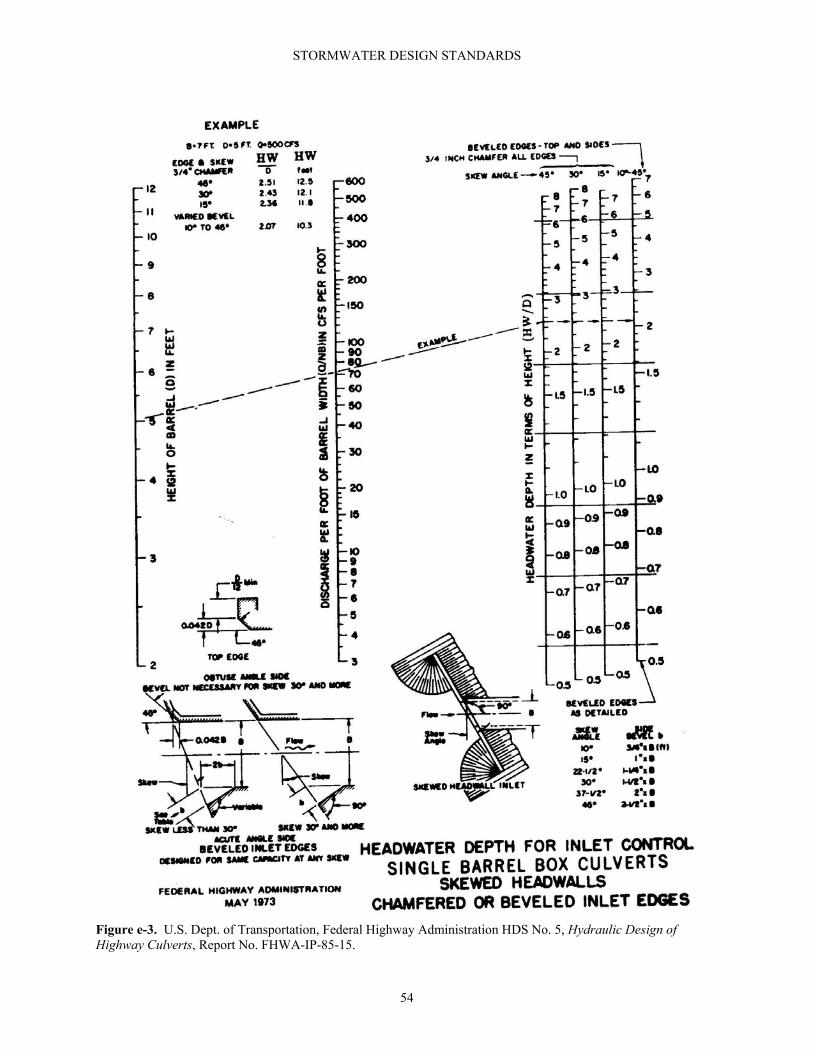
STORMWATER DESIGN STANDARDS
Figure e-3. U.S. Dept. of Transportation, Federal Highway Administration HDS No. 5, Hydraulic Design of Highway Culverts, Report No. FHWA-IP-85-15.
54
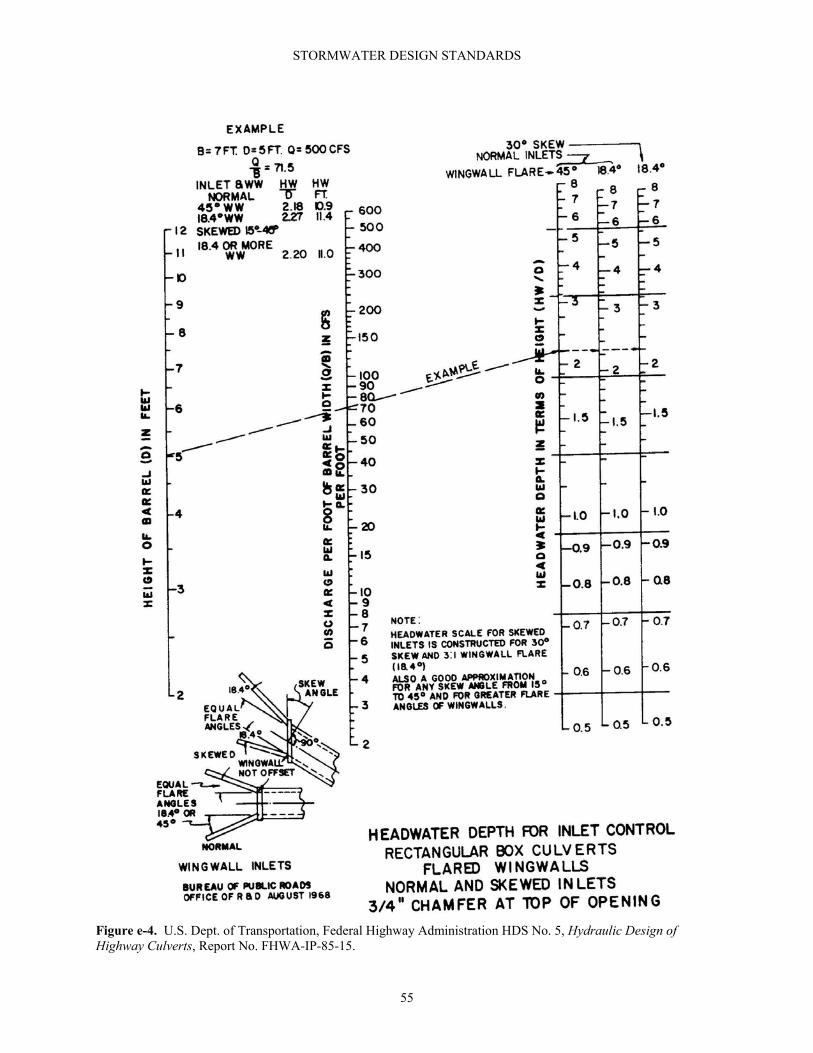
STORMWATER DESIGN STANDARDS
Figure e-4. U.S. Dept. of Transportation, Federal Highway Administration HDS No. 5, Hydraulic Design of Highway Culverts, Report No. FHWA-IP-85-15.
55
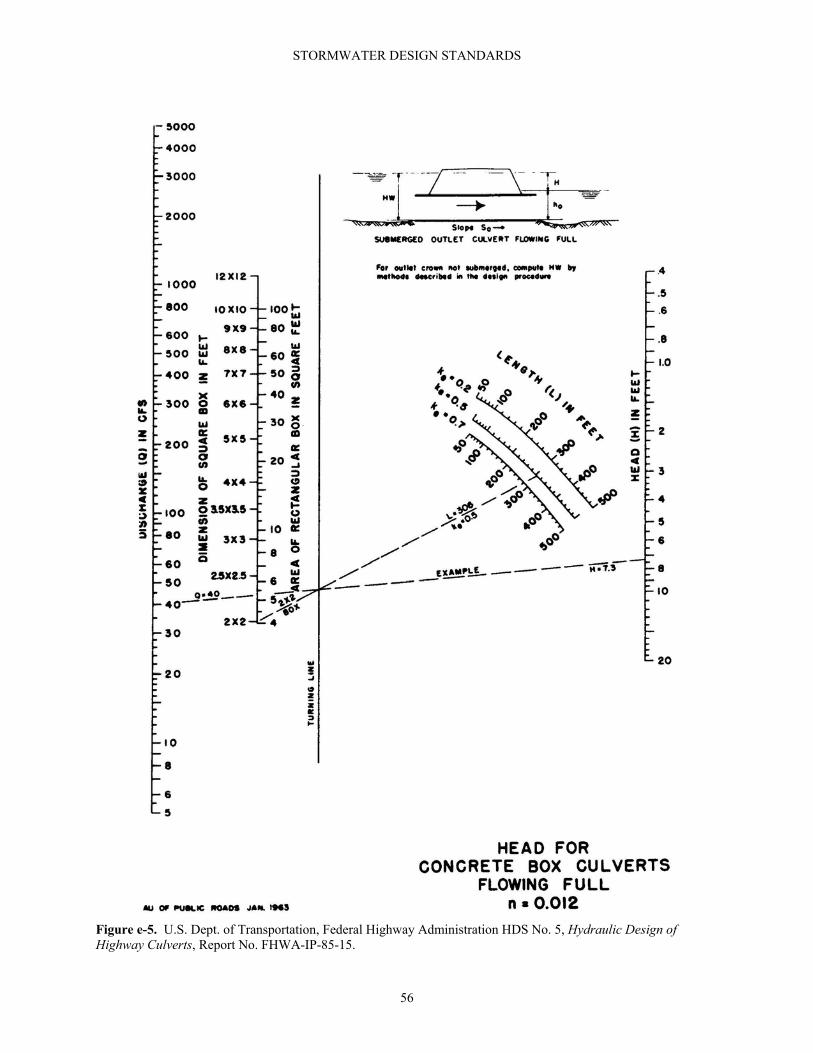
STORMWATER DESIGN STANDARDS
Figure e-5. U.S. Dept. of Transportation, Federal Highway Administration HDS No. 5, Hydraulic Design of Highway Culverts, Report No. FHWA-IP-85-15.
56
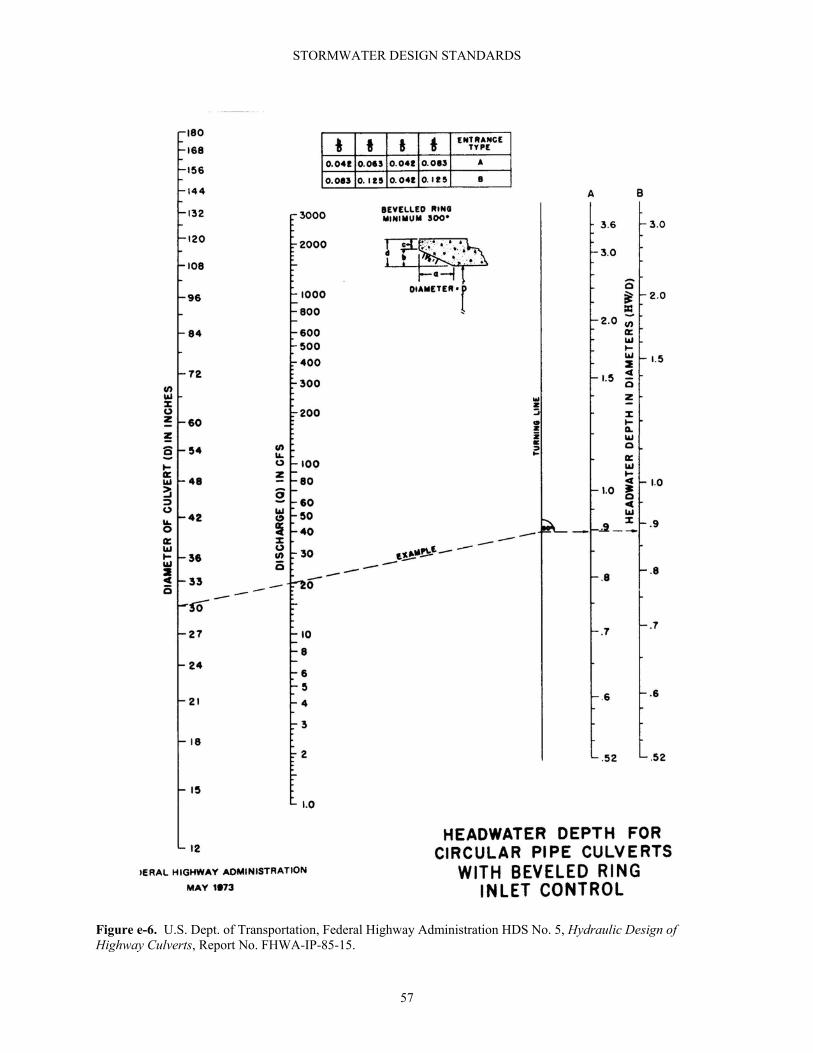
STORMWATER DESIGN STANDARDS
Figure e-6. U.S. Dept. of Transportation, Federal Highway Administration HDS No. 5, Hydraulic Design of Highway Culverts, Report No. FHWA-IP-85-15.
57
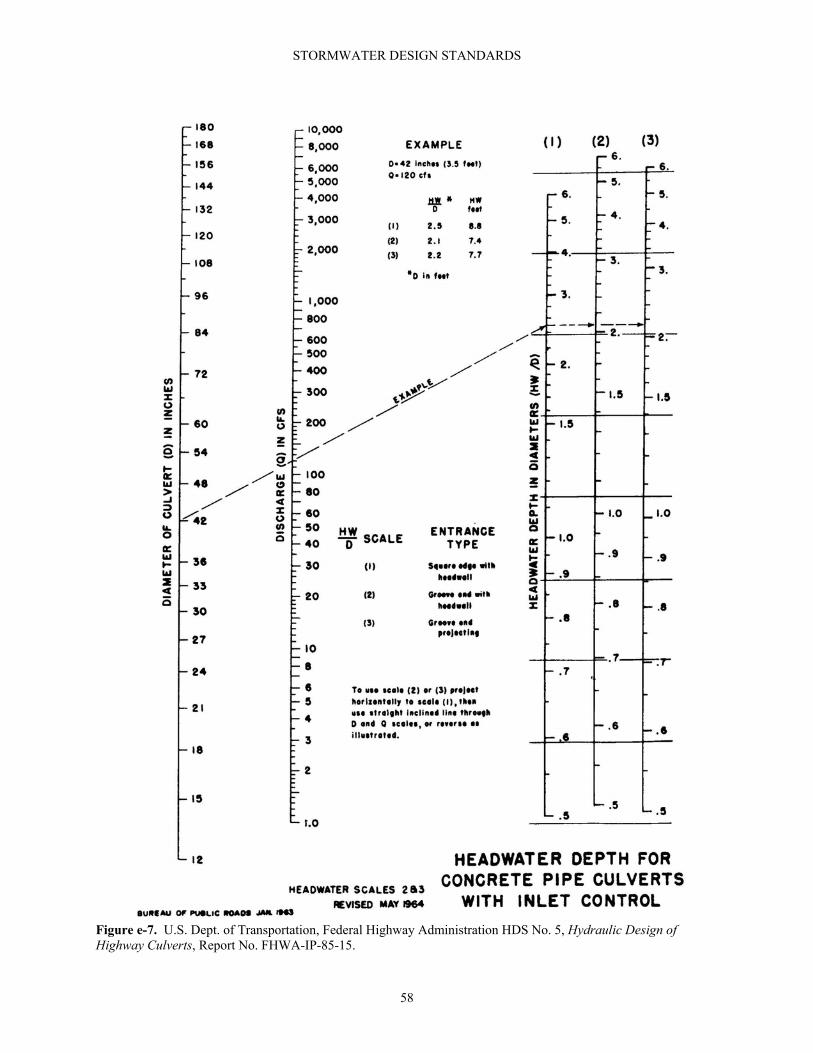
STORMWATER DESIGN STANDARDS
Figure e-7. U.S. Dept. of Transportation, Federal Highway Administration HDS No. 5, Hydraulic Design of Highway Culverts, Report No. FHWA-IP-85-15.
58
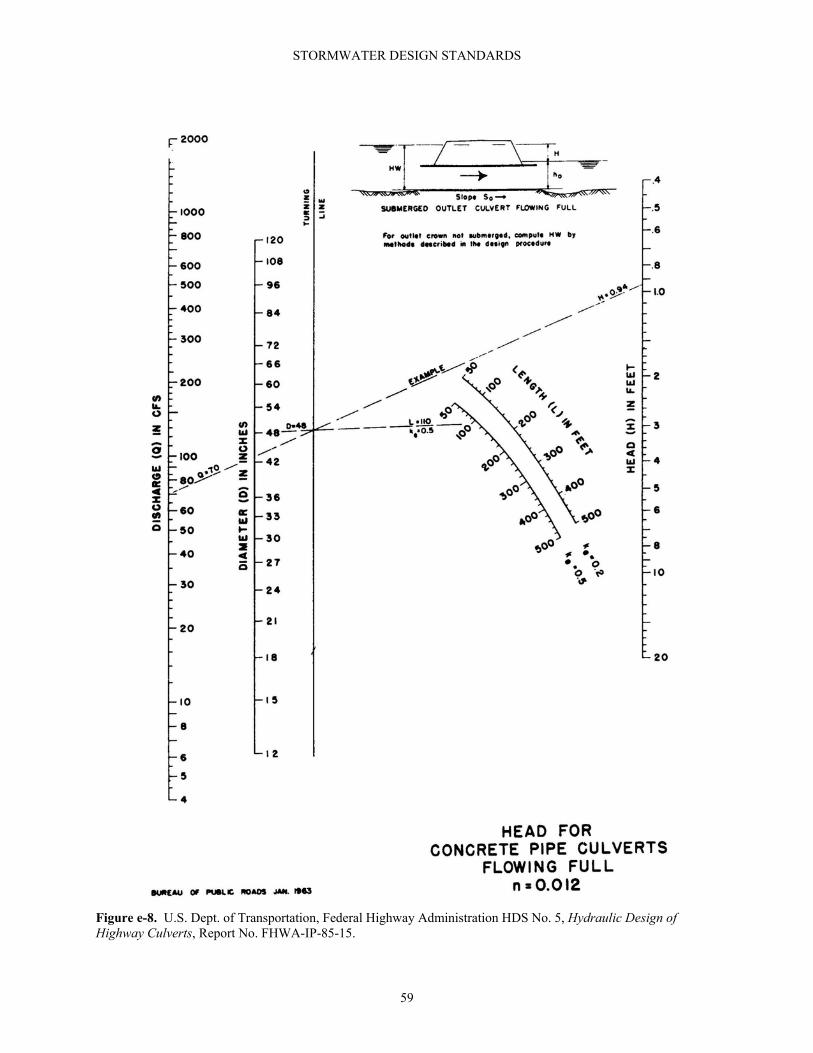
STORMWATER DESIGN STANDARDS
Figure e-8. U.S. Dept. of Transportation, Federal Highway Administration HDS No. 5, Hydraulic Design of Highway Culverts, Report No. FHWA-IP-85-15.
59
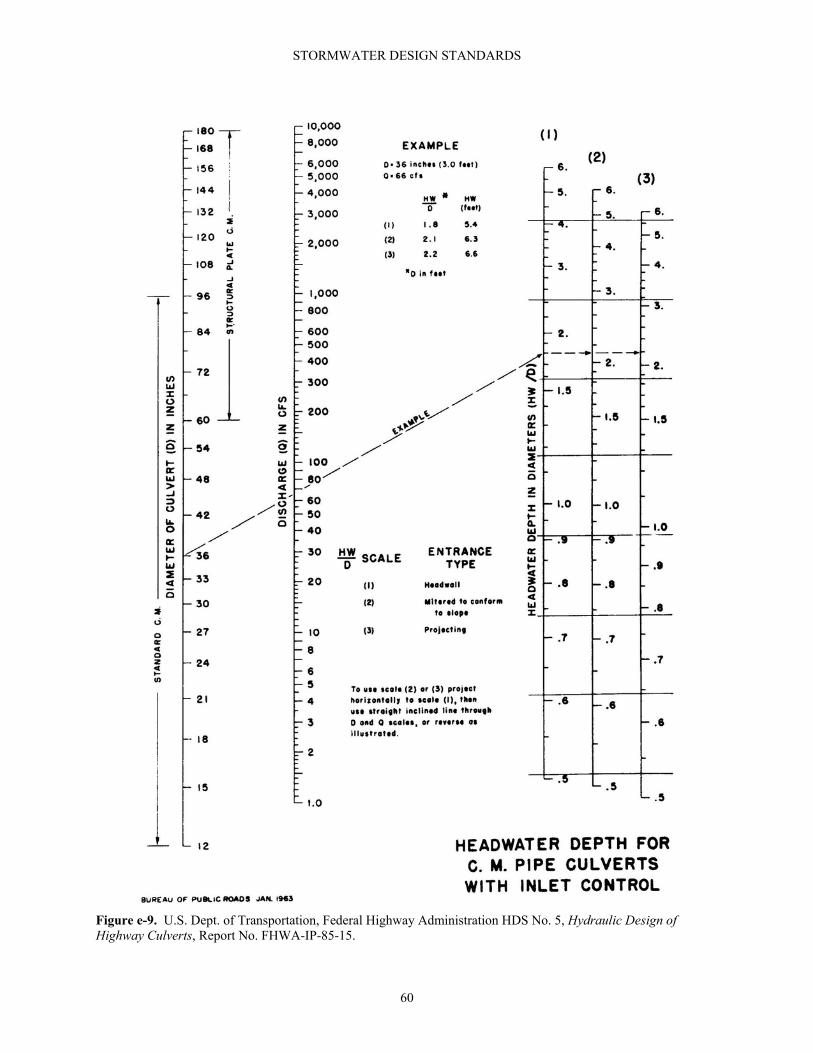
STORMWATER DESIGN STANDARDS
Figure e-9. U.S. Dept. of Transportation, Federal Highway Administration HDS No. 5, Hydraulic Design of Highway Culverts, Report No. FHWA-IP-85-15.
60
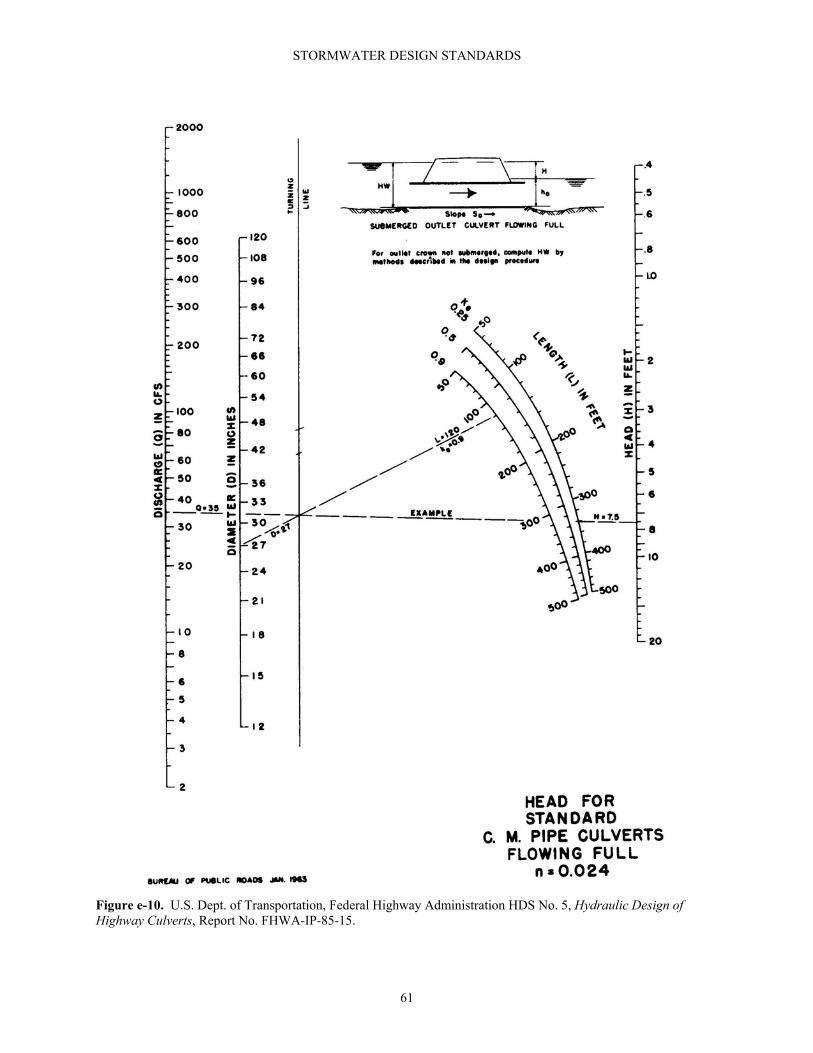
STORMWATER DESIGN STANDARDS
Figure e-10. U.S. Dept. of Transportation, Federal Highway Administration HDS No. 5, Hydraulic Design of Highway Culverts, Report No. FHWA-IP-85-15.
61
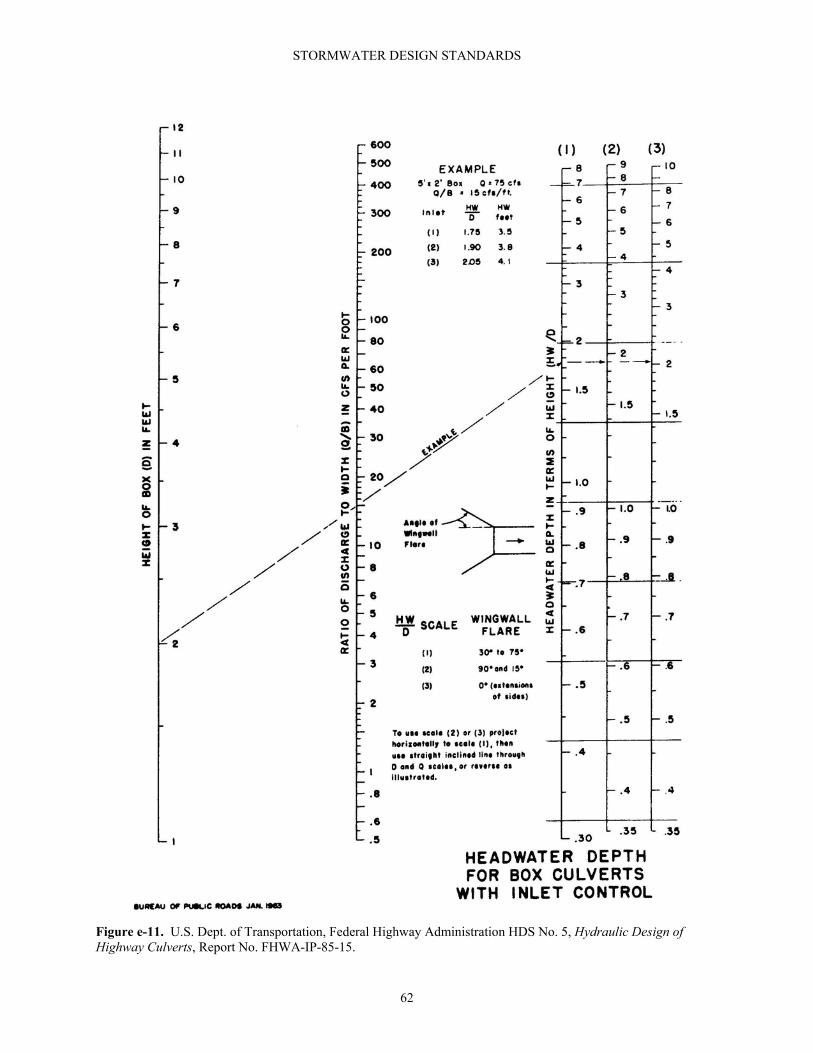
STORMWATER DESIGN STANDARDS
Figure e-11. U.S. Dept. of Transportation, Federal Highway Administration HDS No. 5, Hydraulic Design of Highway Culverts, Report No. FHWA-IP-85-15.
62
STORMWATER DESIGN STANDARDS
STORMWATER DETENTION (7) GENERAL The primary objectives of requiring developments to control the stormwater discharge rate are: 1. to allow development without increased flooding of downstream areas; 2. to reduce damage to receiving streams and impairment of their capacity caused by increases
in the quantity and rate of water discharged; 3. to assure the long-term adequacy of storm drainage systems and to establish a basis for the
design of a storm drainage system which will preserve the rights of all property owners. Storage of excess stormwater runoff is one of the most widely used methods today in alleviating urban flood damage. Stormwater detention and retention facilities should be planned and designed to assure an effective and efficient method for operation and maintenance. Retention and detention are two generalized types of runoff storage used to control flooding. Retention storage refers to storm runoff collected and stored for a significant period and released or used after the storm has ended. Retention storage consists of a permanent reservoir which often has agricultural, recreational, and/or aesthetic value. Flood storage volume is provided above the permanent water surface. Detention storage refers to stormwater held only during and shortly after runoff events. Stormwater detention reduces the peak runoff rate by controlling stormwater discharge through an outlet structure and by extending the duration of the runoff. Detention facilities can either be on-line or off-line. On-line detention basins are located on the main stream of a watercourse and intercept on-site as well as off-site flows. Off-line detention basins are located outside the primary watercourse and allow off-site flows to pass through the site without passing through the detention basin. Peak channel flows may be reduced at the point of interest and diverted to the off-line facility through the use of side flow weirs or similar diversions. Uses of the procedures outlined in this section provide a minimum standard for the planning and design of retention and detention facilities which shall be incorporated into a development. (8) DESIGN CONSIDERATIONS 1. Hydrology. The design storm used should be approximately 1.5 to 2.5 times the time of
concentration of the watershed, but shall not be less than 1 hour or greater than 24 hours. Runoff calculations shall take into consideration the proposed ultimate development of the entire watershed.
63
STORMWATER DESIGN STANDARDS
2. Required Volume. All retention and detention basins shall be designed to detain runoff from a 2-year, 10-year or 25-year design storm such that the discharge of said runoff shall not exceed the pre-development peak discharge for each respective design storm. Required storage volume provided for 2-year, 10-year and 25-year design storms shall be calculated based on the assumption that all detention basin discharge shall exit via the primary spillway. Detention and retention basins shall be designed to safely pass the 100-year design storm without damage to the facility or downstream channel.
The routing computations shall be based on an application of the continuity principle (i.e., level pool routing).
3. Location. Detention basins shall be located within a single lot or property. The Engineer shall make every effort to locate the detention facility at or near the lowest point of the project such that all on-site runoff will be directed into the detention facility.
Detention basins proposed to be located within a designated 100-year floodplain as identified on the Flood Insurance Rate Map (FIRM) shall not be permitted unless the design, including the emergency spillway, has been certified by a registered professional engineer to cause no increase in the base flood elevation. For these cases the engineer shall issue a certificate of NO-RISE in accordance with current Federal Emergency Management Agency (FEMA) requirements. All floodplain development permits must be submitted to the City in accordance with Chapter 15 of the Rolla City Code, Stormwater and Flood Control.
4. Construction. Control structures and overflow structures shall be constructed of reinforced concrete. Railroad tie walls cannot be used where water will be in contact with the railroad tie wall.
The maximum side slopes, without fencing, for detention basins, and the fluctuating area of retention basins shall be 3:1. A 4 foot (minimum height) approved fence shall be provided around the perimeter of any basin where the side slopes exceed 3:1.
A minimum grade of 1.0 % shall be provided in the bottom of a detention pond, unless a low flow trickle channel is provided, in which case, the minimum grade must be no less than 0.4 %.
5. Retention ponds or lakes: Retention ponds shall be designed to minimize fluctuating lake levels. Maximum fluctuation from the permanent pool elevation to the maximum ponding elevation shall be 3 feet. Minimum depth of retention ponds shall be 4 feet. The engineer is encouraged to contact the Missouri Department of Conservation if the pond is to be stocked with fish.
(9) HYDRAULIC / HYDROLOGIC DESIGN Industry accepted stormwater storage routing methods and/or programs must be used for sizing all basins.
64
STORMWATER DESIGN STANDARDS
(10) MAXIMUM DEPTH The maximum depth of water in a dry detention basin shall not exceed 8 feet. Projects which need a deeper basin to attain the required detention volume due to physical constraints may be evaluated on a case-by-case basis. Additional requirements limiting access to the pond (e.g. fencing) may be required. The design and construction of dams greater than 8 feet in height, but which do not fall into state or federal requirement categories shall be designed in accordance with SCS Technical Release No. 60, Earth Dams and Reservoirs, August 1981, as Class “C” structures. Such dams must also be designed by a professional engineer registered in the State of Missouri. (11) LIMITS OF MAXIMUM PONDING 1. The limits of maximum ponding in dry detention basins or permanent lakes shall not be
closer than 30 feet horizontally to any building and must be at least 2 feet below the lowest sill elevation of any building.
2. The limits of maximum ponding in parking lots shall not be closer than 10 feet horizontally
to any building and must be at least 1 foot below the lowest sill elevation of any building. 3. A minimum of 1 foot of freeboard shall be provided from the top of the basin to the
maximum ponding elevation. (12) OUTLET STRUCTURES Spillways and Outlet works, as well as conveyance system entrances to the detention basin, shall be equipped with energy dissipating devices as necessary to limit the peak discharge velocity to non-erosive velocities as noted in Table 5-1 on page 50. Spillways and outlet structures shall be provided with toewalls extending a minimum depth of 24 inches below finish grade at the upstream and downstream ends to prevent undercutting. Spillway sidewalls shall extend in height to the top of the dam. 2. Principal Outlet Structure The principal outlet structure shall be designed to function without requiring attendance or operation of any kind or requiring use of equipment or tools, or any mechanical devices. Examples of some outlet structures are shown in Figure 6-1. It is considered good practice to install trash racks on retention and detention basin outlet structures. Trash racks will need routine cleaning to ensure proper function of the outlet structures. It is recommended that a maintenance schedule be adopted by the property owner responsible for upkeep.
65
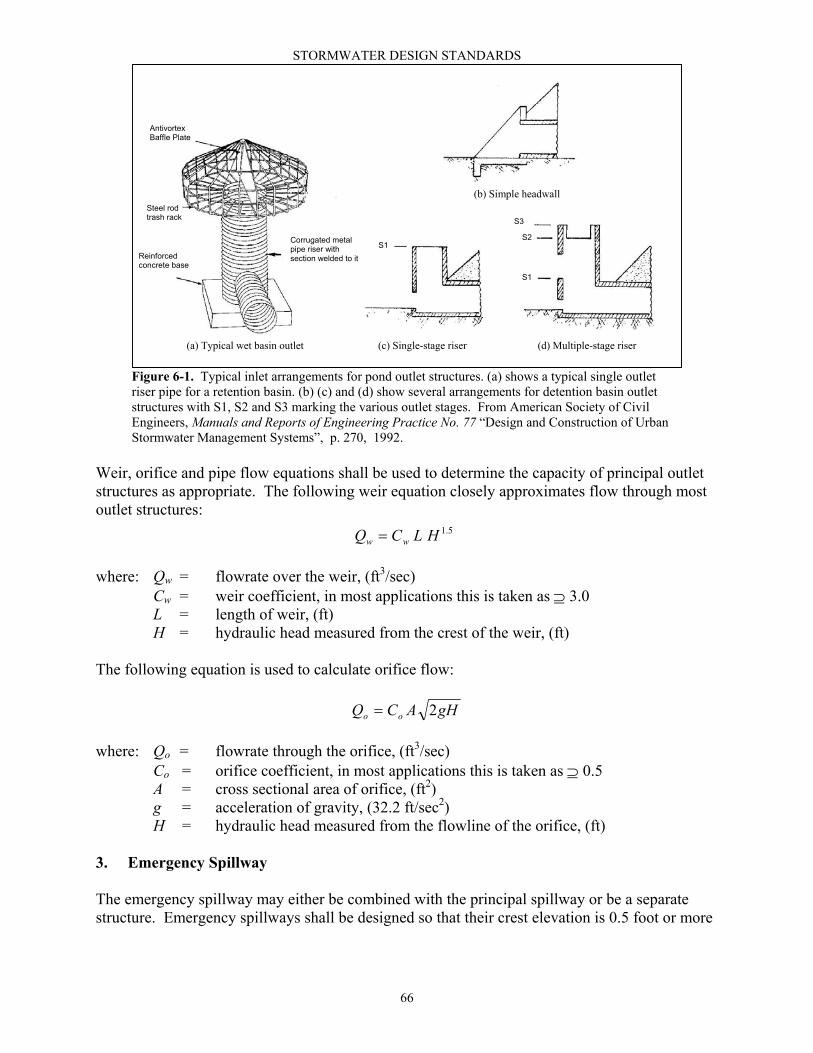
STORMWATER DESIGN STANDARDS
Figure 6-1. Typical inlet arrangements for pond outlet structures. (a) shows a typical single outlet riser pipe for a retention basin. (b) (c) and (d) show several arrangements for detention basin outlet structures with S1, S2 and S3 marking the various outlet stages. From American Society of Civil Engineers, Manuals and Reports of Engineering Practice No. 77 “Design and Construction of Urban Stormwater Management Systems”, p. 270, 1992.
S1
S2
S3
S1Corrugated metal pipe riser with section welded to it Reinforced
concrete base
Steel rod trash rack
Antivortex Baffle Plate
(a) Typical wet basin outlet (d) Multiple-stage riser (c) Single-stage riser
(b) Simple headwall
Weir, orifice and pipe flow equations shall be used to determine the capacity of principal outlet structures as appropriate. The following weir equation closely approximates flow through most outlet structures:
5.1HLCQ ww = where: Qw = flowrate over the weir, (ft3/sec) Cw = weir coefficient, in most applications this is taken as ⊇ 3.0 L = length of weir, (ft) H = hydraulic head measured from the crest of the weir, (ft) The following equation is used to calculate orifice flow:
gHACQ oo 2= where: Qo = flowrate through the orifice, (ft3/sec) Co = orifice coefficient, in most applications this is taken as ⊇ 0.5 A = cross sectional area of orifice, (ft2) g = acceleration of gravity, (32.2 ft/sec2) H = hydraulic head measured from the flowline of the orifice, (ft) 3. Emergency Spillway The emergency spillway may either be combined with the principal spillway or be a separate structure. Emergency spillways shall be designed so that their crest elevation is 0.5 foot or more
66
STORMWATER DESIGN STANDARDS
above the maximum water surface elevation in the detention facility attained by the 25-year storm. (13) EASEMENT REQUIRED In subdivisions, the detention basin, access roads or paths, control structures and outfall pipes are to be located in easements dedicated to the City. (14) MAINTENANCE On commercial projects, the Owner(s) of the project shall be responsible for maintenance of the detention basin or pond to ensure the detention area will be kept in working order. The City will be responsible for maintenance of detention basins that are in residentially zoned developments. Dry basins or ponds and the fluctuating areas of permanent ponds or lakes shall be vegetated and kept mowed. (15) REQUIRED SUBMITTALS The Engineer must submit the following for review of a stormwater detention facility:
A drainage area map showing the entire area tributary to the detention basin. Areas shall be noted in acres.
Runoff curve numbers for the entire drainage area.
The time of concentration and travel time for entire basin or each subbasin.
Elevation vs Discharge tables and curves for all design storms.
Elevation vs Storage tables and curves for all design storms.
Pre-development and post-development inflow hydrographs for all design storms.
A tabulation of inflow hydrographs routed through the detention basin by the storage indication method and a tabulation of subsequent outflow hydrograph, detention pond elevations and storage. Elevation at which the peak stage occurs should be included.
If the embankment contains fill material a geotechnical report may be required.
Site plan showing appropriate design information.
Structural details for the outlet control structures (if required).
Cross sections defining the size, shape and depth of the detention basin shall be required. At a minimum, three sections, one at each end and one in the middle of the basin will be required. These sections will be used to compute the as-built volume of the basin and thus must be tied to a known-physical structure or baseline.
67

STORMWATER ANALYSIS
f. DAM PERMIT REQUIREMENTS
Dams with a height of 35 feet or greater will require approval from the Missouri Department of Natural Resources Dam Safety Program.
68
STORMWATER ANALYSIS
g. DESIGN EXAMPLE
The following design example serves to illustrate the application of procedures outlined in these Design Standards, such as should be submitted to the City of Rolla. Example calculations and half-size (11” x 17”) plan sheets are included here for reference. Please refer to the Rolla City Code, Chapter 15, Stormwater and Flood Control, Section 15-12 for required submittals. (1) PROJECT CONDITIONS A 36 acre tract is to be developed with 1/3 to 1/2 acre lots for single family housing. The streets will have curb and gutter installed. The site plan for the proposed development is shown on Plan Sheet 1. Design the following stormwater system for the proposed development: • A stormwater conveyance system; • A detention basin; and • An erosion and sediment control plan. (2) SOLUTION Delineate the extents of the main drainage area. Then, study the subdivision plat and site topography on Plan Sheet 1 and determine the preliminary conveyance system layout. Locate all inlets, pipes and channels. The drainage area will be divided into subbasins tributary to each inlet. Delineate, measure and label each subbasin. All drainage structures are identified by letters and numbers. Curb inlets are identified as CI, junction boxes are identified as JB and flared end sections are identified as FES. Refer to Plan Sheets 2 for the drainage system layout. For conveyance system design, use a 10-year return period and a storm duration approximately equal to the time of concentration. The rational method may be employed for conveyance system design because the development is less than 200 acres. Conveyance system design begins at the upstream end and works downstream. We will begin example calculations with CI 3 on Line 2 and assume that Line 1 has already been designed. The basic procedure for each segment of the collection system is as follows: • Determine the peak flow rate to the inlet; • Determine the curb inlet capacity; • Size the outgoing pipe based on the longer time of concentration (inlet or upstream system)
accounting for all upstream area; When the conveyance system design is complete, check the hydraulic grade line. The following section outlines step-by-step procedures for designing the stormwater conveyance system.
69
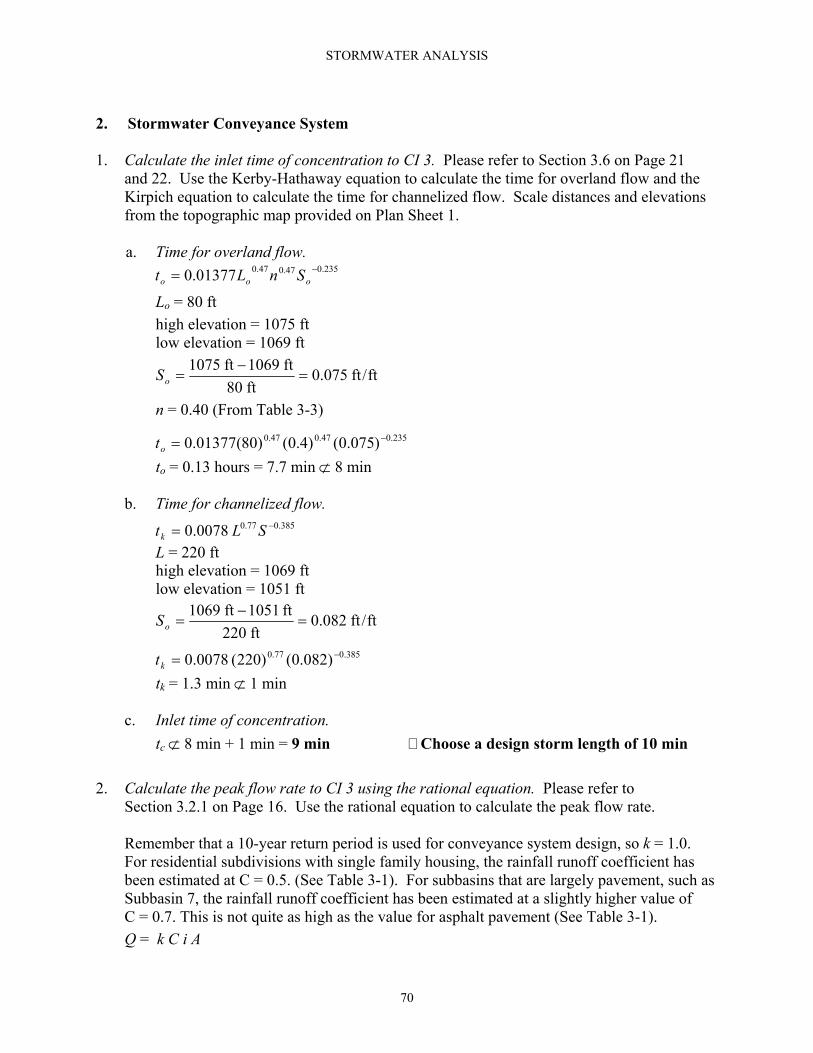
STORMWATER ANALYSIS
2. Stormwater Conveyance System
Calculate the inlet time of concentration to CI 3. Please refer to Section 3.6 on Page 21 and 22. Use the Kerby-Hathaway equation to calculate the time for overland flow and the Kirpich equation to calculate the time for channelized flow. Scale distances and elevations from the topographic map provided on Plan Sheet 1.
1.
2.
a. Time for overland flow.
235.047.047.001377.0 −= ooo SnLt
Lo = 80 ft high elevation = 1075 ft low elevation = 1069 ft
ft/ft075.0ft80
ft1069ft1075=
−=oS
n = 0.40 (From Table 3-3) 235.047.047.0 )075.0()4.0()80(01377.0 −=ot
to = 0.13 hours = 7.7 min ⊄ 8 min
b. Time for channelized flow. 385.077.00078.0 −= SLtk
L = 220 ft high elevation = 1069 ft low elevation = 1051 ft
ft/ft082.0ft220
ft1051ft1069=
−=oS
385.077.0 )082.0()220(0078.0 −=kttk = 1.3 min ⊄ 1 min
c. Inlet time of concentration. tc ⊄ 8 min + 1 min = 9 min Choose a design storm length of 10 min
Calculate the peak flow rate to CI 3 using the rational equation. Please refer to Section 3.2.1 on Page 16. Use the rational equation to calculate the peak flow rate. Remember that a 10-year return period is used for conveyance system design, so k = 1.0. For residential subdivisions with single family housing, the rainfall runoff coefficient has been estimated at C = 0.5. (See Table 3-1). For subbasins that are largely pavement, such as Subbasin 7, the rainfall runoff coefficient has been estimated at a slightly higher value of C = 0.7. This is not quite as high as the value for asphalt pavement (See Table 3-1).
Q = k C i A
70
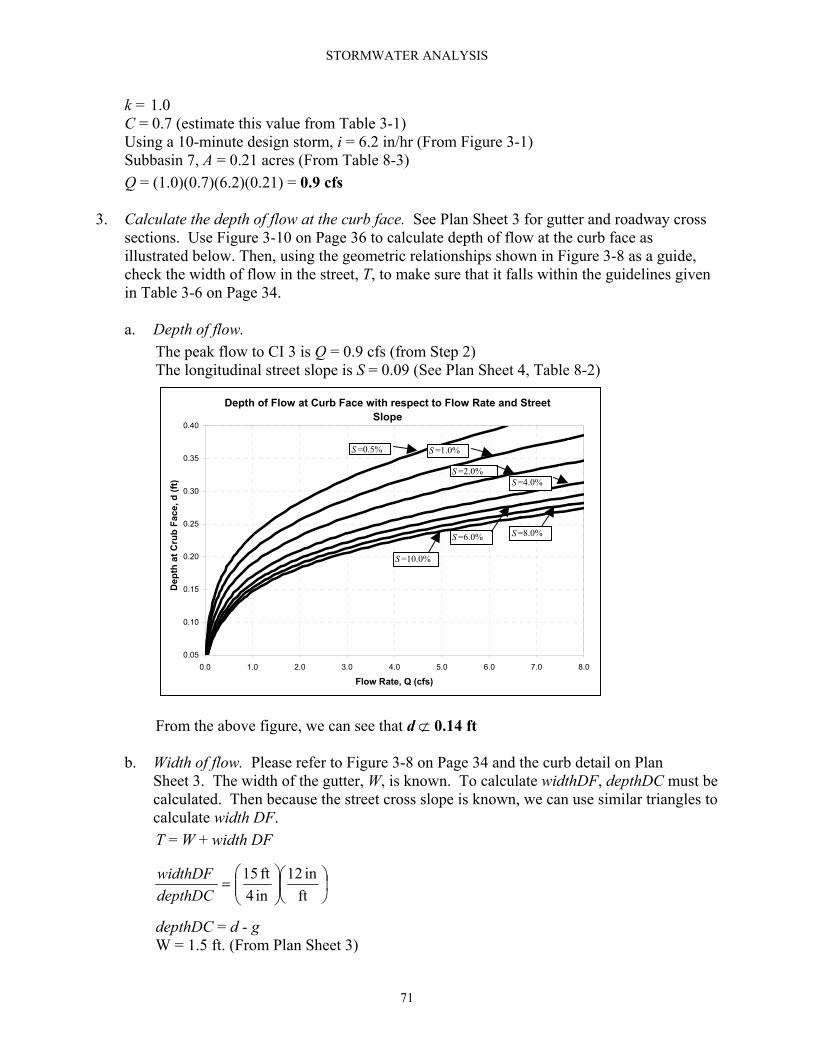
STORMWATER ANALYSIS
k = 1.0 C = 0.7 (estimate this value from Table 3-1)
Using a 10-minute design storm, i = 6.2 in/hr (From Figure 3-1) Subbasin 7, A = 0.21 acres (From Table 8-3) Q = (1.0)(0.7)(6.2)(0.21) = 0.9 cfs Calculate the depth of flow at the curb face. See Plan Sheet 3 for gutter and roadway cross sections. Use Figure 3-10 on Page 36 to calculate depth of flow at the curb face as illustrated below. Then, using the geometric relationships shown in Figure 3-8 as a guide, check the width of flow in the street, T, to make sure that it falls within the guidelines given in Table 3-6 on Page 34.
3.
a. Depth of flow. The peak flow to CI 3 is Q = 0.9 cfs (from Step 2) The longitudinal street slope is S = 0.09 (See Plan Sheet 4, Table 8-2)
Depth of Flow at Curb Face with respect to Flow Rate and Street Slope
0.05
0.10
0.15
0.20
0.25
0.30
0.35
0.40
0.0 1.0 2.0 3.0 4.0 5.0 6.0 7.0 8.0
Flow Rate, Q (cfs)
Dep
th a
t Cru
b Fa
ce, d
(ft)
S =0.5% S =1.0%
S =2.0%S =4.0%
S =6.0%
S =10.0%
S =8.0%
From the above figure, we can see that d ⊄ 0.14 ft
b. Width of flow. Please refer to Figure 3-8 on Page 34 and the curb detail on Plan Sheet 3. The width of the gutter, W, is known. To calculate widthDF, depthDC must be calculated. Then because the street cross slope is known, we can use similar triangles to calculate width DF.
T = W + width DF
=
ftin12
in4ft15
depthDCwidthDF
depthDC = d - g W = 1.5 ft. (From Plan Sheet 3)
71
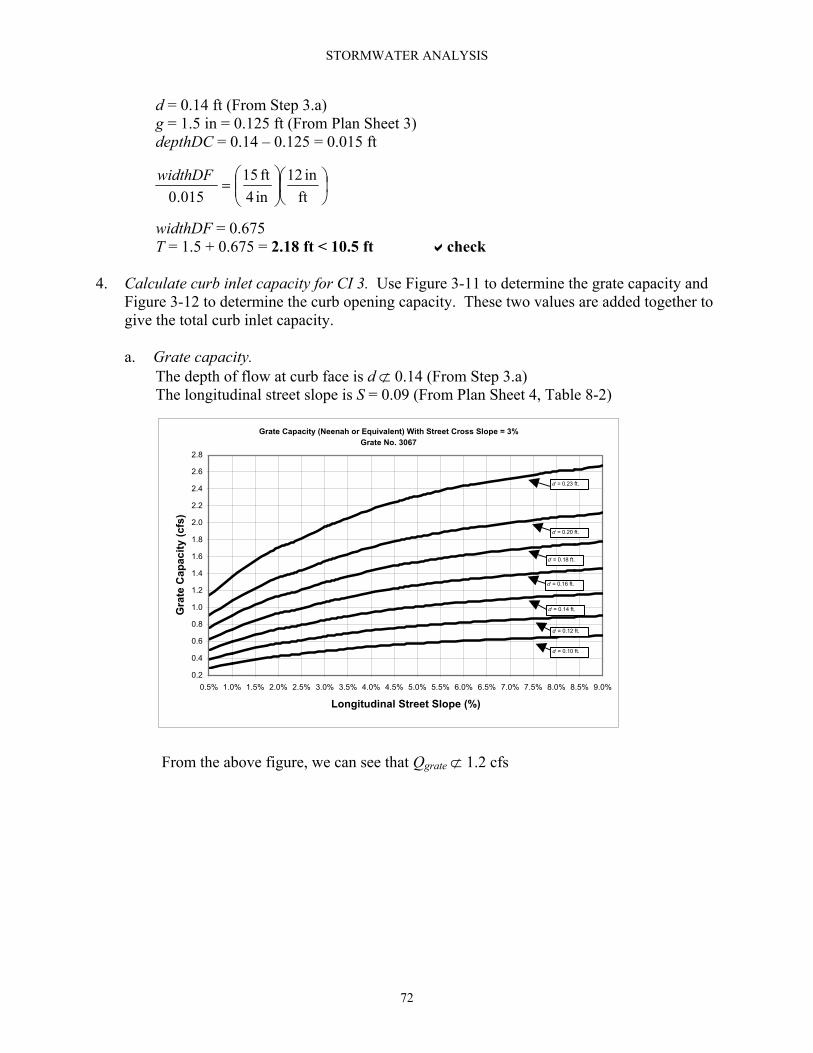
STORMWATER ANALYSIS
d = 0.14 ft (From Step 3.a) g = 1.5 in = 0.125 ft (From Plan Sheet 3) depthDC = 0.14 – 0.125 = 0.015 ft
=
ftin12
in4ft15
015.0widthDF
widthDF = 0.675 T = 1.5 + 0.675 = 2.18 ft < 10.5 ft check
Calculate curb inlet capacity for CI 3. Use Figure 3-11 to determine the grate capacity and Figure 3-12 to determine the curb opening capacity. These two values are added together to give the total curb inlet capacity.
4.
a. Grate capacity. The depth of flow at curb face is d ⊄ 0.14 (From Step 3.a) The longitudinal street slope is S = 0.09 (From Plan Sheet 4, Table 8-2)
Grate Capacity (Neenah or Equivalent) With Street Cross Slope = 3%Grate No. 3067
0.2
0.4
0.6
0.8
1.0
1.2
1.4
1.6
1.8
2.0
2.2
2.4
2.6
2.8
0.5% 1.0% 1.5% 2.0% 2.5% 3.0% 3.5% 4.0% 4.5% 5.0% 5.5% 6.0% 6.5% 7.0% 7.5% 8.0% 8.5% 9.0%
Longitudinal Street Slope (%)
Gra
te C
apac
ity (c
fs)
d = 0.23 ft.
d = 0.20 ft.
d = 0.18 ft.
d = 0.16 ft.
d = 0.14 ft.
d = 0.12 ft.
d = 0.10 ft.
From the above figure, we can see that Qgrate ⊄ 1.2 cfs
72
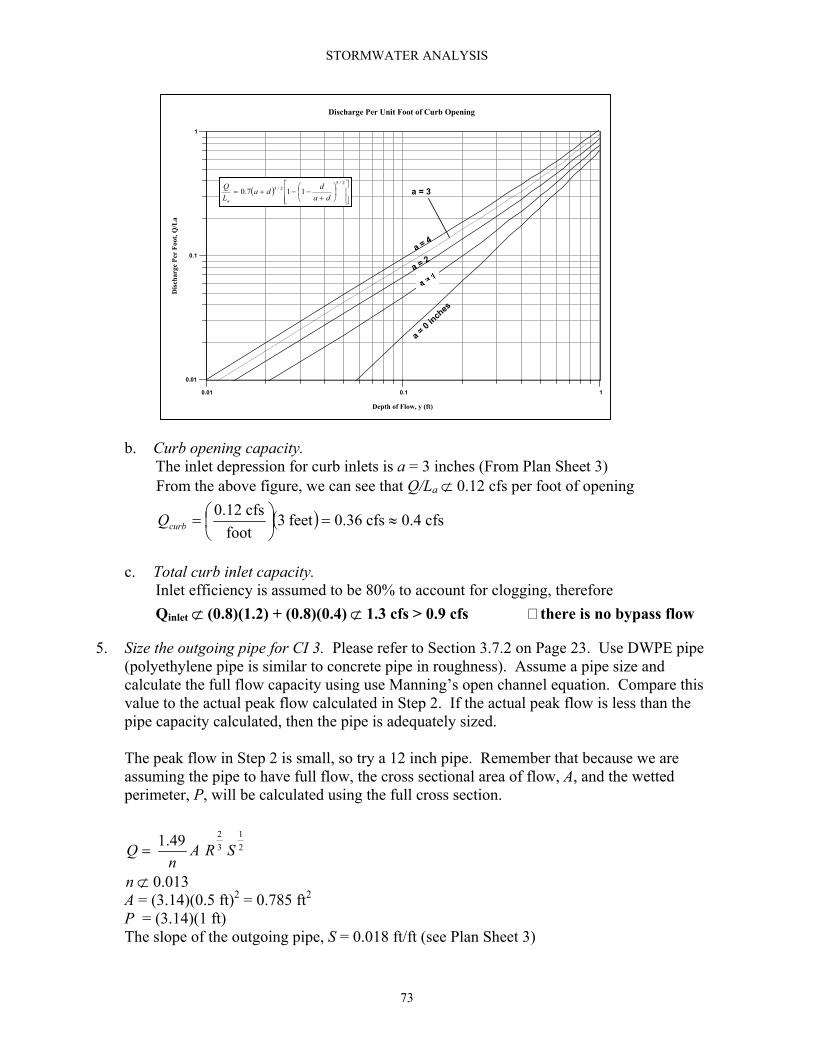
STORMWATER ANALYSIS
0.01 0.1 1
Depth of Flow, y (ft)
0.01
0.1
1
Dis
char
ge P
er F
oot,
Q/L
a
Discharge Per Unit Foot of Curb Opening
a = 0
inches
a = 3
a = 4
a = 2
( )
+−−+=
2/52/3 117.0
dadda
LQ
a
b. Curb opening capacity. The inlet depression for curb inlets is a = 3 inches (From Plan Sheet 3)
From the above figure, we can see that Q/La ⊄ 0.12 cfs per foot of opening
( ) cfs4.0cfs36.0feet3foot
cfs12.0≈=
=curbQ
c. Total curb inlet capacity. Inlet efficiency is assumed to be 80% to account for clogging, therefore Qinlet ⊄ (0.8)(1.2) + (0.8)(0.4) ⊄ 1.3 cfs > 0.9 cfs there is no bypass flow
Size the outgoing pipe for CI 3. Please refer to Section 3.7.2 on Page 23. Use DWPE pipe (polyethylene pipe is similar to concrete pipe in roughness). Assume a pipe size and calculate the full flow capacity using use Manning’s open channel equation. Compare this value to the actual peak flow calculated in Step 2. If the actual peak flow is less than the pipe capacity calculated, then the pipe is adequately sized.
5.
The peak flow in Step 2 is small, so try a 12 inch pipe. Remember that because we are assuming the pipe to have full flow, the cross sectional area of flow, A, and the wetted perimeter, P, will be calculated using the full cross section.
21
3249.1 SRA
nQ =
n ⊄ 0.013 A = (3.14)(0.5 ft)2 = 0.785 ft2 P = (3.14)(1 ft) The slope of the outgoing pipe, S = 0.018 ft/ft (see Plan Sheet 3)
73
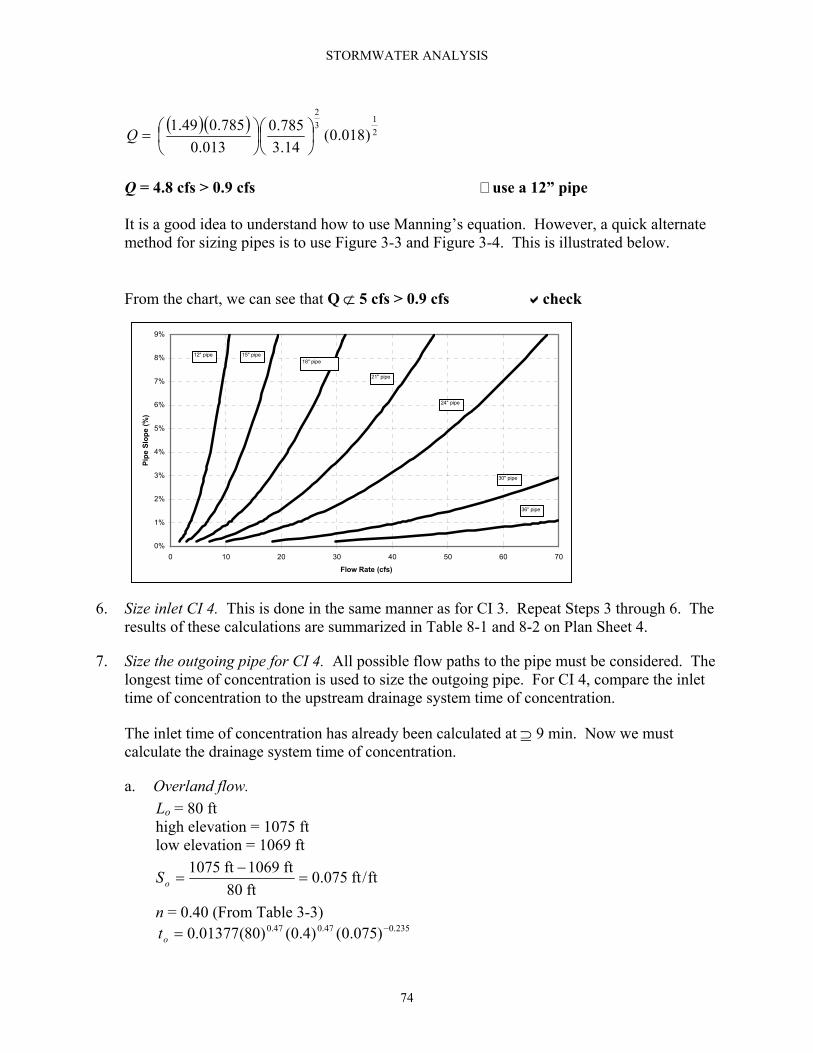
STORMWATER ANALYSIS
( )( ) 21
32
)018.0(14.3785.0
013.0785.049.1
=Q
Q = 4.8 cfs > 0.9 cfs use a 12” pipe It is a good idea to understand how to use Manning’s equation. However, a quick alternate method for sizing pipes is to use Figure 3-3 and Figure 3-4. This is illustrated below. From the chart, we can see that Q ⊄ 5 cfs > 0.9 cfs check
0%
1%
2%
3%
4%
5%
6%
7%
8%
9%
0 10 20 30 40 50 60 7
Flow Rate (cfs)
Pipe
Slo
pe (%
)
12" pipe
24" pipe
21" pipe
18" pipe15" pipe
30" pipe
36" pipe
0
6.
7.
n = 0.40 (From Table 3-3) 235.047.047.0 )075.0()4.0()80(01377.0 −=ot
Size inlet CI 4. This is done in the same manner as for CI 3. Repeat Steps 3 through 6. The results of these calculations are summarized in Table 8-1 and 8-2 on Plan Sheet 4.
Size the outgoing pipe for CI 4. All possible flow paths to the pipe must be considered. The longest time of concentration is used to size the outgoing pipe. For CI 4, compare the inlet time of concentration to the upstream drainage system time of concentration.
The inlet time of concentration has already been calculated at ⊇ 9 min. Now we must calculate the drainage system time of concentration.
a. Overland flow. Lo = 80 ft high elevation = 1075 ft low elevation = 1069 ft
ft/ft075.0ft80
ft1069ft1075=
−=oS
74
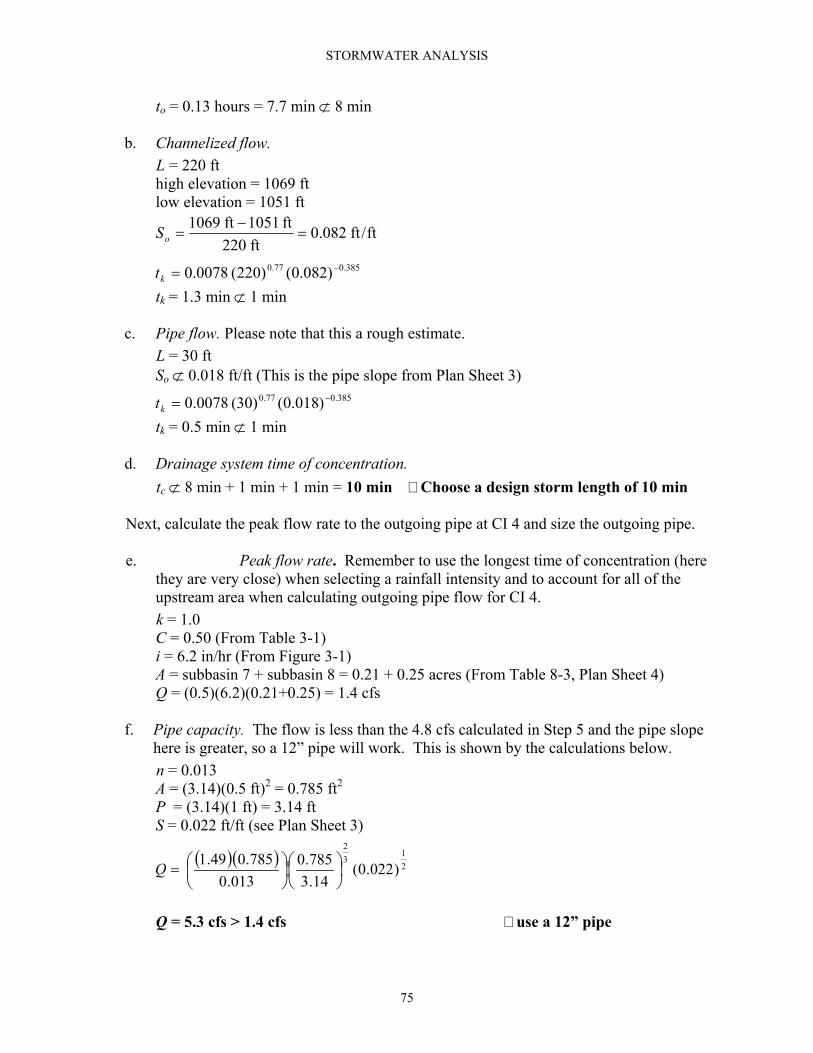
STORMWATER ANALYSIS
to = 0.13 hours = 7.7 min ⊄ 8 min
b. hannelized flow. L = 220 ft high elevation = 1069 ft
1 ft
c. gh estimate.
⊄ 0.018 ft/ft (This is the pipe slope from Plan Sheet 3)
d. min = 10 min Choose a design storm length of 10 min
ing pipe at CI 4 and size the outgoing pipe.
. Peak flow rate. Remember to use the longest time of concentration (here
upstream area when calculating outgoing pipe flow for CI 4. k = 1.0
asin 7 + subbasin 8 = 0.21 + 0.25 acres (From Table 8-3, Plan Sheet 4) 1.4 cfs
f. lope rk. This is shown by the calculations below.
= 0.013
t/ft (see Plan Sheet 3)
use a 12” pipe
C
low elevation = 105
tk = 1.3 min ⊄ 1 min
385.0)082.0()220(0078.0 −=kt
Pipe flow. Please note that this a rouL = 30 ft So
385.077.0 −
tk = 0.5 min ⊄ 1 min Drainage system time of concentration.tc ⊄ 8 min + 1 min + 1
Next, calculate the peak flow rate to the outgo
ethey are very close) when selecting a rainfall intensity and to account for all of the
C = 0.50 (From Table 3-1) i = 6.2 in/hr (From Figure 3-1) A = subbQ = (0.5)(6.2)(0.21+0.25) = Pipe capacity. The flow is less than the 4.8 cfs calculated in Step 5 and the pipe shere is greater, so a 12” pipe will wonA = (3.14)(0.5 ft)2 = 0.785 ft2 P = (3.14)(1 ft) = 3.14 ft S = 0.022 f
Q = 5.3 cfs > 1.4 cfs
77.0
ft/ft082.ft1051−
)018.0()30(8
0ft220
==oS ft1069
007.0=kt
( )( ) 78.0785.049.1
=Q 2
13
)022.0(5
2
14.3013.0
75
STORMWATER ANALYSIS
8. Size inlet CI 5. This is a sump inlet, so there will be no bypass flow; all flow to CI 5 must be inlet flow. Additionally, there is no bypass flow from upst let time of concentration and peak flow rate is calculated in the same manner as shown in Steps 1
th of 10 min
2 0.22+ .14) = 1.6 cfs
ity. A given depth of water over the inlet will produce a given flow ak flow rate (to account for inlet efficiency) begin
ith a single inlet and, from Figure 3-13, determine the resulting depth of flow in the
. Width of flow in street. This is done in the same manner as for CI 3, Step 3.b. The
9.
conc
ream inlets. The in
and 2. The results of these calculations are summarized in Plan Sheet 4 and shown below. Use Figure 3-13 to properly size the inlet as shown on the next page. a. Inlet time of concentration.
tc ≈ 3 min Choose a design storm leng
b. Peak flow rate. Q = (0.7)(6. )( 0
c. Curb inlet capacrate. Therefore, using 80% of the pewstreet. If this depth of water causes too much flooding in the street according to Table3-6, go back to Figure 3-13 and try two inlets (i.e. double the inlet capacity).
Sump Inlet C ap acit y ( N eenah o r Eq uivalent )
1
From the figure below, we can see that for the given flow rate, d = 0.1 ft.
0
0.1
0.2
0.3
0.4
0.5
0.6
0.7
0.8
0.9
0 1 2 3 4 5 6 7 8 9 1
Fl ow r a t e ( c f s)
Total capacity
Grate Capacity3 ft Curb Opening Capacity
0
dresults of these calculations are summarized in Table 8-2 on Plan Sheet 4.
Size the outgoing pipe for CI 5. In this case we must compare four values for time of entration. The separate times of concentration that we must calculate are:
a. inlet time of concentration to CI 5 (Step 8.a) b. upstream system time of concentration from Line 1
76
STORMWATER ANALYSIS
c. culvert time of concentration from subbasin 10 ine 2
on Plan Sheet 4 and Table 8-3 on Plan time of concentration to CI 5 is
(c) tc ⊄ 20 min for the overland flow route from subbasin 10. e.
C = 0.50 (From Table 3-1) Figure 3-1)
acres (From Table 8-3, Plan Sheet 4) cfs
pe to have full flow, the cross sectional ll be calculated using the full cross
f.
t)2 = 0.785 ft2
f the outgoing pipe, S = 0.018 ft/ft (see Plan Sheet 3)
we can see that Q ⊄ 53 cfs > 31 cfs use a 30” pipe 10. he rest of Line 2 is designed in a similar manner. The summary of calculations are shown
re lin of concentration will determine the design storm duration used to size the exiting pipe. All
d. upstream system time of concentration from L
These calculations are summarized in Tables 8-1Sheet 5. The longest, and therefore, the controlling
Peak Flow Rate. k = 1.0
i = 4.6 in/hr (From A = 13.6 Q = (0.5)(4.6)(13.6) = 31.2
Remember that because we are assuming the piperimeter, P, wiarea of flow, A, and the wetted
section.
Pipe Capacity.
n ⊄ 0.013 A = (3.14)(0.5 f P = (3.14)(1 ft) The slope o From Figure 3-3,
Tin Plan Sheet 4. Any time there is a confluence of two or mo es, the longest time
upstream drainage areas must be accounted for.
77
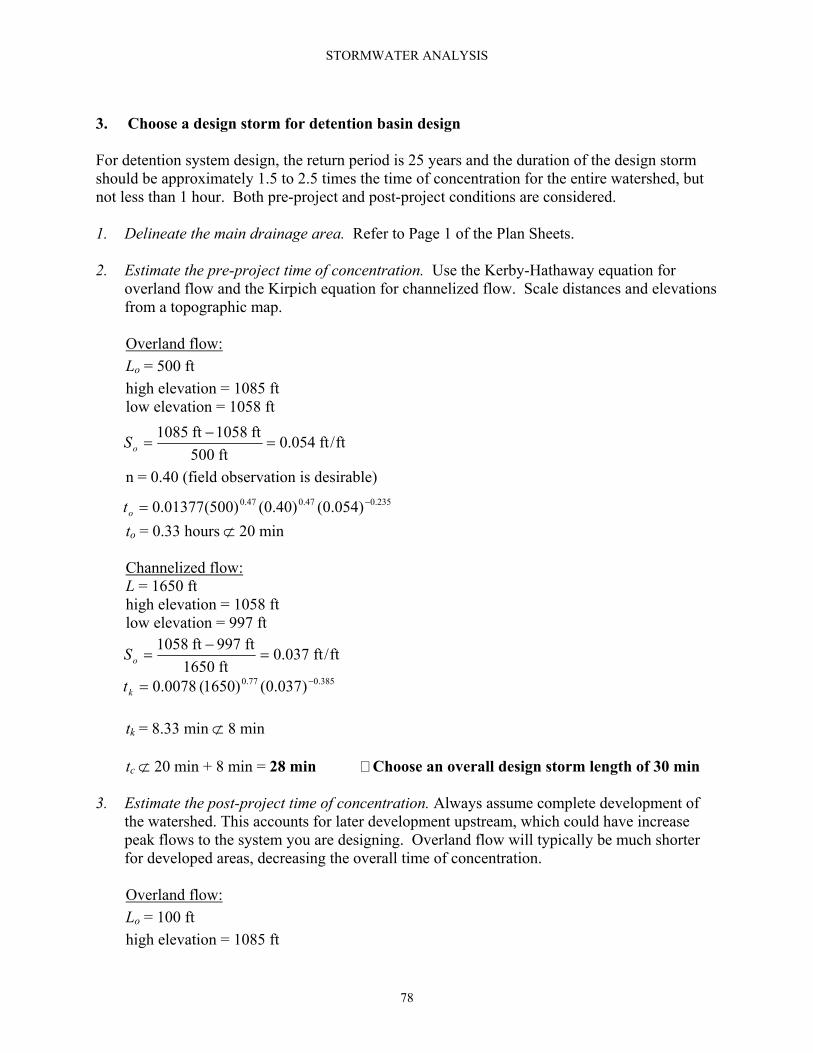
STORMWATER ANALYSIS
3. Choose a design storm for detention basin design For detention system design, the return period is 25 years and the duration of the design storm should be approximately 1.5 to 2.5 times the time of concentration for the entire watershed, but not less than 1 hour. Both pre-project and post-project conditions are considered. 1. Delineate the main drainage area. Refer to Page 1 of the Plan Sheets. 2. Estimate the pre-project time of concentration. Use the Kerby-Hathaway equation for
overland flow and the Kirpich equation for channelized flow. Scale distances and elevations from a topographic map. Overland flow: Lo = 500 ft high elevation = 1085 ft low elevation = 1058 ft
ft/ft054.0ft500
ft1058ft1085=
−=oS
n = 0.40 (field observation is desirable) 235.047.047.0 )054.0()40.0()500(01377.0 −=ot
to = 0.33 hours ⊄ 20 min Channelized flow: L = 1650 ft high elevation = 1058 ft low elevation = 997 ft
ft/ft037.0ft1650
ft997ft1058=
−=oS
385.077.0 )037.0()1650(0078.0 −=kt tk = 8.33 min ⊄ 8 min tc ⊄ 20 min + 8 min = 28 min Choose an overall design storm length of 30 min
3. Estimate the post-project time of concentration. Always assume complete development of the watershed. This accounts for later development upstream, which could have increase peak flows to the system you are designing. Overland flow will typically be much shorter for developed areas, decreasing the overall time of concentration. Overland flow: Lo = 100 ft high elevation = 1085 ft
78
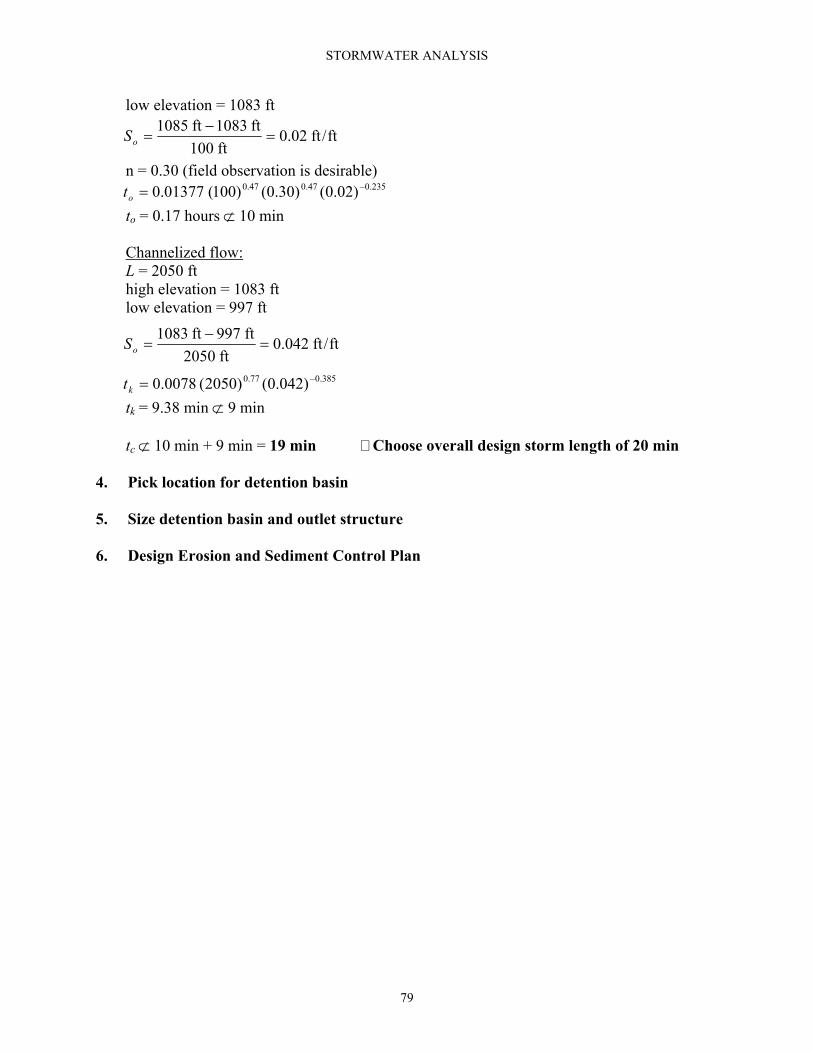
STORMWATER ANALYSIS
low elevation = 1083 ft
ft/ft02.0ft100
ft1083ft1085=
−=oS
n = 0.30 (field observation is desirable)
hannelized flow:
235.047.047.0 )02.0()30.0()100(01377.0 −=otto = 0.17 hours ⊄ 10 min C
n = 1083 ft
⊄ 10 min + 9 min = 19 min Choose overall design storm length of 20 min
4. Pick location for detention basin
. Size detention basin and outlet structure
. Design Erosion and Sediment Control Plan
L = 2050 ft high elevatiolow elevation = 997 ft
tk = 9.38 min ⊄ 9 min k
385.077.0 )042.0()2050(0078.0 −=t
ft/ft042.0ft2050
==oS ft997ft1083 −
tc
5 6
79
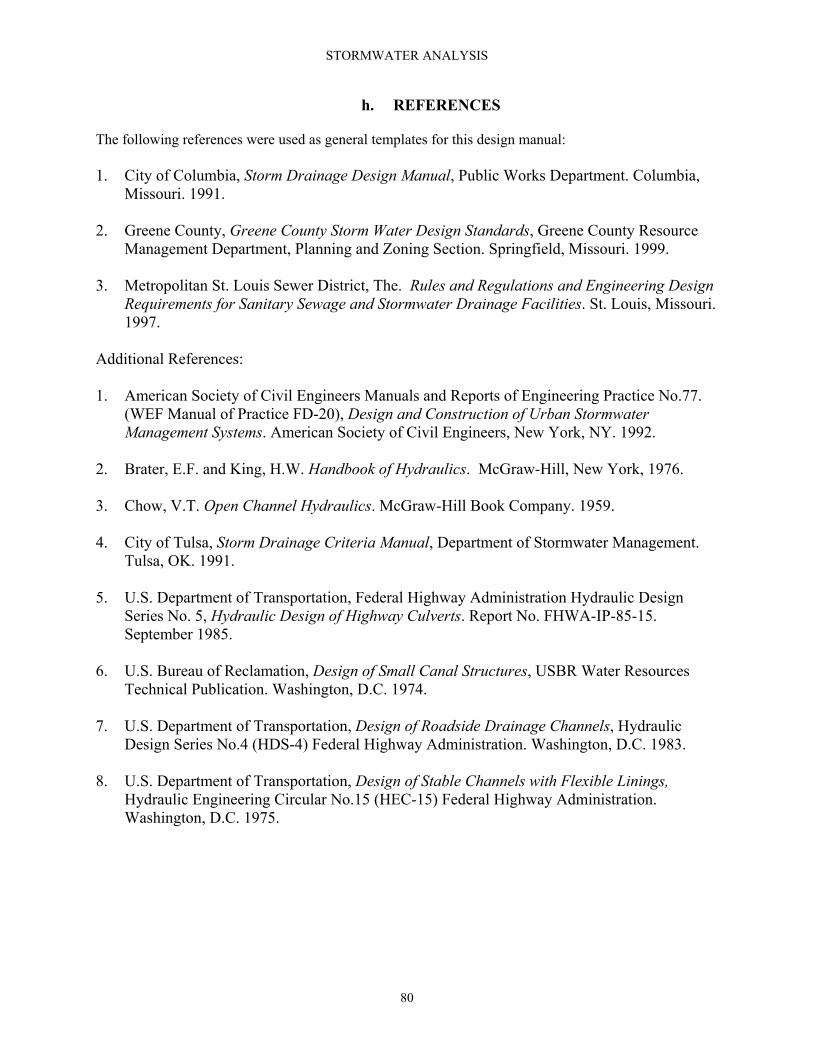
STORMWATER ANALYSIS
80
h. REFERENCES The following references were used as general templates for this design manual: 1. City of Columbia, Storm Drainage Design Manual, Public Works Department. Columbia,
Missouri. 1991. 2. Greene County, Greene County Storm Water Design Standards, Greene County Resource
Management Department, Planning and Zoning Section. Springfield, Missouri. 1999.
3. Metropolitan St. Louis Sewer District, The. Rules and Regulations and Engineering Design Requirements for Sanitary Sewage and Stormwater Drainage Facilities. St. Louis, Missouri. 1997.
Additional References: 1. American Society of Civil Engineers Manuals and Reports of Engineering Practice No.77.
(WEF Manual of Practice FD-20), Design and Construction of Urban Stormwater Management Systems. American Society of Civil Engineers, New York, NY. 1992.
2. Brater, E.F. and King, H.W. Handbook of Hydraulics. McGraw-Hill, New York, 1976. 3. Chow, V.T. Open Channel Hydraulics. McGraw-Hill Book Company. 1959. 4. City of Tulsa, Storm Drainage Criteria Manual, Department of Stormwater Management.
Tulsa, OK. 1991. 5. U.S. Department of Transportation, Federal Highway Administration Hydraulic Design
Series No. 5, Hydraulic Design of Highway Culverts. Report No. FHWA-IP-85-15. September 1985.
6. U.S. Bureau of Reclamation, Design of Small Canal Structures, USBR Water Resources
Technical Publication. Washington, D.C. 1974. 7. U.S. Department of Transportation, Design of Roadside Drainage Channels, Hydraulic
Design Series No.4 (HDS-4) Federal Highway Administration. Washington, D.C. 1983. 8. U.S. Department of Transportation, Design of Stable Channels with Flexible Linings,
Hydraulic Engineering Circular No.15 (HEC-15) Federal Highway Administration. Washington, D.C. 1975.