Embed Size (px)
Citation preview
Rewards and Punishments in Bargaining
Svetlana Pevnitskaya and Dmitry RyvkinFlorida State University
June 5, 2009Moscow
Introduction
• Economic and social activity is usually preceded by bargaining between the interested parties
• Bargaining fails when participants do not reach an agreement despite an opportunity for Pareto improvement
• Bargaining positions are often asymmetric
• The deal still hinges on a decision of voluntary engagement from the other party
• Can the acceptance decision be facilitated?
In this paper:
• asymmetric bargaining with two parties employing the setting of ultimatum games– acceptance decision is required for positive payoffs– extensively studied (robust and well understood
behavior)– most responders do not agree to low offers resulting in
monetary efficiency losses• review of early ultimatum experiments e.g., Guth 1995,
Roth 1995, Camerer and Thaler 1995
IntroductionIn this paper:
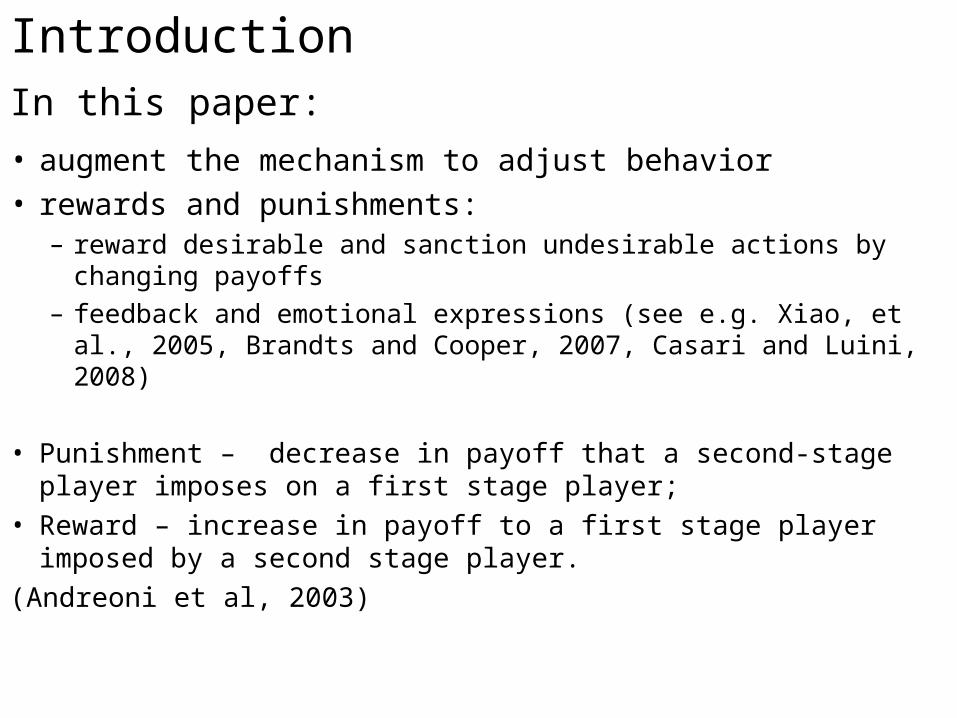
• augment the mechanism to adjust behavior
• rewards and punishments:– reward desirable and sanction undesirable actions by changing payoffs
– feedback and emotional expressions (see e.g. Xiao, et al., 2005, Brandts and Cooper, 2007, Casari and Luini, 2008)
• Punishment – decrease in payoff that a second-stage player imposes on a first stage player;
• Reward – increase in payoff to a first stage player imposed by a second stage player.
(Andreoni et al, 2003)
Introduction
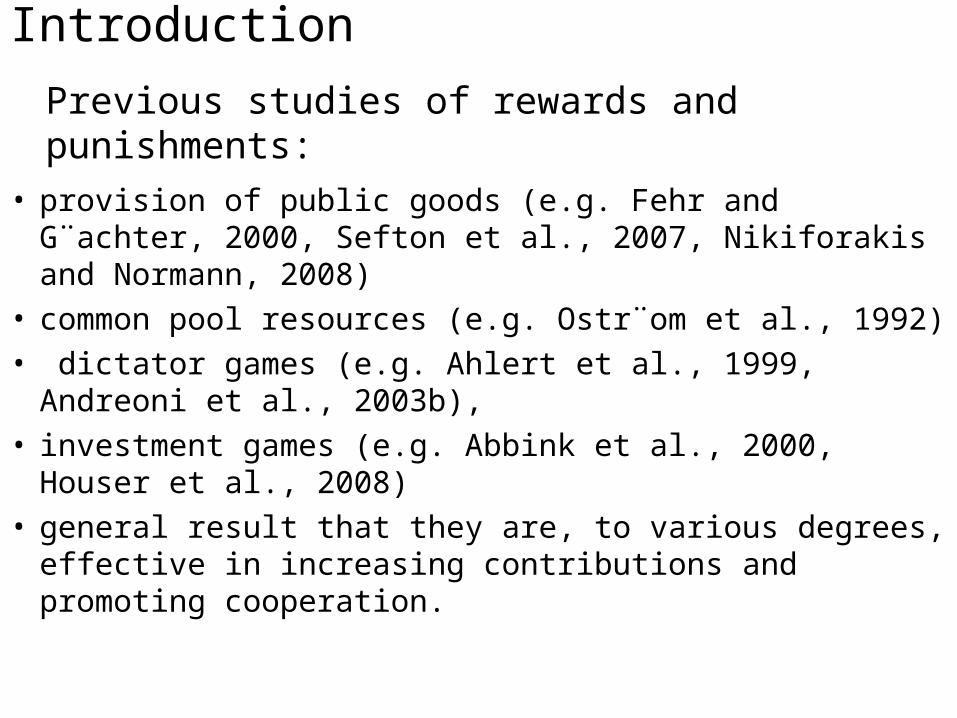
Previous studies of rewards and punishments:
• provision of public goods (e.g. Fehr and G¨achter, 2000, Sefton et al., 2007, Nikiforakis and Normann, 2008)
• common pool resources (e.g. Ostr¨om et al., 1992)• dictator games (e.g. Ahlert et al., 1999, Andreoni et al.,
2003b), • investment games (e.g. Abbink et al., 2000, Houser et al.,
2008)• general result that they are, to various degrees, effective in
increasing contributions and promoting cooperation.
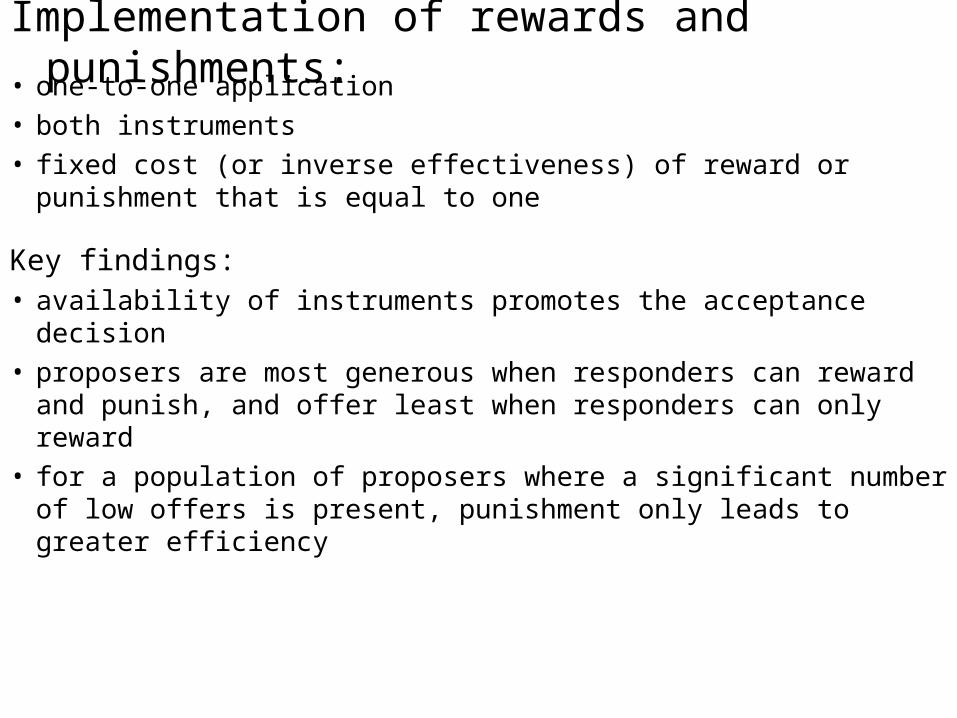
Implementation of rewards and punishments:• one-to-one application• both instruments• fixed cost (or inverse effectiveness) of reward or punishment that
is equal to one
Key findings:• availability of instruments promotes the acceptance decision• proposers are most generous when responders can reward and
punish, and offer least when responders can only reward• for a population of proposers where a significant number of low
offers is present, punishment only leads to greater efficiency
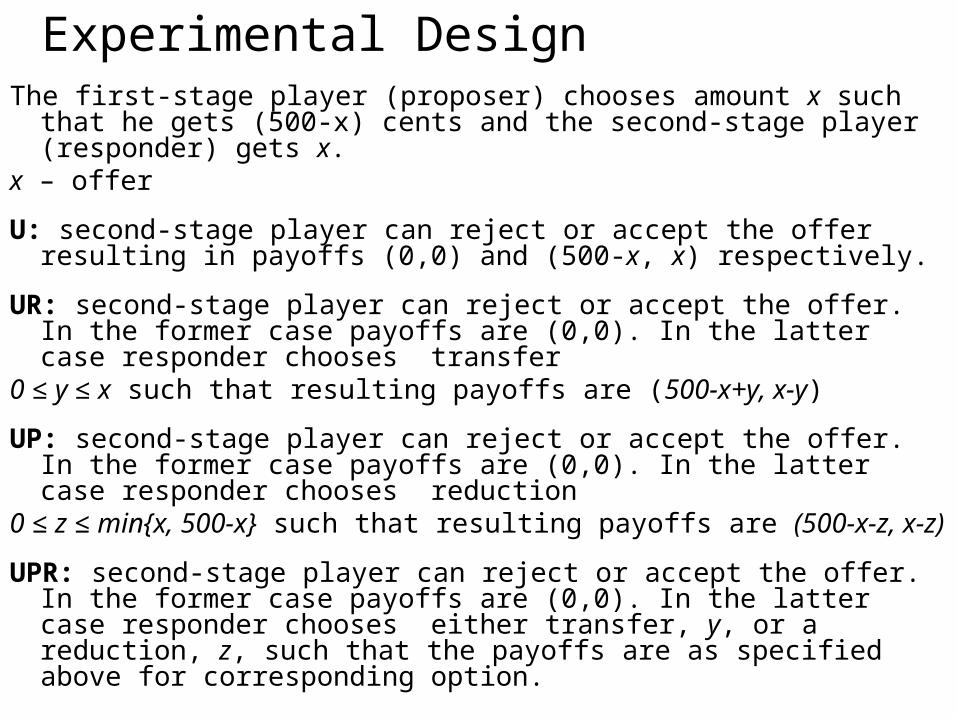
Experimental DesignThe first-stage player (proposer) chooses amount x such that he gets
(500-x) cents and the second-stage player (responder) gets x. x – offer
U: second-stage player can reject or accept the offer resulting in payoffs (0,0) and (500-x, x) respectively.
UR: second-stage player can reject or accept the offer. In the former case payoffs are (0,0). In the latter case responder chooses transfer
0 ≤ y ≤ x such that resulting payoffs are (500-x+y, x-y)
UP: second-stage player can reject or accept the offer. In the former case payoffs are (0,0). In the latter case responder chooses reduction
0 ≤ z ≤ min{x, 500-x} such that resulting payoffs are (500-x-z, x-z)
UPR: second-stage player can reject or accept the offer. In the former case payoffs are (0,0). In the latter case responder chooses either transfer, y, or a reduction, z, such that the payoffs are as specified above for corresponding option.
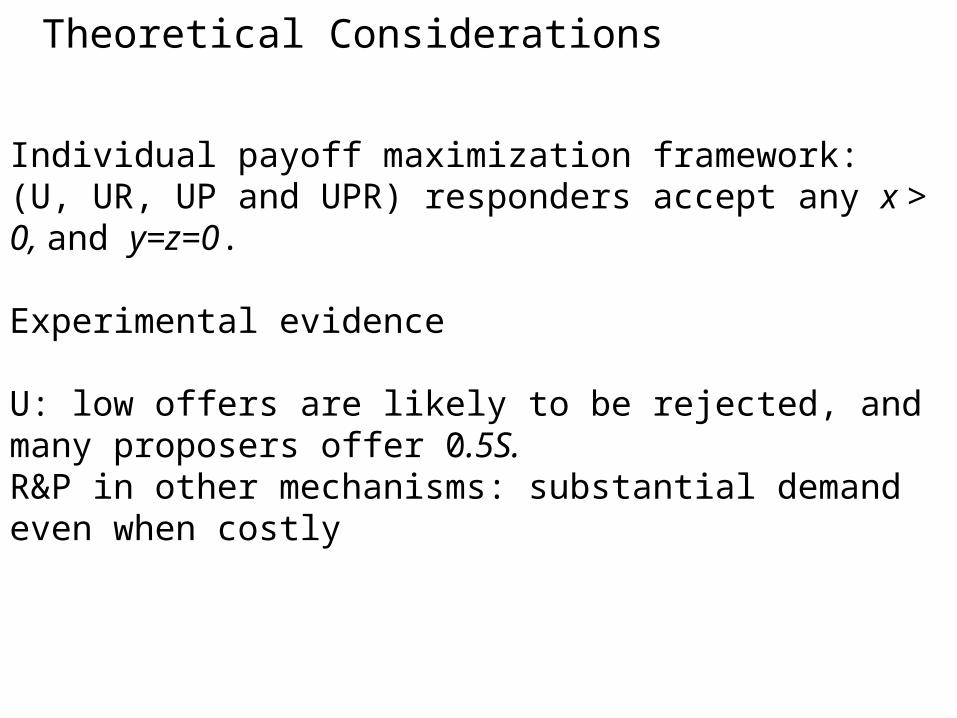
Theoretical Considerations
Individual payoff maximization framework: (U, UR, UP and UPR) responders accept any x > 0, and y=z=0.
Experimental evidence
U: low offers are likely to be rejected, and many proposers offer 0.5S.R&P in other mechanisms: substantial demand even when costly
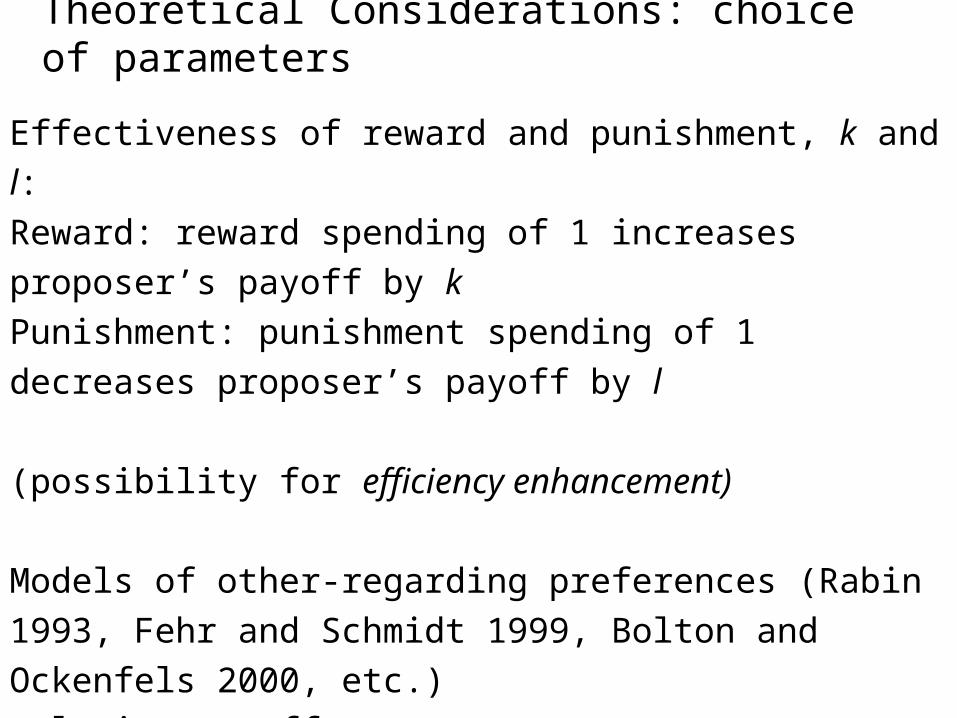
Theoretical Considerations: choice of parameters
Effectiveness of reward and punishment, k and l:
Reward: reward spending of 1 increases proposer’s payoff by k
Punishment: punishment spending of 1 decreases proposer’s payoff
by l
(possibility for efficiency enhancement)
Models of other-regarding preferences (Rabin 1993, Fehr and
Schmidt 1999, Bolton and Ockenfels 2000, etc.)
relative payoffs
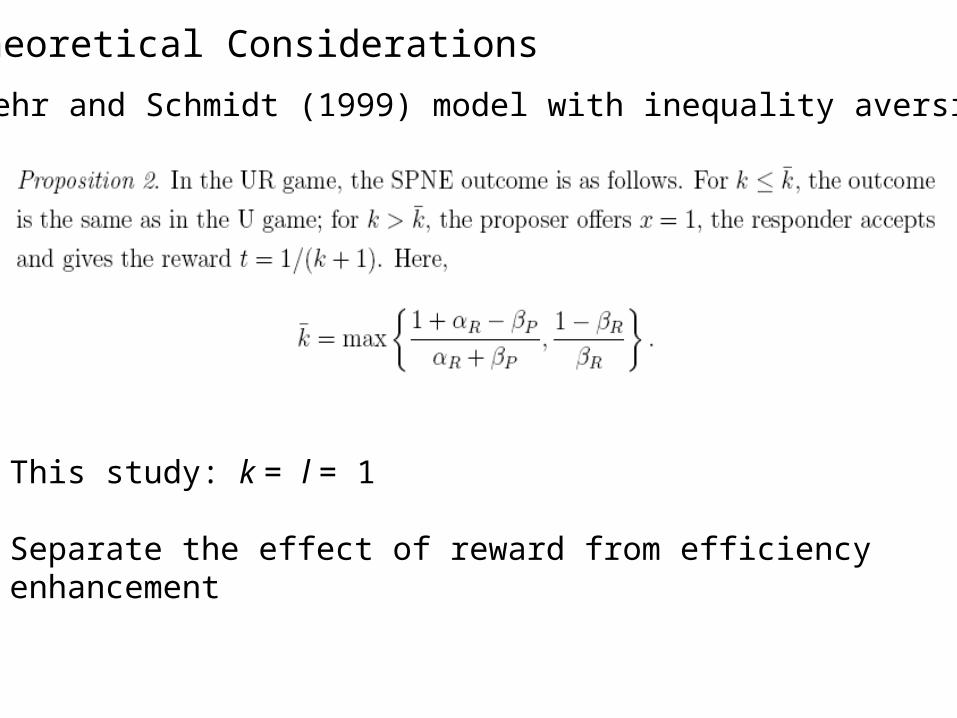
Using Fehr and Schmidt (1999) model with inequality aversion:
This study: k = l = 1
Separate the effect of reward from efficiency enhancement
Theoretical Considerations
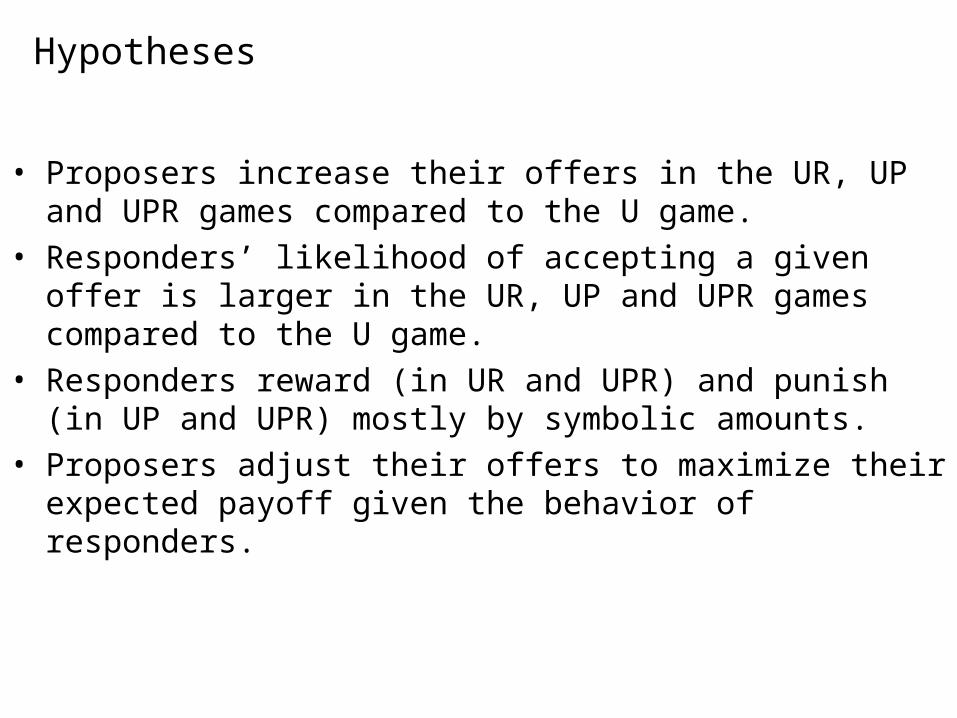
Hypotheses
• Proposers increase their offers in the UR, UP and UPR games compared to the U game.
• Responders’ likelihood of accepting a given offer is larger in the UR, UP and UPR games compared to the U game.
• Responders reward (in UR and UPR) and punish (in UP and UPR) mostly by symbolic amounts.
• Proposers adjust their offers to maximize their expected payoff given the behavior of responders.
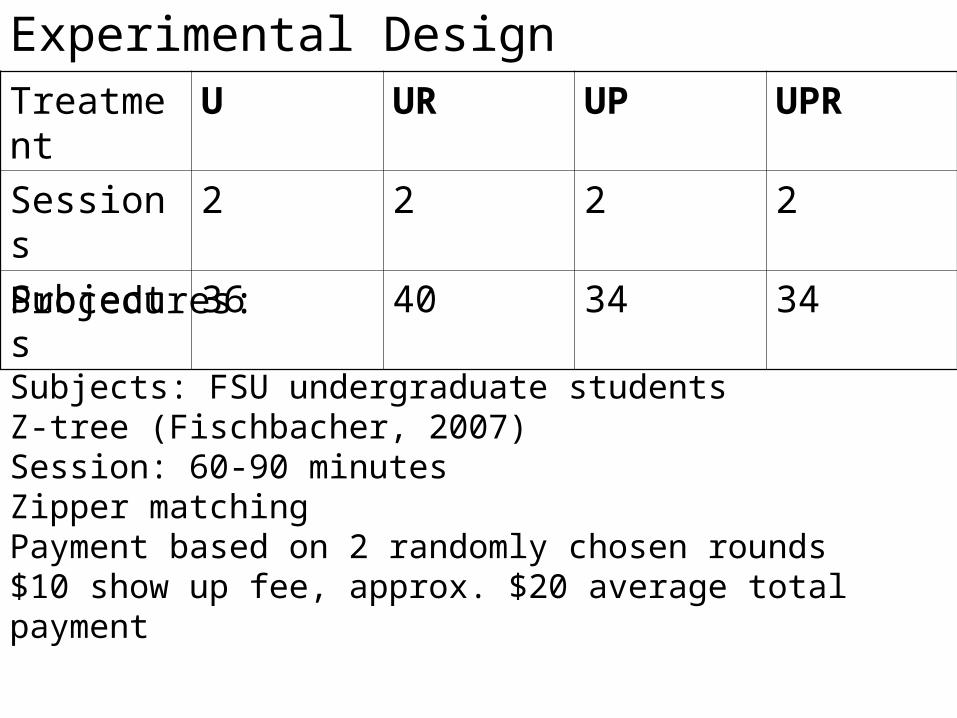
Experimental DesignTreatment U UR UP UPR
Sessions 2 2 2 2
Subjects 36 40 34 34
Procedures:
Subjects: FSU undergraduate studentsZ-tree (Fischbacher, 2007)Session: 60-90 minutesZipper matchingPayment based on 2 randomly chosen rounds$10 show up fee, approx. $20 average total payment
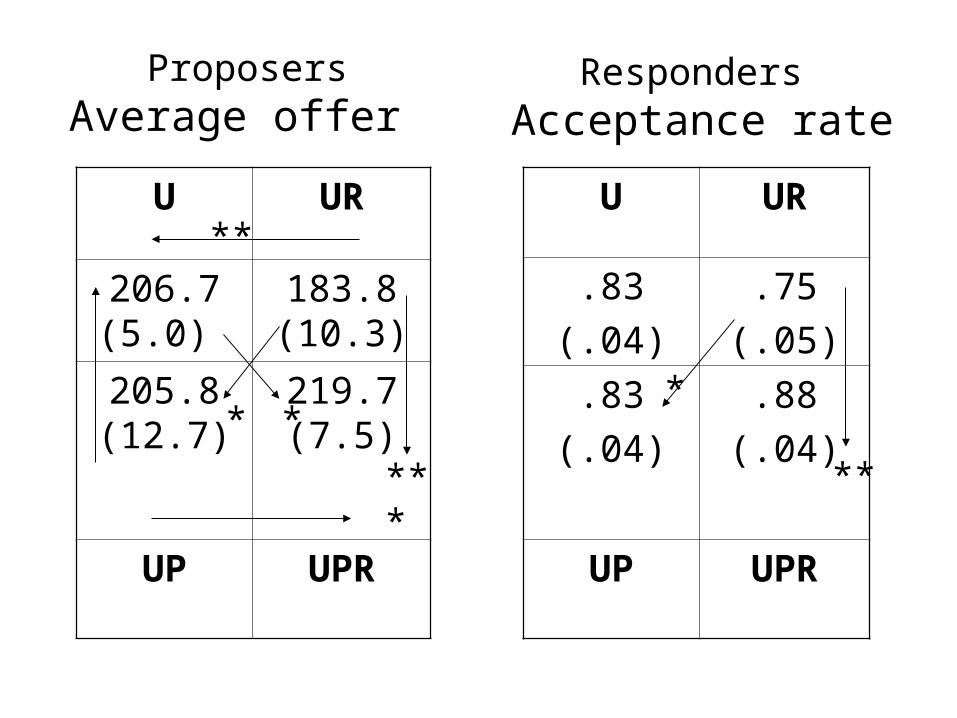
ProposersAverage offer
U UR
206.7 (5.0)
183.8 (10.3)
205.8 (12.7)
219.7 (7.5)
UP UPR
U UR
.83
(.04)
.75
(.05)
.83
(.04)
.88
(.04)
UP UPR
Responders Acceptance rate
**
***
**
*
**
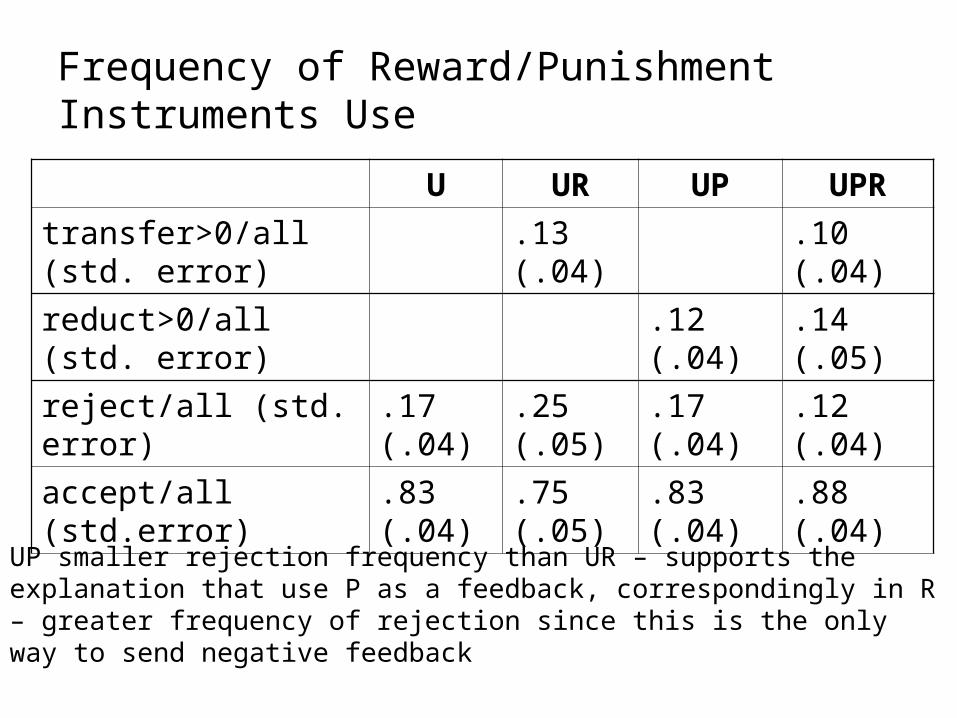
Frequency of Reward/Punishment Instruments Use
U UR UP UPR
transfer>0/all (std. error) .13 (.04) .10 (.04)
reduct>0/all (std. error) .12 (.04) .14 (.05)
reject/all (std. error) .17 (.04) .25 (.05) .17 (.04) .12 (.04)
accept/all (std.error) .83 (.04) .75 (.05) .83 (.04) .88 (.04)
UP smaller rejection frequency than UR – supports the explanation that use P as a feedback, correspondingly in R – greater frequency of rejection since this is the only way to send negative feedback
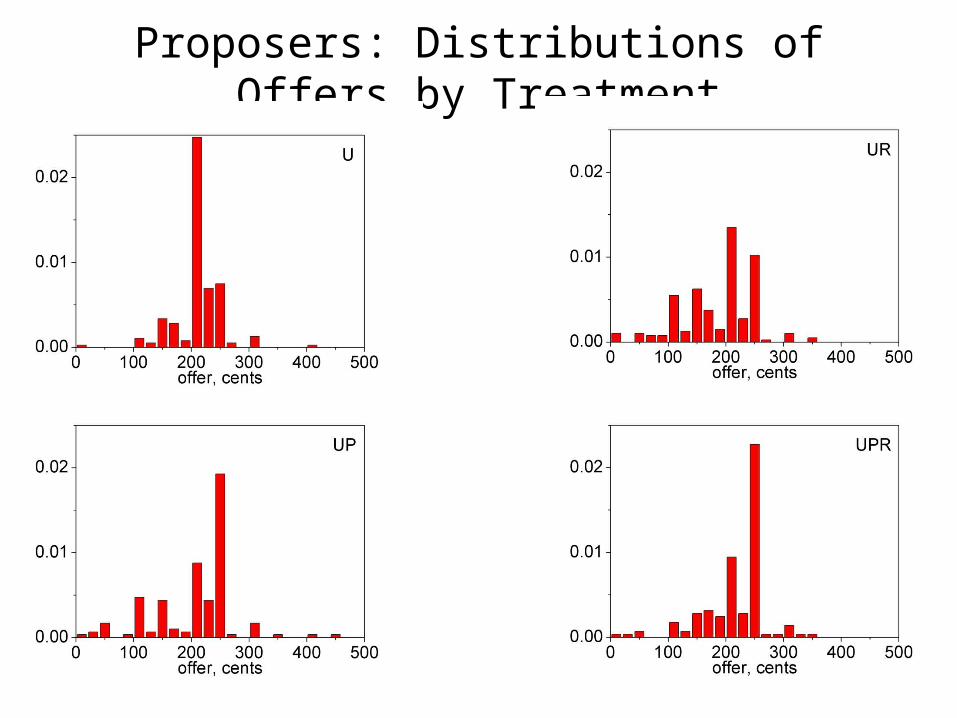
Proposers: Distributions of Offers by Treatment
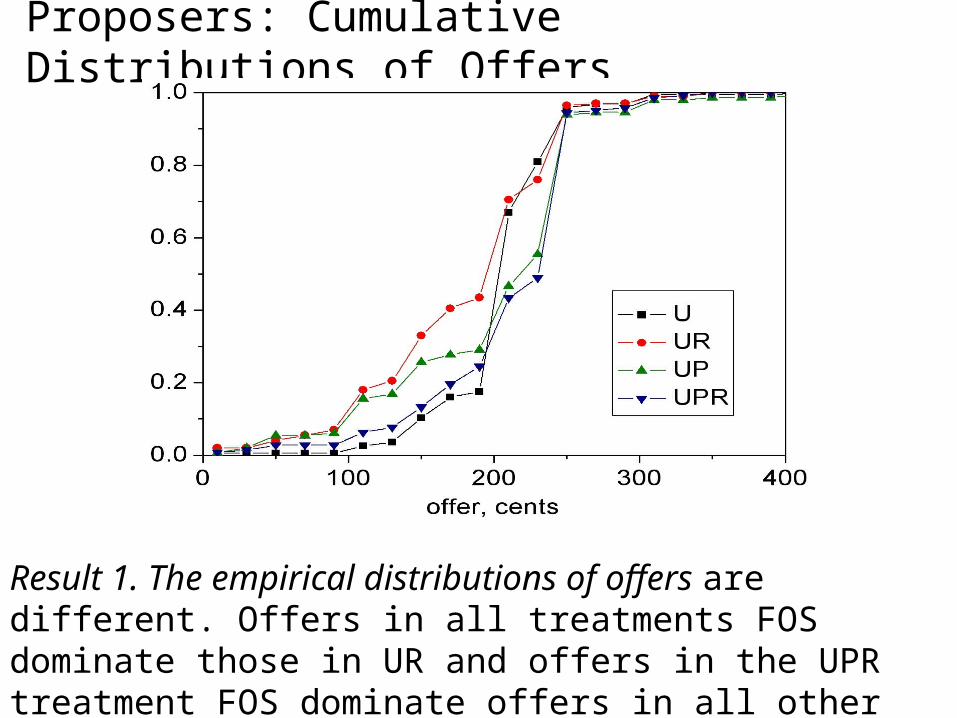
Proposers: Cumulative Distributions of Offers
Result 1. The empirical distributions of offers are different. Offers in all treatments FOS dominate those in UR and offers in the UPR treatment FOS dominate offers in all other treatments.
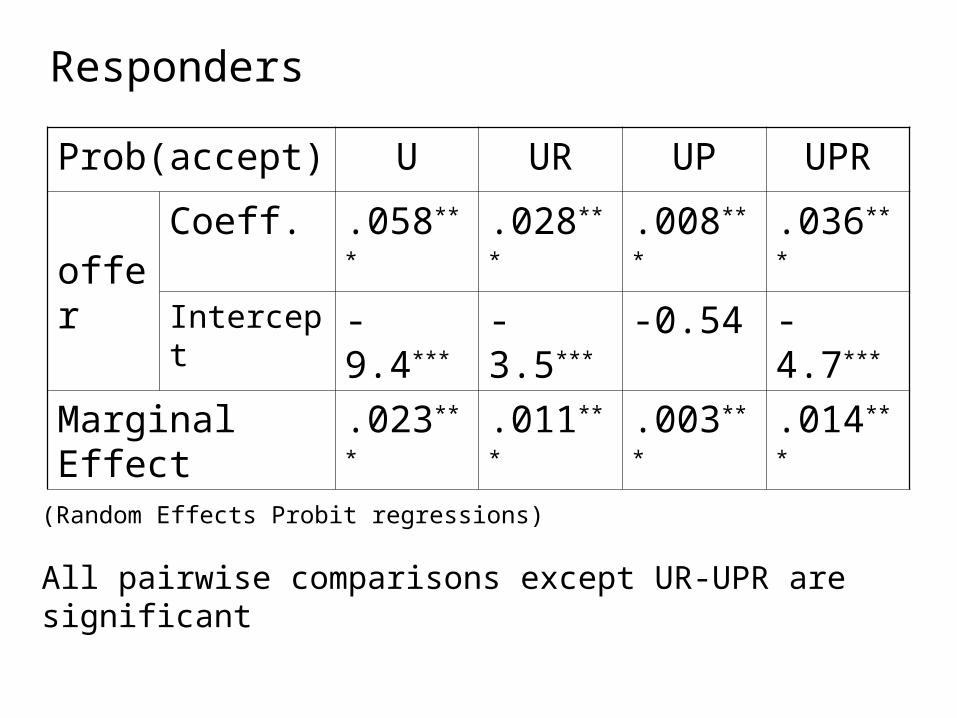
Responders
(Random Effects Probit regressions)
All pairwise comparisons except UR-UPR are significant
Prob(accept) U UR UP UPR
offerCoeff. .058*** .028*** .008*** .036***
Intercept -9.4*** -3.5*** -0.54 -4.7***
Marginal Effect .023*** .011*** .003*** .014***
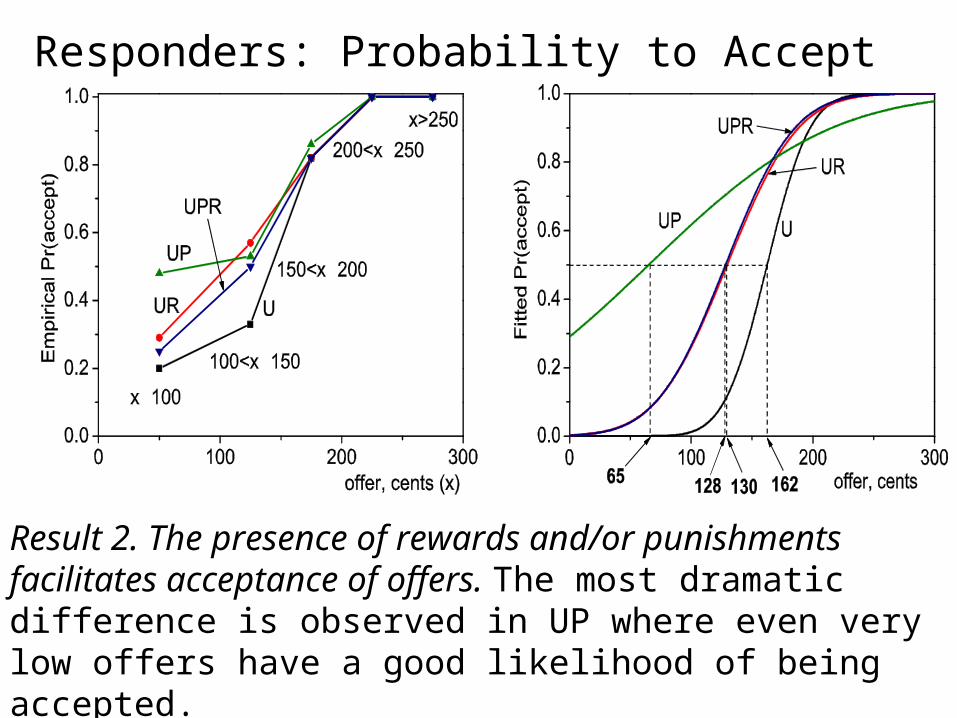
Responders: Probability to Accept
Result 2. The presence of rewards and/or punishments facilitates acceptance of offers. The most dramatic difference is observed in UP where even very low offers have a good likelihood of being accepted.
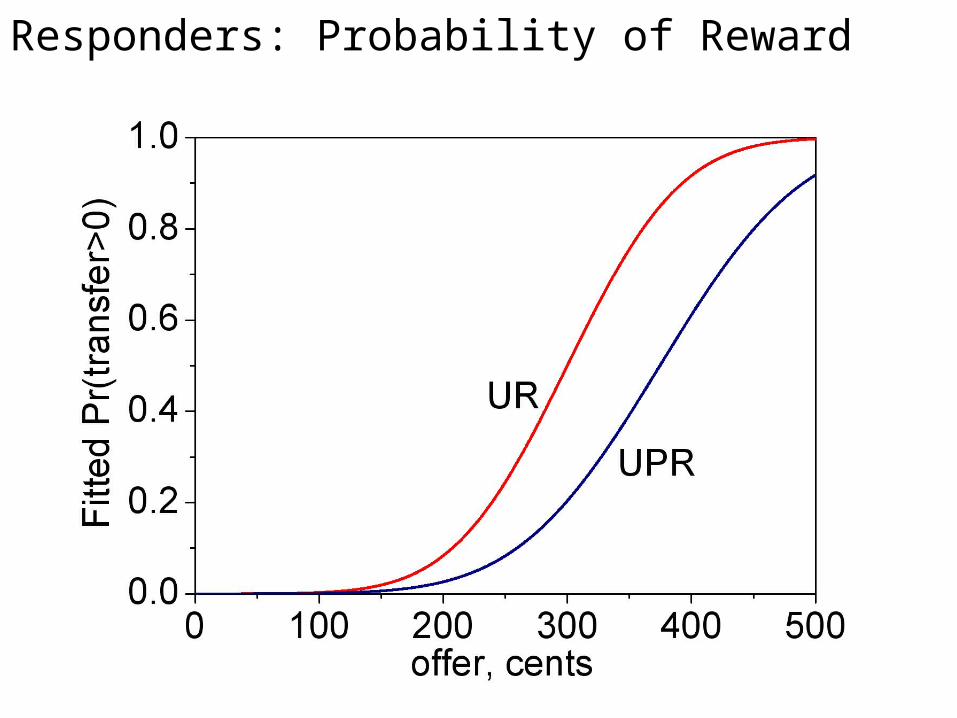
Responders: Probability of Reward
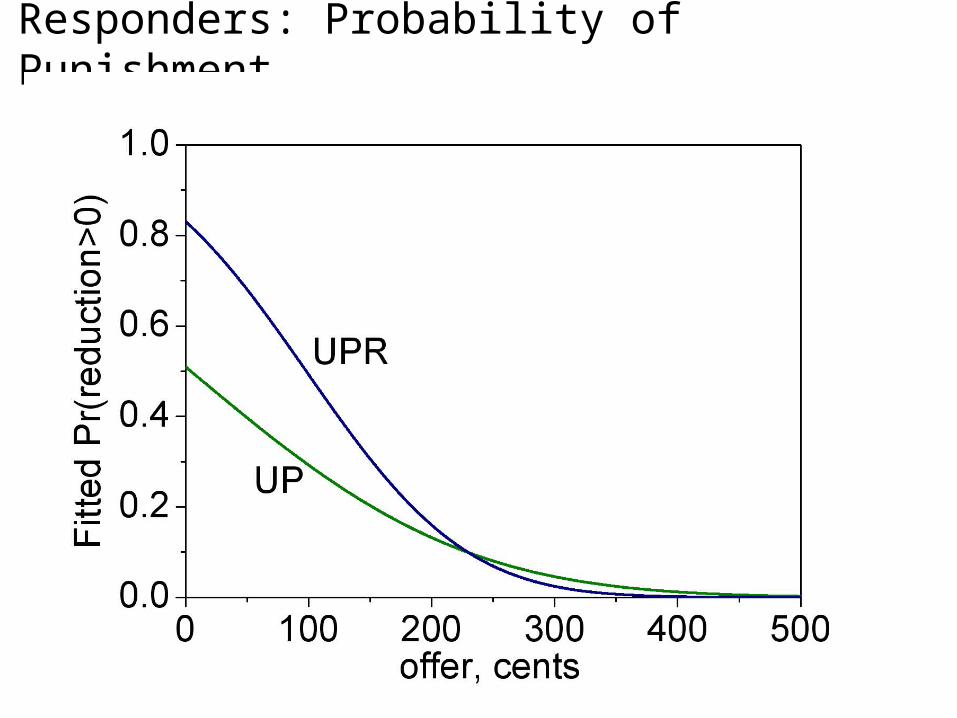
Responders: Probability of Punishment
Responders: Reward and Punishment
Result 3. The probability of using rewards and punishments depends asymmetrically on the presence of the other instrument. Rewards are less likely in the presence of punishment than without it, but punishments are more likely in the presence of reward than without it.
Result 4. (i) Rewards are statistically significant and larger in magnitude in the presence of punishment than without it. (ii) Punishments are statistically significant in the presence of reward but are essentially zero without reward, indicating they are used as feedback.
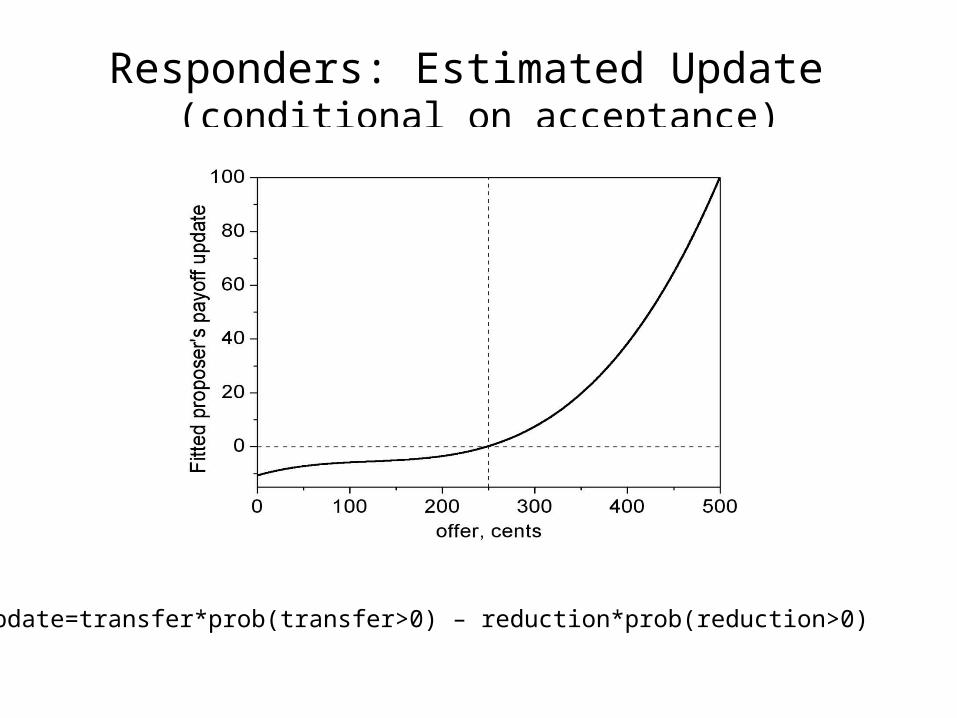
Responders: Estimated Update (conditional on acceptance)
Update=transfer*prob(transfer>0) – reduction*prob(reduction>0)
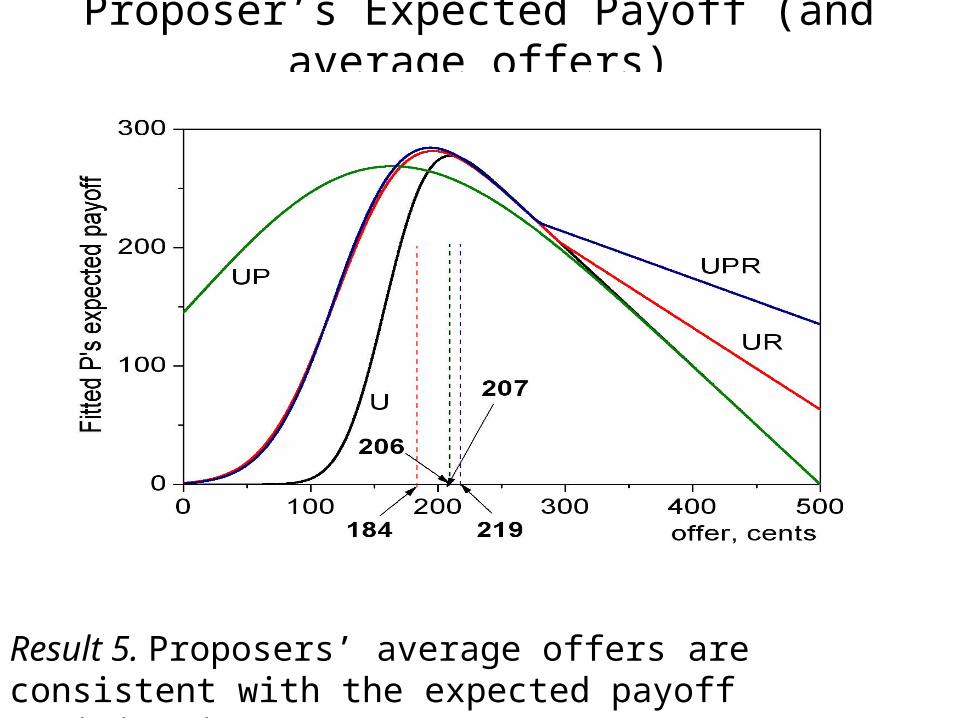
Proposer’s Expected Payoff (and average offers)
Result 5. Proposers’ average offers are consistent with the expected payoff maximization
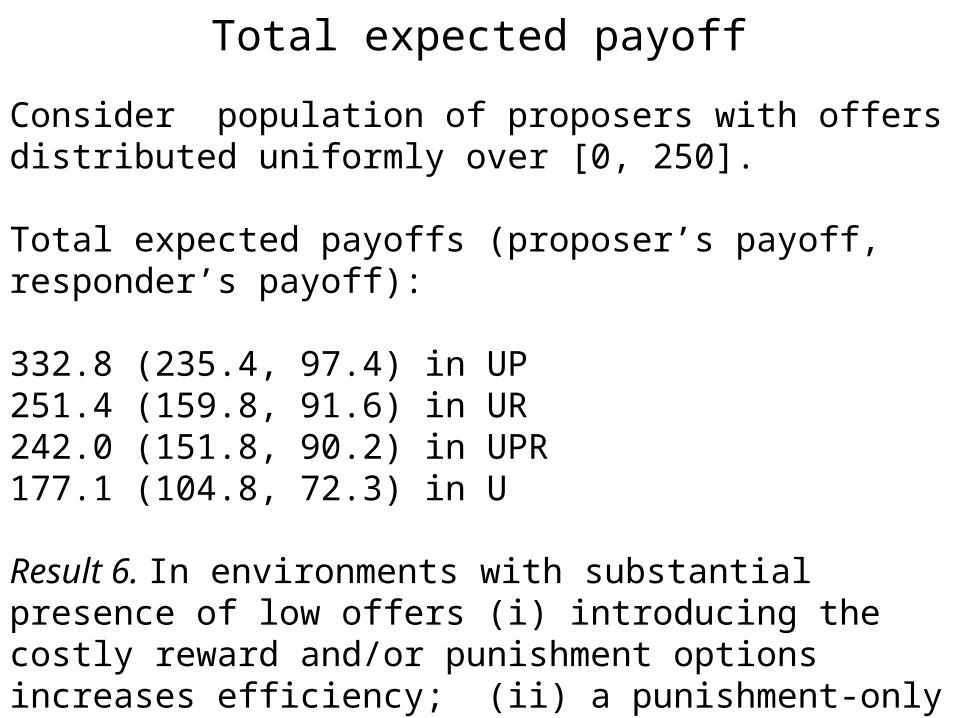
Total expected payoff
Consider population of proposers with offers distributed uniformly over [0, 250].
Total expected payoffs (proposer’s payoff, responder’s payoff):
332.8 (235.4, 97.4) in UP251.4 (159.8, 91.6) in UR242.0 (151.8, 90.2) in UPR177.1 (104.8, 72.3) in U Result 6. In environments with substantial presence of low offers (i) introducing the costly reward and/or punishment options increases efficiency; (ii) a punishment-only scheme leads to the largest gain in efficiency.
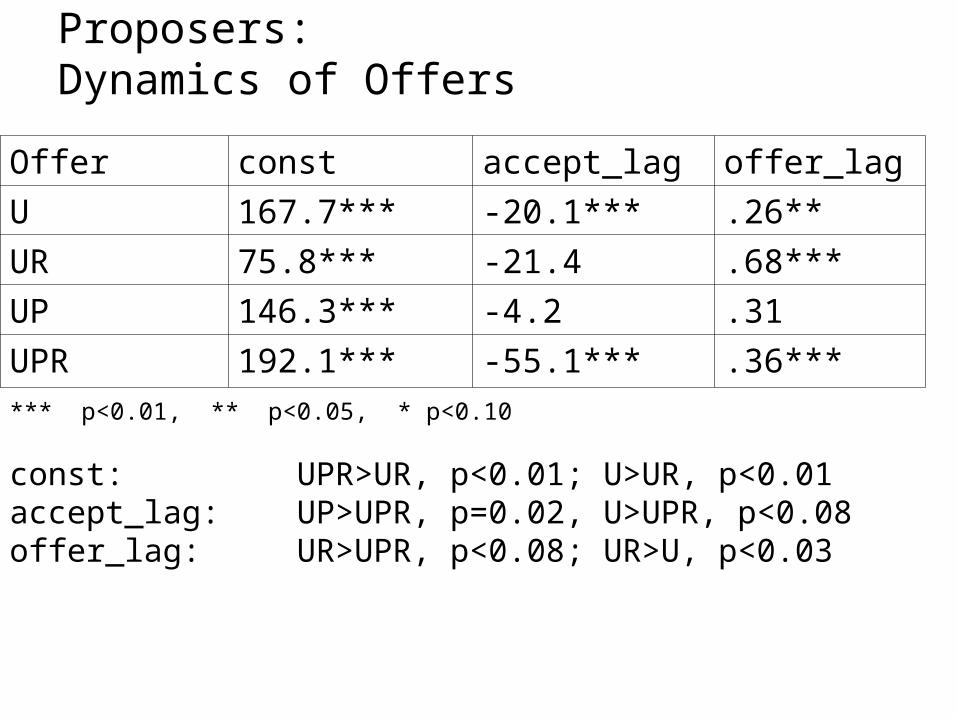
Proposers: Dynamics of Offers
Offer const accept_lag offer_lag
U 167.7*** -20.1*** .26**
UR 75.8*** -21.4 .68***
UP 146.3*** -4.2 .31
UPR 192.1*** -55.1*** .36***
*** p<0.01, ** p<0.05, * p<0.10
const: UPR>UR, p<0.01; U>UR, p<0.01accept_lag: UP>UPR, p=0.02, U>UPR, p<0.08offer_lag: UR>UPR, p<0.08; UR>U, p<0.03
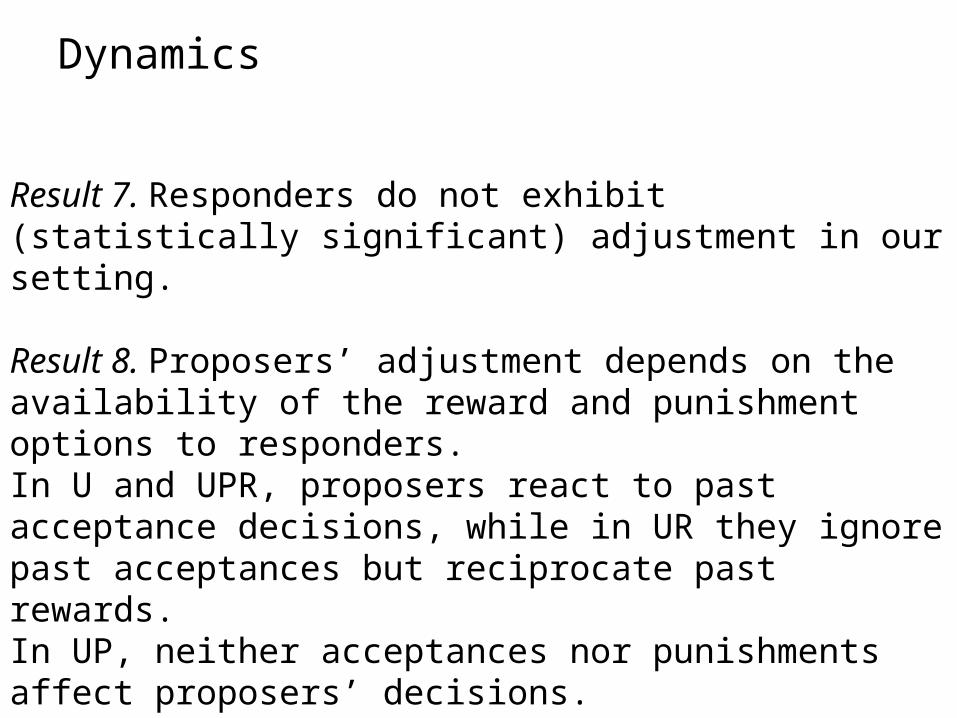
Dynamics
Result 7. Responders do not exhibit (statistically significant) adjustment in our setting.
Result 8. Proposers’ adjustment depends on the availability of the reward and punishment options to responders. In U and UPR, proposers react to past acceptance decisions, while in UR they ignore past acceptances but reciprocate past rewards. In UP, neither acceptances nor punishments affect proposers’ decisions.
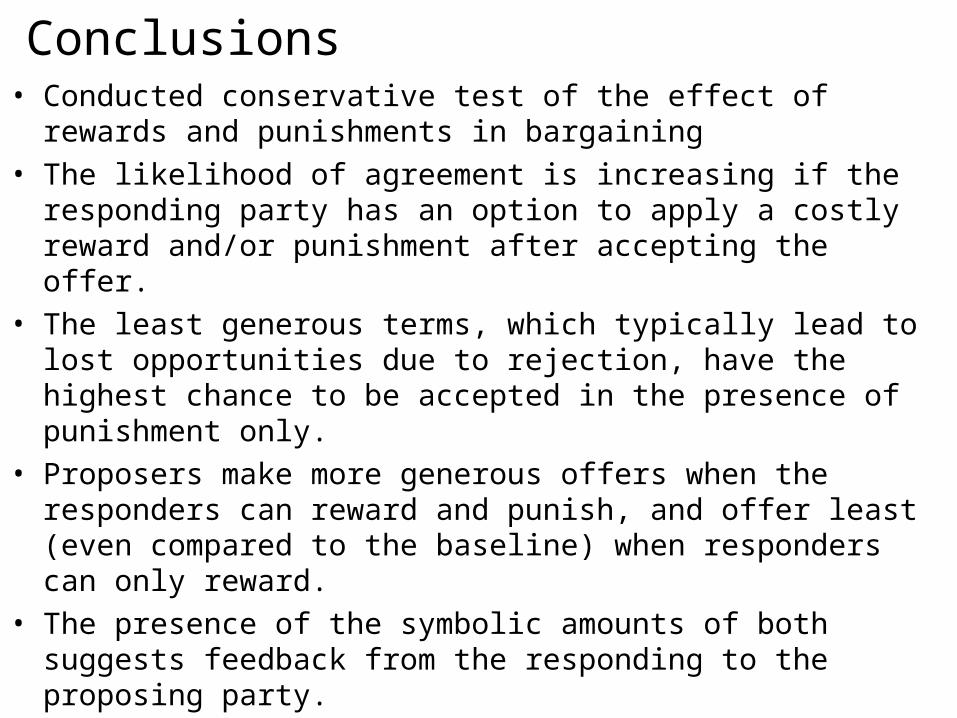
Conclusions• Conducted conservative test of the effect of rewards and punishments
in bargaining
• The likelihood of agreement is increasing if the responding party has an option to apply a costly reward and/or punishment after accepting the offer.
• The least generous terms, which typically lead to lost opportunities due to rejection, have the highest chance to be accepted in the presence of punishment only.
• Proposers make more generous offers when the responders can reward and punish, and offer least (even compared to the baseline) when responders can only reward.
• The presence of the symbolic amounts of both suggests feedback from the responding to the proposing party.
Conclusions
• Did not observe adjustment in responders’ behavior.
• Proposers adjust behavior in U, UR and UPR. based on acceptance (decrease) in U, UPR and reward (increase) in UR
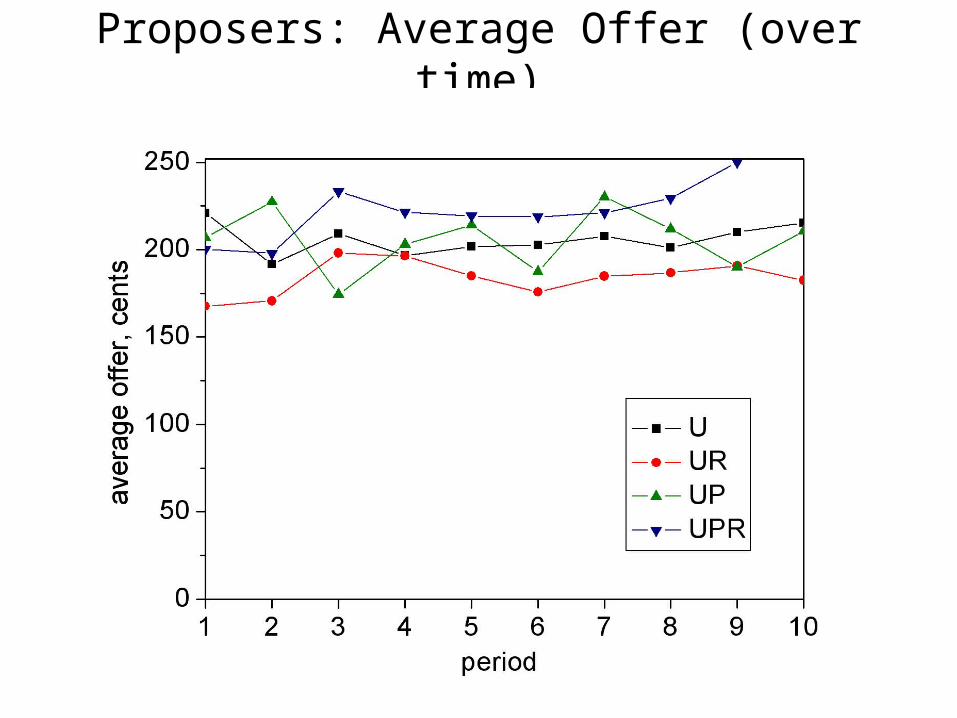
Proposers: Average Offer (over time)
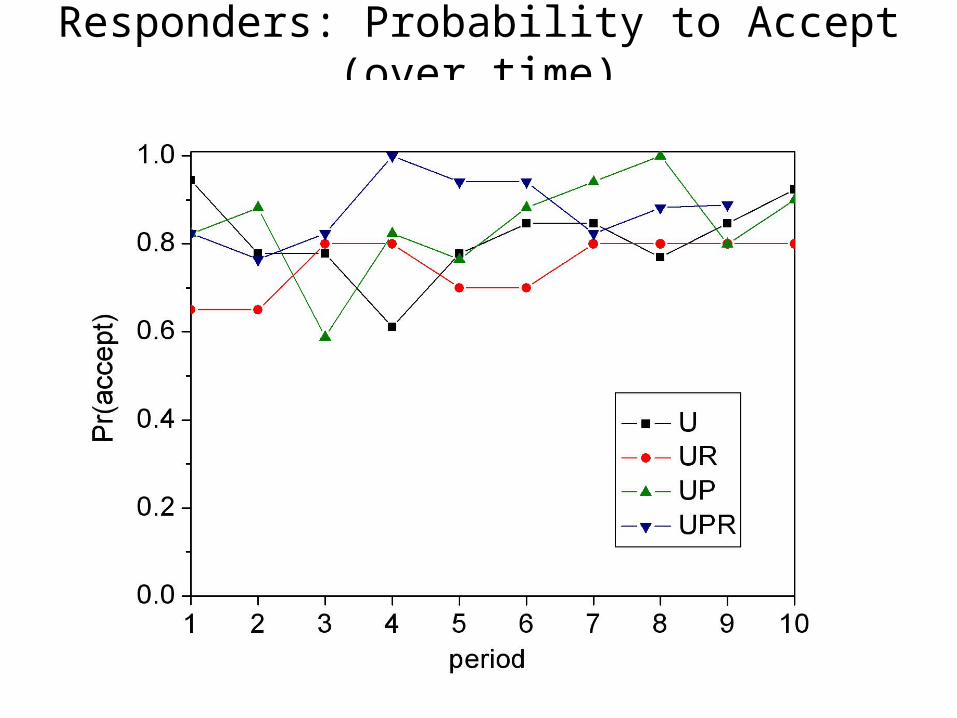
Responders: Probability to Accept (over time)
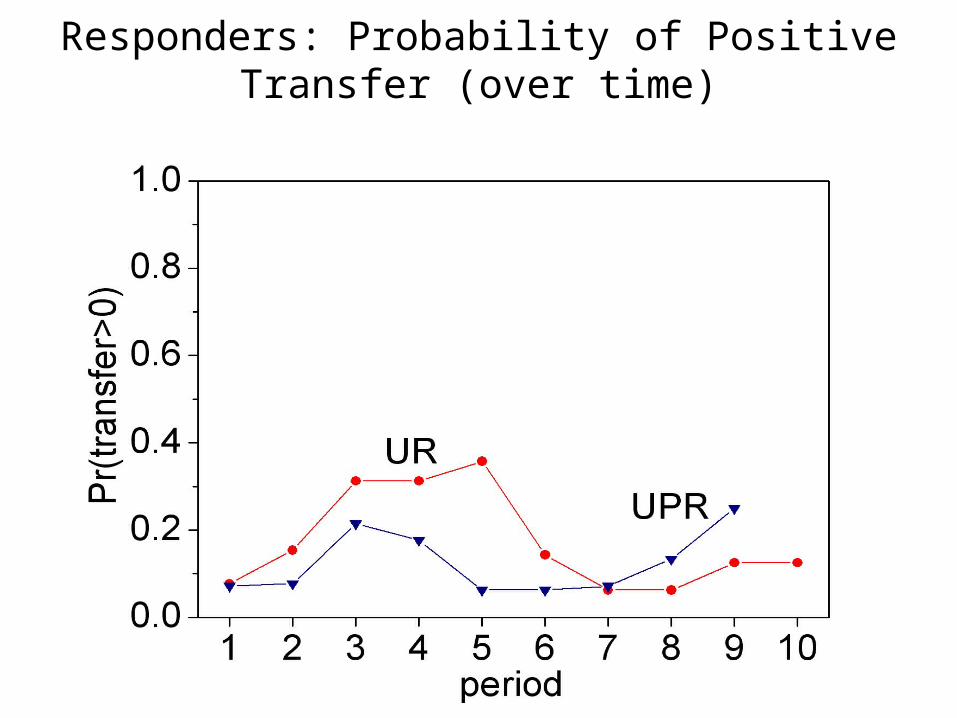
Responders: Probability of Positive Transfer (over time)
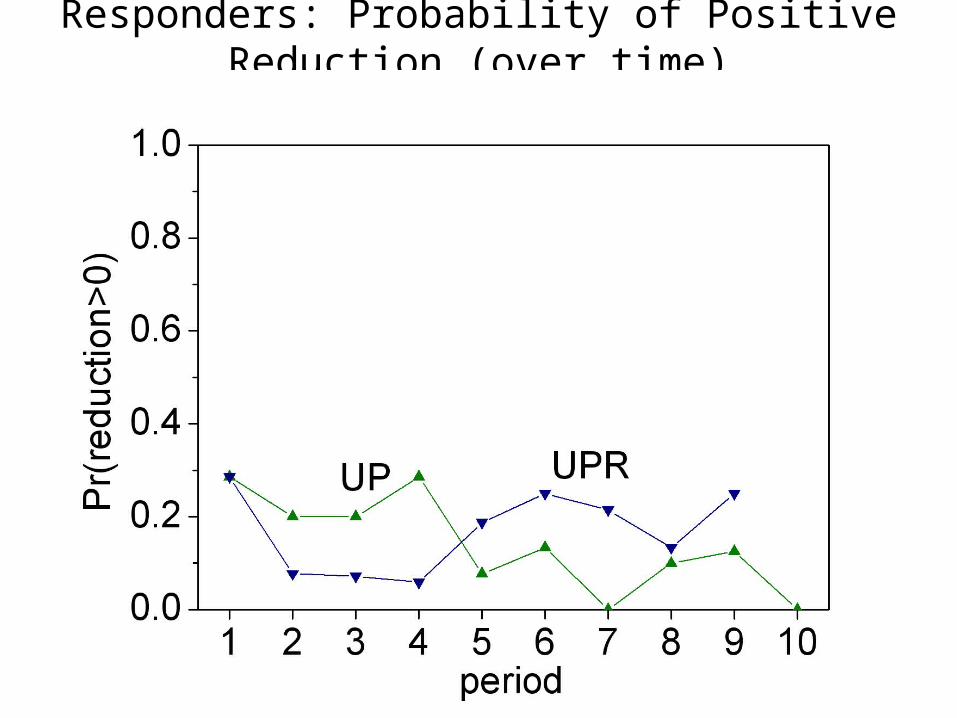
Responders: Probability of Positive Reduction (over time)
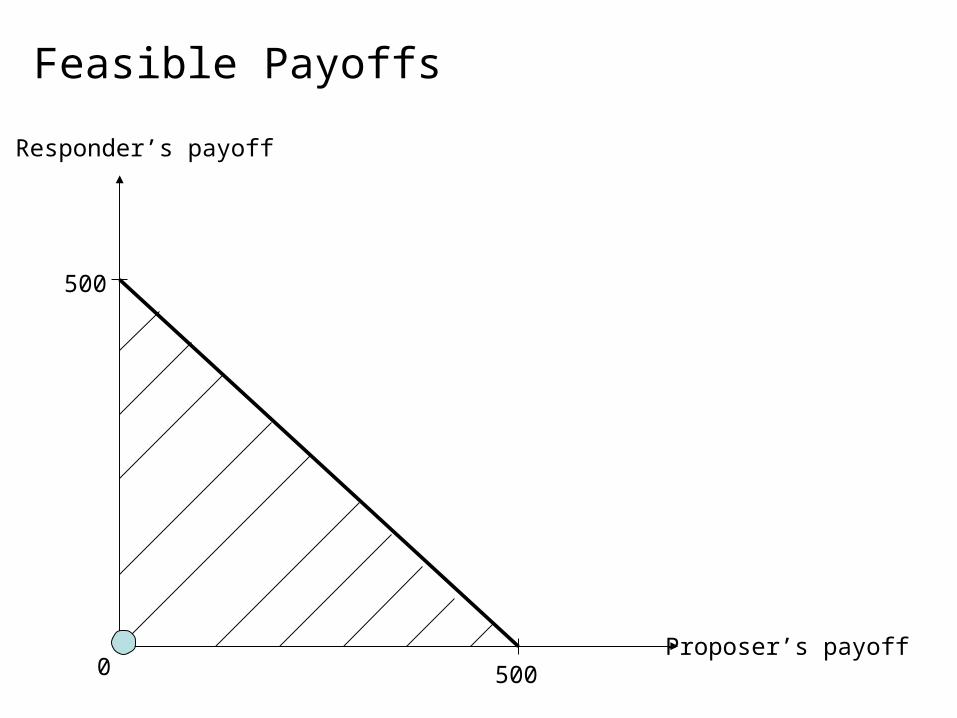
Feasible Payoffs
Responder’s payoff
Proposer’s payoff
500
5000