Embed Size (px)
Citation preview
RGICS
RAJIV GANDHI INSTITUTE FOR CONTEMPORARY STUDIES
JAWAHAR BHAWAN, DR. RAJENDRA PRASAD ROAD, NEW DELHI-110001
RGICS BRIEF (January 09, 2018)
Crime against Women: Beyond Numbers
Jeet Singh
RGICS Brief
Crime against Women: Beyond Numbers
2
Part-I
Background
1.1 Introduction:
The Union Home Minister Mr. Rajnath Singh released the crime data compiled by the National Crime Record
Bureau (NCRB) for the year 2016 on 30th
November 2017. The release of the data received a lot of media
attention focusing on increase in incidents of crime, especially on the increasing crimes against women. In their
haste to make headlines, the media declared certain states or cities most insecure or secure for women, based
on reporting of the crime. For example, Delhi and Uttar Pradesh have been declared as most insecure for
women as Delhi has reported highest rate of crime against women and Uttar Pradesh shares highest number of
criminal incidents. Uttar Pradesh has always been on top of the list as it records nearly 14% of total crime
against women. However, the rate of reported crime against women in the state is very low. In 2016, it has
reported 47 cases per one lakh female population which is far less than crime rate of states like Delhi, Assam,
Odisha and Telangana. Yes, there has been steady growth in reporting of crime in almost all states. In some
states, the growth of reporting of crime has substantially increased in the last ten years, while in other states the
growth of reporting is marginal. Due to various reasons, a large number of incidents of crime remain un-
reported in India. The NCRB report on crime is a mere compilation of incidents reported by Central and State
level law enforcement agencies. Therefore, it is very clear that the NCRB data reveals increase or decrease in
reporting of crime. It does not claim increase or decrease in actual incidents of crime. Therefore, tagging any
city or state as most secure or insecure place based on NCRB data does not have any basis.
The issue of women security is not just a law and order issue, it goes much beyond and finds its roots in social
and cultural practices and norms. More than half of crime against women occurs within family, where family
member themselves criminally abuse and assault women. For example, cases pertaining to Dowry Death, and
Dowry and Cruelty by Husband or his Relative together represented 45.3% of total crimes against women from
2007 to 2016. If we also track down offenders of remaining offences against women, then the numbers will be
higher. Therefore, both the nature of crime and reporting of crime are very complex. While the NCRB report on
crime is valuable documentation, we need to work a lot on these numbers to understand crime and nature of
crime. This paper is an attempt to highlight some of the complexities that must be understood while analysing
crime against women.
RGICS Brief
Crime against Women: Beyond Numbers
3
1.2 Is Crime against Women on the rise?
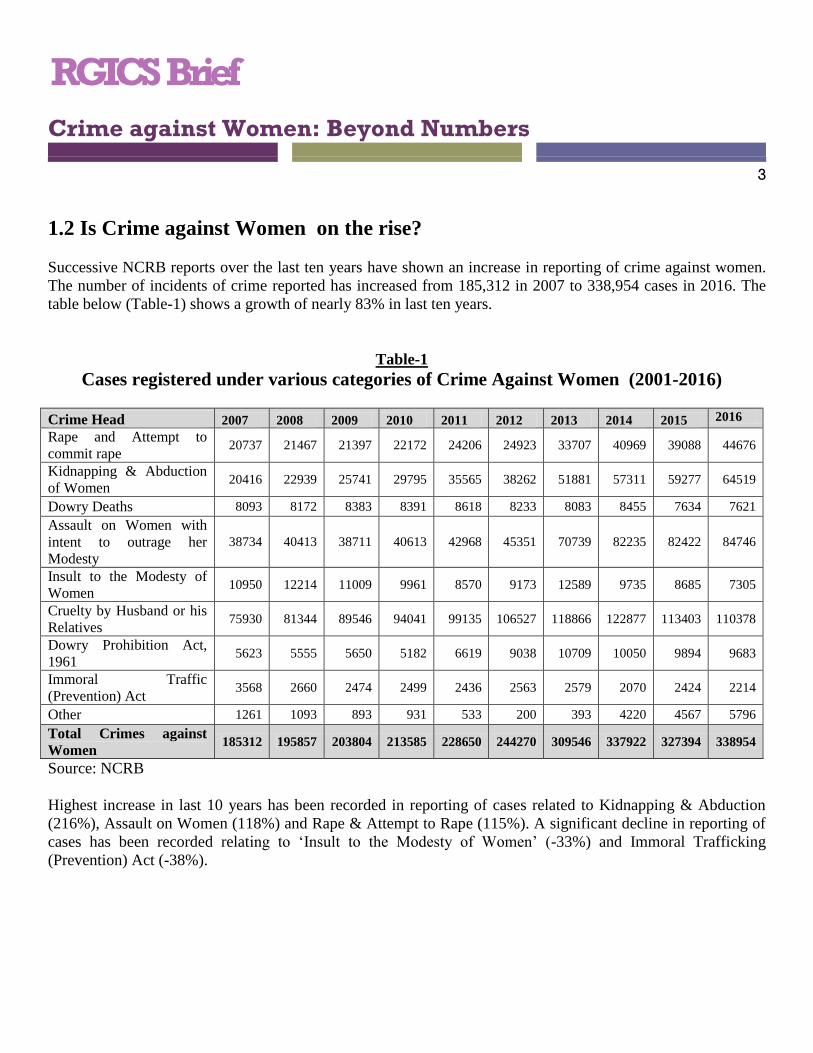
Successive NCRB reports over the last ten years have shown an increase in reporting of crime against women.
The number of incidents of crime reported has increased from 185,312 in 2007 to 338,954 cases in 2016. The
table below (Table-1) shows a growth of nearly 83% in last ten years.
Table-1
Cases registered under various categories of Crime Against Women (2001-2016)
Crime Head 2007 2008 2009 2010 2011 2012 2013 2014 2015 2016
Rape and Attempt to
commit rape 20737 21467 21397 22172 24206 24923 33707 40969 39088 44676
Kidnapping & Abduction
of Women 20416 22939 25741 29795 35565 38262 51881 57311 59277 64519
Dowry Deaths 8093 8172 8383 8391 8618 8233 8083 8455 7634 7621
Assault on Women with
intent to outrage her
Modesty
38734 40413 38711 40613 42968 45351 70739 82235 82422 84746
Insult to the Modesty of
Women 10950 12214 11009 9961 8570 9173 12589 9735 8685 7305
Cruelty by Husband or his
Relatives 75930 81344 89546 94041 99135 106527 118866 122877 113403 110378
Dowry Prohibition Act,
1961 5623 5555 5650 5182 6619 9038 10709 10050 9894 9683
Immoral Traffic
(Prevention) Act 3568 2660 2474 2499 2436 2563 2579 2070 2424 2214
Other 1261 1093 893 931 533 200 393 4220 4567 5796
Total Crimes against
Women 185312 195857 203804 213585 228650 244270 309546 337922 327394 338954
Source: NCRB
Highest increase in last 10 years has been recorded in reporting of cases related to Kidnapping & Abduction
(216%), Assault on Women (118%) and Rape & Attempt to Rape (115%). A significant decline in reporting of
cases has been recorded relating to „Insult to the Modesty of Women‟ (-33%) and Immoral Trafficking
(Prevention) Act (-38%).
RGICS Brief
Crime against Women: Beyond Numbers
4
Source: NCRB
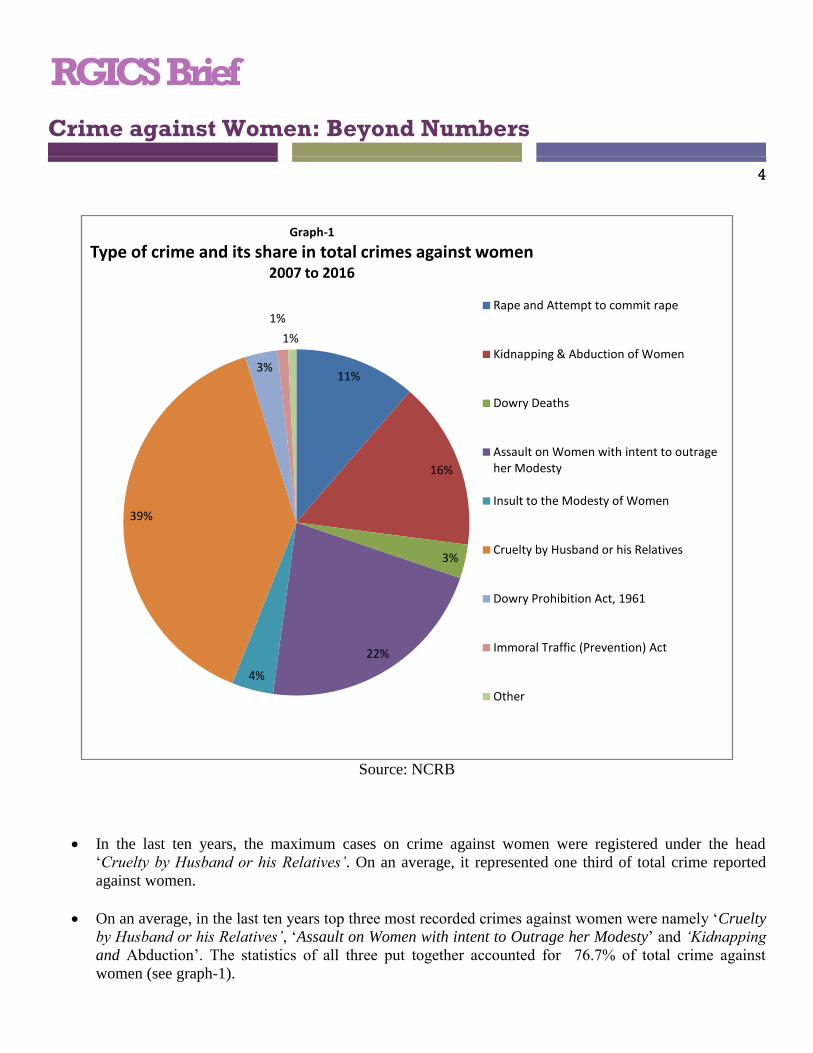
In the last ten years, the maximum cases on crime against women were registered under the head
„Cruelty by Husband or his Relatives’. On an average, it represented one third of total crime reported
against women.
On an average, in the last ten years top three most recorded crimes against women were namely „Cruelty
by Husband or his Relatives’, „Assault on Women with intent to Outrage her Modesty‟ and ‘Kidnapping
and Abduction‟. The statistics of all three put together accounted for 76.7% of total crime against
women (see graph-1).
11%
16%
3%
22%
4%
39%
3%
1%
1%
Graph-1
Type of crime and its share in total crimes against women2007 to 2016
Rape and Attempt to commit rape
Kidnapping & Abduction of Women
Dowry Deaths
Assault on Women with intent to outrage her Modesty
Insult to the Modesty of Women
Cruelty by Husband or his Relatives
Dowry Prohibition Act, 1961
Immoral Traffic (Prevention) Act
Other
RGICS Brief
Crime against Women: Beyond Numbers
5
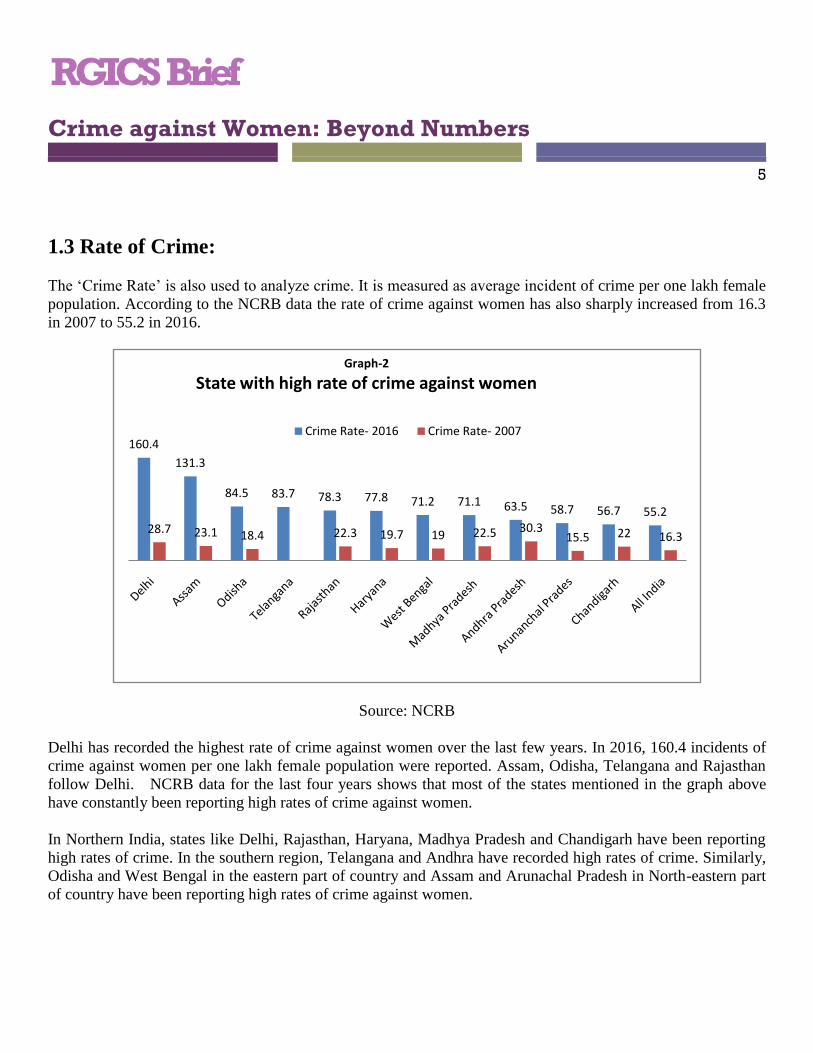
1.3 Rate of Crime:
The „Crime Rate‟ is also used to analyze crime. It is measured as average incident of crime per one lakh female
population. According to the NCRB data the rate of crime against women has also sharply increased from 16.3
in 2007 to 55.2 in 2016.
Source: NCRB
Delhi has recorded the highest rate of crime against women over the last few years. In 2016, 160.4 incidents of
crime against women per one lakh female population were reported. Assam, Odisha, Telangana and Rajasthan
follow Delhi. NCRB data for the last four years shows that most of the states mentioned in the graph above
have constantly been reporting high rates of crime against women.
In Northern India, states like Delhi, Rajasthan, Haryana, Madhya Pradesh and Chandigarh have been reporting
high rates of crime. In the southern region, Telangana and Andhra have recorded high rates of crime. Similarly,
Odisha and West Bengal in the eastern part of country and Assam and Arunachal Pradesh in North-eastern part
of country have been reporting high rates of crime against women.
160.4
131.3
84.5 83.7 78.3 77.8 71.2 71.1 63.5 58.7 56.7 55.2
28.7 23.1 18.4 22.3 19.7 19 22.5 30.315.5 22 16.3
Graph-2
State with high rate of crime against women
Crime Rate- 2016 Crime Rate- 2007
RGICS Brief
Crime against Women: Beyond Numbers
6
Source: NCRB
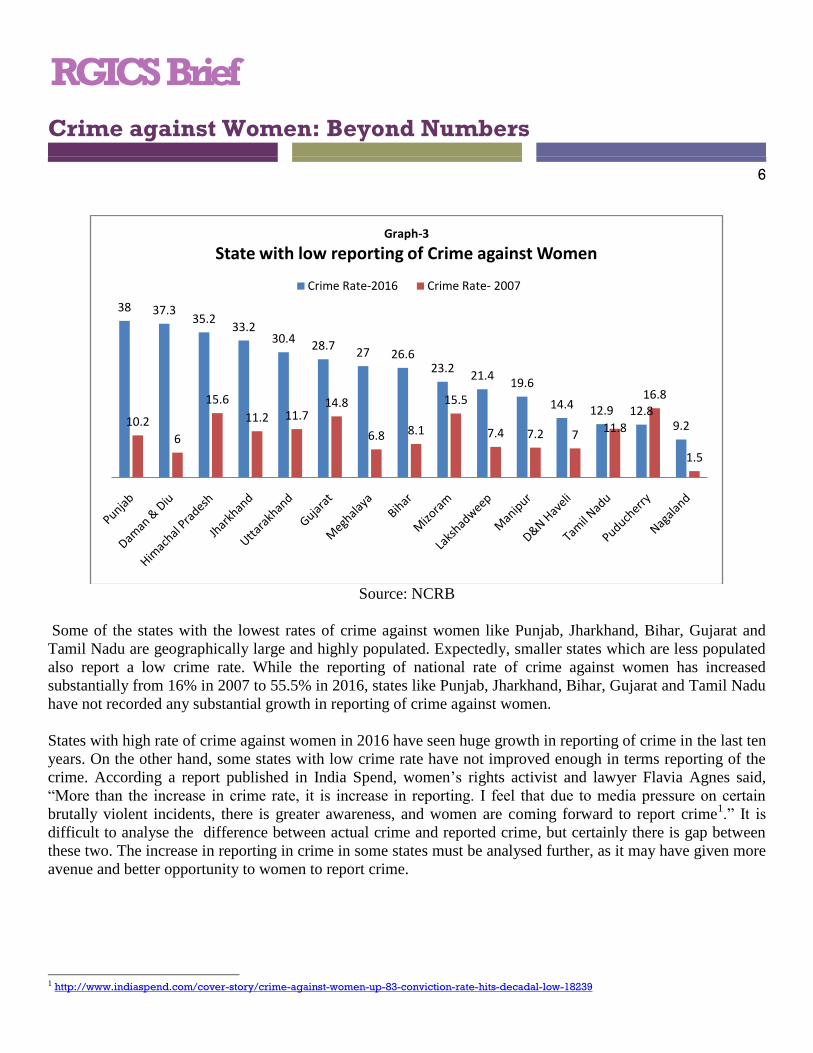
Some of the states with the lowest rates of crime against women like Punjab, Jharkhand, Bihar, Gujarat and
Tamil Nadu are geographically large and highly populated. Expectedly, smaller states which are less populated
also report a low crime rate. While the reporting of national rate of crime against women has increased
substantially from 16% in 2007 to 55.5% in 2016, states like Punjab, Jharkhand, Bihar, Gujarat and Tamil Nadu
have not recorded any substantial growth in reporting of crime against women.
States with high rate of crime against women in 2016 have seen huge growth in reporting of crime in the last ten
years. On the other hand, some states with low crime rate have not improved enough in terms reporting of the
crime. According a report published in India Spend, women‟s rights activist and lawyer Flavia Agnes said,
“More than the increase in crime rate, it is increase in reporting. I feel that due to media pressure on certain
brutally violent incidents, there is greater awareness, and women are coming forward to report crime1.” It is
difficult to analyse the difference between actual crime and reported crime, but certainly there is gap between
these two. The increase in reporting in crime in some states must be analysed further, as it may have given more
avenue and better opportunity to women to report crime.
1 http://www.indiaspend.com/cover-story/crime-against-women-up-83-conviction-rate-hits-decadal-low-18239
38 37.335.2
33.230.4
28.727 26.6
23.221.4
19.6
14.4 12.9 12.89.210.2
6
15.6
11.2 11.714.8
6.8 8.1
15.5
7.4 7.2 711.8
16.8
1.5
Graph-3
State with low reporting of Crime against Women
Crime Rate-2016 Crime Rate- 2007
RGICS Brief
Crime against Women: Beyond Numbers
7
Part-II
Crime against Women
2.1 Kidnapping and Abduction:
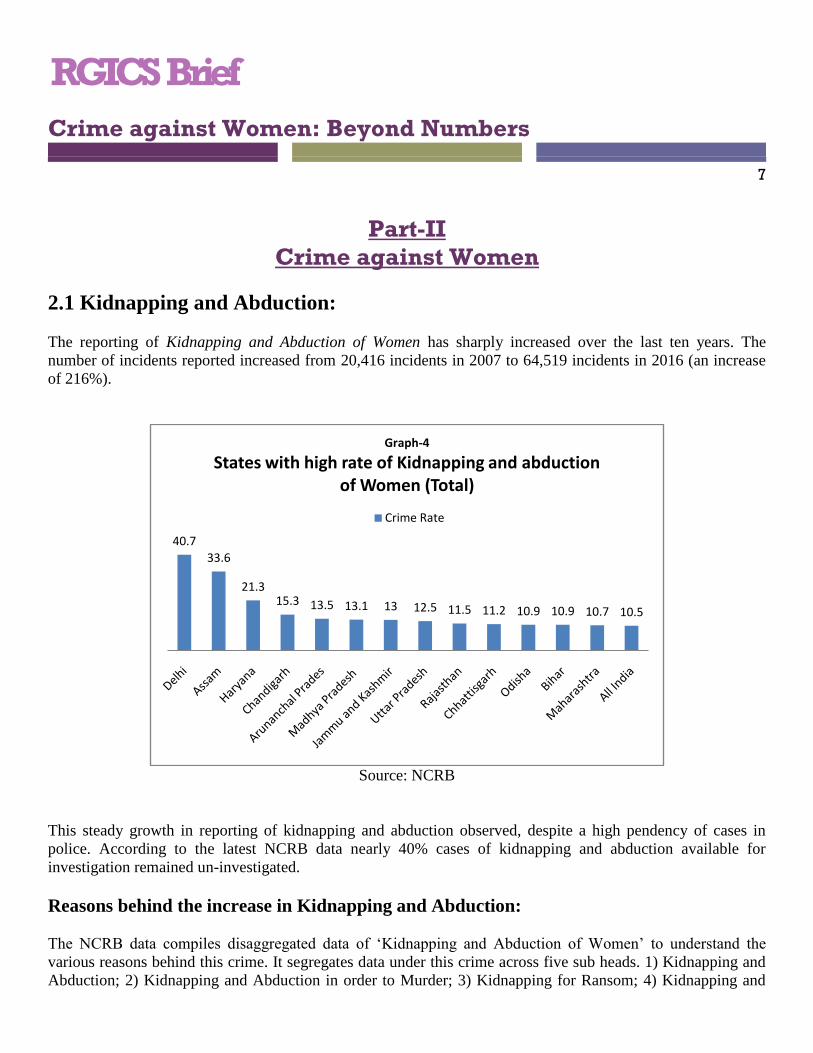
The reporting of Kidnapping and Abduction of Women has sharply increased over the last ten years. The
number of incidents reported increased from 20,416 incidents in 2007 to 64,519 incidents in 2016 (an increase
of 216%).
Source: NCRB
This steady growth in reporting of kidnapping and abduction observed, despite a high pendency of cases in
police. According to the latest NCRB data nearly 40% cases of kidnapping and abduction available for
investigation remained un-investigated.
Reasons behind the increase in Kidnapping and Abduction:
The NCRB data compiles disaggregated data of „Kidnapping and Abduction of Women‟ to understand the
various reasons behind this crime. It segregates data under this crime across five sub heads. 1) Kidnapping and
Abduction; 2) Kidnapping and Abduction in order to Murder; 3) Kidnapping for Ransom; 4) Kidnapping and
40.7
33.6
21.315.3 13.5 13.1 13 12.5 11.5 11.2 10.9 10.9 10.7 10.5
Graph-4
States with high rate of Kidnapping and abduction of Women (Total)
Crime Rate
RGICS Brief
Crime against Women: Beyond Numbers
8
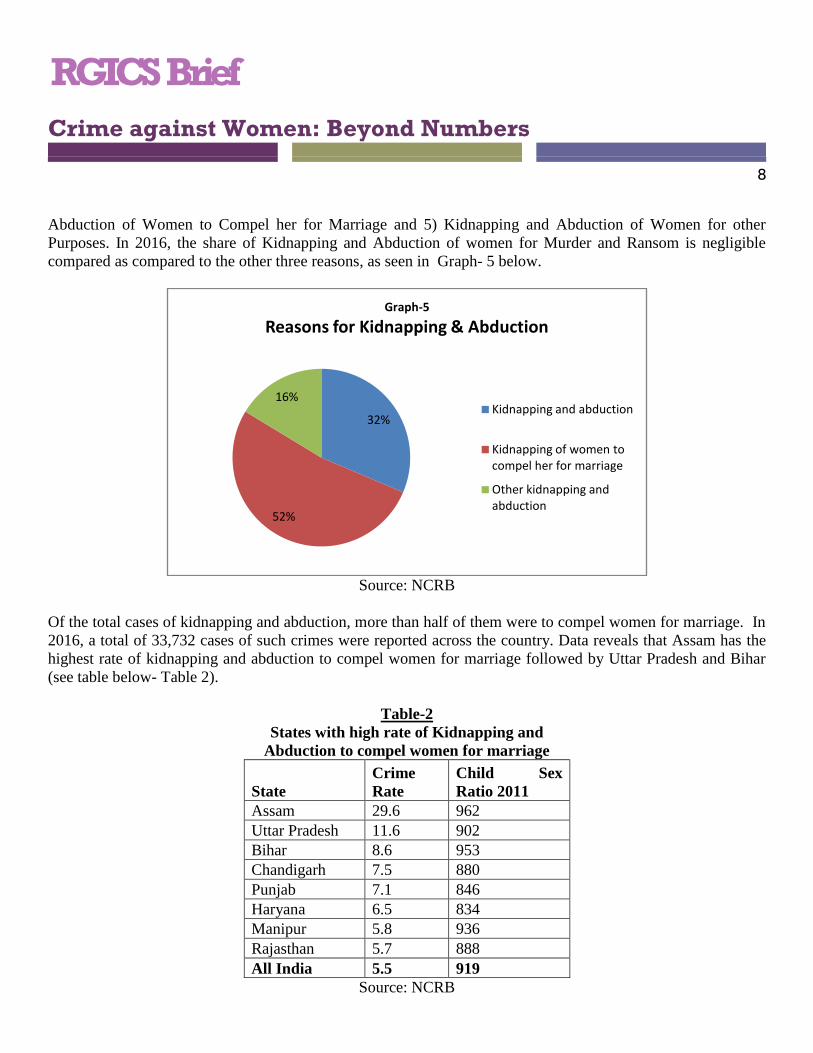
Abduction of Women to Compel her for Marriage and 5) Kidnapping and Abduction of Women for other
Purposes. In 2016, the share of Kidnapping and Abduction of women for Murder and Ransom is negligible
compared as compared to the other three reasons, as seen in Graph- 5 below.
Source: NCRB
Of the total cases of kidnapping and abduction, more than half of them were to compel women for marriage. In
2016, a total of 33,732 cases of such crimes were reported across the country. Data reveals that Assam has the
highest rate of kidnapping and abduction to compel women for marriage followed by Uttar Pradesh and Bihar
(see table below- Table 2).
Table-2
States with high rate of Kidnapping and
Abduction to compel women for marriage
State
Crime
Rate
Child Sex
Ratio 2011
Assam 29.6 962
Uttar Pradesh 11.6 902
Bihar 8.6 953
Chandigarh 7.5 880
Punjab 7.1 846
Haryana 6.5 834
Manipur 5.8 936
Rajasthan 5.7 888
All India 5.5 919
Source: NCRB
32%
52%
16%
Graph-5
Reasons for Kidnapping & Abduction
Kidnapping and abduction
Kidnapping of women to compel her for marriage
Other kidnapping and abduction
RGICS Brief
Crime against Women: Beyond Numbers
9
The top eight states with high rates of crime to kidnap and abduct of women for marriage are of two categories.
The first category of states comprises of Assam, Uttar Pradesh, Bihar and Manipur which have comparatively
better sex ratio. The second category states includes Chandigarh, Punjab, Haryana and Rajasthan which have
very poor gender balance population. Poor sex ratio in the second category states has lead to á „shortage of
brides‟. This data perhaps provides evidence to support the argument that states with low sex ratio are facing
shortage of brides and they have been sourcing brides from other states through various means including
kidnapping and abduction.
2.2 Assault on Women to Outrage her Modesty:
Source: NCRB
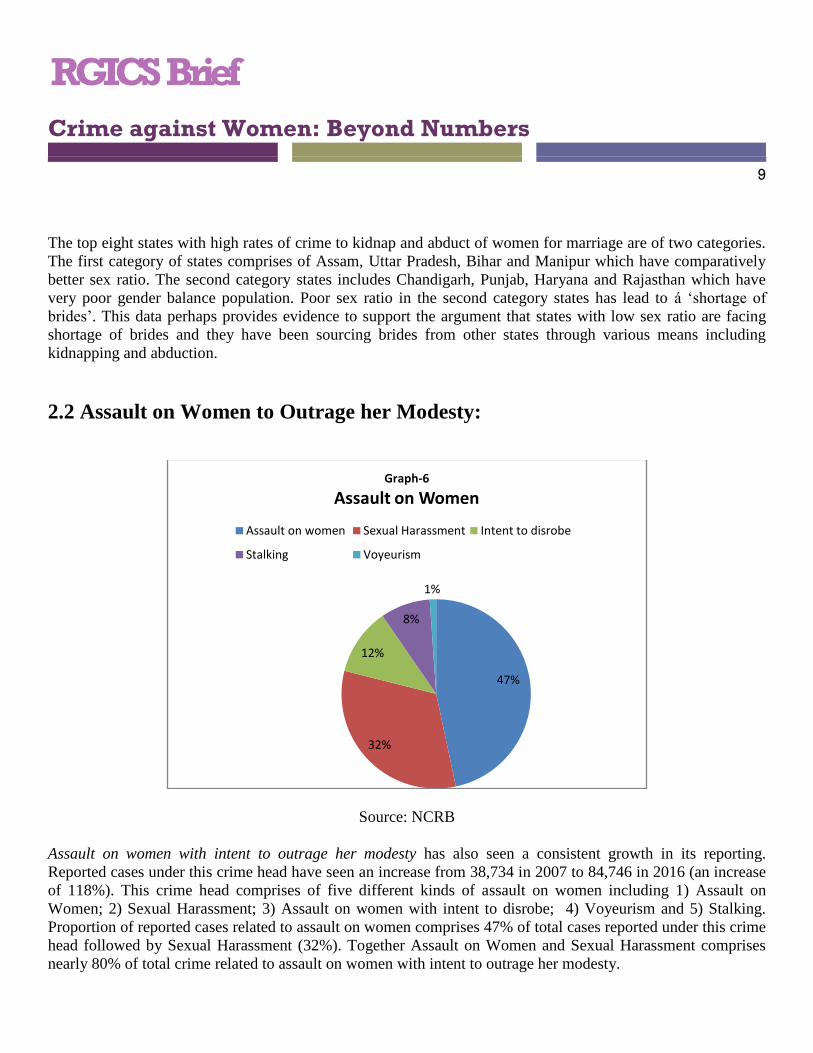
Assault on women with intent to outrage her modesty has also seen a consistent growth in its reporting.
Reported cases under this crime head have seen an increase from 38,734 in 2007 to 84,746 in 2016 (an increase
of 118%). This crime head comprises of five different kinds of assault on women including 1) Assault on
Women; 2) Sexual Harassment; 3) Assault on women with intent to disrobe; 4) Voyeurism and 5) Stalking.
Proportion of reported cases related to assault on women comprises 47% of total cases reported under this crime
head followed by Sexual Harassment (32%). Together Assault on Women and Sexual Harassment comprises
nearly 80% of total crime related to assault on women with intent to outrage her modesty.
47%
32%
12%
8%
1%
Graph-6
Assault on Women
Assault on women Sexual Harassment Intent to disrobe
Stalking Voyeurism
RGICS Brief
Crime against Women: Beyond Numbers
10
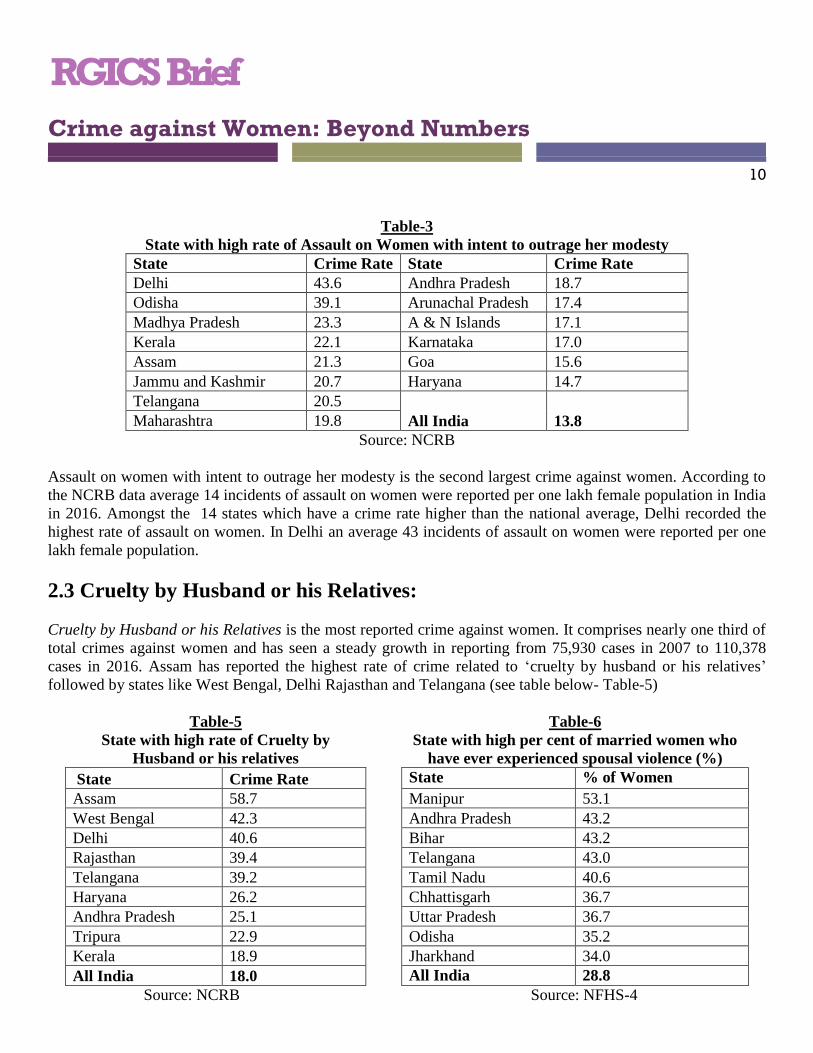
Table-3
State with high rate of Assault on Women with intent to outrage her modesty
State Crime Rate State Crime Rate
Delhi 43.6 Andhra Pradesh 18.7
Odisha 39.1 Arunachal Pradesh 17.4
Madhya Pradesh 23.3 A & N Islands 17.1
Kerala 22.1 Karnataka 17.0
Assam 21.3 Goa 15.6
Jammu and Kashmir 20.7 Haryana 14.7
Telangana 20.5
All India 13.8 Maharashtra 19.8
Source: NCRB
Assault on women with intent to outrage her modesty is the second largest crime against women. According to
the NCRB data average 14 incidents of assault on women were reported per one lakh female population in India
in 2016. Amongst the 14 states which have a crime rate higher than the national average, Delhi recorded the
highest rate of assault on women. In Delhi an average 43 incidents of assault on women were reported per one
lakh female population.
2.3 Cruelty by Husband or his Relatives:
Cruelty by Husband or his Relatives is the most reported crime against women. It comprises nearly one third of
total crimes against women and has seen a steady growth in reporting from 75,930 cases in 2007 to 110,378
cases in 2016. Assam has reported the highest rate of crime related to „cruelty by husband or his relatives‟
followed by states like West Bengal, Delhi Rajasthan and Telangana (see table below- Table-5)
Table-5
State with high rate of Cruelty by
Husband or his relatives
Table-6
State with high per cent of married women who
have ever experienced spousal violence (%)
State Crime Rate State % of Women
Assam 58.7 Manipur 53.1
West Bengal 42.3 Andhra Pradesh 43.2
Delhi 40.6 Bihar 43.2
Rajasthan 39.4 Telangana 43.0
Telangana 39.2 Tamil Nadu 40.6
Haryana 26.2 Chhattisgarh 36.7
Andhra Pradesh 25.1 Uttar Pradesh 36.7
Tripura 22.9 Odisha 35.2
Kerala 18.9 Jharkhand 34.0
All India 18.0 All India 28.8
Source: NCRB Source: NFHS-4
RGICS Brief
Crime against Women: Beyond Numbers
11
Cruelty by Husband or his Relatives largely covers issues of domestic violence where many women are victims
of the patriarchal setup of the society. Despite criminalizing all such crimes through The Protection of Women
from Domestic Violence Act, 2005 reporting of such crimes remains very low. For example according to
NFHS-4 (2015-16) 28.8% „ever married women had experienced spousal violence. Whereas the NCRB data
shows that only 18 cases of cruelty by husband or his relatives were registered per one lakh female population
in 2016. Similarly, at the state level huge variations have been observed in actual prevalence of domestic
violence and amount of registered cases. Table-6 above reveals that states where there is a high prevalence of
domestic violence, they are not among top state with high rate of reporting such crimes.
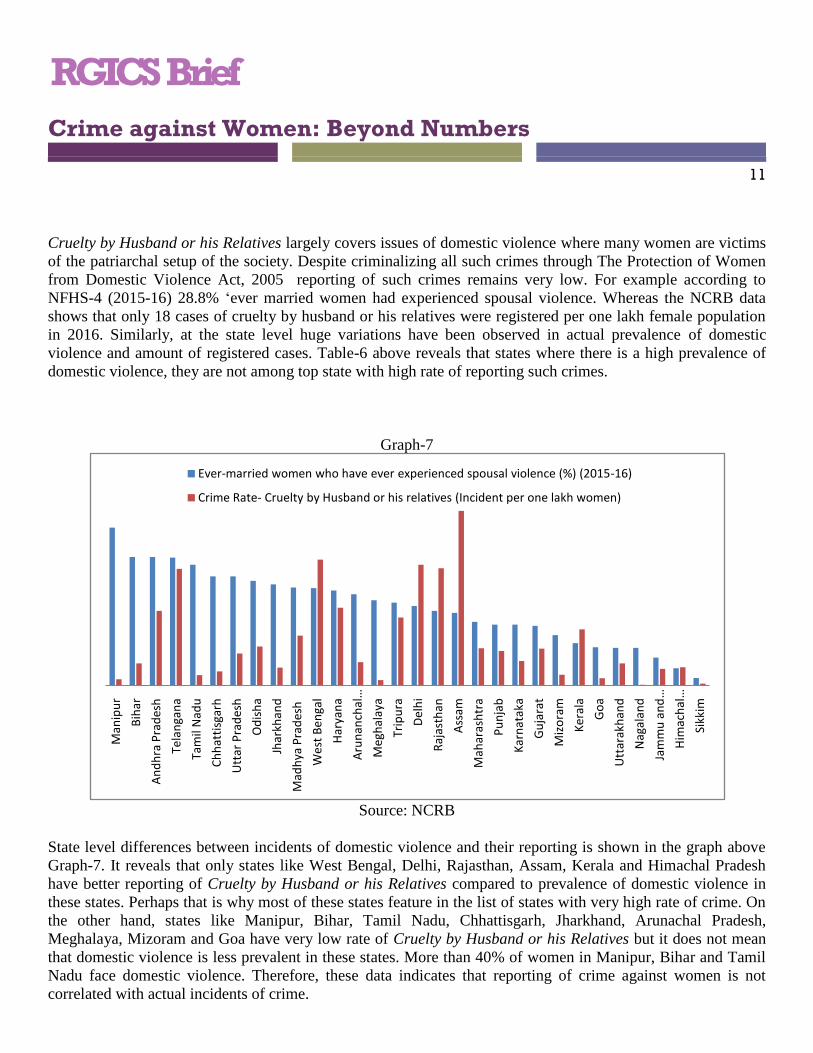
Graph-7
Source: NCRB
State level differences between incidents of domestic violence and their reporting is shown in the graph above
Graph-7. It reveals that only states like West Bengal, Delhi, Rajasthan, Assam, Kerala and Himachal Pradesh
have better reporting of Cruelty by Husband or his Relatives compared to prevalence of domestic violence in
these states. Perhaps that is why most of these states feature in the list of states with very high rate of crime. On
the other hand, states like Manipur, Bihar, Tamil Nadu, Chhattisgarh, Jharkhand, Arunachal Pradesh,
Meghalaya, Mizoram and Goa have very low rate of Cruelty by Husband or his Relatives but it does not mean
that domestic violence is less prevalent in these states. More than 40% of women in Manipur, Bihar and Tamil
Nadu face domestic violence. Therefore, these data indicates that reporting of crime against women is not
correlated with actual incidents of crime.
Man
ipu
r
Bih
ar
An
dh
ra P
rad
esh
Tela
nga
na
Tam
il N
adu
Ch
hat
tisg
arh
Utt
ar P
rad
esh
Od
ish
a
Jhar
khan
d
Mad
hya
Pra
des
h
Wes
t B
enga
l
Har
yan
a
Aru
nan
chal
…
Meg
hal
aya
Trip
ura
Del
hi
Raj
asth
an
Ass
am
Mah
aras
htr
a
Pu
nja
b
Kar
nat
aka
Gu
jara
t
Miz
ora
m
Ker
ala
Go
a
Utt
arak
han
d
Nag
alan
d
Jam
mu
an
d …
Him
ach
al …
Sikk
im
Ever-married women who have ever experienced spousal violence (%) (2015-16)
Crime Rate- Cruelty by Husband or his relatives (Incident per one lakh women)
RGICS Brief
Crime against Women: Beyond Numbers
12
2.4 Rape and Attempt to Rape:
Rape unfortunately has seen more than 100 per cent increase in its reporting in last ten years. The registered
cases of rape and attempt to rape have increased from 20,737 in 2007 to 44,674 in 2016. However, a large
number of cases have not seen any head way as far as investigations are concerned. According to last three
NCRB reports nearly 30% of cases registered under these crime heads remained un-investigated.
Table-7
State with high rates of rape
State Crime Rate State Crime Rate
Sikkim 30.3 Odisha 9.4
Delhi 22.6 Haryana 9.4
Arunachal Prades 14.7 Chandigarh 9.3
Meghalaya 13.8 Kerala 9.1
Madhya Pradesh 13.1 Himachal Pradesh 7.3
Chhattisgarh 12.6 Maharashtra 7.3
Lakshadweep 11.9 D&N Haveli 7.2
Assam 11.2 Telangana 6.9
A & N Islands 11.2 Jharkhand 6.8
Tripura 11.0 Goa 6.7
Daman & Diu 10.9 Uttarakhand 6.4
Rajasthan 10.4 All India 6.3
Source: NCRB
Sikkim recorded the highest rate of rape in 2016 followed with Delhi, Arunachal Pradesh, Meghalaya and
Madhya Pradesh.
Source: NCRB
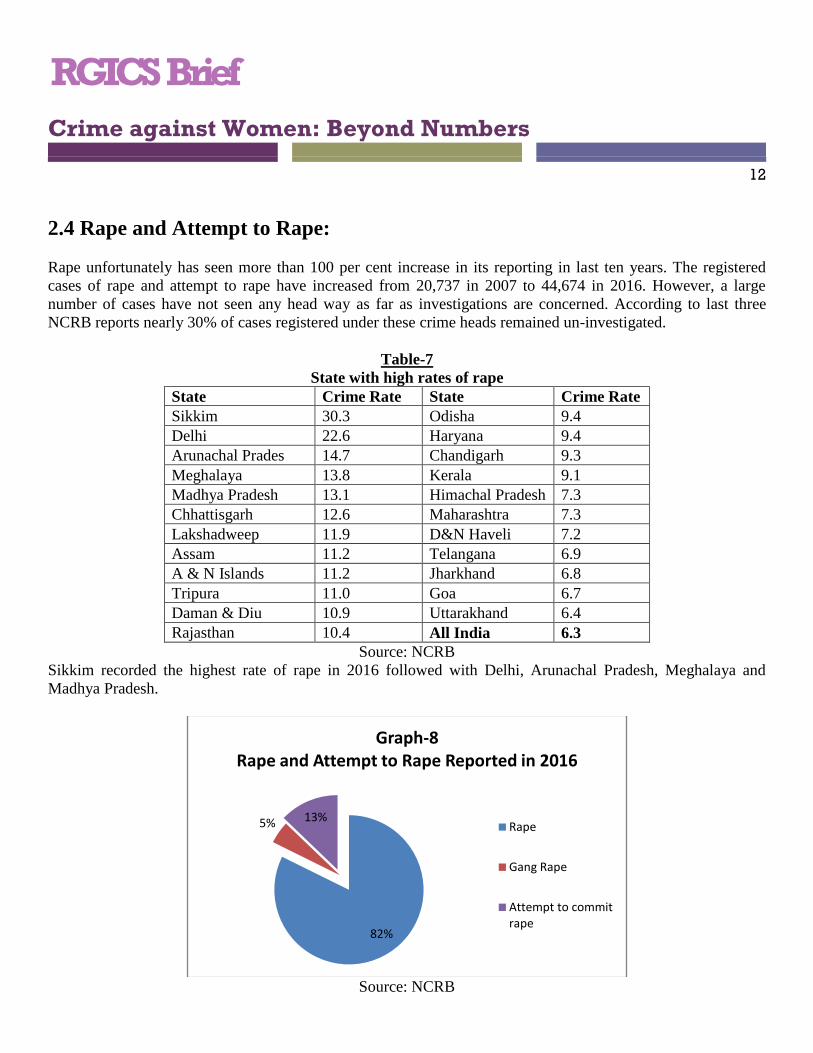
82%
5% 13%
Graph-8Rape and Attempt to Rape Reported in 2016
Rape
Gang Rape
Attempt to commit rape
RGICS Brief
Crime against Women: Beyond Numbers
13
Cases of gang rape constituted 5% of total number of rapes reported in 2016. This year, a total of 2167 cases of
gang rape were reported. Highest reporting of gang rape is from Uttar Pradesh (682 incidents) followed by
Rajasthan (366 incidents), Madhya Pradesh (226 incidents) and Haryana (191 incidents). The crime rate of gang
rape is highest in Haryana followed by Rajasthan. In 2016, an average of 1.5 cases of gang rape per one lakh
women population were reported in Haryana. Rajasthan reported one case of gang rape per one lakh women
population.
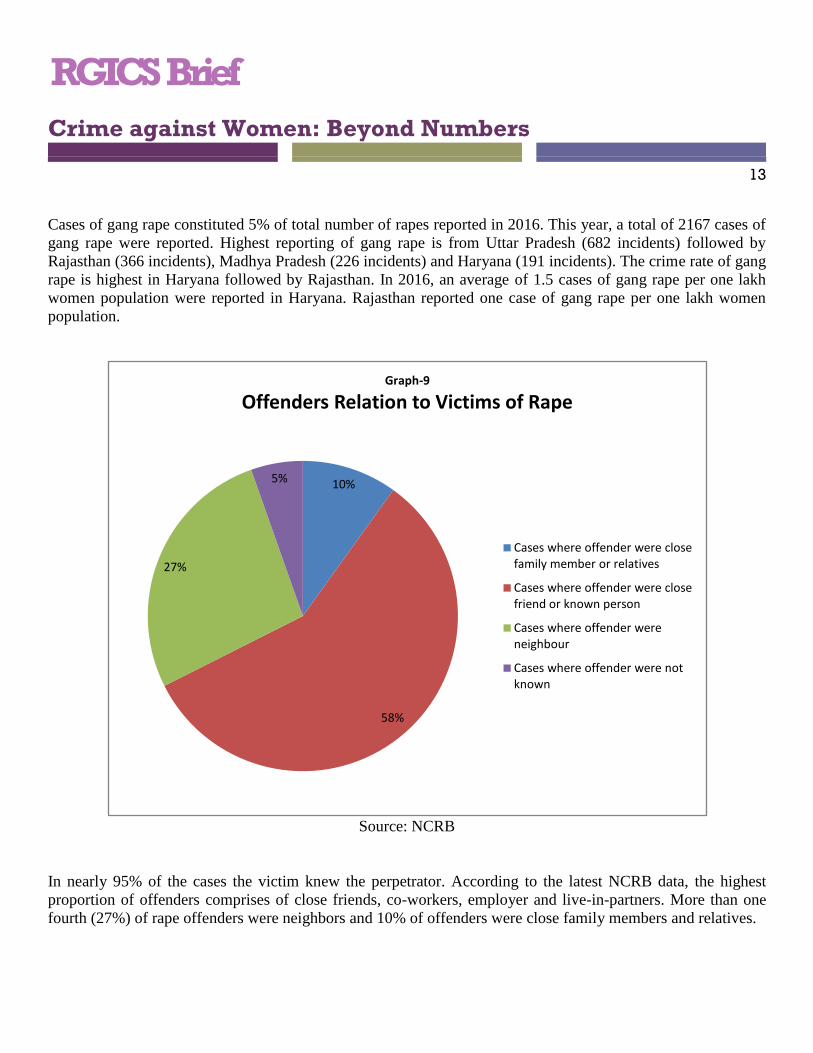
Source: NCRB
In nearly 95% of the cases the victim knew the perpetrator. According to the latest NCRB data, the highest
proportion of offenders comprises of close friends, co-workers, employer and live-in-partners. More than one
fourth (27%) of rape offenders were neighbors and 10% of offenders were close family members and relatives.
10%
58%
27%
5%
Graph-9
Offenders Relation to Victims of Rape
Cases where offender were close family member or relatives
Cases where offender were close friend or known person
Cases where offender were neighbour
Cases where offender were not known
RGICS Brief
Crime against Women: Beyond Numbers
14
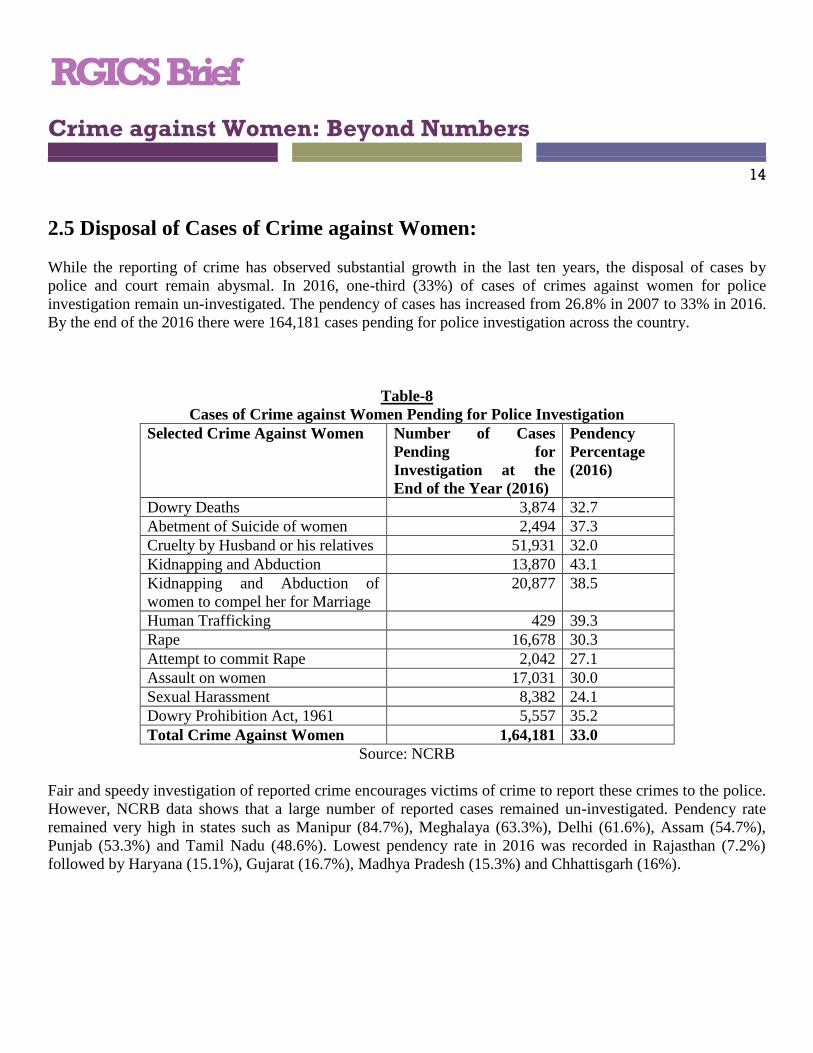
2.5 Disposal of Cases of Crime against Women:
While the reporting of crime has observed substantial growth in the last ten years, the disposal of cases by
police and court remain abysmal. In 2016, one-third (33%) of cases of crimes against women for police
investigation remain un-investigated. The pendency of cases has increased from 26.8% in 2007 to 33% in 2016.
By the end of the 2016 there were 164,181 cases pending for police investigation across the country.
Table-8
Cases of Crime against Women Pending for Police Investigation
Selected Crime Against Women Number of Cases
Pending for
Investigation at the
End of the Year (2016)
Pendency
Percentage
(2016)
Dowry Deaths 3,874 32.7
Abetment of Suicide of women 2,494 37.3
Cruelty by Husband or his relatives 51,931 32.0
Kidnapping and Abduction 13,870 43.1
Kidnapping and Abduction of
women to compel her for Marriage
20,877 38.5
Human Trafficking 429 39.3
Rape 16,678 30.3
Attempt to commit Rape 2,042 27.1
Assault on women 17,031 30.0
Sexual Harassment 8,382 24.1
Dowry Prohibition Act, 1961 5,557 35.2
Total Crime Against Women 1,64,181 33.0
Source: NCRB
Fair and speedy investigation of reported crime encourages victims of crime to report these crimes to the police.
However, NCRB data shows that a large number of reported cases remained un-investigated. Pendency rate
remained very high in states such as Manipur (84.7%), Meghalaya (63.3%), Delhi (61.6%), Assam (54.7%),
Punjab (53.3%) and Tamil Nadu (48.6%). Lowest pendency rate in 2016 was recorded in Rajasthan (7.2%)
followed by Haryana (15.1%), Gujarat (16.7%), Madhya Pradesh (15.3%) and Chhattisgarh (16%).
RGICS Brief
Crime against Women: Beyond Numbers
15
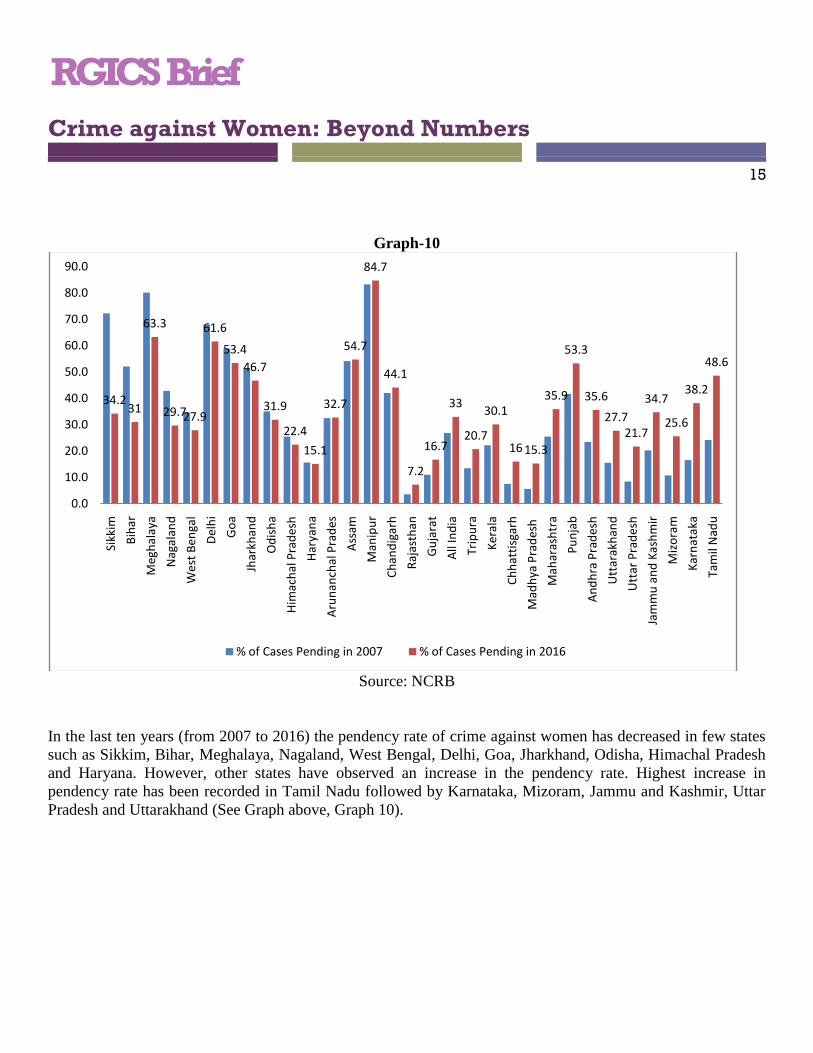
Graph-10
Source: NCRB
In the last ten years (from 2007 to 2016) the pendency rate of crime against women has decreased in few states
such as Sikkim, Bihar, Meghalaya, Nagaland, West Bengal, Delhi, Goa, Jharkhand, Odisha, Himachal Pradesh
and Haryana. However, other states have observed an increase in the pendency rate. Highest increase in
pendency rate has been recorded in Tamil Nadu followed by Karnataka, Mizoram, Jammu and Kashmir, Uttar
Pradesh and Uttarakhand (See Graph above, Graph 10).
34.231
63.3
29.727.9
61.6
53.4
46.7
31.9
22.4
15.1
32.7
54.7
84.7
44.1
7.2
16.7
33
20.7
30.1
16 15.3
35.9
53.3
35.6
27.721.7
34.7
25.6
38.2
48.6
0.0
10.0
20.0
30.0
40.0
50.0
60.0
70.0
80.0
90.0
Sikk
im
Bih
ar
Meg
hal
aya
Nag
alan
d
Wes
t B
enga
l
Del
hi
Go
a
Jhar
khan
d
Od
ish
a
Him
ach
al P
rad
esh
Har
yan
a
Aru
nan
chal
Pra
des
Ass
am
Man
ipu
r
Ch
and
igar
h
Raj
asth
an
Gu
jara
t
All
Ind
ia
Trip
ura
Ker
ala
Ch
hat
tisg
arh
Mad
hya
Pra
des
h
Mah
aras
htr
a
Pu
nja
b
An
dh
ra P
rad
esh
Utt
arak
han
d
Utt
ar P
rad
esh
Jam
mu
an
d K
ash
mir
Miz
ora
m
Kar
nat
aka
Tam
il N
adu
% of Cases Pending in 2007 % of Cases Pending in 2016
RGICS Brief
Crime against Women: Beyond Numbers
16
Part-III
Conclusion and Way Forward
The NCRB‟s annual report on crime indicates important trends related to crime in India. It also help us to
monitor stages of crime after its reporting, such as registration of crime, processing and investigation by police,
trials in court and conviction. Unfortunately, every year, with the release of NCRB data, all these important
information gets overshadowed by a dominant message which only talks about increase or decrease of crime
rate. Largely the reporting of crime has been increasing, so there is increase in crime rate as well. This message
in isolation creates fear among people. There is a need to be careful about while analysing these numbers and
complexities of each crime heads. Such lopsided presentations of crime data through media and other medium
may adversely affect sensitive issues such as women‟s security. For example, news-headlines tagging „Delhi as
most unsafe city for women‟ for its high reporting of crime against women a day after release of NCRB data is
completely mis-leading. It not only creates panic but could also discourage the state police force from
registering every case it receives. A worrying case of unintended consequence of a surface level analysis of
data
While there are a number of social, economic, cultural and other factors that lead to crimes, the reporting of the
crime also depends on range of issues such as social, economic and cultural hindrances to victims and efficacy
of institutions. Various experts working on issues of crime have been arguing that with the increase in public
awareness and relatively more accessible police and judicial system, the reporting of the crime has increased.
However, a large number of crimes against women still goes un-reported. For example, the NFHS in its fourth
survey in 2015-16 found that 28.8% married women in India faces domestic violence. However, the reporting
of such crimes as per the latest NCRB report is abysmally l. The latest report has recorded an average of 18
incidents of cruelty by husbands or his relatives per one lakh married women. This simple example indicates a
large volume of un-reported crimes against women in the country. Furthermore, there is no co-relation between
actual crime and its reporting. Again, in the case of domestic violence, states with higher rate of domestic
violence as per the NFHS data do not have correspondingly higher rate of reporting of such crime. While the
under-reporting of domestic violence is common across the country, it varies from state to state.. States and
cities that report high crime rates do not always mean they are unsafe compared to others.
The above analysis of the NCRB data supports arguments by women‟s rights activists that more than increase in
crime there is increase in reporting of crime in some states. However, factors responsible for the increase in
reporting are not clear. We also don‟t know why there is such a huge difference in crime incidents and their
reporting at state level. To answer these questions, in our analysis of the NCRB data, we tried to map trends
between increasing crime rate and several other reported factors. For example, we ran statistical correlation tests
between increasing crime rate and factors such as rate of disposing of cases by police and court, women literacy
and education of women and rate of domestic violence and sex ratio. We did not find any strong correlation
RGICS Brief
Crime against Women: Beyond Numbers
17
(both negative and positive) to explain rapid increase in crime rate in some state and nominal increase in crime
rate in other states. Therefore, the annual release of number on crime against women is not enough to take this
valuable documentation further to plan and implement effective policies. To understand disparities in reporting
of crime across the country we need to strengthen our documentation on crime. To understand institutional
factors the system must record data related to strength and efficiency of police and judicial system. Data on
accessibility of these institutions would also help to understand connect between population and the system of
justice. As the crime against women is a manifestation of range of social and cultural practices and norms,
socio-economic profiling of both victim and perpetuator of crime would also help to understand prevalence of
crime and hindrance in its reporting. Such disaggregated data related to the system, victim and crime
perpetuator would help to give meaning to the statistics on crime against women, which further can be used to
create better systems and policy responses.