Embed Size (px)
Citation preview

1 TAC 2012: Advances in Pavement Evaluation and Instrumentation – Richard Korczak
Use Of An Automated Temperature Data Logger (ATDL) During Falling Weight Deflectometer (FWD)
Testing
Richard Korczak, PEng
MASc Candidate, University of Waterloo
Project Engineer, Stantec Consulting Ltd.
Susan Tighe, PhD., PEng Professor and Canada Research Chair
Norman W. McLeod Professor in Sustainable Pavement Engineering Director, Centre for Pavement and Transportation Technology
University of Waterloo
Gabe Cimini Stantec Consulting Ltd.
Paper prepared for presentation at the Advances in Pavement Evaluation and Instrumentation Session
of the 2012 Conference of the Transportation Association of Canada Fredericton, New Brunswick
2 TAC 2012: Advances in Pavement Evaluation and Instrumentation – Richard Korczak
Abstract There are various methods of designing an overlay for a flexible pavement. A common method presently
used involves analyzing FWD data to assess the structural capacity of a pavement section and using the
backcalculated data to determine the overlay thickness.
Deflection results of all pavements are dependent on seasonal variations that affect the underlying
aggregate and subgrade. The results from asphalt pavements are also dependent on the temperature of
the asphalt. In order to meaningfully analyze the deflections or the deflection results, the deflection
analysis results, must be adjusted to account for seasonal and temperature effects.
A piece of equipment that has recently been introduced into the Long Term Pavement Performance
(LTPP) program is the Automated Temperature Data Logger (ATDL). The ATDL is designed to provide
continuous automated data collection for pavement temperature gradient measurements associated
with FWD deflection tests on LTPP test sections.
This report will examine the effect of using different sources of temperature gradient data and
temperature models used to adjust FWD deflection results on overlay design for pavement sections in
the LTPP program. All data will be sourced from the LTPP database and will use data from various states
in the North Atlantic and North Central regions of North America. Furthermore, this report will discuss
the impacts of the findings on pavement management and sustainability.
3 TAC 2012: Advances in Pavement Evaluation and Instrumentation – Richard Korczak
1 Introduction
1.1 Background By definition, the term engineering involves the creative applications of scientific principles to design,
construct, maintain and manage structures, machines, apparatus or processes. Pavement engineering is
a subcategory of civil engineering and primarily focuses on pavements. Pavement engineers use
techniques to design, construct, maintain, predict performance and manage road and pavement
structures [Tighe 2012].
This paper focuses on evaluating the structural capacity of pavements. Structural capacity can be
measured using a Benkelman Beam, Dynaflect or by using a Falling Weight Deflectometer (FWD). The
FWD is an automated device used to rapidly and non-destructively measure pavement deflection. An
impulse load which reasonably simulates traffic loading is applied to a spring loaded baseplate on the
pavement surface. Deflections are measured at the center of the baseplate and at six to eight
(depending on sensor configuration) other pre-determined radial points from the baseplate by
geophones or deflection sensors. The deflection response of a pavement to an applied load is an
important indicator of structural capacity, material properties and subsequent pavement performance.
The FWD was introduced in the 1980’s and was gaining wide acceptance in North America during the
1990’s. The FWD has now become the industry standard for collecting pavement deflection data. This
was due to its non-destructive nature, portability (towed by a trailer) and speed of testing. The FWD can
perform in excess of 30 tests per hour [Dynatest 2010].
The data used in this report is sourced from the Long-Term Pavement Performance (LTPP) program.
“The Long–Term Pavement Performance (LTPP) program began in 1987 as part of SHRP” [FHWA 2010a].
The primary purpose was to establish a national long–term pavement database to support pavement
research and improved pavement performance. When SHRP ended as planned in 1992, the LTPP
program continued under the Federal Highway Administration (FHWA) with the participation of highway
agencies in all 50 States, the District of Columbia, Puerto Rico, and 10 Canadian Provinces. Since 1989,
the LTPP program has monitored nearly 2,500 pavement test sections throughout the United States and
Canada” [FHWA 2010b].
A piece of equipment that has recently been introduced into the LTPP program is the Automated
Temperature Data Logger (ATDL). The ATDL is designed to provide continuous automated data
collection for pavement temperature gradient measurements associated with FWD deflection tests on
LTPP test sections.
Pavement temperature gradients include up to five measurements in holes drilled in the bound layers of
the pavement at nominal depths of 25, 50, 100, 200 and 300 mm. Holes are drilled in the center of the
outer wheel path but must be offset at least 0.5 m from each other in the longitudinal direction [FHWA
2008].
4 TAC 2012: Advances in Pavement Evaluation and Instrumentation – Richard Korczak
1.0 Purpose The purpose of this report is to assess the implementation of an ATDL to record pavement temperature
gradients during collection of FWD data. This report will evaluate the differences in using temperature
data from several sources during deflection testing. Furthermore, this paper will investigate the impact
on the design of a pavement by comparing designs using temperature data from different sources.
1.1 Objectives 1. Review the current practice of temperature adjustment factors for deflection data.
2. Evaluate AC layer moduli for a pavement structure using different sources of temperature data
and multiple methods of temperature correction in order to synthesize the various procedures
currently in practice.
3. Investigate the effect on the design process.
4. Highlight differences in findings and discuss how pavement management and sustainability are
affected.
1.1.1 Data Source
All data used for analysis can be found on the latest LTPP Standard Data Release (SDR) 26.0, which was
released in January 2012 at the Transportation Research Board (TRB) Annual Conference in Washington,
DC.
1.1.2 Analysis Software
The backcalculation software used for analyzing the asphalt concrete (AC) layer stiffness in the
pavement structures is called Elmod 6.0 from Dynatest.
2 Data Review & Background
2.0 Temperature Data Collection There are many different ways of obtaining temperature data while performing FWD tests:
1. Automated collection using FWD infrared sensors
2. Manual collection using a handheld infrared thermometer
3. Drilling holes into the bound layers of the pavement to perform manual measurements
4. Drilling holes into the bound layers of the pavement to use an ATDL
Industry most commonly uses Method 1, shown above. Since the LTPP program is a research project,
data collection adheres to a much higher standard as quality data is a number one priority. The LTPP
program uses all four of the above listed methods of obtaining temperature measurements.
Since data from all four sources is available, a comparison can be made using different methods. For the
purpose of this report, Methods 1 and 4 were used for comparison. It is important to note that Method
1 only provides surface temperature, while Method 4 provides surface temperature and asphalt
temperature at various depths within the layer.
5 TAC 2012: Advances in Pavement Evaluation and Instrumentation – Richard Korczak
2.1 Temperature Correction Deflection results of all pavements are dependent on seasonal variations that affect the underlying
aggregate and subgrade. The results from asphalt pavements are also dependent on the temperature of
the asphalt. In order to meaningfully analyze the deflections or the deflection results the deflection
analysis results, must be adjusted to account for the seasonal and temperature effects [FHWA 2000].
Over the years, a number of methods have been developed to measure the asphalt temperature and to
adjust the deflection results for the effects of temperature. The Elmod backcalculation software has the
flexibility to use three sources of data to correct temperatures:
1. Asphalt temperature measured at ⅓ or ½ the depth of the layer (can be manual or automated)
2. Surface temperature (can be manual or automated)
3. Average air temperature the day before testing (BELLS equation)
The BELLS equation was refined by the FHWA using temperature models created by using LTPP data
from all of the experimental pavement sections across North America.
The version of the BELLS equation used in analysis by the Elmod software is a variation of the original
equation called the BELLS2 equation [FHWA 2000] and can be expressed as the following:
where: Td = Pavement temperature at depth d, °C
IR = Infrared surface temperature, °C log = Base 10 logarithm d = Depth at which mat temperature is to be predicted, mm 1-day = Average air temperature the day before testing sin = Sine function on an 18-hr clock system, with 2π radians equal to one 18-hr cycle hr = Time of day, in 24-hr clock system, but calculated using an 18-hr asphalt concrete (AC)
temperature rise- and fall-time cycle
2.2 Test Section Details For this report, three different experimental test sections were analyzed. The first section, 510115, is
located on the SR-29 Expressway near Danville, Virginia. The second pavement section, 340506, is
located on the Westbound lanes of I-195 in Upper Freehold, New Jersey. The third section, 447401, is
located on the Northbound lanes of the N Smithfield Expressway near Providence, Rhode Island [FHWA
2010c].
2.2.1 510115 – SR-29 near Danville, Virginia
Section 510115 is part of the SPS-1 project. The SPS-1 experiment is a study of the influence of strategic
factors that affect performance of asphalt concrete pavement [FHWA 2011]. Section 510115 is 1 of 13
individual 152.4m long, 3.7m wide pavement sections on SR-29.
6 TAC 2012: Advances in Pavement Evaluation and Instrumentation – Richard Korczak
Construction was completed in September of 1995 and the section is performing well with a minimal
amount of maintenance activity. The only maintenance done on this section has been some spot
patching and was done in October of 2004 [FHWA 2010c].
Section 510115 has had 7 FWD testing visits. This report will analyze one of those visits dated July 15th,
2010. Only one visit was analyzed because the ATDL was first implemented in 2009. The previous visit
was in 2004, well before implementation of the ATDL equipment. This pavement section was also
recently overlaid in the summer of 2011. The new layer thickness data is not yet available from the
recent overlay, but it would be interesting to compare to the data analyzed as part of this report [FHWA
2010c].
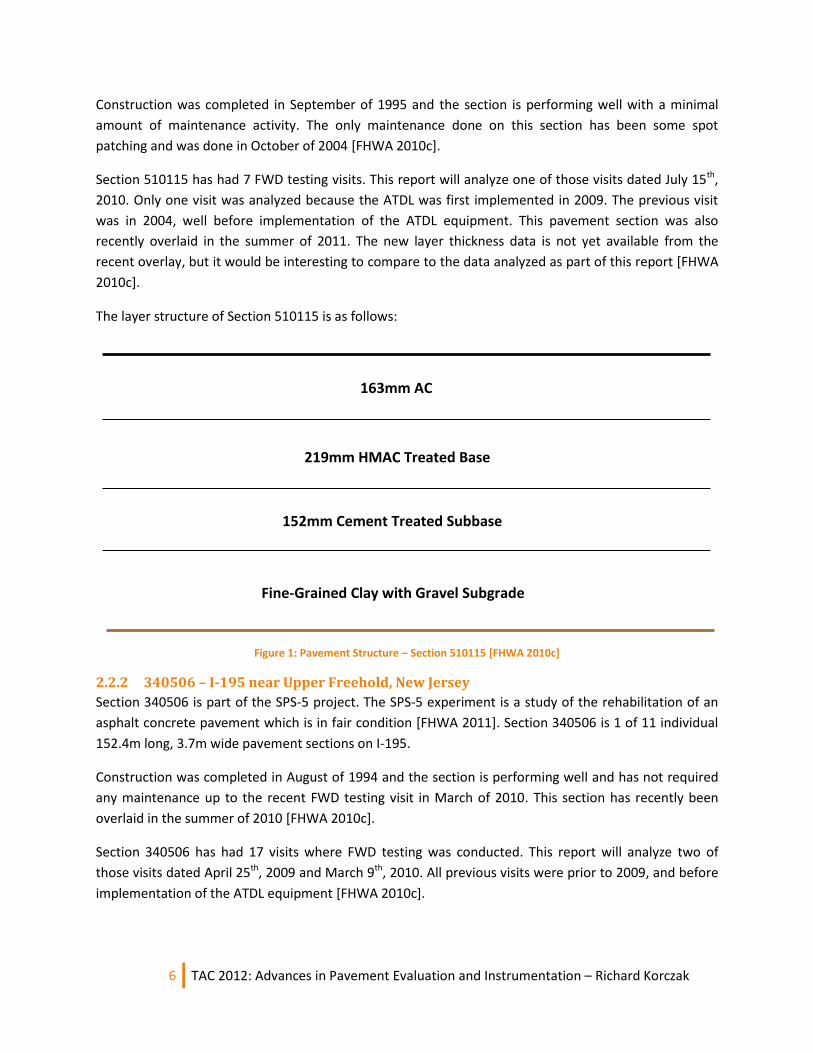
The layer structure of Section 510115 is as follows:
Figure 1: Pavement Structure – Section 510115 [FHWA 2010c]
2.2.2 340506 – I-195 near Upper Freehold, New Jersey
Section 340506 is part of the SPS-5 project. The SPS-5 experiment is a study of the rehabilitation of an
asphalt concrete pavement which is in fair condition [FHWA 2011]. Section 340506 is 1 of 11 individual
152.4m long, 3.7m wide pavement sections on I-195.
Construction was completed in August of 1994 and the section is performing well and has not required
any maintenance up to the recent FWD testing visit in March of 2010. This section has recently been
overlaid in the summer of 2010 [FHWA 2010c].
Section 340506 has had 17 visits where FWD testing was conducted. This report will analyze two of
those visits dated April 25th, 2009 and March 9th, 2010. All previous visits were prior to 2009, and before
implementation of the ATDL equipment [FHWA 2010c].
163mm AC
219mm HMAC Treated Base
152mm Cement Treated Subbase
Fine-Grained Clay with Gravel Subgrade

7 TAC 2012: Advances in Pavement Evaluation and Instrumentation – Richard Korczak
The layer structure of Section 340506 is as follows:
Figure 2: Pavement Structure – Section 340506 [FHWA 2010c]
2.2.3 447401 – N Smithfield Expressway near Providence, Rhode Island
Section 447401 is part of the GPS-7S set of experiments. The GPS-7S experiment is a study of an AC
overlay on a Portland Cement Concrete (PCC) pavement [FHWA 2011]. Section 447401 is a 152.4m long
and 3.7m wide pavement sections on the N Smithfield Expressway.
Section 447401 was overlaid in July of 2002 and the section is performing well and has not required any
maintenance up to the recent FWD testing visit in August of 2011 [FHWA 2010c].
Section 447401 has had 9 visits where FWD testing was conducted. This report will analyze two of those
visits dated November 30th, 2010 and August 3rd, 2011. All previous visits were prior to 2009, and before
implementation of the ATDL equipment [FHWA 2010c].
The layer structure of Section 447401 is as follows:
Figure 3: Pavement Structure – Section 447401 [FHWA 2010c]
287mm AC
254mm Granular Base
Coarse-Grained Silty Sand Subgrade
132mm AC
208mm PCC
Poorly Graded Gravel with Sand Subgrade
8 TAC 2012: Advances in Pavement Evaluation and Instrumentation – Richard Korczak
3 Data Analysis The Elmod 6.0 software used for the analysis in this report is able to utilize three different sources of
pavement temperature.
Source #1: Asphalt temperature recorded with an ATDL
Source #2: Asphalt Surface temperature recorded by the infrared sensors on the FWD during
testing
Source #3: Asphalt temperature predicted using the BELLS temperature prediction model
The LTPP FWD testing protocol consists of a total of 16 drops at each station and four drops per load
level. The four different load levels are 26.7kN, 40kN, 53.4kN and 71.2kN [FHWA 2000]. For the purpose
of this report, only the drops at the 40kN load level were analyzed as this is the standard design load.
Typical modulus values at a reference temperature of 20°C are provided below in Table 1.
Table 1: Typical Modulus Values for AC at 20°C
Material Modulus (MPa)
Bituminous at 20°C 3,000 to 7,000
1.1 FWD Testing & Analysis for Section 510115 FWD testing was completed in the outer wheelpath on SR-29 for Section 510115 on July 15th, 2010. This
cycle of testing was chosen from the database because of the high asphalt surface temperatures
measured during testing.
It is well documented that the stiffness of an asphalt pavement is directly related to its temperature.
When collecting FWD data in the hot summer months, the pavement will produce a greater deflection
at higher temperatures. Consequently, all backcalculated stiffness moduli for the AC layer must be
temperature corrected to account for this material property.
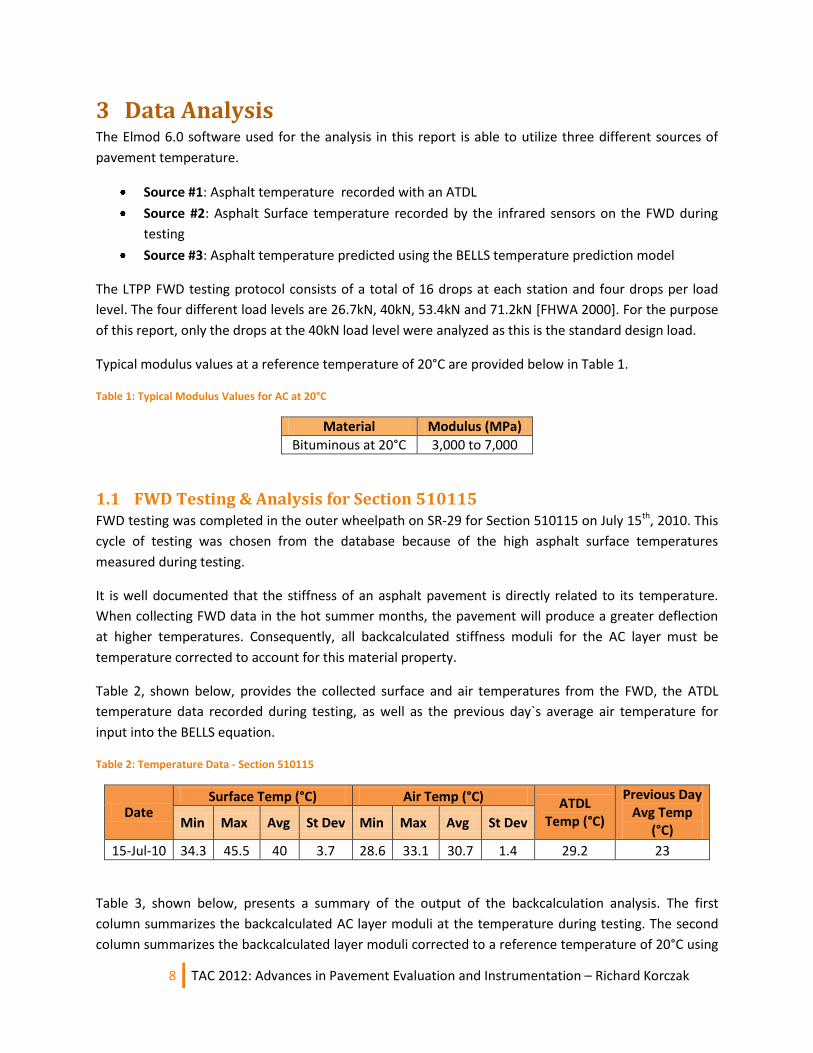
Table 2, shown below, provides the collected surface and air temperatures from the FWD, the ATDL
temperature data recorded during testing, as well as the previous day`s average air temperature for
input into the BELLS equation.
Table 2: Temperature Data - Section 510115
Date Surface Temp (°C) Air Temp (°C) ATDL
Temp (°C)
Previous Day Avg Temp
(°C) Min Max Avg St Dev Min Max Avg St Dev
15-Jul-10 34.3 45.5 40 3.7 28.6 33.1 30.7 1.4 29.2 23
Table 3, shown below, presents a summary of the output of the backcalculation analysis. The first
column summarizes the backcalculated AC layer moduli at the temperature during testing. The second
column summarizes the backcalculated layer moduli corrected to a reference temperature of 20°C using
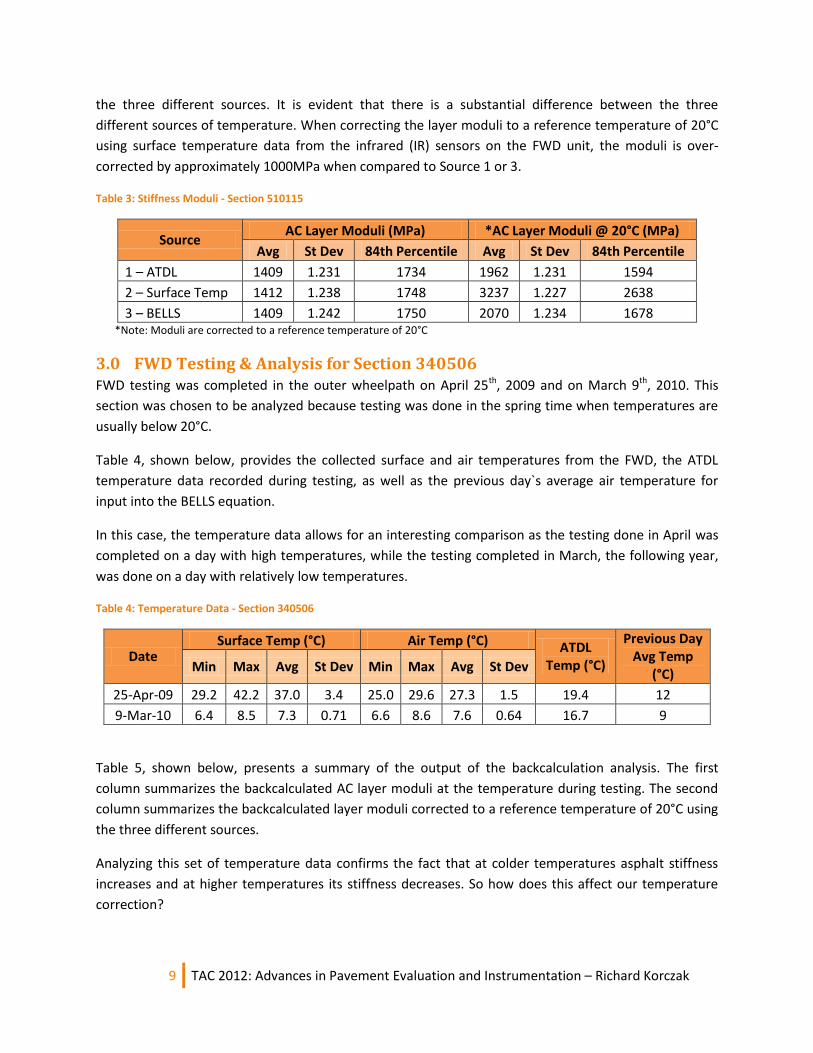
9 TAC 2012: Advances in Pavement Evaluation and Instrumentation – Richard Korczak
the three different sources. It is evident that there is a substantial difference between the three
different sources of temperature. When correcting the layer moduli to a reference temperature of 20°C
using surface temperature data from the infrared (IR) sensors on the FWD unit, the moduli is over-
corrected by approximately 1000MPa when compared to Source 1 or 3.
Table 3: Stiffness Moduli - Section 510115
Source AC Layer Moduli (MPa) *AC Layer Moduli @ 20°C (MPa)
Avg St Dev 84th Percentile Avg St Dev 84th Percentile
1 – ATDL 1409 1.231 1734 1962 1.231 1594
2 – Surface Temp 1412 1.238 1748 3237 1.227 2638
3 – BELLS 1409 1.242 1750 2070 1.234 1678 *Note: Moduli are corrected to a reference temperature of 20°C
3.0 FWD Testing & Analysis for Section 340506 FWD testing was completed in the outer wheelpath on April 25th, 2009 and on March 9th, 2010. This
section was chosen to be analyzed because testing was done in the spring time when temperatures are
usually below 20°C.
Table 4, shown below, provides the collected surface and air temperatures from the FWD, the ATDL
temperature data recorded during testing, as well as the previous day`s average air temperature for
input into the BELLS equation.
In this case, the temperature data allows for an interesting comparison as the testing done in April was
completed on a day with high temperatures, while the testing completed in March, the following year,
was done on a day with relatively low temperatures.
Table 4: Temperature Data - Section 340506
Date Surface Temp (°C) Air Temp (°C) ATDL
Temp (°C)
Previous Day Avg Temp
(°C) Min Max Avg St Dev Min Max Avg St Dev
25-Apr-09 29.2 42.2 37.0 3.4 25.0 29.6 27.3 1.5 19.4 12
9-Mar-10 6.4 8.5 7.3 0.71 6.6 8.6 7.6 0.64 16.7 9
Table 5, shown below, presents a summary of the output of the backcalculation analysis. The first
column summarizes the backcalculated AC layer moduli at the temperature during testing. The second
column summarizes the backcalculated layer moduli corrected to a reference temperature of 20°C using
the three different sources.
Analyzing this set of temperature data confirms the fact that at colder temperatures asphalt stiffness
increases and at higher temperatures its stiffness decreases. So how does this affect our temperature
correction?
10 TAC 2012: Advances in Pavement Evaluation and Instrumentation – Richard Korczak
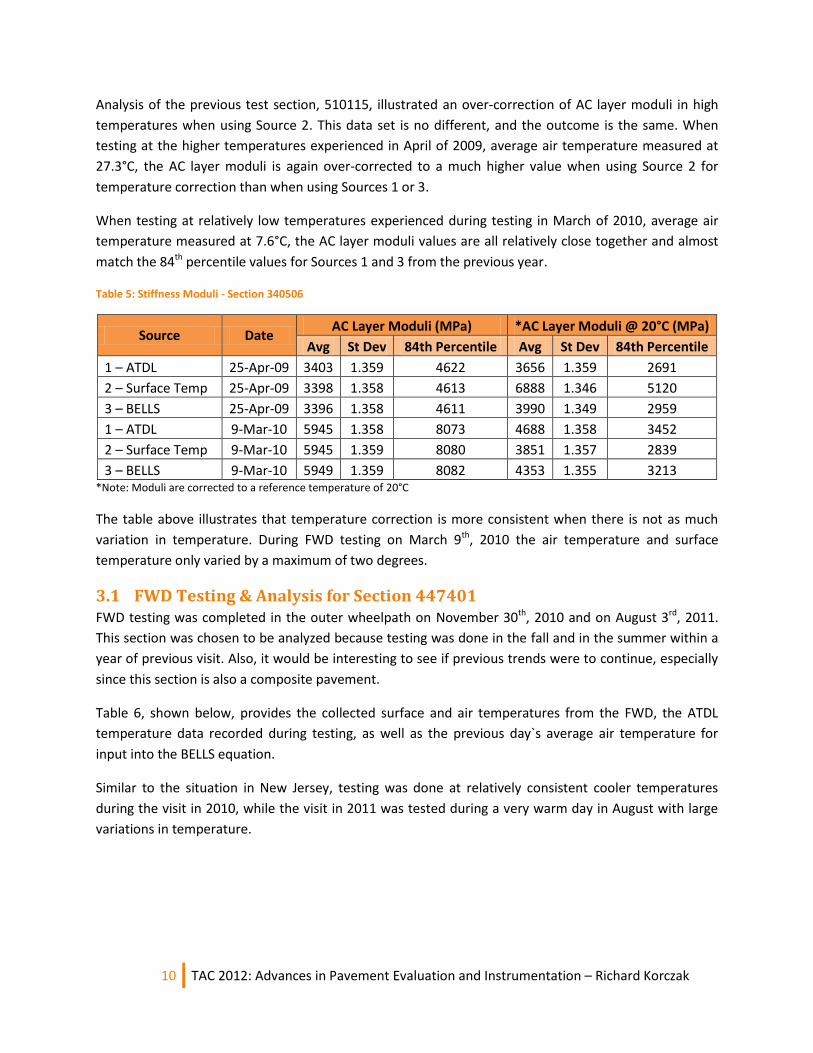
Analysis of the previous test section, 510115, illustrated an over-correction of AC layer moduli in high
temperatures when using Source 2. This data set is no different, and the outcome is the same. When
testing at the higher temperatures experienced in April of 2009, average air temperature measured at
27.3°C, the AC layer moduli is again over-corrected to a much higher value when using Source 2 for
temperature correction than when using Sources 1 or 3.
When testing at relatively low temperatures experienced during testing in March of 2010, average air
temperature measured at 7.6°C, the AC layer moduli values are all relatively close together and almost
match the 84th percentile values for Sources 1 and 3 from the previous year.
Table 5: Stiffness Moduli - Section 340506
Source Date AC Layer Moduli (MPa) *AC Layer Moduli @ 20°C (MPa)
Avg St Dev 84th Percentile Avg St Dev 84th Percentile
1 – ATDL 25-Apr-09 3403 1.359 4622 3656 1.359 2691
2 – Surface Temp 25-Apr-09 3398 1.358 4613 6888 1.346 5120
3 – BELLS 25-Apr-09 3396 1.358 4611 3990 1.349 2959
1 – ATDL 9-Mar-10 5945 1.358 8073 4688 1.358 3452
2 – Surface Temp 9-Mar-10 5945 1.359 8080 3851 1.357 2839
3 – BELLS 9-Mar-10 5949 1.359 8082 4353 1.355 3213 *Note: Moduli are corrected to a reference temperature of 20°C
The table above illustrates that temperature correction is more consistent when there is not as much
variation in temperature. During FWD testing on March 9th, 2010 the air temperature and surface
temperature only varied by a maximum of two degrees.
3.1 FWD Testing & Analysis for Section 447401 FWD testing was completed in the outer wheelpath on November 30th, 2010 and on August 3rd, 2011.
This section was chosen to be analyzed because testing was done in the fall and in the summer within a
year of previous visit. Also, it would be interesting to see if previous trends were to continue, especially
since this section is also a composite pavement.
Table 6, shown below, provides the collected surface and air temperatures from the FWD, the ATDL
temperature data recorded during testing, as well as the previous day`s average air temperature for
input into the BELLS equation.
Similar to the situation in New Jersey, testing was done at relatively consistent cooler temperatures
during the visit in 2010, while the visit in 2011 was tested during a very warm day in August with large
variations in temperature.
11 TAC 2012: Advances in Pavement Evaluation and Instrumentation – Richard Korczak
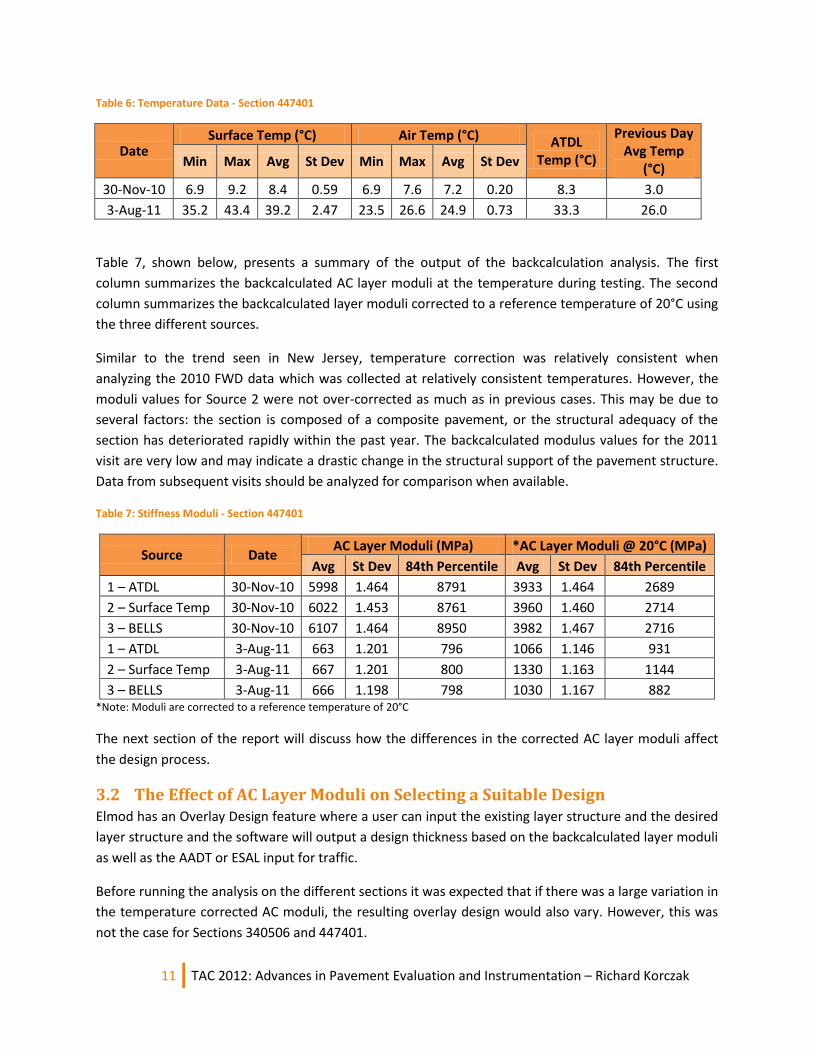
Table 6: Temperature Data - Section 447401
Date Surface Temp (°C) Air Temp (°C) ATDL
Temp (°C)
Previous Day Avg Temp
(°C) Min Max Avg St Dev Min Max Avg St Dev
30-Nov-10 6.9 9.2 8.4 0.59 6.9 7.6 7.2 0.20 8.3 3.0
3-Aug-11 35.2 43.4 39.2 2.47 23.5 26.6 24.9 0.73 33.3 26.0
Table 7, shown below, presents a summary of the output of the backcalculation analysis. The first
column summarizes the backcalculated AC layer moduli at the temperature during testing. The second
column summarizes the backcalculated layer moduli corrected to a reference temperature of 20°C using
the three different sources.
Similar to the trend seen in New Jersey, temperature correction was relatively consistent when
analyzing the 2010 FWD data which was collected at relatively consistent temperatures. However, the
moduli values for Source 2 were not over-corrected as much as in previous cases. This may be due to
several factors: the section is composed of a composite pavement, or the structural adequacy of the
section has deteriorated rapidly within the past year. The backcalculated modulus values for the 2011
visit are very low and may indicate a drastic change in the structural support of the pavement structure.
Data from subsequent visits should be analyzed for comparison when available.
Table 7: Stiffness Moduli - Section 447401
Source Date AC Layer Moduli (MPa) *AC Layer Moduli @ 20°C (MPa)
Avg St Dev 84th Percentile Avg St Dev 84th Percentile
1 – ATDL 30-Nov-10 5998 1.464 8791 3933 1.464 2689
2 – Surface Temp 30-Nov-10 6022 1.453 8761 3960 1.460 2714
3 – BELLS 30-Nov-10 6107 1.464 8950 3982 1.467 2716
1 – ATDL 3-Aug-11 663 1.201 796 1066 1.146 931
2 – Surface Temp 3-Aug-11 667 1.201 800 1330 1.163 1144
3 – BELLS 3-Aug-11 666 1.198 798 1030 1.167 882 *Note: Moduli are corrected to a reference temperature of 20°C
The next section of the report will discuss how the differences in the corrected AC layer moduli affect
the design process.
3.2 The Effect of AC Layer Moduli on Selecting a Suitable Design Elmod has an Overlay Design feature where a user can input the existing layer structure and the desired
layer structure and the software will output a design thickness based on the backcalculated layer moduli
as well as the AADT or ESAL input for traffic.
Before running the analysis on the different sections it was expected that if there was a large variation in
the temperature corrected AC moduli, the resulting overlay design would also vary. However, this was
not the case for Sections 340506 and 447401.

12 TAC 2012: Advances in Pavement Evaluation and Instrumentation – Richard Korczak
The Elmod 6 software uses a mechanistic-empirical based approach when determining the remaining
service life and required overlay thickness.
For purposes of the analyses of the pavement sections, the most important equations and parameters
assumed for the climatic zone and material conditions were as follows:
1. Three seasons (beginning January 1st) were used, where seasons 1, 2 and 3 are 17, 24 and 11
weeks long each, respectively.
2. Seasonal variation of the asphalt concrete modulus is assumed to be sinusoidal.
3. Flexible pavement design fatigue failure criteria (“structural” failure, fatigue cracking in AC):
where: ɛ = Tensile strain at bottom of AC layer (microns)
N = number of load repetitions in millions
E = AC modulus (MPa)
This performance model was used in the development of the Asphalt Institute’s MS-1 Pavement
Design Manual.
4. Permanent deformation on the base and subgrade materials (“functional” failure, roughness
related):
where: = Vertical stress on top of unbound layer (MPa)
N = Number of load repetitions in millions
E = Modulus of material (MPa)
E0 = 160 MPa
C = 1.16 for E < E0
C = 1 for E ≥ E0
This transfer function was derived from an analysis of the WASHO and AASHO road tests and
from CBR designs by J.M. Kirk (Denmark).
5. Poisson’s ratio = 0.35 for all layers
6. Asphalt concrete overlay modulus was assumed to be equal to 3000 MPa at 20°C
7. Assumed design period = 17 years
8. Temperature sensitivity:
The asphalt concrete moduli vary with temperature and in order to compare these it is
necessary to convert the calculated moduli to a reference temperature. As no complete
information was available on the asphalt concrete material and no attempts have been made at
deriving the master curve from repeated testing of representative points at different
13 TAC 2012: Advances in Pavement Evaluation and Instrumentation – Richard Korczak
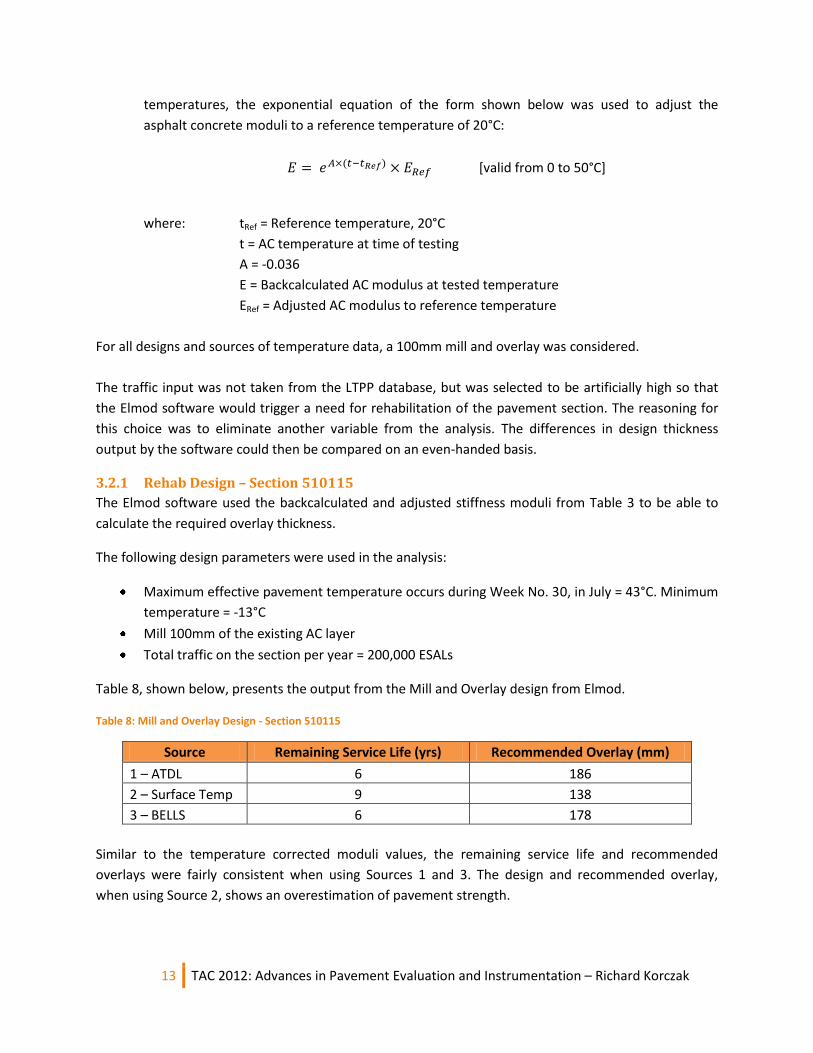
temperatures, the exponential equation of the form shown below was used to adjust the
asphalt concrete moduli to a reference temperature of 20°C:
[valid from 0 to 50°C]
where: tRef = Reference temperature, 20°C
t = AC temperature at time of testing
A = -0.036
E = Backcalculated AC modulus at tested temperature
ERef = Adjusted AC modulus to reference temperature
For all designs and sources of temperature data, a 100mm mill and overlay was considered.
The traffic input was not taken from the LTPP database, but was selected to be artificially high so that
the Elmod software would trigger a need for rehabilitation of the pavement section. The reasoning for
this choice was to eliminate another variable from the analysis. The differences in design thickness
output by the software could then be compared on an even-handed basis.
3.2.1 Rehab Design – Section 510115
The Elmod software used the backcalculated and adjusted stiffness moduli from Table 3 to be able to
calculate the required overlay thickness.
The following design parameters were used in the analysis:
Maximum effective pavement temperature occurs during Week No. 30, in July = 43°C. Minimum
temperature = -13°C
Mill 100mm of the existing AC layer
Total traffic on the section per year = 200,000 ESALs
Table 8, shown below, presents the output from the Mill and Overlay design from Elmod.
Table 8: Mill and Overlay Design - Section 510115
Source Remaining Service Life (yrs) Recommended Overlay (mm)
1 – ATDL 6 186
2 – Surface Temp 9 138
3 – BELLS 6 178
Similar to the temperature corrected moduli values, the remaining service life and recommended
overlays were fairly consistent when using Sources 1 and 3. The design and recommended overlay,
when using Source 2, shows an overestimation of pavement strength.

14 TAC 2012: Advances in Pavement Evaluation and Instrumentation – Richard Korczak
3.2.2 Rehab Design – Section 340506
The Elmod software used the backcalculated and adjusted stiffness moduli from Table 5 to be able to
calculate the required overlay thickness.
The following design parameters were used in the analysis:
Maximum effective pavement temperature occurs during Week No. 29, in July = 45°C. Minimum
temperature = -12°C
Mill 100mm of the existing AC layer
Total traffic on the section per year = 5 million ESALs
Table 9, shown below, presents the output from the Mill and Overlay design from Elmod.
Table 9: Mill and Overlay Design - Section 340506
Source Date Remaining
Service Life (yrs) Recommended Overlay (mm)
1 – ATDL 25-Apr-09 4 144
2 – Surface Temp 25-Apr-09 5 135
3 – BELLS 25-Apr-09 4 143
1 – ATDL 9-Mar-10 7 95
2 – Surface Temp 9-Mar-10 6 99
3 – BELLS 9-Mar-10 6 94
The results shown above were unexpected. The remaining service lives and recommended overlays are
consistent when comparing the different sources. However, the results are inconsistent between the
two test dates. It appears as though the section has gained strength between 2009 and 2010. However,
it is highly unlikely that any rehabilitation was performed between the two visits. There is a possibility
that the pavement structure in 2009 was weaker because of excess moisture in the subgrade caused by
the spring thaw. This cannot be confirmed without additional data or a geotechnical investigation.
3.2.3 Rehab Design – Section 447401
The Elmod software used the backcalculated and adjusted stiffness moduli from Table 7 to be able to
calculate the required overlay thickness.
The following design parameters were used in the analysis:
Maximum effective pavement temperature occurs during Week No. 29, in July = 46°C. Minimum
temperature = -16°C
Mill 100mm of the existing AC layer
Total traffic on the section per year = 250,000 ESALs
Table 10, shown below, presents the output from the Mill and Overlay design from Elmod.
15 TAC 2012: Advances in Pavement Evaluation and Instrumentation – Richard Korczak
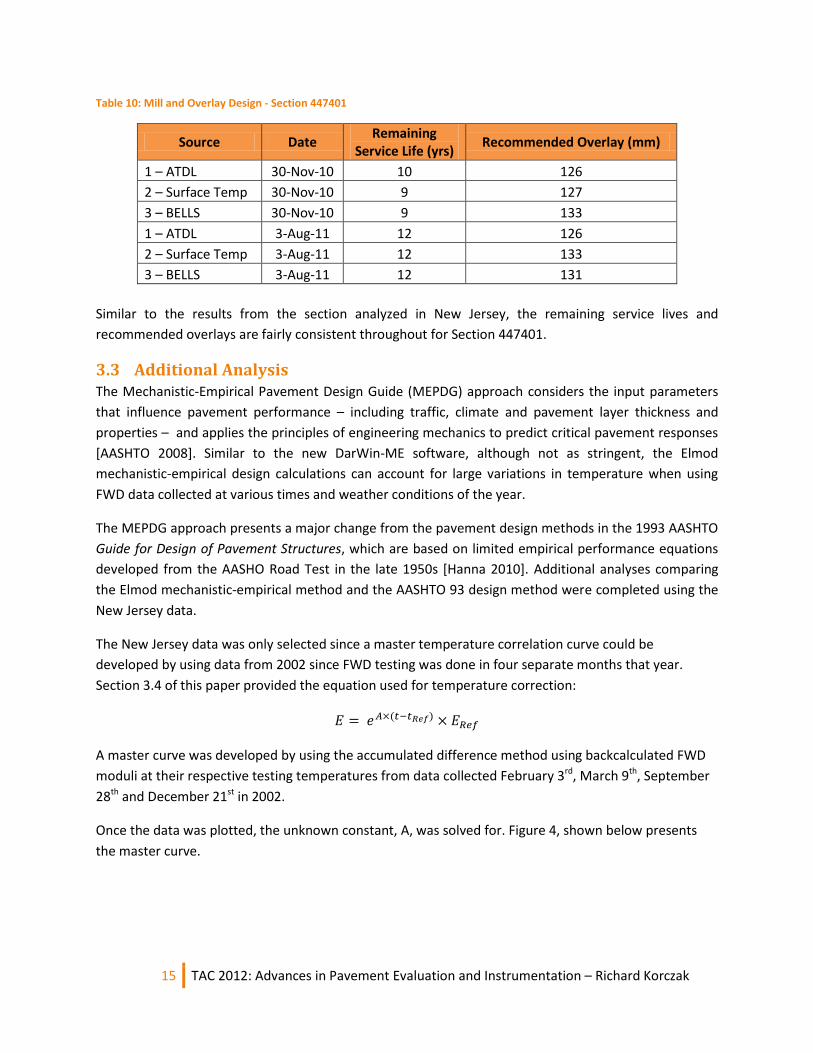
Table 10: Mill and Overlay Design - Section 447401
Source Date Remaining
Service Life (yrs) Recommended Overlay (mm)
1 – ATDL 30-Nov-10 10 126
2 – Surface Temp 30-Nov-10 9 127
3 – BELLS 30-Nov-10 9 133
1 – ATDL 3-Aug-11 12 126
2 – Surface Temp 3-Aug-11 12 133
3 – BELLS 3-Aug-11 12 131
Similar to the results from the section analyzed in New Jersey, the remaining service lives and
recommended overlays are fairly consistent throughout for Section 447401.
3.3 Additional Analysis The Mechanistic-Empirical Pavement Design Guide (MEPDG) approach considers the input parameters
that influence pavement performance – including traffic, climate and pavement layer thickness and
properties – and applies the principles of engineering mechanics to predict critical pavement responses
[AASHTO 2008]. Similar to the new DarWin-ME software, although not as stringent, the Elmod
mechanistic-empirical design calculations can account for large variations in temperature when using
FWD data collected at various times and weather conditions of the year.
The MEPDG approach presents a major change from the pavement design methods in the 1993 AASHTO
Guide for Design of Pavement Structures, which are based on limited empirical performance equations
developed from the AASHO Road Test in the late 1950s [Hanna 2010]. Additional analyses comparing
the Elmod mechanistic-empirical method and the AASHTO 93 design method were completed using the
New Jersey data.
The New Jersey data was only selected since a master temperature correlation curve could be
developed by using data from 2002 since FWD testing was done in four separate months that year.
Section 3.4 of this paper provided the equation used for temperature correction:
A master curve was developed by using the accumulated difference method using backcalculated FWD
moduli at their respective testing temperatures from data collected February 3rd, March 9th, September
28th and December 21st in 2002.
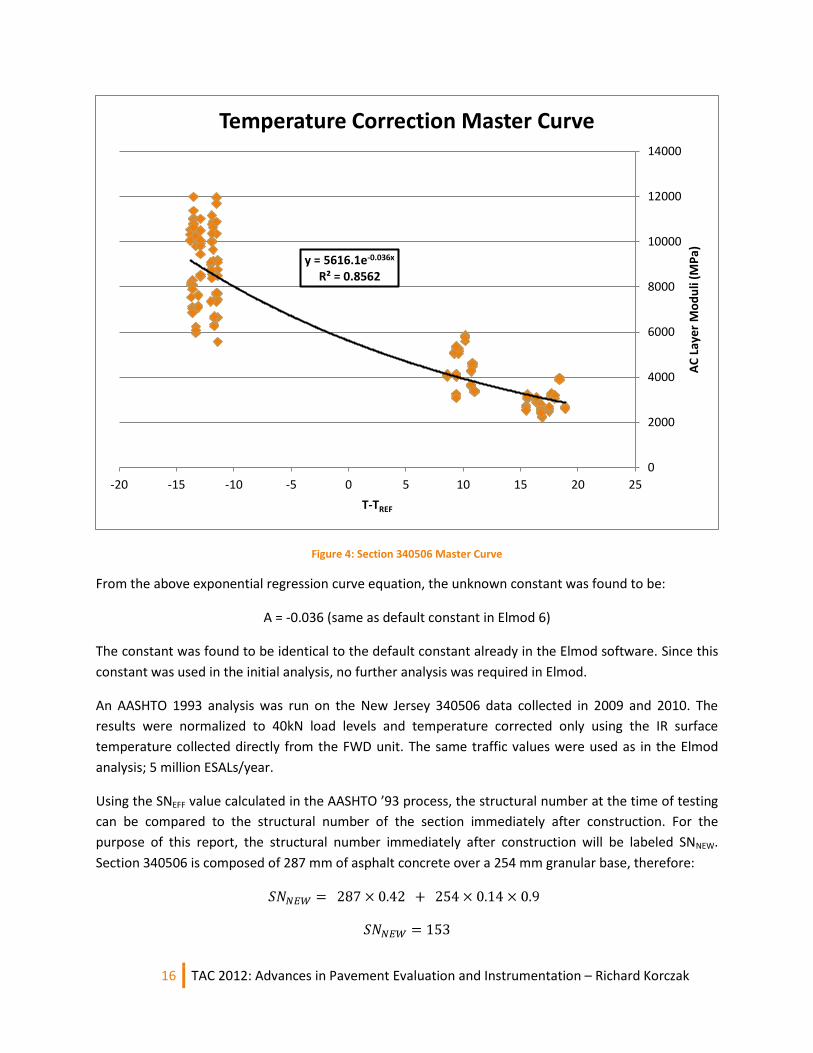
Once the data was plotted, the unknown constant, A, was solved for. Figure 4, shown below presents
the master curve.
16 TAC 2012: Advances in Pavement Evaluation and Instrumentation – Richard Korczak
Figure 4: Section 340506 Master Curve
From the above exponential regression curve equation, the unknown constant was found to be:
A = -0.036 (same as default constant in Elmod 6)
The constant was found to be identical to the default constant already in the Elmod software. Since this
constant was used in the initial analysis, no further analysis was required in Elmod.
An AASHTO 1993 analysis was run on the New Jersey 340506 data collected in 2009 and 2010. The
results were normalized to 40kN load levels and temperature corrected only using the IR surface
temperature collected directly from the FWD unit. The same traffic values were used as in the Elmod
analysis; 5 million ESALs/year.
Using the SNEFF value calculated in the AASHTO ’93 process, the structural number at the time of testing
can be compared to the structural number of the section immediately after construction. For the
purpose of this report, the structural number immediately after construction will be labeled SNNEW.
Section 340506 is composed of 287 mm of asphalt concrete over a 254 mm granular base, therefore:
y = 5616.1e-0.036x R² = 0.8562
0
2000
4000
6000
8000
10000
12000
14000
-20 -15 -10 -5 0 5 10 15 20 25
AC
Lay
er
Mo
du
li (M
Pa)
T-TREF
Temperature Correction Master Curve
17 TAC 2012: Advances in Pavement Evaluation and Instrumentation – Richard Korczak
The following parameters were used in the AASHTO 93 analysis:
Initial Serviceability – 4.2
Terminal Serviceability – 2.2
Reliability (%) – 95
Overall Standard Deviation – 0.44
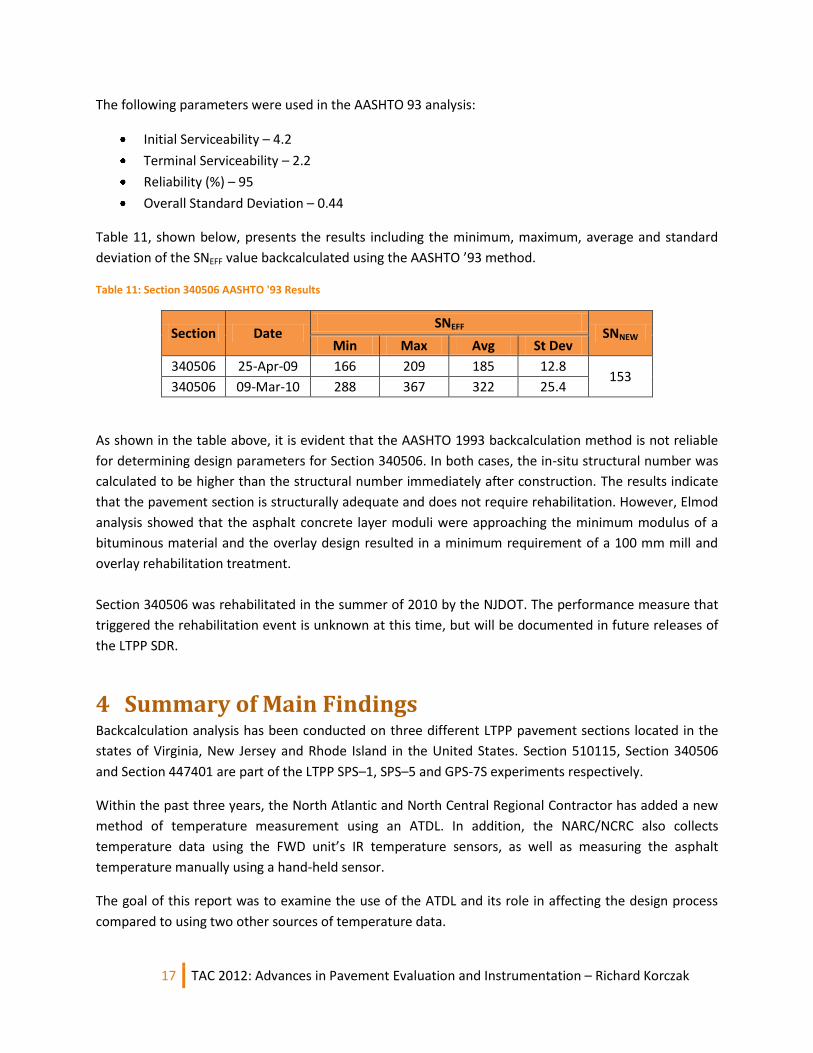
Table 11, shown below, presents the results including the minimum, maximum, average and standard
deviation of the SNEFF value backcalculated using the AASHTO ’93 method.
Table 11: Section 340506 AASHTO '93 Results
Section Date SNEFF
SNNEW Min Max Avg St Dev
340506 25-Apr-09 166 209 185 12.8 153
340506 09-Mar-10 288 367 322 25.4
As shown in the table above, it is evident that the AASHTO 1993 backcalculation method is not reliable
for determining design parameters for Section 340506. In both cases, the in-situ structural number was
calculated to be higher than the structural number immediately after construction. The results indicate
that the pavement section is structurally adequate and does not require rehabilitation. However, Elmod
analysis showed that the asphalt concrete layer moduli were approaching the minimum modulus of a
bituminous material and the overlay design resulted in a minimum requirement of a 100 mm mill and
overlay rehabilitation treatment.
Section 340506 was rehabilitated in the summer of 2010 by the NJDOT. The performance measure that
triggered the rehabilitation event is unknown at this time, but will be documented in future releases of
the LTPP SDR.
4 Summary of Main Findings Backcalculation analysis has been conducted on three different LTPP pavement sections located in the
states of Virginia, New Jersey and Rhode Island in the United States. Section 510115, Section 340506
and Section 447401 are part of the LTPP SPS–1, SPS–5 and GPS-7S experiments respectively.
Within the past three years, the North Atlantic and North Central Regional Contractor has added a new
method of temperature measurement using an ATDL. In addition, the NARC/NCRC also collects
temperature data using the FWD unit’s IR temperature sensors, as well as measuring the asphalt
temperature manually using a hand-held sensor.
The goal of this report was to examine the use of the ATDL and its role in affecting the design process
compared to using two other sources of temperature data.

18 TAC 2012: Advances in Pavement Evaluation and Instrumentation – Richard Korczak
In general, the temperature corrected moduli using Sources 1 and 3 were relatively close in every case.
All three sources were consistent only when FWD testing was done in the spring or fall when
temperatures are cooler and when the surface temperature is close to the air temperature during
testing.
1.1 Section 510115 A backcalculation analysis was completed using FWD data from July 15th, 2010 from LTPP test section
510115 located on the SR-29 Expressway near Danville, Virginia. Air temperature during testing was
approximately 30°C, with surface temperatures ranging from 40°C to 45°C.
An overlay design was conducted using the different temperature sources, Source 1, 2 and 3. The Elmod
software used the adjusted backcalculated layer moduli to calculate the required overlay design
thickness.
Source 1 – Average AC layer modulus (adjusted to 20°C) = 1962 MPa, 186 mm overlay
Source 2 – Average AC layer modulus (adjusted to 20°C) = 3237 MPa, 138 mm overlay
Source 3 – Average AC layer modulus (adjusted to 20°C) = 2070 MPa, 178 mm overlay
4.0 Section 340506 A backcalculation analysis was completed using FWD data from April 25th, 2009 and March 9th, 2010
from LTPP test section 340506 located on the westbound lanes of I-195 near Upper Freehold, New
Jersey. Air temperature during testing was approximately 29°C in April 2009 and 8°C in March 2010, with
surface temperatures ranging from 29°C to 42°C and 6°C to 9°C respectively.
An overlay design was conducted using the different temperature sources, Source 1, 2 and 3. The Elmod
software used the adjusted backcalculated layer moduli to calculate the required overlay design
thickness.
April 2009:
Source 1 – Average AC layer modulus (adjusted to 20°C) = 3656 MPa, 144 mm overlay
Source 2 – Average AC layer modulus (adjusted to 20°C) = 6888 MPa, 135 mm overlay
Source 3 – Average AC layer modulus (adjusted to 20°C) = 3990 MPa, 143 mm overlay
March 2010:
Source 1 – Average AC layer modulus (adjusted to 20°C) = 4688 MPa, 95 mm overlay
Source 2 – Average AC layer modulus (adjusted to 20°C) = 3851 MPa, 99 mm overlay
Source 3 – Average AC layer modulus (adjusted to 20°C) = 4353 MPa, 94 mm overlay
The master temperature correction curve was plotted using FWD data collected in 2002 and the ‘A’
coefficient was found to be equal to -0.036, which is the same as the value that Elmod uses by default
for any design calculations.
19 TAC 2012: Advances in Pavement Evaluation and Instrumentation – Richard Korczak
4.1 Section 447401 A backcalculation analysis was completed using FWD data from November 30th, 2010 and August 3rd,
2011 from LTPP test section 447401 located on the northbound lanes of the N Smithfield Expressway
near Providence, Rhode Island. Air temperature during testing was approximately 7°C in November 2010
and 26°C in August 2011, with surface temperatures ranging from 6°C to 9°C and 35°C to 43°C
respectively.
An overlay design was conducted using the different temperature sources, Source 1, 2 and 3. The Elmod
software used the adjusted backcalculated layer moduli to calculate the required overlay design
thickness.
November 2010:
Source 1 – Average AC layer modulus (adjusted to 20°C) = 3933 MPa, 126 mm overlay
Source 2 – Average AC layer modulus (adjusted to 20°C) = 3960 MPa, 127 mm overlay
Source 3 – Average AC layer modulus (adjusted to 20°C) = 3982 MPa, 133 mm overlay
August 2011:
Source 1 – Average AC layer modulus (adjusted to 20°C) = 1066 MPa, 126 mm overlay
Source 2 – Average AC layer modulus (adjusted to 20°C) = 1330 MPa, 133 mm overlay
Source 3 – Average AC layer modulus (adjusted to 20°C) = 1030 MPa, 131 mm overlay
5 Conclusions In December of 2009, the FHWA published an article in their monthly publication, known as Focus,
regarding their vision on strategic, safe and sustainable pavements [FHWA 2009]. The FHWA outlined six
focus areas to help achieve the high-performing, safe and cost-effective pavement network that the
traveling public and the Nation’s economy depends on every day:
1. Pavement design and analysis
2. Pavement materials and construction technology
3. Pavement management and preservation
4. Pavement surface characteristics
5. Construction and materials quality assurance
6. Environment stewardship
The MEPDG, developed under the National Cooperative Highway Research Program (NCHRP) Project 1-
37A, “provides a uniform basis for the design of flexible, rigid and composite pavements, using
mechanistic-empirical approaches that more realistically characterize in-service pavements and improve
the reliability of designs” [FHWA 2009].
Overall, this paper shows that the differences in temperature corrected moduli can be significant and
depending on the design analysis chosen, can cause either underestimation or overestimation of

20 TAC 2012: Advances in Pavement Evaluation and Instrumentation – Richard Korczak
pavement strength as a result. However, when using a mechanistic-empirical based approach to the
design, the quality of temperature data can be compensated for with a properly developed seasonal
temperature model.
In the past five years, North America has been challenged by difficult financial times. As Federal,
Provincial and Municipal governments cut annual infrastructure budgets, and as natural resources
continue to increase in price and supplies become more limited, agencies must find new ways in
maintaining the level of service of our infrastructure at an acceptable level.
The adoption of mechanistic-empirical design methods by agencies throughout North America will aid in
effectively managing pavement networks and improving sustainability by providing more reliable
pavement designs. As discussed in section 3.3, the AASHTO 1993 analysis provided results that indicated
that the pavement section could be in service for another 15+ years without any rehabilitation.
However, the Elmod mechanistic-empirical analysis indicated that the pavement section would need to
be rehabilitated within the next 5 to 7 years. Trusting the AASHTO 1993 analysis, an agency could allow
the pavement to degrade in quality until a reconstruction would be needed. This would be a significant
misuse of funds and could be compounded when extrapolated to the rest of the pavement network. For
this reason, a mechanistic-empirical design approach could potentially save an agency millions of dollars
every year.
21 TAC 2012: Advances in Pavement Evaluation and Instrumentation – Richard Korczak
6 References [FHWA 2000] FHWA, “Temperature Predictions and Adjustment Factors for Asphalt
Pavement.” Federal Highway Administration, McLean, Virginia, 2000.
[FHWA 2003] FHWA, “LTPP Temperature Prediction and Correction Guide.” Federal Highway
Administration, McLean, Virginia, 2003.
[ASTM 2006] ASTM Standard D7228 – 06a, 2006, “Standard Test Method for Prediction of
Asphalt-Bound Pavement Layer Temperatures.”, American Society for Testing
and Materials (ASTM) International, West Conshohocken, PA, 2006, DOI:
10.1520/D7228-06A, www.astm.org.
[FHWA 2006] FHWA, “Long-Term Pavement Performance Program Manual for Falling Weight
Deflectometer Measurements.” Federal Highway Administration, McLean,
Virginia, December 2006.
[FHWA 2008] Long-Term Pavement Performance (LTPP) Program, “FWD Temperature Monitor
User Manual.” Federal Highway Administration (FHWA), Washington, DC, 2008.
[AASHTO 2008] “Mechanistic-Empirical Pavement Design Guide: A Manual of Practice”.
American Association of State Highway and Transportation Officials (AASHTO),
Washington, D.C., July 2008.
[FHWA 2009] Stephanos, Peter, “Strategic, Safe and Sustainable: Today’s Vision for
Pavements”, Federal Highway Administration, McLean, Virginia, December
2009.
[FHWA 2010a] FHWA, “Long-Term Pavement Performance Program Highlights:
Accomplishments and Benefits 1989-2009.” Federal Highway Administration,
McLean, Virginia, 2010.
[FHWA 2010b] Federal Highway Administration (FHWA). “LTPP Information Management
System – IMS Quality Control Checks.” Federal Highway Administration,
McLean, Virginia, 2010.
[FHWA 2010c] LTPP, Standard Data Release (SDR) 25.0. Federal Highway Administration,
McLean, Virginia, January 2010.
[Dynatest 2010] Dynatest, “Elmod 6 Training Manual.” Gabriel Bazi, 2010.
[Hanna 2010] Hanna, Amir, “Developing the Mechanistic-Empirical Pavement Design Guide”.
Transportation Research Board (TRB), 2010.
[FHWA 2011] FHWA, “Specific Pavement Studies.” Turner-Fairbank Highway Research Center
(TFHRC), McLean, Virginia, 2011.

22 TAC 2012: Advances in Pavement Evaluation and Instrumentation – Richard Korczak
[Wunderground 2012] Weather Underground, Source of historic weather data, 17 March 2012.
http://www.wunderground.com/
[Tighe 2012] Tighe, Susan “2012 Pavement Design and Management Guide”, Transportation
Association of Canada, 2012.