Embed Size (px)
Citation preview
This material was prepared by TMF Health Quality Institute under contract with the Centers for Medicare & Medicaid Services (CMS), an agency of the U.S. Department of Health and Human Services. Any statements expressed by the individual and resources cited in this publication are not an opinion of, nor endorsement by, TMF or CMS.
Risk Adjustment
Patrick Gordon, RMHP
Melanie Maddocks, Leif Associates
Practice Transformation CPC Learning Collaborative
April 29, 2016
Background • CPC involves multiple payers, various lines of business (Medicare,
Medicaid FFS, Medicaid RCCO, Commercial HMO, Commercial PPO, etc.), 72 practices, 360 providers, and over 450,000 patients. Payers in Colorado include CMS, Colorado HCPF, RMHP, Aetna, Anthem, Cigna, Colorado Access, Colorado Choice, Humana, United Healthcare. 1
• CMS allows payers flexibility in paying CPC practices in terms of amount, timing, and methodology.
• Risk Adjustment is a fundamental component of how RMHP pays monthly care management fees, evaluates performance, and determines distribution of shared savings. This presentation represents only RMHP’s current approach to risk adjustment, specific to CPC.
1 CMS, retrieved from https://innovation.cms.gov/initiatives/Comprehensive-Primary-Care-Initiative/Colorado.html on 3/27/16

Claims Based Risk Adjustment – Two Steps
Source: Society of Actuaries, Uncertainty in Risk Adjustment, September 2012
Risk Assessment
Measures the relative health of each individual in a population using data elements from standard healthcare claims.
Risk Adjustment
Compares the average risk assessment of individuals enrolled with two or more entities in order to adjust payments or premiums.
Step Two Step One
Risk Assessment
Risk Assessment assigns a score to each individual
reflecting their predicted overall medical claim
dollars relative to the claim dollars for an average risk
person.
Many claims based models are available for risk assessment.
CMS - HCC HHS - HCC UCSD - CDPS Wakely - WRA 3M - CRG Optum - Impact Pro Milliman - MARA More
RMHP CPC Risk Assessment • Back in 2012, RMHP and Leif Associates evaluated the
implications to CPC care management fees by using the following 3 risk assessment models: CMS-HCC (in part or in full), CDPS (in part), Wakely (in part).
• For several reasons, CMS-HCC was selected by RMHP to be used across the board as a starting point for risk assessment in calculating the monthly care management fees.
• RMHP still uses the base CMS-HCC risk assessment, with updates implemented in January of each year. Currently the 2014 model (v22) is the source of RMHP scoring.
CMS-HCC
HCC
stands for Hierarchical Condition Category
The HCC model is used by CMS for determining the risk of each of their Medicare Advantage members in order to adjust capitation payments to insurers. The intent is to pay the insurers with predictively healthier members less on a PMPM basis than those with less healthy members.
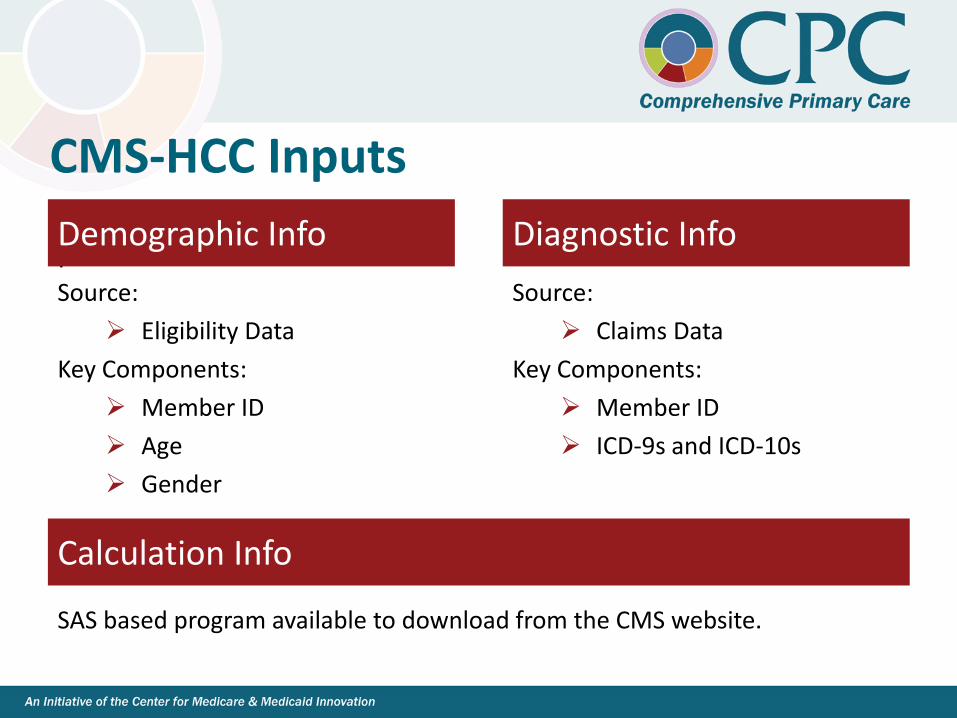
CMS-HCC Inputs
:
Source:
Eligibility Data
Key Components:
Member ID
Age
Gender
SAS based program available to download from the CMS website.
Source:
Claims Data
Key Components:
Member ID
ICD-9s and ICD-10s
Diagnostic Info Demographic Info
Calculation Info
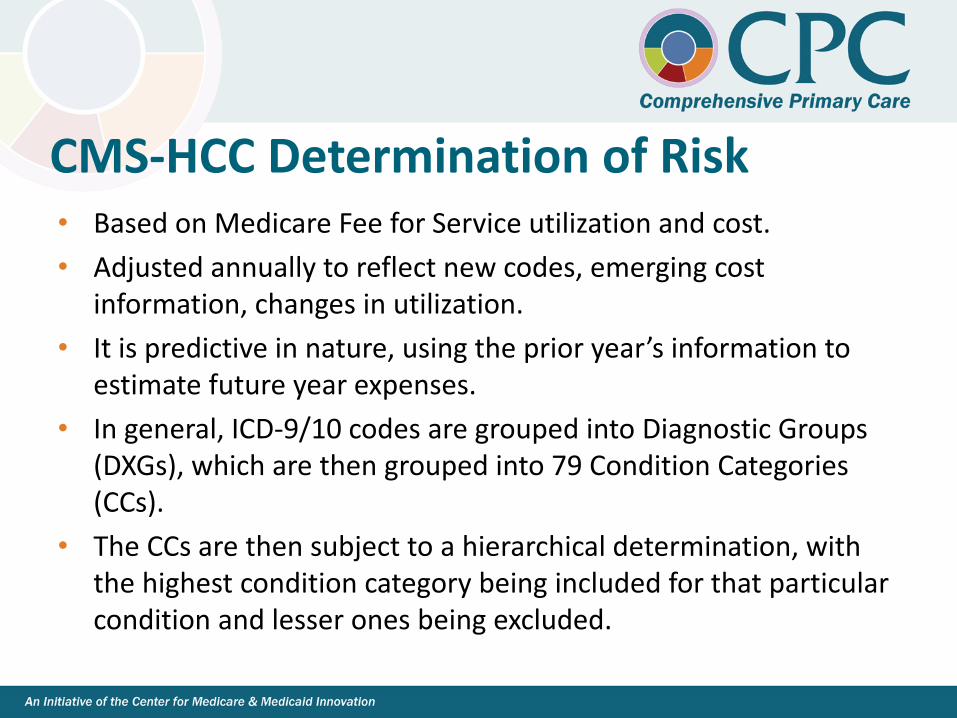
CMS-HCC Determination of Risk • Based on Medicare Fee for Service utilization and cost.
• Adjusted annually to reflect new codes, emerging cost information, changes in utilization.
• It is predictive in nature, using the prior year’s information to estimate future year expenses.
• In general, ICD-9/10 codes are grouped into Diagnostic Groups (DXGs), which are then grouped into 79 Condition Categories (CCs).
• The CCs are then subject to a hierarchical determination, with the highest condition category being included for that particular condition and lesser ones being excluded.
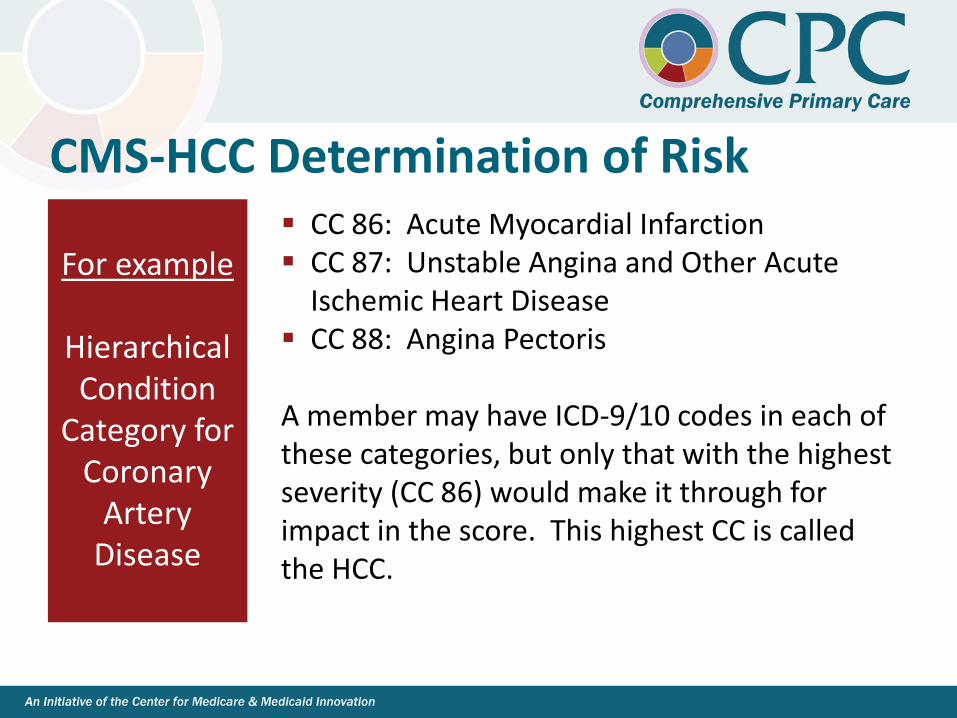
CMS-HCC Determination of Risk
For example
Hierarchical Condition
Category for Coronary
Artery Disease
CC 86: Acute Myocardial Infarction CC 87: Unstable Angina and Other Acute
Ischemic Heart Disease CC 88: Angina Pectoris A member may have ICD-9/10 codes in each of these categories, but only that with the highest severity (CC 86) would make it through for impact in the score. This highest CC is called the HCC.
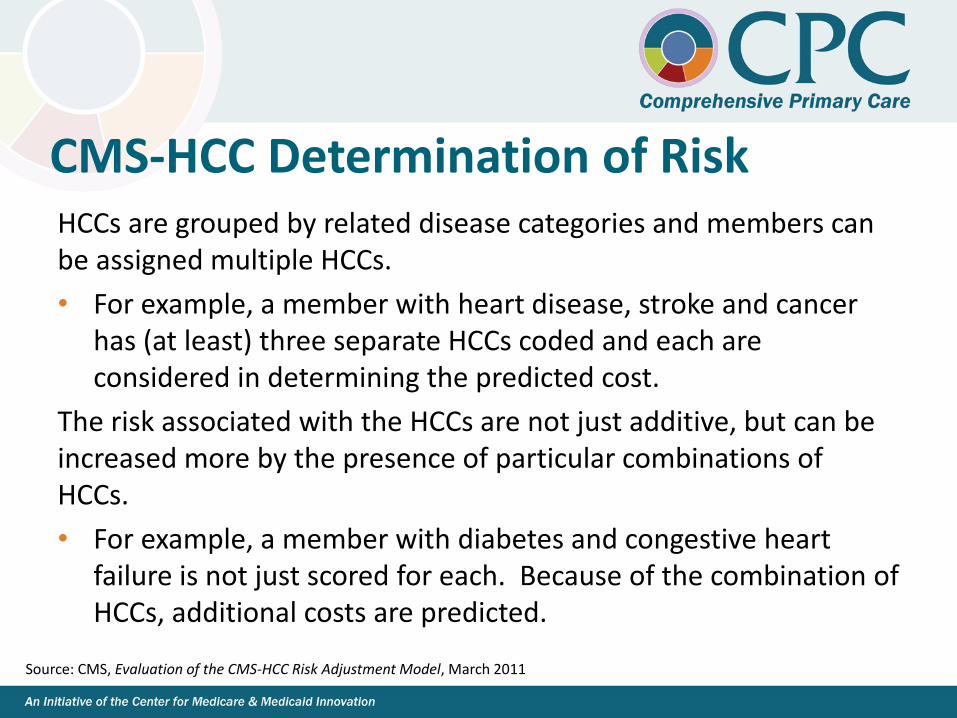
CMS-HCC Determination of Risk HCCs are grouped by related disease categories and members can be assigned multiple HCCs.
• For example, a member with heart disease, stroke and cancer has (at least) three separate HCCs coded and each are considered in determining the predicted cost.
The risk associated with the HCCs are not just additive, but can be increased more by the presence of particular combinations of HCCs.
• For example, a member with diabetes and congestive heart failure is not just scored for each. Because of the combination of HCCs, additional costs are predicted.
Source: CMS, Evaluation of the CMS-HCC Risk Adjustment Model, March 2011
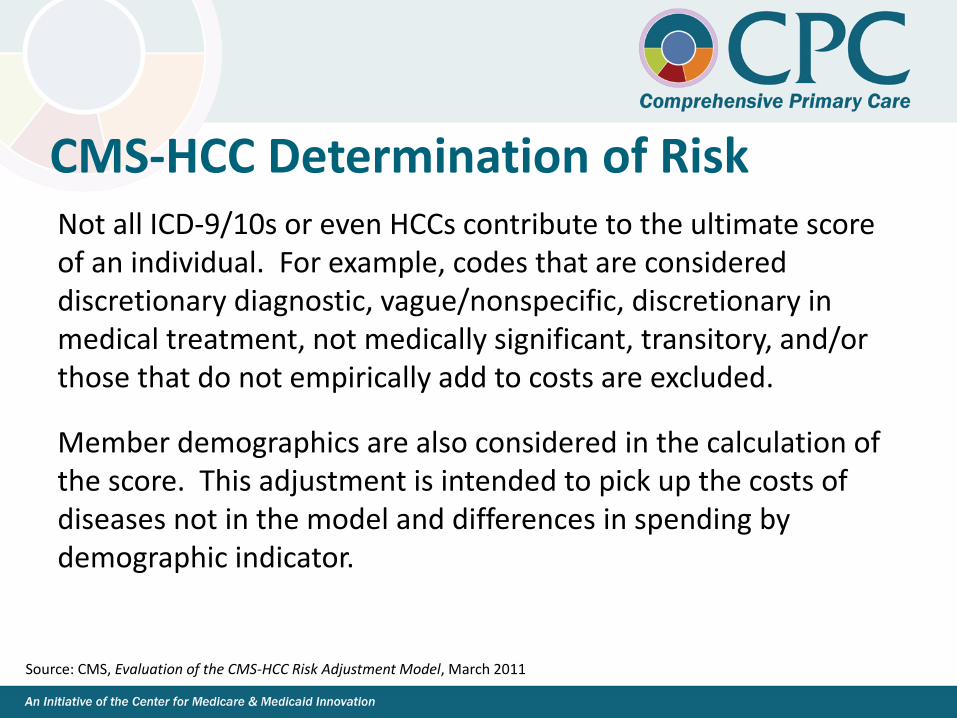
CMS-HCC Determination of Risk Not all ICD-9/10s or even HCCs contribute to the ultimate score of an individual. For example, codes that are considered discretionary diagnostic, vague/nonspecific, discretionary in medical treatment, not medically significant, transitory, and/or those that do not empirically add to costs are excluded.
Member demographics are also considered in the calculation of the score. This adjustment is intended to pick up the costs of diseases not in the model and differences in spending by demographic indicator.
Source: CMS, Evaluation of the CMS-HCC Risk Adjustment Model, March 2011
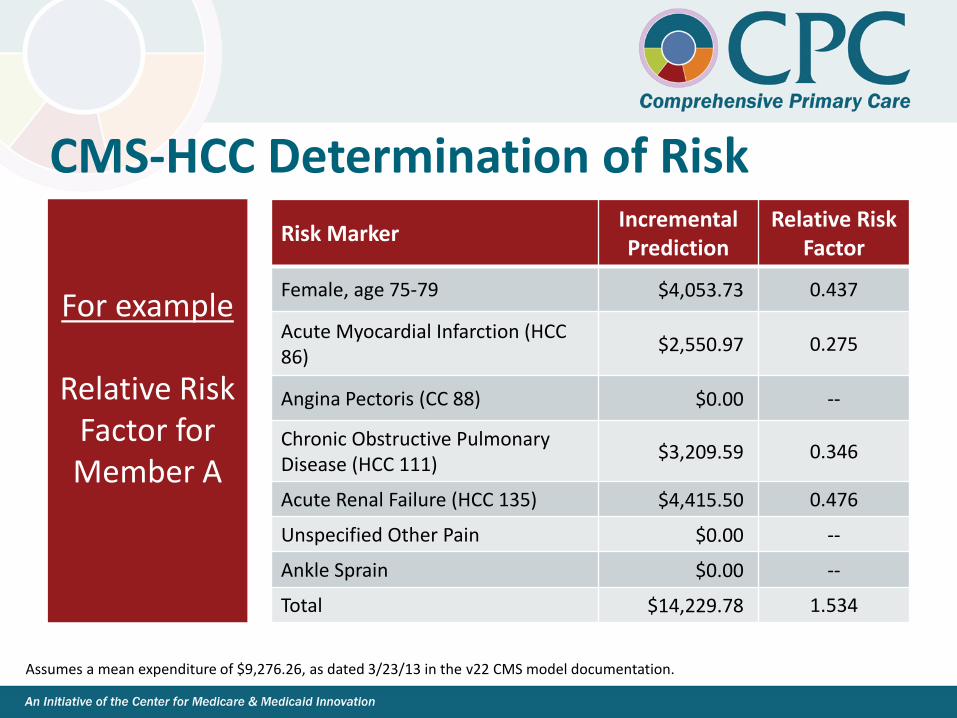
CMS-HCC Determination of Risk
For example
Relative Risk
Factor for Member A
Risk Marker Incremental Prediction
Relative Risk Factor
Female, age 75-79 $4,053.73 0.437
Acute Myocardial Infarction (HCC 86)
$2,550.97 0.275
Angina Pectoris (CC 88) $0.00 --
Chronic Obstructive Pulmonary Disease (HCC 111)
$3,209.59 0.346
Acute Renal Failure (HCC 135) $4,415.50 0.476
Unspecified Other Pain $0.00 --
Ankle Sprain $0.00 --
Total $14,229.78 1.534
Assumes a mean expenditure of $9,276.26, as dated 3/23/13 in the v22 CMS model documentation.
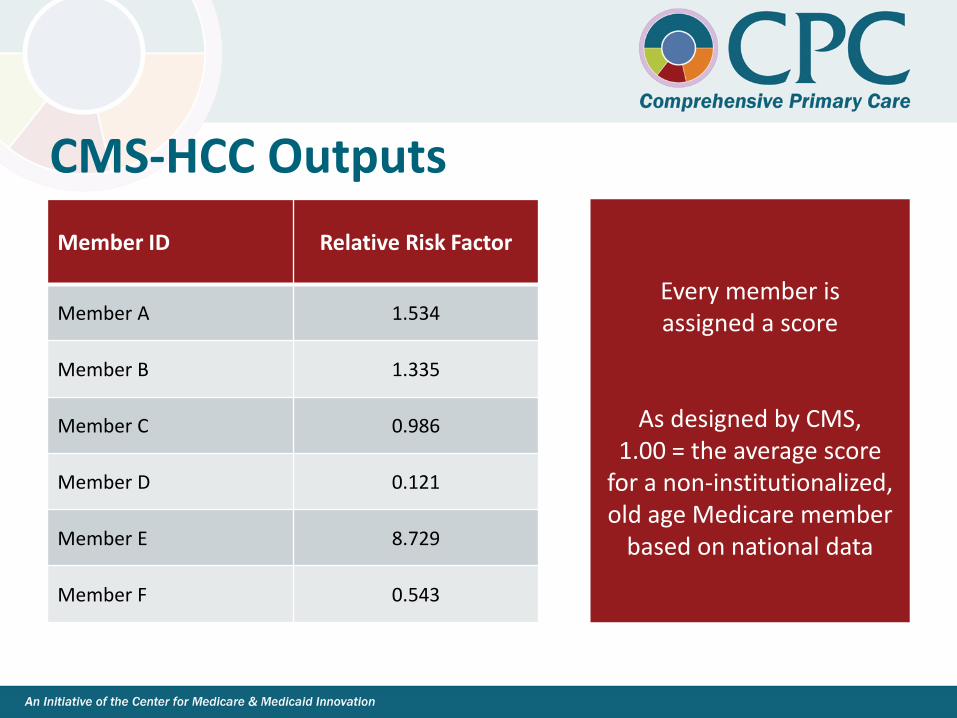
CMS-HCC Outputs
Every member is assigned a score
As designed by CMS, 1.00 = the average score
for a non-institutionalized, old age Medicare member
based on national data
Member ID Relative Risk Factor
Member A 1.534
Member B 1.335
Member C 0.986
Member D 0.121
Member E 8.729
Member F 0.543
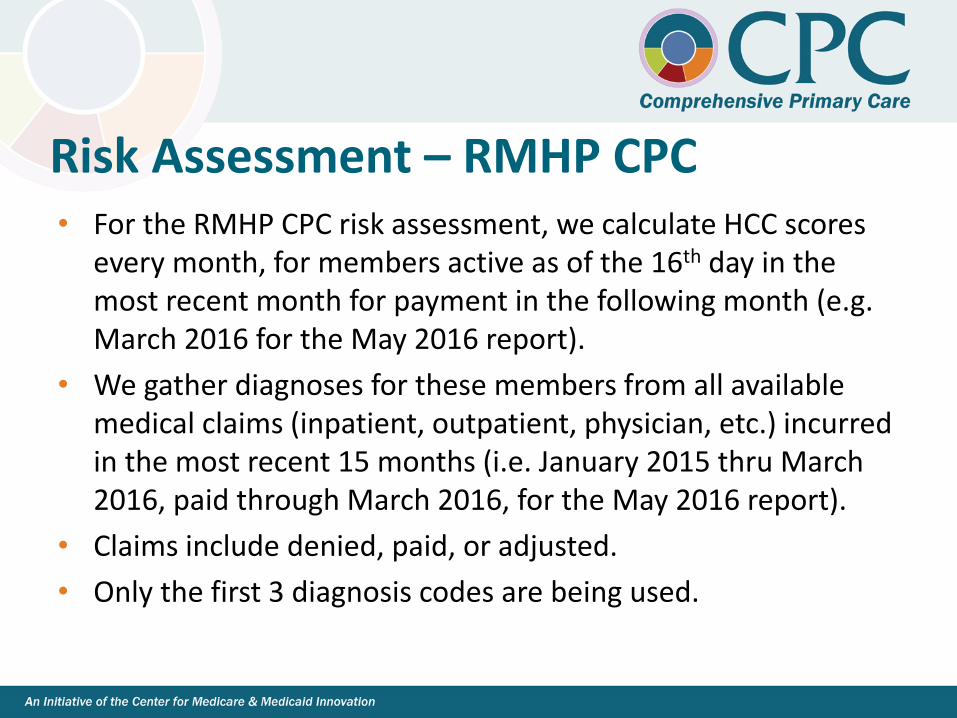
Risk Assessment – RMHP CPC • For the RMHP CPC risk assessment, we calculate HCC scores
every month, for members active as of the 16th day in the most recent month for payment in the following month (e.g. March 2016 for the May 2016 report).
• We gather diagnoses for these members from all available medical claims (inpatient, outpatient, physician, etc.) incurred in the most recent 15 months (i.e. January 2015 thru March 2016, paid through March 2016, for the May 2016 report).
• Claims include denied, paid, or adjusted.
• Only the first 3 diagnosis codes are being used.
Risk Assessment – RMHP CPC
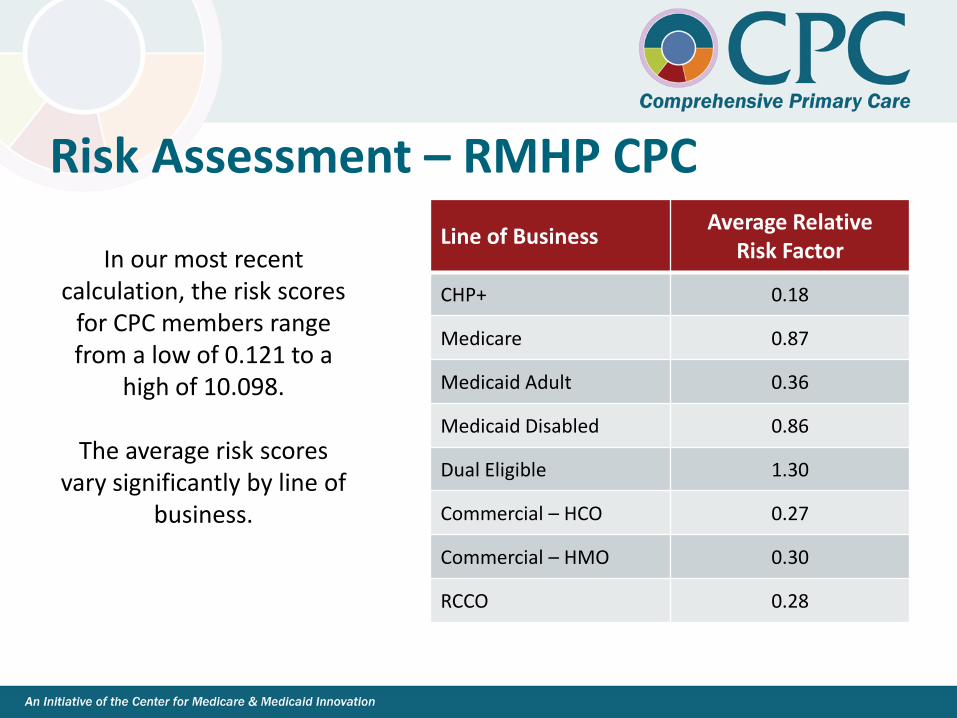
In our most recent calculation, the risk scores
for CPC members range from a low of 0.121 to a
high of 10.098.
The average risk scores vary significantly by line of
business.
Line of Business Average Relative
Risk Factor
CHP+ 0.18
Medicare 0.87
Medicaid Adult 0.36
Medicaid Disabled 0.86
Dual Eligible 1.30
Commercial – HCO 0.27
Commercial – HMO 0.30
RCCO 0.28
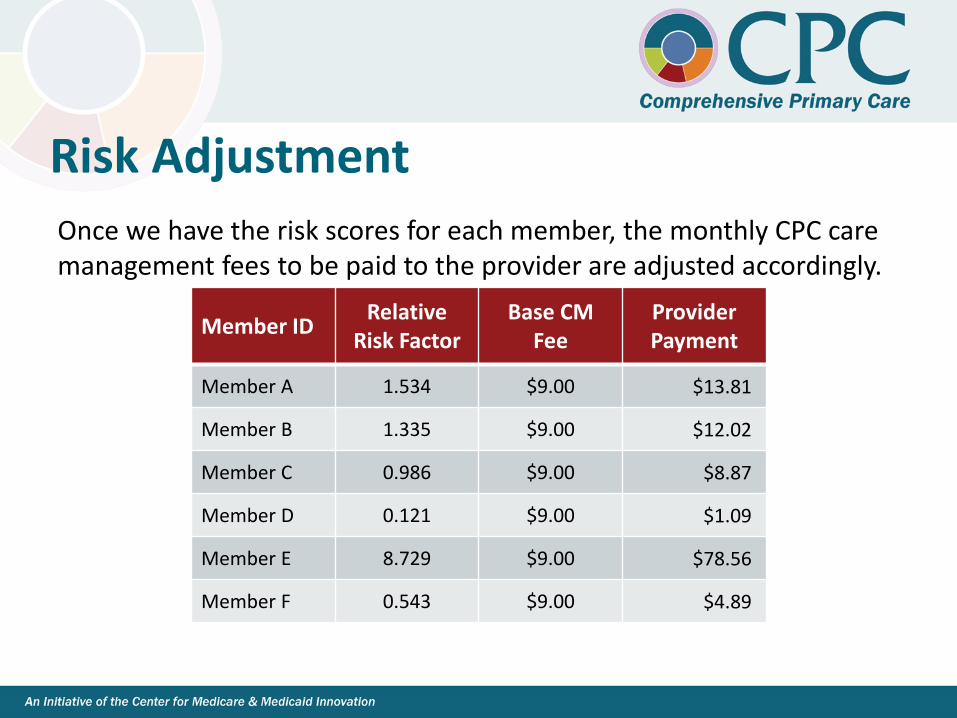
Risk Adjustment Once we have the risk scores for each member, the monthly CPC care management fees to be paid to the provider are adjusted accordingly.
Member ID Relative
Risk Factor Base CM
Fee Provider Payment
Member A 1.534 $9.00 $13.81
Member B 1.335 $9.00 $12.02
Member C 0.986 $9.00 $8.87
Member D 0.121 $9.00 $1.09
Member E 8.729 $9.00 $78.56
Member F 0.543 $9.00 $4.89
Risk Adjustment • This means that the amount a particular practice and/or provider will
be paid by RMHP will vary significantly based on their actual mix of members.
• For example, a practice with more Medicare or Medicaid disabled will likely be paid a higher PMPM rate than a practice with more commercial members.
• Likewise, a practice that has less healthy commercial members will be paid more than that of a practice with healthier commercial members.
• A recent CPC payment month showed payments by RMHP to practices ranging from $2.71 PMPM to $12.64 PMPM, with an average of $5.38 PMPM.
Limitations of Risk Determination • Risk scoring is based on average costs. (Members age 65-70,
on average cost $x, whereas Members age 65-70 with diabetes on average cost $y.)
• It is not an evaluation of a each unique person based on their particular historical patterns of care or socioeconomic situation.
• Historical diagnoses and costs only help predict or explain a small portion of future costs.
• Some members’ scores will be too high, others too low.
Limitations of Risk Determination • Risk scoring does not isolate the frequency or particular type
of care that will be utilized by the member.
• Therefore risk assessment may not appropriately value the level of care required of particular provider types, like primary care.
• In evaluating specific utilization measures, like ER visits, we tend to normalize across practices by average risk scores. However, the correlation between those is not necessarily intended in the development of the risk scoring methodology.
Attribution • Risk assessment and adjustment is separate and different
from attribution.
• Attribution is the “assignment” of a member to a practice for purposes of payment and evaluation.
• Just like risk scoring, the detailed methodologies of attribution vary across payers and practices.
• Attribution is usually based on claims data showing a pattern of care with a practice or provider. But it could also be on patient election, provider declaration, geography, health condition, etc.
Closing Remarks and Questions