Embed Size (px)
Citation preview
459
Chapter 11
RISK AND PROTECTIVE FACTORS
Over the years, the primary objective of the Hawaii Student Alcohol, Tobacco, and Other Drug Use Studyhas been to ascertain substance use prevalence and trends among students in grades 6, 8, 10, and 12 in theState of Hawaii. The 2003 Hawaii Student Alcohol, Tobacco, and Other Drug Use Study continued tomonitor substance use prevalence and trends, but was also designed to assess risk and protective factorsthat predict substance use among Hawaii students in grades 6 through 12. The prevention needsassessment approach, first begun in 2000, highlights variables related to substance use and provides aframework for implementing and evaluating statewide prevention efforts.
This chapter is organized under three sections: (1) description of the risk and protective factor framework,(2) the relationship of risk and protective factors with substance use and antisocial behaviors (ASBs), and(3) subgroup profiles based on risk and protective factors. Subgroup comparisons are made for schooltype (public versus private), place of residence (City & County of Honolulu, Hawaii County, KauaiCounty, and Maui County), public school district (Honolulu, Central, Leeward, Windward, Hawaii,Kauai, and Maui Districts), sex (male and female), and ethnic background (Chinese, Filipino, Japanese,Native Hawaiian, and White). Each subgroup is compared to statewide proportions on each individualrisk and protective factor in an effort to highlight factors that should be the focus of drug preventionefforts in various communities. Additionally, each subgroup within a category is compared to the othersto illustrate factors that differentiate subgroups and to help explain high or low substance use rates invarious communities. Changes from 2002 to 2003 are addressed briefly at the end of each major section. To assist in highlighting subgroup differences, grade-level comparisons at the subgroup level are notaddressed. Rather, estimates for each risk and protective factor are weighted by grade for each subgroup.
Grade-level comparisons for each subgroup are found in profile reports made available on the State ofHawaii Department of Health’s web site (www.hawaii.gov/health/substance-abuse/prevention-treatment/survey/report2003).
RISK AND PROTECTIVE FACTOR FRAMEWORK
For more than a decade, the Hawaii Student Alcohol, Tobacco, and Other Drug Use Study has addressedtwo central factors that are presumed to be related to substance use: Adolescent attitudes and beliefsrelated to alcohol and drugs (see Chapter 8), and exposure to substance use (see Chapter 9). However,neither substance use nor substance abuse can be accounted for by just a few etiological factors(Newcomb & Felix-Ortiz, 1992). Recent approaches to adolescent substance use have turned to the roleof risk and protective factors in the domains of community, family, school, and peer-individual to explainsubstance use initiation and continuation (Arthur, Hawkins, Pollard, Catalano, & Baglioni, 2002; Arthur,Glaser, & Hawkins, 2003; Herrenkohol, Hawkins, Chung, Hill, & Battin-Pearson, 2000; Newcomb,1995). The risk and protective factor framework attempts to address measurable risk factors, which areprecursors for drug and alcohol problems, and measurable protective factors, which “moderate or buffer”the impact of risk factors by improving coping, adaptation, and competence.
Chapter 11
460
Risk versus Protective Factors
Risk factors are characteristics of community, family, and school environments, as well as characteristicsof students and their peer groups, that are known to predict increased likelihood of drug use, delinquency,and violent behaviors among youths (Brewer, Hawkins, Catalano, & Neckerman, 1995; Hawkins, Arthur,& Catalano, 1995). For example, researchers have found that children who live in disorganized, crime-ridden neighborhoods are more likely to become involved in crime and drug use than children who live insafe neighborhoods. Risk factors included in the present study are based on recommendations from theCenter for Substance Abuse Prevention (CSAP) and fall into four different domains: (1) community, (2)family, (3) school, and (4) peer-individual.
Protective factors exert a positive influence or buffer against the negative influence of risk, thus reducingthe likelihood that adolescents will engage in problem behaviors. Protective factors identified throughresearch reviewed by Hawkins and Catalano include social bonding to family, school, community, andpeers; healthy beliefs and clear standards for behavior; and individual characteristics. For bonding toserve as a protective influence, it must occur through involvement with peers and adults whocommunicate healthy values and set clear standards for behavior. Similar to risk factors, protectivefactors addressed in the present study are based on recommendations from CSAP and relate to thecommunity, family, school, and peer-individual domains.
Community Profiles and Prevention Planning
Research on risk and protective factors has important implications for prevention efforts. The premise ofthe risk and protective factor approach is that, in order to promote positive youth development andprevent problem behaviors, factors that predict the problem behaviors must be addressed. By measuringrisk and protective factors in various populations, prevention programs can be implemented that reduceelevated risk factors and promote protective factors. For example, if the perceived availability ofsubstances is identified as an elevated risk factor in a community, then law enforcement personnel need tointercede and more stringently enforce the laws regarding tobacco and alcohol sales in that community. Also, neighborhood members and school personnel must develop policies to help prevent the sale ofillegal substances in their neighborhood. Prevention efforts that address all of the risk and protectivefactors are sure to have a positive effect on substance use prevention. However, cost and efficiency issuespreclude prevention planners from covering all factors. The risk and protective factor approach addressedin this chapter develops community profiles that highlight elevated risk factors and low protective factorsfor various subgroups. These community profiles allow individuals to strategically prioritize preventionefforts around the most critical set of risk and protective factors in their community.
Community profiles in this chapter are developed so that comparisons can be made to statewideproportions and across subgroups (e.g., across each of the seven districts). Each year, the statewideproportions are used as the primary comparison base to determine which risk and protective factorsshould be prioritized in prevention efforts directed at a particular subgroup. Prevention efforts shouldmove towards reversing or reducing elevated risk factors or enhancing low protective factors. Thus,prevention efforts for each subgroup should focus on risk factors that are above the statewide sample, andprotective factors that are below the statewide sample. Comparisons can also be made across subgroupsto increase our understanding of why certain subgroups have higher substance use and delinquency rates.
Risk and Protective Factors
461
For instance, Chapter 4 and Chapter 6 revealed that Native Hawaiian and White students have higherprevalence rates and greater treatment needs than students from other ethnic groups. Comparing risk andprotective factor profiles for different ethnic groups can help shed light on factors that increase substanceuse vulnerability in various ethnic populations.
Unique to the risk/protective factor approach is the belief that no single predictor can account for largeproportions of variance in substance use. Rather, adolescents’ vulnerability to the use and abuse ofvarious substances is a function of the accumulation of multiple risk factors (Newcomb, 1995). Protective factors, like risk factors, are also presumed to operate in a multiplicative manner. Specifically,no single protective factor prevents substance use and abuse; rather, the accumulation of multipleprotective factors protects an individual from using or abusing substances. Risk and protective factorindexes were created by adding up the number of risk and protective factors to which the individual isexposed. The more risk factors to which an individual is exposed, the greater the likelihood that he or shewill use or abuse substances. The more protective factors to which an individual is exposed, the greaterthe likelihood that he or she will be protected from the possibility of using or abusing substances. Subgroups exposed to a large number of risk factors and a low number of protective factors are in greatestneed of prevention programs. Thus, comparing subgroups on the risk and protective factor indexes canhighlight communities with the greatest need for prevention resources.
Twenty-four risk factors were used to create the risk factor index. These factors were (1) communitydisorganization, (2) transition and mobility, (3) exposure to community alcohol, tobacco, and drug(ATOD) use, (4) laws and norms favorable to drug use, (5) perceived availability of drugs and handguns,(6) ability to purchase alcohol or tobacco, (7) poor family supervision, (8) lack of parental sanctions forantisocial behaviors (ASBs), (9) parental attitudes favorable toward ATOD use, (10) exposure to familyATOD use, (11) parental attitudes favorable toward ASB, (12) family (sibling) history of ASB, (13) lowschool commitment, (14) poor academic performance, (15) early initiation of problem behaviors, (16)favorable attitudes toward ATOD use, (17) low perceived ATOD use risk, (18) antisocial behaviors(ASBs), (19) favorable attitudes toward ASB, (20) friends’ ATOD use, (21) interaction with antisocialpeers, (22) rewards for antisocial involvement, (23) rebelliousness, and (24) sensation seeking.
Ten protective factors were used to create the protective factor index. These factors were (1) communityopportunities for positive involvement, (2) community rewards for positive involvement, (3) familyattachment, (4) family opportunities for positive involvement, (5) family rewards for positiveinvolvement, (6) school opportunities for positive involvement, (7) school rewards for positiveinvolvement, (8) peer disapproval of ATOD use, (9) belief in the moral order, and (10) educationalaspirations.
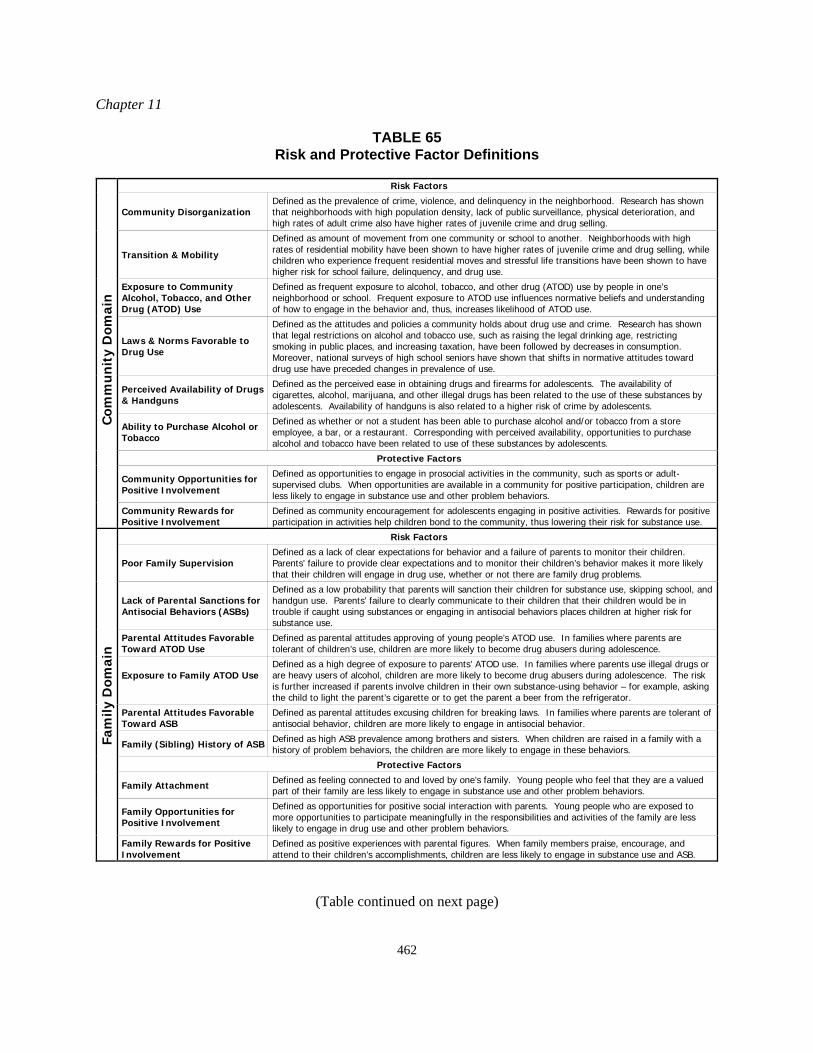
Table 65 describes each of the risk and protective factors addressed in the community, family, school, andpeer-individual domains. Refer to Chapter 3 for descriptive statistics for each scale, as well as for a list ofthe items from the 2003 Hawaii Student Alcohol, Tobacco, and Other Drug Use Survey that were used tocreate each scale. As addressed in Chapter 3, the scales used in the 2003 survey effort correspond to thescales used in 2000 and 2002.
Chapter 11
462
TABLE 65Risk and Protective Factor Definitions
Com
mu
nit
y D
omai
n
Risk Factors
Community DisorganizationDefined as the prevalence of crime, violence, and delinquency in the neighborhood. Research has shownthat neighborhoods with high population density, lack of public surveillance, physical deterioration, andhigh rates of adult crime also have higher rates of juvenile crime and drug selling.
Transition & Mobility
Defined as amount of movement from one community or school to another. Neighborhoods with highrates of residential mobility have been shown to have higher rates of juvenile crime and drug selling, whilechildren who experience frequent residential moves and stressful life transitions have been shown to havehigher risk for school failure, delinquency, and drug use.
Exposure to CommunityAlcohol, Tobacco, and OtherDrug (ATOD) Use
Defined as frequent exposure to alcohol, tobacco, and other drug (ATOD) use by people in one’sneighborhood or school. Frequent exposure to ATOD use influences normative beliefs and understandingof how to engage in the behavior and, thus, increases likelihood of ATOD use.
Laws & Norms Favorable toDrug Use
Defined as the attitudes and policies a community holds about drug use and crime. Research has shownthat legal restrictions on alcohol and tobacco use, such as raising the legal drinking age, restrictingsmoking in public places, and increasing taxation, have been followed by decreases in consumption. Moreover, national surveys of high school seniors have shown that shifts in normative attitudes towarddrug use have preceded changes in prevalence of use.
Perceived Availability of Drugs& Handguns
Defined as the perceived ease in obtaining drugs and firearms for adolescents. The availability ofcigarettes, alcohol, marijuana, and other illegal drugs has been related to the use of these substances byadolescents. Availability of handguns is also related to a higher risk of crime by adolescents.
Ability to Purchase Alcohol orTobacco
Defined as whether or not a student has been able to purchase alcohol and/or tobacco from a storeemployee, a bar, or a restaurant. Corresponding with perceived availability, opportunities to purchasealcohol and tobacco have been related to use of these substances by adolescents.
Protective Factors
Community Opportunities forPositive Involvement
Defined as opportunities to engage in prosocial activities in the community, such as sports or adult-supervised clubs. When opportunities are available in a community for positive participation, children areless likely to engage in substance use and other problem behaviors.
Community Rewards forPositive Involvement
Defined as community encouragement for adolescents engaging in positive activities. Rewards for positiveparticipation in activities help children bond to the community, thus lowering their risk for substance use.
Fam
ily D
omai
n
Risk Factors
Poor Family SupervisionDefined as a lack of clear expectations for behavior and a failure of parents to monitor their children. Parents’ failure to provide clear expectations and to monitor their children’s behavior makes it more likelythat their children will engage in drug use, whether or not there are family drug problems.
Lack of Parental Sanctions forAntisocial Behaviors (ASBs)
Defined as a low probability that parents will sanction their children for substance use, skipping school, andhandgun use. Parents’ failure to clearly communicate to their children that their children would be introuble if caught using substances or engaging in antisocial behaviors places children at higher risk forsubstance use.
Parental Attitudes FavorableToward ATOD Use
Defined as parental attitudes approving of young people’s ATOD use. In families where parents aretolerant of children’s use, children are more likely to become drug abusers during adolescence.
Exposure to Family ATOD UseDefined as a high degree of exposure to parents’ ATOD use. In families where parents use illegal drugs orare heavy users of alcohol, children are more likely to become drug abusers during adolescence. The riskis further increased if parents involve children in their own substance-using behavior – for example, askingthe child to light the parent’s cigarette or to get the parent a beer from the refrigerator.
Parental Attitudes FavorableToward ASB
Defined as parental attitudes excusing children for breaking laws. In families where parents are tolerant ofantisocial behavior, children are more likely to engage in antisocial behavior.
Family (Sibling) History of ASB Defined as high ASB prevalence among brothers and sisters. When children are raised in a family with ahistory of problem behaviors, the children are more likely to engage in these behaviors.
Protective Factors
Family Attachment Defined as feeling connected to and loved by one’s family. Young people who feel that they are a valuedpart of their family are less likely to engage in substance use and other problem behaviors.
Family Opportunities forPositive Involvement
Defined as opportunities for positive social interaction with parents. Young people who are exposed tomore opportunities to participate meaningfully in the responsibilities and activities of the family are lesslikely to engage in drug use and other problem behaviors.
Family Rewards for PositiveInvolvement
Defined as positive experiences with parental figures. When family members praise, encourage, andattend to their children’s accomplishments, children are less likely to engage in substance use and ASB.
(Table continued on next page)
Risk and Protective Factors
463
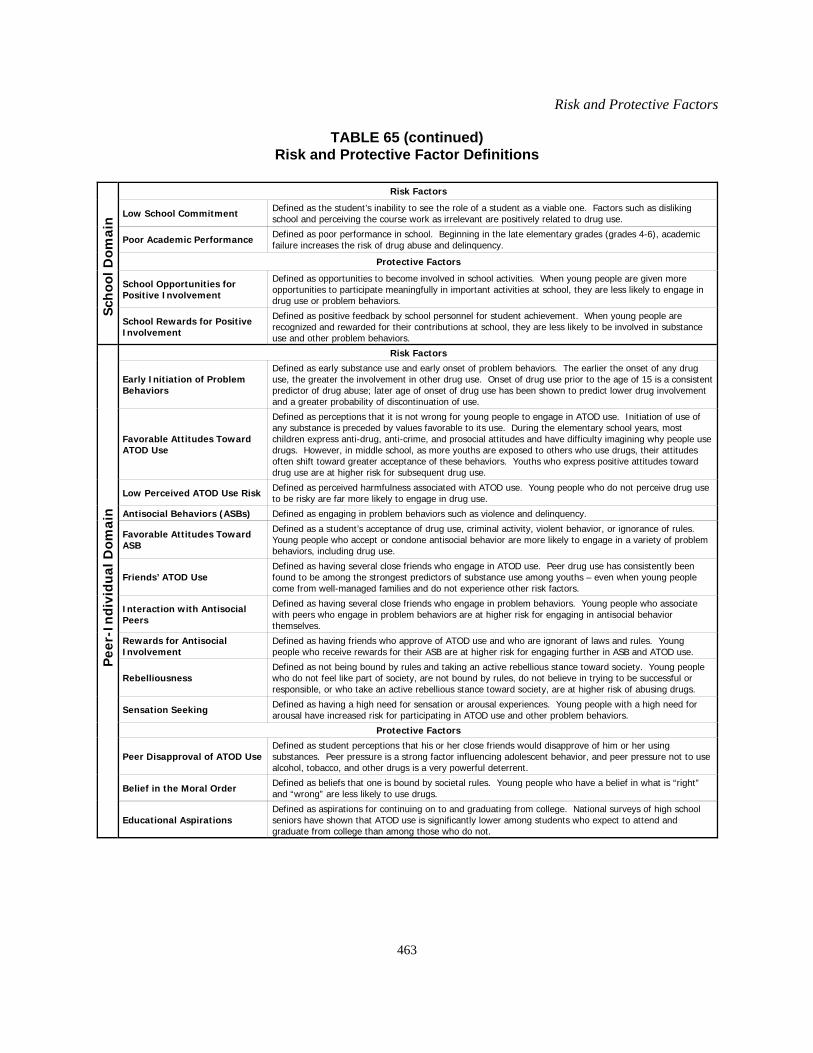
TABLE 65 (continued)Risk and Protective Factor Definitions
Sch
ool D
omai
n
Risk Factors
Low School Commitment Defined as the student’s inability to see the role of a student as a viable one. Factors such as dislikingschool and perceiving the course work as irrelevant are positively related to drug use.
Poor Academic Performance Defined as poor performance in school. Beginning in the late elementary grades (grades 4-6), academicfailure increases the risk of drug abuse and delinquency.
Protective Factors
School Opportunities forPositive Involvement
Defined as opportunities to become involved in school activities. When young people are given moreopportunities to participate meaningfully in important activities at school, they are less likely to engage indrug use or problem behaviors.
School Rewards for PositiveInvolvement
Defined as positive feedback by school personnel for student achievement. When young people arerecognized and rewarded for their contributions at school, they are less likely to be involved in substanceuse and other problem behaviors.
Pee
r-In
divi
dual
Dom
ain
Risk Factors
Early Initiation of ProblemBehaviors
Defined as early substance use and early onset of problem behaviors. The earlier the onset of any druguse, the greater the involvement in other drug use. Onset of drug use prior to the age of 15 is a consistentpredictor of drug abuse; later age of onset of drug use has been shown to predict lower drug involvementand a greater probability of discontinuation of use.
Favorable Attitudes TowardATOD Use
Defined as perceptions that it is not wrong for young people to engage in ATOD use. Initiation of use ofany substance is preceded by values favorable to its use. During the elementary school years, mostchildren express anti-drug, anti-crime, and prosocial attitudes and have difficulty imagining why people usedrugs. However, in middle school, as more youths are exposed to others who use drugs, their attitudesoften shift toward greater acceptance of these behaviors. Youths who express positive attitudes towarddrug use are at higher risk for subsequent drug use.
Low Perceived ATOD Use Risk Defined as perceived harmfulness associated with ATOD use. Young people who do not perceive drug useto be risky are far more likely to engage in drug use.
Antisocial Behaviors (ASBs) Defined as engaging in problem behaviors such as violence and delinquency.
Favorable Attitudes TowardASB
Defined as a student’s acceptance of drug use, criminal activity, violent behavior, or ignorance of rules. Young people who accept or condone antisocial behavior are more likely to engage in a variety of problembehaviors, including drug use.
Friends’ ATOD Use Defined as having several close friends who engage in ATOD use. Peer drug use has consistently beenfound to be among the strongest predictors of substance use among youths – even when young peoplecome from well-managed families and do not experience other risk factors.
Interaction with AntisocialPeers
Defined as having several close friends who engage in problem behaviors. Young people who associatewith peers who engage in problem behaviors are at higher risk for engaging in antisocial behaviorthemselves.
Rewards for AntisocialInvolvement
Defined as having friends who approve of ATOD use and who are ignorant of laws and rules. Youngpeople who receive rewards for their ASB are at higher risk for engaging further in ASB and ATOD use.
RebelliousnessDefined as not being bound by rules and taking an active rebellious stance toward society. Young peoplewho do not feel like part of society, are not bound by rules, do not believe in trying to be successful orresponsible, or who take an active rebellious stance toward society, are at higher risk of abusing drugs.
Sensation Seeking Defined as having a high need for sensation or arousal experiences. Young people with a high need forarousal have increased risk for participating in ATOD use and other problem behaviors.
Protective Factors
Peer Disapproval of ATOD UseDefined as student perceptions that his or her close friends would disapprove of him or her usingsubstances. Peer pressure is a strong factor influencing adolescent behavior, and peer pressure not to usealcohol, tobacco, and other drugs is a very powerful deterrent.
Belief in the Moral Order Defined as beliefs that one is bound by societal rules. Young people who have a belief in what is “right”and “wrong” are less likely to use drugs.
Educational AspirationsDefined as aspirations for continuing on to and graduating from college. National surveys of high schoolseniors have shown that ATOD use is significantly lower among students who expect to attend andgraduate from college than among those who do not.
Chapter 11
464
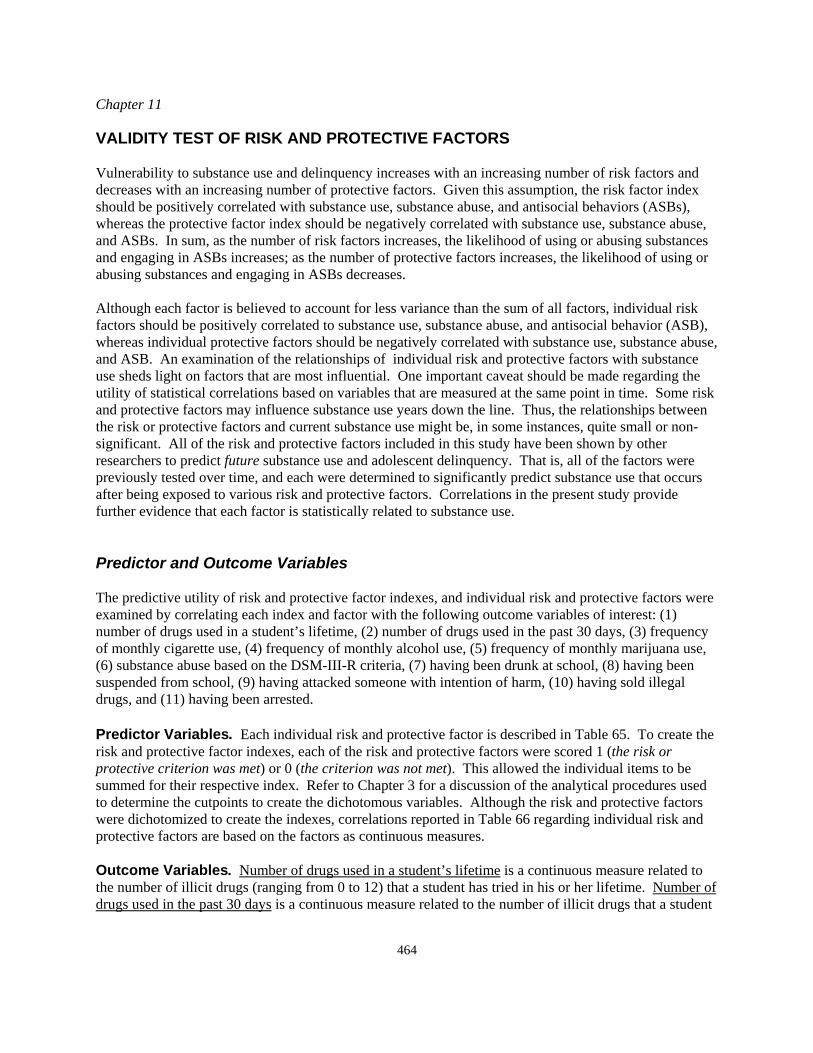
VALIDITY TEST OF RISK AND PROTECTIVE FACTORS
Vulnerability to substance use and delinquency increases with an increasing number of risk factors anddecreases with an increasing number of protective factors. Given this assumption, the risk factor indexshould be positively correlated with substance use, substance abuse, and antisocial behaviors (ASBs),whereas the protective factor index should be negatively correlated with substance use, substance abuse,and ASBs. In sum, as the number of risk factors increases, the likelihood of using or abusing substancesand engaging in ASBs increases; as the number of protective factors increases, the likelihood of using orabusing substances and engaging in ASBs decreases.
Although each factor is believed to account for less variance than the sum of all factors, individual riskfactors should be positively correlated to substance use, substance abuse, and antisocial behavior (ASB),whereas individual protective factors should be negatively correlated with substance use, substance abuse,and ASB. An examination of the relationships of individual risk and protective factors with substanceuse sheds light on factors that are most influential. One important caveat should be made regarding theutility of statistical correlations based on variables that are measured at the same point in time. Some riskand protective factors may influence substance use years down the line. Thus, the relationships betweenthe risk or protective factors and current substance use might be, in some instances, quite small or non-significant. All of the risk and protective factors included in this study have been shown by otherresearchers to predict future substance use and adolescent delinquency. That is, all of the factors werepreviously tested over time, and each were determined to significantly predict substance use that occursafter being exposed to various risk and protective factors. Correlations in the present study providefurther evidence that each factor is statistically related to substance use.
Predictor and Outcome Variables
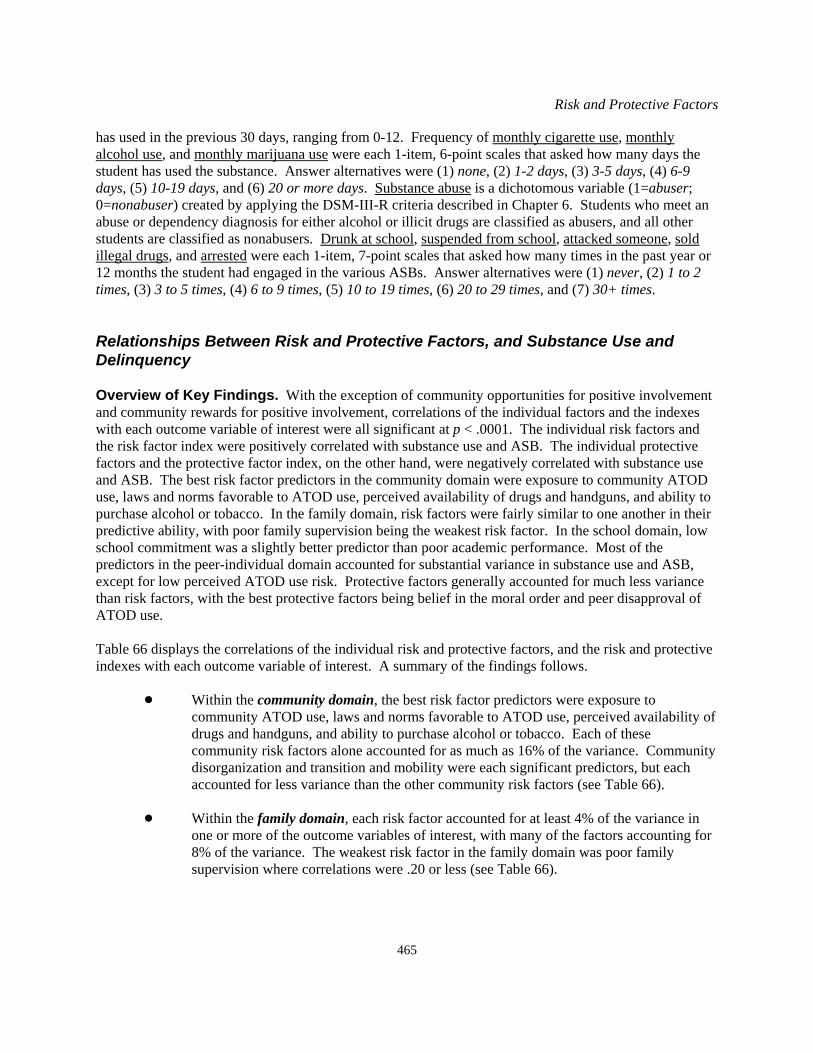
The predictive utility of risk and protective factor indexes, and individual risk and protective factors wereexamined by correlating each index and factor with the following outcome variables of interest: (1)number of drugs used in a student’s lifetime, (2) number of drugs used in the past 30 days, (3) frequencyof monthly cigarette use, (4) frequency of monthly alcohol use, (5) frequency of monthly marijuana use,(6) substance abuse based on the DSM-III-R criteria, (7) having been drunk at school, (8) having beensuspended from school, (9) having attacked someone with intention of harm, (10) having sold illegaldrugs, and (11) having been arrested.
Predictor Variables. Each individual risk and protective factor is described in Table 65. To create therisk and protective factor indexes, each of the risk and protective factors were scored 1 (the risk orprotective criterion was met) or 0 (the criterion was not met). This allowed the individual items to besummed for their respective index. Refer to Chapter 3 for a discussion of the analytical procedures usedto determine the cutpoints to create the dichotomous variables. Although the risk and protective factorswere dichotomized to create the indexes, correlations reported in Table 66 regarding individual risk andprotective factors are based on the factors as continuous measures.
Outcome Variables. Number of drugs used in a student’s lifetime is a continuous measure related tothe number of illicit drugs (ranging from 0 to 12) that a student has tried in his or her lifetime. Number ofdrugs used in the past 30 days is a continuous measure related to the number of illicit drugs that a student
Risk and Protective Factors
465
has used in the previous 30 days, ranging from 0-12. Frequency of monthly cigarette use, monthlyalcohol use, and monthly marijuana use were each 1-item, 6-point scales that asked how many days thestudent has used the substance. Answer alternatives were (1) none, (2) 1-2 days, (3) 3-5 days, (4) 6-9days, (5) 10-19 days, and (6) 20 or more days. Substance abuse is a dichotomous variable (1=abuser;0=nonabuser) created by applying the DSM-III-R criteria described in Chapter 6. Students who meet anabuse or dependency diagnosis for either alcohol or illicit drugs are classified as abusers, and all otherstudents are classified as nonabusers. Drunk at school, suspended from school, attacked someone, soldillegal drugs, and arrested were each 1-item, 7-point scales that asked how many times in the past year or12 months the student had engaged in the various ASBs. Answer alternatives were (1) never, (2) 1 to 2times, (3) 3 to 5 times, (4) 6 to 9 times, (5) 10 to 19 times, (6) 20 to 29 times, and (7) 30+ times.
Relationships Between Risk and Protective Factors, and Substance Use andDelinquency
Overview of Key Findings. With the exception of community opportunities for positive involvementand community rewards for positive involvement, correlations of the individual factors and the indexeswith each outcome variable of interest were all significant at p < .0001. The individual risk factors andthe risk factor index were positively correlated with substance use and ASB. The individual protectivefactors and the protective factor index, on the other hand, were negatively correlated with substance useand ASB. The best risk factor predictors in the community domain were exposure to community ATODuse, laws and norms favorable to ATOD use, perceived availability of drugs and handguns, and ability topurchase alcohol or tobacco. In the family domain, risk factors were fairly similar to one another in theirpredictive ability, with poor family supervision being the weakest risk factor. In the school domain, lowschool commitment was a slightly better predictor than poor academic performance. Most of thepredictors in the peer-individual domain accounted for substantial variance in substance use and ASB,except for low perceived ATOD use risk. Protective factors generally accounted for much less variancethan risk factors, with the best protective factors being belief in the moral order and peer disapproval ofATOD use.
Table 66 displays the correlations of the individual risk and protective factors, and the risk and protectiveindexes with each outcome variable of interest. A summary of the findings follows.
! Within the community domain, the best risk factor predictors were exposure tocommunity ATOD use, laws and norms favorable to ATOD use, perceived availability ofdrugs and handguns, and ability to purchase alcohol or tobacco. Each of thesecommunity risk factors alone accounted for as much as 16% of the variance. Communitydisorganization and transition and mobility were each significant predictors, but eachaccounted for less variance than the other community risk factors (see Table 66).
! Within the family domain, each risk factor accounted for at least 4% of the variance inone or more of the outcome variables of interest, with many of the factors accounting for8% of the variance. The weakest risk factor in the family domain was poor familysupervision where correlations were .20 or less (see Table 66).
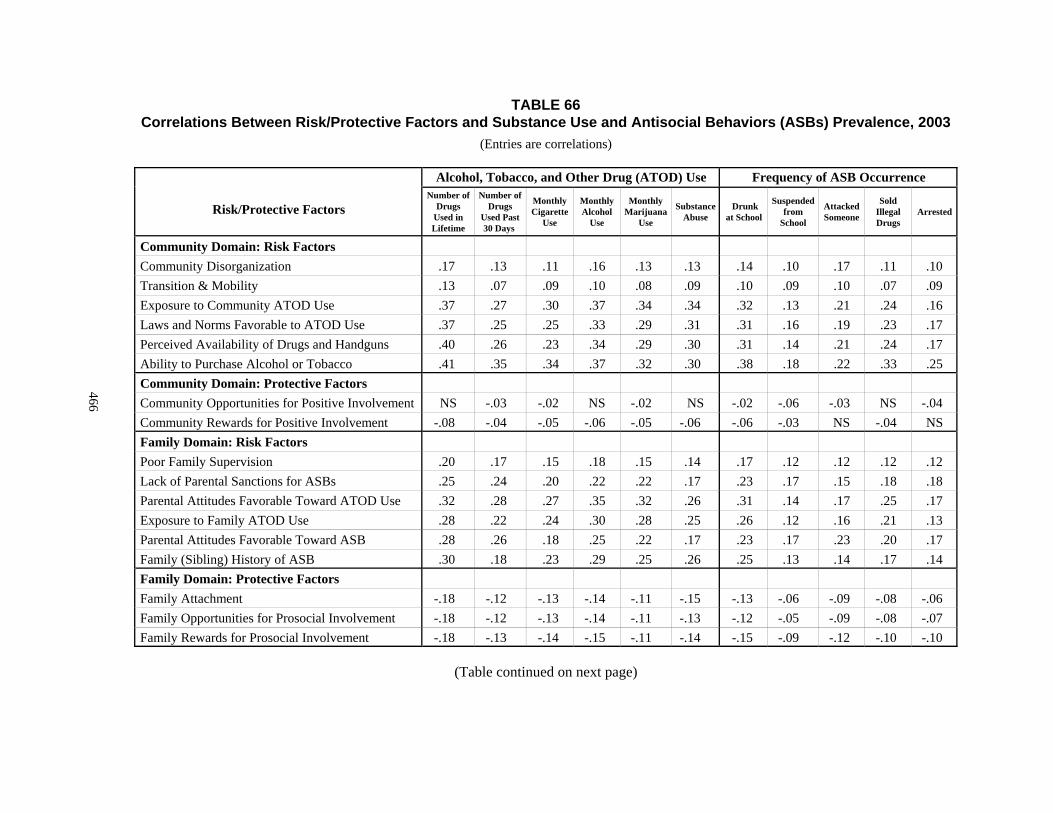
TABLE 66Correlations Between Risk/Protective Factors and Substance Use and Antisocial Behaviors (ASBs) Prevalence, 2003
(Entries are correlations)
Risk/Protective Factors
Alcohol, Tobacco, and Other Drug (ATOD) Use Frequency of ASB OccurrenceNumber of
DrugsUsed inLifetime
Number ofDrugs
Used Past30 Days
MonthlyCigarette
Use
MonthlyAlcohol
Use
MonthlyMarijuana
Use
SubstanceAbuse
Drunkat School
Suspendedfrom
School
AttackedSomeone
SoldIllegalDrugs
Arrested
Community Domain: Risk FactorsCommunity Disorganization .17 .13 .11 .16 .13 .13 .14 .10 .17 .11 .10Transition & Mobility .13 .07 .09 .10 .08 .09 .10 .09 .10 .07 .09Exposure to Community ATOD Use .37 .27 .30 .37 .34 .34 .32 .13 .21 .24 .16Laws and Norms Favorable to ATOD Use .37 .25 .25 .33 .29 .31 .31 .16 .19 .23 .17Perceived Availability of Drugs and Handguns .40 .26 .23 .34 .29 .30 .31 .14 .21 .24 .17Ability to Purchase Alcohol or Tobacco .41 .35 .34 .37 .32 .30 .38 .18 .22 .33 .25Community Domain: Protective FactorsCommunity Opportunities for Positive Involvement NS -.03 -.02 NS -.02 NS -.02 -.06 -.03 NS -.04Community Rewards for Positive Involvement -.08 -.04 -.05 -.06 -.05 -.06 -.06 -.03 NS -.04 NSFamily Domain: Risk FactorsPoor Family Supervision .20 .17 .15 .18 .15 .14 .17 .12 .12 .12 .12Lack of Parental Sanctions for ASBs .25 .24 .20 .22 .22 .17 .23 .17 .15 .18 .18Parental Attitudes Favorable Toward ATOD Use .32 .28 .27 .35 .32 .26 .31 .14 .17 .25 .17Exposure to Family ATOD Use .28 .22 .24 .30 .28 .25 .26 .12 .16 .21 .13Parental Attitudes Favorable Toward ASB .28 .26 .18 .25 .22 .17 .23 .17 .23 .20 .17Family (Sibling) History of ASB .30 .18 .23 .29 .25 .26 .25 .13 .14 .17 .14Family Domain: Protective FactorsFamily Attachment -.18 -.12 -.13 -.14 -.11 -.15 -.13 -.06 -.09 -.08 -.06Family Opportunities for Prosocial Involvement -.18 -.12 -.13 -.14 -.11 -.13 -.12 -.05 -.09 -.08 -.07Family Rewards for Prosocial Involvement -.18 -.13 -.14 -.15 -.11 -.14 -.15 -.09 -.12 -.10 -.10
(Table continued on next page)
466
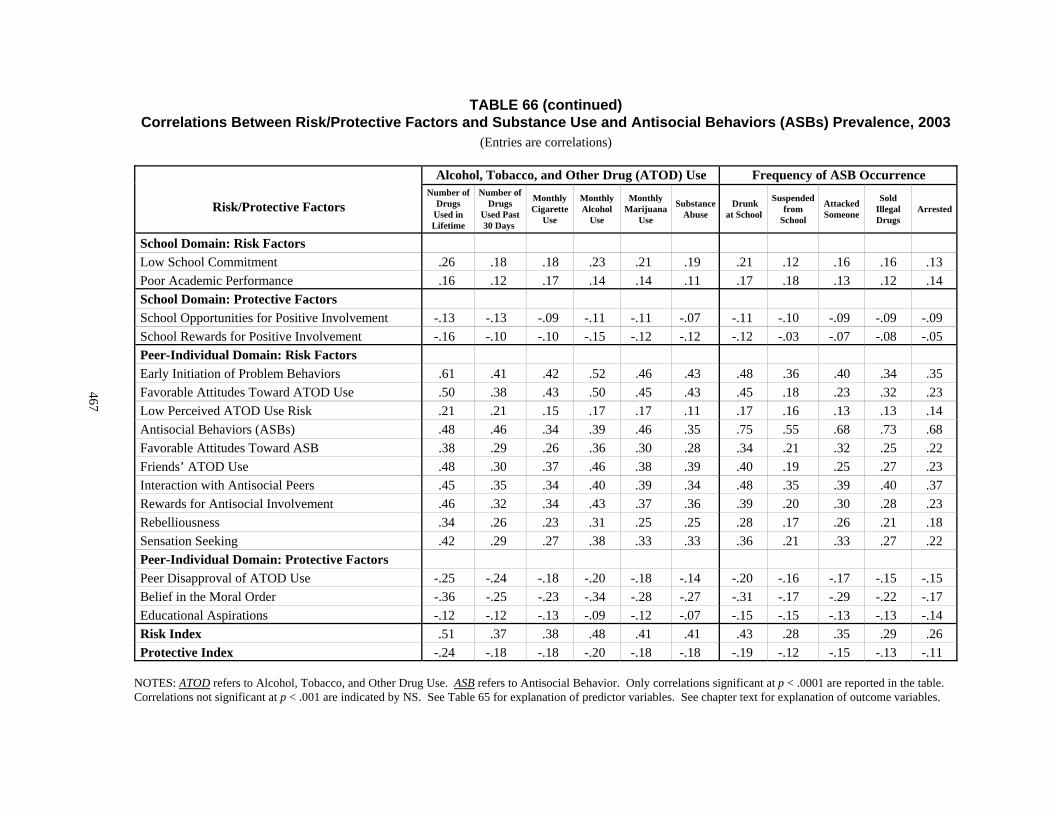
TABLE 66 (continued)Correlations Between Risk/Protective Factors and Substance Use and Antisocial Behaviors (ASBs) Prevalence, 2003
(Entries are correlations)
Risk/Protective Factors
Alcohol, Tobacco, and Other Drug (ATOD) Use Frequency of ASB OccurrenceNumber of
DrugsUsed inLifetime
Number ofDrugs
Used Past30 Days
MonthlyCigarette
Use
MonthlyAlcohol
Use
MonthlyMarijuana
Use
SubstanceAbuse
Drunkat School
Suspendedfrom
School
AttackedSomeone
SoldIllegalDrugs
Arrested
School Domain: Risk FactorsLow School Commitment .26 .18 .18 .23 .21 .19 .21 .12 .16 .16 .13Poor Academic Performance .16 .12 .17 .14 .14 .11 .17 .18 .13 .12 .14School Domain: Protective FactorsSchool Opportunities for Positive Involvement -.13 -.13 -.09 -.11 -.11 -.07 -.11 -.10 -.09 -.09 -.09School Rewards for Positive Involvement -.16 -.10 -.10 -.15 -.12 -.12 -.12 -.03 -.07 -.08 -.05Peer-Individual Domain: Risk FactorsEarly Initiation of Problem Behaviors .61 .41 .42 .52 .46 .43 .48 .36 .40 .34 .35Favorable Attitudes Toward ATOD Use .50 .38 .43 .50 .45 .43 .45 .18 .23 .32 .23Low Perceived ATOD Use Risk .21 .21 .15 .17 .17 .11 .17 .16 .13 .13 .14Antisocial Behaviors (ASBs) .48 .46 .34 .39 .46 .35 .75 .55 .68 .73 .68Favorable Attitudes Toward ASB .38 .29 .26 .36 .30 .28 .34 .21 .32 .25 .22Friends’ ATOD Use .48 .30 .37 .46 .38 .39 .40 .19 .25 .27 .23Interaction with Antisocial Peers .45 .35 .34 .40 .39 .34 .48 .35 .39 .40 .37Rewards for Antisocial Involvement .46 .32 .34 .43 .37 .36 .39 .20 .30 .28 .23Rebelliousness .34 .26 .23 .31 .25 .25 .28 .17 .26 .21 .18Sensation Seeking .42 .29 .27 .38 .33 .33 .36 .21 .33 .27 .22Peer-Individual Domain: Protective FactorsPeer Disapproval of ATOD Use -.25 -.24 -.18 -.20 -.18 -.14 -.20 -.16 -.17 -.15 -.15Belief in the Moral Order -.36 -.25 -.23 -.34 -.28 -.27 -.31 -.17 -.29 -.22 -.17Educational Aspirations -.12 -.12 -.13 -.09 -.12 -.07 -.15 -.15 -.13 -.13 -.14Risk Index .51 .37 .38 .48 .41 .41 .43 .28 .35 .29 .26Protective Index -.24 -.18 -.18 -.20 -.18 -.18 -.19 -.12 -.15 -.13 -.11
NOTES: ATOD refers to Alcohol, Tobacco, and Other Drug Use. ASB refers to Antisocial Behavior. Only correlations significant at p < .0001 are reported in the table. Correlations not significant at p < .001 are indicated by NS. See Table 65 for explanation of predictor variables. See chapter text for explanation of outcome variables.
467
Chapter 11
468
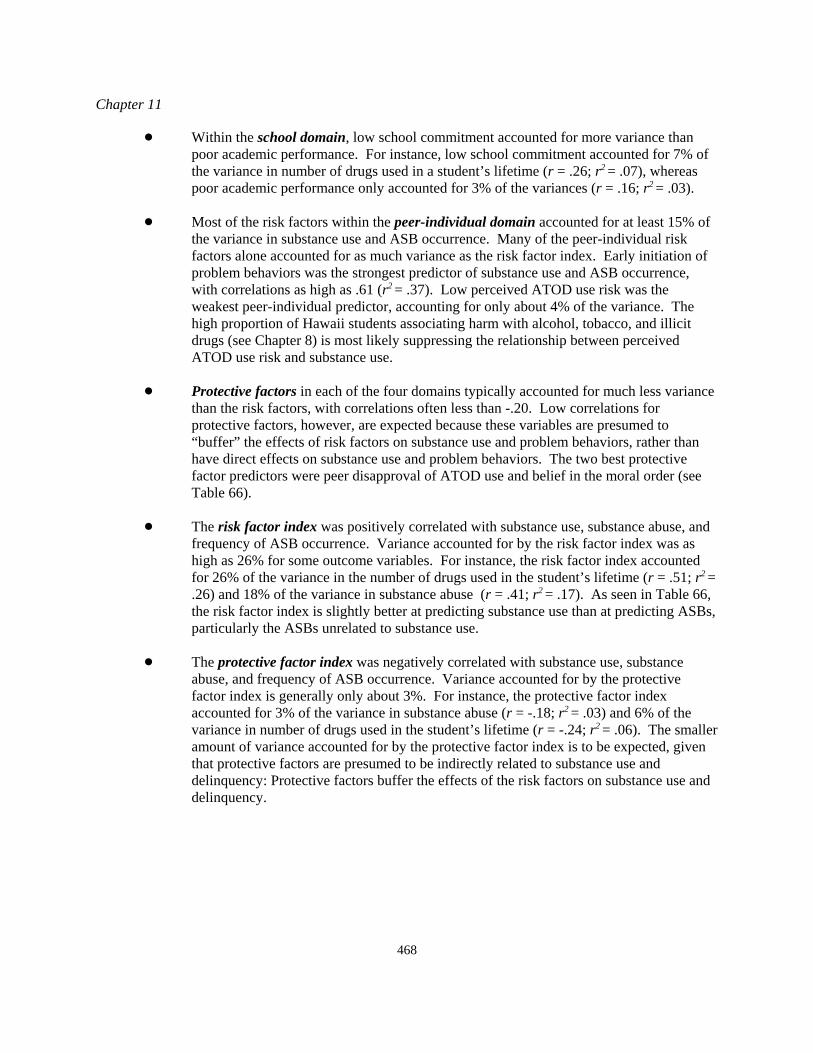
! Within the school domain, low school commitment accounted for more variance thanpoor academic performance. For instance, low school commitment accounted for 7% ofthe variance in number of drugs used in a student’s lifetime (r = .26; r2 = .07), whereaspoor academic performance only accounted for 3% of the variances (r = .16; r2 = .03).
! Most of the risk factors within the peer-individual domain accounted for at least 15% ofthe variance in substance use and ASB occurrence. Many of the peer-individual riskfactors alone accounted for as much variance as the risk factor index. Early initiation ofproblem behaviors was the strongest predictor of substance use and ASB occurrence,with correlations as high as .61 (r2 = .37). Low perceived ATOD use risk was theweakest peer-individual predictor, accounting for only about 4% of the variance. Thehigh proportion of Hawaii students associating harm with alcohol, tobacco, and illicitdrugs (see Chapter 8) is most likely suppressing the relationship between perceivedATOD use risk and substance use.
! Protective factors in each of the four domains typically accounted for much less variancethan the risk factors, with correlations often less than -.20. Low correlations forprotective factors, however, are expected because these variables are presumed to“buffer” the effects of risk factors on substance use and problem behaviors, rather thanhave direct effects on substance use and problem behaviors. The two best protectivefactor predictors were peer disapproval of ATOD use and belief in the moral order (seeTable 66).
! The risk factor index was positively correlated with substance use, substance abuse, andfrequency of ASB occurrence. Variance accounted for by the risk factor index was ashigh as 26% for some outcome variables. For instance, the risk factor index accountedfor 26% of the variance in the number of drugs used in the student’s lifetime (r = .51; r2 =.26) and 18% of the variance in substance abuse (r = .41; r2 = .17). As seen in Table 66,the risk factor index is slightly better at predicting substance use than at predicting ASBs,particularly the ASBs unrelated to substance use.
! The protective factor index was negatively correlated with substance use, substanceabuse, and frequency of ASB occurrence. Variance accounted for by the protectivefactor index is generally only about 3%. For instance, the protective factor indexaccounted for 3% of the variance in substance abuse (r = -.18; r2 = .03) and 6% of thevariance in number of drugs used in the student’s lifetime (r = -.24; r2 = .06). The smalleramount of variance accounted for by the protective factor index is to be expected, giventhat protective factors are presumed to be indirectly related to substance use anddelinquency: Protective factors buffer the effects of the risk factors on substance use anddelinquency.
Risk and Protective Factors
469
SUBGROUP COMPARISONS
The following sections develop risk and protective factor profiles based on five different subgroupclassifications: (1) school type, (2) place of residence, (3) public school district, (4) sex, and (5) ethnicbackground. For each subgroup classification, risk and protective profiles were developed that show thepercentage of students at risk and the percentage of students with protection, based on each scale. Theprofiles developed on the following pages allow for two types of comparisons: comparisons acrosssubgroups (e.g., males versus females) and comparisons between a particular subgroup and studentsstatewide. Grade-level differences for each subgroup are not addressed. Rather, profiles are developedfor each subgroup by weighting the percentage at risk, or protected, at each grade level, by statewide N-sizes at that grade level for that specific subgroup (see Appendix B for approximate weighted N-sizes). Weighting was done to prevent estimates from being biased by disproportionate numbers of 6th, 8th,10th, and 12th graders participating in the study. Creating overall estimates across grades for each riskand protective factor allowed for greater ease in displaying differences across subgroups. As noted earlierin the chapter, grade-level differences for each subgroup and trend data can be found in the profile reportsmade available on the State of Hawaii Department of Health’s web site.
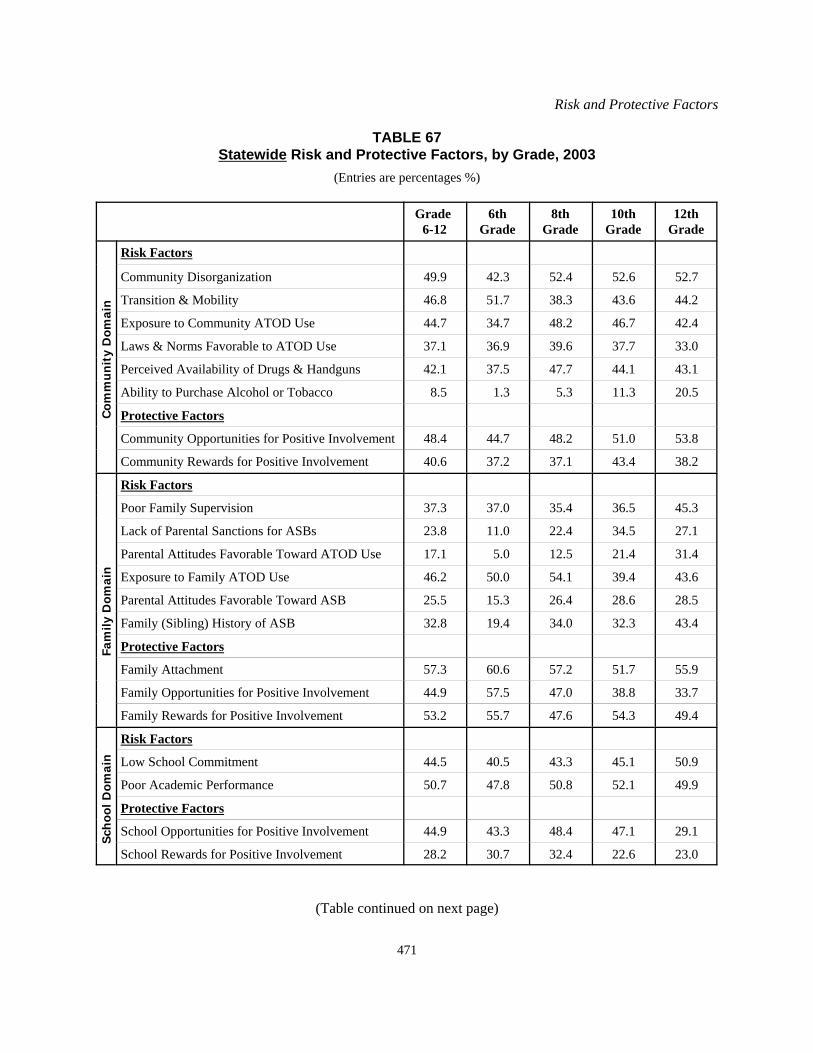
Table 67 presents the percentages of students statewide and at each grade level who meet each risk andprotective criterion. The statewide proportions listed in the tables are uninformative by themselves. Thestatewide proportions are used as a comparison base to determine which subgroups are above or belowthe statewide population on each of the risk and protective factors. Subgroups above the statewidesample on individual risk factors and below the statewide sample on individual protective factors are mostat risk. As previously indicated, prevention efforts should move toward reversing or reducing risk factorsor enhancing protective factors.
For each subgroup classification discussed in this chapter, a table is provided that lists the percentages ofstudents who reported “elevated risk” or “elevated protection” on the various scales. The tables also liststhe percentages of students who are exposed to a high, moderate, or low number of risk and protectivefactors. Subgroups that are exposed to a high number of risk factors and a low number of protectivefactors are most in need of prevention programs. Examination of the risk and protective factors indexes atthe end of each table is used to assess which communities are in greatest need of prevention programs. An understanding of which risk and protective factors to address in various communities can most easilybe assessed by examining the charts that follow the tables. Charts are provided that highlight elevatedrisk and elevated protection in each of the four domains (community, family, school, and peer-individual). In the charts, the bars represent the percentage of students from a particular subgroup whoindicated “elevated risk” on the risk factor scales or “elevated protection” on the protective factor scales. The dots on the charts represent the percentage of Hawaii students statewide who reported “elevated risk”or “elevated protection” on the 2003 survey. The comparison to the overall state percentages providesinformation used to determine the relative importance of each risk or protective factor level for thespecific subgroup: Bars that are higher than the dot in the risk factor charts represent elevated risk; barsthat are higher than the dot in the protective factor chart represent elevated protection. Prevention effortsshould focus on risk factors that are above the dots and protective factors that are below the dots. Factorsmost (or least) prevalent for a specific subgroup, in comparison to other subgroups in that classification,are determined by scanning across the charts and comparing bars. Bars that are higher than other barsrepresent elevated risk or elevated protection for that particular subgroup.
Chapter 11
470
The charts and tables for counties and public school districts are summarized in Table 71 (pages 502-503). The charts and tables for sex and ethnicity are summarized in Table 74 (pages 522-523). In thesetwo tables, dates (‘00, ‘02, ‘03, or all) are placed beside each risk factor that was identified as higher thanor equal to statewide percentages during the year represented by the date. The date indicates that the riskfactor was higher than the statewide average during that year (i.e., the risk factor needed to be addressedby prevention efforts). Dates are also placed beside each protective factor that was identified as lowerthan or equal to statewide percentages. The date indicates that the protective factor was lower than thestatewide average during that year (i.e., the protective factor needed to be addressed by preventionefforts). Prevention efforts have worked if a risk or protective factor was marked as problematic in ‘02,but was not marked as problematic in ‘03. Prevention efforts need to focus on those factors which remainproblematic in 2003 or which have become problematic in 2003. Factors that were problematic in allthree survey years, as indicated by the word all, are the most important factors to address in preventionefforts.
The final table in this chapter, Table 75, provides trend data for each risk and protective factor bysubgroup. As addressed in Chapter 3, 2003 data was collected in the fall semester, which was fourmonths earlier than previous data collection years. The change scores noted between 2002 and 2003could be partially a function of surveying the students earlier in the academic year. To best determine if aprevention effort is working in a particular community or group, one should examine if the factor ofinterest is above or below the statewide percentages, in addition to examining whether there was apositive or negative change in the factor from 2002 to 2003. For instance, if a risk factor in a particularsubgroup showed a decrease from 2002 to 2003 and was below the statewide percentage in 2003,prevention efforts worked. On the other hand, if a risk factor in a particular subgroup showed a decreasefrom 2002 to 2003 and was above the statewide percentage in 2003, prevention efforts may not haveworked. Rather, the change score may be reflective of surveying the students earlier in the academicyear, which resulted in a lower percentage of students, overall, affected by that particular risk factor. Prevention efforts have worked on various protective factors if there was both an increase noted from2002 to 2003 and the protective factors is above the statewide percentage.
Some risk and protective factors may be impossible to change. For instance, the risk factor, sensationseeking, is a personality trait involving a high need for arousal. Prevention efforts are not going to beable to alter a person’s personality. In the case of personality variables, prevention programs must utilizethe information to design more effective campaigns aimed at people with certain personality traits. Forinstance, tests of the Activation Model of Information Exposure (Palmgreen, Donohew, Lorch, Hoyle, &Stephenson, 2001; Stephenson, 2003) have shown that high sensation seekers are more likely to attend todrug prevention campaigns that use high sensation value messages (e.g., rock music, vivid pictures, scaryimages) instead of low sensation value messages.
Grade-Level Comparisons
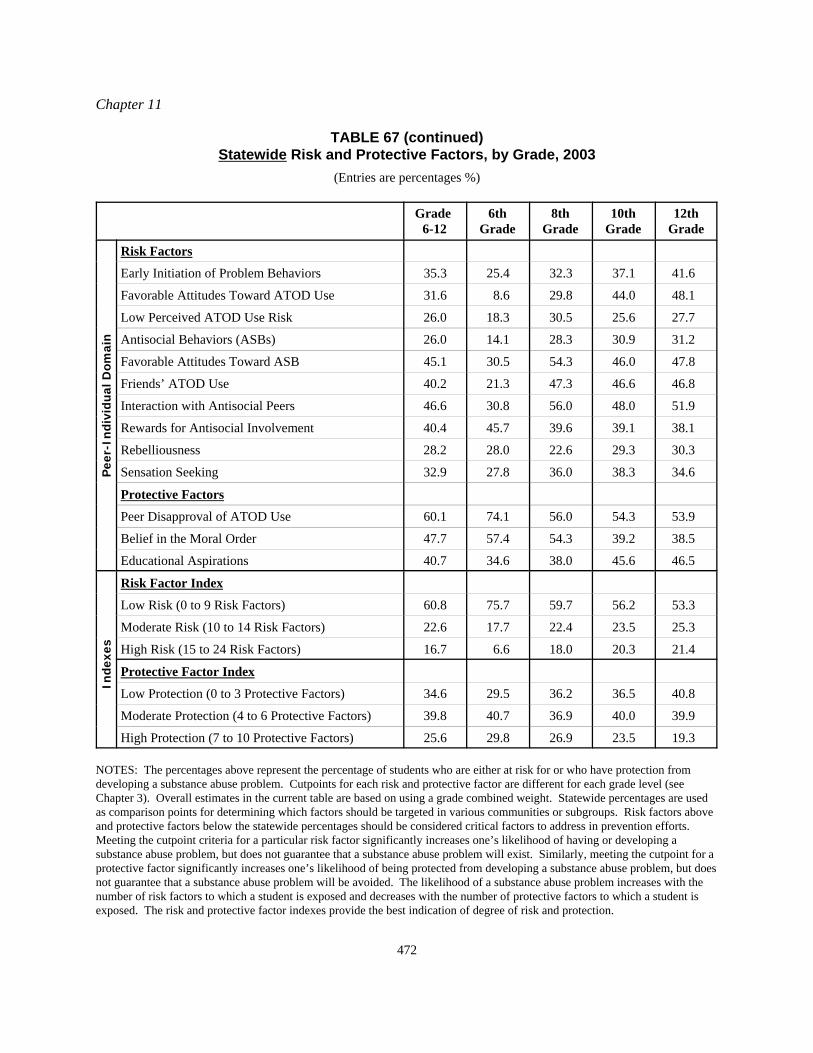
Table 67 lists the percentage of students, at each grade level, who meet the criterion on each risk andprotective factor. Because cutpoints are grade specific (see Chapter 3), discussing differences betweeneach grade on each factor is relatively uninformative. With each grade-level advancement comes greatersocial, psychological, and educational challenges. Students in higher grade levels become moreindependent from their families and have to learn to get along with a wider group of peers. Thus, the
Risk and Protective Factors
471
TABLE 67Statewide Risk and Protective Factors, by Grade, 2003
(Entries are percentages %)
Grade 6-12
6thGrade
8thGrade
10thGrade
12thGrade
Com
mu
nit
y D
omai
n
Risk Factors
Community Disorganization 49.9 42.3 52.4 52.6 52.7
Transition & Mobility 46.8 51.7 38.3 43.6 44.2
Exposure to Community ATOD Use 44.7 34.7 48.2 46.7 42.4
Laws & Norms Favorable to ATOD Use 37.1 36.9 39.6 37.7 33.0
Perceived Availability of Drugs & Handguns 42.1 37.5 47.7 44.1 43.1
Ability to Purchase Alcohol or Tobacco 8.5 1.3 5.3 11.3 20.5
Protective Factors
Community Opportunities for Positive Involvement 48.4 44.7 48.2 51.0 53.8
Community Rewards for Positive Involvement 40.6 37.2 37.1 43.4 38.2
Fam
ily D
omai
n
Risk Factors
Poor Family Supervision 37.3 37.0 35.4 36.5 45.3
Lack of Parental Sanctions for ASBs 23.8 11.0 22.4 34.5 27.1
Parental Attitudes Favorable Toward ATOD Use 17.1 5.0 12.5 21.4 31.4
Exposure to Family ATOD Use 46.2 50.0 54.1 39.4 43.6
Parental Attitudes Favorable Toward ASB 25.5 15.3 26.4 28.6 28.5
Family (Sibling) History of ASB 32.8 19.4 34.0 32.3 43.4
Protective Factors
Family Attachment 57.3 60.6 57.2 51.7 55.9
Family Opportunities for Positive Involvement 44.9 57.5 47.0 38.8 33.7
Family Rewards for Positive Involvement 53.2 55.7 47.6 54.3 49.4
Sch
ool D
omai
n
Risk Factors
Low School Commitment 44.5 40.5 43.3 45.1 50.9
Poor Academic Performance 50.7 47.8 50.8 52.1 49.9
Protective Factors
School Opportunities for Positive Involvement 44.9 43.3 48.4 47.1 29.1
School Rewards for Positive Involvement 28.2 30.7 32.4 22.6 23.0
(Table continued on next page)
Chapter 11
472
TABLE 67 (continued)Statewide Risk and Protective Factors, by Grade, 2003
(Entries are percentages %)
Grade 6-12
6thGrade
8thGrade
10thGrade
12thGrade
Pee
r-In
divi
dual
Dom
ain
Risk Factors
Early Initiation of Problem Behaviors 35.3 25.4 32.3 37.1 41.6
Favorable Attitudes Toward ATOD Use 31.6 8.6 29.8 44.0 48.1
Low Perceived ATOD Use Risk 26.0 18.3 30.5 25.6 27.7
Antisocial Behaviors (ASBs) 26.0 14.1 28.3 30.9 31.2
Favorable Attitudes Toward ASB 45.1 30.5 54.3 46.0 47.8
Friends’ ATOD Use 40.2 21.3 47.3 46.6 46.8
Interaction with Antisocial Peers 46.6 30.8 56.0 48.0 51.9
Rewards for Antisocial Involvement 40.4 45.7 39.6 39.1 38.1
Rebelliousness 28.2 28.0 22.6 29.3 30.3
Sensation Seeking 32.9 27.8 36.0 38.3 34.6
Protective Factors
Peer Disapproval of ATOD Use 60.1 74.1 56.0 54.3 53.9
Belief in the Moral Order 47.7 57.4 54.3 39.2 38.5
Educational Aspirations 40.7 34.6 38.0 45.6 46.5
Inde
xes
Risk Factor Index
Low Risk (0 to 9 Risk Factors) 60.8 75.7 59.7 56.2 53.3
Moderate Risk (10 to 14 Risk Factors) 22.6 17.7 22.4 23.5 25.3
High Risk (15 to 24 Risk Factors) 16.7 6.6 18.0 20.3 21.4
Protective Factor Index
Low Protection (0 to 3 Protective Factors) 34.6 29.5 36.2 36.5 40.8
Moderate Protection (4 to 6 Protective Factors) 39.8 40.7 36.9 40.0 39.9
High Protection (7 to 10 Protective Factors) 25.6 29.8 26.9 23.5 19.3
NOTES: The percentages above represent the percentage of students who are either at risk for or who have protection fromdeveloping a substance abuse problem. Cutpoints for each risk and protective factor are different for each grade level (seeChapter 3). Overall estimates in the current table are based on using a grade combined weight. Statewide percentages are usedas comparison points for determining which factors should be targeted in various communities or subgroups. Risk factors aboveand protective factors below the statewide percentages should be considered critical factors to address in prevention efforts.Meeting the cutpoint criteria for a particular risk factor significantly increases one’s likelihood of having or developing asubstance abuse problem, but does not guarantee that a substance abuse problem will exist. Similarly, meeting the cutpoint for aprotective factor significantly increases one’s likelihood of being protected from developing a substance abuse problem, but doesnot guarantee that a substance abuse problem will be avoided. The likelihood of a substance abuse problem increases with thenumber of risk factors to which a student is exposed and decreases with the number of protective factors to which a student isexposed. The risk and protective factor indexes provide the best indication of degree of risk and protection.

Risk and Protective Factors
473
amount of exposure to risk factors should increase, and the amount of exposure to protective factorsshould decrease, as the student advances in grade. The risk and protective factor indexes at the end ofTable 67 address this belief. As seen in Table 67, a greater number of students in the higher grade levelsare exposed to a high number of risk factors (15 or more risk factors). Eighteen percent of the 8thgraders, 20% of the 10th graders, and 21% of the 12th graders are exposed to 15 or more risk factors,whereas only 7% of 6th graders are exposed to 15 or more risk factors. The amount of protection, on theother hand, is lower in the higher grade levels. Thirty percent of the 6th graders have high protection bybeing exposed to seven or more protective factors, whereas only 27% of 8th graders, 24% of 10th graders,and 19% of 12th graders have high protection.
School-Type Comparisons
The following section begins by comparing public to private school students on the number of risk andprotective factors to which they are exposed (i.e., risk and protective factor indexes). Next, school-typecomparisons are made by examining the individual risk and protective factors that are above or below thestatewide percentages for private versus public school students. Prevention efforts should focus onreducing risk factors that are above the statewide percentages and enhancing protective factors that arebelow the statewide percentages. The category of private school students includes students who attendeither private schools or charter schools.
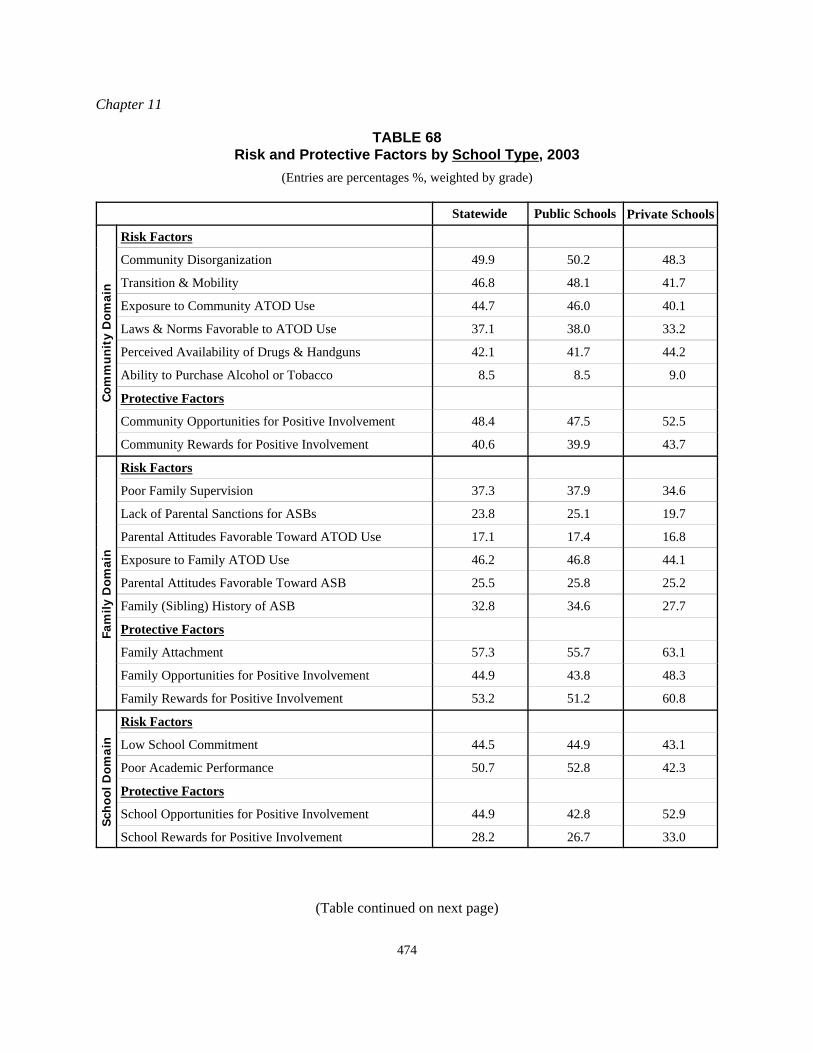
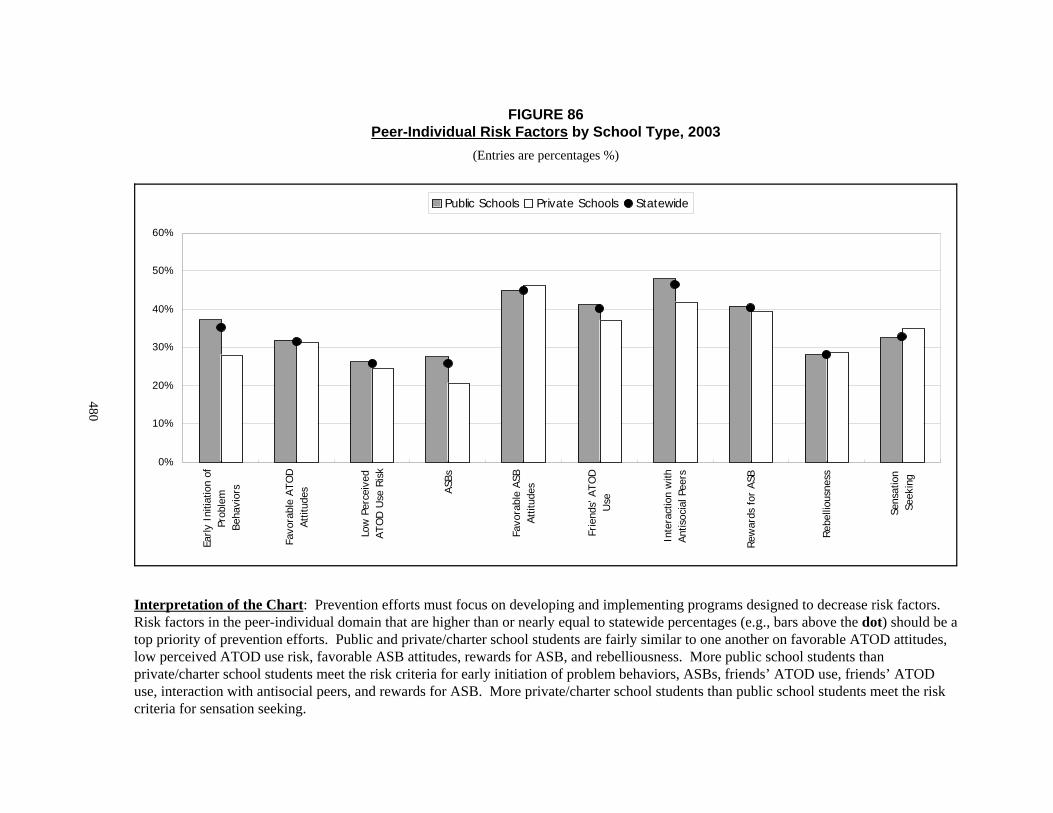
Table 68 lists the percentages of students in public versus private schools who meet each risk andprotective factor, and lists the percentages of students who are exposed to a high, moderate, or lownumber of factors. Figures 83 through 86 display each risk factor in each domain so that public andprivate school students can be compared to each other, as well as to statewide percentages. Figure 87displays each protective factor in each domain so that public and private school students can be comparedto each other, as well as to statewide percentages. Bars represent public and private school percentages,and dots represent statewide percentages. Bars above the dots on the risk factor figures representelevated risk, and bars below the dots on the protective factor figures represent low levels of protection. Prevention efforts should address risk factors that are higher than statewide averages and protectivefactors that are lower than statewide averages.
Overview of Key Findings. A greater percentage of public school students than private schoolstudents are exposed to a high number of risk factors, whereas a greater percentage of private schoolstudents than public school students are exposed to a high number of protective factors. Thus, publicschool students are at greater risk than private school students for substance use and delinquency. Although a greater proportion of public school students than private school students typically meet therisk criteria for each risk factor, there are instances when public and private school students are similar toone another, and there are a few cases where more private school students meet the risk criteria thanpublic school students. A greater proportion of private school students had elevated protection on variousprotective factors than public school students.
! Comparisons on the risk factor index show that a greater percentage of public schoolstudents (17%) than private school students (15%) are exposed to a high number of riskfactors (15 or more).
Chapter 11
474
TABLE 68Risk and Protective Factors by School Type, 2003
(Entries are percentages %, weighted by grade)
Statewide Public Schools Private Schools
Com
mu
nit
y D
omai
n
Risk Factors
Community Disorganization 49.9 50.2 48.3
Transition & Mobility 46.8 48.1 41.7
Exposure to Community ATOD Use 44.7 46.0 40.1
Laws & Norms Favorable to ATOD Use 37.1 38.0 33.2
Perceived Availability of Drugs & Handguns 42.1 41.7 44.2
Ability to Purchase Alcohol or Tobacco 8.5 8.5 9.0
Protective Factors
Community Opportunities for Positive Involvement 48.4 47.5 52.5
Community Rewards for Positive Involvement 40.6 39.9 43.7
Fam
ily D
omai
n
Risk Factors
Poor Family Supervision 37.3 37.9 34.6
Lack of Parental Sanctions for ASBs 23.8 25.1 19.7
Parental Attitudes Favorable Toward ATOD Use 17.1 17.4 16.8
Exposure to Family ATOD Use 46.2 46.8 44.1
Parental Attitudes Favorable Toward ASB 25.5 25.8 25.2
Family (Sibling) History of ASB 32.8 34.6 27.7
Protective Factors
Family Attachment 57.3 55.7 63.1
Family Opportunities for Positive Involvement 44.9 43.8 48.3
Family Rewards for Positive Involvement 53.2 51.2 60.8
Sch
ool D
omai
n
Risk Factors
Low School Commitment 44.5 44.9 43.1
Poor Academic Performance 50.7 52.8 42.3
Protective Factors
School Opportunities for Positive Involvement 44.9 42.8 52.9
School Rewards for Positive Involvement 28.2 26.7 33.0
(Table continued on next page)
Risk and Protective Factors
475
TABLE 68 (continued)Risk and Protective Factors by School Type, 2003
(Entries are percentages %, weighted by grade)
Statewide Public Schools Private Schools
Pee
r-In
divi
dual
Dom
ain
Risk Factors
Early Initiation of Problem Behaviors 35.3 37.3 28.0
Favorable Attitudes Toward ATOD Use 31.6 31.9 31.4
Low Perceived ATOD Use Risk 26.0 26.3 24.7
Antisocial Behaviors (ASBs) 26.0 27.5 20.6
Favorable Attitudes Toward ASB 45.1 45.1 46.4
Friends’ ATOD Use 40.2 41.3 37.1
Interaction with Antisocial Peers 46.6 48.0 42.0
Rewards for Antisocial Involvement 40.4 40.8 39.3
Rebelliousness 28.2 28.2 28.7
Sensation Seeking 32.9 32.6 34.9
Protective Factors
Peer Disapproval of ATOD Use 60.1 59.7 60.9
Belief in the Moral Order 47.7 47.0 48.9
Educational Aspirations 40.7 36.8 56.6
Inde
xes
Risk Factor Index
Low Risk (0 to 9 Risk Factors) 60.8 59.1 65.5
Moderate Risk (10 to 14 Risk Factors) 22.6 23.6 19.7
High Risk (15 to 24 Risk Factors) 16.7 17.4 14.8
Protective Factor Index
Low Protection (0 to 3 Protective Factors) 34.6 36.6 27.1
Moderate Protection (4 to 6 Protective Factors) 39.8 40.0 39.2
High Protection (7 to 10 Protective Factors) 25.6 23.4 33.8
NOTES: The percentages above represent the percentage of students who are either at risk for or who have protection fromdeveloping a substance abuse problem. Overall estimates in the current table are based on using a grade combined weight. Statewide percentages are used as comparison points for determining which risk and protective factors should be targeted invarious communities or subgroups. Risk factors above and protective factors below the statewide percentages should beconsidered critical factors to address in prevention efforts. Having a particular risk factor significantly increases one’s likelihoodof having or developing a substance abuse problem, but does not guarantee that a substance abuse problem will exist. Similarly,having a protective factor significantly increases one’s likelihood of being protected from developing a substance abuse problem,but does not guarantee that a substance abuse problem will be avoided. The likelihood of a substance abuse problem increaseswith the number of risk factors to which a student is exposed and decreases with the number of protective factors to which astudent is exposed. The risk and protective factor indexes provide the best indication of degree of risk and protection. Thecategory of private schools included both private and charter schools.
Chapter 11
476
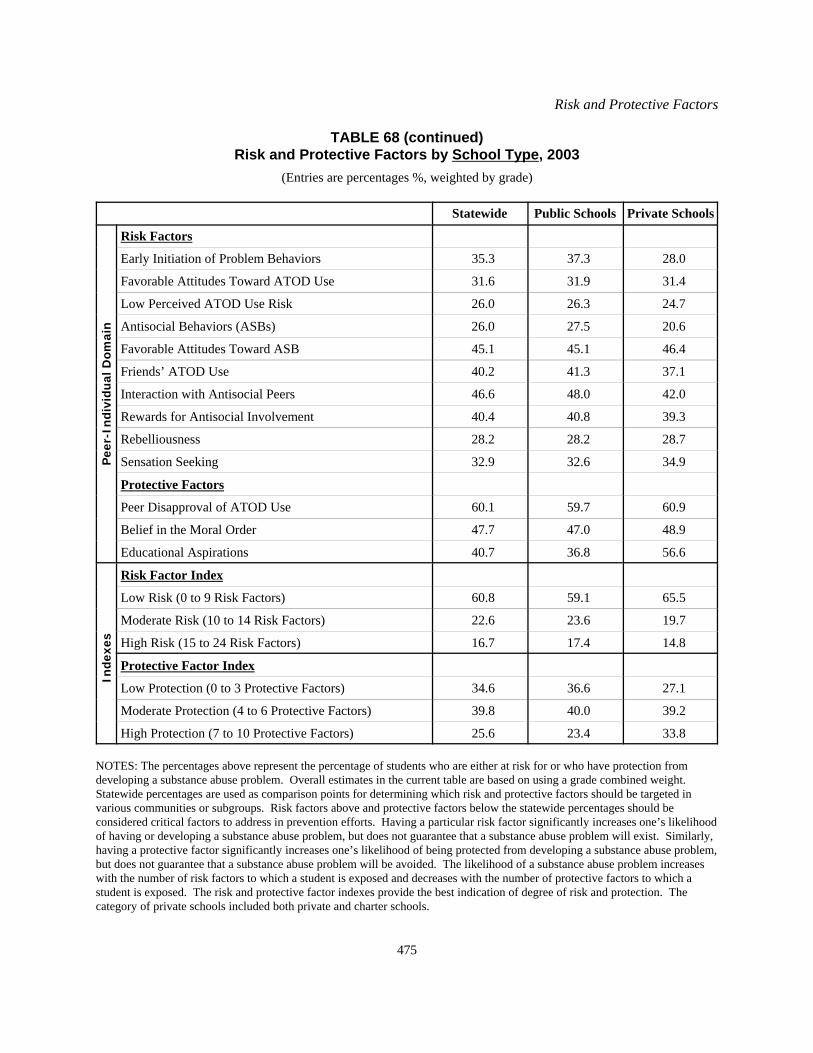
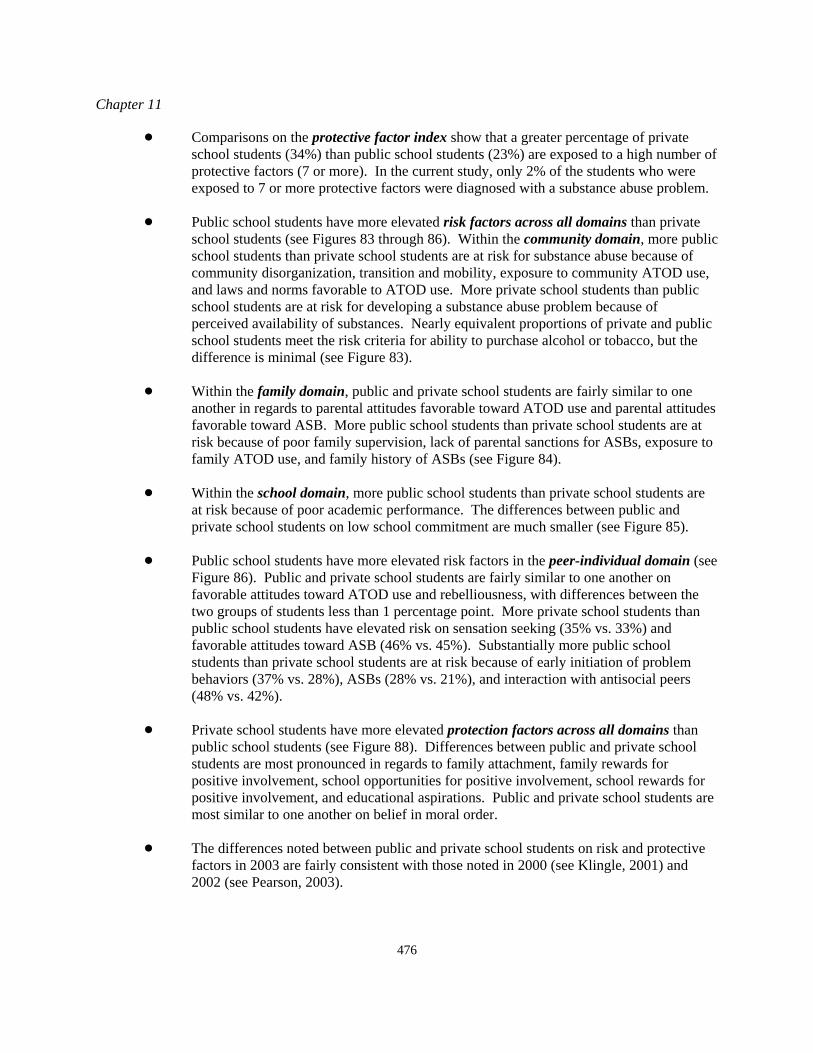
! Comparisons on the protective factor index show that a greater percentage of privateschool students (34%) than public school students (23%) are exposed to a high number ofprotective factors (7 or more). In the current study, only 2% of the students who wereexposed to 7 or more protective factors were diagnosed with a substance abuse problem.
! Public school students have more elevated risk factors across all domains than privateschool students (see Figures 83 through 86). Within the community domain, more publicschool students than private school students are at risk for substance abuse because ofcommunity disorganization, transition and mobility, exposure to community ATOD use,and laws and norms favorable to ATOD use. More private school students than publicschool students are at risk for developing a substance abuse problem because ofperceived availability of substances. Nearly equivalent proportions of private and publicschool students meet the risk criteria for ability to purchase alcohol or tobacco, but thedifference is minimal (see Figure 83).
! Within the family domain, public and private school students are fairly similar to oneanother in regards to parental attitudes favorable toward ATOD use and parental attitudesfavorable toward ASB. More public school students than private school students are atrisk because of poor family supervision, lack of parental sanctions for ASBs, exposure tofamily ATOD use, and family history of ASBs (see Figure 84).
! Within the school domain, more public school students than private school students areat risk because of poor academic performance. The differences between public andprivate school students on low school commitment are much smaller (see Figure 85).
! Public school students have more elevated risk factors in the peer-individual domain (seeFigure 86). Public and private school students are fairly similar to one another onfavorable attitudes toward ATOD use and rebelliousness, with differences between thetwo groups of students less than 1 percentage point. More private school students thanpublic school students have elevated risk on sensation seeking (35% vs. 33%) andfavorable attitudes toward ASB (46% vs. 45%). Substantially more public schoolstudents than private school students are at risk because of early initiation of problembehaviors (37% vs. 28%), ASBs (28% vs. 21%), and interaction with antisocial peers(48% vs. 42%).
! Private school students have more elevated protection factors across all domains thanpublic school students (see Figure 88). Differences between public and private schoolstudents are most pronounced in regards to family attachment, family rewards forpositive involvement, school opportunities for positive involvement, school rewards forpositive involvement, and educational aspirations. Public and private school students aremost similar to one another on belief in moral order.
! The differences noted between public and private school students on risk and protectivefactors in 2003 are fairly consistent with those noted in 2000 (see Klingle, 2001) and2002 (see Pearson, 2003).
Risk and Protective Factors
477
0%
10%
20%
30%
40%
50%
60%
CommunityDisorganization
Transition &Mobility
Exposure toCommunity ATOD
Use
Laws & NormsFavorable toATOD Use
PerceivedAvailability of
Drugs &Handguns
Ability toPurchase Alcohol
or Tobacco
Public Schools Private Schools Statewide
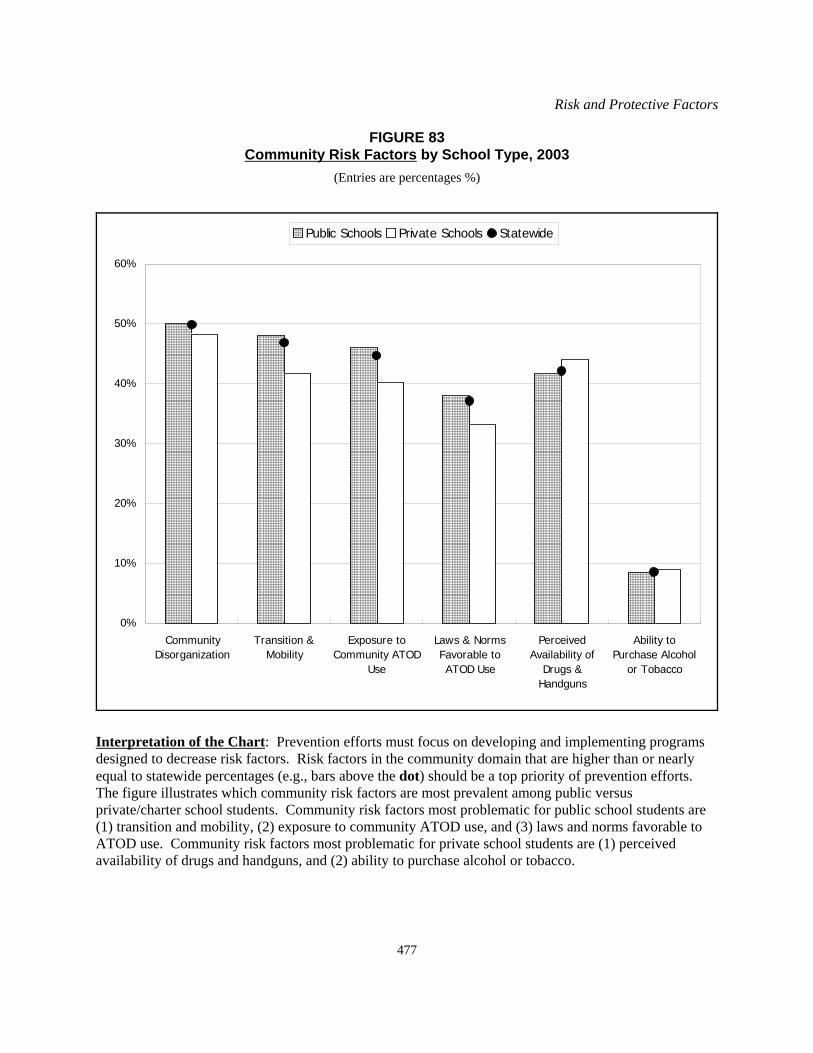
FIGURE 83Community Risk Factors by School Type, 2003
(Entries are percentages %)
Interpretation of the Chart: Prevention efforts must focus on developing and implementing programsdesigned to decrease risk factors. Risk factors in the community domain that are higher than or nearlyequal to statewide percentages (e.g., bars above the dot) should be a top priority of prevention efforts. The figure illustrates which community risk factors are most prevalent among public versusprivate/charter school students. Community risk factors most problematic for public school students are(1) transition and mobility, (2) exposure to community ATOD use, and (3) laws and norms favorable toATOD use. Community risk factors most problematic for private school students are (1) perceivedavailability of drugs and handguns, and (2) ability to purchase alcohol or tobacco.
Chapter 11
478
0%
10%
20%
30%
40%
50%
60%
Poor FamilySupervision
Lack of ParentalSanctions for
ASBs
FavorableParental ATOD
Attitudes
Exposure toFamily ATOD Use
FavorableParental ASB
Attitudes
Family History ofASB
Public Schools Private Schools Statewide
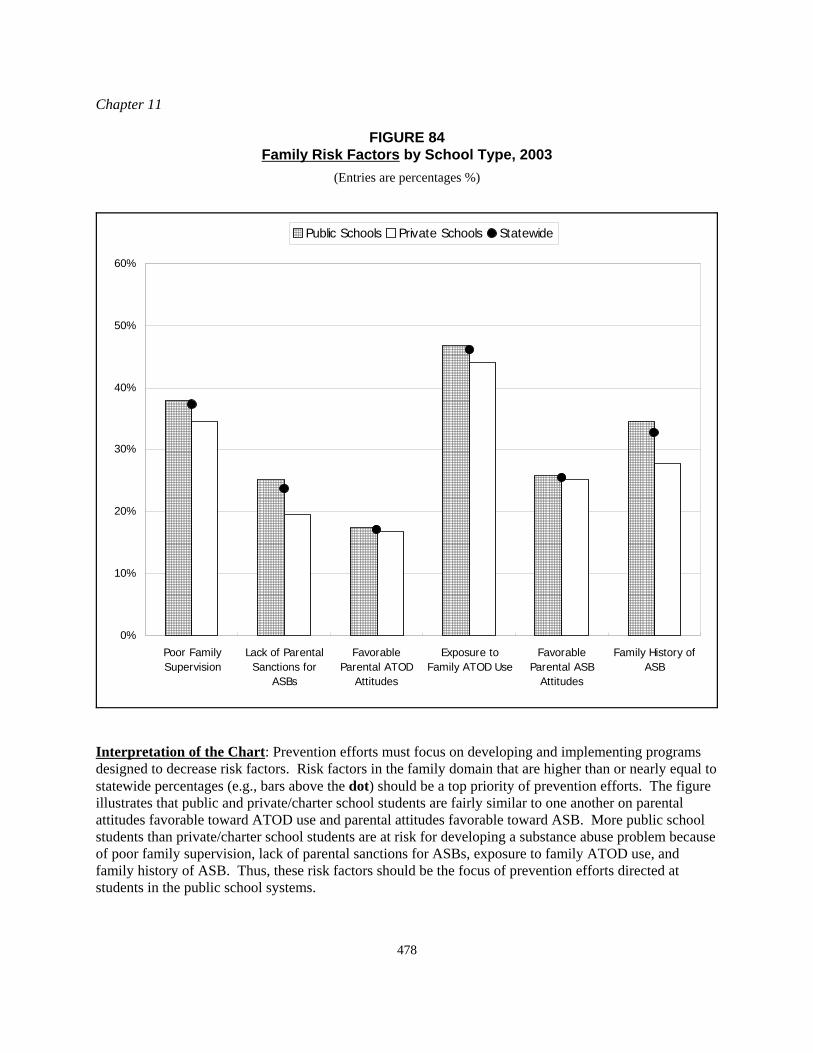
FIGURE 84Family Risk Factors by School Type, 2003
(Entries are percentages %)
Interpretation of the Chart: Prevention efforts must focus on developing and implementing programsdesigned to decrease risk factors. Risk factors in the family domain that are higher than or nearly equal tostatewide percentages (e.g., bars above the dot) should be a top priority of prevention efforts. The figureillustrates that public and private/charter school students are fairly similar to one another on parentalattitudes favorable toward ATOD use and parental attitudes favorable toward ASB. More public schoolstudents than private/charter school students are at risk for developing a substance abuse problem becauseof poor family supervision, lack of parental sanctions for ASBs, exposure to family ATOD use, andfamily history of ASB. Thus, these risk factors should be the focus of prevention efforts directed atstudents in the public school systems.
Risk and Protective Factors
479
0%
10%
20%
30%
40%
50%
60%
Low School Commitment Poor Academic Performance
Public Schools Private Schools Statewide
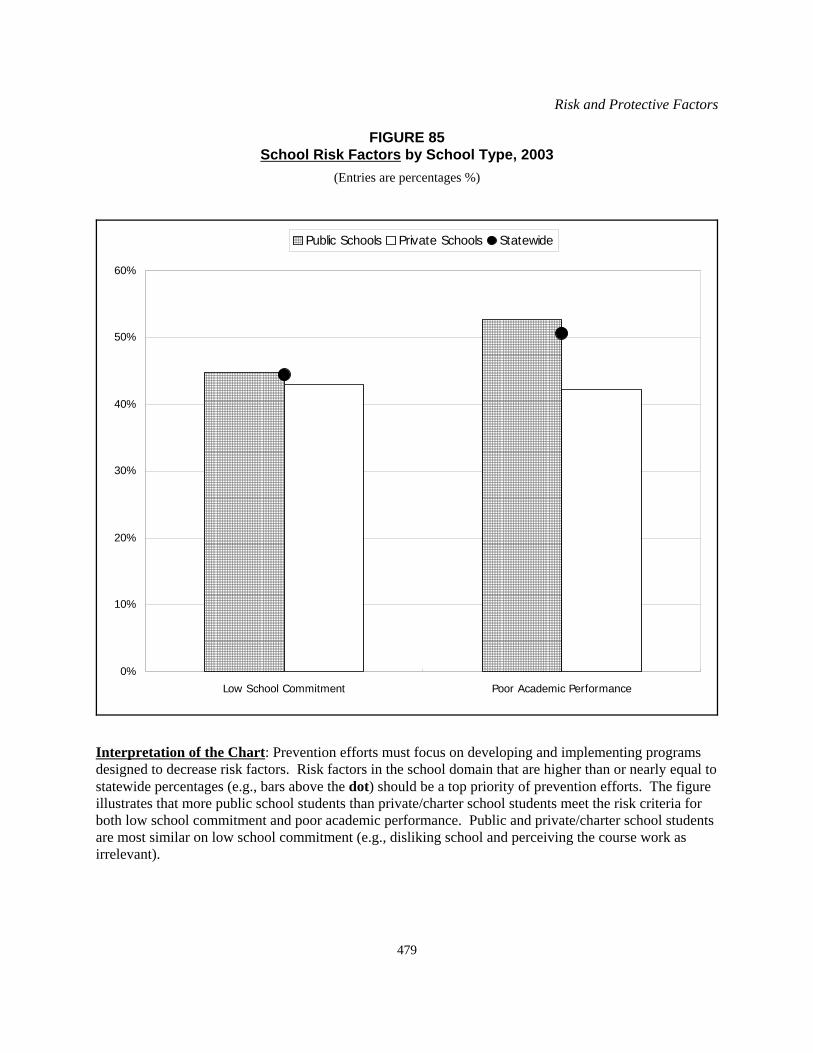
FIGURE 85School Risk Factors by School Type, 2003
(Entries are percentages %)
Interpretation of the Chart: Prevention efforts must focus on developing and implementing programsdesigned to decrease risk factors. Risk factors in the school domain that are higher than or nearly equal tostatewide percentages (e.g., bars above the dot) should be a top priority of prevention efforts. The figureillustrates that more public school students than private/charter school students meet the risk criteria forboth low school commitment and poor academic performance. Public and private/charter school studentsare most similar on low school commitment (e.g., disliking school and perceiving the course work asirrelevant).
0%
10%
20%
30%
40%
50%
60%
Early
Ini
tiatio
n of
Prob
lem
Beha
vior
s
Favo
rabl
e AT
OD
Attit
udes
Low
Per
ceiv
edAT
OD
Use
Ris
k
ASBs
Favo
rabl
e AS
BAt
titud
es
Frie
nds'
ATO
DU
se
Inte
ract
ion
with
Antis
ocia
l Pee
rs
Rew
ards
for
ASB
Rebe
lliou
snes
s
Sens
atio
nSe
ekin
g
Public Schools Private Schools Statewide
FIGURE 86Peer-Individual Risk Factors by School Type, 2003
(Entries are percentages %)
Interpretation of the Chart: Prevention efforts must focus on developing and implementing programs designed to decrease risk factors. Risk factors in the peer-individual domain that are higher than or nearly equal to statewide percentages (e.g., bars above the dot) should be atop priority of prevention efforts. Public and private/charter school students are fairly similar to one another on favorable ATOD attitudes,low perceived ATOD use risk, favorable ASB attitudes, rewards for ASB, and rebelliousness. More public school students thanprivate/charter school students meet the risk criteria for early initiation of problem behaviors, ASBs, friends’ ATOD use, friends’ ATODuse, interaction with antisocial peers, and rewards for ASB. More private/charter school students than public school students meet the riskcriteria for sensation seeking.
480
Risk and Protective Factors
481
0%
10%
20%
30%
40%
50%
60%
70%
Com
mun
ityO
ppor
tuni
ties
Com
mun
ityRe
war
ds
Fam
ily A
ttach
men
t
Fam
ilyO
ppor
tuni
ties
Fam
ily R
ewar
ds
Scho
olO
ppor
tuni
ties
Scho
ol R
ewar
ds
Peer
Dis
appr
oval
of
ATO
D U
se
Belie
f in
Mor
alO
rder
Educ
atio
nal
Aspi
ratio
ns
Public Schools Private Schools Statewide
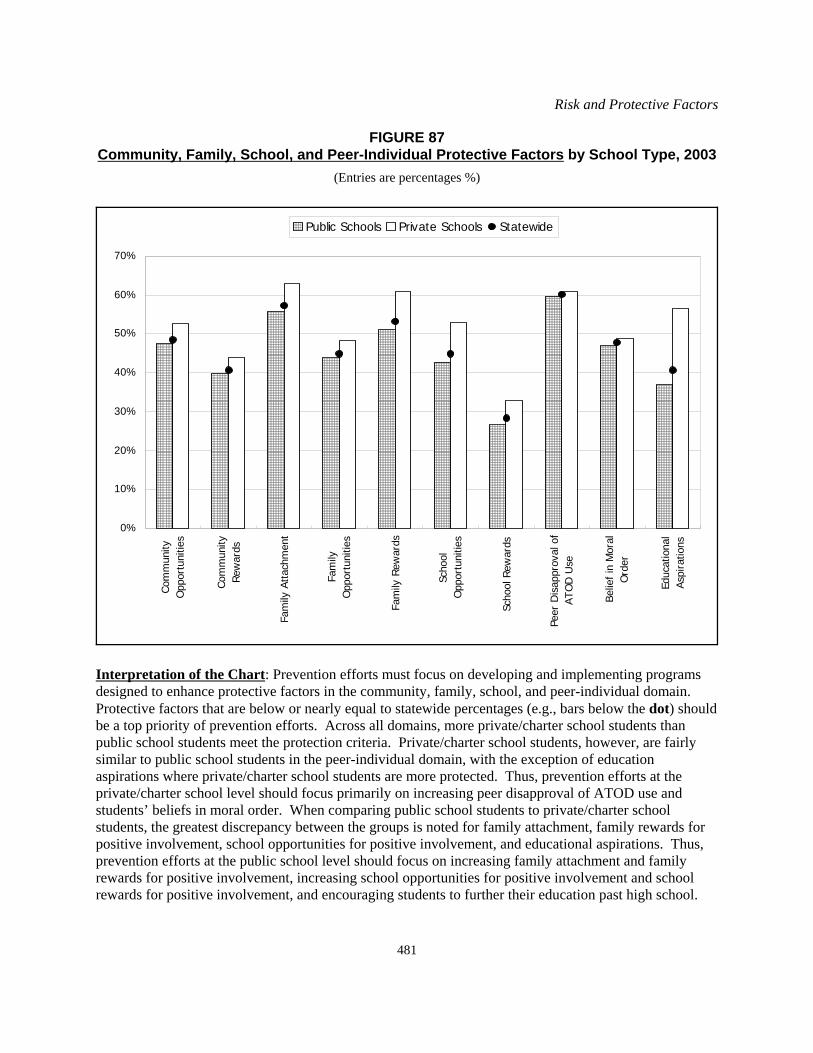
FIGURE 87Community, Family, School, and Peer-Individual Protective Factors by School Type, 2003
(Entries are percentages %)
Interpretation of the Chart: Prevention efforts must focus on developing and implementing programsdesigned to enhance protective factors in the community, family, school, and peer-individual domain. Protective factors that are below or nearly equal to statewide percentages (e.g., bars below the dot) shouldbe a top priority of prevention efforts. Across all domains, more private/charter school students thanpublic school students meet the protection criteria. Private/charter school students, however, are fairlysimilar to public school students in the peer-individual domain, with the exception of educationaspirations where private/charter school students are more protected. Thus, prevention efforts at theprivate/charter school level should focus primarily on increasing peer disapproval of ATOD use andstudents’ beliefs in moral order. When comparing public school students to private/charter schoolstudents, the greatest discrepancy between the groups is noted for family attachment, family rewards forpositive involvement, school opportunities for positive involvement, and educational aspirations. Thus,prevention efforts at the public school level should focus on increasing family attachment and familyrewards for positive involvement, increasing school opportunities for positive involvement and schoolrewards for positive involvement, and encouraging students to further their education past high school.
Chapter 11
482
County-Level (Place of Residence) Comparisons
The following section begins by comparing students from different counties on the number of risk andprotective factors to which they are exposed (i.e., risk and protective factor indexes). Next, countycomparisons are made by examining the individual risk and protective factors that are above or below thestatewide percentages. Prevention efforts should focus on reducing risk factors that are above thestatewide percentages and enhancing protective factors that are below the statewide percentages. Countydefinitions are based on place of residence and include public, private, and charter school students.
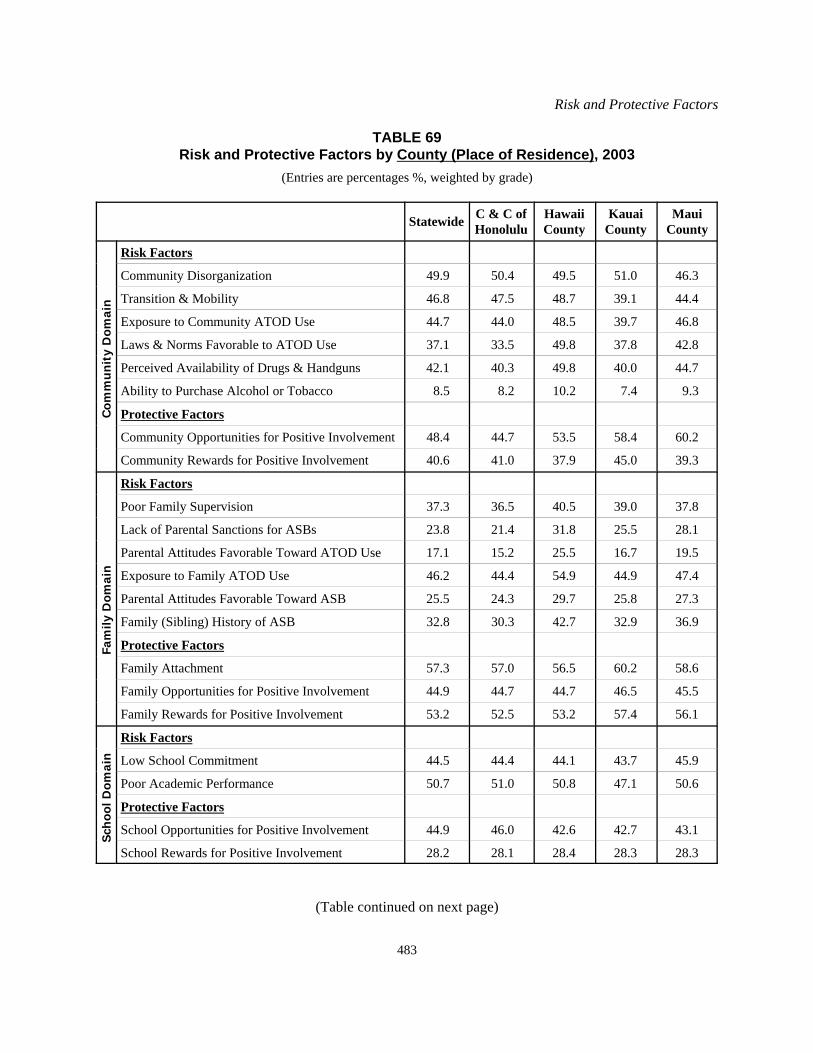
Table 69 lists the percentages of students in each county who meet each risk and protective factor, and thepercentages of students who are exposed to a high, moderate, or low number of factors. Figures 88through 91 display each risk factor in each domain so that counties can be compared to each other, as wellas to statewide percentages. Figure 92 displays each protective factor in each domain for the samepurposes. Bars represent county percentages, and dots represent statewide percentages. Bars above thedots on the risk factor figures represent elevated risk, and bars below the dots on the protective factorfigures represent low levels of protection. Prevention efforts should address risk factors that are higherthan statewide averages and protective factors that are lower than statewide averages.
Overview of Key Findings. Hawaii County, followed by Maui County, has the largest proportion ofstudents with elevated risk on the risk factor index (15 or more risk factors). Hawaii County has thesmallest proportion of students with high protection (7 or more protective factors) and the largestproportion of students with low protection (3 or fewer protective factors) on the protective factor index. On each specific risk factor, Hawaii and Maui Counties typically have the greatest proportion of studentsmeeting the risk criteria. No one county clearly has a larger proportion of students with elevatedprotection across each protective factor, although Kauai County is higher than other counties on a numberof protective factors.
! Comparisons on the risk factor index show that a greater percentage of students inHawaii County (24%) than in the City & County of Honolulu (15%), and Kauai (14%)and Maui Counties (20%) are exposed to a high number of risk factors (15 or more). This is consistent with 2000 reports where Hawaii County had the highest proportion ofstudents with elevated risk. Back in 2002, the City & County of Honolulu had thehighest proportion of students with elevated risk, which corresponded with prevalencerates rising in 2002 for the City & County of Honolulu.
! County differences on the protective factor index also show Hawaii County students asmost vulnerable. Only 24% of Hawaii County students have high protection (7 to 10protective factors), compared to 26% in the City & County of Honolulu and MauiCounty, and 31% in Kauai County.
Risk factors that should be prioritized in each county can be noted by scanning Figures 88 through 91 andby looking for bars that are above or equal to the dots in the figures. Protective factors that should be prioritized in each county can be noted by scanning Figure 92 and by looking for bars that are below orequal to the dots in the figure. Table 71 summarizes the county-level comparisons by placing a date (‘00,‘02, ‘03, and/or all) to indicate the year in which the risk or protective factor was problematic. Preventionefforts should focus on factors that have become or that remain problematic in 2003.
Risk and Protective Factors
483
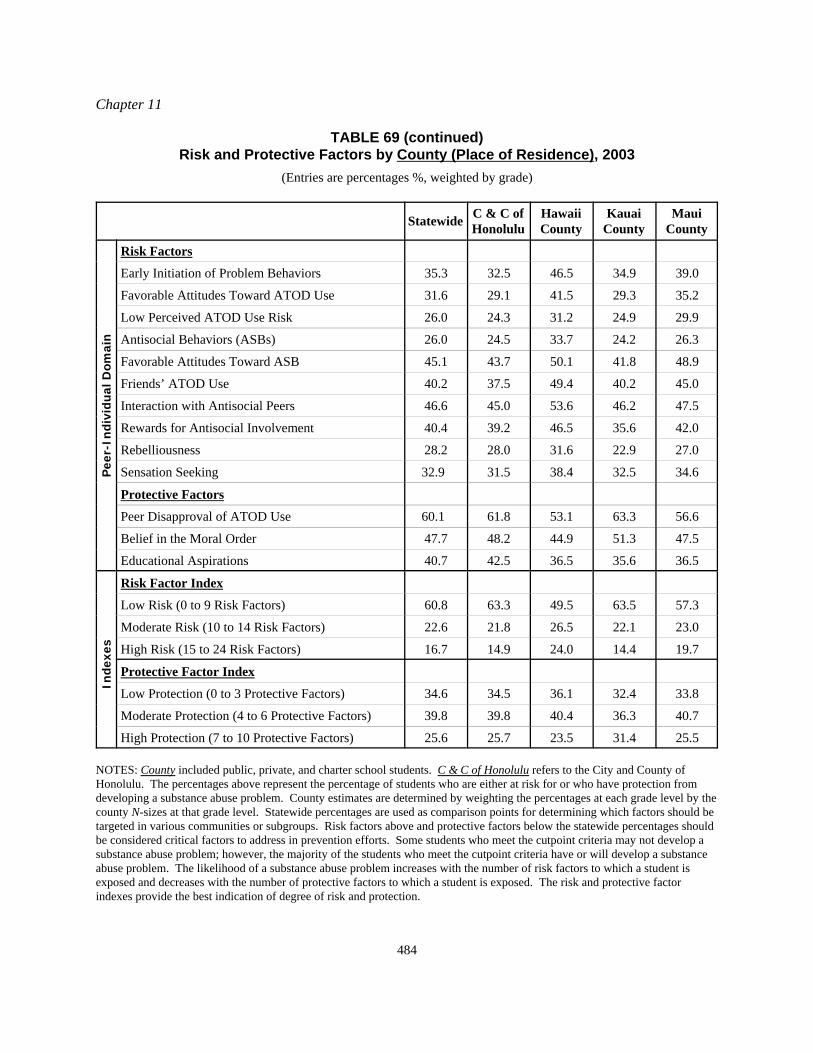
TABLE 69Risk and Protective Factors by County (Place of Residence), 2003
(Entries are percentages %, weighted by grade)
Statewide C & C ofHonolulu
HawaiiCounty
KauaiCounty
MauiCounty
Com
mu
nit
y D
omai
n
Risk Factors
Community Disorganization 49.9 50.4 49.5 51.0 46.3
Transition & Mobility 46.8 47.5 48.7 39.1 44.4
Exposure to Community ATOD Use 44.7 44.0 48.5 39.7 46.8
Laws & Norms Favorable to ATOD Use 37.1 33.5 49.8 37.8 42.8
Perceived Availability of Drugs & Handguns 42.1 40.3 49.8 40.0 44.7
Ability to Purchase Alcohol or Tobacco 8.5 8.2 10.2 7.4 9.3
Protective Factors
Community Opportunities for Positive Involvement 48.4 44.7 53.5 58.4 60.2
Community Rewards for Positive Involvement 40.6 41.0 37.9 45.0 39.3
Fam
ily D
omai
n
Risk Factors
Poor Family Supervision 37.3 36.5 40.5 39.0 37.8
Lack of Parental Sanctions for ASBs 23.8 21.4 31.8 25.5 28.1
Parental Attitudes Favorable Toward ATOD Use 17.1 15.2 25.5 16.7 19.5
Exposure to Family ATOD Use 46.2 44.4 54.9 44.9 47.4
Parental Attitudes Favorable Toward ASB 25.5 24.3 29.7 25.8 27.3
Family (Sibling) History of ASB 32.8 30.3 42.7 32.9 36.9
Protective Factors
Family Attachment 57.3 57.0 56.5 60.2 58.6
Family Opportunities for Positive Involvement 44.9 44.7 44.7 46.5 45.5
Family Rewards for Positive Involvement 53.2 52.5 53.2 57.4 56.1
Sch
ool D
omai
n
Risk Factors
Low School Commitment 44.5 44.4 44.1 43.7 45.9
Poor Academic Performance 50.7 51.0 50.8 47.1 50.6
Protective Factors
School Opportunities for Positive Involvement 44.9 46.0 42.6 42.7 43.1
School Rewards for Positive Involvement 28.2 28.1 28.4 28.3 28.3
(Table continued on next page)
Chapter 11
484
TABLE 69 (continued)Risk and Protective Factors by County (Place of Residence), 2003
(Entries are percentages %, weighted by grade)
Statewide C & C ofHonolulu
HawaiiCounty
KauaiCounty
MauiCounty
Pee
r-In
divi
dual
Dom
ain
Risk Factors
Early Initiation of Problem Behaviors 35.3 32.5 46.5 34.9 39.0
Favorable Attitudes Toward ATOD Use 31.6 29.1 41.5 29.3 35.2
Low Perceived ATOD Use Risk 26.0 24.3 31.2 24.9 29.9
Antisocial Behaviors (ASBs) 26.0 24.5 33.7 24.2 26.3
Favorable Attitudes Toward ASB 45.1 43.7 50.1 41.8 48.9
Friends’ ATOD Use 40.2 37.5 49.4 40.2 45.0
Interaction with Antisocial Peers 46.6 45.0 53.6 46.2 47.5
Rewards for Antisocial Involvement 40.4 39.2 46.5 35.6 42.0
Rebelliousness 28.2 28.0 31.6 22.9 27.0
Sensation Seeking 32.9 31.5 38.4 32.5 34.6
Protective Factors
Peer Disapproval of ATOD Use 60.1 61.8 53.1 63.3 56.6
Belief in the Moral Order 47.7 48.2 44.9 51.3 47.5
Educational Aspirations 40.7 42.5 36.5 35.6 36.5
Inde
xes
Risk Factor Index
Low Risk (0 to 9 Risk Factors) 60.8 63.3 49.5 63.5 57.3
Moderate Risk (10 to 14 Risk Factors) 22.6 21.8 26.5 22.1 23.0
High Risk (15 to 24 Risk Factors) 16.7 14.9 24.0 14.4 19.7
Protective Factor Index
Low Protection (0 to 3 Protective Factors) 34.6 34.5 36.1 32.4 33.8
Moderate Protection (4 to 6 Protective Factors) 39.8 39.8 40.4 36.3 40.7
High Protection (7 to 10 Protective Factors) 25.6 25.7 23.5 31.4 25.5
NOTES: County included public, private, and charter school students. C & C of Honolulu refers to the City and County ofHonolulu. The percentages above represent the percentage of students who are either at risk for or who have protection fromdeveloping a substance abuse problem. County estimates are determined by weighting the percentages at each grade level by thecounty N-sizes at that grade level. Statewide percentages are used as comparison points for determining which factors should betargeted in various communities or subgroups. Risk factors above and protective factors below the statewide percentages shouldbe considered critical factors to address in prevention efforts. Some students who meet the cutpoint criteria may not develop asubstance abuse problem; however, the majority of the students who meet the cutpoint criteria have or will develop a substanceabuse problem. The likelihood of a substance abuse problem increases with the number of risk factors to which a student isexposed and decreases with the number of protective factors to which a student is exposed. The risk and protective factorindexes provide the best indication of degree of risk and protection.
Risk and Protective Factors
485
0%
10%
20%
30%
40%
50%
60%
CommunityDisorganization
Transition &Mobility
Exposure toCommunity ATOD
Use
Laws & NormsFavorable toATOD Use
PerceivedAvailability of
Drugs &Handguns
Ability toPurchase Alcohol
or Tobacco
C&C of Honolulu Hawaii County Kauai County Maui County Statewide
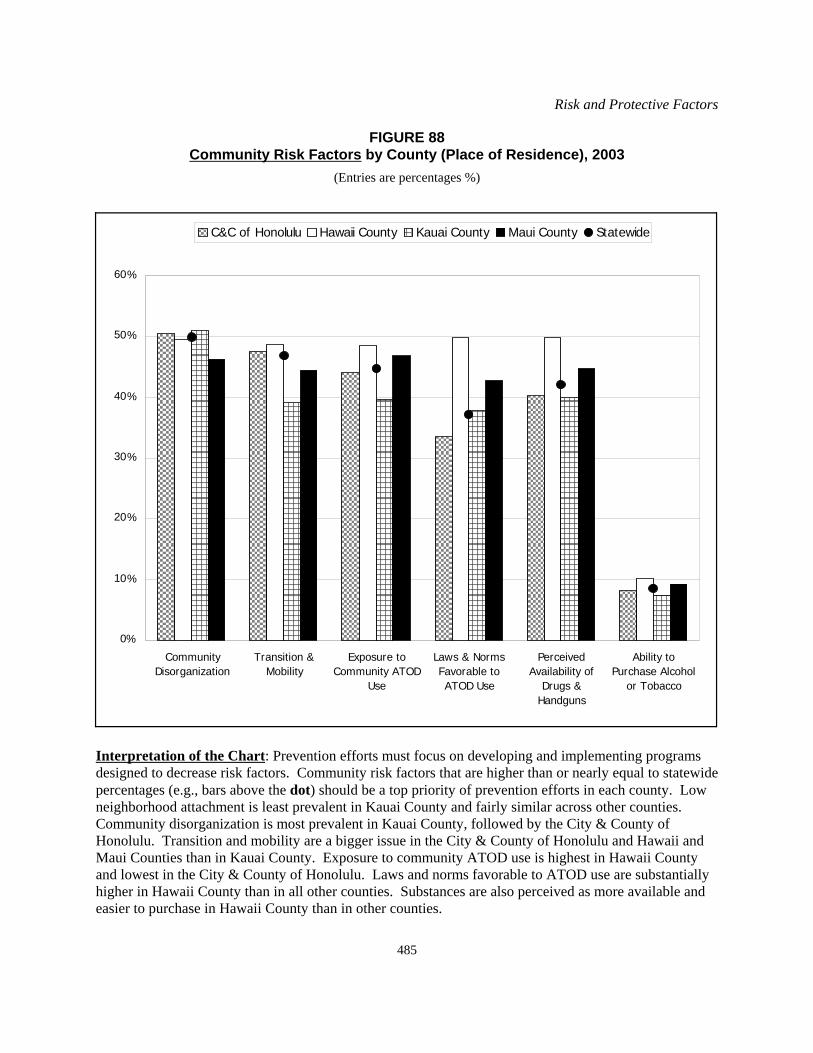
FIGURE 88Community Risk Factors by County (Place of Residence), 2003
(Entries are percentages %)
Interpretation of the Chart: Prevention efforts must focus on developing and implementing programsdesigned to decrease risk factors. Community risk factors that are higher than or nearly equal to statewidepercentages (e.g., bars above the dot) should be a top priority of prevention efforts in each county. Lowneighborhood attachment is least prevalent in Kauai County and fairly similar across other counties. Community disorganization is most prevalent in Kauai County, followed by the City & County ofHonolulu. Transition and mobility are a bigger issue in the City & County of Honolulu and Hawaii andMaui Counties than in Kauai County. Exposure to community ATOD use is highest in Hawaii Countyand lowest in the City & County of Honolulu. Laws and norms favorable to ATOD use are substantiallyhigher in Hawaii County than in all other counties. Substances are also perceived as more available andeasier to purchase in Hawaii County than in other counties.
Chapter 11
486
0%
10%
20%
30%
40%
50%
60%
Poor FamilySupervision
Lack of ParentalSanctions for
ASBs
FavorableParental ATOD
Attitudes
Exposure toFamily ATOD Use
FavorableParental ASB
Attitudes
Family History ofASB
C&C of Honolulu Hawaii County Kauai County Maui County Statewide
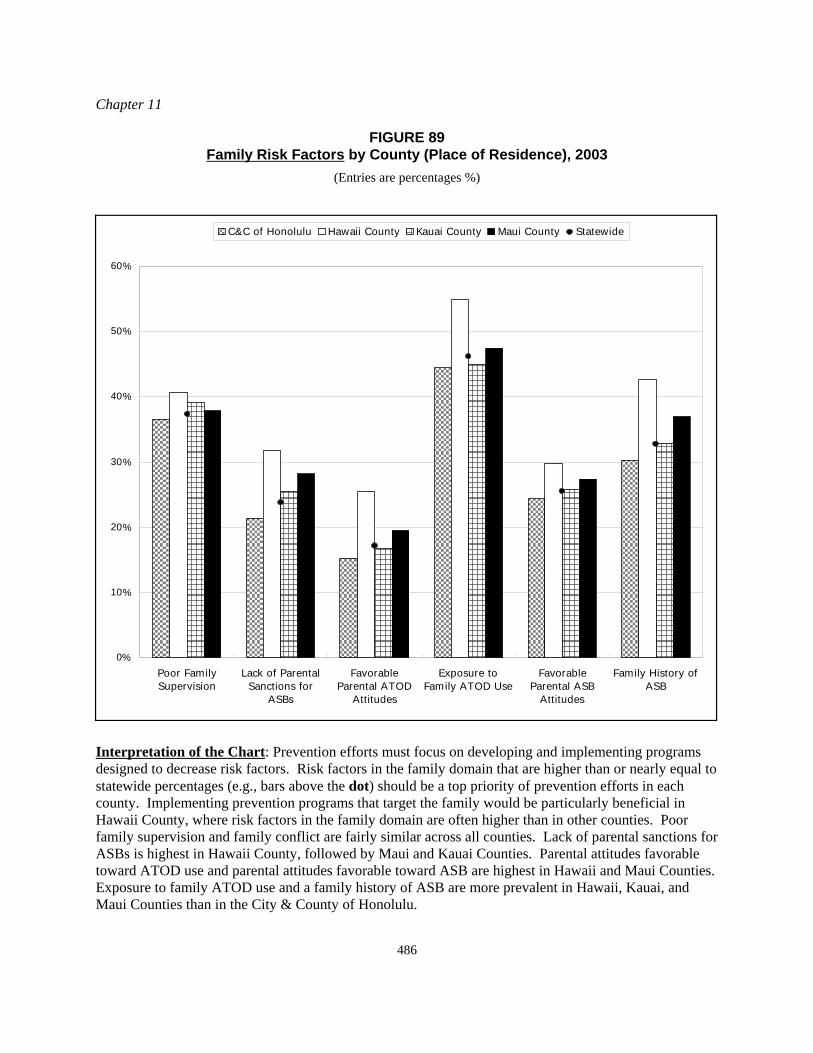
FIGURE 89Family Risk Factors by County (Place of Residence), 2003
(Entries are percentages %)
Interpretation of the Chart: Prevention efforts must focus on developing and implementing programsdesigned to decrease risk factors. Risk factors in the family domain that are higher than or nearly equal tostatewide percentages (e.g., bars above the dot) should be a top priority of prevention efforts in eachcounty. Implementing prevention programs that target the family would be particularly beneficial inHawaii County, where risk factors in the family domain are often higher than in other counties. Poorfamily supervision and family conflict are fairly similar across all counties. Lack of parental sanctions forASBs is highest in Hawaii County, followed by Maui and Kauai Counties. Parental attitudes favorabletoward ATOD use and parental attitudes favorable toward ASB are highest in Hawaii and Maui Counties. Exposure to family ATOD use and a family history of ASB are more prevalent in Hawaii, Kauai, andMaui Counties than in the City & County of Honolulu.
Risk and Protective Factors
487
0%
10%
20%
30%
40%
50%
60%
Low School Commitment Poor Academic Performance
C&C of Honolulu Hawaii County Kauai County Maui County Statewide
FIGURE 90School Risk Factors by County (Place of Residence), 2003
(Entries are percentages %)
Interpretation of the Chart: Prevention efforts must focus on developing and implementing programsdesigned to decrease risk factors. Risk factors in the school domain that are higher than or nearly equal tostatewide percentages (e.g., bars above the dot) should be a top priority of prevention efforts in eachcounty. Low school commitment is pretty similar across counties. However, Hawaii, Kauai, and MauiCounties are all slightly above the statewide average on low school commitment. Poor academicperformance is least prevalent in Hawaii County compared to other counties. The City & County ofHonolulu and Kauai and Maui Counties are equally high in regards to the percentage of students meetingthe risk criteria for poor academic performance.
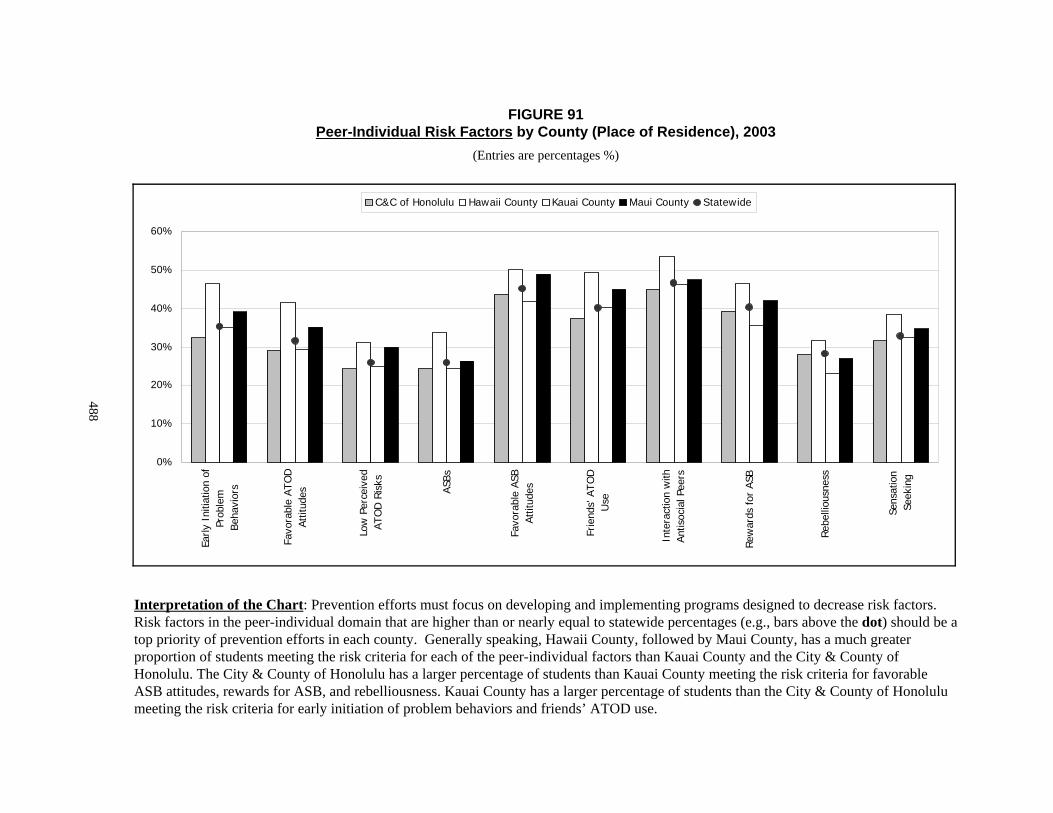
0%
10%
20%
30%
40%
50%
60%
Early
Ini
tiatio
n of
Prob
lem
Beha
vior
s
Favo
rabl
e AT
OD
Attit
udes
Low
Per
ceiv
edAT
OD
Ris
ks
ASBs
Favo
rabl
e AS
BAt
titud
es
Frie
nds'
ATO
DU
se
Inte
ract
ion
with
Antis
ocia
l Pee
rs
Rew
ards
for
ASB
Rebe
lliou
snes
s
Sens
atio
nSe
ekin
g
C&C of Honolulu Hawaii County Kauai County Maui County Statewide
FIGURE 91Peer-Individual Risk Factors by County (Place of Residence), 2003
(Entries are percentages %)
Interpretation of the Chart: Prevention efforts must focus on developing and implementing programs designed to decrease risk factors. Risk factors in the peer-individual domain that are higher than or nearly equal to statewide percentages (e.g., bars above the dot) should be atop priority of prevention efforts in each county. Generally speaking, Hawaii County, followed by Maui County, has a much greaterproportion of students meeting the risk criteria for each of the peer-individual factors than Kauai County and the City & County ofHonolulu. The City & County of Honolulu has a larger percentage of students than Kauai County meeting the risk criteria for favorableASB attitudes, rewards for ASB, and rebelliousness. Kauai County has a larger percentage of students than the City & County of Honolulumeeting the risk criteria for early initiation of problem behaviors and friends’ ATOD use.
488
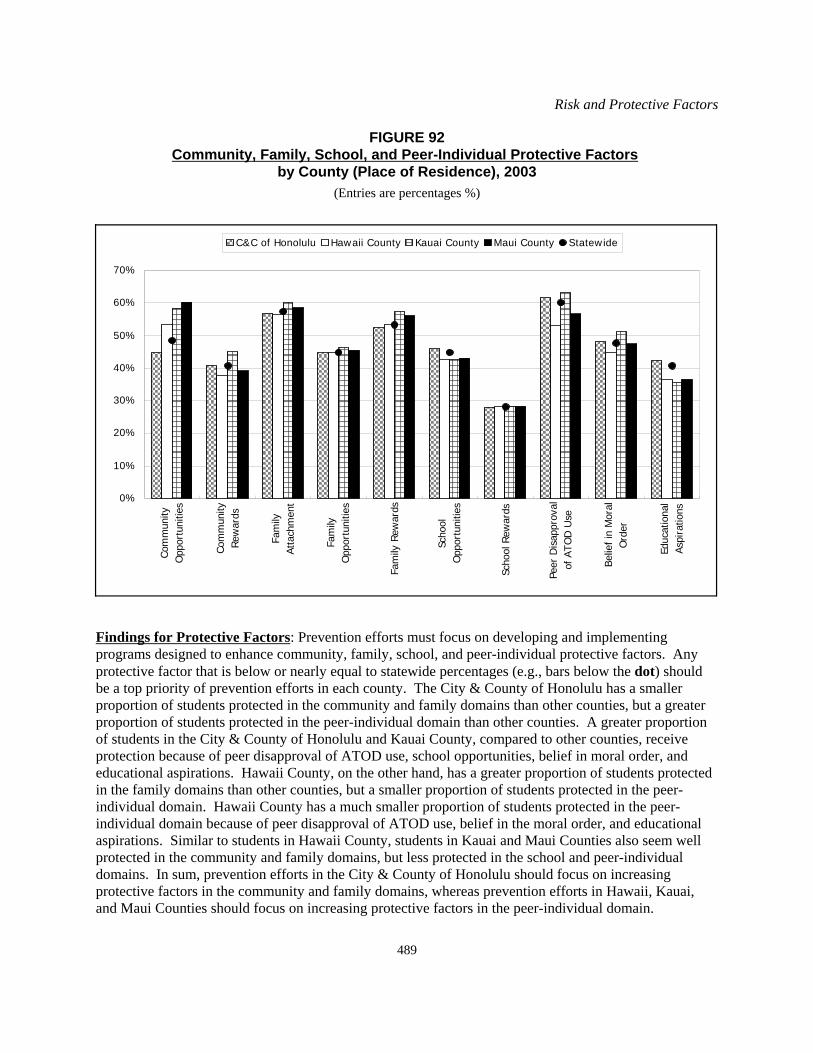
Risk and Protective Factors
489
0%
10%
20%
30%
40%
50%
60%
70%
Com
mun
ityO
ppor
tuni
ties
Com
mun
ityRe
war
ds
Fam
ilyAt
tach
men
t
Fam
ilyO
ppor
tuni
ties
Fam
ily R
ewar
ds
Scho
olO
ppor
tuni
ties
Scho
ol R
ewar
ds
Peer
Dis
appr
oval
of A
TOD
Use
Belie
f in
Mor
alO
rder
Educ
atio
nal
Aspi
ratio
ns
C&C of Honolulu Hawaii County Kauai County Maui County Statewide
FIGURE 92Community, Family, School, and Peer-Individual Protective Factors
by County (Place of Residence), 2003(Entries are percentages %)
Findings for Protective Factors: Prevention efforts must focus on developing and implementingprograms designed to enhance community, family, school, and peer-individual protective factors. Anyprotective factor that is below or nearly equal to statewide percentages (e.g., bars below the dot) shouldbe a top priority of prevention efforts in each county. The City & County of Honolulu has a smallerproportion of students protected in the community and family domains than other counties, but a greaterproportion of students protected in the peer-individual domain than other counties. A greater proportionof students in the City & County of Honolulu and Kauai County, compared to other counties, receiveprotection because of peer disapproval of ATOD use, school opportunities, belief in moral order, andeducational aspirations. Hawaii County, on the other hand, has a greater proportion of students protectedin the family domains than other counties, but a smaller proportion of students protected in the peer-individual domain. Hawaii County has a much smaller proportion of students protected in the peer-individual domain because of peer disapproval of ATOD use, belief in the moral order, and educationalaspirations. Similar to students in Hawaii County, students in Kauai and Maui Counties also seem wellprotected in the community and family domains, but less protected in the school and peer-individualdomains. In sum, prevention efforts in the City & County of Honolulu should focus on increasingprotective factors in the community and family domains, whereas prevention efforts in Hawaii, Kauai,and Maui Counties should focus on increasing protective factors in the peer-individual domain.
Chapter 11
490
Public School District-Level Comparisons
The following section begins by comparing students from different public school districts on the numberof risk and protective factors to which they are exposed (i.e., risk and protective factor indexes). Next,district comparisons are made by examining the individual risk and protective factors that are above orbelow the statewide percentages. Prevention efforts should focus on reducing risk factors that are abovethe statewide percentages and enhancing protective factors that are below the statewide percentages.
Table 70 lists the percentages of students in each public school district who meet each risk and protectivefactor, and the percentages of students who are exposed to a high, moderate, or low number of factors. Figures 93 through 96 display each risk factor in each domain so that districts can be compared to oneanother, as well as to statewide percentages. Figure 97 displays each protective factor in each domain sothat districts can be compared to one another, as well as to statewide percentages. Bars represent districtpercentages, and dots represent statewide percentages. Bars above the dots on the risk factor figuresrepresent elevated risk, and bars below the dots on the protective factor figures represent low levels ofprotection. Prevention efforts should address risk factors that are higher than statewide averages andprotective factors that are lower than statewide averages.
Overview of Key Findings. Hawaii District, followed by Windward District, has the largestproportion of students with elevated risk on the risk factor index. Kauai District has the highestproportion of students with elevated protection on the protection factor index. There is a great deal ofvariation in where districts fall in comparison to statewide percentages on each individual risk andprotective factor.
! Comparisons on the risk factor index show that Hawaii and Windward Districts have agreater proportion of students who have 15 or more risk factors than other districts. Hawaii District has the largest proportion of students with elevated risk on the risk factorindex (24%), followed by Windward District (21%), Maui District (19%), LeewardDistrict (17%), Kauai and Central Districts (15% each), and Honolulu District (14%).
! District differences on the protective factor index are less extreme, with Kauai Districthaving the largest percentage of students exposed to 7 or more protective factors (29%),followed by Windward District (26%), Central District (25%), Maui District (24%),Hawaii and Honolulu Districts (22% each), and Leeward District (21%).
For each individual risk and protective factor, a great deal of variation exists among districts. Risk factorsthat should be a priority in each public school district can be noted by scanning Figures 93 through 96 andlooking for bars that are above or equal to the dots on the figures. Protective factors that should beprioritized in each public school district can be noted by scanning Figure 97 and by looking for bars thatare below or equal to the dots in the figure.
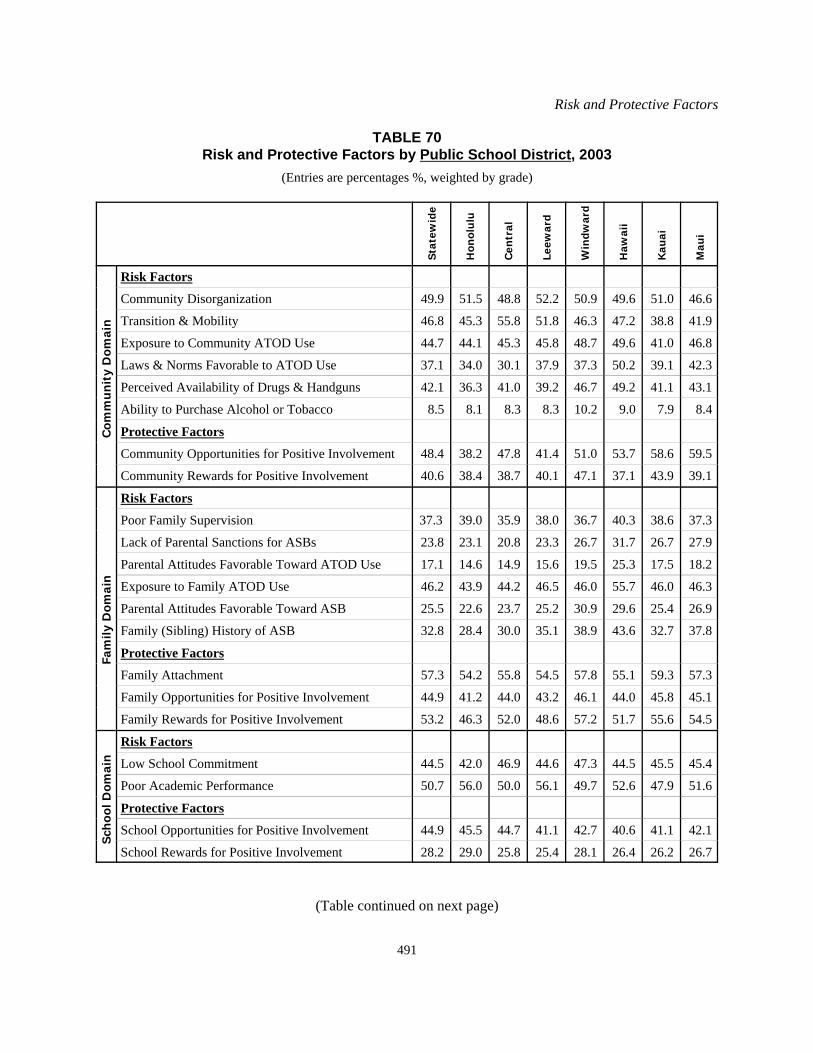
Risk and Protective Factors
491
TABLE 70Risk and Protective Factors by Public School District, 2003
(Entries are percentages %, weighted by grade)
Stat
ewid
e
Hon
olu
lu
Cen
tral
Leew
ard
Win
dwar
d
Haw
aii
Kau
ai
Mau
i
Com
mu
nit
y D
omai
n
Risk Factors
Community Disorganization 49.9 51.5 48.8 52.2 50.9 49.6 51.0 46.6
Transition & Mobility 46.8 45.3 55.8 51.8 46.3 47.2 38.8 41.9
Exposure to Community ATOD Use 44.7 44.1 45.3 45.8 48.7 49.6 41.0 46.8
Laws & Norms Favorable to ATOD Use 37.1 34.0 30.1 37.9 37.3 50.2 39.1 42.3
Perceived Availability of Drugs & Handguns 42.1 36.3 41.0 39.2 46.7 49.2 41.1 43.1
Ability to Purchase Alcohol or Tobacco 8.5 8.1 8.3 8.3 10.2 9.0 7.9 8.4
Protective Factors
Community Opportunities for Positive Involvement 48.4 38.2 47.8 41.4 51.0 53.7 58.6 59.5
Community Rewards for Positive Involvement 40.6 38.4 38.7 40.1 47.1 37.1 43.9 39.1
Fam
ily D
omai
n
Risk Factors
Poor Family Supervision 37.3 39.0 35.9 38.0 36.7 40.3 38.6 37.3
Lack of Parental Sanctions for ASBs 23.8 23.1 20.8 23.3 26.7 31.7 26.7 27.9
Parental Attitudes Favorable Toward ATOD Use 17.1 14.6 14.9 15.6 19.5 25.3 17.5 18.2
Exposure to Family ATOD Use 46.2 43.9 44.2 46.5 46.0 55.7 46.0 46.3
Parental Attitudes Favorable Toward ASB 25.5 22.6 23.7 25.2 30.9 29.6 25.4 26.9
Family (Sibling) History of ASB 32.8 28.4 30.0 35.1 38.9 43.6 32.7 37.8
Protective Factors
Family Attachment 57.3 54.2 55.8 54.5 57.8 55.1 59.3 57.3
Family Opportunities for Positive Involvement 44.9 41.2 44.0 43.2 46.1 44.0 45.8 45.1
Family Rewards for Positive Involvement 53.2 46.3 52.0 48.6 57.2 51.7 55.6 54.5
Sch
ool D
omai
n
Risk Factors
Low School Commitment 44.5 42.0 46.9 44.6 47.3 44.5 45.5 45.4
Poor Academic Performance 50.7 56.0 50.0 56.1 49.7 52.6 47.9 51.6
Protective Factors
School Opportunities for Positive Involvement 44.9 45.5 44.7 41.1 42.7 40.6 41.1 42.1
School Rewards for Positive Involvement 28.2 29.0 25.8 25.4 28.1 26.4 26.2 26.7
(Table continued on next page)
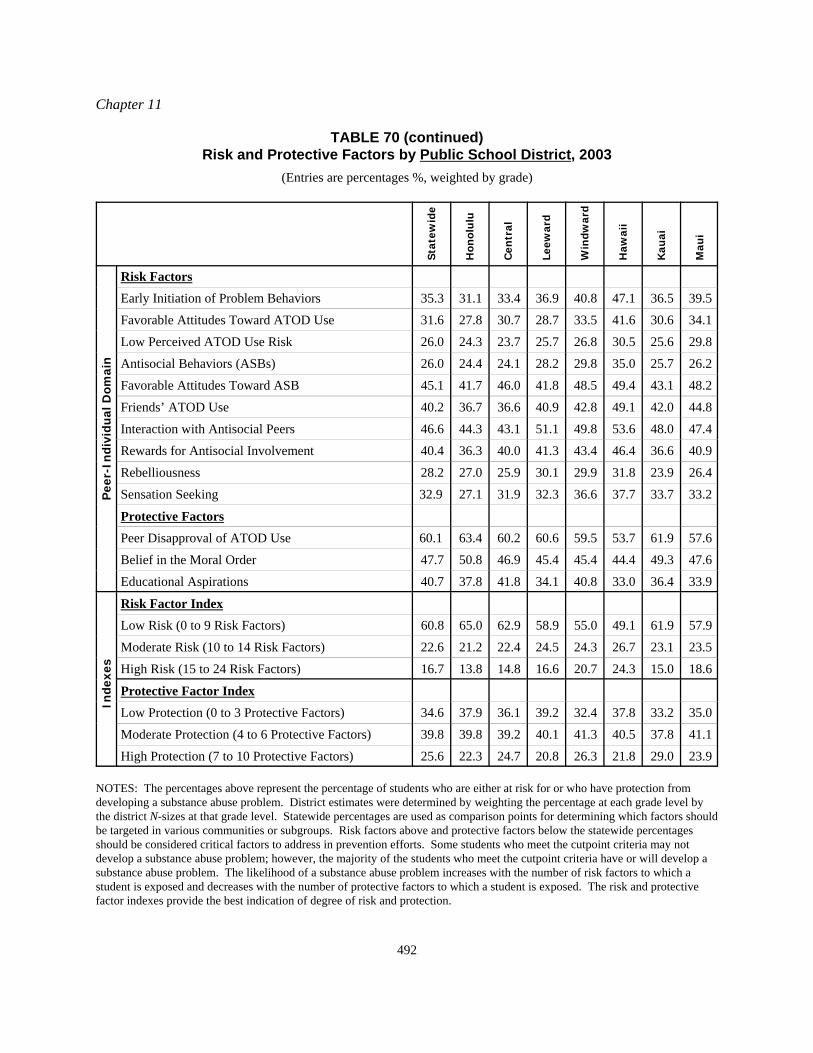
Chapter 11
492
TABLE 70 (continued)Risk and Protective Factors by Public School District, 2003
(Entries are percentages %, weighted by grade)
Stat
ewid
e
Hon
olu
lu
Cen
tral
Leew
ard
Win
dwar
d
Haw
aii
Kau
ai
Mau
i
Pee
r-In
divi
dual
Dom
ain
Risk FactorsEarly Initiation of Problem Behaviors 35.3 31.1 33.4 36.9 40.8 47.1 36.5 39.5
Favorable Attitudes Toward ATOD Use 31.6 27.8 30.7 28.7 33.5 41.6 30.6 34.1
Low Perceived ATOD Use Risk 26.0 24.3 23.7 25.7 26.8 30.5 25.6 29.8
Antisocial Behaviors (ASBs) 26.0 24.4 24.1 28.2 29.8 35.0 25.7 26.2
Favorable Attitudes Toward ASB 45.1 41.7 46.0 41.8 48.5 49.4 43.1 48.2
Friends’ ATOD Use 40.2 36.7 36.6 40.9 42.8 49.1 42.0 44.8
Interaction with Antisocial Peers 46.6 44.3 43.1 51.1 49.8 53.6 48.0 47.4
Rewards for Antisocial Involvement 40.4 36.3 40.0 41.3 43.4 46.4 36.6 40.9
Rebelliousness 28.2 27.0 25.9 30.1 29.9 31.8 23.9 26.4
Sensation Seeking 32.9 27.1 31.9 32.3 36.6 37.7 33.7 33.2
Protective FactorsPeer Disapproval of ATOD Use 60.1 63.4 60.2 60.6 59.5 53.7 61.9 57.6
Belief in the Moral Order 47.7 50.8 46.9 45.4 45.4 44.4 49.3 47.6
Educational Aspirations 40.7 37.8 41.8 34.1 40.8 33.0 36.4 33.9
Inde
xes
Risk Factor IndexLow Risk (0 to 9 Risk Factors) 60.8 65.0 62.9 58.9 55.0 49.1 61.9 57.9
Moderate Risk (10 to 14 Risk Factors) 22.6 21.2 22.4 24.5 24.3 26.7 23.1 23.5
High Risk (15 to 24 Risk Factors) 16.7 13.8 14.8 16.6 20.7 24.3 15.0 18.6
Protective Factor IndexLow Protection (0 to 3 Protective Factors) 34.6 37.9 36.1 39.2 32.4 37.8 33.2 35.0
Moderate Protection (4 to 6 Protective Factors) 39.8 39.8 39.2 40.1 41.3 40.5 37.8 41.1
High Protection (7 to 10 Protective Factors) 25.6 22.3 24.7 20.8 26.3 21.8 29.0 23.9
NOTES: The percentages above represent the percentage of students who are either at risk for or who have protection fromdeveloping a substance abuse problem. District estimates were determined by weighting the percentage at each grade level bythe district N-sizes at that grade level. Statewide percentages are used as comparison points for determining which factors shouldbe targeted in various communities or subgroups. Risk factors above and protective factors below the statewide percentagesshould be considered critical factors to address in prevention efforts. Some students who meet the cutpoint criteria may notdevelop a substance abuse problem; however, the majority of the students who meet the cutpoint criteria have or will develop asubstance abuse problem. The likelihood of a substance abuse problem increases with the number of risk factors to which astudent is exposed and decreases with the number of protective factors to which a student is exposed. The risk and protectivefactor indexes provide the best indication of degree of risk and protection.
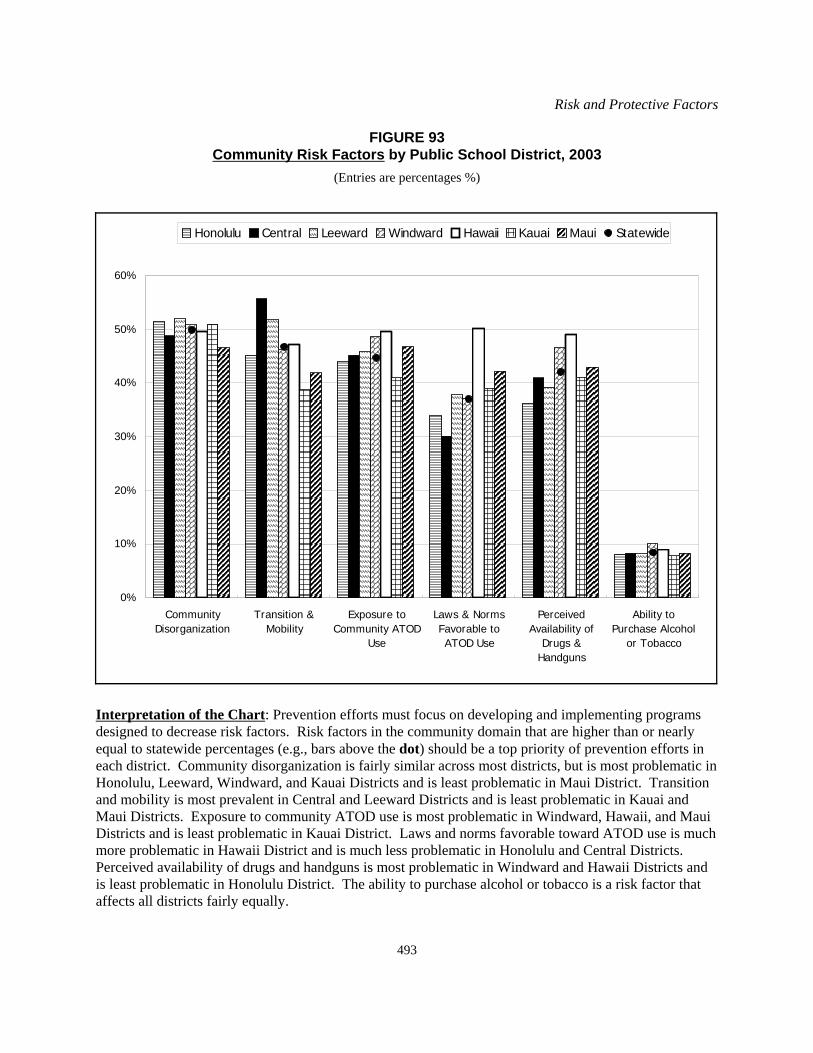
Risk and Protective Factors
493
0%
10%
20%
30%
40%
50%
60%
CommunityDisorganization
Transition &Mobility
Exposure toCommunity ATOD
Use
Laws & NormsFavorable toATOD Use
PerceivedAvailability of
Drugs &Handguns
Ability toPurchase Alcohol
or Tobacco
Honolulu Central Leeward Windward Hawaii Kauai Maui Statewide
FIGURE 93Community Risk Factors by Public School District, 2003
(Entries are percentages %)
Interpretation of the Chart: Prevention efforts must focus on developing and implementing programsdesigned to decrease risk factors. Risk factors in the community domain that are higher than or nearlyequal to statewide percentages (e.g., bars above the dot) should be a top priority of prevention efforts ineach district. Community disorganization is fairly similar across most districts, but is most problematic inHonolulu, Leeward, Windward, and Kauai Districts and is least problematic in Maui District. Transitionand mobility is most prevalent in Central and Leeward Districts and is least problematic in Kauai andMaui Districts. Exposure to community ATOD use is most problematic in Windward, Hawaii, and MauiDistricts and is least problematic in Kauai District. Laws and norms favorable toward ATOD use is muchmore problematic in Hawaii District and is much less problematic in Honolulu and Central Districts. Perceived availability of drugs and handguns is most problematic in Windward and Hawaii Districts andis least problematic in Honolulu District. The ability to purchase alcohol or tobacco is a risk factor thataffects all districts fairly equally.
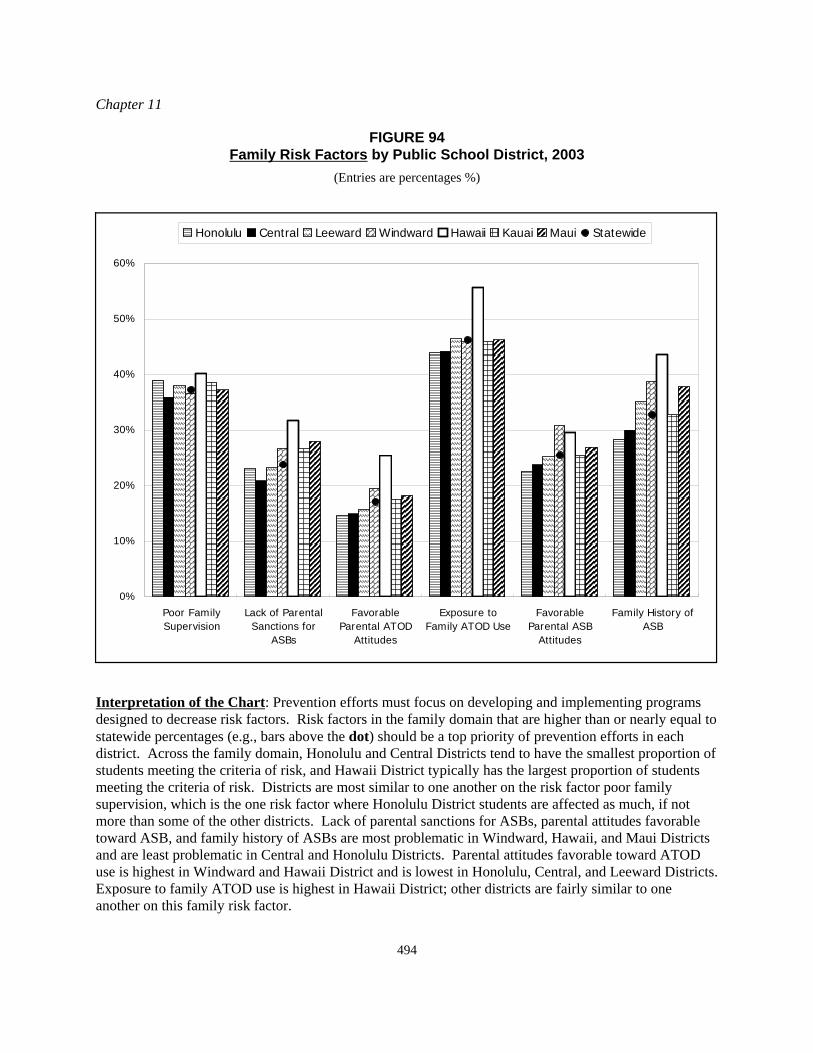
Chapter 11
494
0%
10%
20%
30%
40%
50%
60%
Poor FamilySupervision
Lack of ParentalSanctions for
ASBs
FavorableParental ATOD
Attitudes
Exposure toFamily ATOD Use
FavorableParental ASB
Attitudes
Family History ofASB
Honolulu Central Leeward Windward Hawaii Kauai Maui Statewide
FIGURE 94Family Risk Factors by Public School District, 2003
(Entries are percentages %)
Interpretation of the Chart: Prevention efforts must focus on developing and implementing programsdesigned to decrease risk factors. Risk factors in the family domain that are higher than or nearly equal tostatewide percentages (e.g., bars above the dot) should be a top priority of prevention efforts in eachdistrict. Across the family domain, Honolulu and Central Districts tend to have the smallest proportion ofstudents meeting the criteria of risk, and Hawaii District typically has the largest proportion of studentsmeeting the criteria of risk. Districts are most similar to one another on the risk factor poor familysupervision, which is the one risk factor where Honolulu District students are affected as much, if notmore than some of the other districts. Lack of parental sanctions for ASBs, parental attitudes favorabletoward ASB, and family history of ASBs are most problematic in Windward, Hawaii, and Maui Districtsand are least problematic in Central and Honolulu Districts. Parental attitudes favorable toward ATODuse is highest in Windward and Hawaii District and is lowest in Honolulu, Central, and Leeward Districts. Exposure to family ATOD use is highest in Hawaii District; other districts are fairly similar to oneanother on this family risk factor.
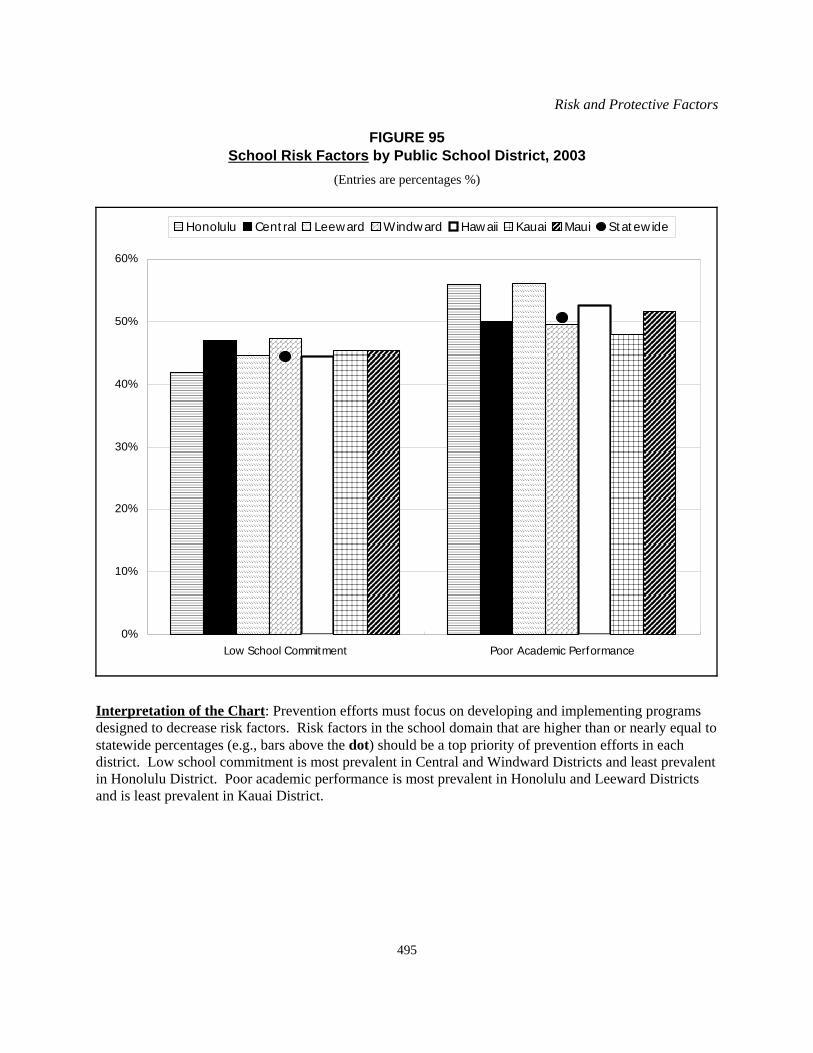
Risk and Protective Factors
495
0%
10%
20%
30%
40%
50%
60%
Low School Commitment Poor Academic Performance
Honolulu Central Leeward Windward Hawaii Kauai Maui Statewide
FIGURE 95School Risk Factors by Public School District, 2003
(Entries are percentages %)
Interpretation of the Chart: Prevention efforts must focus on developing and implementing programsdesigned to decrease risk factors. Risk factors in the school domain that are higher than or nearly equal tostatewide percentages (e.g., bars above the dot) should be a top priority of prevention efforts in eachdistrict. Low school commitment is most prevalent in Central and Windward Districts and least prevalentin Honolulu District. Poor academic performance is most prevalent in Honolulu and Leeward Districtsand is least prevalent in Kauai District.
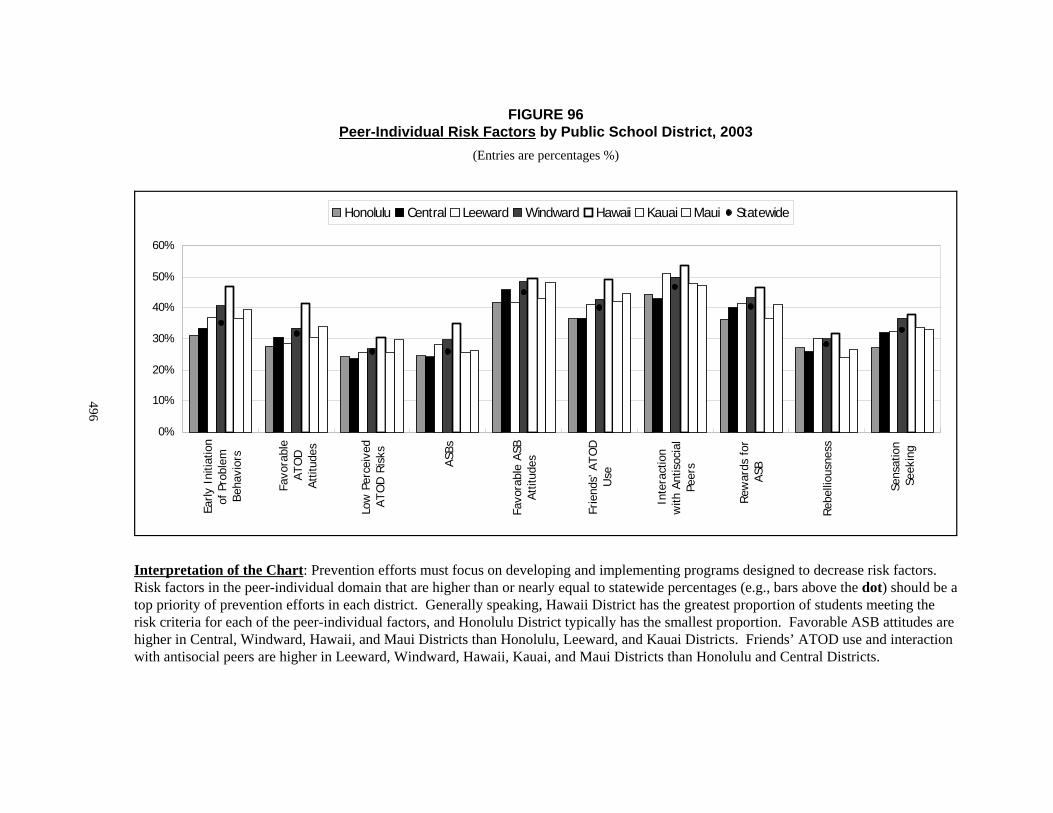
0%
10%
20%
30%
40%
50%
60%
Early
Ini
tiatio
nof
Pro
blem
Beha
vior
s
Favo
rabl
eAT
OD
Attit
udes
Low
Per
ceiv
edAT
OD
Ris
ks
ASBs
Favo
rabl
e AS
BAt
titud
es
Frie
nds'
ATO
DU
se
Inte
ract
ion
with
Ant
isoc
ial
Peer
s
Rew
ards
for
ASB
Rebe
lliou
snes
s
Sens
atio
nSe
ekin
g
Honolulu Central Leeward Windward Hawaii Kauai Maui Statewide
FIGURE 96Peer-Individual Risk Factors by Public School District, 2003
(Entries are percentages %)
Interpretation of the Chart: Prevention efforts must focus on developing and implementing programs designed to decrease risk factors. Risk factors in the peer-individual domain that are higher than or nearly equal to statewide percentages (e.g., bars above the dot) should be atop priority of prevention efforts in each district. Generally speaking, Hawaii District has the greatest proportion of students meeting therisk criteria for each of the peer-individual factors, and Honolulu District typically has the smallest proportion. Favorable ASB attitudes arehigher in Central, Windward, Hawaii, and Maui Districts than Honolulu, Leeward, and Kauai Districts. Friends’ ATOD use and interactionwith antisocial peers are higher in Leeward, Windward, Hawaii, Kauai, and Maui Districts than Honolulu and Central Districts.
496
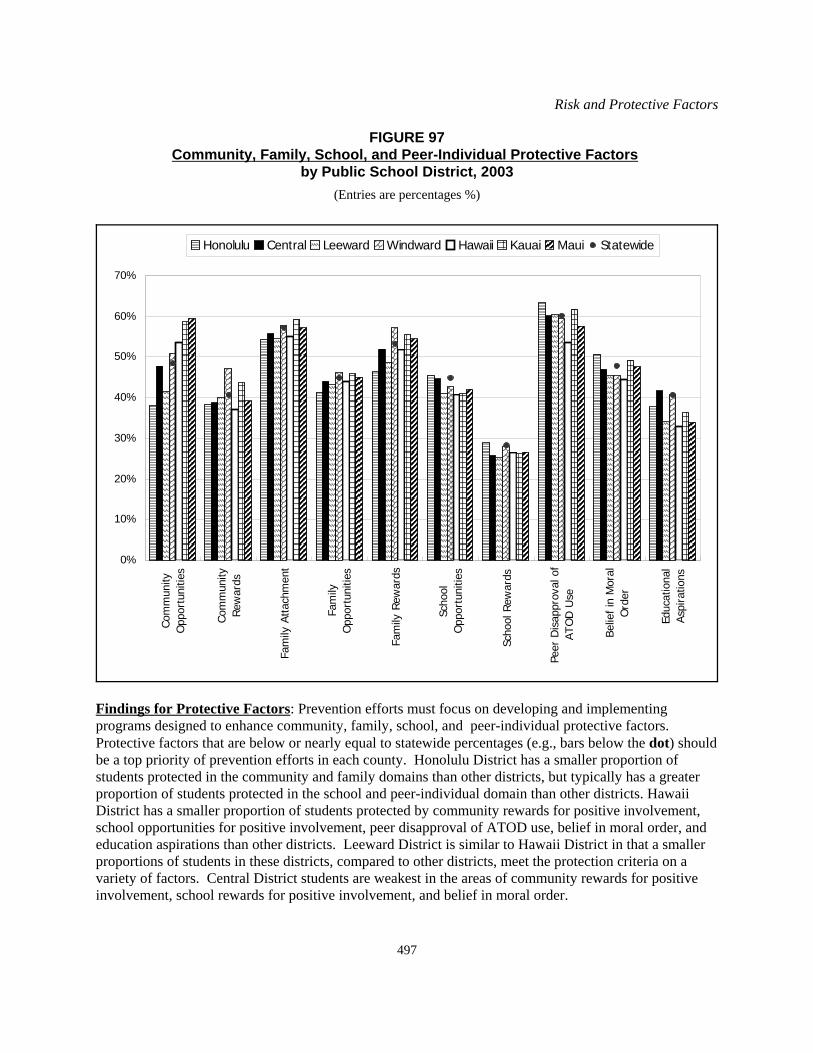
Risk and Protective Factors
497
0%
10%
20%
30%
40%
50%
60%
70%
Com
mun
ityO
ppor
tuni
ties
Com
mun
ityRe
war
ds
Fam
ily A
ttach
men
t
Fam
ilyO
ppor
tuni
ties
Fam
ily R
ewar
ds
Scho
olO
ppor
tuni
ties
Scho
ol R
ewar
ds
Peer
Dis
appr
oval
of
ATO
D U
se
Belie
f in
Mor
alO
rder
Educ
atio
nal
Aspi
ratio
ns
Honolulu Central Leeward Windward Hawaii Kauai Maui Statewide
FIGURE 97Community, Family, School, and Peer-Individual Protective Factors
by Public School District, 2003(Entries are percentages %)
Findings for Protective Factors: Prevention efforts must focus on developing and implementingprograms designed to enhance community, family, school, and peer-individual protective factors. Protective factors that are below or nearly equal to statewide percentages (e.g., bars below the dot) shouldbe a top priority of prevention efforts in each county. Honolulu District has a smaller proportion ofstudents protected in the community and family domains than other districts, but typically has a greaterproportion of students protected in the school and peer-individual domain than other districts. HawaiiDistrict has a smaller proportion of students protected by community rewards for positive involvement,school opportunities for positive involvement, peer disapproval of ATOD use, belief in moral order, andeducation aspirations than other districts. Leeward District is similar to Hawaii District in that a smallerproportions of students in these districts, compared to other districts, meet the protection criteria on avariety of factors. Central District students are weakest in the areas of community rewards for positiveinvolvement, school rewards for positive involvement, and belief in moral order.
Chapter 11
498
Trends in Problematic Risk and Protective Factors by Public School District,2000-2003
Table 71 summarizes the county- and district-level comparisons by placing a date (‘00, ‘02, ‘03, or all) toindicate the year in which the risk or protective factor was problematic. Prevention efforts should focuson factors that have become or that remain problematic in 2003.
In this section, each district is addressed to summarize where prevention efforts should be directed invarious communities. Since the district grouping, versus the county grouping, addresses a larger numberof communities and better explains what is happening in various parts of Oahu, the focus of this summaryis on district, rather than on county. Key findings are first summarized for each district. Next, factorswithin each domain are listed that need to be addressed in prevention efforts directed at adolescents fromthe district in question.
Honolulu District. Prevention efforts in Honolulu District should focus primarily on bolsteringprotective factors in the community and family domains. Unlike other districts, Honolulu District hasvery few risk factors above statewide averages. The only risk factors in Honolulu District that are abovethe statewide percentages in 2003 are community disorganization, poor family supervision, and pooracademic performance.
! In the community domain, prevention efforts directed at adolescents from HonoluluDistrict should focus on (1) community disorganization, (2) community opportunities forpositive involvement, and (3) community rewards for positive involvement. Each ofthese factors were problematic in all three survey years. Ability to purchase alcohol ortobacco was problematic in 2002, but was not elevated in 2003.
! In the family domain, prevention efforts directed at adolescents from Honolulu Districtshould primarily focus on (1) poor family supervision, (2) family attachment, (3) familyopportunities for prosocial involvement, and (4) family rewards for prosocialinvolvement. All three protective factors in the family domain have been elevated ineach of the survey years. The risk factor, poor family supervision, was elevated in 2000and is again elevated in 2003.
! In the school domain, prevention efforts directed at adolescents from Honolulu Districtshould focus primarily on poor academic performance. Although school opportunitiesfor positive involvement and school rewards for positive involvement were elevated in2000 and 2002, these factors were not elevated in 2003.
! Honolulu District, unlike other districts, has very few problematic risk and protectivefactors in the peer-individual domain. Fewer students in Honolulu District thanstatewide, met the protective factor criteria for educational aspirations. Keep in mind thatthe category of Honolulu District includes only public school students in HonoluluDistrict. As noted earlier, substantially more private school students than public schoolstudents meet the protective criteria for educational aspirations.
Risk and Protective Factors
499
Central District. Central District had a big drop in the number of problematic risk factors from 2000 to2002. However, in 2003, several of the previous problematic risk factors became problematic again.
! In the community domain, prevention efforts directed at adolescents from CentralDistrict should focus on (1) transition and mobility, (2) exposure to community ATODuse, (3) community opportunities for positive involvement, and (4) community rewardsfor positive involvement. Transition and mobility, and community rewards for positiveinvolvement have been problematic in Central District over all three survey years.
! In the family domain, Central District had all three protective factors return to beingproblematic: (1) family attachment, (2) family opportunities for prosocial involvements,and (3) family rewards for prosocial involvement. Similar to 2002, Central Districtdoesn’t have any family domain risk factors that are problematic in 2003.
! In the school domain, prevention efforts directed at adolescents from Central Districtshould focus on (1) low school commitment, (2) school opportunities for positiveinvolvement, and (3) school rewards for positive involvement. These three factors werealso problematic in 2000.
! In the peer-individual domain, prevention efforts should focus on (1) favorable attitudestoward ASB and (2) belief in the moral order. Belief in the moral order is a protectivefactor that has shown up as problematic in all three survey years.
Leeward District. Leeward District had more problematic risk and protective factors in 2002 than in2000, and the number increased again in 2003. Across each domain, Leeward District has a large numberof problematic factors and many of them have show up as problematic in all three survey years.
! In the community domain, prevention efforts directed at adolescents from LeewardDistrict should focus on (1) community disorganization, (2) transition & mobility, (3)exposure to community ATOD use, (4) laws and norms favorable to ATOD use, (5)community opportunities for positive involvement, and (6) community rewards forpositive involvement.
! In the family domain, prevention efforts directed at adolescents from Leeward Districtshould focus on (1) poor family supervision, (2) exposure to family ATOD use, (3)family history of ASB, (4) family attachment, (5) family opportunities for prosocialinvolvement, and (6) family rewards for prosocial involvement.
! In the school domain, prevention efforts in Leeward District should focus on each of therisk and protective factors since each was elevated.
! In the peer-individual domain, prevention efforts in Leeward District should focus on (1)early initiation of problem behaviors, (2) antisocial behaviors, (3) friends’ ATOD use, (4)interaction with antisocial peers, (5) rewards for antisocial involvement, (6)rebelliousness, (7) belief in moral order, and (8) educational aspirations.
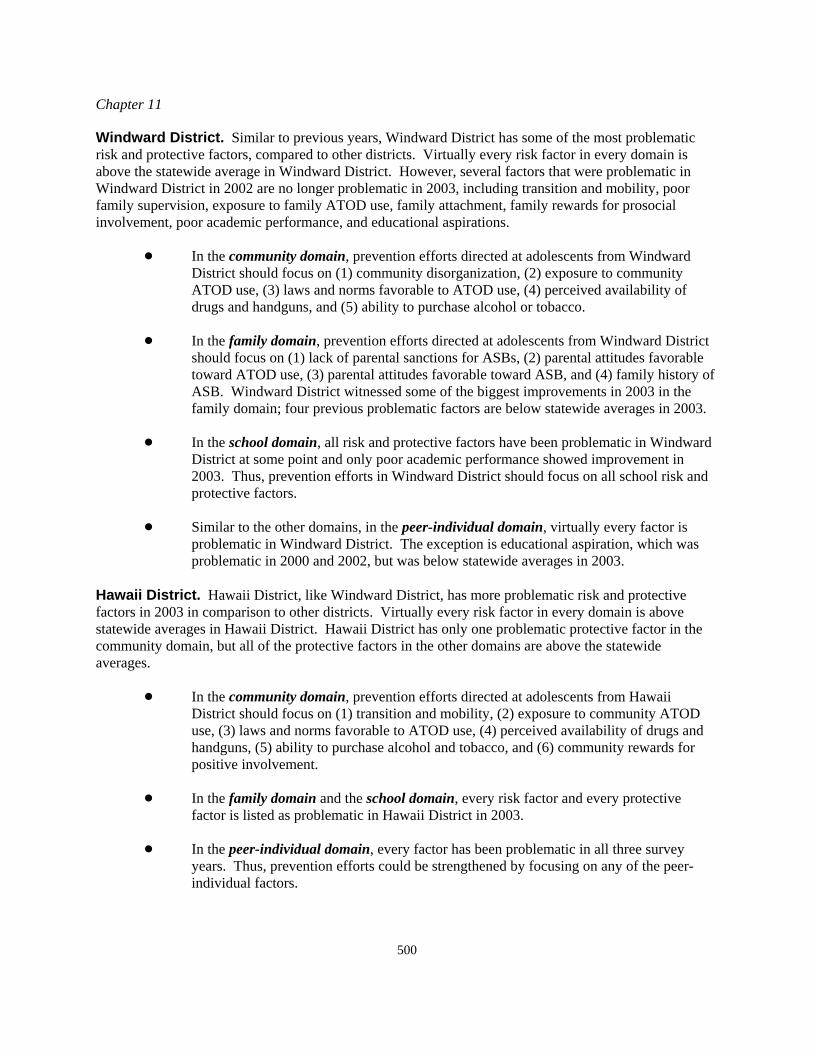
Chapter 11
500
Windward District. Similar to previous years, Windward District has some of the most problematicrisk and protective factors, compared to other districts. Virtually every risk factor in every domain isabove the statewide average in Windward District. However, several factors that were problematic inWindward District in 2002 are no longer problematic in 2003, including transition and mobility, poorfamily supervision, exposure to family ATOD use, family attachment, family rewards for prosocialinvolvement, poor academic performance, and educational aspirations.
! In the community domain, prevention efforts directed at adolescents from WindwardDistrict should focus on (1) community disorganization, (2) exposure to communityATOD use, (3) laws and norms favorable to ATOD use, (4) perceived availability ofdrugs and handguns, and (5) ability to purchase alcohol or tobacco.
! In the family domain, prevention efforts directed at adolescents from Windward Districtshould focus on (1) lack of parental sanctions for ASBs, (2) parental attitudes favorabletoward ATOD use, (3) parental attitudes favorable toward ASB, and (4) family history ofASB. Windward District witnessed some of the biggest improvements in 2003 in thefamily domain; four previous problematic factors are below statewide averages in 2003.
! In the school domain, all risk and protective factors have been problematic in WindwardDistrict at some point and only poor academic performance showed improvement in2003. Thus, prevention efforts in Windward District should focus on all school risk andprotective factors.
! Similar to the other domains, in the peer-individual domain, virtually every factor isproblematic in Windward District. The exception is educational aspiration, which wasproblematic in 2000 and 2002, but was below statewide averages in 2003.
Hawaii District. Hawaii District, like Windward District, has more problematic risk and protectivefactors in 2003 in comparison to other districts. Virtually every risk factor in every domain is abovestatewide averages in Hawaii District. Hawaii District has only one problematic protective factor in thecommunity domain, but all of the protective factors in the other domains are above the statewideaverages.
! In the community domain, prevention efforts directed at adolescents from HawaiiDistrict should focus on (1) transition and mobility, (2) exposure to community ATODuse, (3) laws and norms favorable to ATOD use, (4) perceived availability of drugs andhandguns, (5) ability to purchase alcohol and tobacco, and (6) community rewards forpositive involvement.
! In the family domain and the school domain, every risk factor and every protectivefactor is listed as problematic in Hawaii District in 2003.
! In the peer-individual domain, every factor has been problematic in all three surveyyears. Thus, prevention efforts could be strengthened by focusing on any of the peer-individual factors.
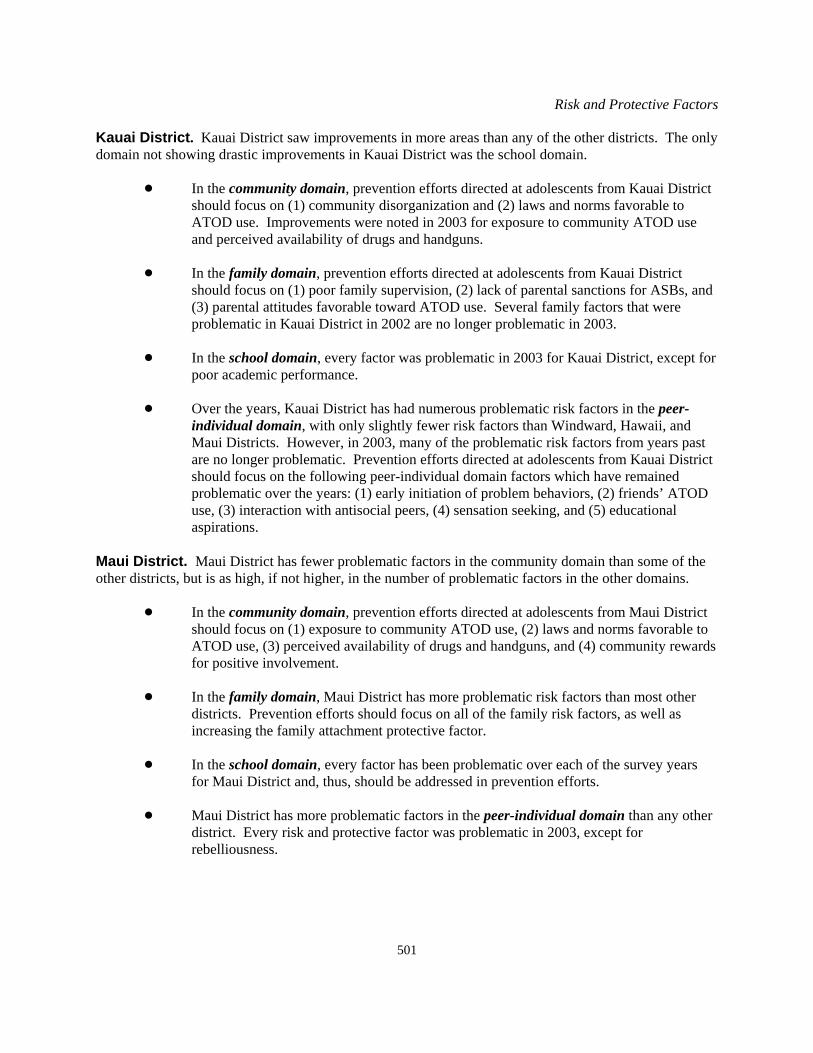
Risk and Protective Factors
501
Kauai District. Kauai District saw improvements in more areas than any of the other districts. The onlydomain not showing drastic improvements in Kauai District was the school domain.
! In the community domain, prevention efforts directed at adolescents from Kauai Districtshould focus on (1) community disorganization and (2) laws and norms favorable toATOD use. Improvements were noted in 2003 for exposure to community ATOD useand perceived availability of drugs and handguns.
! In the family domain, prevention efforts directed at adolescents from Kauai Districtshould focus on (1) poor family supervision, (2) lack of parental sanctions for ASBs, and(3) parental attitudes favorable toward ATOD use. Several family factors that wereproblematic in Kauai District in 2002 are no longer problematic in 2003.
! In the school domain, every factor was problematic in 2003 for Kauai District, except forpoor academic performance.
! Over the years, Kauai District has had numerous problematic risk factors in the peer-individual domain, with only slightly fewer risk factors than Windward, Hawaii, andMaui Districts. However, in 2003, many of the problematic risk factors from years pastare no longer problematic. Prevention efforts directed at adolescents from Kauai Districtshould focus on the following peer-individual domain factors which have remainedproblematic over the years: (1) early initiation of problem behaviors, (2) friends’ ATODuse, (3) interaction with antisocial peers, (4) sensation seeking, and (5) educationalaspirations.
Maui District. Maui District has fewer problematic factors in the community domain than some of theother districts, but is as high, if not higher, in the number of problematic factors in the other domains.
! In the community domain, prevention efforts directed at adolescents from Maui Districtshould focus on (1) exposure to community ATOD use, (2) laws and norms favorable toATOD use, (3) perceived availability of drugs and handguns, and (4) community rewardsfor positive involvement.
! In the family domain, Maui District has more problematic risk factors than most otherdistricts. Prevention efforts should focus on all of the family risk factors, as well asincreasing the family attachment protective factor.
! In the school domain, every factor has been problematic over each of the survey years for Maui District and, thus, should be addressed in prevention efforts.
! Maui District has more problematic factors in the peer-individual domain than any otherdistrict. Every risk and protective factor was problematic in 2003, except forrebelliousness.
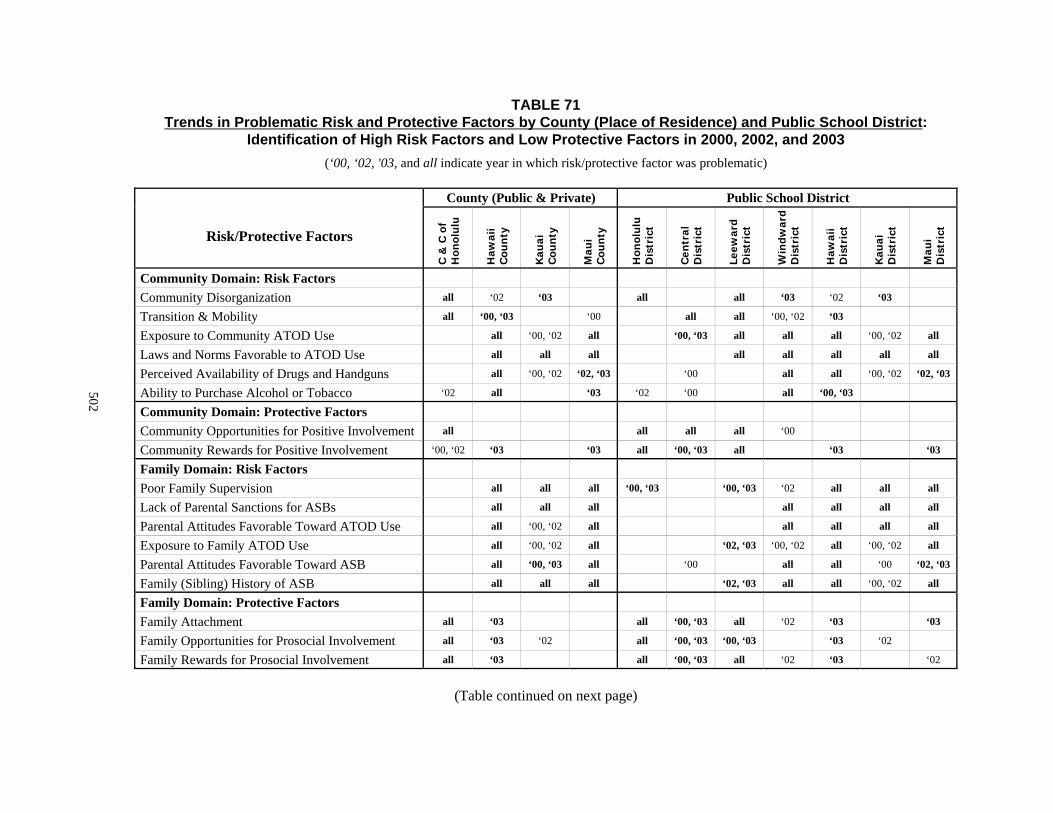
TABLE 71Trends in Problematic Risk and Protective Factors by County (Place of Residence) and Public School District:
Identification of High Risk Factors and Low Protective Factors in 2000, 2002, and 2003(‘00, ‘02, '03, and all indicate year in which risk/protective factor was problematic)
Risk/Protective Factors
County (Public & Private) Public School District
C &
C o
fH
onol
ulu
Haw
aii
Cou
nty
Kau
aiC
oun
ty
Mau
iC
oun
ty
Hon
olu
luD
istr
ict
Cen
tral
Dis
tric
t
Leew
ard
Dis
tric
t
Win
dwar
dD
istr
ict
Haw
aii
Dis
tric
t
Kau
aiD
istr
ict
Mau
iD
istr
ict
Community Domain: Risk FactorsCommunity Disorganization all ‘02 ‘03 all all ‘03 ‘02 ‘03
Transition & Mobility all ‘00, ‘03 ‘00 all all ‘00, ‘02 ‘03
Exposure to Community ATOD Use all ‘00, ‘02 all ‘00, ‘03 all all all ‘00, ‘02 all
Laws and Norms Favorable to ATOD Use all all all all all all all all
Perceived Availability of Drugs and Handguns all ‘00, ‘02 ‘02, ‘03 ‘00 all all ‘00, ‘02 ‘02, ‘03
Ability to Purchase Alcohol or Tobacco ‘02 all ‘03 ‘02 ‘00 all ‘00, ‘03
Community Domain: Protective FactorsCommunity Opportunities for Positive Involvement all all all all ‘00
Community Rewards for Positive Involvement ‘00, ‘02 ‘03 ‘03 all ‘00, ‘03 all ‘03 ‘03
Family Domain: Risk FactorsPoor Family Supervision all all all ‘00, ‘03 ‘00, ‘03 ‘02 all all all
Lack of Parental Sanctions for ASBs all all all all all all all
Parental Attitudes Favorable Toward ATOD Use all ‘00, ‘02 all all all all all
Exposure to Family ATOD Use all ‘00, ‘02 all ‘02, ‘03 ‘00, ‘02 all ‘00, ‘02 all
Parental Attitudes Favorable Toward ASB all ‘00, ‘03 all ‘00 all all ‘00 ‘02, ‘03
Family (Sibling) History of ASB all all all ‘02, ‘03 all all ‘00, ‘02 all
Family Domain: Protective FactorsFamily Attachment all ‘03 all ‘00, ‘03 all ‘02 ‘03 ‘03
Family Opportunities for Prosocial Involvement all ‘03 ‘02 all ‘00, ‘03 ‘00, ‘03 ‘03 ‘02
Family Rewards for Prosocial Involvement all ‘03 all ‘00, ‘03 all ‘02 ‘03 ‘02
(Table continued on next page)
502
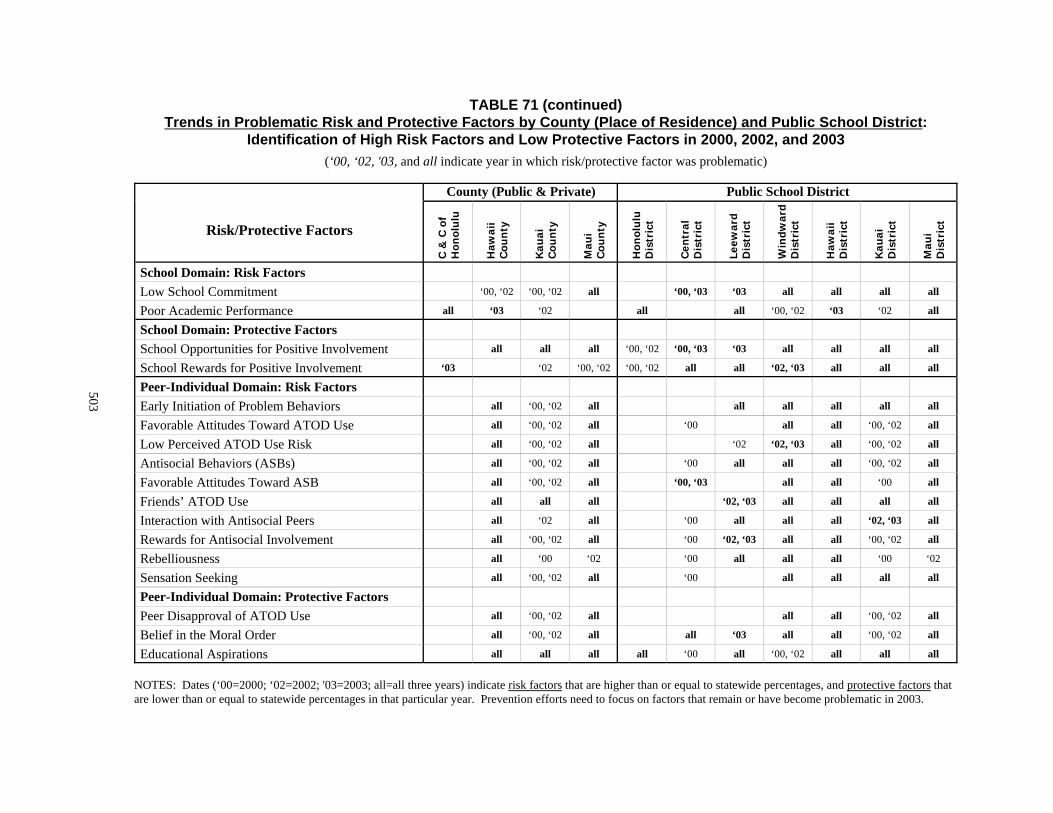
TABLE 71 (continued)Trends in Problematic Risk and Protective Factors by County (Place of Residence) and Public School District:
Identification of High Risk Factors and Low Protective Factors in 2000, 2002, and 2003(‘00, ‘02, '03, and all indicate year in which risk/protective factor was problematic)
Risk/Protective Factors
County (Public & Private) Public School District
C &
C o
fH
onol
ulu
Haw
aii
Cou
nty
Kau
aiC
oun
ty
Mau
iC
oun
ty
Hon
olu
luD
istr
ict
Cen
tral
Dis
tric
t
Leew
ard
Dis
tric
t
Win
dwar
dD
istr
ict
Haw
aii
Dis
tric
t
Kau
aiD
istr
ict
Mau
iD
istr
ict
School Domain: Risk FactorsLow School Commitment ‘00, ‘02 ‘00, ‘02 all ‘00, ‘03 ‘03 all all all all
Poor Academic Performance all ‘03 ‘02 all all ‘00, ‘02 ‘03 ‘02 all
School Domain: Protective FactorsSchool Opportunities for Positive Involvement all all all ‘00, ‘02 ‘00, ‘03 ‘03 all all all all
School Rewards for Positive Involvement ‘03 ‘02 ‘00, ‘02 ‘00, ‘02 all all ‘02, ‘03 all all all
Peer-Individual Domain: Risk FactorsEarly Initiation of Problem Behaviors all ‘00, ‘02 all all all all all all
Favorable Attitudes Toward ATOD Use all ‘00, ‘02 all ‘00 all all ‘00, ‘02 all
Low Perceived ATOD Use Risk all ‘00, ‘02 all ‘02 ‘02, ‘03 all ‘00, ‘02 all
Antisocial Behaviors (ASBs) all ‘00, ‘02 all ‘00 all all all ‘00, ‘02 all
Favorable Attitudes Toward ASB all ‘00, ‘02 all ‘00, ‘03 all all ‘00 all
Friends’ ATOD Use all all all ‘02, ‘03 all all all all
Interaction with Antisocial Peers all ‘02 all ‘00 all all all ‘02, ‘03 all
Rewards for Antisocial Involvement all ‘00, ‘02 all ‘00 ‘02, ‘03 all all ‘00, ‘02 all
Rebelliousness all ‘00 ‘02 ‘00 all all all ‘00 ‘02
Sensation Seeking all ‘00, ‘02 all ‘00 all all all all
Peer-Individual Domain: Protective FactorsPeer Disapproval of ATOD Use all ‘00, ‘02 all all all ‘00, ‘02 all
Belief in the Moral Order all ‘00, ‘02 all all ‘03 all all ‘00, ‘02 all
Educational Aspirations all all all all ‘00 all ‘00, ‘02 all all all
NOTES: Dates (‘00=2000; ‘02=2002; '03=2003; all=all three years) indicate risk factors that are higher than or equal to statewide percentages, and protective factors thatare lower than or equal to statewide percentages in that particular year. Prevention efforts need to focus on factors that remain or have become problematic in 2003.
503
Chapter 11
504
Sex Differences
The following section begins by comparing male and female students on the number of risk andprotective factors to which they are exposed (i.e., risk and protective factor indexes). Next, sexdifferences are examined by comparing males to females on individual risk and protective factors. Prevention efforts directed at each subgroup should focus on reducing risk factors that are above thestatewide percentages and enhancing protective factors that are below the statewide percentages.
Table 72 lists the percentages of male and female students who meet each risk and protective factor, andthe percentages of male and female students who are exposed to a high, moderate, or low number offactors. Figures 98 through 101 display each risk factor in each domain so that males and females can becompared to each other, as well as to statewide percentages. Figure 102 displays each protective factor ineach domain so that males and females can be compared to each other, as well as to statewidepercentages. Bars represent subgroup percentages, and dots represent statewide percentages. Bars abovethe dots on the risk factor figures represent elevated risk, and bars below the dots on the protective factorfigures represent low levels of protection. Prevention efforts should address risk factors that are higherthan statewide averages and protective factors that are lower than statewide averages.
Table 74 (pages 522-523) summarizes all the information regarding sex and ethnic comparisons in onetable by highlighting risk and protective factors that should be the focus of prevention efforts for eachsubgroup. The table places a date (‘00, ‘02, ‘03, or all) to indicate the year in which the risk or protectivefactor was problematic. Prevention efforts should focus on factors that have become or that remainproblematic in 2003.
Overview of Key Findings. A greater proportion of males than females have elevated risk and lowerresiliency because of the number of risk and protective factors to which they are exposed. Males tend tohave more elevated risk factors in the school and peer-individual domain, whereas females tend to havemore elevated risk factors in the community and family domain. Females have more elevated protectivefactors than males, and a greater percentage of females than males are exposed to large numbers ofprotective factors. Males and females, however, are similar to one another on several risk and protectivefactors.
! Comparisons on the risk factor index show that a slightly larger proportion of males thanfemales are exposed to 15 or more risk factors (17% vs. 16%). More males (25%) thanfemales (20%) are also exposed to moderate amounts of risk factors (10 to 14 riskfactors). The percentages of males and females at low, moderate, and high risk based onthe risk factor index are provided in Table 72 on page 507.
! Comparisons on the protective factor index show that more females than males areexposed to 7 to 10 protective factors (28% vs. 22%), and more females than males areexposed to 4 to 6 protective factors (40% vs. 39%). More males than females, on theother hand, are exposed to 3 or fewer protective factors (38% vs 31%).
Risk and Protective Factors
505
! Figure 98, related to community risk factors, and Figure 102, related to protective factors,show that in the community domain prevention efforts directed at male adolescentsshould focus on the following problematic factors: (1) community disorganization, (2)laws and norms favorable to ATOD use, (3) perceived availability of drugs andhandguns, (4) ability to purchase alcohol and tobacco, (5) community opportunities forpositive involvement, and (6) community rewards for positive involvement. Preventionefforts directed at female adolescents, on the other hand, should focus on (1) transition &mobility and (2) exposure to community ATOD use. Males and females are fairly similarto one another on perceived availability of drugs and handguns, ability to purchasealcohol and tobacco, and community rewards for positive involvement.
! Figure 99, related to family risk factors, and Figure 102, related to protective factors,show that in the family domain prevention efforts directed at male adolescents shouldfocus on (1) poor family supervision, (2) parental attitudes favorable toward ASB, (3)family opportunities for prosocial involvement, and (4) family rewards for prosocialinvolvement. Prevention efforts for female adolescents, on the other hand, should focuson (1) lack of parental sanctions for ASBs, (2) parental attitudes favorable toward ATODuse, (3) exposure to family ATOD use, (4) family history of ASB, and (5) familyattachment. Males and females are similar to one another on lack of parental sanctionsfor ASBs and parental attitudes favorable toward ATOD.
! Figure 100, related to school risk factors, and Figure 102, related to protective factors,show that every risk and protective factor in the school domain is problematic for maleadolescents but not for female adolescents. Males, however, are only slightly lessprotected on school reward for positive involvement.
! Figure 101, related to peer-individual risk factors, and Figure 102, related to protectivefactors, show that male adolescents have more problematic risk and protective factors inthe peer-individual domain than female adolescents. The exceptions are for favorableattitudes toward ATOD use and friends’ ATOD use, where the percentages of femalesmeeting the risk criteria are slightly higher than the male percentages. Thus, preventionefforts directed at males should focus on a variety of risk factors in the peer-individualdomain and prevention efforts directed at females should focus on favorable ATODattitudes and friends’ ATOD use.
! Table 74 summarizes all the problematic risk and protective factors in 2000, 2002, and2003 for males and females to illustrate where prevention is currently needed (i.e.,problematic in 2003) and where prevention efforts have been effective (i.e., problematicin 2000 or 2002, but not in 2003).
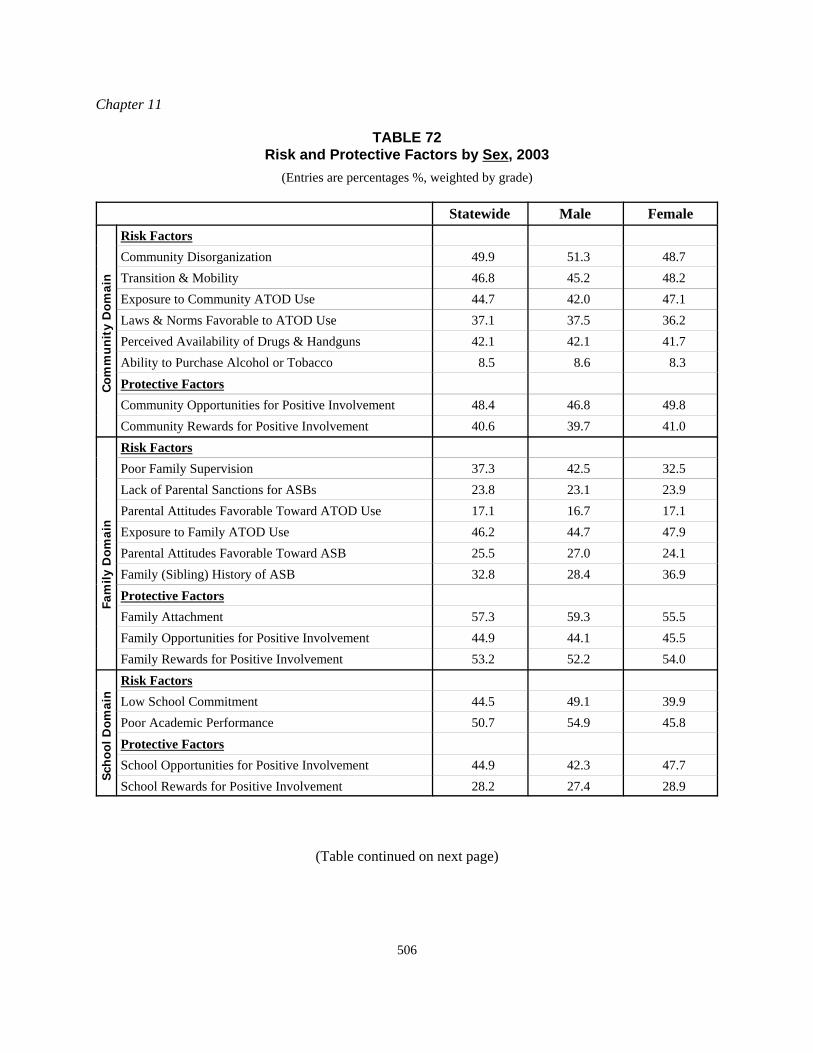
Chapter 11
506
TABLE 72Risk and Protective Factors by Sex, 2003
(Entries are percentages %, weighted by grade)
Statewide Male Female
Com
mu
nit
y D
omai
n
Risk FactorsCommunity Disorganization 49.9 51.3 48.7Transition & Mobility 46.8 45.2 48.2Exposure to Community ATOD Use 44.7 42.0 47.1Laws & Norms Favorable to ATOD Use 37.1 37.5 36.2Perceived Availability of Drugs & Handguns 42.1 42.1 41.7Ability to Purchase Alcohol or Tobacco 8.5 8.6 8.3Protective FactorsCommunity Opportunities for Positive Involvement 48.4 46.8 49.8Community Rewards for Positive Involvement 40.6 39.7 41.0
Fam
ily D
omai
n
Risk FactorsPoor Family Supervision 37.3 42.5 32.5Lack of Parental Sanctions for ASBs 23.8 23.1 23.9Parental Attitudes Favorable Toward ATOD Use 17.1 16.7 17.1Exposure to Family ATOD Use 46.2 44.7 47.9Parental Attitudes Favorable Toward ASB 25.5 27.0 24.1Family (Sibling) History of ASB 32.8 28.4 36.9Protective FactorsFamily Attachment 57.3 59.3 55.5Family Opportunities for Positive Involvement 44.9 44.1 45.5Family Rewards for Positive Involvement 53.2 52.2 54.0
Sch
ool D
omai
n
Risk FactorsLow School Commitment 44.5 49.1 39.9Poor Academic Performance 50.7 54.9 45.8Protective FactorsSchool Opportunities for Positive Involvement 44.9 42.3 47.7School Rewards for Positive Involvement 28.2 27.4 28.9
(Table continued on next page)
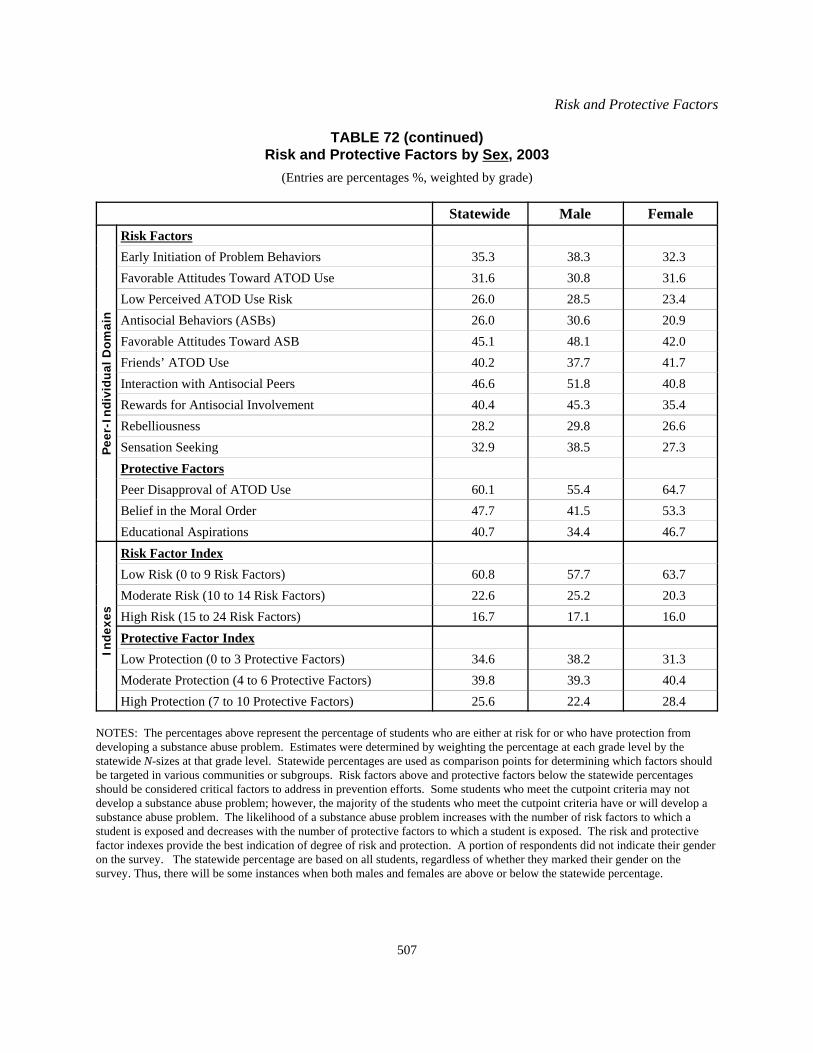
Risk and Protective Factors
507
TABLE 72 (continued)Risk and Protective Factors by Sex, 2003
(Entries are percentages %, weighted by grade)
Statewide Male Female
Pee
r-In
divi
dual
Dom
ain
Risk FactorsEarly Initiation of Problem Behaviors 35.3 38.3 32.3Favorable Attitudes Toward ATOD Use 31.6 30.8 31.6Low Perceived ATOD Use Risk 26.0 28.5 23.4Antisocial Behaviors (ASBs) 26.0 30.6 20.9Favorable Attitudes Toward ASB 45.1 48.1 42.0Friends’ ATOD Use 40.2 37.7 41.7Interaction with Antisocial Peers 46.6 51.8 40.8Rewards for Antisocial Involvement 40.4 45.3 35.4Rebelliousness 28.2 29.8 26.6Sensation Seeking 32.9 38.5 27.3Protective FactorsPeer Disapproval of ATOD Use 60.1 55.4 64.7Belief in the Moral Order 47.7 41.5 53.3Educational Aspirations 40.7 34.4 46.7
Inde
xes
Risk Factor IndexLow Risk (0 to 9 Risk Factors) 60.8 57.7 63.7Moderate Risk (10 to 14 Risk Factors) 22.6 25.2 20.3High Risk (15 to 24 Risk Factors) 16.7 17.1 16.0Protective Factor IndexLow Protection (0 to 3 Protective Factors) 34.6 38.2 31.3Moderate Protection (4 to 6 Protective Factors) 39.8 39.3 40.4High Protection (7 to 10 Protective Factors) 25.6 22.4 28.4
NOTES: The percentages above represent the percentage of students who are either at risk for or who have protection fromdeveloping a substance abuse problem. Estimates were determined by weighting the percentage at each grade level by thestatewide N-sizes at that grade level. Statewide percentages are used as comparison points for determining which factors shouldbe targeted in various communities or subgroups. Risk factors above and protective factors below the statewide percentagesshould be considered critical factors to address in prevention efforts. Some students who meet the cutpoint criteria may notdevelop a substance abuse problem; however, the majority of the students who meet the cutpoint criteria have or will develop asubstance abuse problem. The likelihood of a substance abuse problem increases with the number of risk factors to which astudent is exposed and decreases with the number of protective factors to which a student is exposed. The risk and protectivefactor indexes provide the best indication of degree of risk and protection. A portion of respondents did not indicate their genderon the survey. The statewide percentage are based on all students, regardless of whether they marked their gender on thesurvey. Thus, there will be some instances when both males and females are above or below the statewide percentage.
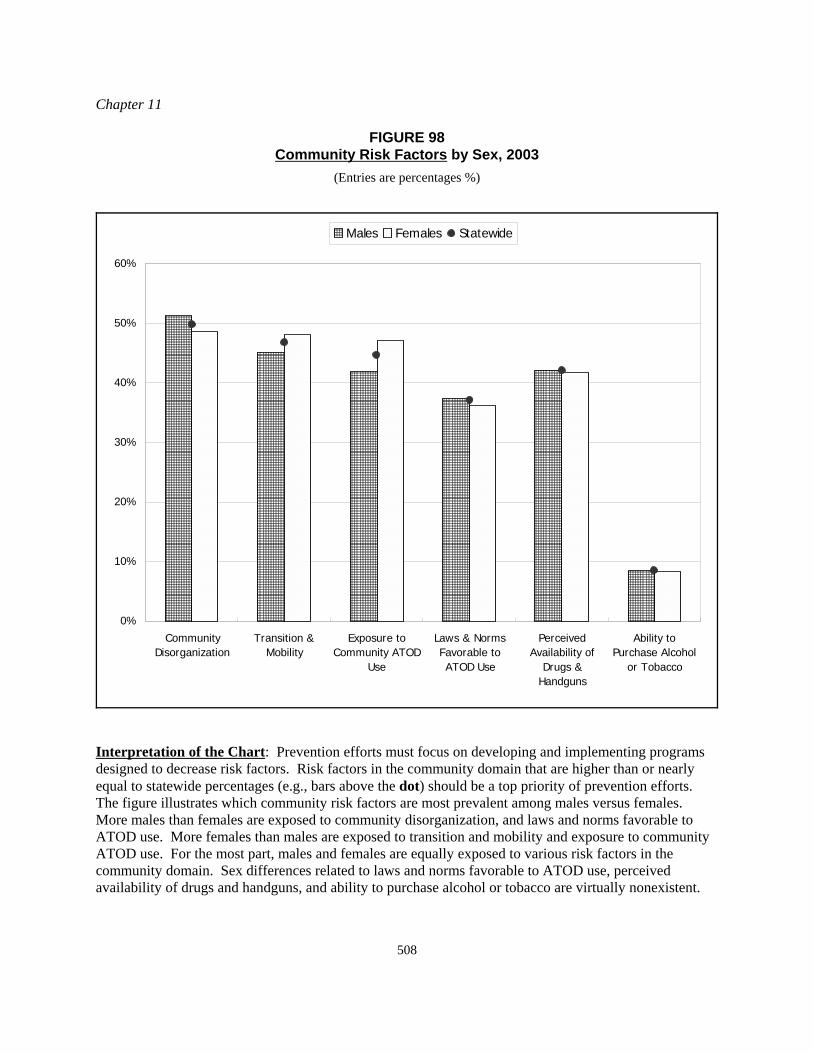
Chapter 11
508
0%
10%
20%
30%
40%
50%
60%
CommunityDisorganization
Transition &Mobility
Exposure toCommunity ATOD
Use
Laws & NormsFavorable toATOD Use
PerceivedAvailability of
Drugs &Handguns
Ability toPurchase Alcohol
or Tobacco
Males Females Statewide
FIGURE 98Community Risk Factors by Sex, 2003
(Entries are percentages %)
Interpretation of the Chart: Prevention efforts must focus on developing and implementing programsdesigned to decrease risk factors. Risk factors in the community domain that are higher than or nearlyequal to statewide percentages (e.g., bars above the dot) should be a top priority of prevention efforts. The figure illustrates which community risk factors are most prevalent among males versus females. More males than females are exposed to community disorganization, and laws and norms favorable toATOD use. More females than males are exposed to transition and mobility and exposure to communityATOD use. For the most part, males and females are equally exposed to various risk factors in thecommunity domain. Sex differences related to laws and norms favorable to ATOD use, perceivedavailability of drugs and handguns, and ability to purchase alcohol or tobacco are virtually nonexistent.
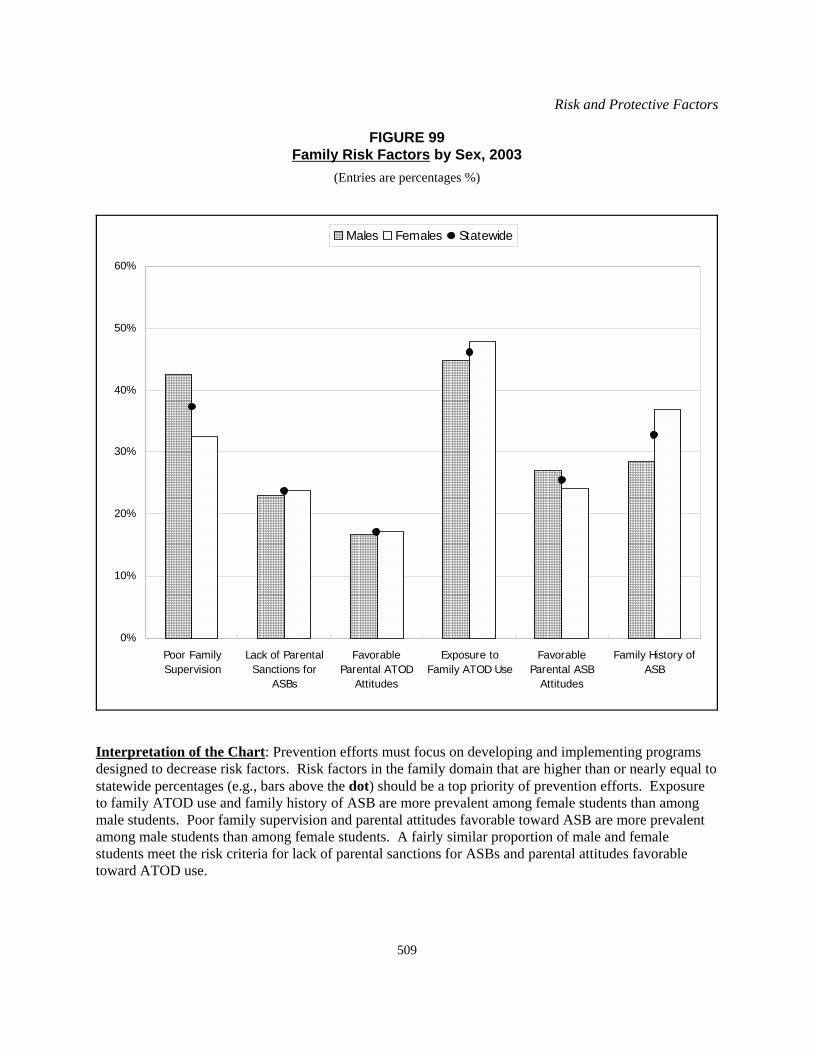
Risk and Protective Factors
509
0%
10%
20%
30%
40%
50%
60%
Poor FamilySupervision
Lack of ParentalSanctions for
ASBs
FavorableParental ATOD
Attitudes
Exposure toFamily ATOD Use
FavorableParental ASB
Attitudes
Family History ofASB
Males Females Statewide
FIGURE 99Family Risk Factors by Sex, 2003
(Entries are percentages %)
Interpretation of the Chart: Prevention efforts must focus on developing and implementing programsdesigned to decrease risk factors. Risk factors in the family domain that are higher than or nearly equal tostatewide percentages (e.g., bars above the dot) should be a top priority of prevention efforts. Exposureto family ATOD use and family history of ASB are more prevalent among female students than amongmale students. Poor family supervision and parental attitudes favorable toward ASB are more prevalentamong male students than among female students. A fairly similar proportion of male and femalestudents meet the risk criteria for lack of parental sanctions for ASBs and parental attitudes favorabletoward ATOD use.
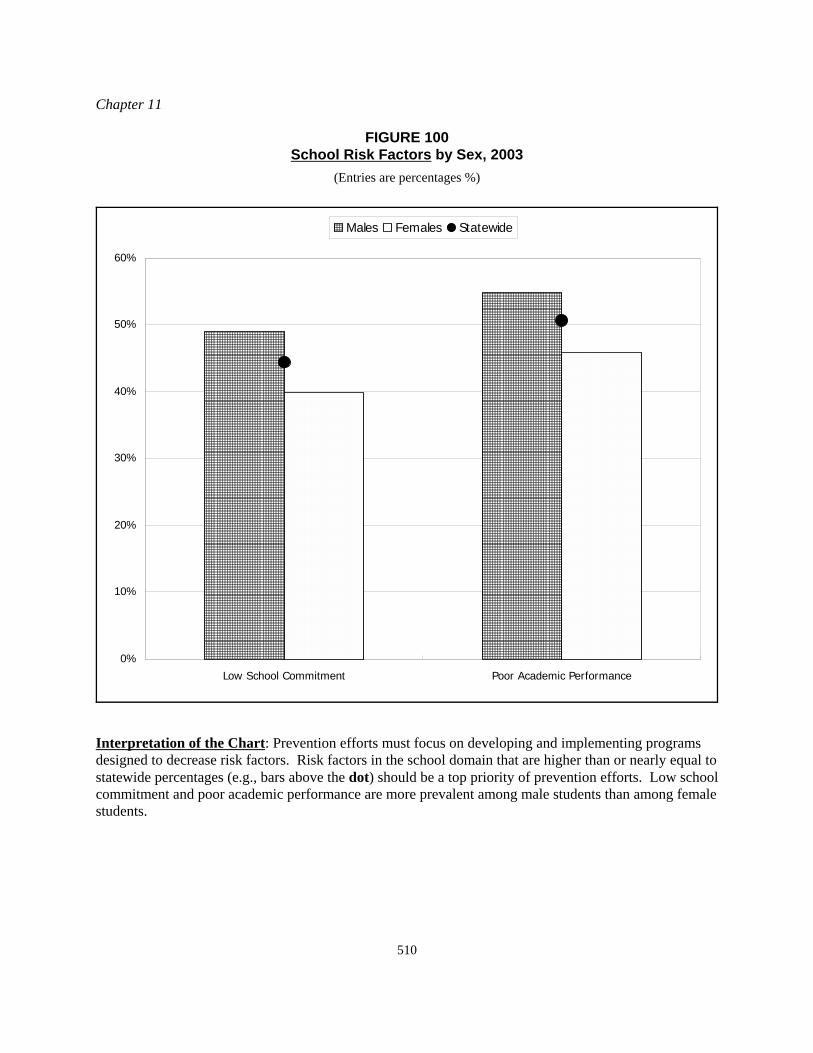
Chapter 11
510
0%
10%
20%
30%
40%
50%
60%
Low School Commitment Poor Academic Performance
Males Females Statewide
FIGURE 100School Risk Factors by Sex, 2003
(Entries are percentages %)
Interpretation of the Chart: Prevention efforts must focus on developing and implementing programsdesigned to decrease risk factors. Risk factors in the school domain that are higher than or nearly equal tostatewide percentages (e.g., bars above the dot) should be a top priority of prevention efforts. Low schoolcommitment and poor academic performance are more prevalent among male students than among femalestudents.
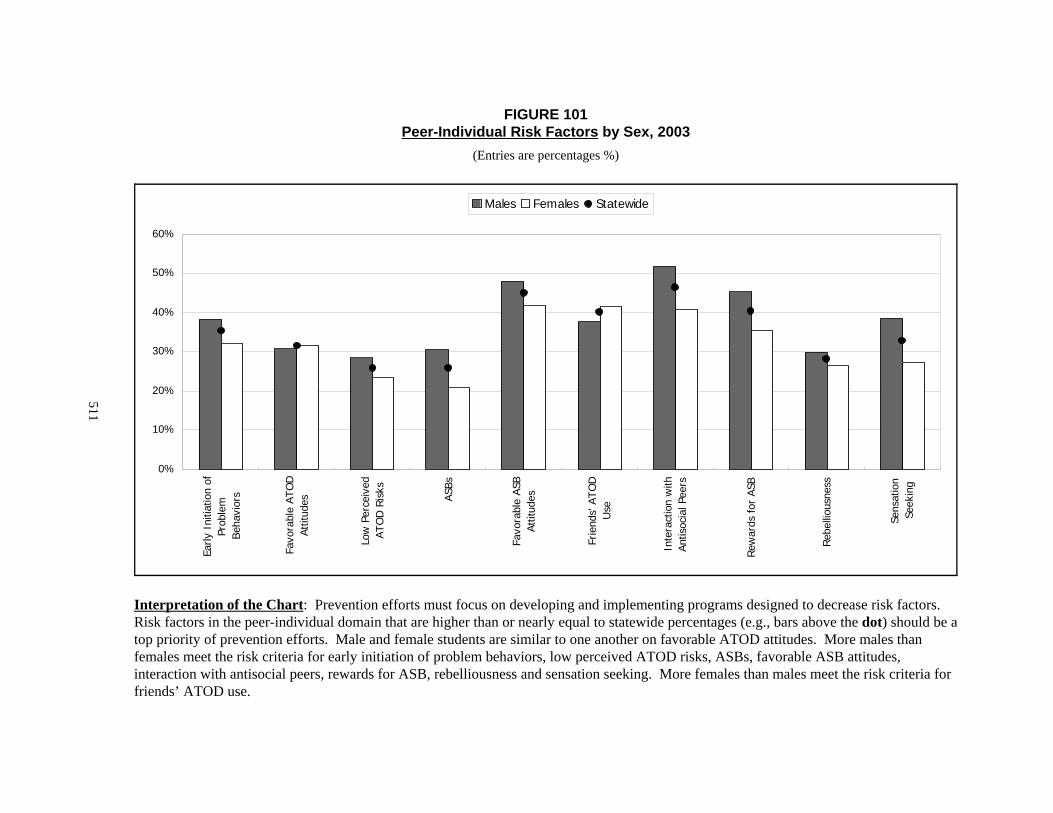
0%
10%
20%
30%
40%
50%
60%
Early
Ini
tiatio
n of
Prob
lem
Beha
vior
s
Favo
rabl
e AT
OD
Attit
udes
Low
Per
ceiv
edAT
OD
Ris
ks
ASBs
Favo
rabl
e AS
BAt
titud
es
Frie
nds'
ATO
DU
se
Inte
ract
ion
with
Antis
ocia
l Pee
rs
Rew
ards
for
ASB
Reb
ellio
usne
ss
Sens
atio
nSe
ekin
g
Males Females Statewide
FIGURE 101Peer-Individual Risk Factors by Sex, 2003
(Entries are percentages %)
Interpretation of the Chart: Prevention efforts must focus on developing and implementing programs designed to decrease risk factors. Risk factors in the peer-individual domain that are higher than or nearly equal to statewide percentages (e.g., bars above the dot) should be atop priority of prevention efforts. Male and female students are similar to one another on favorable ATOD attitudes. More males thanfemales meet the risk criteria for early initiation of problem behaviors, low perceived ATOD risks, ASBs, favorable ASB attitudes,interaction with antisocial peers, rewards for ASB, rebelliousness and sensation seeking. More females than males meet the risk criteria forfriends’ ATOD use.
511
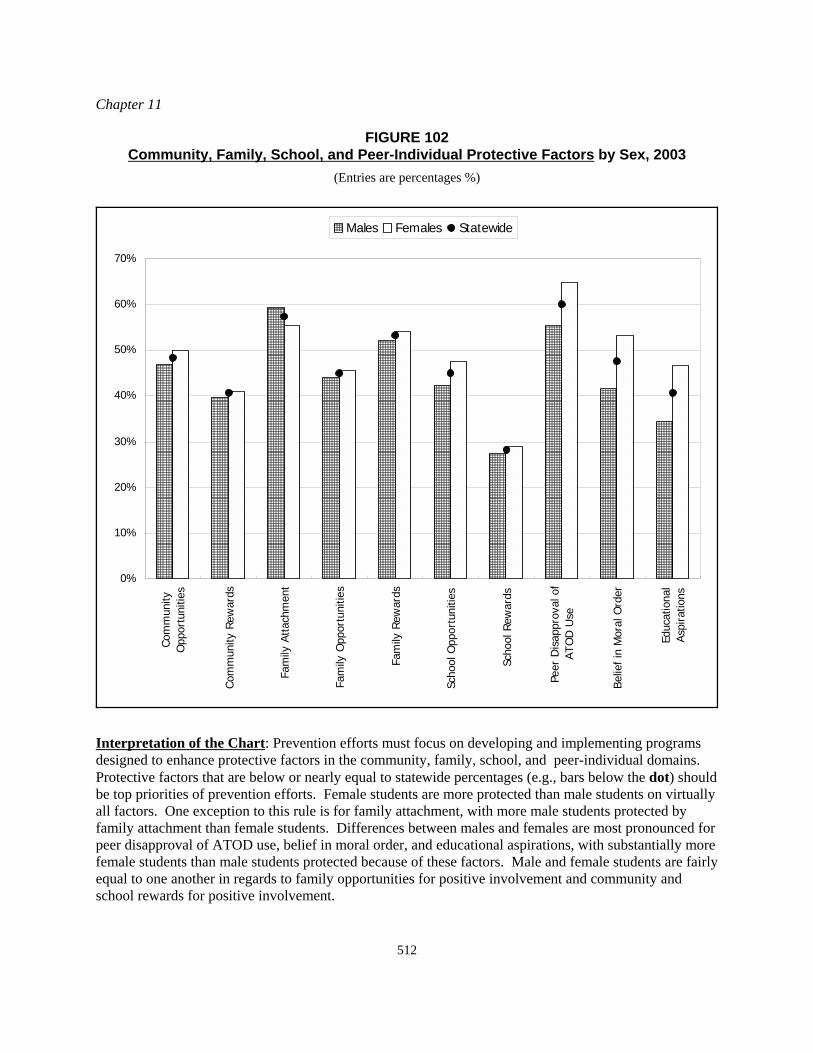
Chapter 11
512
0%
10%
20%
30%
40%
50%
60%
70%
Com
mun
ityO
ppor
tuni
ties
Com
mun
ity R
ewar
ds
Fam
ily A
ttach
men
t
Fam
ily O
ppor
tuni
ties
Fam
ily R
ewar
ds
Scho
ol O
ppor
tuni
ties
Scho
ol R
ewar
ds
Peer
Dis
appr
oval
of
ATO
D U
se
Belie
f in
Mor
al O
rder
Educ
atio
nal
Asp
iratio
ns
Males Females Statewide
FIGURE 102Community, Family, School, and Peer-Individual Protective Factors by Sex, 2003
(Entries are percentages %)
Interpretation of the Chart: Prevention efforts must focus on developing and implementing programsdesigned to enhance protective factors in the community, family, school, and peer-individual domains. Protective factors that are below or nearly equal to statewide percentages (e.g., bars below the dot) shouldbe top priorities of prevention efforts. Female students are more protected than male students on virtuallyall factors. One exception to this rule is for family attachment, with more male students protected byfamily attachment than female students. Differences between males and females are most pronounced forpeer disapproval of ATOD use, belief in moral order, and educational aspirations, with substantially morefemale students than male students protected because of these factors. Male and female students are fairlyequal to one another in regards to family opportunities for positive involvement and community andschool rewards for positive involvement.
Risk and Protective Factors
513
Ethnic Comparisons
Similar to the previous sections, prevention efforts directed at different ethnic groups should focus on riskfactors that are above the statewide percentages and protective factors that are below the statewidepercentages. This section addresses risk and protective factors that are most prevalent among certainethnic groups to help explain why groups have different prevalence rates. As noted in Chapter 4 andChapter 6, substance use and abuse are higher among Native Hawaiian and White students than studentsfrom other ethnic groups. The risk and protective profiles detailed below can help structure preventionprograms directed at lowering the prevalence rates among Native Hawaiian and White students, and canhelp explain factors that might be causing the higher prevalence rates among these groups of students.
Table 73 lists the percentages of students from each ethnic group who meet the criteria for each risk andprotective factor, and the percentages of these students who are exposed to a high, moderate, or lownumber of factors. Figures 103 through 106 display each risk factor in each domain so that ethnic groupscan be compared to one another, as well as to statewide percentages. Figure 107 displays each protectivefactor in each domain so that ethnic groups can be compared to one another, as well as to statewidepercentages. Bars represent subgroup percentages, and dots represent statewide percentages. Bars abovethe dots on the risk factor figures represent elevated risk, and bars below the dots on the protective factorfigures represent low levels of protection. Prevention efforts should address risk factors that are higherthan statewide averages and protective factors that are lower than statewide averages.
Overview of Key Findings. A larger proportion of Native Hawaiian and White students than studentsfrom other ethnic backgrounds have elevated risk because of the number of risk factors to which they areexposed. Less than one tenth of Chinese and Japanese students are exposed to 15 or more risk factors,whereas over one-fifth of the Native Hawaiian and White students are exposed to 15 or more risk factors. Ethnic differences are less pronounced on the protective factor index. Specific risk and protective factorsthat are higher or lower among students from various ethnic groups are noted in the figures and discussedbelow.
. ! Comparisons on the risk factor index in Table 73 show that larger proportions of NativeHawaiian and White students than students from other ethnic groups are exposed to 15 ormore risk factors. Nearly twice as many Native Hawaiians and Whites (22% each) thanFilipinos (13%) are exposed to a high number of risk factors; differences are even morepronounced when comparing these groups to Chinese (7%) and Japanese (9%).
! Ethnic differences are less pronounced on the protective factor index. A greaterproportion of Japanese (28%), compared to Native Hawaiians and Whites (27% each),and Chinese and Filipinos (24% each), are exposed to a high amount of protectivefactors.
! Japanese students have fewer problematic factors than students from all other ethnicgroups (see Table 74 on pages 522-523). Prevention efforts directed at Japanese studentsshould focus on the following problematic factors: (1) family opportunities for prosocialinvolvement, (2) low school commitment, (3) school opportunities for positiveinvolvement, and (4) school rewards for positive involvement.
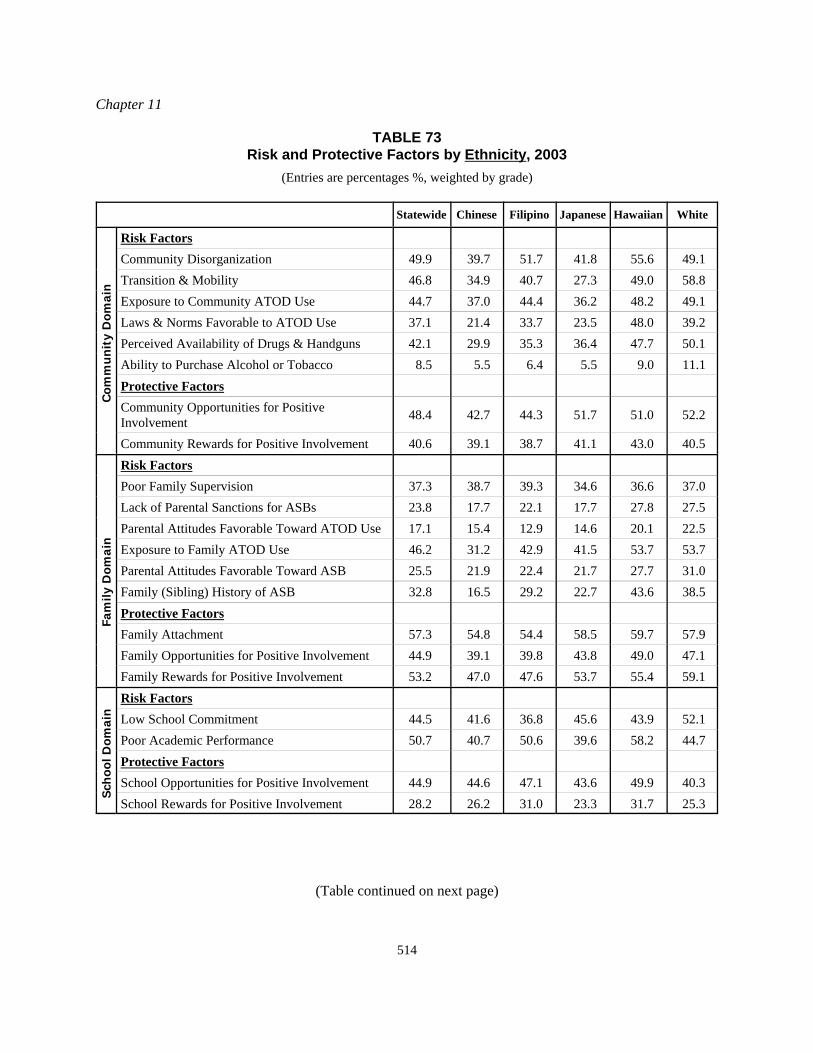
Chapter 11
514
TABLE 73Risk and Protective Factors by Ethnicity, 2003
(Entries are percentages %, weighted by grade)
Statewide Chinese Filipino Japanese Hawaiian White
Com
mu
nit
y D
omai
n
Risk FactorsCommunity Disorganization 49.9 39.7 51.7 41.8 55.6 49.1Transition & Mobility 46.8 34.9 40.7 27.3 49.0 58.8Exposure to Community ATOD Use 44.7 37.0 44.4 36.2 48.2 49.1Laws & Norms Favorable to ATOD Use 37.1 21.4 33.7 23.5 48.0 39.2Perceived Availability of Drugs & Handguns 42.1 29.9 35.3 36.4 47.7 50.1Ability to Purchase Alcohol or Tobacco 8.5 5.5 6.4 5.5 9.0 11.1Protective FactorsCommunity Opportunities for PositiveInvolvement 48.4 42.7 44.3 51.7 51.0 52.2
Community Rewards for Positive Involvement 40.6 39.1 38.7 41.1 43.0 40.5
Fam
ily D
omai
n
Risk FactorsPoor Family Supervision 37.3 38.7 39.3 34.6 36.6 37.0Lack of Parental Sanctions for ASBs 23.8 17.7 22.1 17.7 27.8 27.5Parental Attitudes Favorable Toward ATOD Use 17.1 15.4 12.9 14.6 20.1 22.5Exposure to Family ATOD Use 46.2 31.2 42.9 41.5 53.7 53.7Parental Attitudes Favorable Toward ASB 25.5 21.9 22.4 21.7 27.7 31.0Family (Sibling) History of ASB 32.8 16.5 29.2 22.7 43.6 38.5Protective FactorsFamily Attachment 57.3 54.8 54.4 58.5 59.7 57.9Family Opportunities for Positive Involvement 44.9 39.1 39.8 43.8 49.0 47.1Family Rewards for Positive Involvement 53.2 47.0 47.6 53.7 55.4 59.1
Sch
ool D
omai
n
Risk FactorsLow School Commitment 44.5 41.6 36.8 45.6 43.9 52.1Poor Academic Performance 50.7 40.7 50.6 39.6 58.2 44.7Protective FactorsSchool Opportunities for Positive Involvement 44.9 44.6 47.1 43.6 49.9 40.3School Rewards for Positive Involvement 28.2 26.2 31.0 23.3 31.7 25.3
(Table continued on next page)
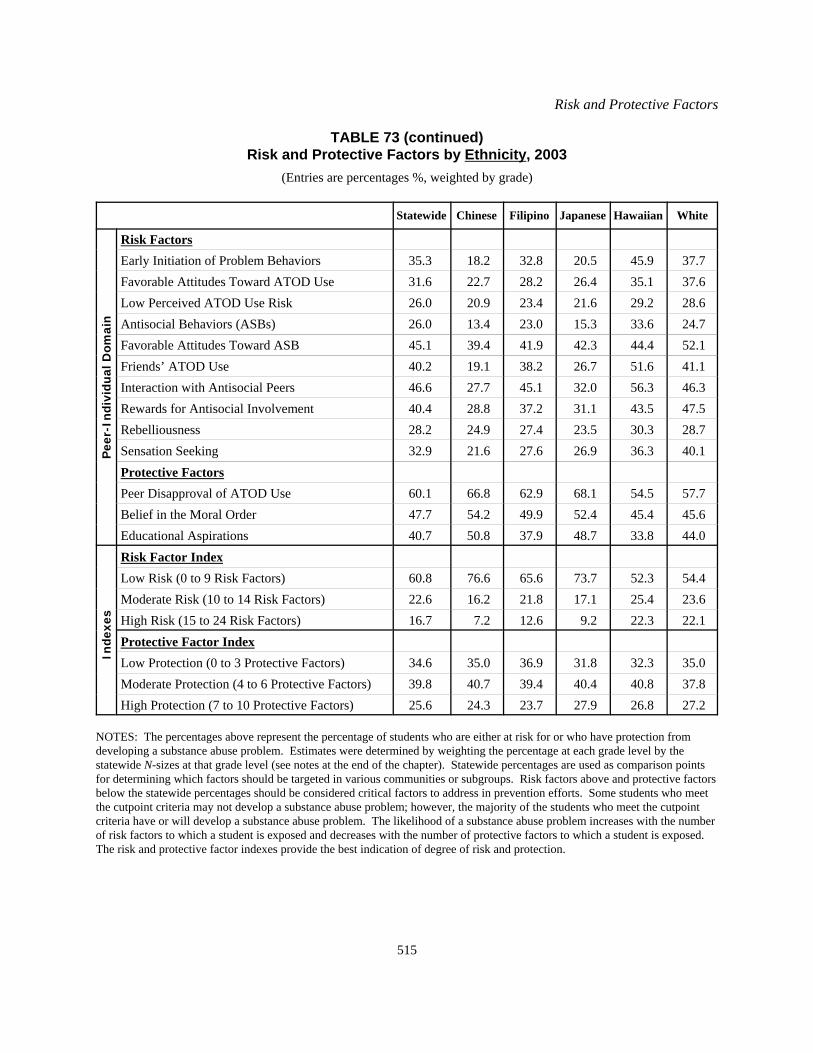
Risk and Protective Factors
515
TABLE 73 (continued)Risk and Protective Factors by Ethnicity, 2003
(Entries are percentages %, weighted by grade)
Statewide Chinese Filipino Japanese Hawaiian White
Pee
r-In
divi
dual
Dom
ain
Risk FactorsEarly Initiation of Problem Behaviors 35.3 18.2 32.8 20.5 45.9 37.7Favorable Attitudes Toward ATOD Use 31.6 22.7 28.2 26.4 35.1 37.6Low Perceived ATOD Use Risk 26.0 20.9 23.4 21.6 29.2 28.6Antisocial Behaviors (ASBs) 26.0 13.4 23.0 15.3 33.6 24.7Favorable Attitudes Toward ASB 45.1 39.4 41.9 42.3 44.4 52.1Friends’ ATOD Use 40.2 19.1 38.2 26.7 51.6 41.1Interaction with Antisocial Peers 46.6 27.7 45.1 32.0 56.3 46.3Rewards for Antisocial Involvement 40.4 28.8 37.2 31.1 43.5 47.5Rebelliousness 28.2 24.9 27.4 23.5 30.3 28.7Sensation Seeking 32.9 21.6 27.6 26.9 36.3 40.1Protective FactorsPeer Disapproval of ATOD Use 60.1 66.8 62.9 68.1 54.5 57.7Belief in the Moral Order 47.7 54.2 49.9 52.4 45.4 45.6Educational Aspirations 40.7 50.8 37.9 48.7 33.8 44.0
Inde
xes
Risk Factor IndexLow Risk (0 to 9 Risk Factors) 60.8 76.6 65.6 73.7 52.3 54.4Moderate Risk (10 to 14 Risk Factors) 22.6 16.2 21.8 17.1 25.4 23.6High Risk (15 to 24 Risk Factors) 16.7 7.2 12.6 9.2 22.3 22.1Protective Factor IndexLow Protection (0 to 3 Protective Factors) 34.6 35.0 36.9 31.8 32.3 35.0Moderate Protection (4 to 6 Protective Factors) 39.8 40.7 39.4 40.4 40.8 37.8High Protection (7 to 10 Protective Factors) 25.6 24.3 23.7 27.9 26.8 27.2
NOTES: The percentages above represent the percentage of students who are either at risk for or who have protection fromdeveloping a substance abuse problem. Estimates were determined by weighting the percentage at each grade level by thestatewide N-sizes at that grade level (see notes at the end of the chapter). Statewide percentages are used as comparison pointsfor determining which factors should be targeted in various communities or subgroups. Risk factors above and protective factorsbelow the statewide percentages should be considered critical factors to address in prevention efforts. Some students who meetthe cutpoint criteria may not develop a substance abuse problem; however, the majority of the students who meet the cutpointcriteria have or will develop a substance abuse problem. The likelihood of a substance abuse problem increases with the numberof risk factors to which a student is exposed and decreases with the number of protective factors to which a student is exposed. The risk and protective factor indexes provide the best indication of degree of risk and protection.
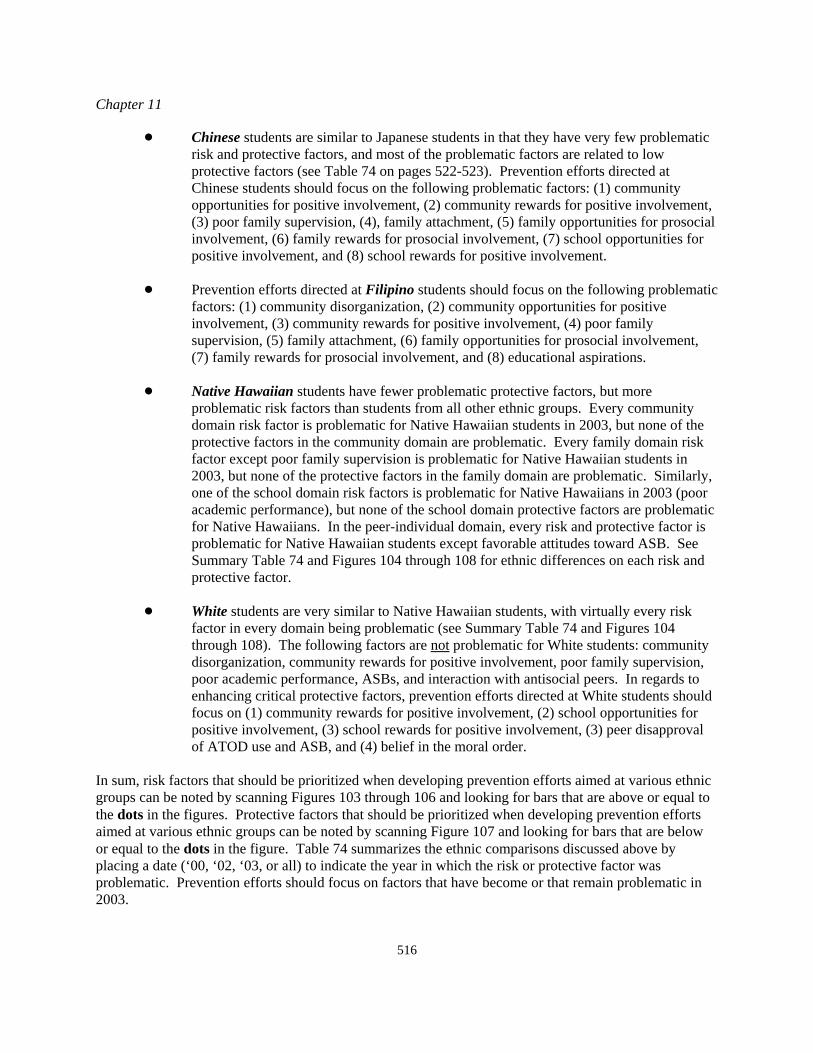
Chapter 11
516
! Chinese students are similar to Japanese students in that they have very few problematicrisk and protective factors, and most of the problematic factors are related to lowprotective factors (see Table 74 on pages 522-523). Prevention efforts directed atChinese students should focus on the following problematic factors: (1) communityopportunities for positive involvement, (2) community rewards for positive involvement,(3) poor family supervision, (4), family attachment, (5) family opportunities for prosocialinvolvement, (6) family rewards for prosocial involvement, (7) school opportunities forpositive involvement, and (8) school rewards for positive involvement.
! Prevention efforts directed at Filipino students should focus on the following problematicfactors: (1) community disorganization, (2) community opportunities for positiveinvolvement, (3) community rewards for positive involvement, (4) poor familysupervision, (5) family attachment, (6) family opportunities for prosocial involvement,(7) family rewards for prosocial involvement, and (8) educational aspirations.
! Native Hawaiian students have fewer problematic protective factors, but moreproblematic risk factors than students from all other ethnic groups. Every communitydomain risk factor is problematic for Native Hawaiian students in 2003, but none of theprotective factors in the community domain are problematic. Every family domain riskfactor except poor family supervision is problematic for Native Hawaiian students in2003, but none of the protective factors in the family domain are problematic. Similarly,one of the school domain risk factors is problematic for Native Hawaiians in 2003 (pooracademic performance), but none of the school domain protective factors are problematicfor Native Hawaiians. In the peer-individual domain, every risk and protective factor isproblematic for Native Hawaiian students except favorable attitudes toward ASB. SeeSummary Table 74 and Figures 104 through 108 for ethnic differences on each risk andprotective factor.
! White students are very similar to Native Hawaiian students, with virtually every riskfactor in every domain being problematic (see Summary Table 74 and Figures 104through 108). The following factors are not problematic for White students: communitydisorganization, community rewards for positive involvement, poor family supervision,poor academic performance, ASBs, and interaction with antisocial peers. In regards toenhancing critical protective factors, prevention efforts directed at White students shouldfocus on (1) community rewards for positive involvement, (2) school opportunities forpositive involvement, (3) school rewards for positive involvement, (3) peer disapprovalof ATOD use and ASB, and (4) belief in the moral order.
In sum, risk factors that should be prioritized when developing prevention efforts aimed at various ethnicgroups can be noted by scanning Figures 103 through 106 and looking for bars that are above or equal tothe dots in the figures. Protective factors that should be prioritized when developing prevention effortsaimed at various ethnic groups can be noted by scanning Figure 107 and looking for bars that are belowor equal to the dots in the figure. Table 74 summarizes the ethnic comparisons discussed above byplacing a date (‘00, ‘02, ‘03, or all) to indicate the year in which the risk or protective factor wasproblematic. Prevention efforts should focus on factors that have become or that remain problematic in2003.
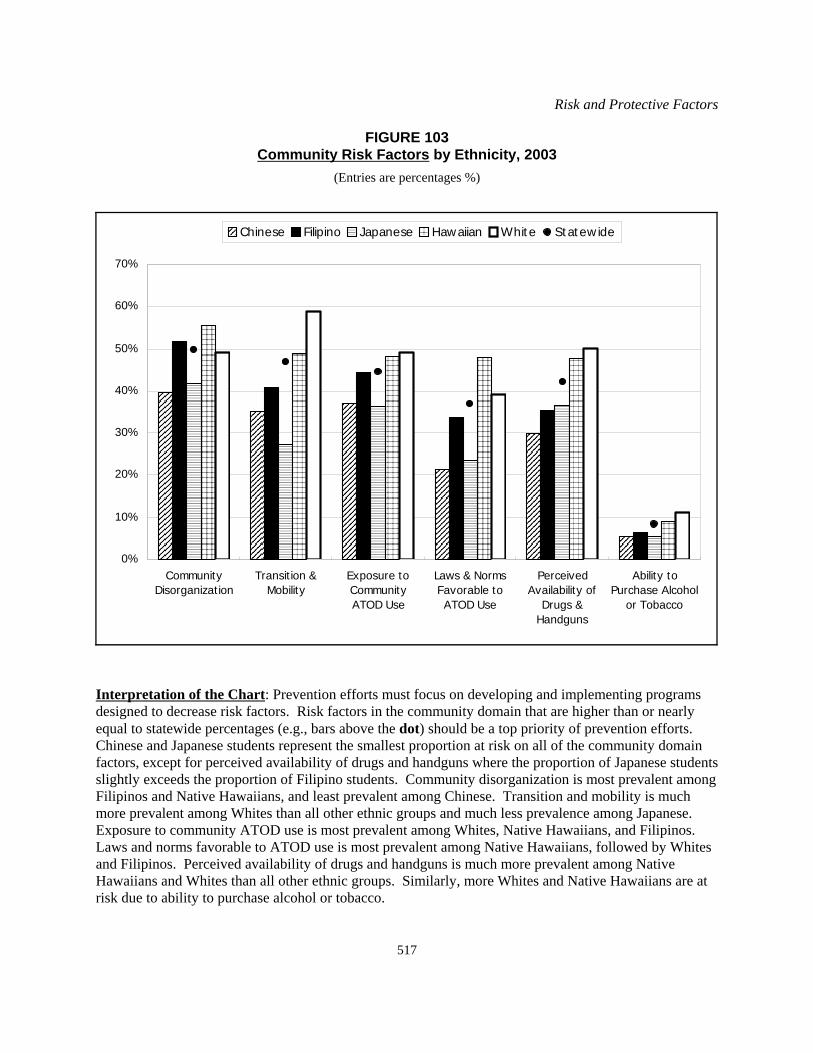
Risk and Protective Factors
517
0%
10%
20%
30%
40%
50%
60%
70%
CommunityDisorganization
Transition &Mobility
Exposure toCommunityATOD Use
Laws & NormsFavorable toATOD Use
PerceivedAvailability of
Drugs &Handguns
Ability toPurchase Alcohol
or Tobacco
Chinese Filipino Japanese Hawaiian White Statewide
FIGURE 103Community Risk Factors by Ethnicity, 2003
(Entries are percentages %)
Interpretation of the Chart: Prevention efforts must focus on developing and implementing programsdesigned to decrease risk factors. Risk factors in the community domain that are higher than or nearlyequal to statewide percentages (e.g., bars above the dot) should be a top priority of prevention efforts. Chinese and Japanese students represent the smallest proportion at risk on all of the community domainfactors, except for perceived availability of drugs and handguns where the proportion of Japanese studentsslightly exceeds the proportion of Filipino students. Community disorganization is most prevalent amongFilipinos and Native Hawaiians, and least prevalent among Chinese. Transition and mobility is muchmore prevalent among Whites than all other ethnic groups and much less prevalence among Japanese. Exposure to community ATOD use is most prevalent among Whites, Native Hawaiians, and Filipinos. Laws and norms favorable to ATOD use is most prevalent among Native Hawaiians, followed by Whitesand Filipinos. Perceived availability of drugs and handguns is much more prevalent among NativeHawaiians and Whites than all other ethnic groups. Similarly, more Whites and Native Hawaiians are atrisk due to ability to purchase alcohol or tobacco.
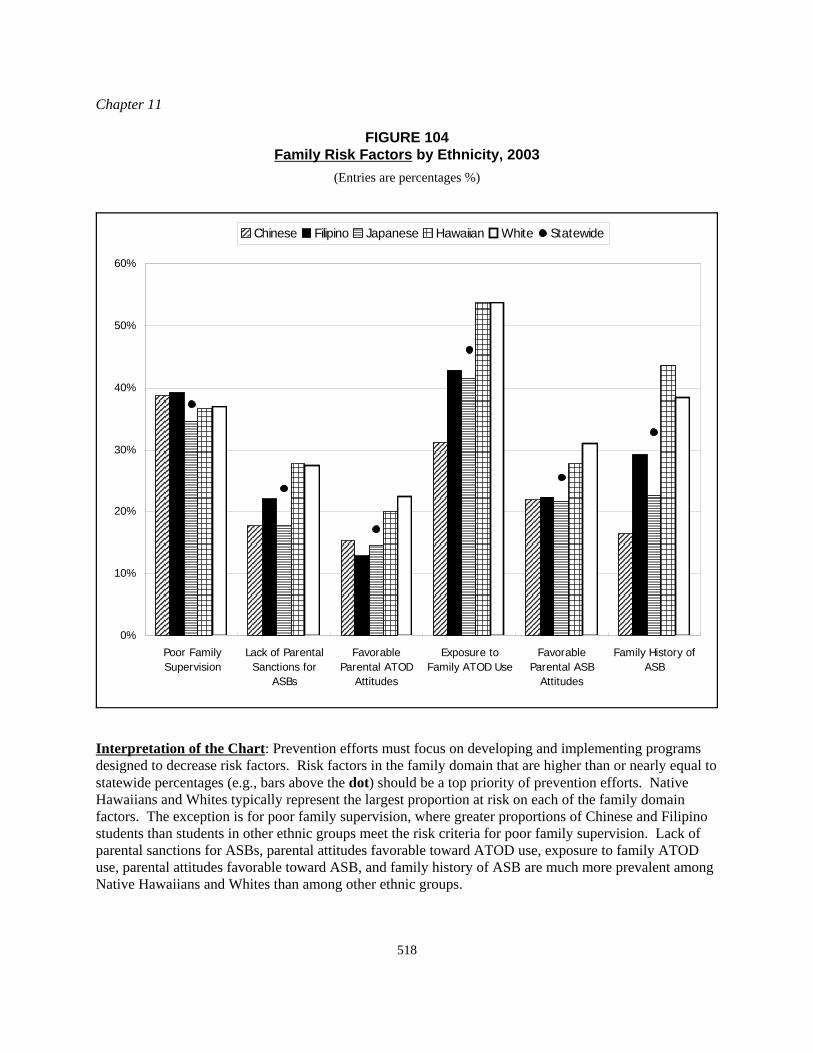
Chapter 11
518
0%
10%
20%
30%
40%
50%
60%
Poor FamilySupervision
Lack of ParentalSanctions for
ASBs
FavorableParental ATOD
Attitudes
Exposure toFamily ATOD Use
FavorableParental ASB
Attitudes
Family History ofASB
Chinese Filipino Japanese Hawaiian White Statewide
FIGURE 104Family Risk Factors by Ethnicity, 2003
(Entries are percentages %)
Interpretation of the Chart: Prevention efforts must focus on developing and implementing programsdesigned to decrease risk factors. Risk factors in the family domain that are higher than or nearly equal tostatewide percentages (e.g., bars above the dot) should be a top priority of prevention efforts. NativeHawaiians and Whites typically represent the largest proportion at risk on each of the family domainfactors. The exception is for poor family supervision, where greater proportions of Chinese and Filipinostudents than students in other ethnic groups meet the risk criteria for poor family supervision. Lack ofparental sanctions for ASBs, parental attitudes favorable toward ATOD use, exposure to family ATODuse, parental attitudes favorable toward ASB, and family history of ASB are much more prevalent amongNative Hawaiians and Whites than among other ethnic groups.
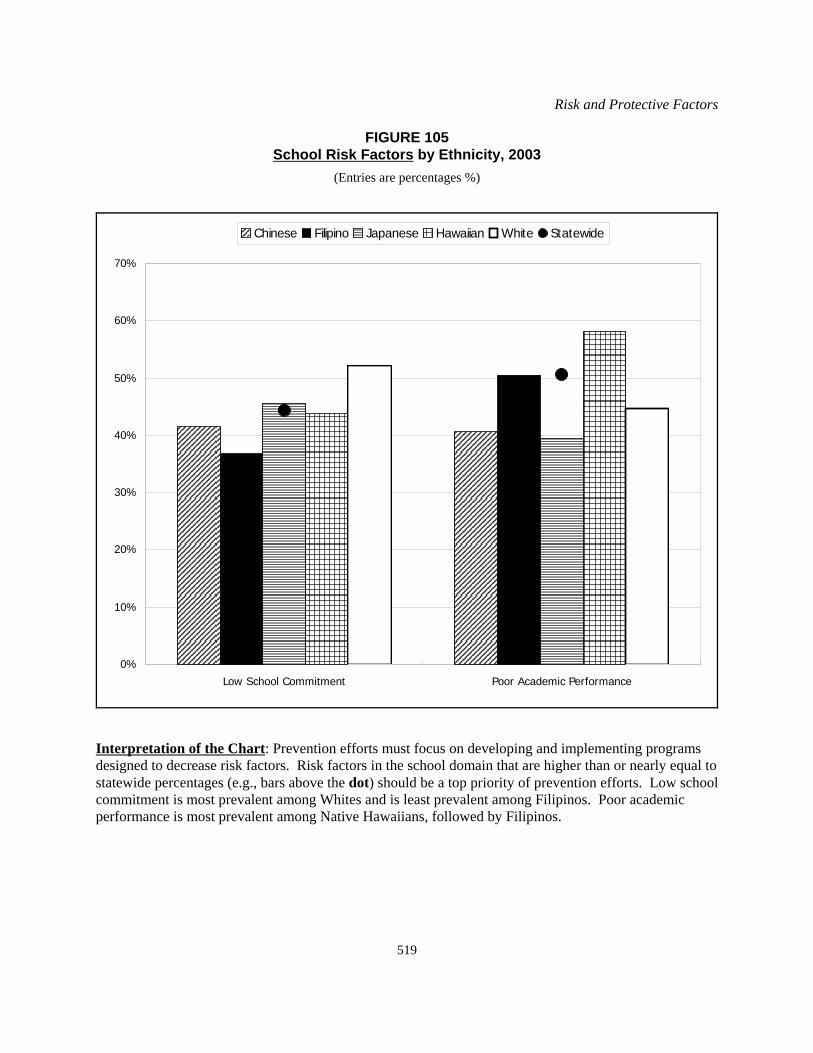
Risk and Protective Factors
519
0%
10%
20%
30%
40%
50%
60%
70%
Low School Commitment Poor Academic Performance
Chinese Filipino Japanese Hawaiian White Statewide
FIGURE 105School Risk Factors by Ethnicity, 2003
(Entries are percentages %)
Interpretation of the Chart: Prevention efforts must focus on developing and implementing programsdesigned to decrease risk factors. Risk factors in the school domain that are higher than or nearly equal tostatewide percentages (e.g., bars above the dot) should be a top priority of prevention efforts. Low schoolcommitment is most prevalent among Whites and is least prevalent among Filipinos. Poor academicperformance is most prevalent among Native Hawaiians, followed by Filipinos.
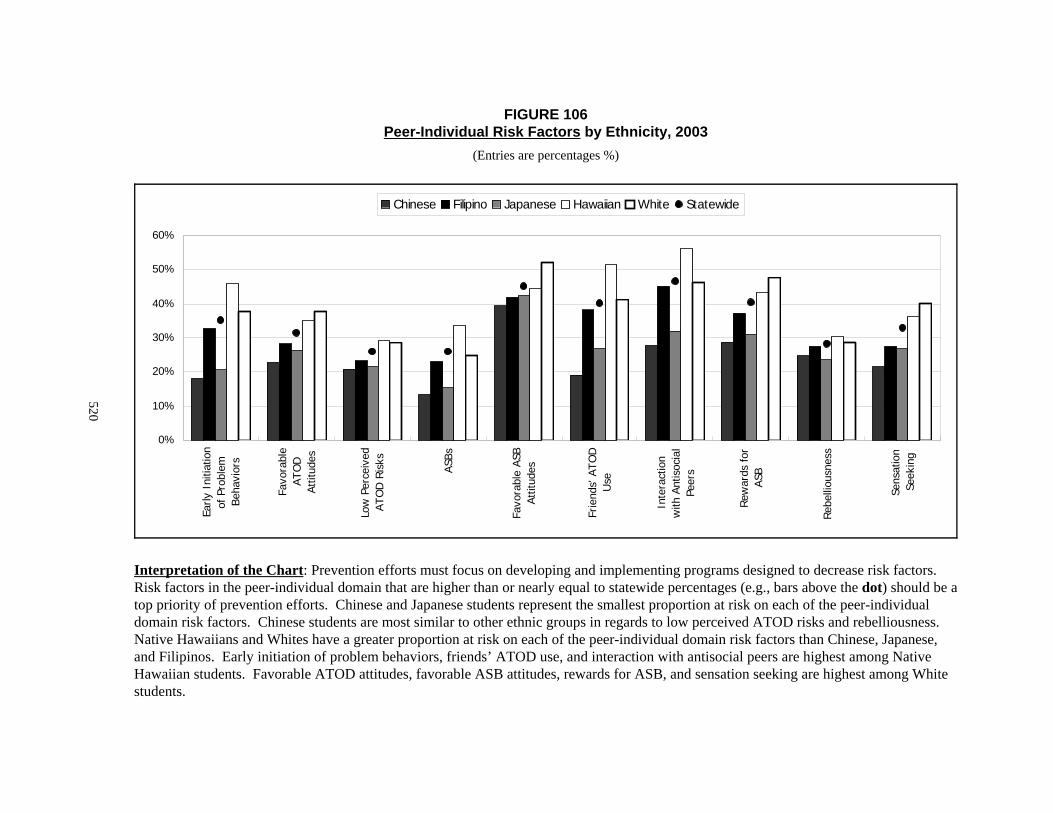
0%
10%
20%
30%
40%
50%
60%
Early
Ini
tiatio
nof
Pro
blem
Beha
vior
s
Favo
rabl
eAT
OD
Attit
udes
Low
Per
ceiv
edAT
OD
Ris
ks
ASBs
Favo
rabl
e AS
BAt
titud
es
Frie
nds'
ATO
DU
se
Inte
ract
ion
with
Ant
isoc
ial
Peer
s
Rew
ards
for
ASB
Rebe
lliou
snes
s
Sens
atio
nSe
ekin
g
Chinese Filipino Japanese Hawaiian White Statewide
FIGURE 106Peer-Individual Risk Factors by Ethnicity, 2003
(Entries are percentages %)
Interpretation of the Chart: Prevention efforts must focus on developing and implementing programs designed to decrease risk factors. Risk factors in the peer-individual domain that are higher than or nearly equal to statewide percentages (e.g., bars above the dot) should be atop priority of prevention efforts. Chinese and Japanese students represent the smallest proportion at risk on each of the peer-individualdomain risk factors. Chinese students are most similar to other ethnic groups in regards to low perceived ATOD risks and rebelliousness. Native Hawaiians and Whites have a greater proportion at risk on each of the peer-individual domain risk factors than Chinese, Japanese,and Filipinos. Early initiation of problem behaviors, friends’ ATOD use, and interaction with antisocial peers are highest among NativeHawaiian students. Favorable ATOD attitudes, favorable ASB attitudes, rewards for ASB, and sensation seeking are highest among Whitestudents.
520
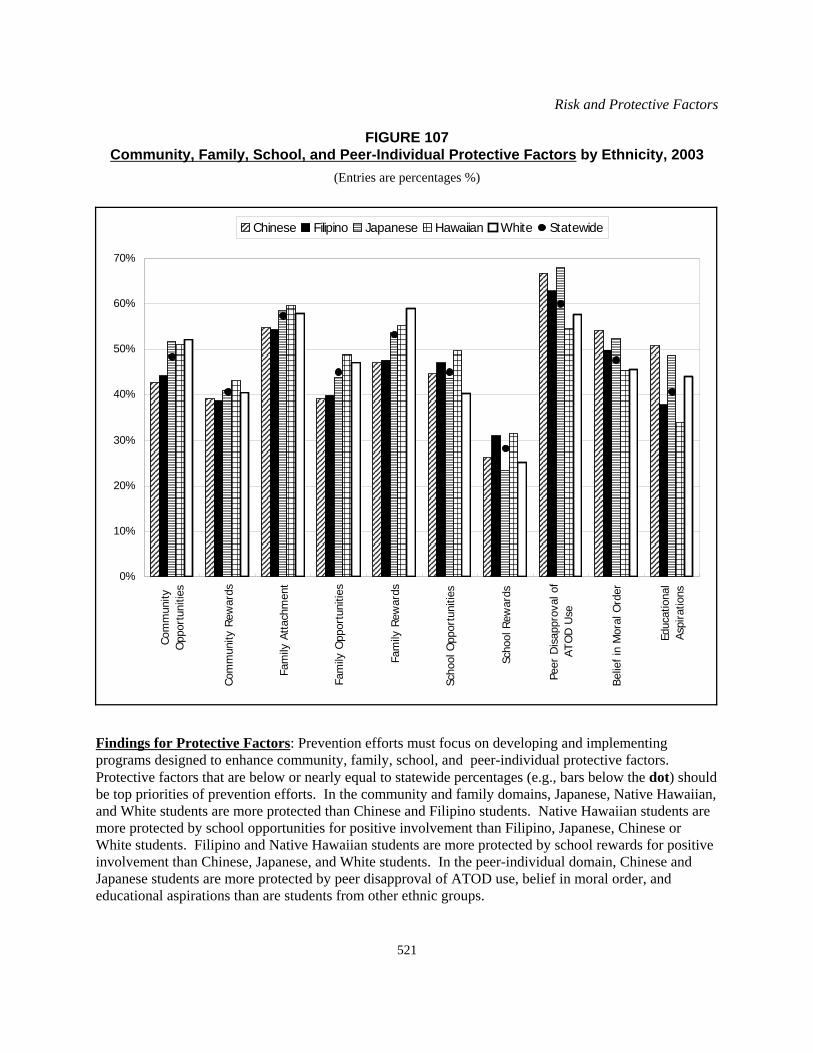
Risk and Protective Factors
521
0%
10%
20%
30%
40%
50%
60%
70%
Com
mun
ityO
ppor
tuni
ties
Com
mun
ity R
ewar
ds
Fam
ily A
ttach
men
t
Fam
ily O
ppor
tuni
ties
Fam
ily R
ewar
ds
Scho
ol O
ppor
tuni
ties
Scho
ol R
ewar
ds
Peer
Dis
appr
oval
of
ATO
D U
se
Belie
f in
Mor
al O
rder
Educ
atio
nal
Aspi
ratio
ns
Chinese Filipino Japanese Hawaiian White Statewide
FIGURE 107Community, Family, School, and Peer-Individual Protective Factors by Ethnicity, 2003
(Entries are percentages %)
Findings for Protective Factors: Prevention efforts must focus on developing and implementingprograms designed to enhance community, family, school, and peer-individual protective factors. Protective factors that are below or nearly equal to statewide percentages (e.g., bars below the dot) shouldbe top priorities of prevention efforts. In the community and family domains, Japanese, Native Hawaiian,and White students are more protected than Chinese and Filipino students. Native Hawaiian students aremore protected by school opportunities for positive involvement than Filipino, Japanese, Chinese orWhite students. Filipino and Native Hawaiian students are more protected by school rewards for positiveinvolvement than Chinese, Japanese, and White students. In the peer-individual domain, Chinese andJapanese students are more protected by peer disapproval of ATOD use, belief in moral order, andeducational aspirations than are students from other ethnic groups.
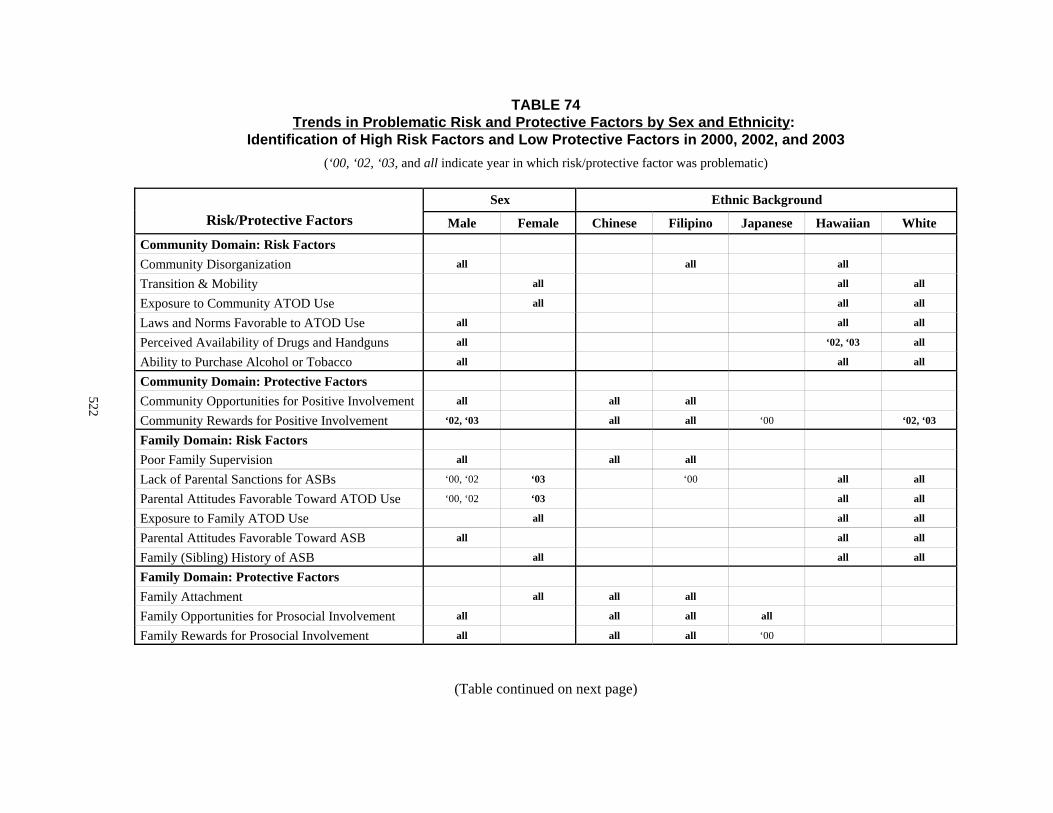
TABLE 74Trends in Problematic Risk and Protective Factors by Sex and Ethnicity:
Identification of High Risk Factors and Low Protective Factors in 2000, 2002, and 2003(‘00, ‘02, ‘03, and all indicate year in which risk/protective factor was problematic)
Risk/Protective FactorsSex Ethnic Background
Male Female Chinese Filipino Japanese Hawaiian WhiteCommunity Domain: Risk FactorsCommunity Disorganization all all all
Transition & Mobility all all all
Exposure to Community ATOD Use all all all
Laws and Norms Favorable to ATOD Use all all all
Perceived Availability of Drugs and Handguns all ‘02, ‘03 all
Ability to Purchase Alcohol or Tobacco all all all
Community Domain: Protective FactorsCommunity Opportunities for Positive Involvement all all all
Community Rewards for Positive Involvement ‘02, ‘03 all all ‘00 ‘02, ‘03
Family Domain: Risk FactorsPoor Family Supervision all all all
Lack of Parental Sanctions for ASBs ‘00, ‘02 ‘03 ‘00 all all
Parental Attitudes Favorable Toward ATOD Use ‘00, ‘02 ‘03 all all
Exposure to Family ATOD Use all all all
Parental Attitudes Favorable Toward ASB all all all
Family (Sibling) History of ASB all all all
Family Domain: Protective FactorsFamily Attachment all all all
Family Opportunities for Prosocial Involvement all all all all
Family Rewards for Prosocial Involvement all all all ‘00
(Table continued on next page)
522
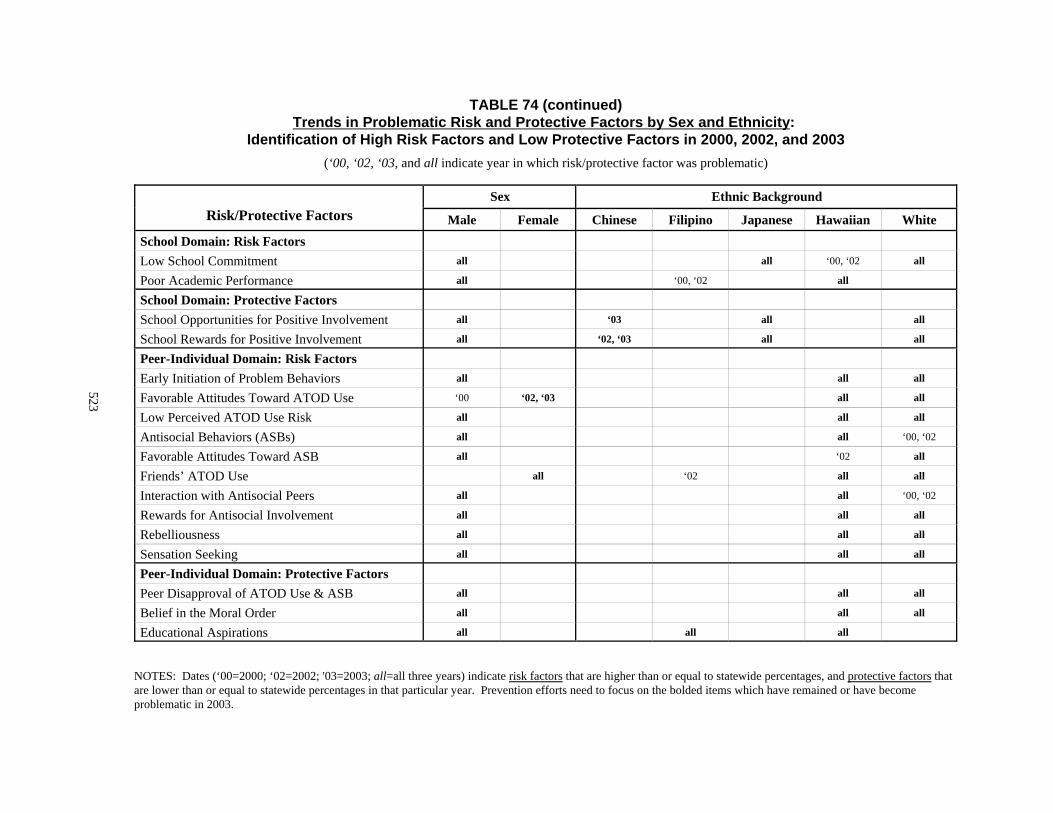
TABLE 74 (continued)Trends in Problematic Risk and Protective Factors by Sex and Ethnicity:
Identification of High Risk Factors and Low Protective Factors in 2000, 2002, and 2003(‘00, ‘02, ‘03, and all indicate year in which risk/protective factor was problematic)
Risk/Protective FactorsSex Ethnic Background
Male Female Chinese Filipino Japanese Hawaiian WhiteSchool Domain: Risk FactorsLow School Commitment all all ‘00, ‘02 all
Poor Academic Performance all ‘00, ‘02 all
School Domain: Protective FactorsSchool Opportunities for Positive Involvement all ‘03 all all
School Rewards for Positive Involvement all ‘02, ‘03 all all
Peer-Individual Domain: Risk FactorsEarly Initiation of Problem Behaviors all all all
Favorable Attitudes Toward ATOD Use ‘00 ‘02, ‘03 all all
Low Perceived ATOD Use Risk all all all
Antisocial Behaviors (ASBs) all all ‘00, ‘02
Favorable Attitudes Toward ASB all ‘02 all
Friends’ ATOD Use all ‘02 all all
Interaction with Antisocial Peers all all ‘00, ‘02
Rewards for Antisocial Involvement all all all
Rebelliousness all all all
Sensation Seeking all all all
Peer-Individual Domain: Protective FactorsPeer Disapproval of ATOD Use & ASB all all all
Belief in the Moral Order all all all
Educational Aspirations all all all
NOTES: Dates (‘00=2000; ‘02=2002; '03=2003; all=all three years) indicate risk factors that are higher than or equal to statewide percentages, and protective factors thatare lower than or equal to statewide percentages in that particular year. Prevention efforts need to focus on the bolded items which have remained or have becomeproblematic in 2003.
523
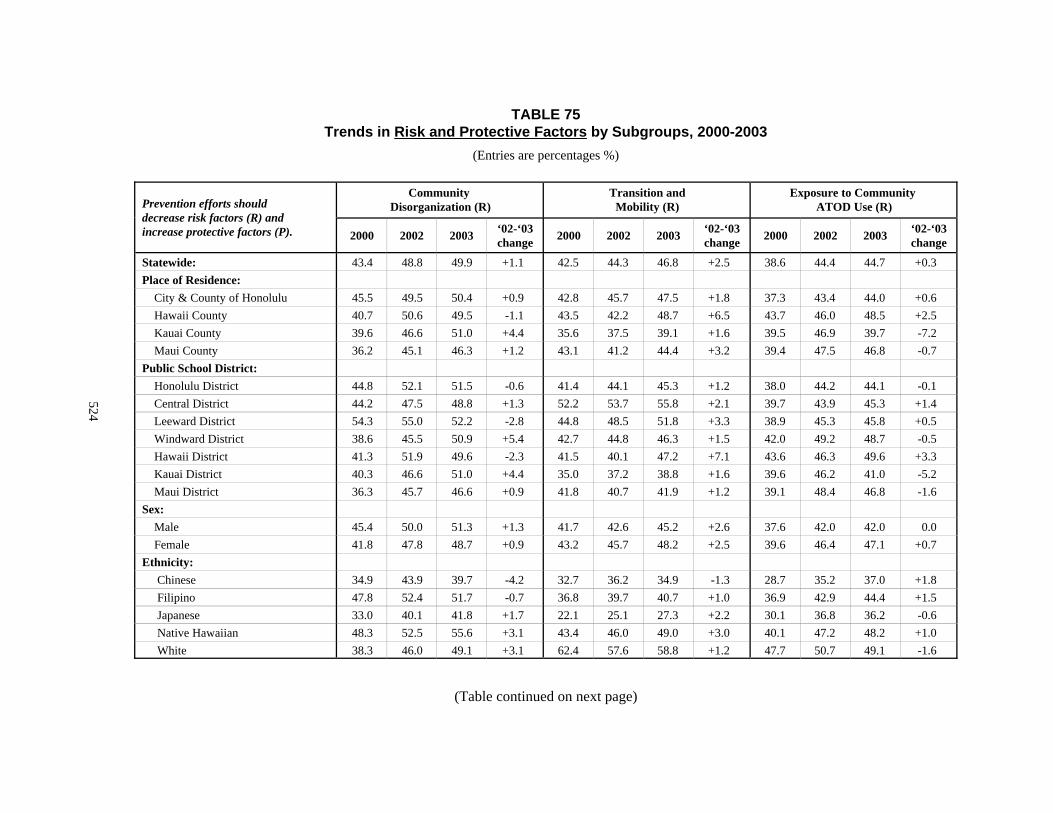
TABLE 75Trends in Risk and Protective Factors by Subgroups, 2000-2003
(Entries are percentages %)
Prevention efforts should decrease risk factors (R) andincrease protective factors (P).
Community Disorganization (R)
Transition andMobility (R)
Exposure to Community ATOD Use (R)
2000 2002 2003 ‘02-‘03change 2000 2002 2003 ‘02-‘03
change 2000 2002 2003 ‘02-‘03change
Statewide: 43.4 48.8 49.9 +1.1 42.5 44.3 46.8 +2.5 38.6 44.4 44.7 +0.3Place of Residence: City & County of Honolulu 45.5 49.5 50.4 +0.9 42.8 45.7 47.5 +1.8 37.3 43.4 44.0 +0.6 Hawaii County 40.7 50.6 49.5 -1.1 43.5 42.2 48.7 +6.5 43.7 46.0 48.5 +2.5 Kauai County 39.6 46.6 51.0 +4.4 35.6 37.5 39.1 +1.6 39.5 46.9 39.7 -7.2 Maui County 36.2 45.1 46.3 +1.2 43.1 41.2 44.4 +3.2 39.4 47.5 46.8 -0.7Public School District: Honolulu District 44.8 52.1 51.5 -0.6 41.4 44.1 45.3 +1.2 38.0 44.2 44.1 -0.1 Central District 44.2 47.5 48.8 +1.3 52.2 53.7 55.8 +2.1 39.7 43.9 45.3 +1.4 Leeward District 54.3 55.0 52.2 -2.8 44.8 48.5 51.8 +3.3 38.9 45.3 45.8 +0.5 Windward District 38.6 45.5 50.9 +5.4 42.7 44.8 46.3 +1.5 42.0 49.2 48.7 -0.5 Hawaii District 41.3 51.9 49.6 -2.3 41.5 40.1 47.2 +7.1 43.6 46.3 49.6 +3.3 Kauai District 40.3 46.6 51.0 +4.4 35.0 37.2 38.8 +1.6 39.6 46.2 41.0 -5.2 Maui District 36.3 45.7 46.6 +0.9 41.8 40.7 41.9 +1.2 39.1 48.4 46.8 -1.6Sex: Male 45.4 50.0 51.3 +1.3 41.7 42.6 45.2 +2.6 37.6 42.0 42.0 0.0 Female 41.8 47.8 48.7 +0.9 43.2 45.7 48.2 +2.5 39.6 46.4 47.1 +0.7Ethnicity: Chinese 34.9 43.9 39.7 -4.2 32.7 36.2 34.9 -1.3 28.7 35.2 37.0 +1.8 Filipino 47.8 52.4 51.7 -0.7 36.8 39.7 40.7 +1.0 36.9 42.9 44.4 +1.5 Japanese 33.0 40.1 41.8 +1.7 22.1 25.1 27.3 +2.2 30.1 36.8 36.2 -0.6 Native Hawaiian 48.3 52.5 55.6 +3.1 43.4 46.0 49.0 +3.0 40.1 47.2 48.2 +1.0 White 38.3 46.0 49.1 +3.1 62.4 57.6 58.8 +1.2 47.7 50.7 49.1 -1.6
(Table continued on next page)
524
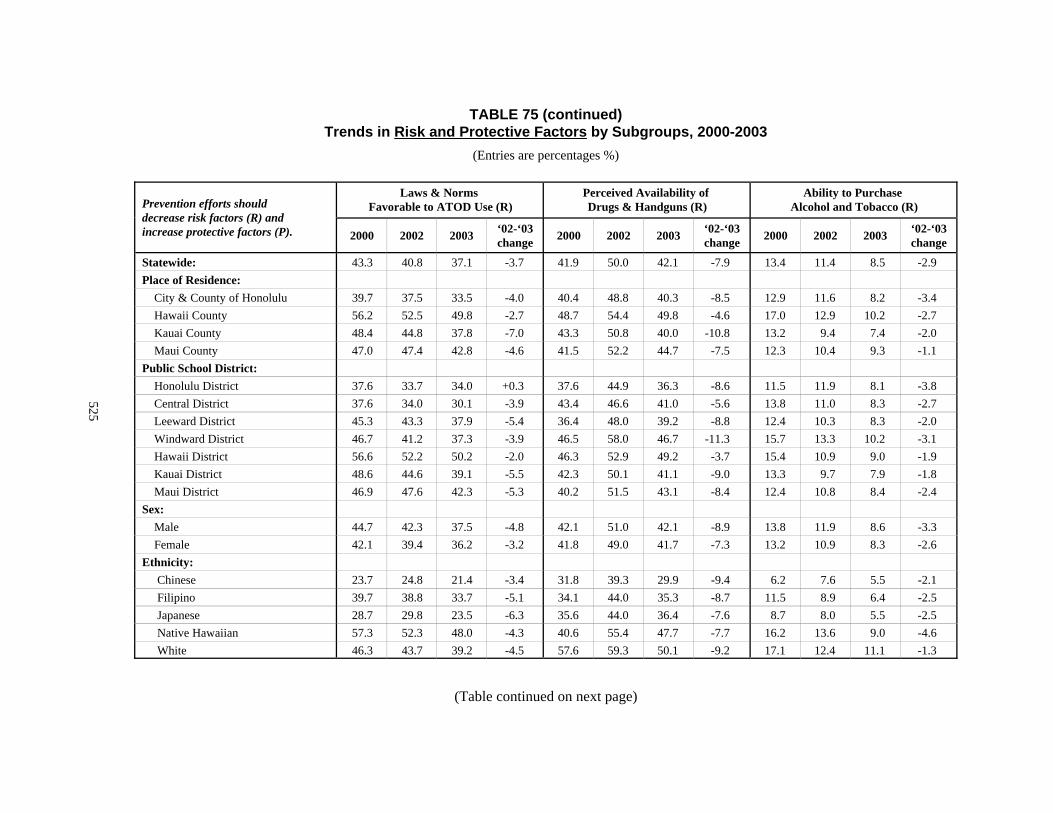
TABLE 75 (continued)Trends in Risk and Protective Factors by Subgroups, 2000-2003
(Entries are percentages %)
Prevention efforts should decrease risk factors (R) andincrease protective factors (P).
Laws & Norms Favorable to ATOD Use (R)
Perceived Availability of Drugs & Handguns (R)
Ability to Purchase Alcohol and Tobacco (R)
2000 2002 2003 ‘02-‘03change 2000 2002 2003 ‘02-‘03
change 2000 2002 2003 ‘02-‘03change
Statewide: 43.3 40.8 37.1 -3.7 41.9 50.0 42.1 -7.9 13.4 11.4 8.5 -2.9Place of Residence: City & County of Honolulu 39.7 37.5 33.5 -4.0 40.4 48.8 40.3 -8.5 12.9 11.6 8.2 -3.4 Hawaii County 56.2 52.5 49.8 -2.7 48.7 54.4 49.8 -4.6 17.0 12.9 10.2 -2.7 Kauai County 48.4 44.8 37.8 -7.0 43.3 50.8 40.0 -10.8 13.2 9.4 7.4 -2.0 Maui County 47.0 47.4 42.8 -4.6 41.5 52.2 44.7 -7.5 12.3 10.4 9.3 -1.1Public School District: Honolulu District 37.6 33.7 34.0 +0.3 37.6 44.9 36.3 -8.6 11.5 11.9 8.1 -3.8 Central District 37.6 34.0 30.1 -3.9 43.4 46.6 41.0 -5.6 13.8 11.0 8.3 -2.7 Leeward District 45.3 43.3 37.9 -5.4 36.4 48.0 39.2 -8.8 12.4 10.3 8.3 -2.0 Windward District 46.7 41.2 37.3 -3.9 46.5 58.0 46.7 -11.3 15.7 13.3 10.2 -3.1 Hawaii District 56.6 52.2 50.2 -2.0 46.3 52.9 49.2 -3.7 15.4 10.9 9.0 -1.9 Kauai District 48.6 44.6 39.1 -5.5 42.3 50.1 41.1 -9.0 13.3 9.7 7.9 -1.8 Maui District 46.9 47.6 42.3 -5.3 40.2 51.5 43.1 -8.4 12.4 10.8 8.4 -2.4Sex: Male 44.7 42.3 37.5 -4.8 42.1 51.0 42.1 -8.9 13.8 11.9 8.6 -3.3 Female 42.1 39.4 36.2 -3.2 41.8 49.0 41.7 -7.3 13.2 10.9 8.3 -2.6Ethnicity: Chinese 23.7 24.8 21.4 -3.4 31.8 39.3 29.9 -9.4 6.2 7.6 5.5 -2.1 Filipino 39.7 38.8 33.7 -5.1 34.1 44.0 35.3 -8.7 11.5 8.9 6.4 -2.5 Japanese 28.7 29.8 23.5 -6.3 35.6 44.0 36.4 -7.6 8.7 8.0 5.5 -2.5 Native Hawaiian 57.3 52.3 48.0 -4.3 40.6 55.4 47.7 -7.7 16.2 13.6 9.0 -4.6 White 46.3 43.7 39.2 -4.5 57.6 59.3 50.1 -9.2 17.1 12.4 11.1 -1.3
(Table continued on next page)
525
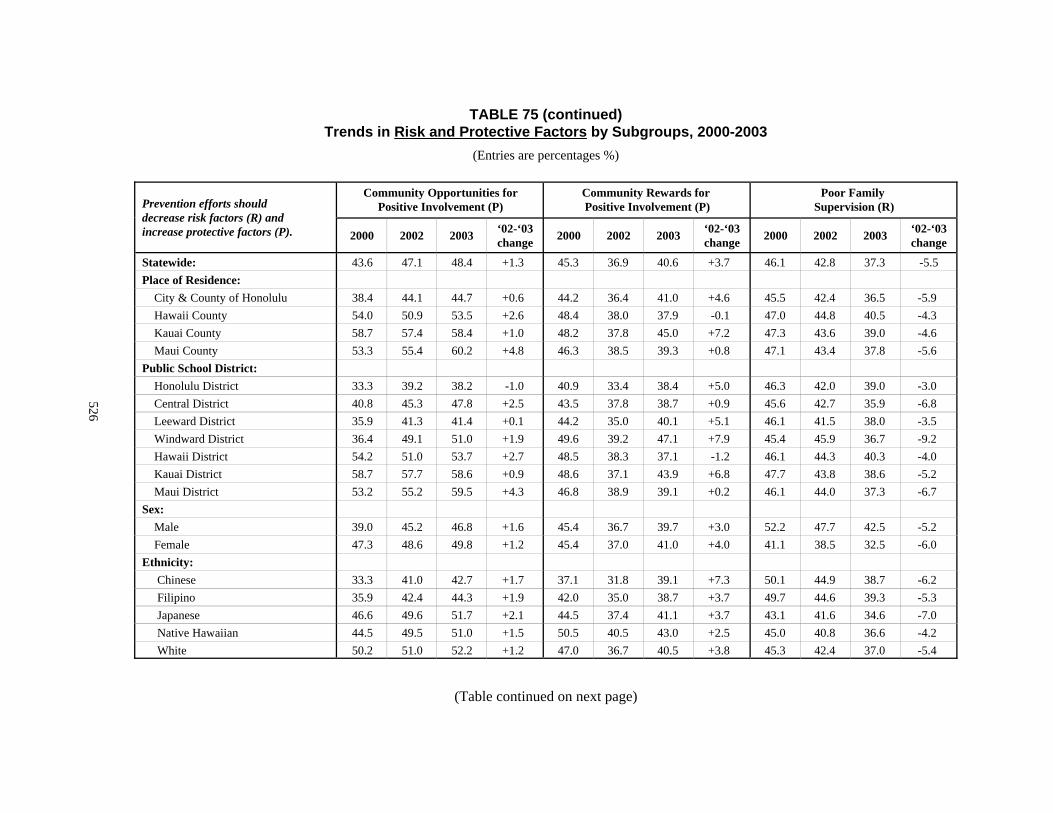
TABLE 75 (continued)Trends in Risk and Protective Factors by Subgroups, 2000-2003
(Entries are percentages %)
Prevention efforts should decrease risk factors (R) andincrease protective factors (P).
Community Opportunities forPositive Involvement (P)
Community Rewards for Positive Involvement (P)
Poor Family Supervision (R)
2000 2002 2003 ‘02-‘03change 2000 2002 2003 ‘02-‘03
change 2000 2002 2003 ‘02-‘03change
Statewide: 43.6 47.1 48.4 +1.3 45.3 36.9 40.6 +3.7 46.1 42.8 37.3 -5.5Place of Residence: City & County of Honolulu 38.4 44.1 44.7 +0.6 44.2 36.4 41.0 +4.6 45.5 42.4 36.5 -5.9 Hawaii County 54.0 50.9 53.5 +2.6 48.4 38.0 37.9 -0.1 47.0 44.8 40.5 -4.3 Kauai County 58.7 57.4 58.4 +1.0 48.2 37.8 45.0 +7.2 47.3 43.6 39.0 -4.6 Maui County 53.3 55.4 60.2 +4.8 46.3 38.5 39.3 +0.8 47.1 43.4 37.8 -5.6Public School District: Honolulu District 33.3 39.2 38.2 -1.0 40.9 33.4 38.4 +5.0 46.3 42.0 39.0 -3.0 Central District 40.8 45.3 47.8 +2.5 43.5 37.8 38.7 +0.9 45.6 42.7 35.9 -6.8 Leeward District 35.9 41.3 41.4 +0.1 44.2 35.0 40.1 +5.1 46.1 41.5 38.0 -3.5 Windward District 36.4 49.1 51.0 +1.9 49.6 39.2 47.1 +7.9 45.4 45.9 36.7 -9.2 Hawaii District 54.2 51.0 53.7 +2.7 48.5 38.3 37.1 -1.2 46.1 44.3 40.3 -4.0 Kauai District 58.7 57.7 58.6 +0.9 48.6 37.1 43.9 +6.8 47.7 43.8 38.6 -5.2 Maui District 53.2 55.2 59.5 +4.3 46.8 38.9 39.1 +0.2 46.1 44.0 37.3 -6.7Sex: Male 39.0 45.2 46.8 +1.6 45.4 36.7 39.7 +3.0 52.2 47.7 42.5 -5.2 Female 47.3 48.6 49.8 +1.2 45.4 37.0 41.0 +4.0 41.1 38.5 32.5 -6.0Ethnicity: Chinese 33.3 41.0 42.7 +1.7 37.1 31.8 39.1 +7.3 50.1 44.9 38.7 -6.2 Filipino 35.9 42.4 44.3 +1.9 42.0 35.0 38.7 +3.7 49.7 44.6 39.3 -5.3 Japanese 46.6 49.6 51.7 +2.1 44.5 37.4 41.1 +3.7 43.1 41.6 34.6 -7.0 Native Hawaiian 44.5 49.5 51.0 +1.5 50.5 40.5 43.0 +2.5 45.0 40.8 36.6 -4.2 White 50.2 51.0 52.2 +1.2 47.0 36.7 40.5 +3.8 45.3 42.4 37.0 -5.4
(Table continued on next page)
526
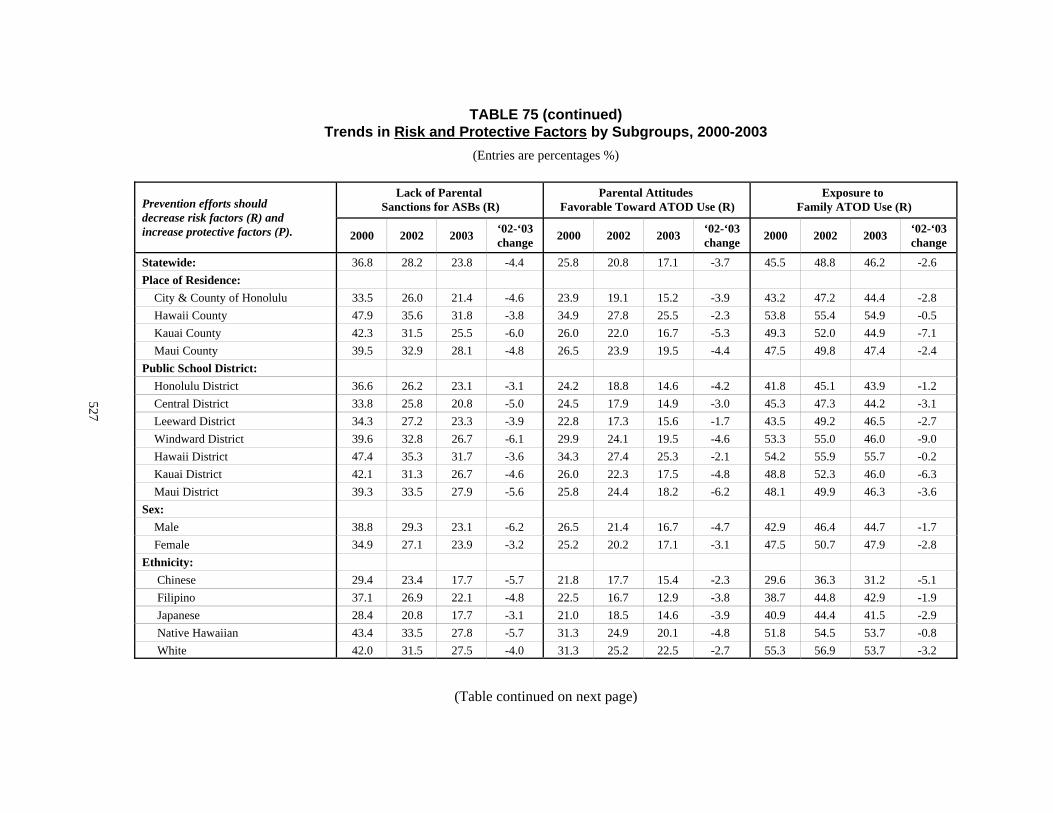
TABLE 75 (continued)Trends in Risk and Protective Factors by Subgroups, 2000-2003
(Entries are percentages %)
Prevention efforts should decrease risk factors (R) andincrease protective factors (P).
Lack of Parental Sanctions for ASBs (R)
Parental Attitudes Favorable Toward ATOD Use (R)
Exposure to Family ATOD Use (R)
2000 2002 2003 ‘02-‘03change 2000 2002 2003 ‘02-‘03
change 2000 2002 2003 ‘02-‘03change
Statewide: 36.8 28.2 23.8 -4.4 25.8 20.8 17.1 -3.7 45.5 48.8 46.2 -2.6Place of Residence: City & County of Honolulu 33.5 26.0 21.4 -4.6 23.9 19.1 15.2 -3.9 43.2 47.2 44.4 -2.8 Hawaii County 47.9 35.6 31.8 -3.8 34.9 27.8 25.5 -2.3 53.8 55.4 54.9 -0.5 Kauai County 42.3 31.5 25.5 -6.0 26.0 22.0 16.7 -5.3 49.3 52.0 44.9 -7.1 Maui County 39.5 32.9 28.1 -4.8 26.5 23.9 19.5 -4.4 47.5 49.8 47.4 -2.4Public School District: Honolulu District 36.6 26.2 23.1 -3.1 24.2 18.8 14.6 -4.2 41.8 45.1 43.9 -1.2 Central District 33.8 25.8 20.8 -5.0 24.5 17.9 14.9 -3.0 45.3 47.3 44.2 -3.1 Leeward District 34.3 27.2 23.3 -3.9 22.8 17.3 15.6 -1.7 43.5 49.2 46.5 -2.7 Windward District 39.6 32.8 26.7 -6.1 29.9 24.1 19.5 -4.6 53.3 55.0 46.0 -9.0 Hawaii District 47.4 35.3 31.7 -3.6 34.3 27.4 25.3 -2.1 54.2 55.9 55.7 -0.2 Kauai District 42.1 31.3 26.7 -4.6 26.0 22.3 17.5 -4.8 48.8 52.3 46.0 -6.3 Maui District 39.3 33.5 27.9 -5.6 25.8 24.4 18.2 -6.2 48.1 49.9 46.3 -3.6Sex: Male 38.8 29.3 23.1 -6.2 26.5 21.4 16.7 -4.7 42.9 46.4 44.7 -1.7 Female 34.9 27.1 23.9 -3.2 25.2 20.2 17.1 -3.1 47.5 50.7 47.9 -2.8Ethnicity: Chinese 29.4 23.4 17.7 -5.7 21.8 17.7 15.4 -2.3 29.6 36.3 31.2 -5.1 Filipino 37.1 26.9 22.1 -4.8 22.5 16.7 12.9 -3.8 38.7 44.8 42.9 -1.9 Japanese 28.4 20.8 17.7 -3.1 21.0 18.5 14.6 -3.9 40.9 44.4 41.5 -2.9 Native Hawaiian 43.4 33.5 27.8 -5.7 31.3 24.9 20.1 -4.8 51.8 54.5 53.7 -0.8 White 42.0 31.5 27.5 -4.0 31.3 25.2 22.5 -2.7 55.3 56.9 53.7 -3.2
(Table continued on next page)
527
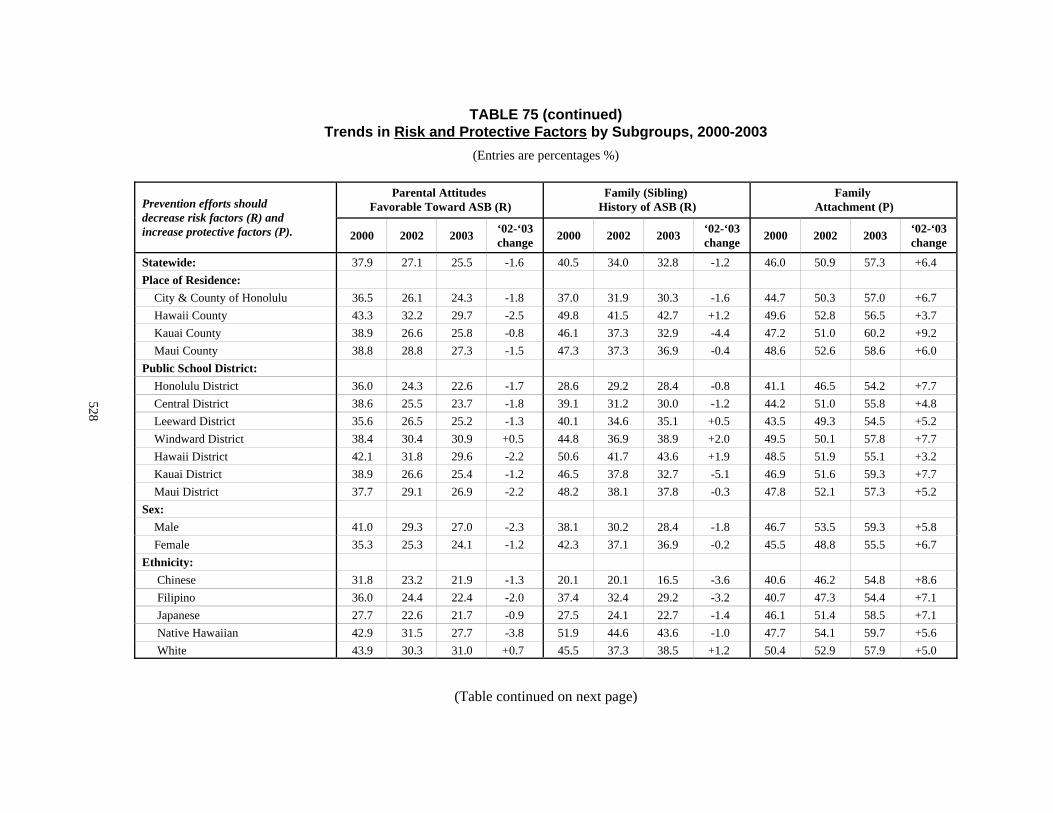
TABLE 75 (continued)Trends in Risk and Protective Factors by Subgroups, 2000-2003
(Entries are percentages %)
Prevention efforts should decrease risk factors (R) andincrease protective factors (P).
Parental Attitudes Favorable Toward ASB (R)
Family (Sibling) History of ASB (R)
Family Attachment (P)
2000 2002 2003 ‘02-‘03change 2000 2002 2003 ‘02-‘03
change 2000 2002 2003 ‘02-‘03change
Statewide: 37.9 27.1 25.5 -1.6 40.5 34.0 32.8 -1.2 46.0 50.9 57.3 +6.4Place of Residence: City & County of Honolulu 36.5 26.1 24.3 -1.8 37.0 31.9 30.3 -1.6 44.7 50.3 57.0 +6.7 Hawaii County 43.3 32.2 29.7 -2.5 49.8 41.5 42.7 +1.2 49.6 52.8 56.5 +3.7 Kauai County 38.9 26.6 25.8 -0.8 46.1 37.3 32.9 -4.4 47.2 51.0 60.2 +9.2 Maui County 38.8 28.8 27.3 -1.5 47.3 37.3 36.9 -0.4 48.6 52.6 58.6 +6.0Public School District: Honolulu District 36.0 24.3 22.6 -1.7 28.6 29.2 28.4 -0.8 41.1 46.5 54.2 +7.7 Central District 38.6 25.5 23.7 -1.8 39.1 31.2 30.0 -1.2 44.2 51.0 55.8 +4.8 Leeward District 35.6 26.5 25.2 -1.3 40.1 34.6 35.1 +0.5 43.5 49.3 54.5 +5.2 Windward District 38.4 30.4 30.9 +0.5 44.8 36.9 38.9 +2.0 49.5 50.1 57.8 +7.7 Hawaii District 42.1 31.8 29.6 -2.2 50.6 41.7 43.6 +1.9 48.5 51.9 55.1 +3.2 Kauai District 38.9 26.6 25.4 -1.2 46.5 37.8 32.7 -5.1 46.9 51.6 59.3 +7.7 Maui District 37.7 29.1 26.9 -2.2 48.2 38.1 37.8 -0.3 47.8 52.1 57.3 +5.2Sex: Male 41.0 29.3 27.0 -2.3 38.1 30.2 28.4 -1.8 46.7 53.5 59.3 +5.8 Female 35.3 25.3 24.1 -1.2 42.3 37.1 36.9 -0.2 45.5 48.8 55.5 +6.7Ethnicity: Chinese 31.8 23.2 21.9 -1.3 20.1 20.1 16.5 -3.6 40.6 46.2 54.8 +8.6 Filipino 36.0 24.4 22.4 -2.0 37.4 32.4 29.2 -3.2 40.7 47.3 54.4 +7.1 Japanese 27.7 22.6 21.7 -0.9 27.5 24.1 22.7 -1.4 46.1 51.4 58.5 +7.1 Native Hawaiian 42.9 31.5 27.7 -3.8 51.9 44.6 43.6 -1.0 47.7 54.1 59.7 +5.6 White 43.9 30.3 31.0 +0.7 45.5 37.3 38.5 +1.2 50.4 52.9 57.9 +5.0
(Table continued on next page)
528
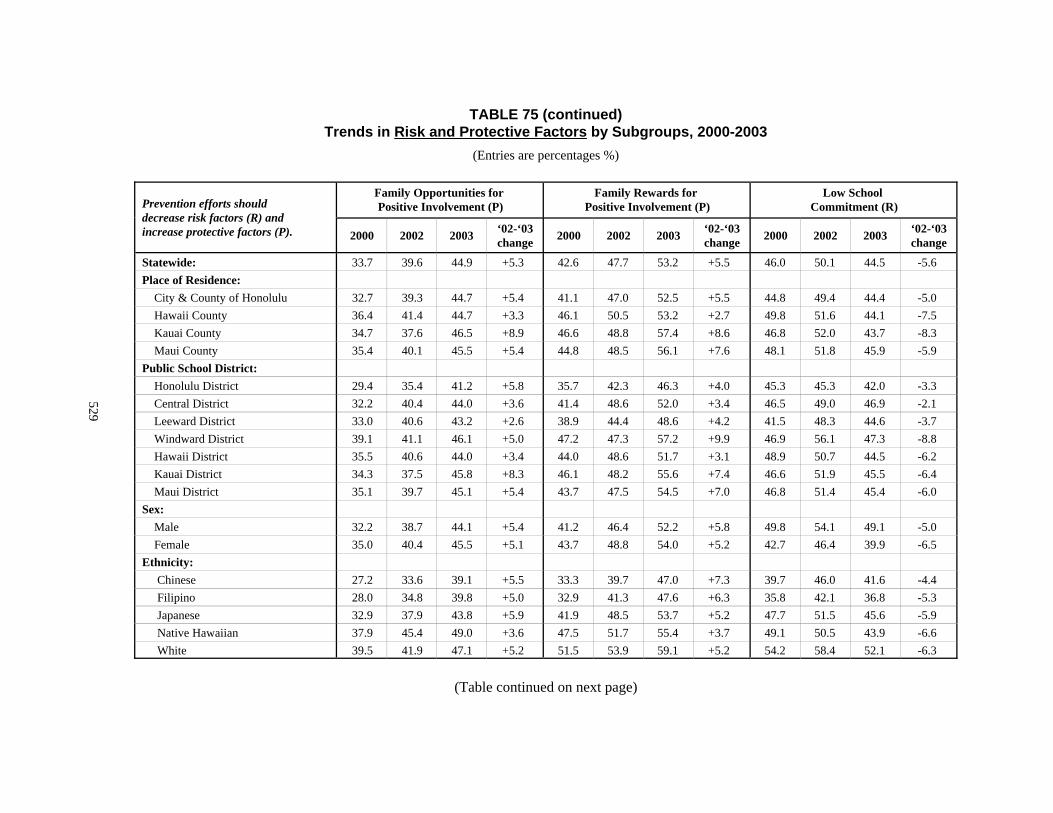
TABLE 75 (continued)Trends in Risk and Protective Factors by Subgroups, 2000-2003
(Entries are percentages %)
Prevention efforts should decrease risk factors (R) andincrease protective factors (P).
Family Opportunities for Positive Involvement (P)
Family Rewards for Positive Involvement (P)
Low School Commitment (R)
2000 2002 2003 ‘02-‘03change 2000 2002 2003 ‘02-‘03
change 2000 2002 2003 ‘02-‘03change
Statewide: 33.7 39.6 44.9 +5.3 42.6 47.7 53.2 +5.5 46.0 50.1 44.5 -5.6Place of Residence: City & County of Honolulu 32.7 39.3 44.7 +5.4 41.1 47.0 52.5 +5.5 44.8 49.4 44.4 -5.0 Hawaii County 36.4 41.4 44.7 +3.3 46.1 50.5 53.2 +2.7 49.8 51.6 44.1 -7.5 Kauai County 34.7 37.6 46.5 +8.9 46.6 48.8 57.4 +8.6 46.8 52.0 43.7 -8.3 Maui County 35.4 40.1 45.5 +5.4 44.8 48.5 56.1 +7.6 48.1 51.8 45.9 -5.9Public School District: Honolulu District 29.4 35.4 41.2 +5.8 35.7 42.3 46.3 +4.0 45.3 45.3 42.0 -3.3 Central District 32.2 40.4 44.0 +3.6 41.4 48.6 52.0 +3.4 46.5 49.0 46.9 -2.1 Leeward District 33.0 40.6 43.2 +2.6 38.9 44.4 48.6 +4.2 41.5 48.3 44.6 -3.7 Windward District 39.1 41.1 46.1 +5.0 47.2 47.3 57.2 +9.9 46.9 56.1 47.3 -8.8 Hawaii District 35.5 40.6 44.0 +3.4 44.0 48.6 51.7 +3.1 48.9 50.7 44.5 -6.2 Kauai District 34.3 37.5 45.8 +8.3 46.1 48.2 55.6 +7.4 46.6 51.9 45.5 -6.4 Maui District 35.1 39.7 45.1 +5.4 43.7 47.5 54.5 +7.0 46.8 51.4 45.4 -6.0Sex: Male 32.2 38.7 44.1 +5.4 41.2 46.4 52.2 +5.8 49.8 54.1 49.1 -5.0 Female 35.0 40.4 45.5 +5.1 43.7 48.8 54.0 +5.2 42.7 46.4 39.9 -6.5Ethnicity: Chinese 27.2 33.6 39.1 +5.5 33.3 39.7 47.0 +7.3 39.7 46.0 41.6 -4.4 Filipino 28.0 34.8 39.8 +5.0 32.9 41.3 47.6 +6.3 35.8 42.1 36.8 -5.3 Japanese 32.9 37.9 43.8 +5.9 41.9 48.5 53.7 +5.2 47.7 51.5 45.6 -5.9 Native Hawaiian 37.9 45.4 49.0 +3.6 47.5 51.7 55.4 +3.7 49.1 50.5 43.9 -6.6 White 39.5 41.9 47.1 +5.2 51.5 53.9 59.1 +5.2 54.2 58.4 52.1 -6.3
(Table continued on next page)
529
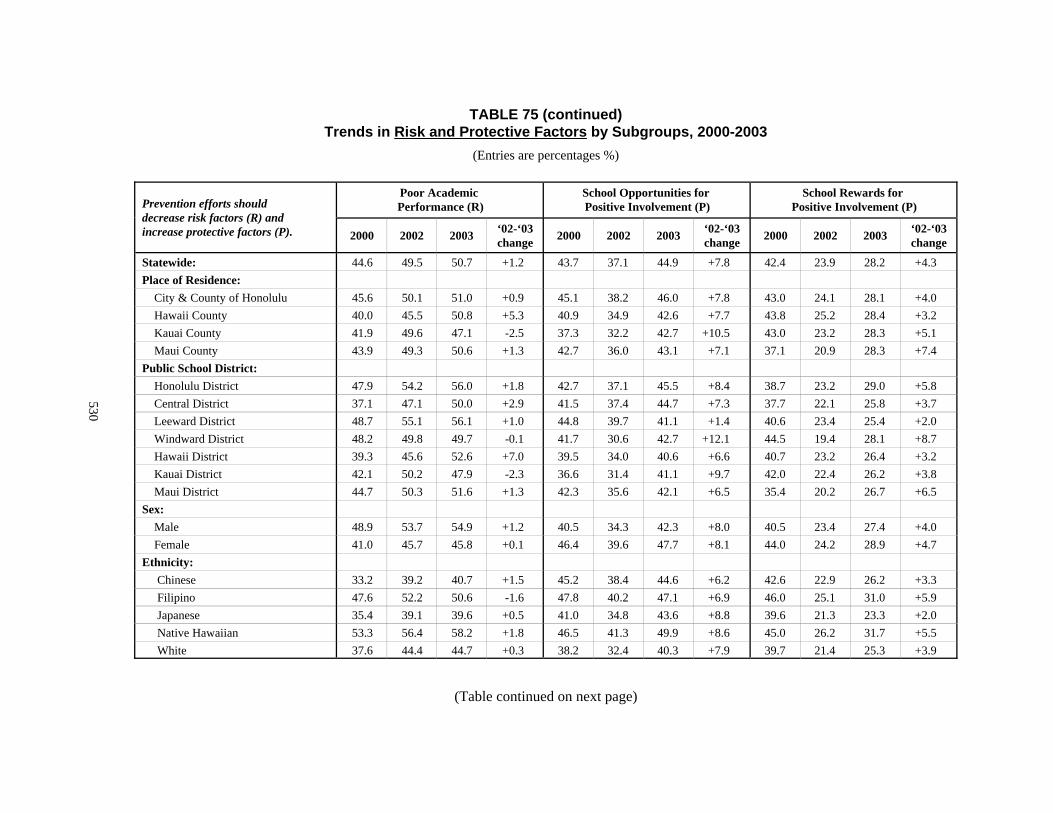
TABLE 75 (continued)Trends in Risk and Protective Factors by Subgroups, 2000-2003
(Entries are percentages %)
Prevention efforts should decrease risk factors (R) andincrease protective factors (P).
Poor Academic Performance (R)
School Opportunities for Positive Involvement (P)
School Rewards for Positive Involvement (P)
2000 2002 2003 ‘02-‘03change 2000 2002 2003 ‘02-‘03
change 2000 2002 2003 ‘02-‘03change
Statewide: 44.6 49.5 50.7 +1.2 43.7 37.1 44.9 +7.8 42.4 23.9 28.2 +4.3Place of Residence: City & County of Honolulu 45.6 50.1 51.0 +0.9 45.1 38.2 46.0 +7.8 43.0 24.1 28.1 +4.0 Hawaii County 40.0 45.5 50.8 +5.3 40.9 34.9 42.6 +7.7 43.8 25.2 28.4 +3.2 Kauai County 41.9 49.6 47.1 -2.5 37.3 32.2 42.7 +10.5 43.0 23.2 28.3 +5.1 Maui County 43.9 49.3 50.6 +1.3 42.7 36.0 43.1 +7.1 37.1 20.9 28.3 +7.4Public School District: Honolulu District 47.9 54.2 56.0 +1.8 42.7 37.1 45.5 +8.4 38.7 23.2 29.0 +5.8 Central District 37.1 47.1 50.0 +2.9 41.5 37.4 44.7 +7.3 37.7 22.1 25.8 +3.7 Leeward District 48.7 55.1 56.1 +1.0 44.8 39.7 41.1 +1.4 40.6 23.4 25.4 +2.0 Windward District 48.2 49.8 49.7 -0.1 41.7 30.6 42.7 +12.1 44.5 19.4 28.1 +8.7 Hawaii District 39.3 45.6 52.6 +7.0 39.5 34.0 40.6 +6.6 40.7 23.2 26.4 +3.2 Kauai District 42.1 50.2 47.9 -2.3 36.6 31.4 41.1 +9.7 42.0 22.4 26.2 +3.8 Maui District 44.7 50.3 51.6 +1.3 42.3 35.6 42.1 +6.5 35.4 20.2 26.7 +6.5Sex: Male 48.9 53.7 54.9 +1.2 40.5 34.3 42.3 +8.0 40.5 23.4 27.4 +4.0 Female 41.0 45.7 45.8 +0.1 46.4 39.6 47.7 +8.1 44.0 24.2 28.9 +4.7Ethnicity: Chinese 33.2 39.2 40.7 +1.5 45.2 38.4 44.6 +6.2 42.6 22.9 26.2 +3.3 Filipino 47.6 52.2 50.6 -1.6 47.8 40.2 47.1 +6.9 46.0 25.1 31.0 +5.9 Japanese 35.4 39.1 39.6 +0.5 41.0 34.8 43.6 +8.8 39.6 21.3 23.3 +2.0 Native Hawaiian 53.3 56.4 58.2 +1.8 46.5 41.3 49.9 +8.6 45.0 26.2 31.7 +5.5 White 37.6 44.4 44.7 +0.3 38.2 32.4 40.3 +7.9 39.7 21.4 25.3 +3.9
(Table continued on next page)
530

TABLE 75 (continued)Trends in Risk and Protective Factors by Subgroups, 2000-2003
(Entries are percentages %)
Prevention efforts should decrease risk factors (R) andincrease protective factors (P).
Early Initiation of Problem Behaviors (R)
Favorable Attitudes Toward ATOD Use (R)
Low Perceived ATOD Use Risk (R)
2000 2002 2003 ‘02-‘03change 2000 2002 2003 ‘02-‘03
change 2000 2002 2003 ‘02-‘03change
Statewide: 40.5 37.3 35.3 -2.0 32.9 35.8 31.6 -4.2 44.1 28.7 26.0 -2.7Place of Residence: City & County of Honolulu 36.7 34.6 32.5 -2.1 30.0 33.6 29.1 -4.5 41.3 26.9 24.3 -2.6 Hawaii County 53.3 45.6 46.5 +0.9 42.8 43.2 41.5 -1.7 52.1 34.7 31.2 -3.5 Kauai County 45.9 41.5 34.9 -6.6 35.5 40.0 29.3 -10.7 50.3 32.2 24.9 -7.3 Maui County 44.8 43.5 39.0 -4.5 36.1 40.2 35.2 -5.0 47.3 32.5 29.9 -2.6Public School District: Honolulu District 33.7 32.1 31.1 -1.0 30.0 30.8 27.8 -3.0 40.5 25.6 24.3 -1.3 Central District 39.7 34.2 33.4 -0.8 33.0 33.4 30.7 -2.7 42.5 26.3 23.7 -2.6 Leeward District 40.6 38.7 36.9 -1.8 27.3 32.2 28.7 -3.5 41.5 29.0 25.7 -3.3 Windward District 45.2 40.8 40.8 0.0 33.3 39.8 33.5 -6.3 43.7 31.5 26.8 -4.7 Hawaii District 53.0 45.4 47.1 +1.7 41.4 41.7 41.6 -0.1 50.6 34.0 30.5 -3.5 Kauai District 46.2 41.4 36.5 -4.9 35.4 40.0 30.6 -9.4 50.7 32.3 25.6 -6.7 Maui District 45.4 44.3 39.5 -4.8 35.5 40.7 34.1 -6.6 46.2 32.9 29.8 -3.1Sex: Male 42.3 39.6 38.3 -1.3 33.5 35.6 30.8 -4.8 46.8 32.3 28.5 -3.8 Female 38.9 35.3 32.3 -3.0 32.1 36.0 31.6 -4.4 41.9 25.5 23.4 -2.1Ethnicity: Chinese 19.4 20.3 18.2 -2.1 24.5 27.0 22.7 -4.3 35.0 20.0 20.9 +0.9 Filipino 38.9 36.0 32.8 -3.2 28.9 32.0 28.2 -3.8 42.2 28.6 23.4 -5.2 Japanese 24.1 23.7 20.5 -3.2 27.5 31.0 26.4 -4.6 39.7 23.0 21.6 -1.4 Native Hawaiian 51.8 48.0 45.9 -2.1 37.0 40.4 35.1 -5.3 47.7 31.8 29.2 -2.6 White 45.5 41.0 37.7 -3.3 39.0 42.3 37.6 -4.7 49.7 30.9 28.6 -2.3
(Table continued on next page)
531
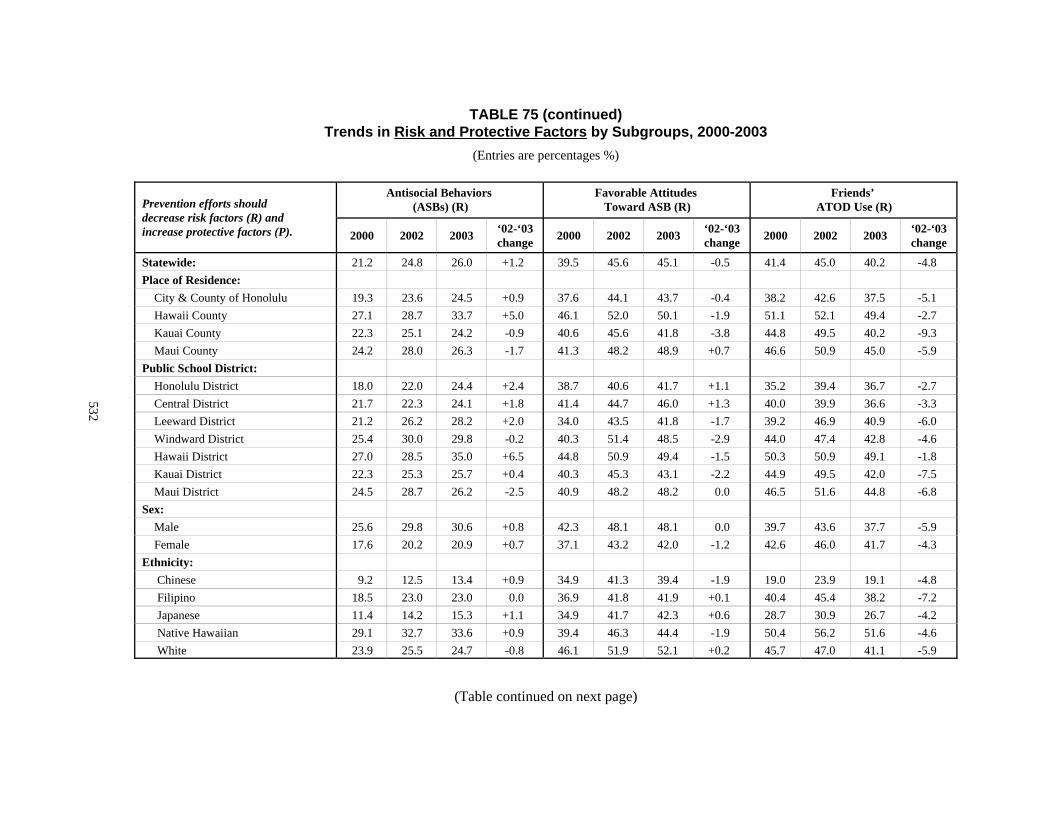
TABLE 75 (continued)Trends in Risk and Protective Factors by Subgroups, 2000-2003
(Entries are percentages %)
Prevention efforts should decrease risk factors (R) andincrease protective factors (P).
Antisocial Behaviors (ASBs) (R)
Favorable Attitudes Toward ASB (R)
Friends’ ATOD Use (R)
2000 2002 2003 ‘02-‘03change 2000 2002 2003 ‘02-‘03
change 2000 2002 2003 ‘02-‘03change
Statewide: 21.2 24.8 26.0 +1.2 39.5 45.6 45.1 -0.5 41.4 45.0 40.2 -4.8Place of Residence: City & County of Honolulu 19.3 23.6 24.5 +0.9 37.6 44.1 43.7 -0.4 38.2 42.6 37.5 -5.1 Hawaii County 27.1 28.7 33.7 +5.0 46.1 52.0 50.1 -1.9 51.1 52.1 49.4 -2.7 Kauai County 22.3 25.1 24.2 -0.9 40.6 45.6 41.8 -3.8 44.8 49.5 40.2 -9.3 Maui County 24.2 28.0 26.3 -1.7 41.3 48.2 48.9 +0.7 46.6 50.9 45.0 -5.9Public School District: Honolulu District 18.0 22.0 24.4 +2.4 38.7 40.6 41.7 +1.1 35.2 39.4 36.7 -2.7 Central District 21.7 22.3 24.1 +1.8 41.4 44.7 46.0 +1.3 40.0 39.9 36.6 -3.3 Leeward District 21.2 26.2 28.2 +2.0 34.0 43.5 41.8 -1.7 39.2 46.9 40.9 -6.0 Windward District 25.4 30.0 29.8 -0.2 40.3 51.4 48.5 -2.9 44.0 47.4 42.8 -4.6 Hawaii District 27.0 28.5 35.0 +6.5 44.8 50.9 49.4 -1.5 50.3 50.9 49.1 -1.8 Kauai District 22.3 25.3 25.7 +0.4 40.3 45.3 43.1 -2.2 44.9 49.5 42.0 -7.5 Maui District 24.5 28.7 26.2 -2.5 40.9 48.2 48.2 0.0 46.5 51.6 44.8 -6.8Sex: Male 25.6 29.8 30.6 +0.8 42.3 48.1 48.1 0.0 39.7 43.6 37.7 -5.9 Female 17.6 20.2 20.9 +0.7 37.1 43.2 42.0 -1.2 42.6 46.0 41.7 -4.3Ethnicity: Chinese 9.2 12.5 13.4 +0.9 34.9 41.3 39.4 -1.9 19.0 23.9 19.1 -4.8 Filipino 18.5 23.0 23.0 0.0 36.9 41.8 41.9 +0.1 40.4 45.4 38.2 -7.2 Japanese 11.4 14.2 15.3 +1.1 34.9 41.7 42.3 +0.6 28.7 30.9 26.7 -4.2 Native Hawaiian 29.1 32.7 33.6 +0.9 39.4 46.3 44.4 -1.9 50.4 56.2 51.6 -4.6 White 23.9 25.5 24.7 -0.8 46.1 51.9 52.1 +0.2 45.7 47.0 41.1 -5.9
(Table continued on next page)
532
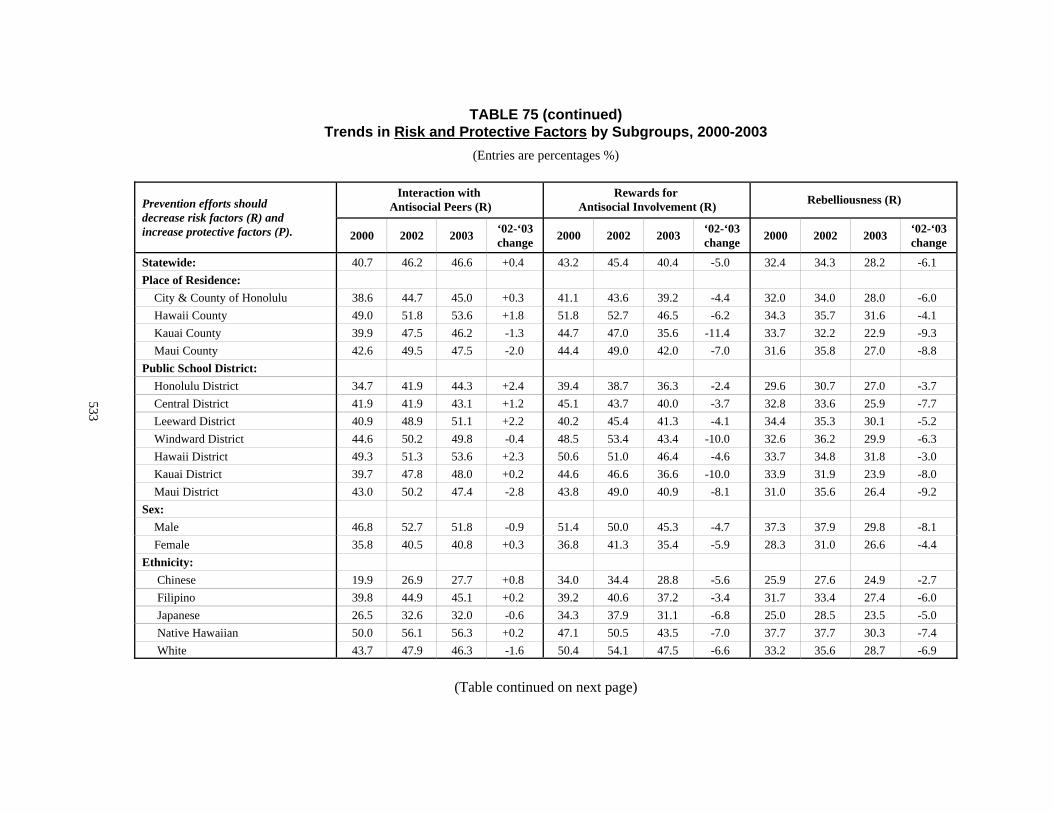
TABLE 75 (continued)Trends in Risk and Protective Factors by Subgroups, 2000-2003
(Entries are percentages %)
Prevention efforts should decrease risk factors (R) andincrease protective factors (P).
Interaction with Antisocial Peers (R)
Rewards for Antisocial Involvement (R) Rebelliousness (R)
2000 2002 2003 ‘02-‘03change 2000 2002 2003 ‘02-‘03
change 2000 2002 2003 ‘02-‘03change
Statewide: 40.7 46.2 46.6 +0.4 43.2 45.4 40.4 -5.0 32.4 34.3 28.2 -6.1Place of Residence: City & County of Honolulu 38.6 44.7 45.0 +0.3 41.1 43.6 39.2 -4.4 32.0 34.0 28.0 -6.0 Hawaii County 49.0 51.8 53.6 +1.8 51.8 52.7 46.5 -6.2 34.3 35.7 31.6 -4.1 Kauai County 39.9 47.5 46.2 -1.3 44.7 47.0 35.6 -11.4 33.7 32.2 22.9 -9.3 Maui County 42.6 49.5 47.5 -2.0 44.4 49.0 42.0 -7.0 31.6 35.8 27.0 -8.8Public School District: Honolulu District 34.7 41.9 44.3 +2.4 39.4 38.7 36.3 -2.4 29.6 30.7 27.0 -3.7 Central District 41.9 41.9 43.1 +1.2 45.1 43.7 40.0 -3.7 32.8 33.6 25.9 -7.7 Leeward District 40.9 48.9 51.1 +2.2 40.2 45.4 41.3 -4.1 34.4 35.3 30.1 -5.2 Windward District 44.6 50.2 49.8 -0.4 48.5 53.4 43.4 -10.0 32.6 36.2 29.9 -6.3 Hawaii District 49.3 51.3 53.6 +2.3 50.6 51.0 46.4 -4.6 33.7 34.8 31.8 -3.0 Kauai District 39.7 47.8 48.0 +0.2 44.6 46.6 36.6 -10.0 33.9 31.9 23.9 -8.0 Maui District 43.0 50.2 47.4 -2.8 43.8 49.0 40.9 -8.1 31.0 35.6 26.4 -9.2Sex: Male 46.8 52.7 51.8 -0.9 51.4 50.0 45.3 -4.7 37.3 37.9 29.8 -8.1 Female 35.8 40.5 40.8 +0.3 36.8 41.3 35.4 -5.9 28.3 31.0 26.6 -4.4Ethnicity: Chinese 19.9 26.9 27.7 +0.8 34.0 34.4 28.8 -5.6 25.9 27.6 24.9 -2.7 Filipino 39.8 44.9 45.1 +0.2 39.2 40.6 37.2 -3.4 31.7 33.4 27.4 -6.0 Japanese 26.5 32.6 32.0 -0.6 34.3 37.9 31.1 -6.8 25.0 28.5 23.5 -5.0 Native Hawaiian 50.0 56.1 56.3 +0.2 47.1 50.5 43.5 -7.0 37.7 37.7 30.3 -7.4 White 43.7 47.9 46.3 -1.6 50.4 54.1 47.5 -6.6 33.2 35.6 28.7 -6.9
(Table continued on next page)
533
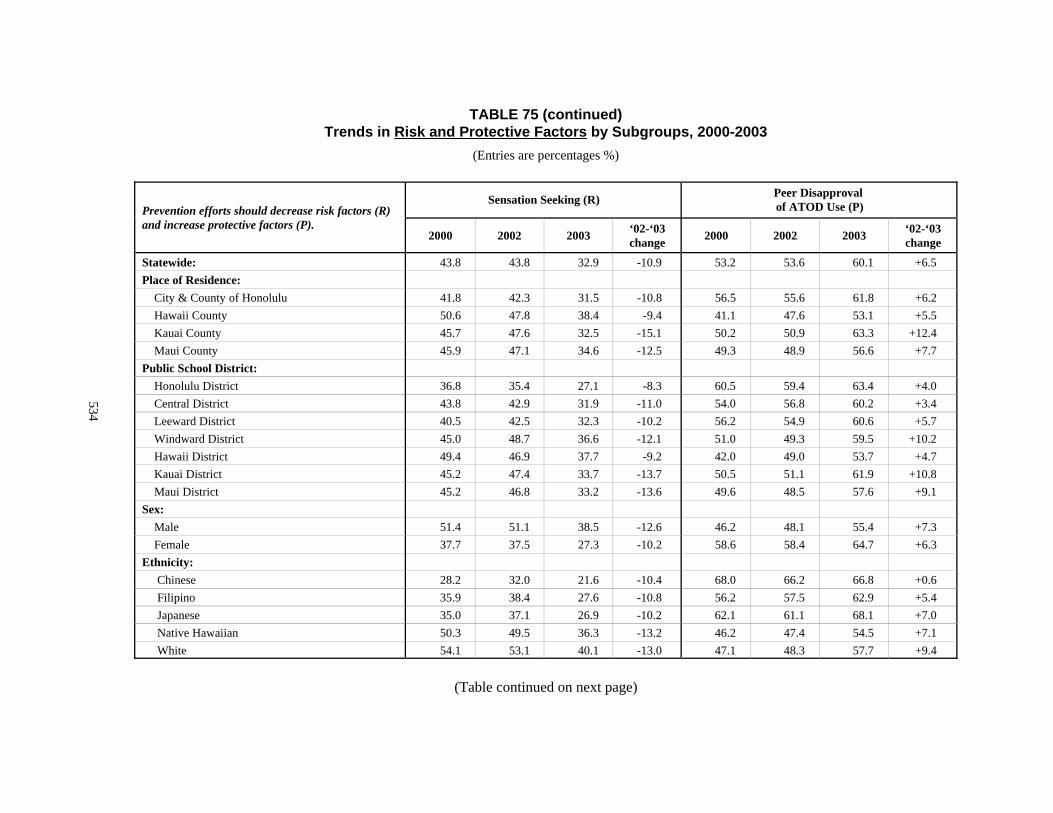
TABLE 75 (continued)Trends in Risk and Protective Factors by Subgroups, 2000-2003
(Entries are percentages %)
Prevention efforts should decrease risk factors (R)and increase protective factors (P).
Sensation Seeking (R) Peer Disapproval of ATOD Use (P)
2000 2002 2003 ‘02-‘03change 2000 2002 2003 ‘02-‘03
change
Statewide: 43.8 43.8 32.9 -10.9 53.2 53.6 60.1 +6.5Place of Residence: City & County of Honolulu 41.8 42.3 31.5 -10.8 56.5 55.6 61.8 +6.2 Hawaii County 50.6 47.8 38.4 -9.4 41.1 47.6 53.1 +5.5 Kauai County 45.7 47.6 32.5 -15.1 50.2 50.9 63.3 +12.4 Maui County 45.9 47.1 34.6 -12.5 49.3 48.9 56.6 +7.7Public School District: Honolulu District 36.8 35.4 27.1 -8.3 60.5 59.4 63.4 +4.0 Central District 43.8 42.9 31.9 -11.0 54.0 56.8 60.2 +3.4 Leeward District 40.5 42.5 32.3 -10.2 56.2 54.9 60.6 +5.7 Windward District 45.0 48.7 36.6 -12.1 51.0 49.3 59.5 +10.2 Hawaii District 49.4 46.9 37.7 -9.2 42.0 49.0 53.7 +4.7 Kauai District 45.2 47.4 33.7 -13.7 50.5 51.1 61.9 +10.8 Maui District 45.2 46.8 33.2 -13.6 49.6 48.5 57.6 +9.1Sex: Male 51.4 51.1 38.5 -12.6 46.2 48.1 55.4 +7.3 Female 37.7 37.5 27.3 -10.2 58.6 58.4 64.7 +6.3Ethnicity: Chinese 28.2 32.0 21.6 -10.4 68.0 66.2 66.8 +0.6 Filipino 35.9 38.4 27.6 -10.8 56.2 57.5 62.9 +5.4 Japanese 35.0 37.1 26.9 -10.2 62.1 61.1 68.1 +7.0 Native Hawaiian 50.3 49.5 36.3 -13.2 46.2 47.4 54.5 +7.1 White 54.1 53.1 40.1 -13.0 47.1 48.3 57.7 +9.4
(Table continued on next page)
534
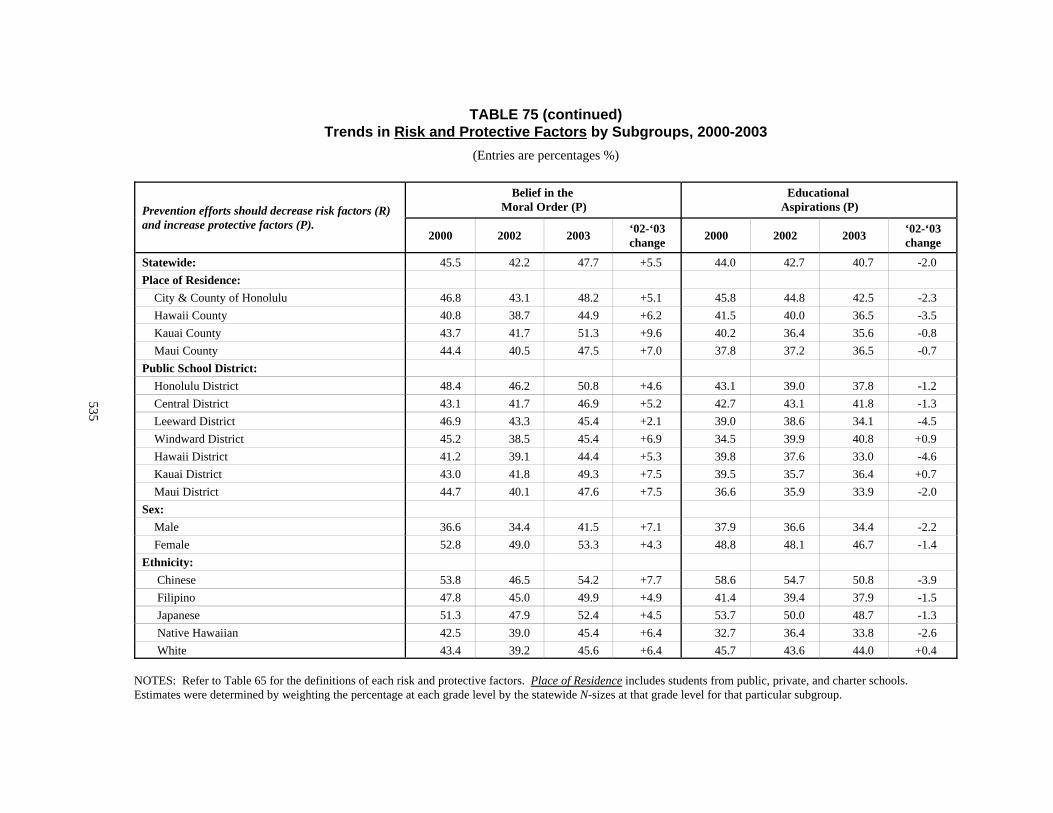
TABLE 75 (continued)Trends in Risk and Protective Factors by Subgroups, 2000-2003
(Entries are percentages %)
Prevention efforts should decrease risk factors (R)and increase protective factors (P).
Belief in the Moral Order (P)
Educational Aspirations (P)
2000 2002 2003 ‘02-‘03change 2000 2002 2003 ‘02-‘03
change
Statewide: 45.5 42.2 47.7 +5.5 44.0 42.7 40.7 -2.0Place of Residence: City & County of Honolulu 46.8 43.1 48.2 +5.1 45.8 44.8 42.5 -2.3 Hawaii County 40.8 38.7 44.9 +6.2 41.5 40.0 36.5 -3.5 Kauai County 43.7 41.7 51.3 +9.6 40.2 36.4 35.6 -0.8 Maui County 44.4 40.5 47.5 +7.0 37.8 37.2 36.5 -0.7Public School District: Honolulu District 48.4 46.2 50.8 +4.6 43.1 39.0 37.8 -1.2 Central District 43.1 41.7 46.9 +5.2 42.7 43.1 41.8 -1.3 Leeward District 46.9 43.3 45.4 +2.1 39.0 38.6 34.1 -4.5 Windward District 45.2 38.5 45.4 +6.9 34.5 39.9 40.8 +0.9 Hawaii District 41.2 39.1 44.4 +5.3 39.8 37.6 33.0 -4.6 Kauai District 43.0 41.8 49.3 +7.5 39.5 35.7 36.4 +0.7 Maui District 44.7 40.1 47.6 +7.5 36.6 35.9 33.9 -2.0Sex: Male 36.6 34.4 41.5 +7.1 37.9 36.6 34.4 -2.2 Female 52.8 49.0 53.3 +4.3 48.8 48.1 46.7 -1.4Ethnicity: Chinese 53.8 46.5 54.2 +7.7 58.6 54.7 50.8 -3.9 Filipino 47.8 45.0 49.9 +4.9 41.4 39.4 37.9 -1.5 Japanese 51.3 47.9 52.4 +4.5 53.7 50.0 48.7 -1.3 Native Hawaiian 42.5 39.0 45.4 +6.4 32.7 36.4 33.8 -2.6 White 43.4 39.2 45.6 +6.4 45.7 43.6 44.0 +0.4
NOTES: Refer to Table 65 for the definitions of each risk and protective factors. Place of Residence includes students from public, private, and charter schools. Estimates were determined by weighting the percentage at each grade level by the statewide N-sizes at that grade level for that particular subgroup.
535