Embed Size (px)
Citation preview

Risk and regulation in a digitalised worldA survey for UK asset managers
March 2017

Contents
Introduction and executive summary
1
Top motivators for the risk and compliance functions
3
Legal risk, strategy risk and technology risk trended strongly compared with 2015
5
Survey findings 7
1 Risk and regulation in a digitalised world A survey for UK asset managers
Introduction and executive summary
EY Risk and Regulation in a Digitalised World survey offers a revealing insight into the unique set of challenges confronting our industry’s risk and other control function professionals. In comparing the views of 42 chief risk officers, heads of operational risk and chief compliance officers from some of the most recognised asset managers servicing the needs of European investors, we can draw valuable conclusions from how asset managers of different styles and sizes are coping with the prospect of managing risks and complying with multiple regulations across the financial industry.
This year’s survey – the eighth in the series – took place in an environment of greater political uncertainty, lower yields and a tectonic drive towards digitalisation. Boards and C-suite functions (chief executive officers (CEOs), chief financial officers (CFOs), chief operating officers (COOs), chief technology officers (CTOs), chief risk officers (CROs) and chief compliance officers CCOs)) were factoring in the ramifications of managing increasing complexity from cross-regulatory measures, the financial impacts on the balance sheet and (given several high-profile process failures during 2015) the need for business resilience.
The need to manage both strategy and, particularly, legal risk was back on the agenda for CROs and CCOs to a degree not witnessed since the financial crisis. Private debt, alternative solutions investing and private markets (featuring private equity (PE), real estate and infrastructure funds) proved popular with investors looking for returns in a low-yield environment. The focus on fees and charges by regulators, liquidity risks from redemptions and capital retractions by the banks, plus the entrance of new models in the FinTech space (the cloud, robo-advice or selection and blockchain) were all significant departure points from last year’s survey. There was also a new theme in 2016 – how to design the ‘front office of the future’.
Perhaps strangely, firms were adapting to the pace and complexity of regulations this year, as a greater proportion of non-discretionary spend was dedicated to that sector. A mid-tier asset manager could expect to spend anything from £5 to £15 million over the course of 2016 to 2018 in order to prepare for, and comply with, the revised Markets in Financial Instruments Directive (MiFID II) alone, for example. Factoring in the simultaneous regulatory measures from the Market Abuse Regulation (MAR), the Securities Financing Transaction Regulation (SFTR), the Packaged Retail and Insurance-based Investment Products (PRIIPs) regulation and the fourth Anti-Money Laundering Directive (AMLD IV) could easily see the total exceed £20 million over a four-year horizon.
2Introduction and executive summary
This does not include the considerable dislocation expected under the General Data Protection Regulation (GDPR) and the arrival of new technical regulations in the FinTech space. Meanwhile, any firms hoping for respite following the UK’s referendum vote on 23 June 2016 were disappointed – there was still going to be a recalibration to cater for UK market needs while the industry awaited greater clarity on whether Brexit would be ‘hard’ (ie, potentially triggering major changes) or ‘soft’.
Some key themes from 2015 still remain. Asset managers continued to undergo transformational change from the perspectives of regulation, tax changes, customer interaction, distribution economics, attention to governance, stewardship and shareholders, technology provision, competition for talent and societal expectations. Fifty-four percent of respondents were taking initial steps to link the management of (mis)conduct risk with the UK’s individual accountability regime (the Senior Managers Regime), even though the latter is likely to take effect during H1 2018.
Regulators were also placing a greater burden of proof – investor protection, conduct, best execution, disclosure and reporting – squarely on the asset manager, irrespective of whether firms chose to outsource or not. It was also partly down to a focus on the personal – whether control function, material risk taker, portfolio manager or trader. The accumulation of personal data was beginning to cause some firms to wonder at the amount of work to be done when complying with the GDPR to come.
The survey also recorded several new developments compared with last year:
1) Regulatory capital and operational resilience – several asset managers posted off-the-scale Internal Capital Adequacy Assessment Process – Individual Capital Guidance (ICAAP ICG) scores during 2015. This trend continued into 2016 and was accompanied by a focus on balance sheet capital to cover liquidity risk, particularly for bank-owned asset managers. ICG scores in excess of 200% were no longer uncommon. Nor were moves to link regulatory capital allocations to misconduct risk. Firms were generally more prepared to deal with the sorts of system outages witnessed during March, April and August 2015 to avoid being awarded higher-than-average ICG scores. Attention moved to ‘cyber resilience’ as a critical hygiene factor, with focus on examples of malware installations, ransomware demands or computer network attacks (CNAs) and espionage. Given the need for extensive reporting requirements (eg, client, trade, transaction and best execution reporting needed under MiFID II), attention to market, reference and metadata was a consistent theme.
2) Liquidity in the market – this was a prevalent theme all year, partly due to the extension of quantitative easing (QE) and a move into a negative interest rate environment in some countries, but also as a result of redemptions and gates in non-equities (particularly real estate markets) plus extensive liquidity retraction due to fewer banks being able or willing to hold inventory. The root causes may be associated with Capital Requirements Directive (CRD) IV’s liquidity coverage ratio (LCR) and net stable funding ratio (NSFR), as well as capital retraction anticipated in complying with the fundamental review of the trading book (FRTB). The net result for many asset managers using derivatives (eg, liability-driven investing firms) or hedging as part of an investment strategy was fewer sell-side firms prepared to quote in size, or maintain large ranges or tenors in bonds or over-the-counter (OTC) traded derivatives respectively.
3) FinTech and the ‘growth’ agenda – the need to manage complexity and simplify was a continuing trend, particularly for bank- and insurance-owned asset managers looking to manage their cost or income ratios downwards in the face of several change features. Several firms were continuing their innovation strategies. The prevalence of new approaches in the digital, robotics, robo-advice and selection, and distributed ledger technology (DLT) or blockchain spaces indicated a ready and vibrant desire to develop simpler digitalised models able to improve client coupling and lower the future cost of regulatory compliance.
It is clear that the role of the risk and compliance professionals has never been more in demand, yet some businesses were challenged to maintain headcount in order to cope with the complexities facing the function. In this fluid environment, we believe that traditional and alternative asset managers derive enormous value from tracking peer progress and giving careful thought to what lies on their early warning ‘risk radars’ over the coming year.
This year’s survey featured one-on-one interviews with CROs, heads of operational risk and heads of compliance or CCOs, conducted between January and September 2016, giving respondents the scope to anonymously share candid opinions. Critical conclusions are featured in the comparison template at the end of this section for reference by CROs, CCOs and seniors from the board or the business. The composition of interviewees represented the customary selection of large (top 20), medium-sized and several alternative investment management firms (by assets under management (AuM)). As ever, we are grateful to them for their patience and considerable support in this endeavour.
3 Risk and regulation in a digitalised world A survey for UK asset managers
Top motivators for the risk and compliance functions
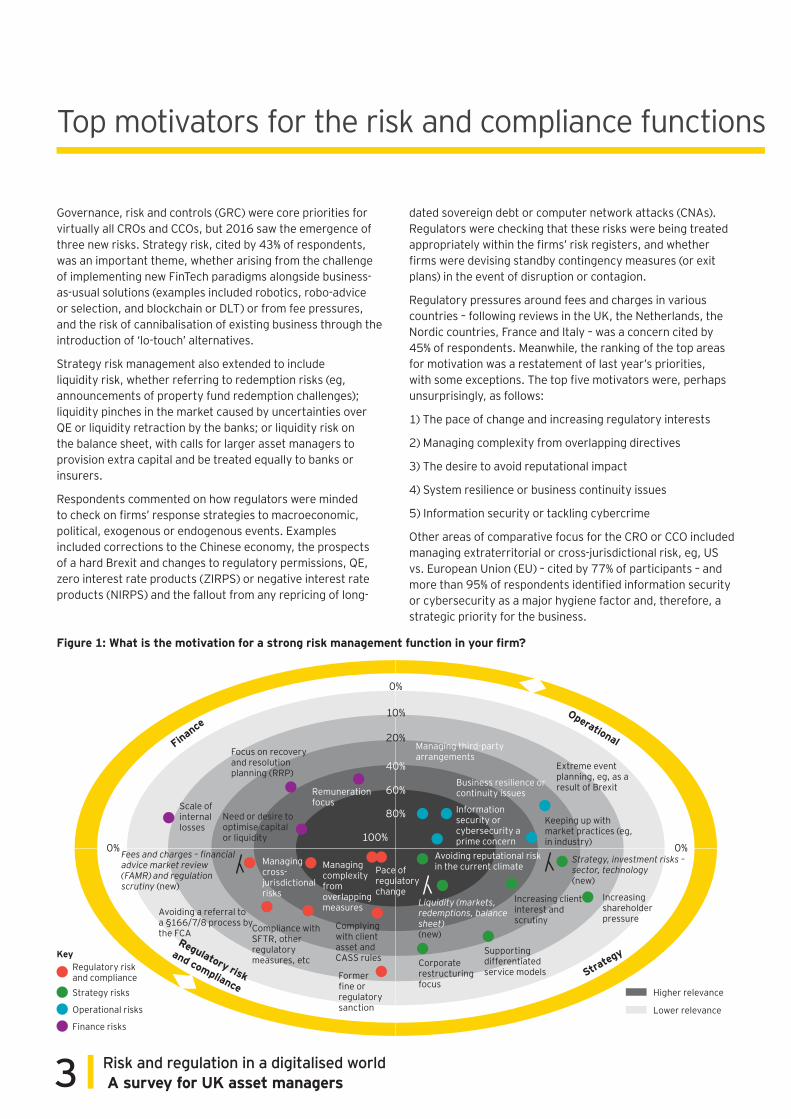
Governance, risk and controls (GRC) were core priorities for virtually all CROs and CCOs, but 2016 saw the emergence of three new risks. Strategy risk, cited by 43% of respondents, was an important theme, whether arising from the challenge of implementing new FinTech paradigms alongside business-as-usual solutions (examples included robotics, robo-advice or selection, and blockchain or DLT) or from fee pressures, and the risk of cannibalisation of existing business through the introduction of ‘lo-touch’ alternatives.
Strategy risk management also extended to include liquidity risk, whether referring to redemption risks (eg, announcements of property fund redemption challenges); liquidity pinches in the market caused by uncertainties over QE or liquidity retraction by the banks; or liquidity risk on the balance sheet, with calls for larger asset managers to provision extra capital and be treated equally to banks or insurers.
Respondents commented on how regulators were minded to check on firms’ response strategies to macroeconomic, political, exogenous or endogenous events. Examples included corrections to the Chinese economy, the prospects of a hard Brexit and changes to regulatory permissions, QE, zero interest rate products (ZIRPS) or negative interest rate products (NIRPS) and the fallout from any repricing of long-
dated sovereign debt or computer network attacks (CNAs). Regulators were checking that these risks were being treated appropriately within the firms’ risk registers, and whether firms were devising standby contingency measures (or exit plans) in the event of disruption or contagion.
Regulatory pressures around fees and charges in various countries – following reviews in the UK, the Netherlands, the Nordic countries, France and Italy – was a concern cited by 45% of respondents. Meanwhile, the ranking of the top areas for motivation was a restatement of last year’s priorities, with some exceptions. The top five motivators were, perhaps unsurprisingly, as follows:
1) The pace of change and increasing regulatory interests
2) Managing complexity from overlapping directives
3) The desire to avoid reputational impact
4) System resilience or business continuity issues
5) Information security or tackling cybercrime
Other areas of comparative focus for the CRO or CCO included managing extraterritorial or cross-jurisdictional risk, eg, US vs. European Union (EU) – cited by 77% of participants – and more than 95% of respondents identified information security or cybersecurity as a major hygiene factor and, therefore, a strategic priority for the business.
Figure 1: What is the motivation for a strong risk management function in your firm?
0%100%
80%
0%
10%
20%
40%
60%
0%
FinanceOperational
Regulatory risk
and complianceStra
tegy
Scale of internal losses
Focus on recovery and resolution planning (RRP)
Remuneration focus
Fees and charges – financial advice market review (FAMR) and regulation scrutiny (new)
Avoiding a referral to a §166/7/8 process by the FCA Compliance with
SFTR, other regulatory measures, etc
Former fine or regulatory sanction
Complying with client asset and CASS rules
Managing cross- jurisdictional risks
Managing complexity from overlapping measures
Pace of regulatory change
Need or desire to optimise capital or liquidity
Managing third-party arrangements
Business resilience or continuity issues
Information security or cybersecurity a prime concern
Keeping up with market practices (eg, in industry)
Extreme event planning, eg, as a result of Brexit
Avoiding reputational risk in the current climate
Liquidity (markets, redemptions, balance sheet) (new)
Corporate restructuring focus
Supporting differentiated service models
Increasing client interest and scrutiny
Strategy, investment risks – sector, technology (new)
Increasing shareholder pressure
KeyRegulatory risk and complianceStrategy risks
Operational risks
Finance risks
Higher relevance
Lower relevance

4Top motivators for the risk and compliance functions
5 Risk and regulation in a digitalised world A survey for UK asset managers
Legal risk, strategy risk and technology risk trended strongly compared with 2015
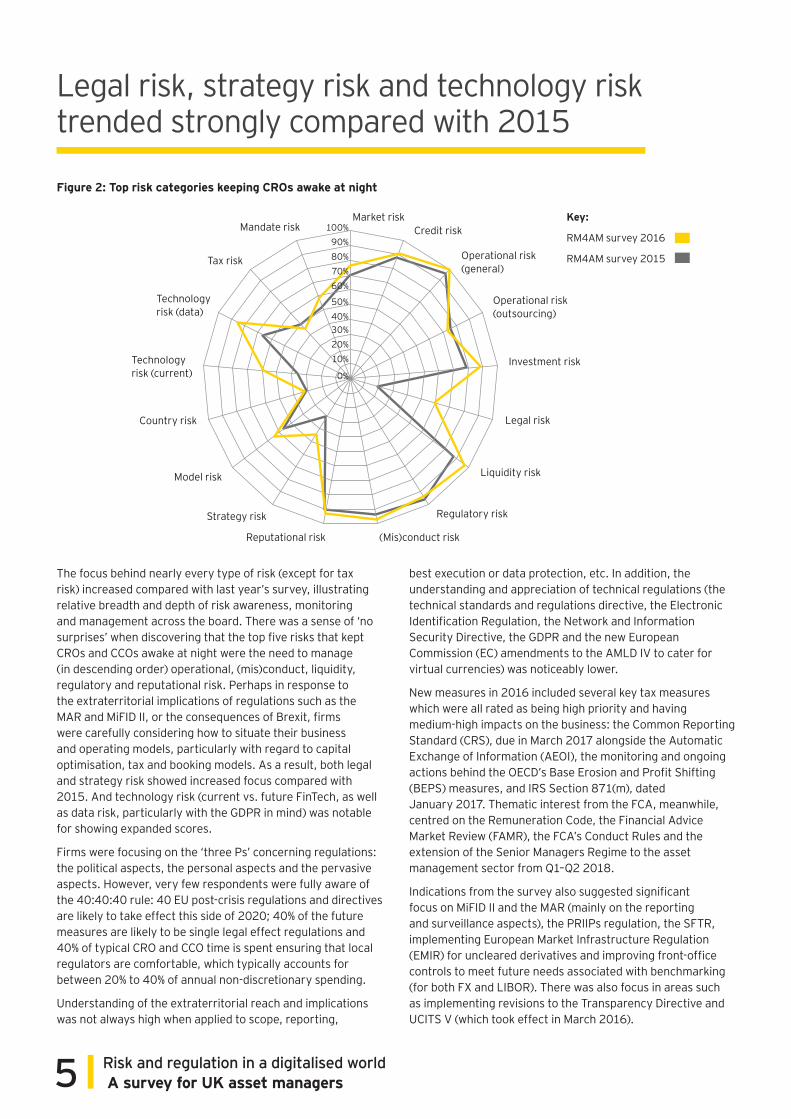
The focus behind nearly every type of risk (except for tax risk) increased compared with last year’s survey, illustrating relative breadth and depth of risk awareness, monitoring and management across the board. There was a sense of ‘no surprises’ when discovering that the top five risks that kept CROs and CCOs awake at night were the need to manage (in descending order) operational, (mis)conduct, liquidity, regulatory and reputational risk. Perhaps in response to the extraterritorial implications of regulations such as the MAR and MiFID II, or the consequences of Brexit, firms were carefully considering how to situate their business and operating models, particularly with regard to capital optimisation, tax and booking models. As a result, both legal and strategy risk showed increased focus compared with 2015. And technology risk (current vs. future FinTech, as well as data risk, particularly with the GDPR in mind) was notable for showing expanded scores.
Firms were focusing on the ‘three Ps’ concerning regulations: the political aspects, the personal aspects and the pervasive aspects. However, very few respondents were fully aware of the 40:40:40 rule: 40 EU post-crisis regulations and directives are likely to take effect this side of 2020; 40% of the future measures are likely to be single legal effect regulations and 40% of typical CRO and CCO time is spent ensuring that local regulators are comfortable, which typically accounts for between 20% to 40% of annual non-discretionary spending.
Understanding of the extraterritorial reach and implications was not always high when applied to scope, reporting,
best execution or data protection, etc. In addition, the understanding and appreciation of technical regulations (the technical standards and regulations directive, the Electronic Identification Regulation, the Network and Information Security Directive, the GDPR and the new European Commission (EC) amendments to the AMLD IV to cater for virtual currencies) was noticeably lower.
New measures in 2016 included several key tax measures which were all rated as being high priority and having medium-high impacts on the business: the Common Reporting Standard (CRS), due in March 2017 alongside the Automatic Exchange of Information (AEOI), the monitoring and ongoing actions behind the OECD’s Base Erosion and Profit Shifting (BEPS) measures, and IRS Section 871(m), dated January 2017. Thematic interest from the FCA, meanwhile, centred on the Remuneration Code, the Financial Advice Market Review (FAMR), the FCA’s Conduct Rules and the extension of the Senior Managers Regime to the asset management sector from Q1–Q2 2018.
Indications from the survey also suggested significant focus on MiFID II and the MAR (mainly on the reporting and surveillance aspects), the PRIIPs regulation, the SFTR, implementing European Market Infrastructure Regulation (EMIR) for uncleared derivatives and improving front-office controls to meet future needs associated with benchmarking (for both FX and LIBOR). There was also focus in areas such as implementing revisions to the Transparency Directive and UCITS V (which took effect in March 2016).
Figure 2: Top risk categories keeping CROs awake at night
100%90%80%70%60%
50%40%30%20%10%
0%
Market riskCredit risk
Operational risk (general)
Operational risk (outsourcing)
Investment risk
Legal risk
Liquidity risk
Regulatory risk
(Mis)conduct riskReputational risk
Strategy risk
Model risk
Country risk
Technology risk (current)
Technology risk (data)
Tax risk
Mandate risk Key:
RM4AM survey 2016
RM4AM survey 2015
6Legal risk, strategy risk and technology risk trended strongly compared with 2015
There was strong evidence on the back of the ICAAP and supervisory review and evaluation process (SREP), processes to suggest that the finance and risk functions within some of the larger asset managers were now showing stronger signs of working in tandem in order to meet the demands of regulators. Equally, asset manager counterparties, such as asset servicers and other outsourcers, were also showing signs of adapting to new levels of liability management and disclosure, which would have a bearing on the business and operating models of some firms.
As with their sell-side counterparts, firms were looking to simplify their operations by differentiating ‘must-do’ measures (laws, regulations, directives and regulatory
technical standards) vs. ‘good-to-do’ measures (principles, guidelines, recommendations and suggestions). Given the delays associated with MiFID II and the serious prospects of delays with the PRIIPs regulation, respondents remained alert to the prospect of complying against varying timelines (eg, delays caused by politics, implementation challenges or global synchronisation). Preparations for Brexit were evident in the foreground, with some firms opening Irish or Luxembourg fund range(s) to give them greater flexibility when navigating the uncertainties of the post-Brexit fund distribution, reorganisation and repapering landscape. The general consensus was that firms would be complying with extant regulations and directives this side of 2019.
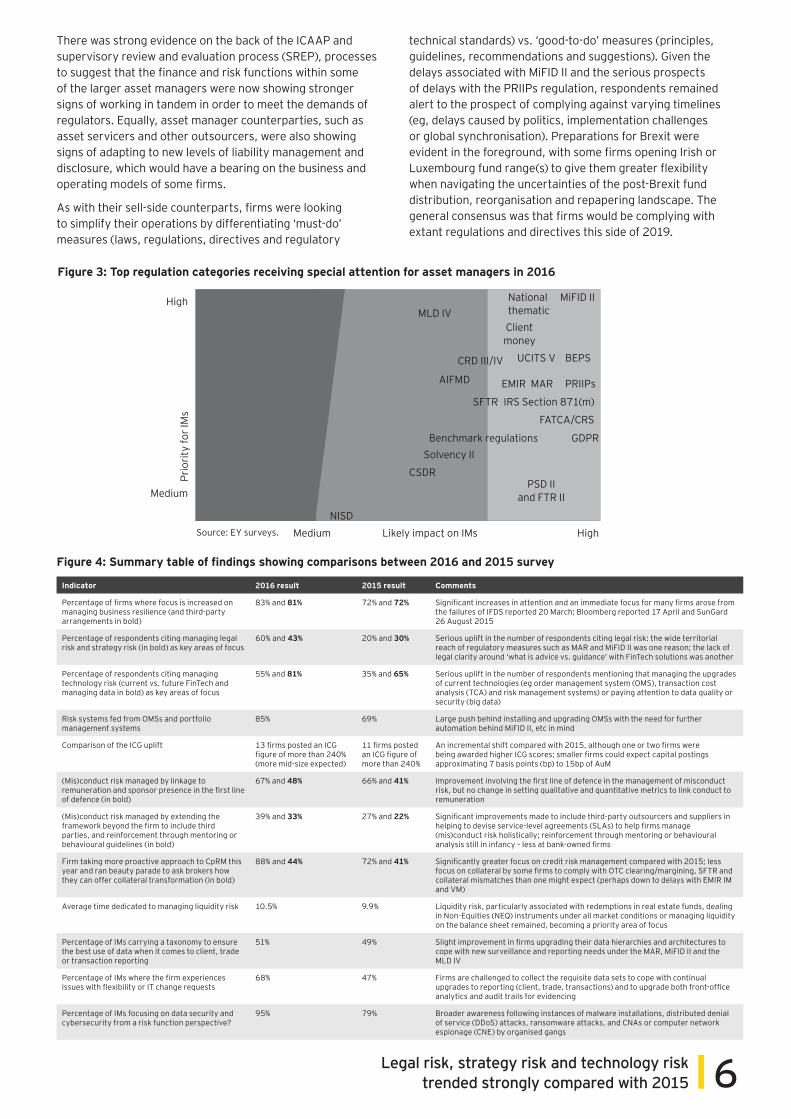
Figure 3: Top regulation categories receiving special attention for asset managers in 2016
Figure 4: Summary table of findings showing comparisons between 2016 and 2015 survey
High
Medium
Prio
rity
for I
Ms
Source: EY surveys. Medium Likely impact on IMs HighNISD
CSDR
Solvency II
PSD II and FTR II
GDPR
MLD IV
AIFMD
CRD III/IV UCITS V
National thematicClient money
EMIR MAR
SFTR IRS Section 871(m)
PRIIPs
BEPS
MiFID II
FATCA/CRS
Benchmark regulations
Indicator 2016 result 2015 result Comments
Percentage of firms where focus is increased on managing business resilience (and third-party arrangements in bold)
83% and 81% 72% and 72% Significant increases in attention and an immediate focus for many firms arose from the failures of IFDS reported 20 March; Bloomberg reported 17 April and SunGard 26 August 2015
Percentage of respondents citing managing legal risk and strategy risk (in bold) as key areas of focus
60% and 43% 20% and 30% Serious uplift in the number of respondents citing legal risk: the wide territorial reach of regulatory measures such as MAR and MiFID II was one reason; the lack of legal clarity around ‘what is advice vs. guidance’ with FinTech solutions was another
Percentage of respondents citing managing technology risk (current vs. future FinTech and managing data in bold) as key areas of focus
55% and 81% 35% and 65% Serious uplift in the number of respondents mentioning that managing the upgrades of current technologies (eg order management system (OMS), transaction cost analysis (TCA) and risk management systems) or paying attention to data quality or security (big data)
Risk systems fed from OMSs and portfolio management systems
85% 69% Large push behind installing and upgrading OMSs with the need for further automation behind MiFID II, etc in mind
Comparison of the ICG uplift 13 firms posted an ICG figure of more than 240% (more mid-size expected)
11 firms posted an ICG figure of more than 240%
An incremental shift compared with 2015, although one or two firms were being awarded higher ICG scores; smaller firms could expect capital postings approximating 7 basis points (bp) to 15bp of AuM
(Mis)conduct risk managed by linkage to remuneration and sponsor presence in the first line of defence (in bold)
67% and 48% 66% and 41% Improvement involving the first line of defence in the management of misconduct risk, but no change in setting qualitative and quantitative metrics to link conduct to remuneration
(Mis)conduct risk managed by extending the framework beyond the firm to include third parties, and reinforcement through mentoring or behavioural guidelines (in bold)
39% and 33% 27% and 22% Significant improvements made to include third-party outsourcers and suppliers in helping to devise service-level agreements (SLAs) to help firms manage (mis)conduct risk holistically; reinforcement through mentoring or behavioural analysis still in infancy – less at bank-owned firms
Firm taking more proactive approach to CpRM this year and ran beauty parade to ask brokers how they can offer collateral transformation (in bold)
88% and 44% 72% and 41% Significantly greater focus on credit risk management compared with 2015; less focus on collateral by some firms to comply with OTC clearing/margining, SFTR and collateral mismatches than one might expect (perhaps down to delays with EMIR IM and VM)
Average time dedicated to managing liquidity risk 10.5% 9.9% Liquidity risk, particularly associated with redemptions in real estate funds, dealing in Non-Equities (NEQ) instruments under all market conditions or managing liquidity on the balance sheet remained, becoming a priority area of focus
Percentage of IMs carrying a taxonomy to ensure the best use of data when it comes to client, trade or transaction reporting
51% 49% Slight improvement in firms upgrading their data hierarchies and architectures to cope with new surveillance and reporting needs under the MAR, MiFID II and the MLD IV
Percentage of IMs where the firm experiences issues with flexibility or IT change requests
68% 47% Firms are challenged to collect the requisite data sets to cope with continual upgrades to reporting (client, trade, transactions) and to upgrade both front-office analytics and audit trails for evidencing
Percentage of IMs focusing on data security and cybersecurity from a risk function perspective?
95% 79% Broader awareness following instances of malware installations, distributed denial of service (DDoS) attacks, ransomware attacks, and CNAs or computer network espionage (CNE) by organised gangs
7 Risk and regulation in a digitalised world A survey for UK asset managers
Regulatory capital and operational resilienceCapital provision remained a focus in this year’s survey, against a backdrop of the financial stability board (FSB) and regulators paying greater attention to asset managers’ balance sheets in an attempt to reduce systemic risks (by ensuring that fund houses carry enough capital to weather stressed markets or operational conditions). Bank-owned asset managers were also spooked by a proposal from the Basel Committee on Banking Supervision (BCBS) issued in April 2016, suggesting that their parent entities hold extra capital in case their fund management operations are hit in a crisis. The BCBS proposed that these banks post additional Pillar I capital worth 1% of their fund arms’ entire AuM (not merely the money market fund component) against ‘step-in’ risk. Some respondents expressed concerns that the additional capital requirements and operational costs for banks could eventually make some forms of asset management less attractive, and might even force large banks out of running asset management divisions.
Comments from respondents were divided on whether their firm was due to receive a visit from the regulator as part of their ICAAP and SREP. Firms that were not due to be visited were understandably more relaxed and were contemplating target figures for ICG uplift (vs. Pillar I or Pillar II capital, depending on the span of the risks they wished to cover). Coverage for liquidity risk was a consistent and critical theme, whether arising to cover redemptions (in sectors such as real estate or money market funds) or to respond to regulators querying whether firms had sufficient capital provisioned on the balance sheet for larger firms.
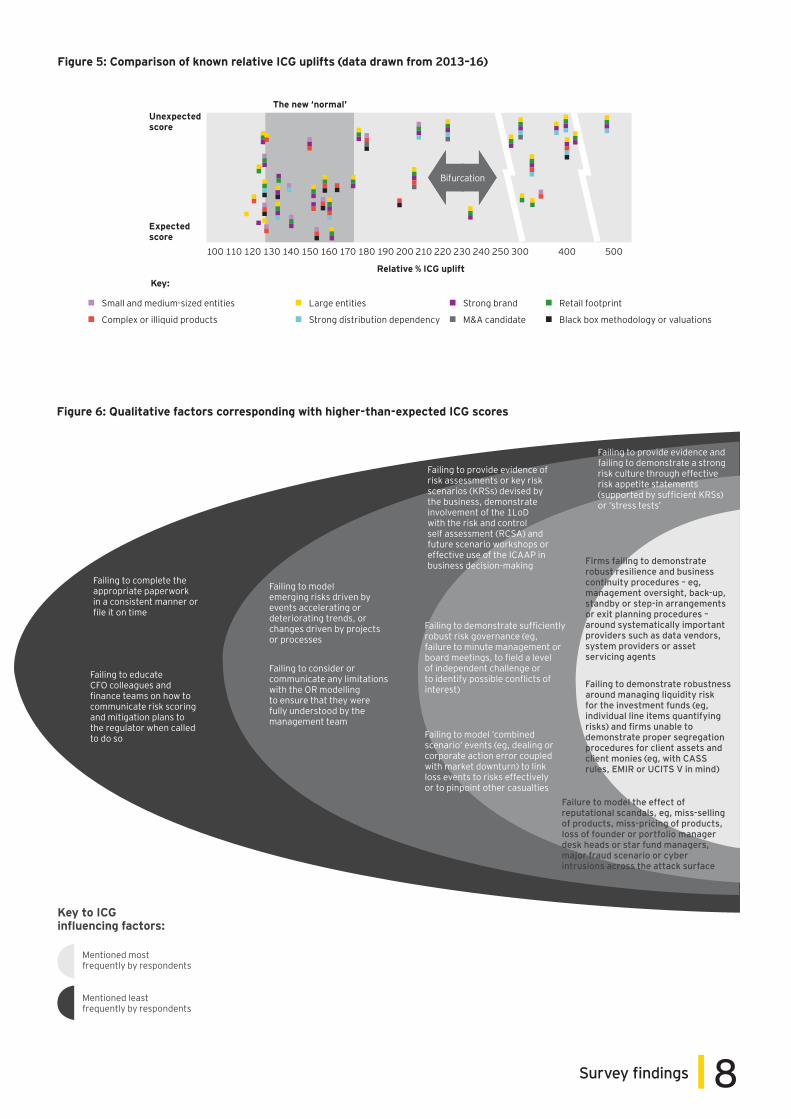
A handful of asset managers saw their ICG scores rise by more than 30% in relative terms to join those who had posted off-the-scale ICAAP ICG scores during the 2013 to 2015 assessment window (see Figure 5). Thirteen firms posted comparative ICG scores in excess of 200, commenting on the varied and occasionally intrusive regulatory processes by teams from the FCA. The regulator remained keen on firms showing clearer and cleaner workings and demonstrating their awareness of culture elements – carrying out conduct risk refreshes or reinforcements biannually, for example.
There was a clear expectation that boards and CEOs would be expected to provide more concrete sponsorship in the form of a ‘tone from the top’ and play a greater role in overseeing the maintenance of the three lines of defence 3LoD approach in practice. A minority of firms complained that the 3LoD approach was no longer suitable to support GRC at their firm, and refinements (such as creating 1.5LoD or 2.5LoD sub-functions) were needed in practice.
The challenge by the FCA covered various areas of perennial interest: the proper articulation of the firm’s risk appetite, the applicability and effectiveness of ‘use’ tests and, finally, more quantitative questioning surrounding the assessments of market, credit and operational risk (OR) as line items. Respondents expected that the FCA would focus not only on the robustness of the OR framework but also on core competencies of the CRO and risk teams, as well as the CFO and finance teams. The sense was that smaller firms were being reviewed thematically on longer cycles, with a handful applying a capital calculation based on 7bp to 15bp of UK-administered AuM in order to arrive at an upper limit for capital provision.
Survey findings
Business and operational resilienceThe business resilience and business continuity procedures around systemically important providers were all important in view of 2015’s reported outages of critical suppliers in March, April and August respectively. The emphasis in 2016 shifted to order management system (OMS) and execution management system (EMS) providers, and other business-critical applications. The resilience of business systems and the operating model dependencies – for outsourcing providers, vendors or clearing houses – remained top of mind among CROs.
This year’s survey showed that 83% of asset managers (compared with 76% in 2015) felt that business continuity or system resilience was an issue for the 2LoD. The common concern centred on what might happen if a service provider (such as a fund administrator or material outsource provider with a large share of the market) faced severe operational disruption, financial distress or default. Would asset managers be able to perform critical and important regulated activities and, if not, would this result in creating detriment for end investors?
Firms could agree on the questions to ask, but not the concrete answers, because they had yet to:
i) Model the implications fully when operating under protracted stressed market conditions
ii) Reach full consensus over contingency planning (such as ‘switching arrangements’, ‘step-in rights’, ‘standby’, ‘warm second provider’ or ‘exit’ arrangements) in the event of an agent hitting financial problems
iii) Evaluate and price the liability arrangements to cover cases of fraud or insolvency of any end agents, such as sub-custodians or depositories (see (c) on the next page)
8Survey findings
Figure 6: Qualitative factors corresponding with higher-than-expected ICG scores
Figure 5: Comparison of known relative ICG uplifts (data drawn from 2013–16)
Unexpected score
Expected score
100 110 120 130 140 150 160 170 180 190 200 210 220 230 240 250 300 400 500
Relative % ICG upliftKey:
Small and medium-sized entities
Complex or illiquid products
Large entities
Strong distribution dependency
Strong brand
M&A candidate
Retail footprint
Black box methodology or valuations
The new ‘normal’
Bifurcation
Failing to complete the appropriate paperwork in a consistent manner or file it on time
Failing to educate CFO colleagues and finance teams on how to communicate risk scoring and mitigation plans to the regulator when called to do so
Mentioned most frequently by respondents
Key to ICG influencing factors:
Mentioned least frequently by respondents
Failing to model emerging risks driven by events accelerating or deteriorating trends, or changes driven by projects or processes
Failing to consider or communicate any limitations with the OR modelling to ensure that they were fully understood by the management team
Failing to provide evidence of risk assessments or key risk scenarios (KRSs) devised by the business, demonstrate involvement of the 1LoD with the risk and control self assessment (RCSA) and future scenario workshops or effective use of the ICAAP in business decision-making
Failing to model ‘combined scenario’ events (eg, dealing or corporate action error coupled with market downturn) to link loss events to risks effectively or to pinpoint other casualties
Failing to demonstrate sufficiently robust risk governance (eg, failure to minute management or board meetings, to field a level of independent challenge or to identify possible conflicts of interest)
Failing to provide evidence and failing to demonstrate a strong risk culture through effective risk appetite statements (supported by sufficient KRSs) or ‘stress tests’
Firms failing to demonstrate robust resilience and business continuity procedures – eg, management oversight, back-up, standby or step-in arrangements or exit planning procedures – around systematically important providers such as data vendors, system providers or asset servicing agents
Failing to demonstrate robustness around managing liquidity risk for the investment funds (eg, individual line items quantifying risks) and firms unable to demonstrate proper segregation procedures for client assets and client monies (eg, with CASS rules, EMIR or UCITS V in mind)
Failure to model the effect of reputational scandals, eg, miss-selling of products, miss-pricing of products, loss of founder or portfolio manager desk heads or star fund managers, major fraud scenario or cyber intrusions across the attack surface
9 Risk and regulation in a digitalised world A survey for UK asset managers
Board and senior management sponsorship
Importance of the OR appetite
In-house challenge and validationUse tests fully applied
Dynamic modelling approach (sensitivity analysis for all assets)
Strategic objectives
Business initiatives
OR foundations Guiding principles, strategy, governance, appetite, GRC structure and glossary
Risk identification and assessment
Risk monitoring Risk measurement
Risk reportingRegulatory and economic capital
Third-party substantiation
RCSA Scenario analysis
KRIsLoss data
Key | Demonstrated by most firms: Some firms: Few firms:
Technology
Number of operational incidents in 2015
Ann
ualis
ed im
plie
d lo
ss v
alue
(inc
ludi
ng in
cide
nts
reso
lved
in
the
clie
nts’
favo
ur) i
n U
S$ ‘0
00
Losses against the firm only
Includes corrections and breaks
Includes near misses
Includes gains in clients’ favour
500 1,000 1,500
1,000
0
2,000
3,000
4,000
5,000
6,000
Figure 7: Operation risk management (ORM) approach showing generic approach for addressing emergent risks
Figure 8: Comparison of the annualised implied loss figures and the number of operational incidents reported internally during 2015
10Survey findings
Better news was that more firms are aware of key product and solution dependencies on third-party vendors such as OMS providers, or third-party service providers such as fund administrators or financial market infrastructures (eg, exchanges and central counterparty clearers). There was even more progress, with respondents:
a) Generally agreeing the definitions and materiality of critical operational functions and investment services and activities
b) Revalidating that they were able to monitor and manage the effectiveness of functions carried out against granular SLAs
c) Ensuring that settlement agents were in a position to offer upstream clients the choice between omnibus and individual client segregation, with information as to the costs and risks associated with each option (eg as per CSDR Art. 38(5) and (6) in EU/European economic area (EEA) countries) relating to insolvency law and procedures, recoverability of assets and indemnification in each jurisdiction
d) Cataloguing the KRIs for external and internal SLAs effectively, particularly in the case of service provision or outsourcing from third countries
e) Ensuring that catalogues and KRSs feature procedures for engaging with competent authorities in third countries
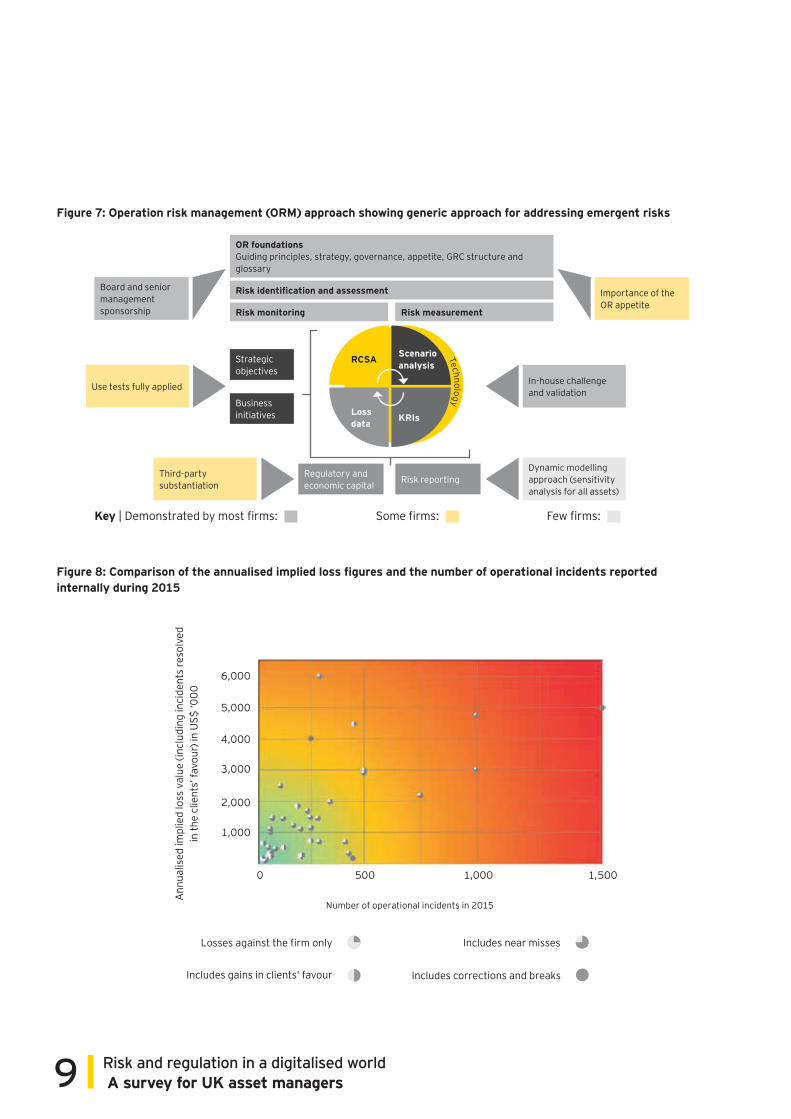
Eighty-one percent of respondents had already raised expectations and devised granular contingency plans based upon SLAs which they felt to be proactive, robust and realistic in the event of a termination of third-party activity under any circumstances, particularly under stressed market conditions or cyber attacks (see Figure 7). Developing a separate OR appetite remained a challenge for smaller entities, such as hedge funds. Many firms had made good progress in embedding their OR frameworks into the business, with a range of metrics being used to express the appetite (including expanding the range of anything from 40 to 120 KRIs and modelling loss values or capital provisions). The leading firms validated their OR frameworks using techniques including internal audit reviews, commissioning external reviews or remediating following regulatory reviews. Often, central risk units at the smaller firms were not able to rely entirely on independent verification, such as internal audit or review by external auditors, to meet this constant requirement, so looked to develop more continuous validation processes.
Other characteristics evident in this year’s survey were as follows:
► ►Improved coupling of loss events with root cause analysis, particularly for cyber or digital risks – the improvement in 2016 was noted in modelling the consequences of cyber attacks or the reputational consequences of mismanagement of digital risk. Not all firms linked loss events to root cause analysis to determine, for example, whether an impact represented an expected, a severe or a worst-case instance of the risk (and, for firms operating under comfort zone thresholds, whether any of the graphs on the previous page could be causally linked to the firm’s stated risk appetite), linking indicators such as deteriorating KRIs (or combinations thereof) to specific KRSs.
► ►OR system configurability – the focus on controls and their design or operating effectiveness was evident, particularly concerning front-office controls. However, a newer trend was firms choosing vendor solutions whose parameters and workflows could be self-configured by the 2LoD. The focus was on simplification and keeping costs down (reduced licence and maintenance fees, better optionality, exploring hosted solutions or relying on local processing). This was particularly notable in the case of firms selecting trade surveillance tools.
At least four different categories were recorded in terms of risk impact (eg, the direct cost impacts of client compensation or regulatory risk, or of the loss of revenue or redemptions impacting the AuM arising from reputational risk):
► ►Operational incidents or errors resulting in loss events against the firm
► ►Unintended gains or incidents resulting in the proceeds being awarded in the clients’ favour
► ►Qualified near-misses arising from errors and omissions
► ►False positives or situations arising from mistranscribing dealing tickets or operational breaks, failures or overdrafts which were corrected or remediated before they qualified as incidents such as the graph on the previous page
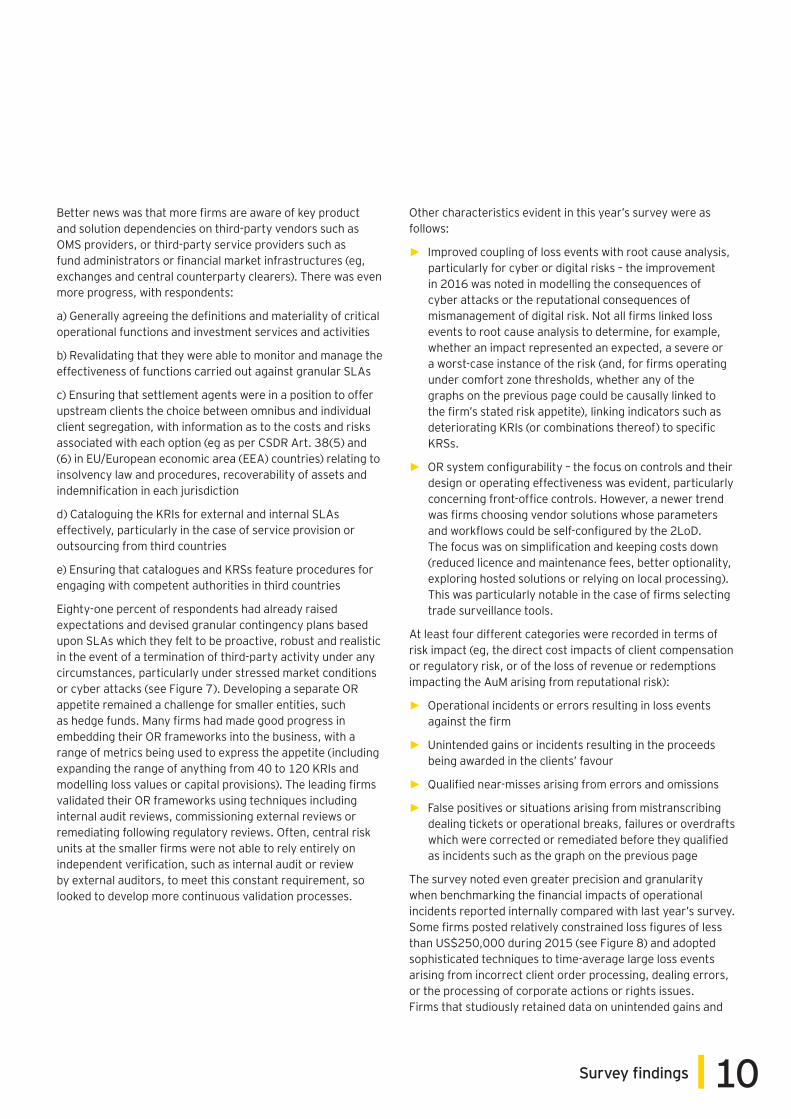
The survey noted even greater precision and granularity when benchmarking the financial impacts of operational incidents reported internally compared with last year’s survey. Some firms posted relatively constrained loss figures of less than US$250,000 during 2015 (see Figure 8) and adopted sophisticated techniques to time-average large loss events arising from incorrect client order processing, dealing errors, or the processing of corporate actions or rights issues. Firms that studiously retained data on unintended gains and
11 Risk and regulation in a digitalised world A survey for UK asset managers
qualified near misses were particularly interested in studying how other firms annualised their loss values – whether over a three- or five-year cycle – and whether peers were formalising a total loss value figure as a target ceiling.
Data sets that could be treated as loss events affecting the business vs. ‘inadvertent’ (consequences of force majeure or market movements). Leading firms provided overlays to differentiate positive impacts for clients vs. neutral or negative impacts. Annualised loss figures for smaller entities were comparable with last year’s data: more firms were counting near misses this year, and the annualised loss figures showed increases for several mid- to large-sized firms when comparing 2015 data with 2014 data.
Market liquidity risk and front-office controlsThe prime area of risk and regulatory focus for asset managers this year was the front office. More asset managers than ever before were focusing on how MiFID II would affect their dealing arrangements (eg, use of telephone trading, lo-touch channels to market such as direct electronic access (DEA), automated order routing (AOR) or smart order routing (SOR), use of specific broker algorithms, use of particular lit or dark venues, and timestamping or providing audit trails). All firms were looking to upgrade their front-office control procedures following the FCA’s Thematic Review TR14/13, especially for non-EQ-type instruments, manage conflicts upfront and upgrade transaction cost analysis (TCA) routines, particularly for telephone trading in non-equities. Although the latter were not strictly mandated by MiFID II, their use was key to demonstrating preventative controls and ‘fitness for purpose’ to regulators and discriminating end investors.
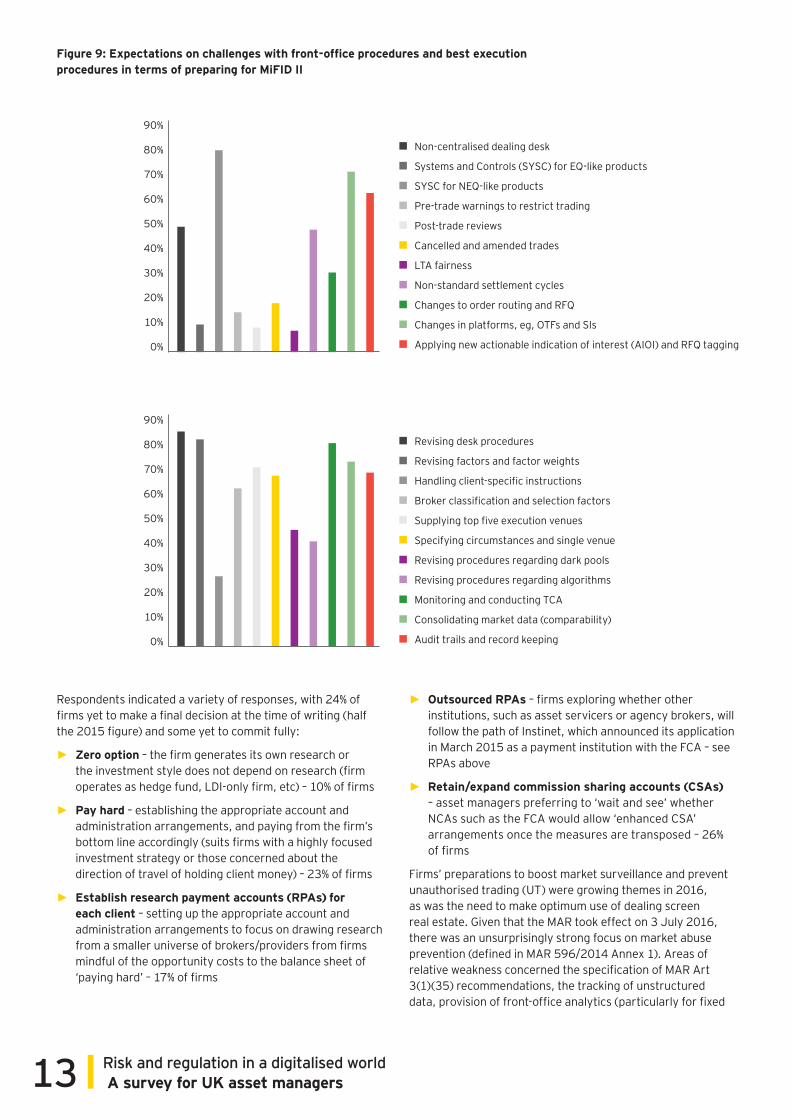
Front-office control awareness and improvements were most noticeable in terms of post-trade reviews and late trade allocation (LTA) fairness, with only 10% and 8% of respondents reporting challenges in these areas respectively (see Figure 9). Areas such as pre-trade warnings (eg, mandate restrictions), checks on cancelled, amended or delayed placements, or compliance with short-selling or ID checks for third-country booking restrictions all showed relatively healthy scores. The only areas where attention clearly needs to be paid included managing portfolio manager notifications and communications, reviews of short-selling arrangements, reviews of spot FX execution, segregation of portfolio manager duties and unusual settlement cycles (which are more sensitive to abuse).
There were slight improvements with greater centralisation of dealing desks, but challenges with non-EQ products and adapting to new platforms for NEQs under MiFID II (eg,
organised trading facilities (OTFs) vs. systematic internalisers), and also applying the new FIX tagging for OMSs and EMSs. Most firms were expecting to revise best execution policies and desk procedures, and the underlying data support behind them, for both hi- and lo-touch trading models in order- and quote-driven markets; the more advanced firms were taking account of both time-sensitive trades in liquid and illiquid markets for more asset classes (including spot FX).
All respondents commented that they would be profiling their dealers in order to produce supportive evidence of broker selection, including understanding which broker execution venues would likely fall under the systematic internaliser definition (thus relieving the asset manager seller of the obligation to trade report), the top five execution venues, use of single venues and use of algorithm or dark venue procedures. Attention to TCA procedures for NEQs (particularly FX), consolidating market data for prints (not just indications) and audit trail storage and retrievals were areas of focus – so was MiFID II RTS 25 (regarding clock synchronisation) for the larger participants using multilateral trading facilities (MTFs) as of Q3 2016.
The increased banking regulatory capital provision under Basel III associated with the introduction of the NSFR and the FRTB inevitably correlated with a lesser appetite to commit capital in the RFQ fixed income, currencies and commodities (FICC) inventory businesses. Given the impact of bond market volatility since October 2014 - and investment banks retracting quotes in corporate and high-yield fixed income instruments, and long-tenor IRS and inflation swap instruments or fixed income exchanged traded funds (ETFs), it was not surprising that many asset managers (including all liability-driven investing (LDI) and ETF firms) were paying close, if not more, attention to their trading patterns and their liquidity risk controls this year.
2016 was also when best execution for NEQs came of age. With MiFID II due to take effect on 3 January 2018, all firms indicated the need to revisit their order execution policy documents, their desk procedures (for each relevant asset class) and their supporting data (from timestamping the processing of orders, and selecting particular broker execution venues or trading venues such as MTFs or OTFs), and supporting data from TCA tools. The focus was on best execution factors, policies and procedures, and some areas of thematic interest also extended to querying whether a ‘best execution price’ was a clear price level which could be applied to certain types of trading (eg, switch, curve or ‘fly’ trades). Respondents also questioned the MiFID II demarcation between RTS 28 Art 2(5)-defined ‘passive’ (providing liquidity) vs. ‘aggressive’ (taking liquidity) trades, given the

12Survey findings
requirement that systems demarcate the two categories.
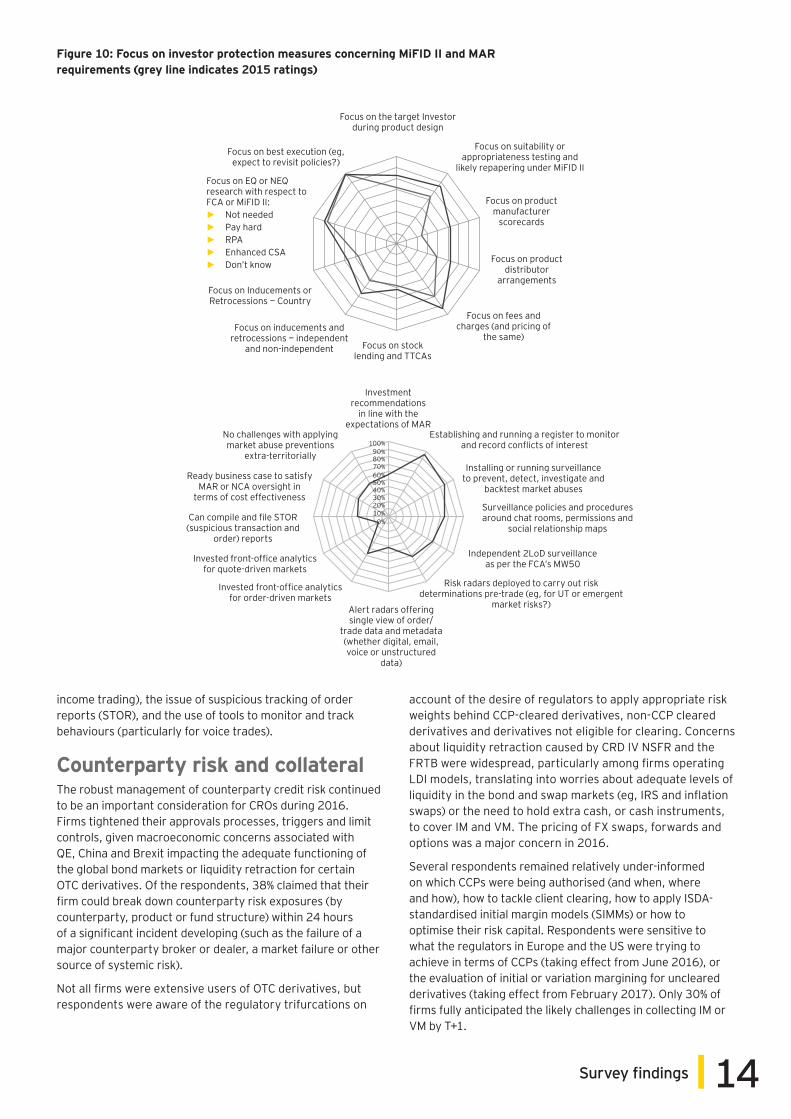
Preparations behind the other aspects of MiFID II investor protection requirements, plus the MAR, remained a prime focus for respondents (see Figure 10). The need to repaper and manage the suitability statements or appropriateness modifications, changes to manufacture or distribution processes, and the accompanying fees and changes (featuring ex-ante and ex-post disclosures) was a consistent theme, with more firms paying attention to these areas than recorded in last year’s survey.
One of the most controversial areas of focus for respondents in the survey was how to treat the subject of research provision under MiFID II, with 83% of asset managers focused on the issue. MiFID II requires asset managers to understand the pricing of research in all its components (including services such as access, polling, any use of expert networks or detailed analytics – not just sector-specific or desk research into stock selection). Respondents, however, baulked at proposals to link provision of fixed income sub-sector research with evidence of best execution, querying how the MiFID II measures could be applied to primary market issuance, discussions of market colour or the issue of sales notes.
MiFID II also requires firms to justify why research costs are value adding to the client (eg, original thought, intellectual rigour and meaningful conclusions). They are required to upgrade administration systems to allocate budgets by funds or by client, because they also need to provide pre- and post-spend research information to clients at the year-end. Concerns were raised by respondents at the prospect of a drop in quality as a result of falling waterfront coverage by the sell-side – recent surveys suggest that analyst research budgets could fall by as much as 20% to 30%. Others were worried about higher costs, greater fragmentation or detriment to the trading of small-cap equities.
13 Risk and regulation in a digitalised world A survey for UK asset managers
Respondents indicated a variety of responses, with 24% of firms yet to make a final decision at the time of writing (half the 2015 figure) and some yet to commit fully:
► Zero option – the firm generates its own research or the investment style does not depend on research (firm operates as hedge fund, LDI-only firm, etc) – 10% of firms
► Pay hard – establishing the appropriate account and administration arrangements, and paying from the firm’s bottom line accordingly (suits firms with a highly focused investment strategy or those concerned about the direction of travel of holding client money) – 23% of firms
► Establish research payment accounts (RPAs) for each client – setting up the appropriate account and administration arrangements to focus on drawing research from a smaller universe of brokers/providers from firms mindful of the opportunity costs to the balance sheet of ‘paying hard’ – 17% of firms
90%
80%
70%
60%
50%
40%
30%
20%
10%
0%
Non-centralised dealing desk
SYSC for NEQ-like products
Pre-trade warnings to restrict trading
Non-standard settlement cycles
Changes to order routing and RFQ
Systems and Controls (SYSC) for EQ-like products
Post-trade reviews
Cancelled and amended trades
LTA fairness
Changes in platforms, eg, OTFs and SIs
Applying new actionable indication of interest (AIOI) and RFQ tagging
90%
80%
70%
60%
50%
40%
30%
20%
10%
0%
Revising desk procedures
Handling client-specific instructions
Broker classification and selection factors
Revising procedures regarding algorithms
Monitoring and conducting TCA
Revising factors and factor weights
Supplying top five execution venues
Specifying circumstances and single venue
Revising procedures regarding dark pools
Consolidating market data (comparability)
Audit trails and record keeping
► Outsourced RPAs – firms exploring whether other institutions, such as asset servicers or agency brokers, will follow the path of Instinet, which announced its application in March 2015 as a payment institution with the FCA – see RPAs above
► ►Retain/expand commission sharing accounts (CSAs) – asset managers preferring to ‘wait and see’ whether NCAs such as the FCA would allow ‘enhanced CSA’ arrangements once the measures are transposed – 26% of firms
Firms’ preparations to boost market surveillance and prevent unauthorised trading (UT) were growing themes in 2016, as was the need to make optimum use of dealing screen real estate. Given that the MAR took effect on 3 July 2016, there was an unsurprisingly strong focus on market abuse prevention (defined in MAR 596/2014 Annex 1). Areas of relative weakness concerned the specification of MAR Art 3(1)(35) recommendations, the tracking of unstructured data, provision of front-office analytics (particularly for fixed
Figure 9: Expectations on challenges with front-office procedures and best execution procedures in terms of preparing for MiFID II
14Survey findings
income trading), the issue of suspicious tracking of order reports (STOR), and the use of tools to monitor and track behaviours (particularly for voice trades).
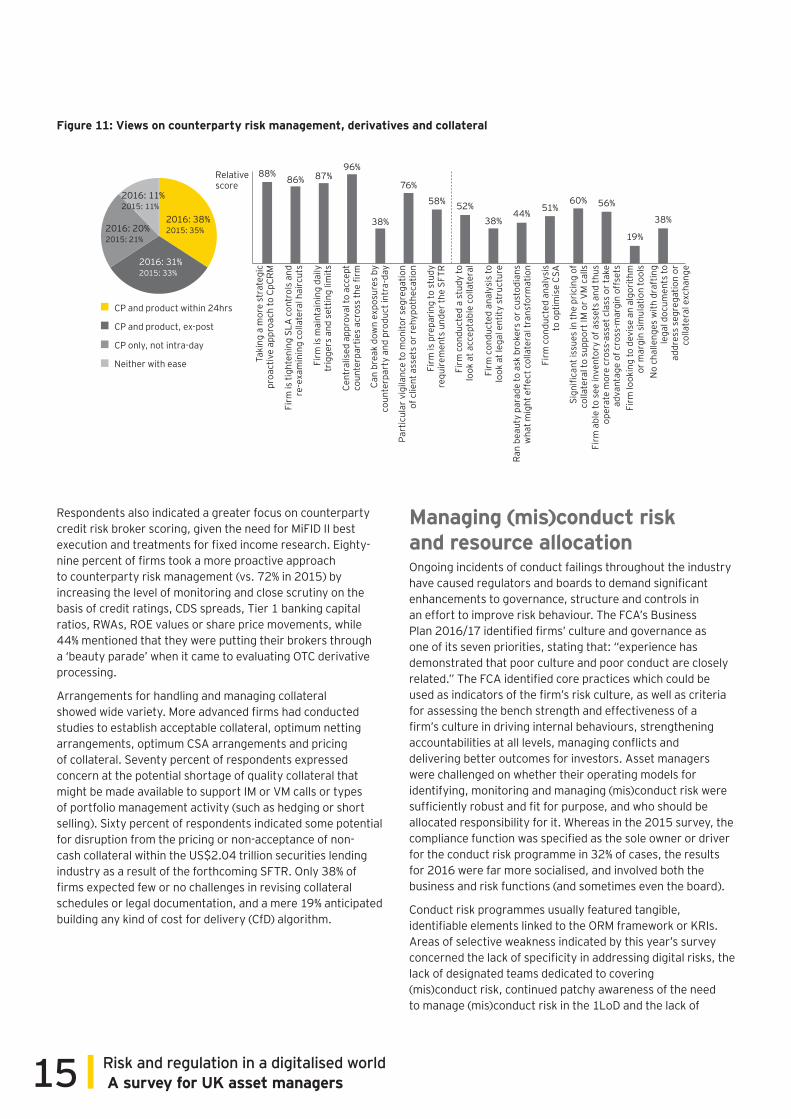
Counterparty risk and collateralThe robust management of counterparty credit risk continued to be an important consideration for CROs during 2016. Firms tightened their approvals processes, triggers and limit controls, given macroeconomic concerns associated with QE, China and Brexit impacting the adequate functioning of the global bond markets or liquidity retraction for certain OTC derivatives. Of the respondents, 38% claimed that their firm could break down counterparty risk exposures (by counterparty, product or fund structure) within 24 hours of a significant incident developing (such as the failure of a major counterparty broker or dealer, a market failure or other source of systemic risk).
Not all firms were extensive users of OTC derivatives, but respondents were aware of the regulatory trifurcations on
account of the desire of regulators to apply appropriate risk weights behind CCP-cleared derivatives, non-CCP cleared derivatives and derivatives not eligible for clearing. Concerns about liquidity retraction caused by CRD IV NSFR and the FRTB were widespread, particularly among firms operating LDI models, translating into worries about adequate levels of liquidity in the bond and swap markets (eg, IRS and inflation swaps) or the need to hold extra cash, or cash instruments, to cover IM and VM. The pricing of FX swaps, forwards and options was a major concern in 2016.
Several respondents remained relatively under-informed on which CCPs were being authorised (and when, where and how), how to tackle client clearing, how to apply ISDA-standardised initial margin models (SIMMs) or how to optimise their risk capital. Respondents were sensitive to what the regulators in Europe and the US were trying to achieve in terms of CCPs (taking effect from June 2016), or the evaluation of initial or variation margining for uncleared derivatives (taking effect from February 2017). Only 30% of firms fully anticipated the likely challenges in collecting IM or VM by T+1.
Focus on the target Investor during product design
Focus on suitability or appropriateness testing and
likely repapering under MiFID II
Focus on product manufacturer
scorecards
Focus on product distributor
arrangements
Focus on fees and charges (and pricing of
the same)Focus on stock
lending and TTCAs
Focus on inducements and retrocessions — independent
and non-independent
Focus on Inducements or Retrocessions — Country
Focus on EQ or NEQ research with respect to FCA or MiFID II:
► Not needed ► Pay hard ► RPA ► Enhanced CSA ► Don’t know
Focus on best execution (eg, expect to revisit policies?)
Investment recommendations
in line with the expectations of MAR
Establishing and running a register to monitor and record conflicts of interest
Installing or running surveillance to prevent, detect, investigate and
backtest market abuses
Surveillance policies and procedures around chat rooms, permissions and
social relationship maps
Independent 2LoD surveillance as per the FCA’s MW50
Risk radars deployed to carry out risk determinations pre-trade (eg, for UT or emergent
market risks?)
Invested front-office analytics for order-driven markets
Invested front-office analytics for quote-driven markets
Can compile and file STOR (suspicious transaction and
order) reports
Ready business case to satisfy MAR or NCA oversight in
terms of cost effectiveness
No challenges with applying market abuse preventions
extra-territorially100%
90%80%70%60%50%40%30%20%10%
0%
Figure 10: Focus on investor protection measures concerning MiFID II and MAR requirements (grey line indicates 2015 ratings)
Alert radars offering single view of order/
trade data and metadata (whether digital, email, voice or unstructured
data)
15 Risk and regulation in a digitalised world A survey for UK asset managers
Respondents also indicated a greater focus on counterparty credit risk broker scoring, given the need for MiFID II best execution and treatments for fixed income research. Eighty-nine percent of firms took a more proactive approach to counterparty risk management (vs. 72% in 2015) by increasing the level of monitoring and close scrutiny on the basis of credit ratings, CDS spreads, Tier 1 banking capital ratios, RWAs, ROE values or share price movements, while 44% mentioned that they were putting their brokers through a ‘beauty parade’ when it came to evaluating OTC derivative processing.
Arrangements for handling and managing collateral showed wide variety. More advanced firms had conducted studies to establish acceptable collateral, optimum netting arrangements, optimum CSA arrangements and pricing of collateral. Seventy percent of respondents expressed concern at the potential shortage of quality collateral that might be made available to support IM or VM calls or types of portfolio management activity (such as hedging or short selling). Sixty percent of respondents indicated some potential for disruption from the pricing or non-acceptance of non-cash collateral within the US$2.04 trillion securities lending industry as a result of the forthcoming SFTR. Only 38% of firms expected few or no challenges in revising collateral schedules or legal documentation, and a mere 19% anticipated building any kind of cost for delivery (CfD) algorithm.
2016: 38% 2015: 35%2016: 20%
2015: 21%
2016: 11% 2015: 11%
2016: 31% 2015: 33%
CP and product within 24hrs
CP and product, ex-post
CP only, not intra-day
Neither with ease
Relative score
Taki
ng a
mor
e st
rate
gic
proa
ctiv
e ap
proa
ch to
CpC
RM
Firm
is ti
ghte
ning
SLA
con
trol
s an
d re
-exa
min
ing
colla
tera
l hai
rcut
s
Firm
is m
aint
aini
ng d
aily
tr
igge
rs a
nd s
ettin
g lim
its
Cent
ralis
ed a
ppro
val t
o ac
cept
co
unte
rpar
ties
acro
ss th
e fir
m
Can
brea
k do
wn
expo
sure
s by
co
unte
rpar
ty a
nd p
rodu
ct in
tra-
day
Part
icul
ar v
igila
nce
to m
onito
r seg
rega
tion
of c
lient
ass
ets
or re
hypo
thec
atio
n
Firm
is p
repa
ring
to s
tudy
re
quire
men
ts u
nder
the
SFTR
Firm
con
duct
ed a
stu
dy to
lo
ok a
t acc
epta
ble
colla
tera
l
Firm
con
duct
ed a
naly
sis
to
look
at l
egal
ent
ity s
truc
ture
Ran
beau
ty p
arad
e to
ask
bro
kers
or c
usto
dian
s w
hat m
ight
eff
ect c
olla
tera
l tra
nsfo
rmat
ion
Firm
con
duct
ed a
naly
sis
to o
ptim
ise
CSA
Sign
ifica
nt is
sues
in th
e pr
icin
g of
co
llate
ral t
o su
ppor
t IM
or V
M c
alls
Firm
abl
e to
see
inve
ntor
y of
ass
ets
and
thus
op
erat
e m
ore
cros
s-as
set c
lass
or t
ake
adva
ntag
e of
cro
ss-m
argi
n of
fset
sFi
rm lo
okin
g to
dev
ise
an a
lgor
ithm
or
mar
gin
sim
ulat
ion
tool
sN
o ch
alle
nges
with
dra
ftin
g le
gal d
ocum
ents
to
addr
ess
segr
egat
ion
or
colla
tera
l exc
hang
e
88%86% 87%
96%
38%
76%
58% 52%38%
44% 51%60% 56%
19%
38%
Figure 11: Views on counterparty risk management, derivatives and collateral
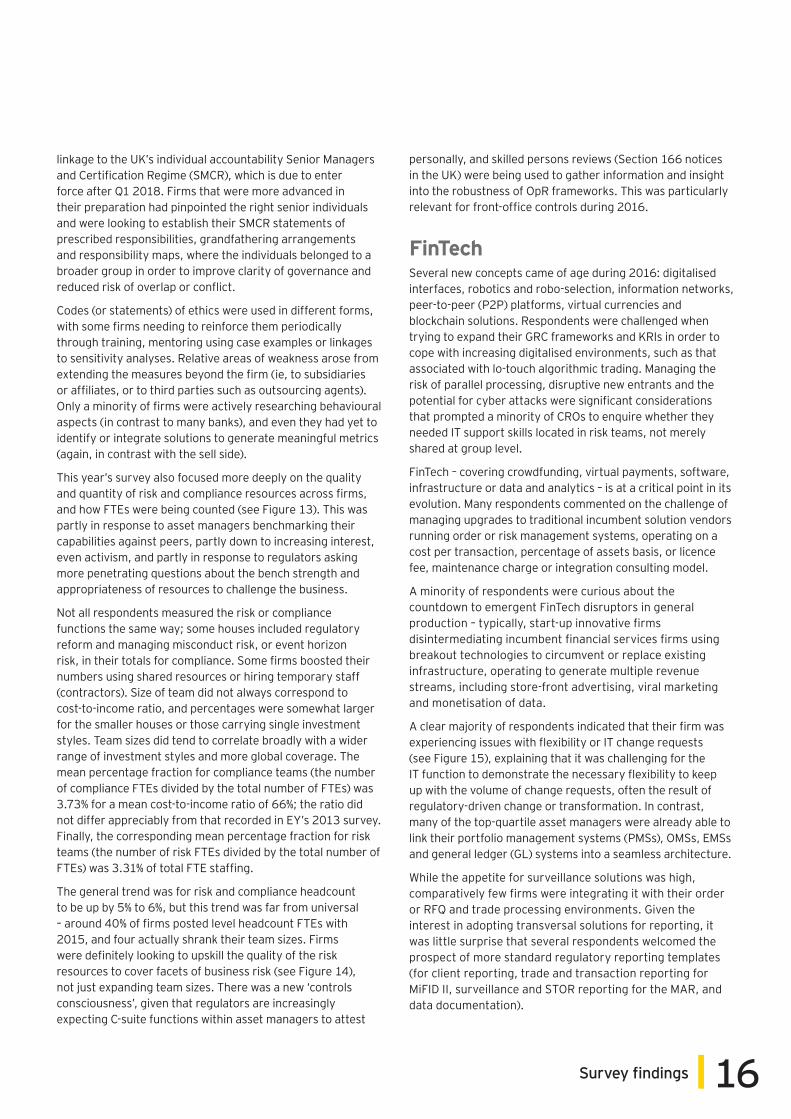
Managing (mis)conduct risk and resource allocationOngoing incidents of conduct failings throughout the industry have caused regulators and boards to demand significant enhancements to governance, structure and controls in an effort to improve risk behaviour. The FCA’s Business Plan 2016/17 identified firms’ culture and governance as one of its seven priorities, stating that: “experience has demonstrated that poor culture and poor conduct are closely related.” The FCA identified core practices which could be used as indicators of the firm’s risk culture, as well as criteria for assessing the bench strength and effectiveness of a firm’s culture in driving internal behaviours, strengthening accountabilities at all levels, managing conflicts and delivering better outcomes for investors. Asset managers were challenged on whether their operating models for identifying, monitoring and managing (mis)conduct risk were sufficiently robust and fit for purpose, and who should be allocated responsibility for it. Whereas in the 2015 survey, the compliance function was specified as the sole owner or driver for the conduct risk programme in 32% of cases, the results for 2016 were far more socialised, and involved both the business and risk functions (and sometimes even the board).
Conduct risk programmes usually featured tangible, identifiable elements linked to the ORM framework or KRIs. Areas of selective weakness indicated by this year’s survey concerned the lack of specificity in addressing digital risks, the lack of designated teams dedicated to covering (mis)conduct risk, continued patchy awareness of the need to manage (mis)conduct risk in the 1LoD and the lack of
16Survey findings
linkage to the UK’s individual accountability Senior Managers and Certification Regime (SMCR), which is due to enter force after Q1 2018. Firms that were more advanced in their preparation had pinpointed the right senior individuals and were looking to establish their SMCR statements of prescribed responsibilities, grandfathering arrangements and responsibility maps, where the individuals belonged to a broader group in order to improve clarity of governance and reduced risk of overlap or conflict.
Codes (or statements) of ethics were used in different forms, with some firms needing to reinforce them periodically through training, mentoring using case examples or linkages to sensitivity analyses. Relative areas of weakness arose from extending the measures beyond the firm (ie, to subsidiaries or affiliates, or to third parties such as outsourcing agents). Only a minority of firms were actively researching behavioural aspects (in contrast to many banks), and even they had yet to identify or integrate solutions to generate meaningful metrics (again, in contrast with the sell side).
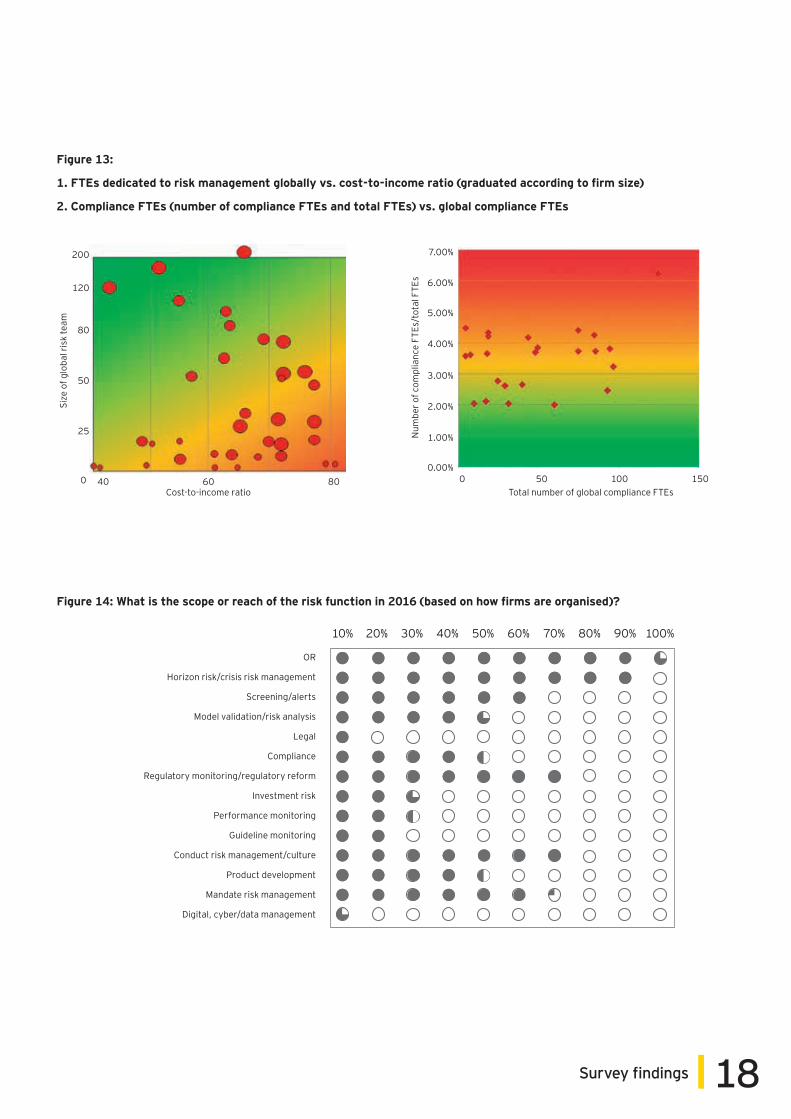
This year’s survey also focused more deeply on the quality and quantity of risk and compliance resources across firms, and how FTEs were being counted (see Figure 13). This was partly in response to asset managers benchmarking their capabilities against peers, partly down to increasing interest, even activism, and partly in response to regulators asking more penetrating questions about the bench strength and appropriateness of resources to challenge the business.
Not all respondents measured the risk or compliance functions the same way; some houses included regulatory reform and managing misconduct risk, or event horizon risk, in their totals for compliance. Some firms boosted their numbers using shared resources or hiring temporary staff (contractors). Size of team did not always correspond to cost-to-income ratio, and percentages were somewhat larger for the smaller houses or those carrying single investment styles. Team sizes did tend to correlate broadly with a wider range of investment styles and more global coverage. The mean percentage fraction for compliance teams (the number of compliance FTEs divided by the total number of FTEs) was 3.73% for a mean cost-to-income ratio of 66%; the ratio did not differ appreciably from that recorded in EY’s 2013 survey. Finally, the corresponding mean percentage fraction for risk teams (the number of risk FTEs divided by the total number of FTEs) was 3.31% of total FTE staffing.
The general trend was for risk and compliance headcount to be up by 5% to 6%, but this trend was far from universal – around 40% of firms posted level headcount FTEs with 2015, and four actually shrank their team sizes. Firms were definitely looking to upskill the quality of the risk resources to cover facets of business risk (see Figure 14), not just expanding team sizes. There was a new ‘controls consciousness’, given that regulators are increasingly expecting C-suite functions within asset managers to attest
personally, and skilled persons reviews (Section 166 notices in the UK) were being used to gather information and insight into the robustness of OpR frameworks. This was particularly relevant for front-office controls during 2016.
FinTechSeveral new concepts came of age during 2016: digitalised interfaces, robotics and robo-selection, information networks, peer-to-peer (P2P) platforms, virtual currencies and blockchain solutions. Respondents were challenged when trying to expand their GRC frameworks and KRIs in order to cope with increasing digitalised environments, such as that associated with lo-touch algorithmic trading. Managing the risk of parallel processing, disruptive new entrants and the potential for cyber attacks were significant considerations that prompted a minority of CROs to enquire whether they needed IT support skills located in risk teams, not merely shared at group level.
FinTech – covering crowdfunding, virtual payments, software, infrastructure or data and analytics – is at a critical point in its evolution. Many respondents commented on the challenge of managing upgrades to traditional incumbent solution vendors running order or risk management systems, operating on a cost per transaction, percentage of assets basis, or licence fee, maintenance charge or integration consulting model.
A minority of respondents were curious about the countdown to emergent FinTech disruptors in general production – typically, start-up innovative firms disintermediating incumbent financial services firms using breakout technologies to circumvent or replace existing infrastructure, operating to generate multiple revenue streams, including store-front advertising, viral marketing and monetisation of data.
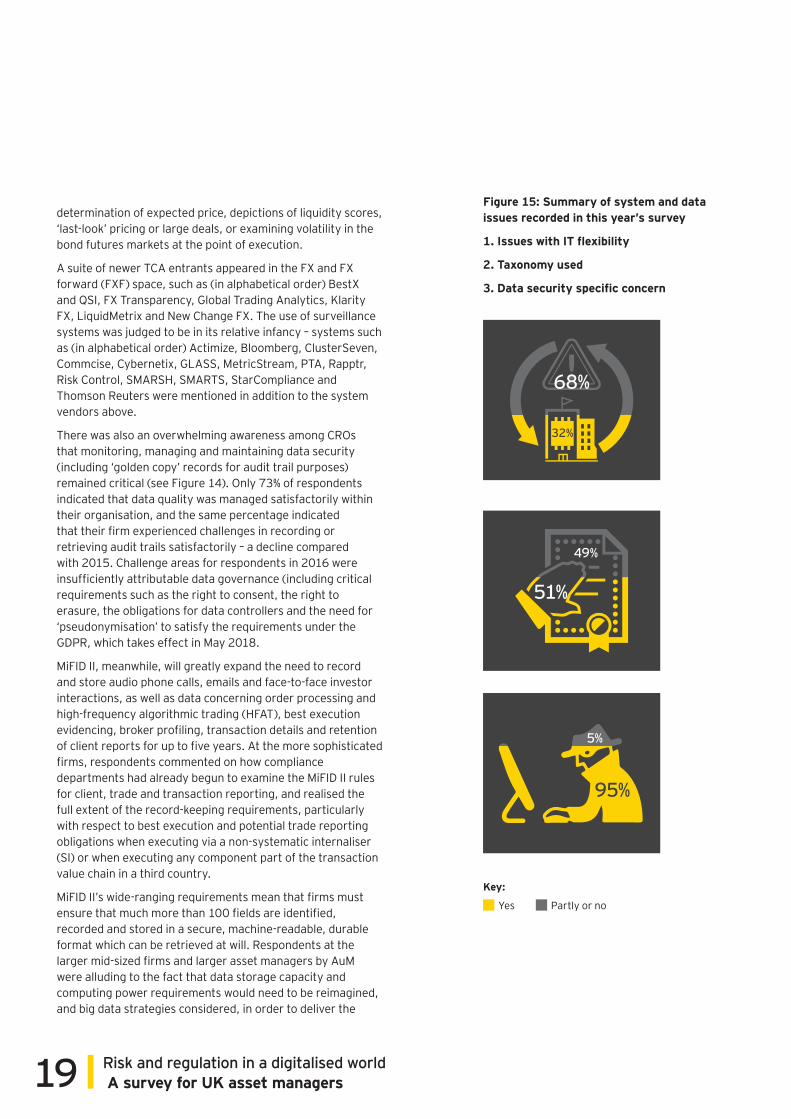
A clear majority of respondents indicated that their firm was experiencing issues with flexibility or IT change requests (see Figure 15), explaining that it was challenging for the IT function to demonstrate the necessary flexibility to keep up with the volume of change requests, often the result of regulatory-driven change or transformation. In contrast, many of the top-quartile asset managers were already able to link their portfolio management systems (PMSs), OMSs, EMSs and general ledger (GL) systems into a seamless architecture.
While the appetite for surveillance solutions was high, comparatively few firms were integrating it with their order or RFQ and trade processing environments. Given the interest in adopting transversal solutions for reporting, it was little surprise that several respondents welcomed the prospect of more standard regulatory reporting templates (for client reporting, trade and transaction reporting for MiFID II, surveillance and STOR reporting for the MAR, and data documentation).
17 Risk and regulation in a digitalised world A survey for UK asset managers
When it came to systems, data acquisition, processing and analytics were the main focus in 2016. Firms were concentrating on the acquisition, processing, storage, retrieval and auditing of structured and unstructured data – with quality data at an entry level generating quality information which, in turn, would generate quality insights and decision-making. There was progress in 51% of firms that showed evidence of developing quality taxonomies to cover market, reference and metadata needs when specifying legal entity identifiers (LEIs), instrument data and personal (identity) data to meet prescriptive regulatory reporting requirements. However, it was clear how many firms found it a challenge to collect the requisite data sets to cope with continual upgrades to reporting (client, trade and transactions) and to upgrade front-office analytics, data retrieval routines, documentation and audit trails for evidencing. This feature is expected to continue well into 2017 and possibly beyond.
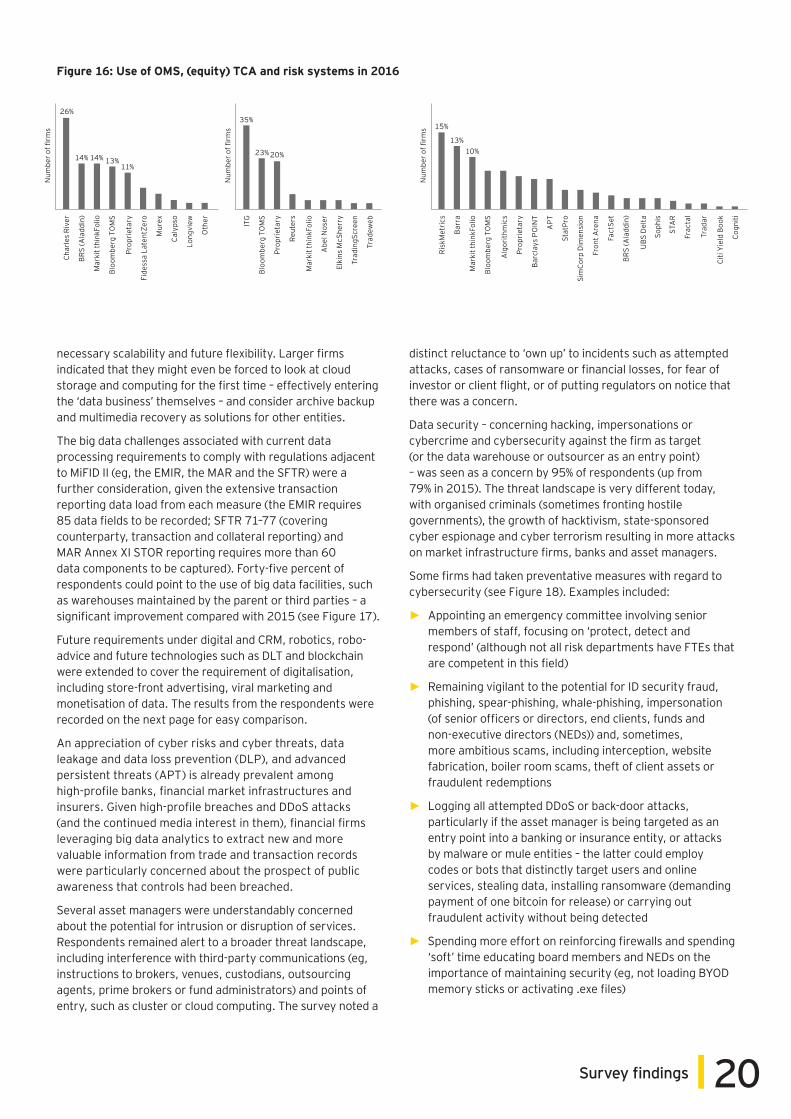
There was significant variation in the usage of third-party risk and reconciliation management systems, with considerable system fragmentation and duplication in evidence, particularly in business lines. It was not uncommon to see multiple systems used in the same firm. System usage was fragmented, with upward of 200 instances of OMSs, TCA, PMSs and investment risk applications in use among the
respondents (not counting FinTech start-up suppliers); many of the smaller firms were using proprietary systems (or even spreadsheets) for PMSs. The pattern of usage of OMSs – sometimes augmented by EMSs – and risk management systems was similar to that recorded in 2015 (see Figure 16). There was also a significant expansion in the use of algorithms.
The key difference was the specific focus on TCA and surveillance systems, partly brought about by the need to support firms complying with MiFID II’s best execution measures or the MAR. Respondents commented that TCA was not necessarily an explicit requirement from MiFID II, but it could be seen as a valuable tool for identifying suspicious trades or screening behaviours on the desk – not merely adding value in terms of dealing, but compliance too.
The usage of TCA was most mature when examining order reversion for equities (implicit costs, eg, market impact and opportunity costs) and, to some degree, spot FX. It was rather less mature in the case of futures and commodities. Usage of TCA was nascent in addressing price evidencing and analysis by the various categories of fixed income – especially non-investment grade corporate debt, high-yield debt or emerging market debt – and unquoted securities. Examples of embryonic approaches to fixed income TCA included
Reference marker all firms
Risk is involved in the oversight of conduct risk
Consistency between risk appetite, organisational culture and employee
behaviour as a key driver
Conduct risk has tangible, identifiable elements (eg, target market assessment,
product design, distribution, and infrastructure)
Conduct risk has specific elements linked to digital risks
Dedicated conduct risk team identified and tasked, with full understanding of
FCA approachFirm focused on the process of changing
its culture
TCF framework being used as basis for
evaluating conduct risk
Report culture is an area of ‘work in progress’
There is a centre of excellence and code of ethics (CoE) ‘owner’
in your firm
Owner has linkage to key committees eg, ExCo, risk,
audit, governance and controls
Conduct risk team in the 1LoD (as well as 2LoD aggregation
and reporting)
Firm links managing conduct risk to individual accountability (eg, FCA’s senior
manager regime)100%
90%80%70%60%50%40%30%20%10%
0%
100%90%80%70%60%50%40%30%20%10%
0%
Reference marker all firms CoE and SoE linked to control framework;
critical management and CF staff identified in that framework?
CoE and SoE sensitivity analysis of effectiveness carried out?
CoE and SoE risk appetite linked to remuneration?
CoE and SoE extends beyond the firm, ie, to subsidiaries, affiliates,
branches and agents?
CoE and SoE extends to third parties, ie, to sub-contractual agents or outsourcing parties?
CoE and SoE communicated and reinforced periodically by means of training?
New professional employees signed up and appraised according to the values
and behaviours?
All professionals mentored according to the values and behaviours stated in
the CoE and SoE?
ORM Framework used to identify, assess, monitor, manage and
review CdR?
Metrics such as RCSA, Loss Event Register, KRIs and KPIs, and Complaints used to support CdR?
Firm is advanced in researching the behavioural aspects eg, MoralDNA?
Firm has applied solutions to monitor the behavioural aspects to areas such as trade surveillance?
Figure 12: Criteria that were used to inform management of conduct risk
18Survey findings
0
25
50
80
120
200
60 Cost-to-income ratio
Size
of g
loba
l ris
k te
am
80 00.00%
1.00%
2.00%
3.00%
4.00%
5.00%
6.00%
7.00%
50 100 150Total number of global compliance FTEs
Num
ber o
f com
plia
nce
FTEs
/tot
al F
TEs
OR
Horizon risk/crisis risk management
Screening/alerts
Model validation/risk analysis
Legal
Compliance
Regulatory monitoring/regulatory reform
Investment risk
Performance monitoring
Guideline monitoring
Conduct risk management/culture
Product development
Mandate risk management
Digital, cyber/data management
10% 20% 30% 40% 50% 60% 70% 80% 90% 100%
Figure 13:
1. FTEs dedicated to risk management globally vs. cost-to-income ratio (graduated according to firm size)
2. Compliance FTEs (number of compliance FTEs and total FTEs) vs. global compliance FTEs
Figure 14: What is the scope or reach of the risk function in 2016 (based on how firms are organised)?
40
19 Risk and regulation in a digitalised world A survey for UK asset managers
determination of expected price, depictions of liquidity scores, ‘last-look’ pricing or large deals, or examining volatility in the bond futures markets at the point of execution.
A suite of newer TCA entrants appeared in the FX and FX forward (FXF) space, such as (in alphabetical order) BestX and QSI, FX Transparency, Global Trading Analytics, Klarity FX, LiquidMetrix and New Change FX. The use of surveillance systems was judged to be in its relative infancy – systems such as (in alphabetical order) Actimize, Bloomberg, ClusterSeven, Commcise, Cybernetix, GLASS, MetricStream, PTA, Rapptr, Risk Control, SMARSH, SMARTS, StarCompliance and Thomson Reuters were mentioned in addition to the system vendors above.
There was also an overwhelming awareness among CROs that monitoring, managing and maintaining data security (including ‘golden copy’ records for audit trail purposes) remained critical (see Figure 14). Only 73% of respondents indicated that data quality was managed satisfactorily within their organisation, and the same percentage indicated that their firm experienced challenges in recording or retrieving audit trails satisfactorily – a decline compared with 2015. Challenge areas for respondents in 2016 were insufficiently attributable data governance (including critical requirements such as the right to consent, the right to erasure, the obligations for data controllers and the need for ‘pseudonymisation’ to satisfy the requirements under the GDPR, which takes effect in May 2018.
MiFID II, meanwhile, will greatly expand the need to record and store audio phone calls, emails and face-to-face investor interactions, as well as data concerning order processing and high-frequency algorithmic trading (HFAT), best execution evidencing, broker profiling, transaction details and retention of client reports for up to five years. At the more sophisticated firms, respondents commented on how compliance departments had already begun to examine the MiFID II rules for client, trade and transaction reporting, and realised the full extent of the record-keeping requirements, particularly with respect to best execution and potential trade reporting obligations when executing via a non-systematic internaliser (SI) or when executing any component part of the transaction value chain in a third country.
MiFID II’s wide-ranging requirements mean that firms must ensure that much more than 100 fields are identified, recorded and stored in a secure, machine-readable, durable format which can be retrieved at will. Respondents at the larger mid-sized firms and larger asset managers by AuM were alluding to the fact that data storage capacity and computing power requirements would need to be reimagined, and big data strategies considered, in order to deliver the
49%
51%
5%
95%
68%
32%
Key:
Yes Partly or no
Figure 15: Summary of system and data issues recorded in this year’s survey
1. Issues with IT flexibility
2. Taxonomy used
3. Data security specific concern
20Survey findings
necessary scalability and future flexibility. Larger firms indicated that they might even be forced to look at cloud storage and computing for the first time – effectively entering the ‘data business’ themselves – and consider archive backup and multimedia recovery as solutions for other entities.
The big data challenges associated with current data processing requirements to comply with regulations adjacent to MiFID II (eg, the EMIR, the MAR and the SFTR) were a further consideration, given the extensive transaction reporting data load from each measure (the EMIR requires 85 data fields to be recorded; SFTR 71–77 (covering counterparty, transaction and collateral reporting) and MAR Annex XI STOR reporting requires more than 60 data components to be captured). Forty-five percent of respondents could point to the use of big data facilities, such as warehouses maintained by the parent or third parties – a significant improvement compared with 2015 (see Figure 17).
Future requirements under digital and CRM, robotics, robo-advice and future technologies such as DLT and blockchain were extended to cover the requirement of digitalisation, including store-front advertising, viral marketing and monetisation of data. The results from the respondents were recorded on the next page for easy comparison.
An appreciation of cyber risks and cyber threats, data leakage and data loss prevention (DLP), and advanced persistent threats (APT) is already prevalent among high-profile banks, financial market infrastructures and insurers. Given high-profile breaches and DDoS attacks (and the continued media interest in them), financial firms leveraging big data analytics to extract new and more valuable information from trade and transaction records were particularly concerned about the prospect of public awareness that controls had been breached.
Several asset managers were understandably concerned about the potential for intrusion or disruption of services. Respondents remained alert to a broader threat landscape, including interference with third-party communications (eg, instructions to brokers, venues, custodians, outsourcing agents, prime brokers or fund administrators) and points of entry, such as cluster or cloud computing. The survey noted a
distinct reluctance to ‘own up’ to incidents such as attempted attacks, cases of ransomware or financial losses, for fear of investor or client flight, or of putting regulators on notice that there was a concern.
Data security – concerning hacking, impersonations or cybercrime and cybersecurity against the firm as target (or the data warehouse or outsourcer as an entry point) – was seen as a concern by 95% of respondents (up from 79% in 2015). The threat landscape is very different today, with organised criminals (sometimes fronting hostile governments), the growth of hacktivism, state-sponsored cyber espionage and cyber terrorism resulting in more attacks on market infrastructure firms, banks and asset managers.
Some firms had taken preventative measures with regard to cybersecurity (see Figure 18). Examples included:
► Appointing an emergency committee involving senior members of staff, focusing on ‘protect, detect and respond’ (although not all risk departments have FTEs that are competent in this field)
► Remaining vigilant to the potential for ID security fraud, phishing, spear-phishing, whale-phishing, impersonation (of senior officers or directors, end clients, funds and non-executive directors (NEDs)) and, sometimes, more ambitious scams, including interception, website fabrication, boiler room scams, theft of client assets or fraudulent redemptions
► Logging all attempted DDoS or back-door attacks, particularly if the asset manager is being targeted as an entry point into a banking or insurance entity, or attacks by malware or mule entities – the latter could employ codes or bots that distinctly target users and online services, stealing data, installing ransomware (demanding payment of one bitcoin for release) or carrying out fraudulent activity without being detected
► ►Spending more effort on reinforcing firewalls and spending ‘soft’ time educating board members and NEDs on the importance of maintaining security (eg, not loading BYOD memory sticks or activating .exe files)
26%
14% 14% 13%11%
Num
ber o
f firm
s
Char
les
Rive
r
BRS
(Ala
ddin
)
Mar
kit t
hink
Folio
Bloo
mbe
rg T
OM
S
Prop
riet
ary
Fide
ssa
Late
ntZe
ro
Mur
ex
Caly
pso
Long
view
Oth
er
35%
23% 20%
Num
ber o
f firm
s
ITG
Bloo
mbe
rg T
OM
S
Prop
riet
ary
Reut
ers
Mar
kit t
hink
Folio
Abe
l Nos
er
Elki
ns M
cShe
rry
Trad
ingS
cree
n
Trad
eweb
15%
13%10%
Num
ber o
f firm
s
Risk
Met
rics
Barr
a
Mar
kit t
hink
Folio
Bloo
mbe
rg T
OM
S
Alg
orith
mic
s
Prop
riet
ary
Barc
lays
PO
INT
APT
Stat
Pro
Sim
Corp
Dim
ensi
on
Fron
t Are
na
Fact
Set
BRS
(Ala
ddin
)
UBS
Del
ta
Soph
is
STA
R
Frac
tal
Trad
ar
Citi
Yie
ld B
ook
Cogn
iti
Figure 16: Use of OMS, (equity) TCA and risk systems in 2016
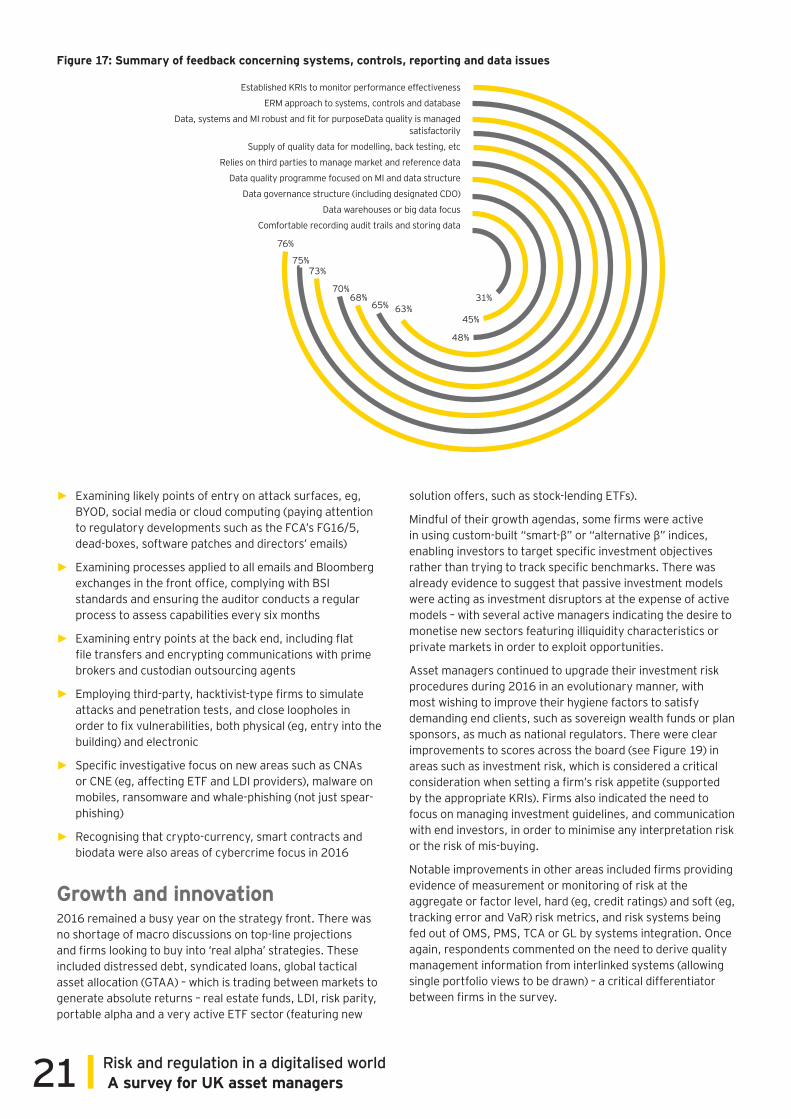
21 Risk and regulation in a digitalised world A survey for UK asset managers
► Examining likely points of entry on attack surfaces, eg, BYOD, social media or cloud computing (paying attention to regulatory developments such as the FCA’s FG16/5, dead-boxes, software patches and directors’ emails)
► Examining processes applied to all emails and Bloomberg exchanges in the front office, complying with BSI standards and ensuring the auditor conducts a regular process to assess capabilities every six months
► Examining entry points at the back end, including flat file transfers and encrypting communications with prime brokers and custodian outsourcing agents
► Employing third-party, hacktivist-type firms to simulate attacks and penetration tests, and close loopholes in order to fix vulnerabilities, both physical (eg, entry into the building) and electronic
► Specific investigative focus on new areas such as CNAs or CNE (eg, affecting ETF and LDI providers), malware on mobiles, ransomware and whale-phishing (not just spear-phishing)
► Recognising that crypto-currency, smart contracts and biodata were also areas of cybercrime focus in 2016
Growth and innovation2016 remained a busy year on the strategy front. There was no shortage of macro discussions on top-line projections and firms looking to buy into ‘real alpha’ strategies. These included distressed debt, syndicated loans, global tactical asset allocation (GTAA) – which is trading between markets to generate absolute returns – real estate funds, LDI, risk parity, portable alpha and a very active ETF sector (featuring new
solution offers, such as stock-lending ETFs).
Mindful of their growth agendas, some firms were active in using custom-built “smart-β” or “alternative β” indices, enabling investors to target specific investment objectives rather than trying to track specific benchmarks. There was already evidence to suggest that passive investment models were acting as investment disruptors at the expense of active models – with several active managers indicating the desire to monetise new sectors featuring illiquidity characteristics or private markets in order to exploit opportunities.
Asset managers continued to upgrade their investment risk procedures during 2016 in an evolutionary manner, with most wishing to improve their hygiene factors to satisfy demanding end clients, such as sovereign wealth funds or plan sponsors, as much as national regulators. There were clear improvements to scores across the board (see Figure 19) in areas such as investment risk, which is considered a critical consideration when setting a firm’s risk appetite (supported by the appropriate KRIs). Firms also indicated the need to focus on managing investment guidelines, and communication with end investors, in order to minimise any interpretation risk or the risk of mis-buying.
Notable improvements in other areas included firms providing evidence of measurement or monitoring of risk at the aggregate or factor level, hard (eg, credit ratings) and soft (eg, tracking error and VaR) risk metrics, and risk systems being fed out of OMS, PMS, TCA or GL by systems integration. Once again, respondents commented on the need to derive quality management information from interlinked systems (allowing single portfolio views to be drawn) – a critical differentiator between firms in the survey.
Established KRIs to monitor performance effectiveness
ERM approach to systems, controls and database
Data, systems and MI robust and fit for purposeData quality is managed satisfactorily
Supply of quality data for modelling, back testing, etc
Relies on third parties to manage market and reference data
Data quality programme focused on MI and data structure
Data governance structure (including designated CDO)
Data warehouses or big data focus
Comfortable recording audit trails and storing data
76%
75%73%
70%68%
65% 63%
48%
45%
31%
Figure 17: Summary of feedback concerning systems, controls, reporting and data issues

22Survey findings
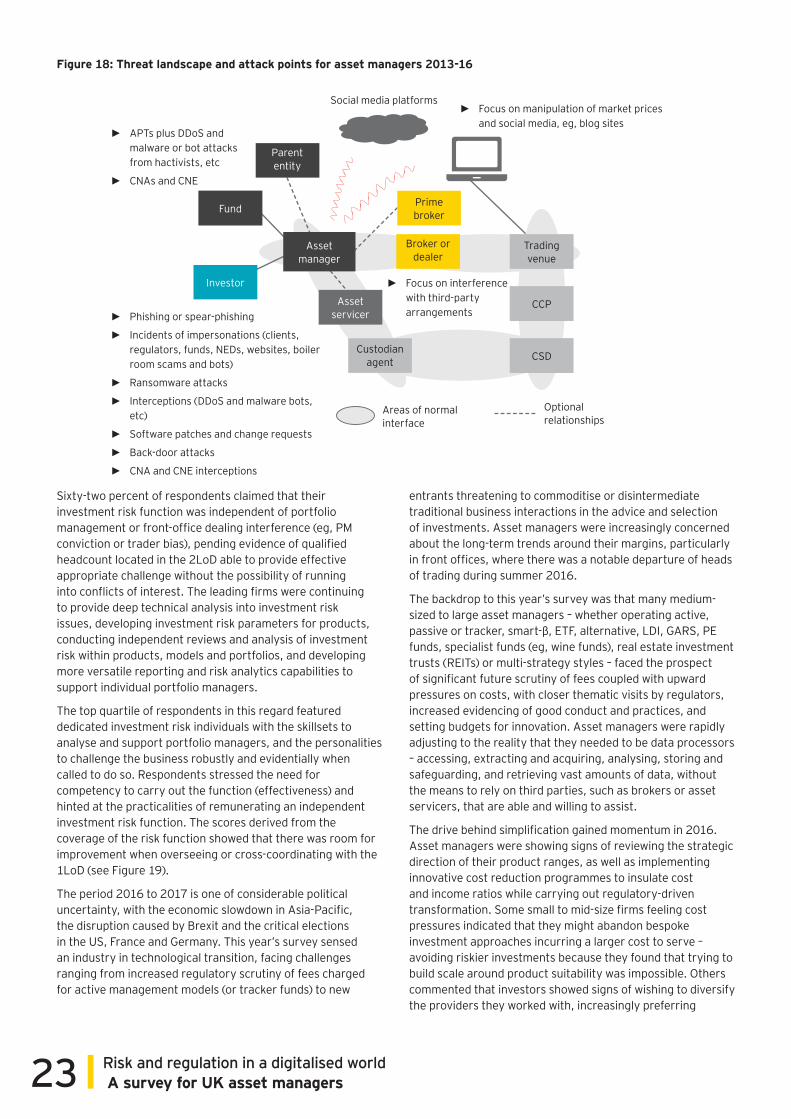
23 Risk and regulation in a digitalised world A survey for UK asset managers
Sixty-two percent of respondents claimed that their investment risk function was independent of portfolio management or front-office dealing interference (eg, PM conviction or trader bias), pending evidence of qualified headcount located in the 2LoD able to provide effective appropriate challenge without the possibility of running into conflicts of interest. The leading firms were continuing to provide deep technical analysis into investment risk issues, developing investment risk parameters for products, conducting independent reviews and analysis of investment risk within products, models and portfolios, and developing more versatile reporting and risk analytics capabilities to support individual portfolio managers.
The top quartile of respondents in this regard featured dedicated investment risk individuals with the skillsets to analyse and support portfolio managers, and the personalities to challenge the business robustly and evidentially when called to do so. Respondents stressed the need for competency to carry out the function (effectiveness) and hinted at the practicalities of remunerating an independent investment risk function. The scores derived from the coverage of the risk function showed that there was room for improvement when overseeing or cross-coordinating with the 1LoD (see Figure 19).
The period 2016 to 2017 is one of considerable political uncertainty, with the economic slowdown in Asia-Pacific, the disruption caused by Brexit and the critical elections in the US, France and Germany. This year’s survey sensed an industry in technological transition, facing challenges ranging from increased regulatory scrutiny of fees charged for active management models (or tracker funds) to new
entrants threatening to commoditise or disintermediate traditional business interactions in the advice and selection of investments. Asset managers were increasingly concerned about the long-term trends around their margins, particularly in front offices, where there was a notable departure of heads of trading during summer 2016.
The backdrop to this year’s survey was that many medium-sized to large asset managers – whether operating active, passive or tracker, smart-β, ETF, alternative, LDI, GARS, PE funds, specialist funds (eg, wine funds), real estate investment trusts (REITs) or multi-strategy styles – faced the prospect of significant future scrutiny of fees coupled with upward pressures on costs, with closer thematic visits by regulators, increased evidencing of good conduct and practices, and setting budgets for innovation. Asset managers were rapidly adjusting to the reality that they needed to be data processors – accessing, extracting and acquiring, analysing, storing and safeguarding, and retrieving vast amounts of data, without the means to rely on third parties, such as brokers or asset servicers, that are able and willing to assist.
The drive behind simplification gained momentum in 2016. Asset managers were showing signs of reviewing the strategic direction of their product ranges, as well as implementing innovative cost reduction programmes to insulate cost and income ratios while carrying out regulatory-driven transformation. Some small to mid-size firms feeling cost pressures indicated that they might abandon bespoke investment approaches incurring a larger cost to serve – avoiding riskier investments because they found that trying to build scale around product suitability was impossible. Others commented that investors showed signs of wishing to diversify the providers they worked with, increasingly preferring
► APTs plus DDoS and malware or bot attacks from hactivists, etc
► CNAs and CNE
► Focus on manipulation of market prices and social media, eg, blog sites
► Focus on interference with third-party arrangements ► Phishing or spear-phishing
► Incidents of impersonations (clients, regulators, funds, NEDs, websites, boiler room scams and bots)
► Ransomware attacks
► Interceptions (DDoS and malware bots, etc)
► Software patches and change requests
► Back-door attacks
► CNA and CNE interceptions
Broker or dealer
Trading venue
CCP
CSDCustodian
agent
Areas of normal interface
Optional relationships
Parent entity
Investor
Fund Prime broker
Asset servicer
Asset manager
Figure 18: Threat landscape and attack points for asset managers 2013-16
Social media platforms
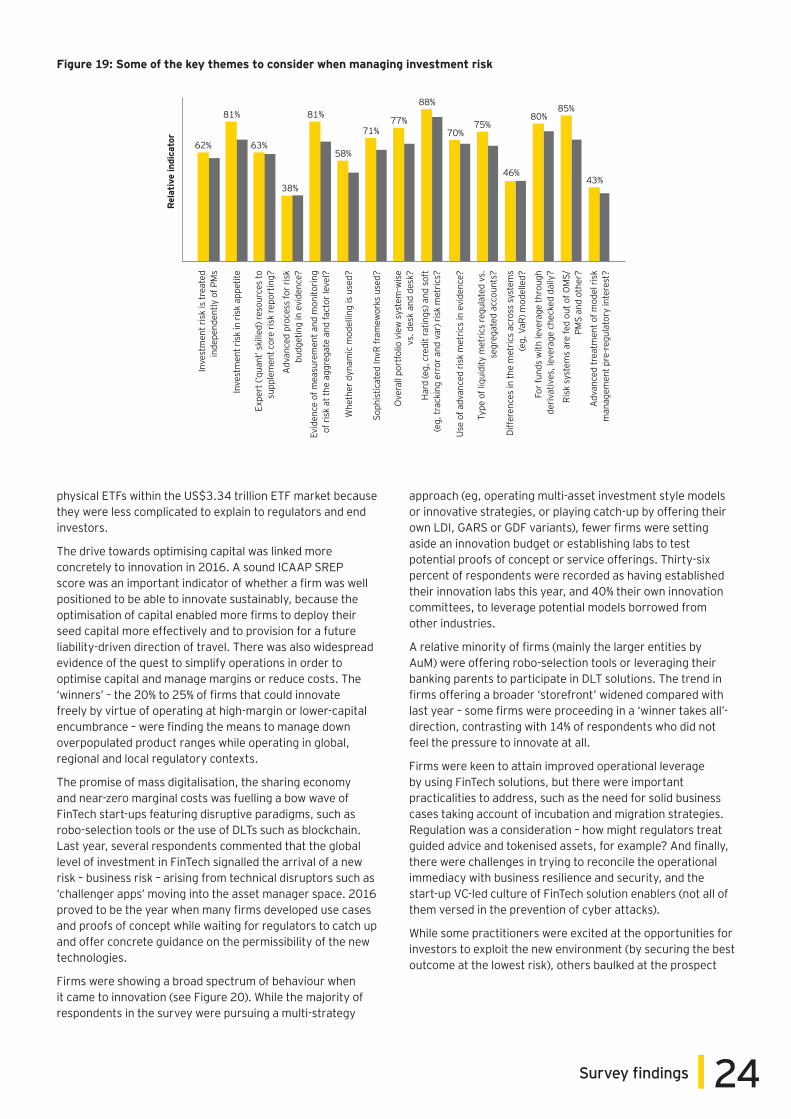
24Survey findings
physical ETFs within the US$3.34 trillion ETF market because they were less complicated to explain to regulators and end investors.
The drive towards optimising capital was linked more concretely to innovation in 2016. A sound ICAAP SREP score was an important indicator of whether a firm was well positioned to be able to innovate sustainably, because the optimisation of capital enabled more firms to deploy their seed capital more effectively and to provision for a future liability-driven direction of travel. There was also widespread evidence of the quest to simplify operations in order to optimise capital and manage margins or reduce costs. The ‘winners’ – the 20% to 25% of firms that could innovate freely by virtue of operating at high-margin or lower-capital encumbrance – were finding the means to manage down overpopulated product ranges while operating in global, regional and local regulatory contexts.
The promise of mass digitalisation, the sharing economy and near-zero marginal costs was fuelling a bow wave of FinTech start-ups featuring disruptive paradigms, such as robo-selection tools or the use of DLTs such as blockchain. Last year, several respondents commented that the global level of investment in FinTech signalled the arrival of a new risk – business risk – arising from technical disruptors such as ‘challenger apps’ moving into the asset manager space. 2016 proved to be the year when many firms developed use cases and proofs of concept while waiting for regulators to catch up and offer concrete guidance on the permissibility of the new technologies.
Firms were showing a broad spectrum of behaviour when it came to innovation (see Figure 20). While the majority of respondents in the survey were pursuing a multi-strategy
approach (eg, operating multi-asset investment style models or innovative strategies, or playing catch-up by offering their own LDI, GARS or GDF variants), fewer firms were setting aside an innovation budget or establishing labs to test potential proofs of concept or service offerings. Thirty-six percent of respondents were recorded as having established their innovation labs this year, and 40% their own innovation committees, to leverage potential models borrowed from other industries.
A relative minority of firms (mainly the larger entities by AuM) were offering robo-selection tools or leveraging their banking parents to participate in DLT solutions. The trend in firms offering a broader ‘storefront’ widened compared with last year – some firms were proceeding in a ‘winner takes all’- direction, contrasting with 14% of respondents who did not feel the pressure to innovate at all.
Firms were keen to attain improved operational leverage by using FinTech solutions, but there were important practicalities to address, such as the need for solid business cases taking account of incubation and migration strategies. Regulation was a consideration – how might regulators treat guided advice and tokenised assets, for example? And finally, there were challenges in trying to reconcile the operational immediacy with business resilience and security, and the start-up VC-led culture of FinTech solution enablers (not all of them versed in the prevention of cyber attacks).
While some practitioners were excited at the opportunities for investors to exploit the new environment (by securing the best outcome at the lowest risk), others baulked at the prospect
Inve
stm
ent r
isk
is tr
eate
d in
depe
nden
tly o
f PM
s
Rel
ativ
e in
dica
tor
62%
81%
63%
38%
81%
58%
71%77%
88%
70%75%
46%
80%85%
43%
Inve
stm
ent r
isk
in ri
sk a
ppet
ite
Expe
rt (‘
quan
t’ sk
illed
) res
ourc
es to
su
pple
men
t cor
e ris
k re
port
ing?
Adv
ance
d pr
oces
s fo
r ris
k bu
dget
ing
in e
vide
nce?
Evid
ence
of m
easu
rem
ent a
nd m
onito
ring
of ri
sk a
t the
agg
rega
te a
nd fa
ctor
leve
l?
Soph
istic
ated
InvR
fram
ewor
ks u
sed?
Whe
ther
dyn
amic
mod
ellin
g is
use
d?
Ove
rall
port
folio
vie
w s
yste
m-w
ise
vs. d
esk
and
desk
?H
ard
(eg,
cre
dit r
atin
gs) a
nd s
oft
(eg,
trac
king
err
or a
nd v
ar) r
isk
met
rics?
Use
of a
dvan
ced
risk
met
rics
in e
vide
nce?
Type
of l
iqui
dity
met
rics
regu
late
d vs
. se
greg
ated
acc
ount
s?
Diffe
renc
es in
the
met
rics
acro
ss s
yste
ms
(eg,
VaR
) mod
elle
d?
For f
unds
with
leve
rage
thro
ugh
deriv
ativ
es, l
ever
age
chec
ked
daily
?
Risk
sys
tem
s ar
e fe
d ou
t of O
MS/
PMS
and
othe
r?
Adv
ance
d tr
eatm
ent o
f mod
el ri
sk
man
agem
ent p
re-r
egul
ator
y in
tere
st?
Figure 19: Some of the key themes to consider when managing investment risk
25 Risk and regulation in a digitalised world A survey for UK asset managers
of significant Uber- or Airbnb-style disruptions of all the components of the asset management model through some of the emergent approaches borrowed from other industry sectors. There were three areas which were becoming distinct in terms of asset managers reimagining their business and operating models.
Use of robotics and algorithms
Situation – there was growing interest in the use of robotics in industries such as auto or pharmaceutical. Bank-owned asset managers were already familiar with these techniques as a means to improving processing efficiencies or automating front-office processes. For example, lo-touch trading algorithms had been deployed in the capital market industry to route orders and execute equities, futures and, more recently, FX transactions according to predetermined logical routines. The experience of trading in capital markets was that algorithms can often execute in strategies such as basic primary VWAP, TWAP, implementation shortfall and participation algorithms for equities. They can also be deployed to cover execution management, market making, inventory and observational algorithms for FX in a manner that can outperform irrational dealers who might be inclined to overcompensate when pricing in risk or be risk-averse if overrelying on an index benchmark, depending on their subjective circumstances.
Examples of benefits:
► Manual inputs – a robotic solution can log into systems and download master spreadsheets and automated reports in order to compare, reconcile and validate the data. It can pull data from the transaction input teams using a unique key reference to capture the subject title, and flag for human intervention to review and investigate via hi-touch exception-based processes. A robotic solution can also monitor intellectual property (IP) and email addresses, and translate the information directly into the core accounting platform, removing the requirement for manual input. The solution can also flag personal data relating to the same by using tagging or other metadata descriptors.
► Execution – robot process automation (RPA) through the use of (typically, sell-side provided) algorithms can automate trading processes to locate liquidity according to predefined parameters or to aggregate, prioritise, slice, peg and dynamically scale orders at normal or high-frequency trading speeds in order to mitigate the effects of market impact or opportunity costs. RPA processes can ping or otherwise test the degree of liquidity in the market, or can look up the most up-to-date indications and prices,
and route the transactions for hi- or lo-touch (platform) execution options accordingly.
► Diagnostics – RPA can be used for gathering data (analytics) and the processing of funds between asset managers and asset servicers, and can be designed to highlight exceptions automatically. RPA can be used to calculate and input fee schedules from Microsoft Excel templates into the core accounting platform. A robot can monitor and automatically initiate the inputs for the validation process and complete the validation checks for each fund automatically, removing human error.
► Reporting – a robotic solution can log into systems to capture information from multiple sources to produce tailored reports; it can then build the reports required and send these to clients. It can also run checks to ensure that all elements have been described in the appropriate ISO format and produce a single tailored report for individual clients in a MiFID II-standardised format. Reports can be automatically produced as often as required, and the elements combined with other market, reference or metadata elements to produce execution, trade or transaction reports on demand.
Downside: intelligent algorithms feature safeguards – deal flow and market volatility constraints, cash into and out of the asset, and maximum and minimum reward thresholds per investor risk appetite. But the very high speed of execution (shoot first, query later) can be destructive if the executing algorithm has no sense of context or overall market sentiment, as proven historically with quant-only investment styles. The electronification of capital markets has driven fees and trade sizes sharply downwards with regards to equity execution, and the issue of intellectual property protection has often got in the way of effective industry standardisation, leading to different legacy issues. There is also the issue that the use of a robot facility provided by a third party does not absolve the asset manager of responsibilities and business resilience obligations under MiFID II, should they decide to customise it.
Self-driving funds, robo-advisors and robo-selection
Situation: 26% of respondents (including several bank-owned and larger independent asset and wealth managers offering business-to-consumer (B2C) models) were interested in providing robo-advice style services (in the form of fully automated investment solutions, self-service investing solutions or guided advice).
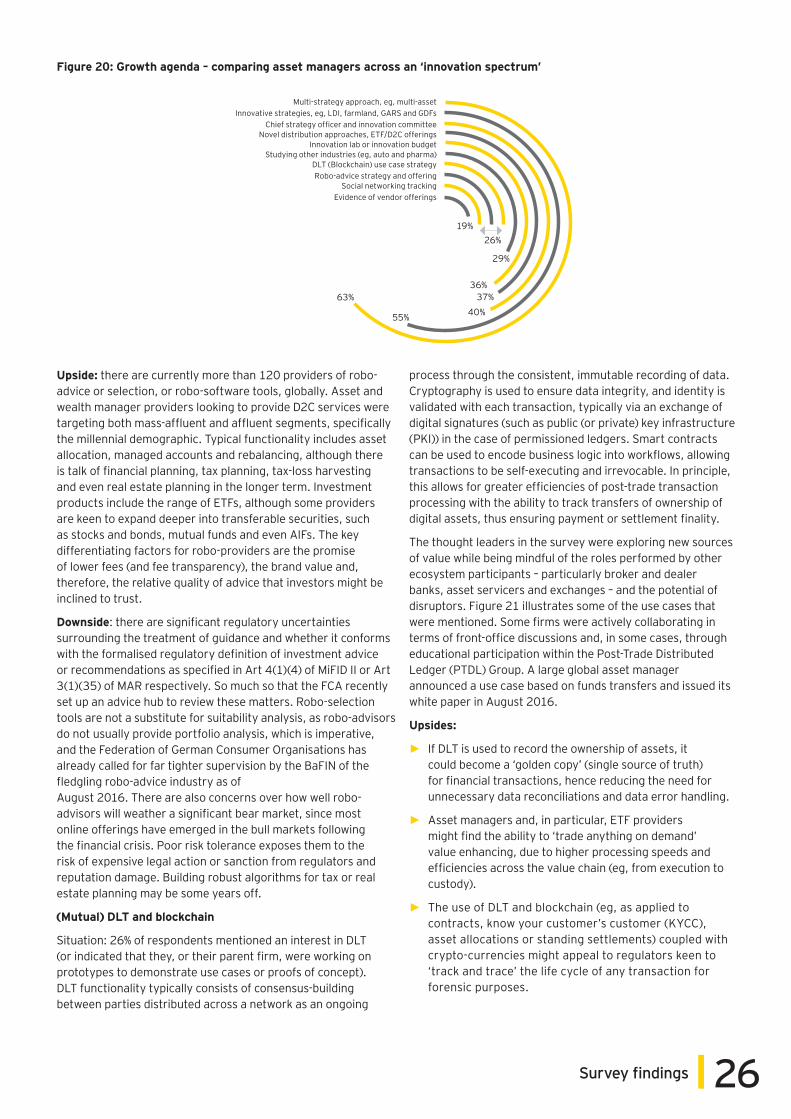
26Survey findings
Upside: there are currently more than 120 providers of robo-advice or selection, or robo-software tools, globally. Asset and wealth manager providers looking to provide D2C services were targeting both mass-affluent and affluent segments, specifically the millennial demographic. Typical functionality includes asset allocation, managed accounts and rebalancing, although there is talk of financial planning, tax planning, tax-loss harvesting and even real estate planning in the longer term. Investment products include the range of ETFs, although some providers are keen to expand deeper into transferable securities, such as stocks and bonds, mutual funds and even AIFs. The key differentiating factors for robo-providers are the promise of lower fees (and fee transparency), the brand value and, therefore, the relative quality of advice that investors might be inclined to trust.
Downside: there are significant regulatory uncertainties surrounding the treatment of guidance and whether it conforms with the formalised regulatory definition of investment advice or recommendations as specified in Art 4(1)(4) of MiFID II or Art 3(1)(35) of MAR respectively. So much so that the FCA recently set up an advice hub to review these matters. Robo-selection tools are not a substitute for suitability analysis, as robo-advisors do not usually provide portfolio analysis, which is imperative, and the Federation of German Consumer Organisations has already called for far tighter supervision by the BaFIN of the fledgling robo-advice industry as of August 2016. There are also concerns over how well robo-advisors will weather a significant bear market, since most online offerings have emerged in the bull markets following the financial crisis. Poor risk tolerance exposes them to the risk of expensive legal action or sanction from regulators and reputation damage. Building robust algorithms for tax or real estate planning may be some years off.
(Mutual) DLT and blockchain
Situation: 26% of respondents mentioned an interest in DLT (or indicated that they, or their parent firm, were working on prototypes to demonstrate use cases or proofs of concept). DLT functionality typically consists of consensus-building between parties distributed across a network as an ongoing
process through the consistent, immutable recording of data. Cryptography is used to ensure data integrity, and identity is validated with each transaction, typically via an exchange of digital signatures (such as public (or private) key infrastructure (PKI)) in the case of permissioned ledgers. Smart contracts can be used to encode business logic into workflows, allowing transactions to be self-executing and irrevocable. In principle, this allows for greater efficiencies of post-trade transaction processing with the ability to track transfers of ownership of digital assets, thus ensuring payment or settlement finality.
The thought leaders in the survey were exploring new sources of value while being mindful of the roles performed by other ecosystem participants – particularly broker and dealer banks, asset servicers and exchanges – and the potential of disruptors. Figure 21 illustrates some of the use cases that were mentioned. Some firms were actively collaborating in terms of front-office discussions and, in some cases, through educational participation within the Post-Trade Distributed Ledger (PTDL) Group. A large global asset manager announced a use case based on funds transfers and issued its white paper in August 2016.
Upsides:
► If DLT is used to record the ownership of assets, it could become a ‘golden copy’ (single source of truth) for financial transactions, hence reducing the need for unnecessary data reconciliations and data error handling.
► Asset managers and, in particular, ETF providers might find the ability to ‘trade anything on demand’ value enhancing, due to higher processing speeds and efficiencies across the value chain (eg, from execution to custody).
► The use of DLT and blockchain (eg, as applied to contracts, know your customer’s customer (KYCC), asset allocations or standing settlements) coupled with crypto-currencies might appeal to regulators keen to ‘track and trace’ the life cycle of any transaction for forensic purposes.
63%
55% 40%37%
36%
29%
26%19%
Innovative strategies, eg, LDI, farmland, GARS and GDFsChief strategy officer and innovation committee
Novel distribution approaches, ETF/D2C offeringsInnovation lab or innovation budget
Studying other industries (eg, auto and pharma)DLT (Blockchain) use case strategyRobo-advice strategy and offering
Social networking trackingEvidence of vendor offerings
Multi-strategy approach, eg, multi-asset
Figure 20: Growth agenda – comparing asset managers across an ‘innovation spectrum’
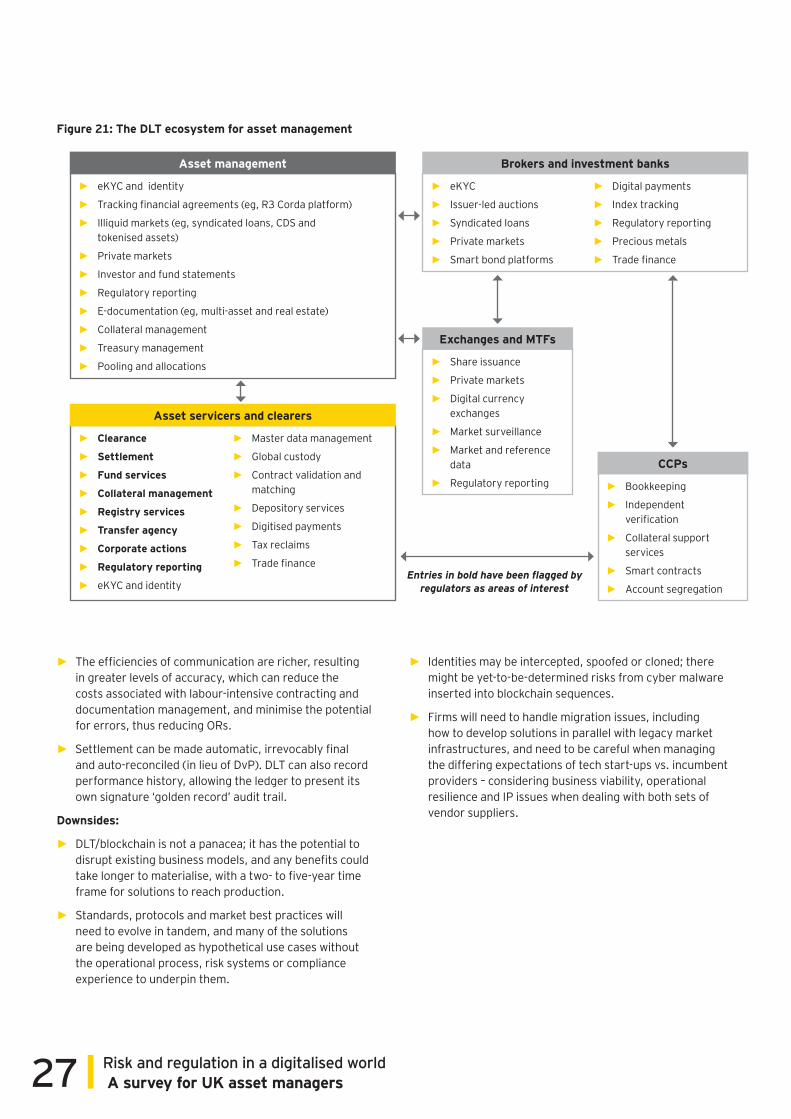
27 Risk and regulation in a digitalised world A survey for UK asset managers
► eKYC and identity
► Tracking financial agreements (eg, R3 Corda platform)
► Illiquid markets (eg, syndicated loans, CDS and tokenised assets)
► Private markets
► Investor and fund statements
► Regulatory reporting
► E-documentation (eg, multi-asset and real estate)
► Collateral management
► Treasury management
► Pooling and allocations
► eKYC
► Issuer-led auctions
► Syndicated loans
► Private markets
► Smart bond platforms
► Digital payments
► Index tracking
► Regulatory reporting
► Precious metals
► Trade finance
► Clearance
► Settlement
► Fund services
► Collateral management
► Registry services
► Transfer agency
► Corporate actions
► Regulatory reporting
► eKYC and identity
► Master data management
► Global custody
► Contract validation and matching
► Depository services
► Digitised payments
► Tax reclaims
► Trade finance
Asset management Brokers and investment banks
► Share issuance
► Private markets
► Digital currency exchanges
► Market surveillance
► Market and reference data
► Regulatory reporting
Exchanges and MTFs
Asset servicers and clearers
Entries in bold have been flagged by regulators as areas of interest
► Bookkeeping
► Independent verification
► Collateral support services
► Smart contracts
► Account segregation
CCPs
Figure 21: The DLT ecosystem for asset management
► The efficiencies of communication are richer, resulting in greater levels of accuracy, which can reduce the costs associated with labour-intensive contracting and documentation management, and minimise the potential for errors, thus reducing ORs.
► ►Settlement can be made automatic, irrevocably final and auto-reconciled (in lieu of DvP). DLT can also record performance history, allowing the ledger to present its own signature ‘golden record’ audit trail.
Downsides:
► DLT/blockchain is not a panacea; it has the potential to disrupt existing business models, and any benefits could take longer to materialise, with a two- to five-year time frame for solutions to reach production.
► Standards, protocols and market best practices will need to evolve in tandem, and many of the solutions are being developed as hypothetical use cases without the operational process, risk systems or compliance experience to underpin them.
► Identities may be intercepted, spoofed or cloned; there might be yet-to-be-determined risks from cyber malware inserted into blockchain sequences.
► Firms will need to handle migration issues, including how to develop solutions in parallel with legacy market infrastructures, and need to be careful when managing the differing expectations of tech start-ups vs. incumbent providers – considering business viability, operational resilience and IP issues when dealing with both sets of vendor suppliers.

28Contacts
Contacts
Dr. Anthony Kirby
Executive Director, UK Regulatory & Risk Management
Tel: +44 207 951 9729Email: [email protected]
Gillian Lofts
Partner, UK Wealth and Asset Management Leader
Tel: +44 207 951 5131Email: [email protected]
Simon Turner
Partner, UK Wealth and Asset Management Regulatory and Risk Leader
Tel: +44 207 980 9215 Email: [email protected]
Üner Nabi
Executive Director, UK Regulatory & Risk Management
Tel: +44 207 951 6442Email: [email protected]

EY | Assurance | Tax | Transactions | Advisory
About EYEY is a global leader in assurance, tax, transaction and advisory services. The insights and quality services we deliver help build trust and confidence in the capital markets and in economies the world over. We develop outstanding leaders who team to deliver on our promises to all of our stakeholders. In so doing, we play a critical role in building a better working world for our people, for our clients and for our communities.
EY refers to the global organization, and may refer to one or more, of the member firms of Ernst & Young Global Limited, each of which is a separate legal entity. Ernst & Young Global Limited, a UK company limited by guarantee, does not provide services to clients. For more information about our organization, please visit ey.com.
Ernst & Young LLPThe UK firm Ernst & Young LLP is a limited liability partnership registered in England and Wales with registered number OC300001 and is a member firm of Ernst & Young Global Limited.
Ernst & Young LLP, 1 More London Place, London, SE1 2AF.
© 2017 Ernst & Young LLP. Published in the UK. All Rights Reserved.
EYG no. 01318-174Gbl
ED None
EY-000017975.indd (UK) 01/17. Artwork by Creative Services Group Design.
In line with EY’s commitment to minimise its impact on the environment, this document has been printed on paper with a high recycled content.
Information in this publication is intended to provide only a general outline of the subjects covered. It should neither be regarded as comprehensive nor sufficient for making decisions, nor should it be used in place of professional advice. Ernst & Young LLP accepts no responsibility for any loss arising from any action taken or not taken by anyone using this material.
ey.com/uk