Embed Size (px)
Citation preview
Risk
Thomas LumleyDepartment of StatisticsUniversity of Auckland
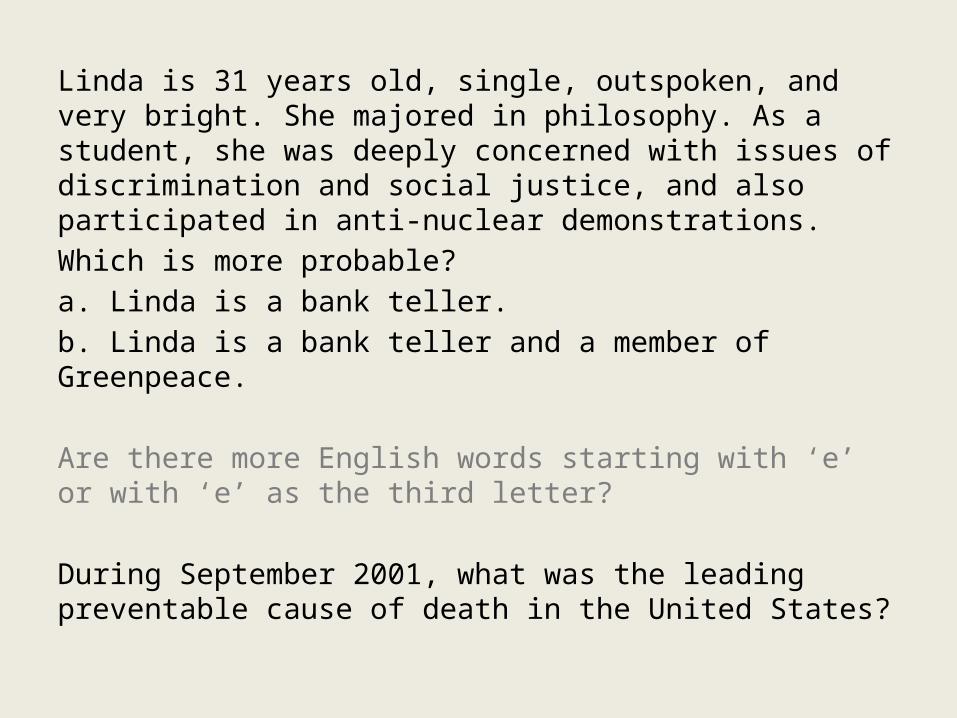
Linda is 31 years old, single, outspoken, and very bright. She majored in philosophy. As a student, she was deeply concerned with issues of discrimination and social justice, and also participated in anti-nuclear demonstrations.Which is more probable?a. Linda is a bank teller.b. Linda is a bank teller and a member of Greenpeace.
Are there more English words starting with ‘e’ or with ‘e’ as the third letter?
During September 2001, what was the leading preventable cause of death in the United States?

The horizontal lines are straight
Your brain tries to be too clever: uses tricks that usually give more accurate results, but that fail here.
Assessing probabilities has the same problem: - our brains rely on tricks that don’t always work - need to learn not to believe our gut feelings - can’t rely on the media to help us.
Illusions
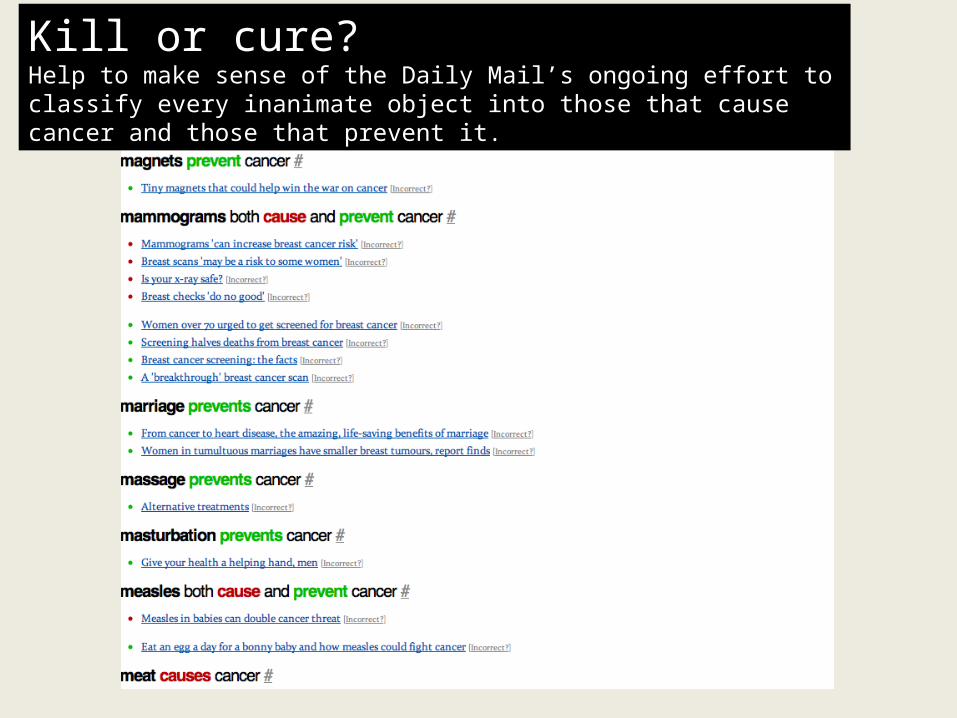
Kill or cure?Help to make sense of the Daily Mail’s ongoing effort to classify every inanimate object into those that cause cancer and those that prevent it.
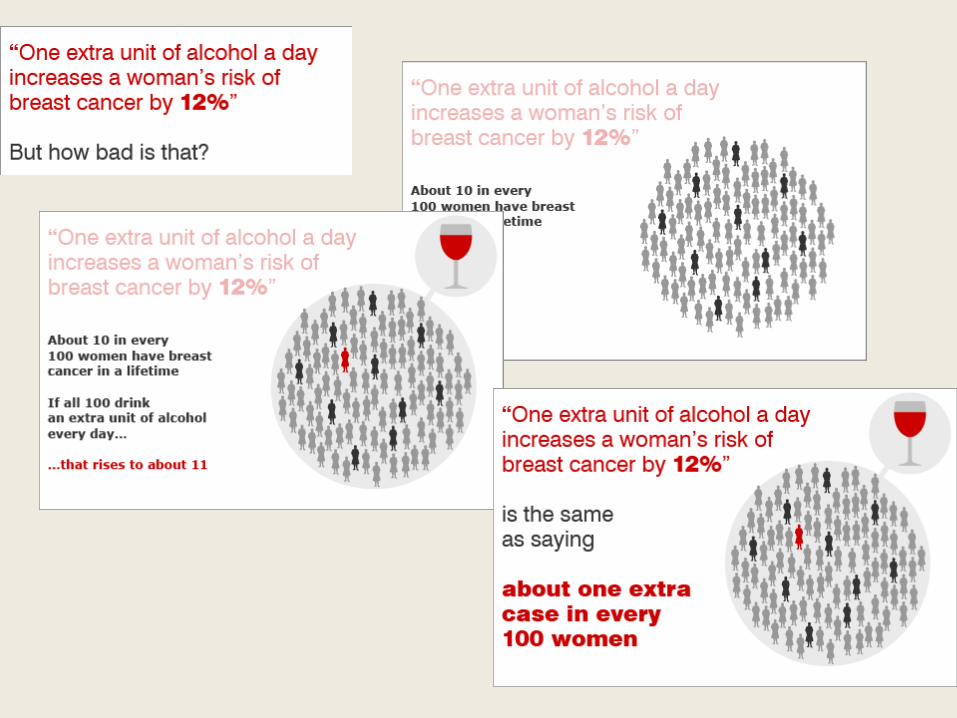
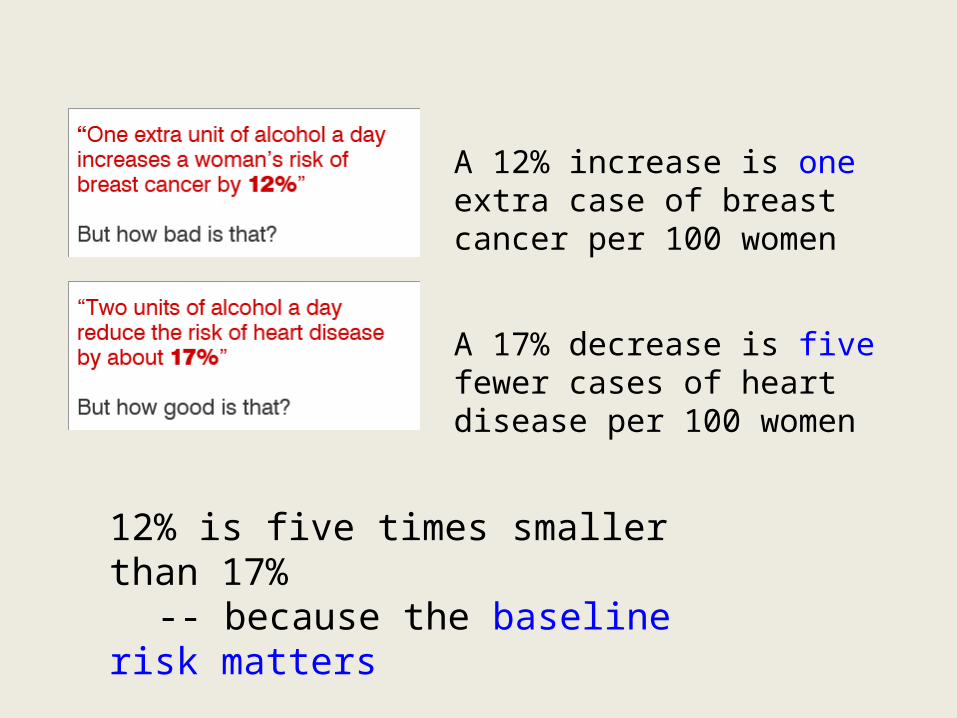
A 12% increase is one extra case of breast cancer per 100 women
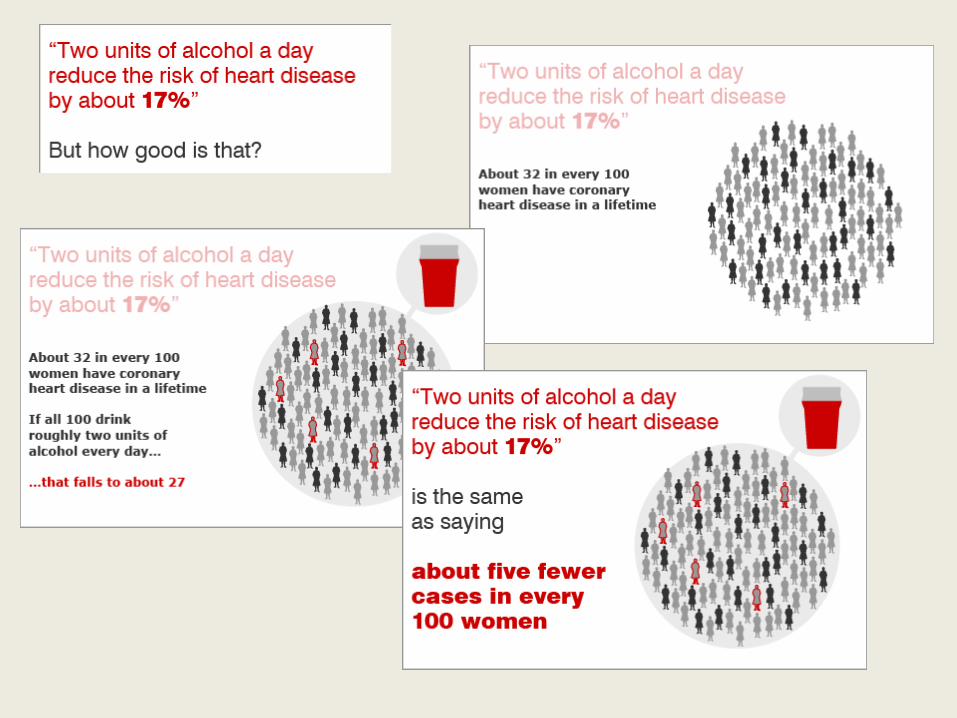
A 17% decrease is five fewer cases of heart disease per 100 women
12% is five times smaller than 17% -- because the baseline risk matters
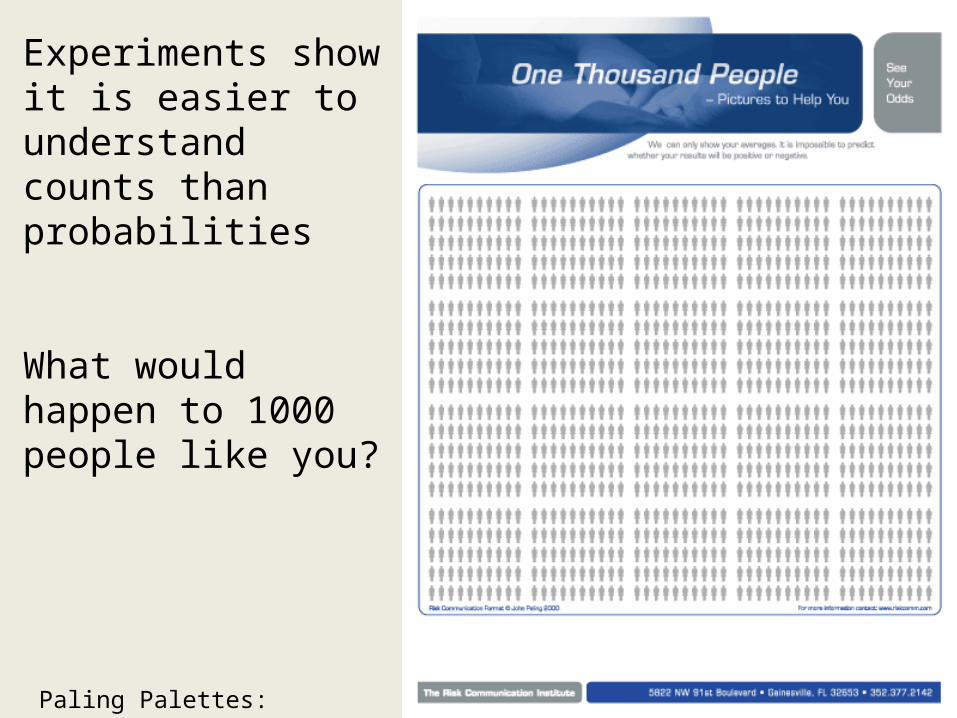
Experiments show it is easier to understand counts than probabilities
What would happen to 1000 people like you?
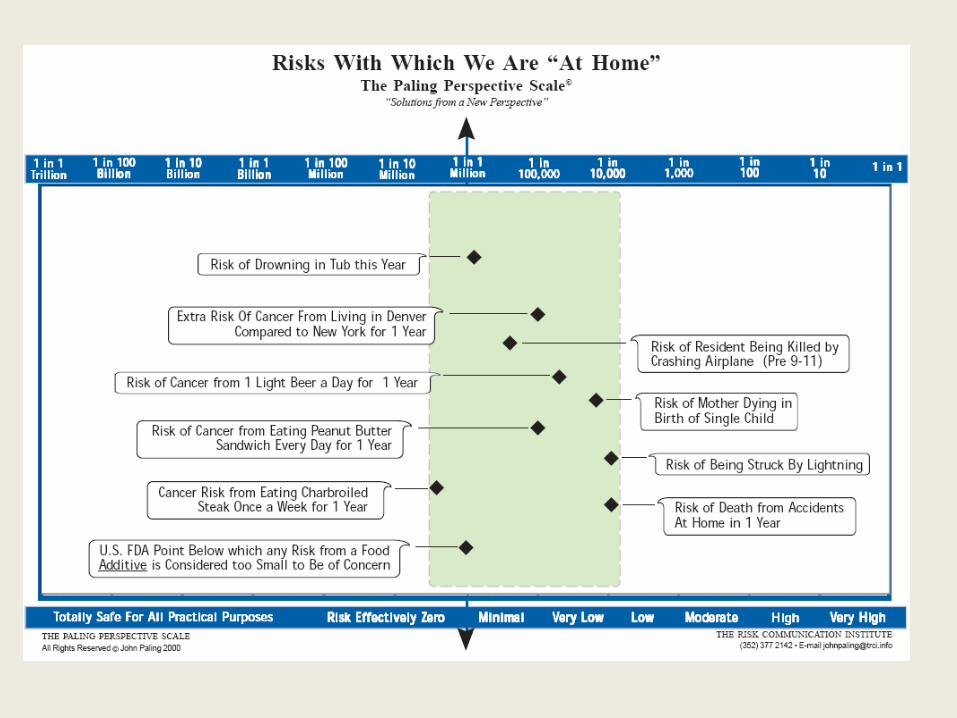
Paling Palettes: riskcomm.com
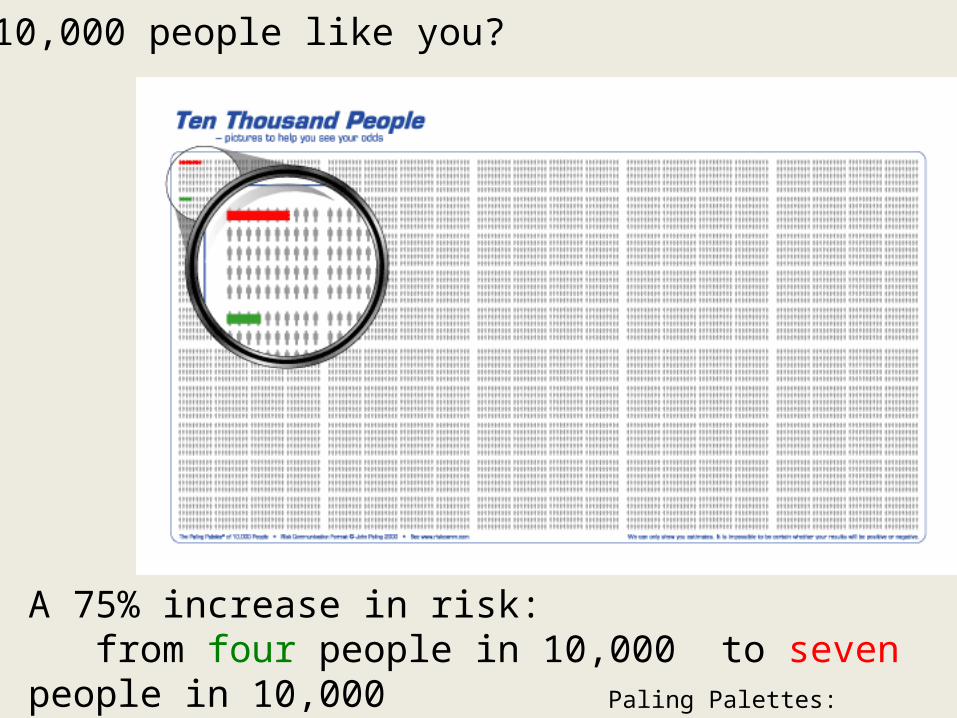
A 75% increase in risk: from four people in 10,000 to seven people in 10,000 Paling Palettes:
riskcomm.com
Or 10,000 people like you?
Relative or absolute?
• We care about absolute risk differences– 10 in 100 vs 11 in 100 risk of breast cancer– is 1 in 100 extra risk worth drinking less?
• Relative risks (risk ratios) are more commonly quoted– 12% increase in risk– less directly useful– but often more transportable from one
setting to another
Up or down?
Risk in group A is 11%, in group B is 10%• 10/11=0.909 = 9% decrease?• 11/10 = 1.10 = 10% increase?Exactly equivalent, so either is correct.
Often being in one group is an action, that group usually goes on top, other group is “baseline”10% increase from drinking vs9% decrease from not drinking
Relative or absolute?
• Cholesterol-lowering drugs reduce heart attack risk about 40%
• Relative risk is pretty much constant across population groups
• Absolute risk reduction is higher for high-risk people– 15 in 100 reduced by 40% is 9 in 100– 3 in 100 reduced by 40% is 2 in 100 – 3 in 1000 reduced by 40% is 2 in 1000
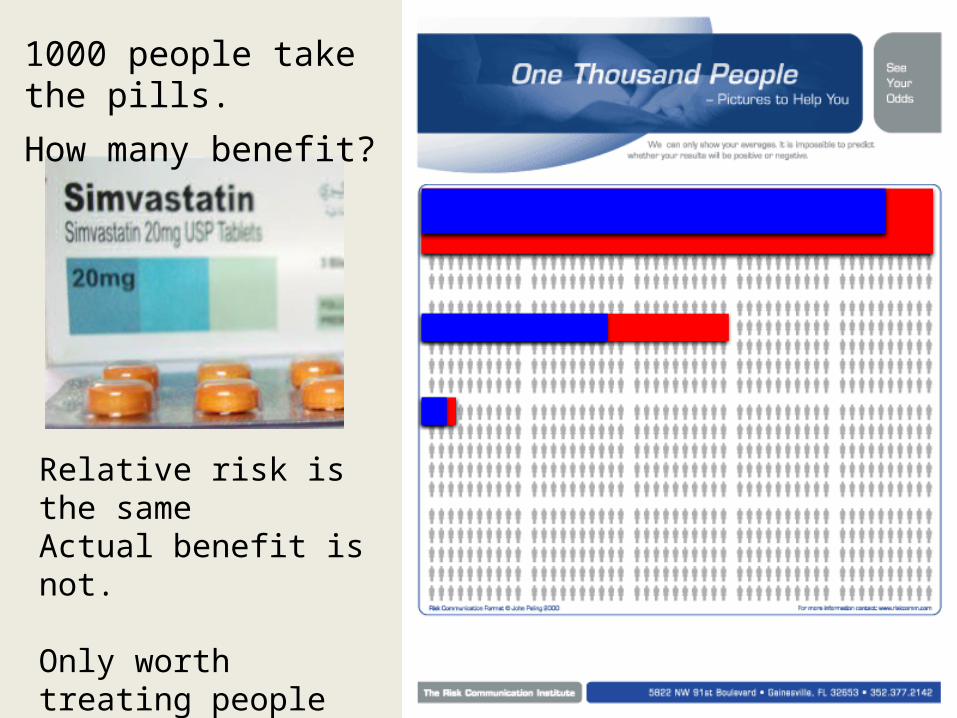
Relative risk is the sameActual benefit is not.
Only worth treating people who have high enough risk.
1000 people take the pills.
How many benefit?
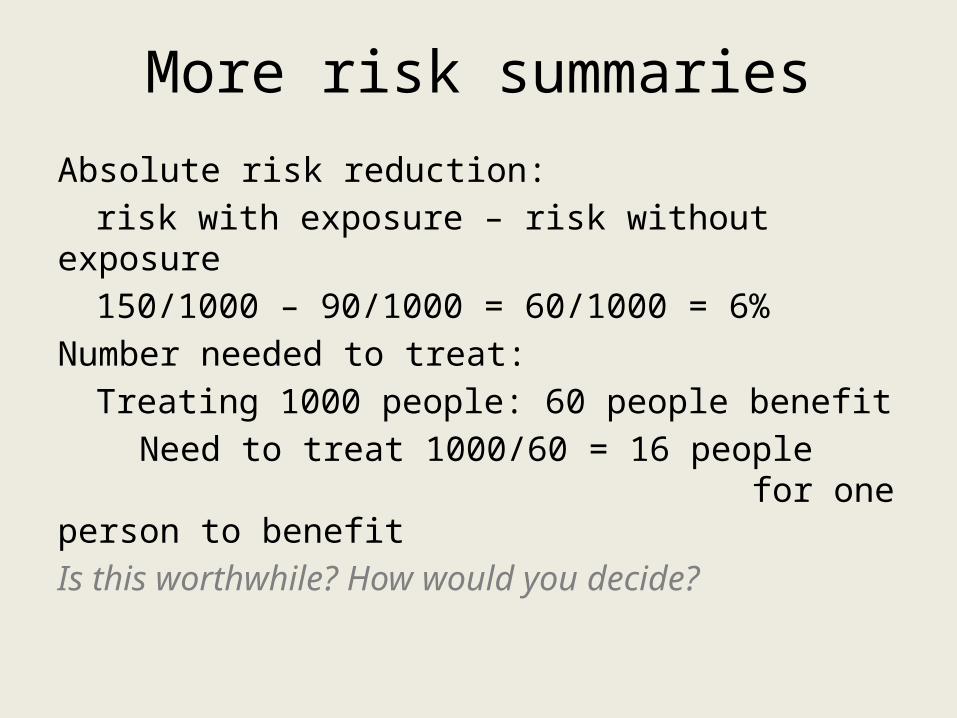
More risk summaries
Absolute risk reduction: risk with exposure – risk without
exposure 150/1000 – 90/1000 = 60/1000 = 6%Number needed to treat:
Treating 1000 people: 60 people benefit Need to treat 1000/60 = 16 people for one person to benefitIs this worthwhile? How would you decide?
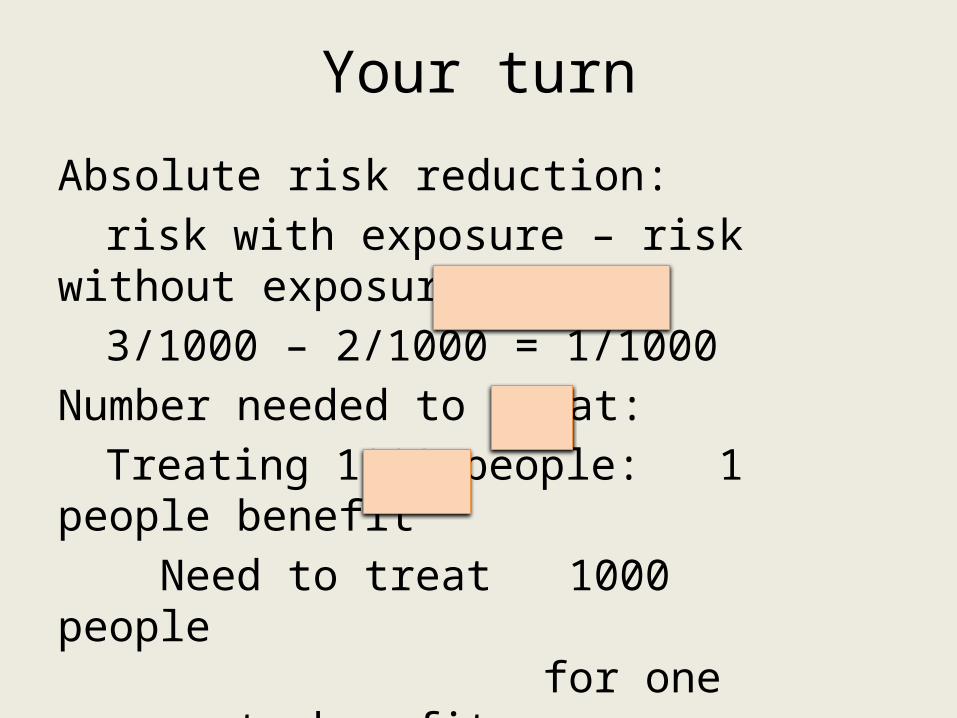
Your turn
Absolute risk reduction: risk with exposure – risk without
exposure 3/1000 – 2/1000 = 1/1000Number needed to treat:
Treating 1000 people: 1 people benefit Need to treat 1000 people for one person to benefit
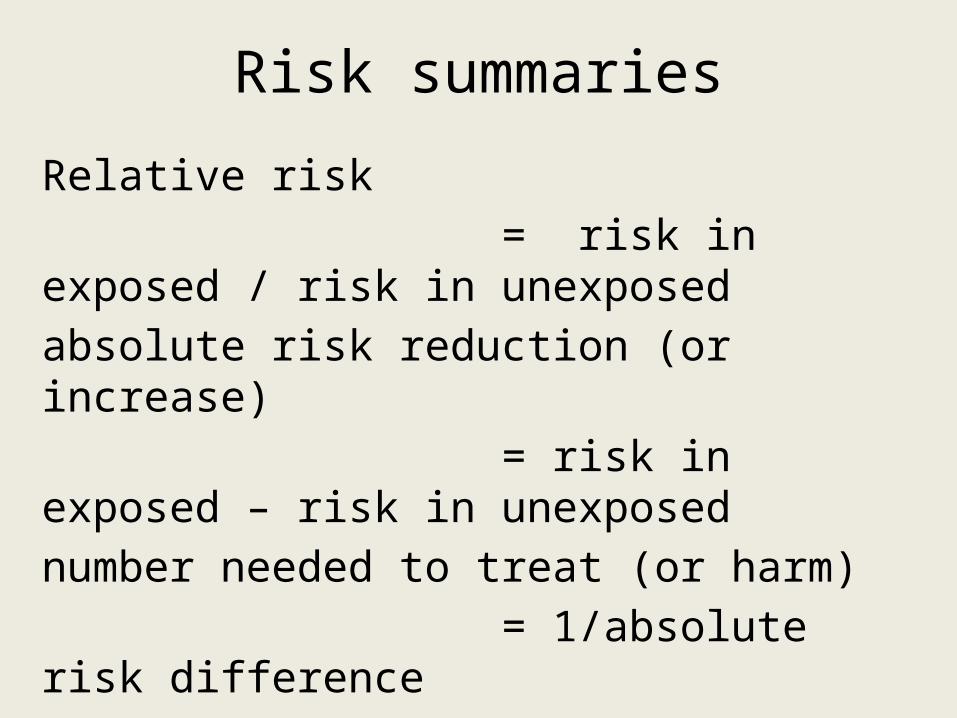
Risk summaries
Relative risk = risk in exposed / risk in unexposedabsolute risk reduction (or increase) = risk in exposed – risk in unexposednumber needed to treat (or harm) = 1/absolute risk difference
Risk perception
Denial: not just a river in Egypt.
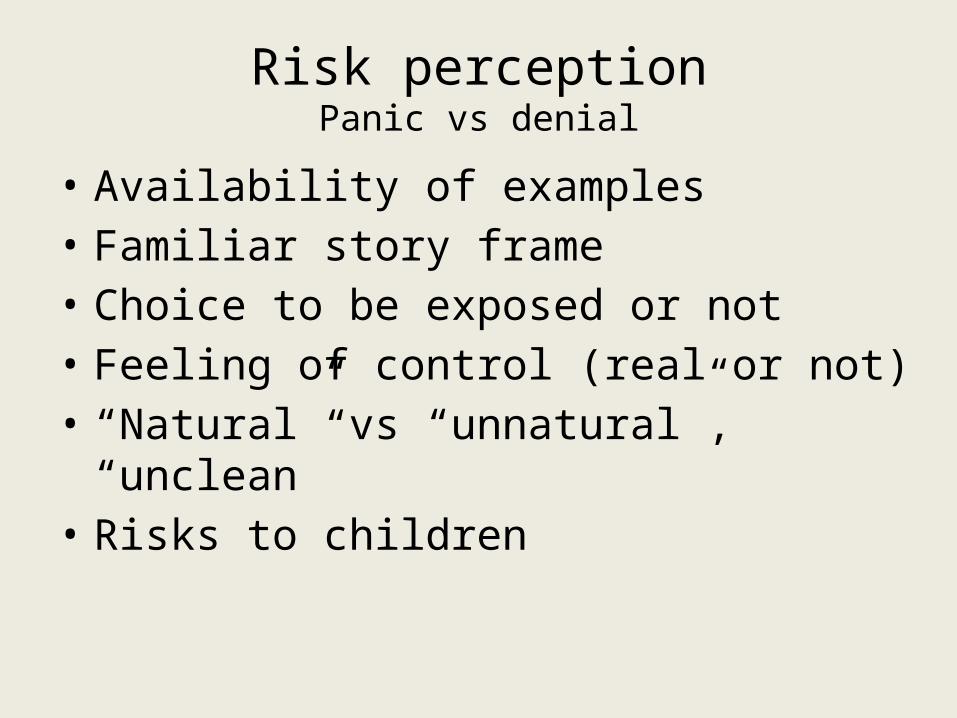
Risk perceptionPanic vs denial
• Availability of examples• Familiar story frame• Choice to be exposed or not• Feeling of control (real or not)• “Natural” vs “unnatural”, “unclean”• Risks to children
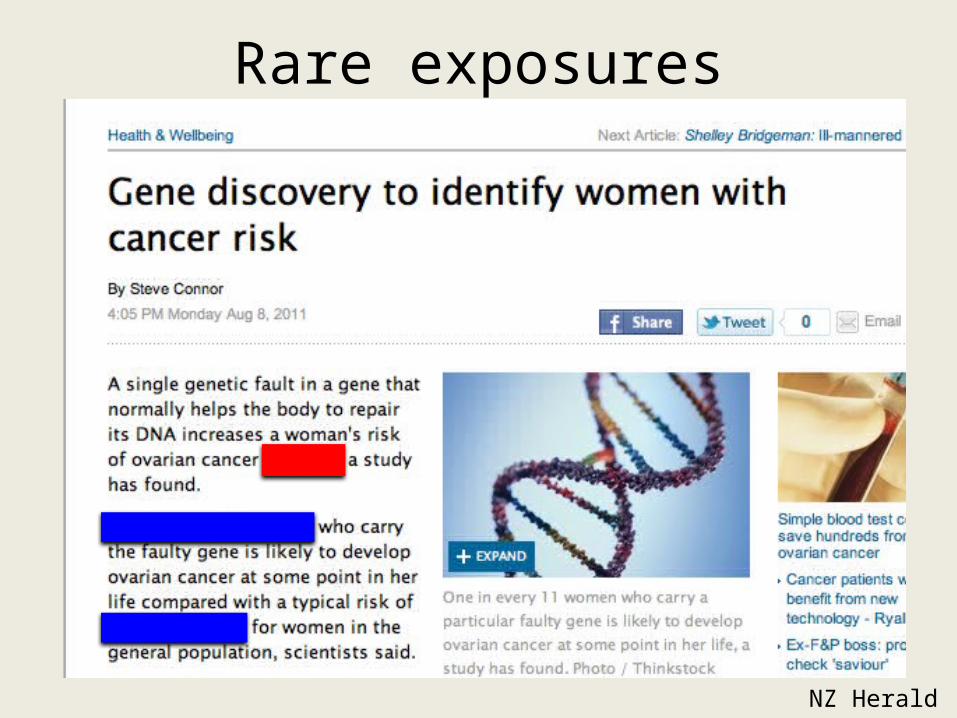
Rare exposures
NZ Herald
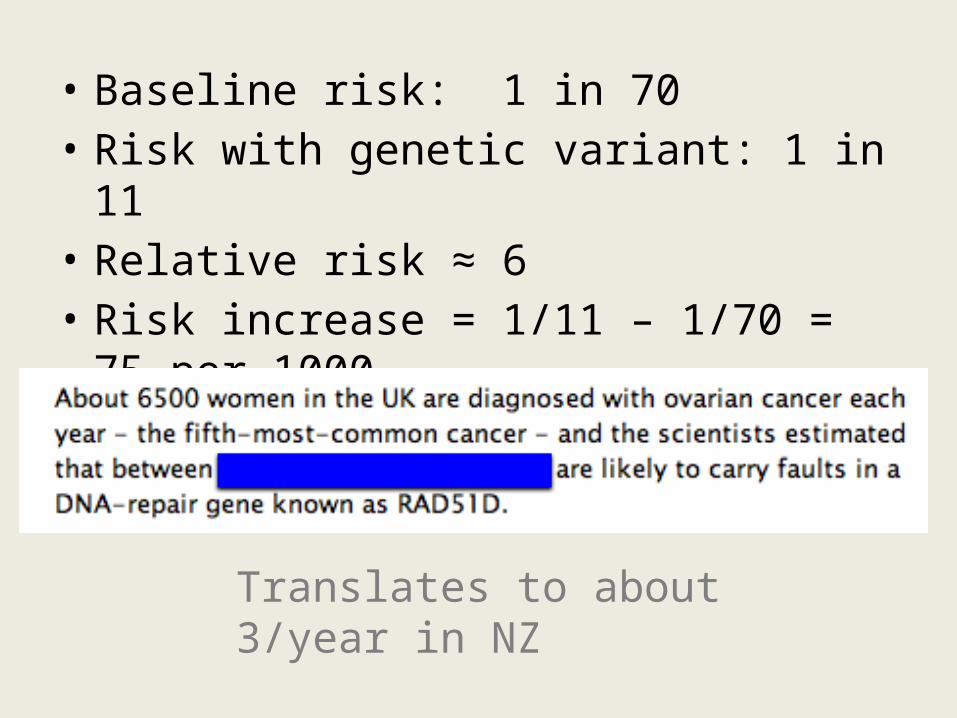
• Baseline risk: 1 in 70• Risk with genetic variant: 1 in 11• Relative risk ≈ 6• Risk increase = 1/11 – 1/70 = 75 per
1000 What else do we need to know?
Translates to about 3/year in NZ
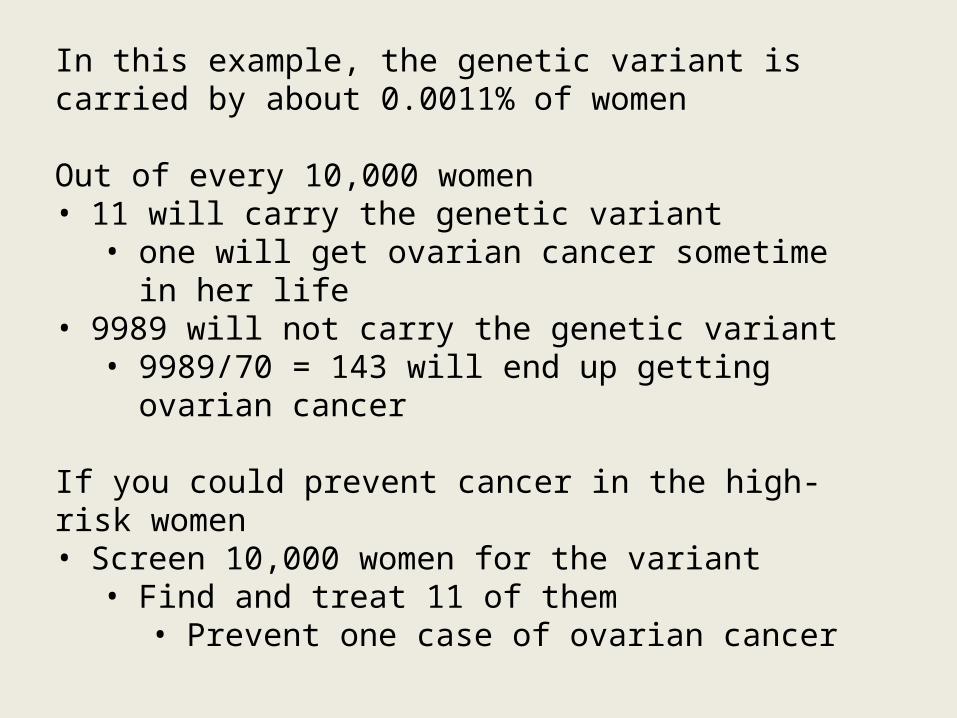
In this example, the genetic variant is carried by about 0.0011% of women
Out of every 10,000 women• 11 will carry the genetic variant• one will get ovarian cancer sometime in her
life• 9989 will not carry the genetic variant• 9989/70 = 143 will end up getting ovarian
cancer
If you could prevent cancer in the high-risk women• Screen 10,000 women for the variant• Find and treat 11 of them • Prevent one case of ovarian cancer
Example: Physicians Health Study
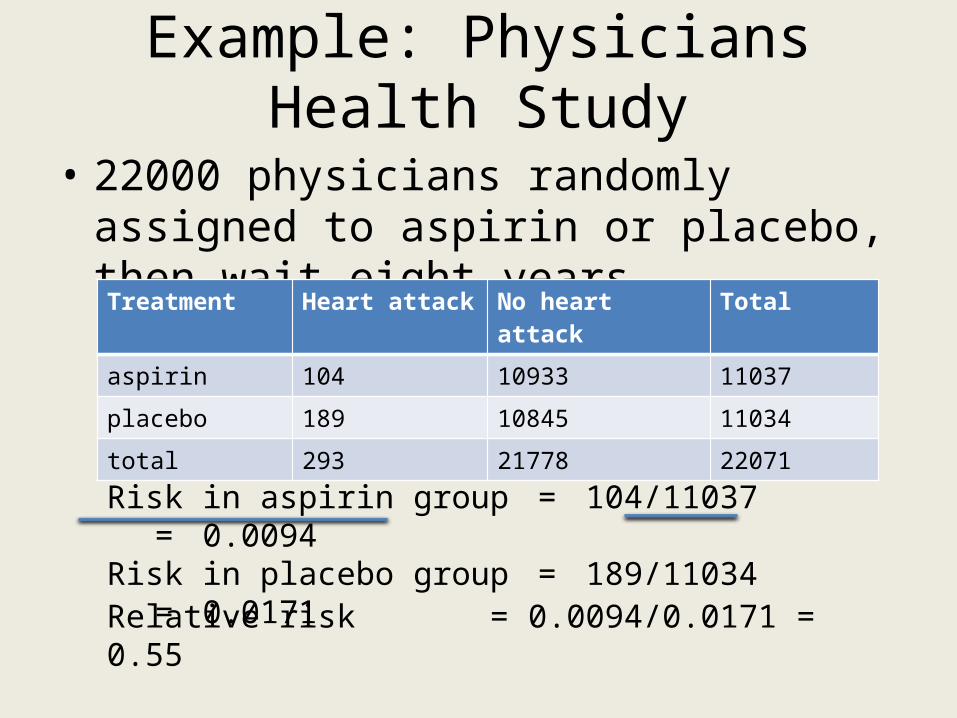
• 22000 physicians randomly assigned to aspirin or placebo, then wait eight yearsTreatment Heart attack No heart
attackTotal
aspirin 104 10933 11037
placebo 189 10845 11034
total 293 21778 22071
Risk in aspirin group = 104/11037= 0.0094
Risk in placebo group = 189/11034= 0.0171Relative risk = 0.0094/0.0171 =
0.55
In words
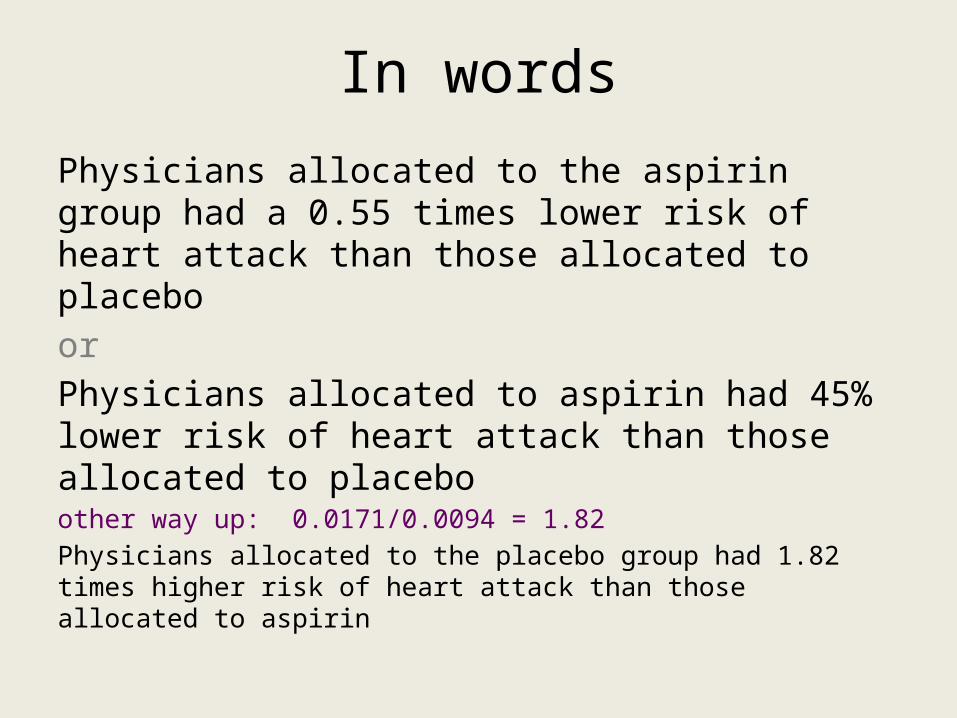
Physicians allocated to the aspirin group had a 0.55 times lower risk of heart attack than those allocated to placeboorPhysicians allocated to aspirin had 45% lower risk of heart attack than those allocated to placeboother way up: 0.0171/0.0094 = 1.82Physicians allocated to the placebo group had 1.82 times higher risk of heart attack than those allocated to aspirin
Example: Physicians Health Study
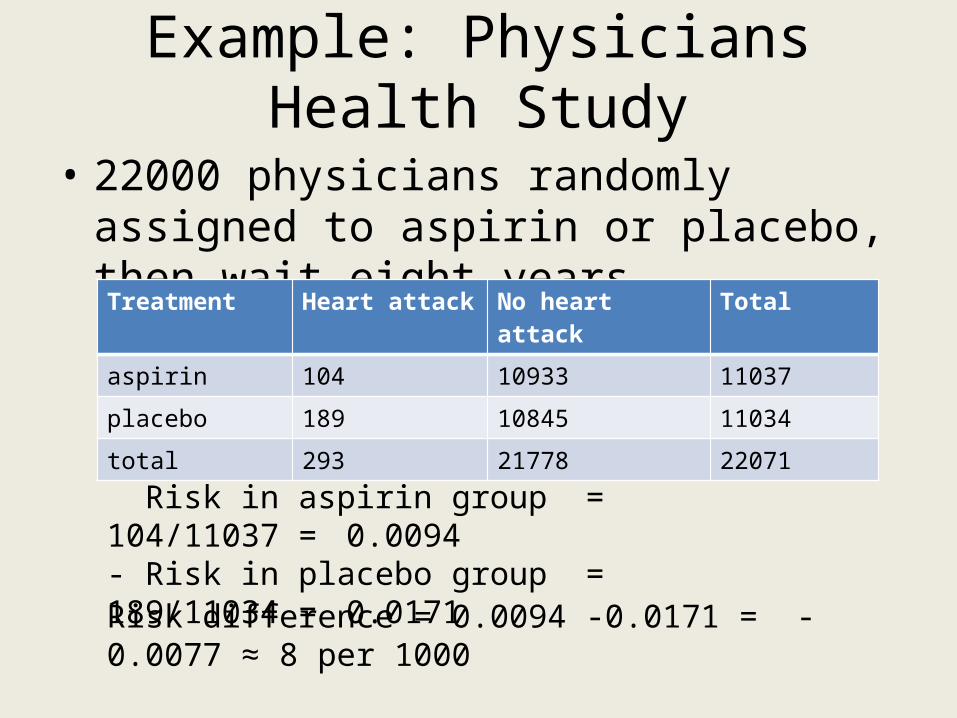
• 22000 physicians randomly assigned to aspirin or placebo, then wait eight yearsTreatment Heart attack No heart
attackTotal
aspirin 104 10933 11037
placebo 189 10845 11034
total 293 21778 22071
Risk in aspirin group = 104/11037= 0.0094
- Risk in placebo group = 189/11034= 0.0171Risk difference = 0.0094 -0.0171 = -0.0077 ≈ 8
per 1000
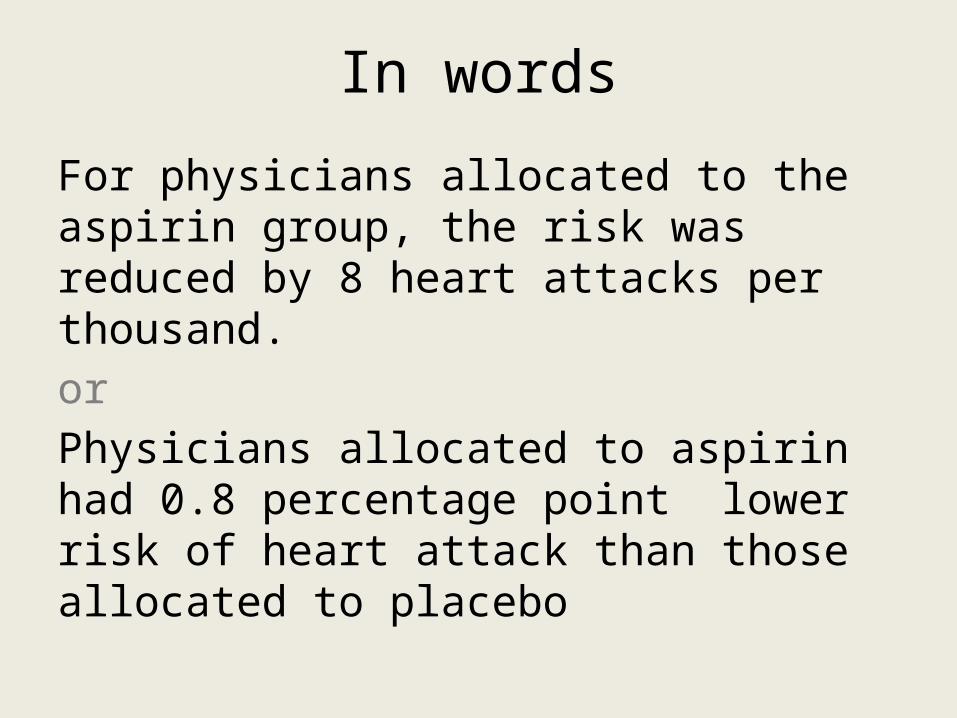
In words
For physicians allocated to the aspirin group, the risk was reduced by 8 heart attacks per thousand.orPhysicians allocated to aspirin had 0.8 percentage point lower risk of heart attack than those allocated to placebo
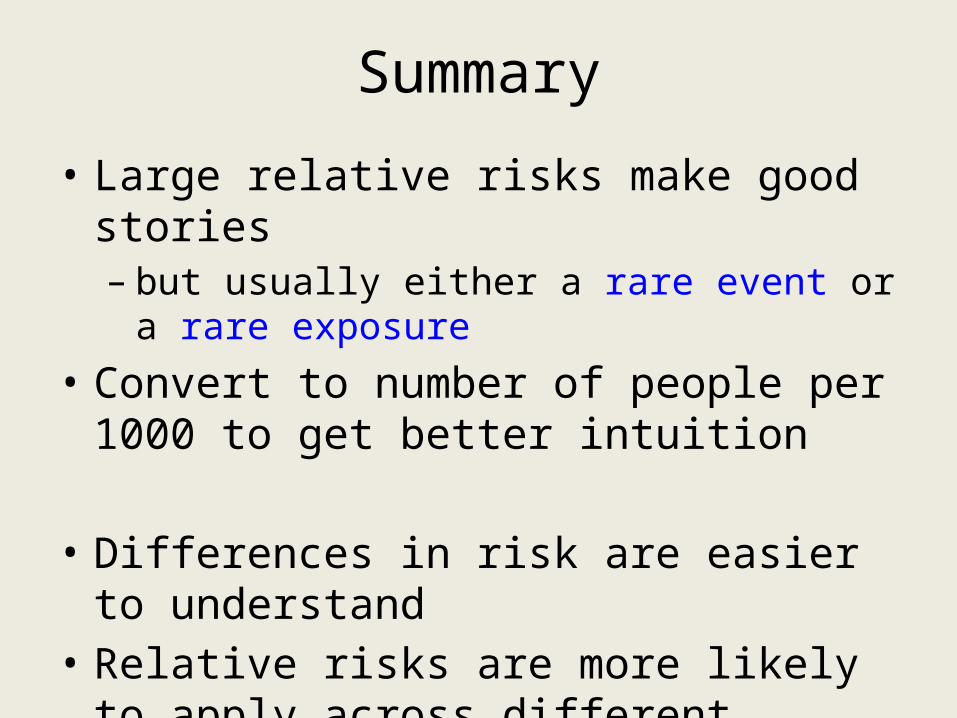
Summary
• Large relative risks make good stories– but usually either a rare event or a rare
exposure
• Convert to number of people per 1000 to get better intuition
• Differences in risk are easier to understand
• Relative risks are more likely to apply across different groups of people.

That’s all, folks.