Embed Size (px)
Citation preview
RIVAS SCP0-GA-2010-265754
RIVAS_CEDEX_WP3_D3_7_PART_A_FINAL Page I of IV 07/06/2013
RIVAS
Railway Induced Vibration Abatement Solutions
Collaborative project
RESULTS OF LABORATORY TESTS FOR BALLASTED TRACK MITIGATION MEASURES
CEDEX TRACK BOX TESTS
Deliverable D3.7 (PART A)
Submission date: 07/06/2013
Project Coordinator:
Bernd Asmussen
International Union of Railways (UIC)

RIVAS SCP0-GA-2010-265754
RIVAS_CEDEX_WP3_D3_7_PART_A_FINAL Page II of IV 07/06/2013
RIVAS SCP0-GA-2010-265754
RIVAS_CEDEX_WP3_D3_7_PART_A_FINAL Page III of IV 07/06/2013
Title
Results of laboratory tests for ballasted track mitigation measures measuresCEDEXCCEDEX
CEDECEDEX
CEDEX track box tests
Domain WP3,Task 3.2
Date 07/06/2013
Author/Authors V. Cuéllar, J. Estaire, F.Navarro, M.A. Andreu, M.Rodríguez, A. Andrés Andres W.Rücker, E.Bongini W. Rücker, E. Bongini, A. Pieringer, R. Garburg, F. Baldrick
E. Knothe, S. Schwieger, L. Auersch, H. Flöttmann
Partner CEDEX
Document Code RIVAS_CEDEX_ WP3_D3_7_ V01
Version 2
Status FINAL
Dissemination level:
Document history
Revision Date Description
1 03/06/2013 First Draft
2 07/06/2013 Final Version
Project co-funded by the European Commission within the seventh framework programme
Dissemination Level PU Public
PP Restricted to other programme participants (including the Commission Services)
RE Restricted to a group specified by the consortium (including the Commission) Services) x
CO Confidential, only for members of the consortium (including the Commission Services)

RIVAS SCP0-GA-2010-265754
RIVAS_CEDEX_WP3_D3_7_PART_A_FINAL Page IV of IV 07/06/2013
RIVAS SCP0-GA-2010-265754
RIVAS_CEDEX_WP3_D3_7_PART_A_FINAL Page 1 of 241 07/06/2013
TABLE OF CONTENTS
TABLE OF CONTENTS ............................................................................................................. 1
EXECUTIVE SUMMARY ............................................................................................................ 3
1 INTRODUCTION .................................................................................................................. 5
2 CEDEX TRACK BOX ........................................................................................................... 7
2.1 Description ................................................................................................................... 7
2.2 Capacity to simulate the track effects of vertical loads moving horizontally ................... 9
2.3 Sensor system ............................................................................................................ 11
2.3.1 Introduction ..................................................................................................... 11
2.3.2 External System .............................................................................................. 12
2.3.3 Internal System ............................................................................................... 20
2.4 Acquisition and measuring systems ............................................................................ 26
3 PHYSICAL MODEL PROPERTIES .................................................................................... 27
4 LOADING TIME HISTORIES .............................................................................................. 33
4.1 Introduction ................................................................................................................. 33
4.2 Quasi-static loads ....................................................................................................... 33
4.3 Dynamic loads ............................................................................................................ 33
5 TRACK SYSTEMS AND BALLAST STATES TESTED ....................................................... 45
5.1 Introduction ................................................................................................................. 45
5.2 Spanish track components .......................................................................................... 46
5.3 German track components .......................................................................................... 51
6 TESTS PERFORMED ........................................................................................................ 55
6.1 Introduction ................................................................................................................. 55
6.2 Receptance test .......................................................................................................... 55
6.2.1 High frequency tests ........................................................................................ 56
6.2.2 Low frequency tests ........................................................................................ 60
6.3 Static tests .................................................................................................................. 61
6.4 Quasi-static tests ........................................................................................................ 62
6.4.1 Long lasting test .............................................................................................. 62
6.4.2 Short lasting tests ............................................................................................ 63
6.5 Dynamic short lasting insertion loss tests ................................................................... 64
7 RESULTS OBTAINED ........................................................................................................ 67
7.1 Introduction ................................................................................................................. 67
RIVAS SCP0-GA-2010-265754
RIVAS_CEDEX_WP3_D3_7_PART_A_FINAL Page 2 of 241 07/06/2013
7.2 Track receptance tests ............................................................................................... 67
7.3 Static tests .................................................................................................................. 80
7.4 Quasi static long lasting test ....................................................................................... 88
7.5 Track systems insertion loss ....................................................................................... 97
REFERENCES ....................................................................................................................... 111
APPENDIX 1: CEDEX RAIL PAD TESTS…………………………………………………………..113
APPENDIX 2: TRACK RECEPTANCE CURVES………………………………………………....119
APPENDIX 3: INSERTION LOSS GRAPHS…………………………………………………........181
RIVAS SCP0-GA-2010-265754
RIVAS_CEDEX_WP3_D3_7_PART_A_FINAL Page 3 of 241 07/06/2013
EXECUTIVE SUMMARY
Task 3.2 of work package 3 (WP3) in the EU FP7 project RIVAS focusses on vibration mitigation measures for ballasted track by optimizing rail fastening system, sleeper and sleeper/substructure interaction. Also promotes innovative solutions by combining computer simulation, laboratory tests and field tests. Concerning the optimisation of the sleeper and the sleeper/substructure interaction, a prototype sleeper provided with hard rail pads and a soft under-sleeper pad has been manufactured and delivered by RAILONE to CEDEX to be tested in its big dimension track box under realistic conditions (i.e. realistic traffic scenarios with different speeds). The new sleeper is a mono-bloc concrete pre-stressed B90.2 model having a mass of 610 kg and approximately the same dimensions that standard mono-bloc sleepers. The objective of this deliverable 3.7 (Part A) has been the presentation in a comprehensive way of the results obtained in the tests run for the RIVAS project in CEDEX track box. Among the different types of test performed, those carried out to shed light on the vertical vibration insertion loss capacity of the new type of sleepers compared with standard sleepers have received special attention. To carry out the insertion loss tests, 13 units of the B90.2 sleeper type have been installed in the central zone of the track box replacing the same number of standard sleepers that having been also tested under the same testing and ballast conditions have been considered as a reference for comparative purposes. Accordingly, constant high amplitude quasi-static load time histories, with frequencies according to the geometric distribution of axles and bogies in EU trains travelling at 300 km/h and 120 km/h, have been generated in the track box using a set of computer controlled 250 kN and 50 Hz servo-hydraulic cylinders. The combination of a couple of such cylinders, one on each rail, with two 20 kN and 300 Hz piezoelectric shakers, has also enabled the setting up in the track box of the variable low amplitude dynamic load time history generated by the passage of an EU freight vehicle travelling at 120 km/h over the vertical irregularities of a given track. For each one of those quasi-static and dynamic vertical vibration sources, velocity and acceleration insertion losses have been determined in the track superstructure elements (rail, sleeper, ballast) and substructure components (subballast, form layer, upper and lower embankment) in short lasting tests. Additional data provided by two 1Hz geophones deployed at the foundation of the track box have been also used. To characterize the track and ballast conditions under which the insertion loss tests were performed, other track receptance and static loading tests have been carried out in the central zone of the track box. They have also provided data enabling the comparison of the insertion loss results obtained in the track box with those provided by EIFFAGE rig tests, and other in situ data collected in experimental sites having the same track systems. Also, one long lasting quasi-static test has been run with the new sleepers so that the results obtained can be compared with those provided by a previous test of the same type, run in CEDEX track box outside of the RIVAS project, with standard sleepers. In those tests, an accelerated loading process was implemented simulating the passage over 7 consecutive
RIVAS SCP0-GA-2010-265754
RIVAS_CEDEX_WP3_D3_7_PART_A_FINAL Page 4 of 241 07/06/2013
sleepers of 2 M freight vehicle axle loads at a travelling speed of 120 km/h. For both sleeper configurations, the amplitudes of: rail deflections, rail pad and ballast compressions, velocities and accelerations of the different track superstructure and substructure elements, generated along such a loading process have been recorded. The evolution with the number of axle load applications of the ballast irreversible compressions obtained in the test (ballast fatigue curve) has been also obtained. In chapter 2 of the present report, the CEDEX track box and its capacity to simulate the track effects of vertical loads moving horizontally are described. The sensor systems used in the tests and the data acquisition and measuring systems employed are also described in that chapter. In chapter 3, the properties and dimensions of the physical model used to run the tests are presented. That model represents, at 1:1 scale, a cross section of the Madrid-Barcelona high speed line with an embankment 2.5 m high. The static track stiffness measured in the model with standard sleepers ranged between 100 and 150 kN/mm. In chapter 4, the quasi-static and dynamic load time histories previously cited are defined and the process adopted to derive the PSD function for the dynamic forces is fully explained. Besides, the track vertical irregularity PSD function selected has been compared with those suggested by ORE. In chapter 5, the track systems and ballast states analysed, to assess the insertion losses induced in the different track superstructure and substructure elements by the new sleepers compared with the standard sleepers, are introduced. Reference is made in that chapter to Appendix 1 in the document, where the results obtained in the compression tests made in CEDEX with the two types of rail pad used in the track box tests have been collected. Also a reference is made to part B of deliverable 3.7 where the results of the tests made by BAM to characterise the mechanical behaviour and properties of the new sleepers and under-sleeper pads are reported In chapter 6, the types of test performed are described and the testing routine adopted for each one of them is identified. In chapter 7, the results obtained in the different tests performed for the RIVAS project are presented. A series of tables have been produced summarizing the comparative study of the track receptance functions made in Appendix 2, where the receptance curves obtained with different procedures are gathered. Also a family of tables compiling the velocity and acceleration one-third octave band insertion loss values, provided in Appendix 3 for different vibration sources, are given. The results provided by the static tests and the long lasting quasi-static test have been condensed in tables and figures. Although many of the figures and tables given in chapter 7, comparing the results obtained in the different tests performed, may be considered as conclusive, no formal conclusions have been included in this report. After those results have been properly discussed, on the light of the information provided in other RIVAS documents, and compared with the data obtained in other rig and in situ tests, conclusions suitable to be inserted in RIVAS final reports will be drawn.
RIVAS SCP0-GA-2010-265754
RIVAS_CEDEX_WP3_D3_7_PART_A_FINAL Page 5 of 241 07/06/2013
1 INTRODUCTION
In the framework of the EC FP7 project Railway Induced Vibration Abatement Solutions (RIVAS) work package 3 (WP3) deals with track vibrations at source and the mitigation measures at the track itself. Within that work package, Task 3.2 focusses on vibration mitigation measures for ballasted track by optimizing rail fastening system, sleeper and sleeper/substructure interaction. Concerning the optimisation of the sleeper and the sleeper/substructure interaction, 13 units of a prototype sleeper with hard rail pads and soft under-sleeper pads have been manufactured and delivered by RAILONE to CEDEX to be tested under realistic conditions (i.e. realistic traffic scenarios with different speeds) in its big dimension track box. The main objective of the short lasting insertion loss tests performed in the track box has been to shed light, under well defined track substructure conditions and a good testing control system, on the vertical vibration insertion loss capacity of the new sleepers as compared with the standard sleepers. To that aim, constant high amplitude quasi-static load time histories, with frequencies according to the geometric distribution of axles and bogies in EU trains travelling at 300 km/h and 120 km/h, have been generated in the track box using a set of computer controlled 250 kN and 50 Hz servo-hydraulic cylinders. For the generation of a variable low amplitude high frequency dynamic load time history, simulating the passage of an EU freight vehicle travelling at 120 km/h over the track vertical irregularities of a given track, a couple of servo-hydraulic cylinders, one on each rail, has been used in conjunction with two 20 kN and 300 Hz piezoelectric shakers. Besides the short lasting insertion loss tests run with the two types of vibration source mentioned above, other receptance and static loading tests have been carried out to characterize the track systems and ballast states used. Also a long lasting quasi-static test with 2M freight vehicle axle loads has been performed. In chapter 2, the CEDEX track box and its capacity to simulate the track effects of vertical loads moving horizontally are described. The sensor systems used in the tests and the data acquisition and measuring systems employed are also described in that chapter. In chapter 3, the properties and dimensions of the physical model used to run the tests are presented. In chapter 4, the quasi-static and dynamic load time histories previously cited are defined and the process adopted to derive the PSD function of the dynamic forces is fully explained. In chapter 5, the track systems and ballast states analysed are described and reference is made to Appendix 1 where the results of the compression tests made in CEDEX with the two types of rail pad used are collected. In chapter 6, the types of test performed are described and the testing routine adopted for each one of them is identified. Finally, in chapter 7 the results obtained in the different tests performed for the RIVAS project are presented. A series of tables have been produced summarizing the comparative study of the track receptance functions obtained with different procedures (Appendix 2) and the velocity and acceleration insertion losses achieved in the track elements with different vibration sources (Appendix 3). The results provided by the static tests and the long lasting quasi-static test have been also condensed in tables and figures.

RIVAS SCP0-GA-2010-265754
RIVAS_CEDEX_WP3_D3_7_PART_A_FINAL Page 6 of 241 07/06/2013
RIVAS SCP0-GA-2010-265754
RIVAS_CEDEX_WP3_D3_7_PART_A_FINAL Page 7 of 241 07/06/2013
2 CEDEX TRACK BOX
2.1 Description
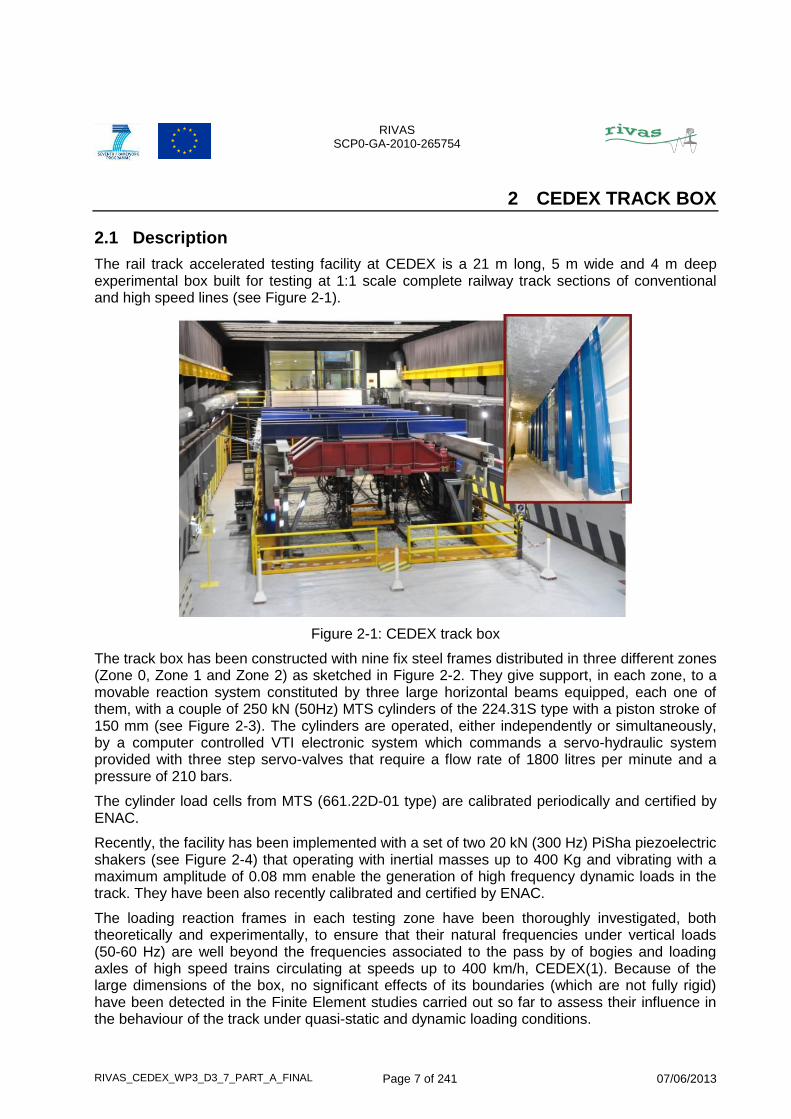
The rail track accelerated testing facility at CEDEX is a 21 m long, 5 m wide and 4 m deep experimental box built for testing at 1:1 scale complete railway track sections of conventional and high speed lines (see Figure 2-1).
Figure 2-1: CEDEX track box
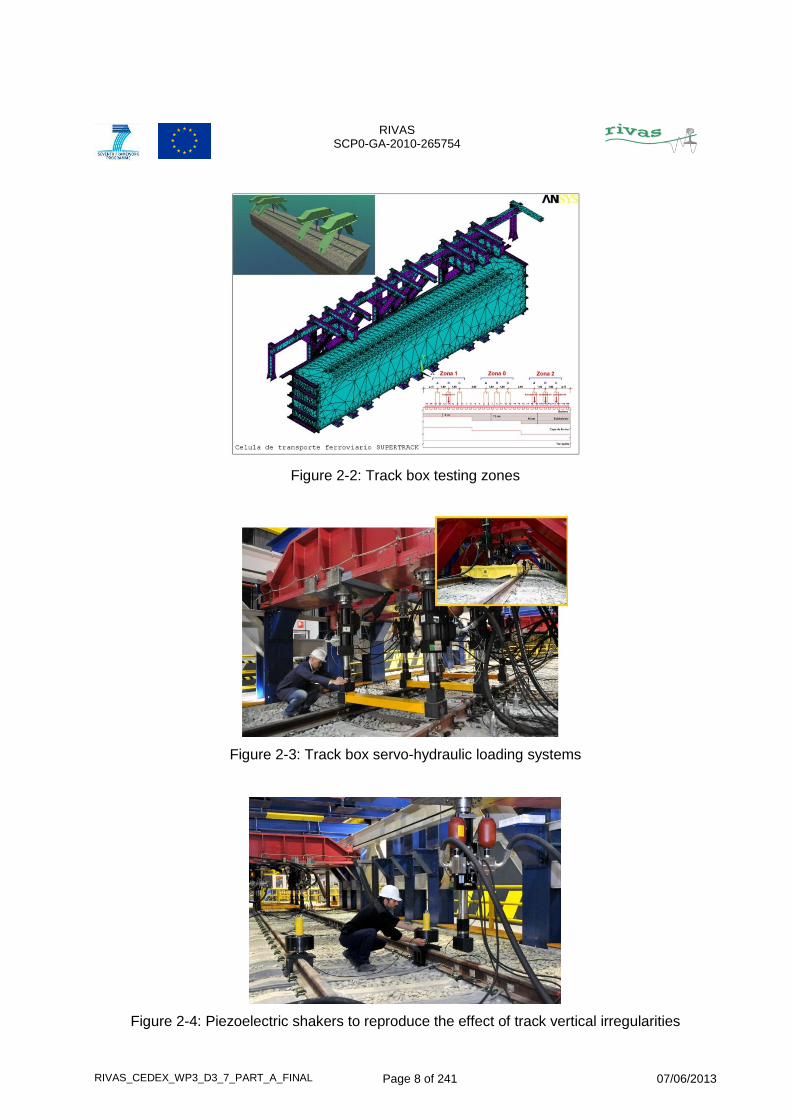
The track box has been constructed with nine fix steel frames distributed in three different zones (Zone 0, Zone 1 and Zone 2) as sketched in Figure 2-2. They give support, in each zone, to a movable reaction system constituted by three large horizontal beams equipped, each one of them, with a couple of 250 kN (50Hz) MTS cylinders of the 224.31S type with a piston stroke of 150 mm (see Figure 2-3). The cylinders are operated, either independently or simultaneously, by a computer controlled VTI electronic system which commands a servo-hydraulic system provided with three step servo-valves that require a flow rate of 1800 litres per minute and a pressure of 210 bars.
The cylinder load cells from MTS (661.22D-01 type) are calibrated periodically and certified by ENAC.
Recently, the facility has been implemented with a set of two 20 kN (300 Hz) PiSha piezoelectric shakers (see Figure 2-4) that operating with inertial masses up to 400 Kg and vibrating with a maximum amplitude of 0.08 mm enable the generation of high frequency dynamic loads in the track. They have been also recently calibrated and certified by ENAC.
The loading reaction frames in each testing zone have been thoroughly investigated, both theoretically and experimentally, to ensure that their natural frequencies under vertical loads (50-60 Hz) are well beyond the frequencies associated to the pass by of bogies and loading axles of high speed trains circulating at speeds up to 400 km/h, CEDEX(1). Because of the large dimensions of the box, no significant effects of its boundaries (which are not fully rigid) have been detected in the Finite Element studies carried out so far to assess their influence in the behaviour of the track under quasi-static and dynamic loading conditions.
RIVAS SCP0-GA-2010-265754
RIVAS_CEDEX_WP3_D3_7_PART_A_FINAL Page 8 of 241 07/06/2013
Figure 2-2: Track box testing zones
Figure 2-3: Track box servo-hydraulic loading systems
Figure 2-4: Piezoelectric shakers to reproduce the effect of track vertical irregularities
RIVAS SCP0-GA-2010-265754
RIVAS_CEDEX_WP3_D3_7_PART_A_FINAL Page 9 of 241 07/06/2013
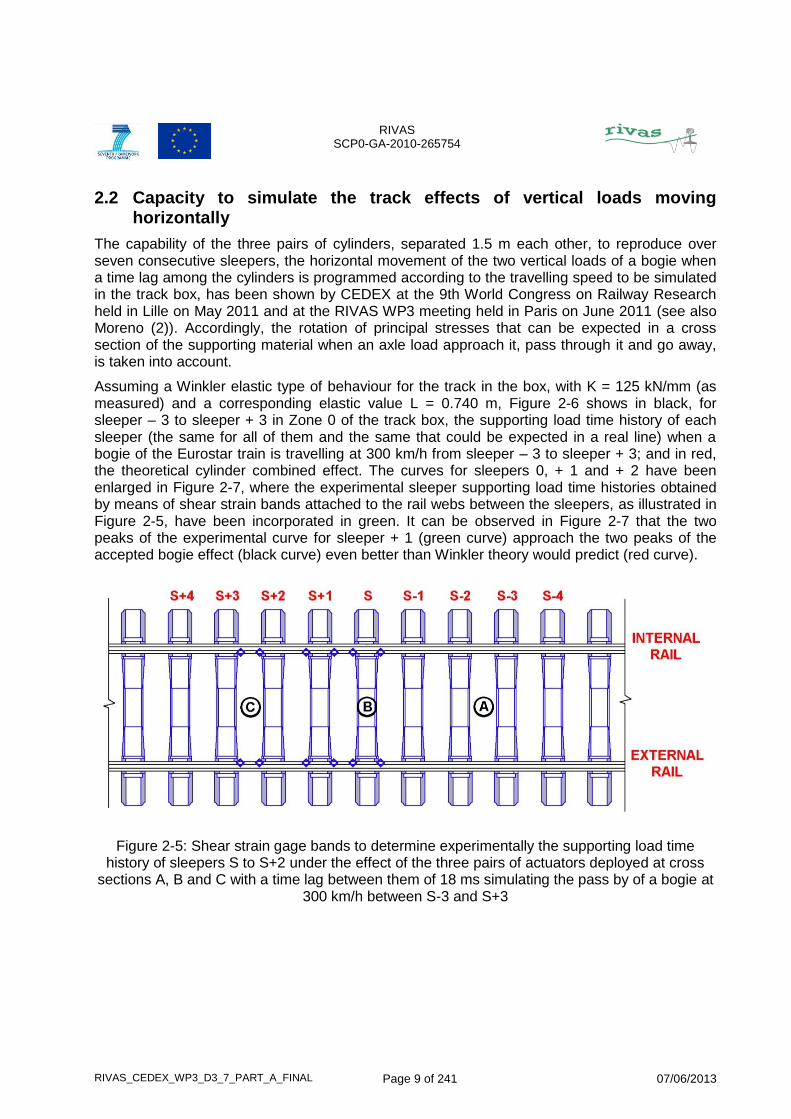
2.2 Capacity to simulate the track effects of vertical loads moving horizontally
The capability of the three pairs of cylinders, separated 1.5 m each other, to reproduce over seven consecutive sleepers, the horizontal movement of the two vertical loads of a bogie when a time lag among the cylinders is programmed according to the travelling speed to be simulated in the track box, has been shown by CEDEX at the 9th World Congress on Railway Research held in Lille on May 2011 and at the RIVAS WP3 meeting held in Paris on June 2011 (see also Moreno (2)). Accordingly, the rotation of principal stresses that can be expected in a cross section of the supporting material when an axle load approach it, pass through it and go away, is taken into account.
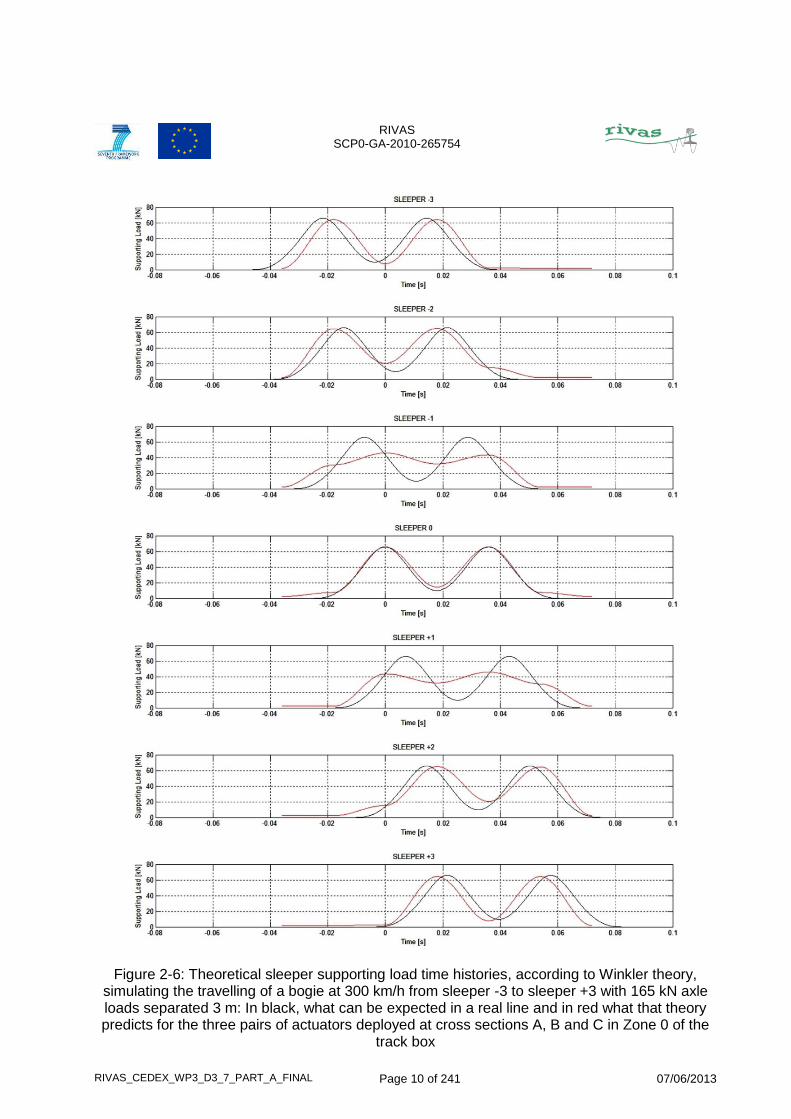
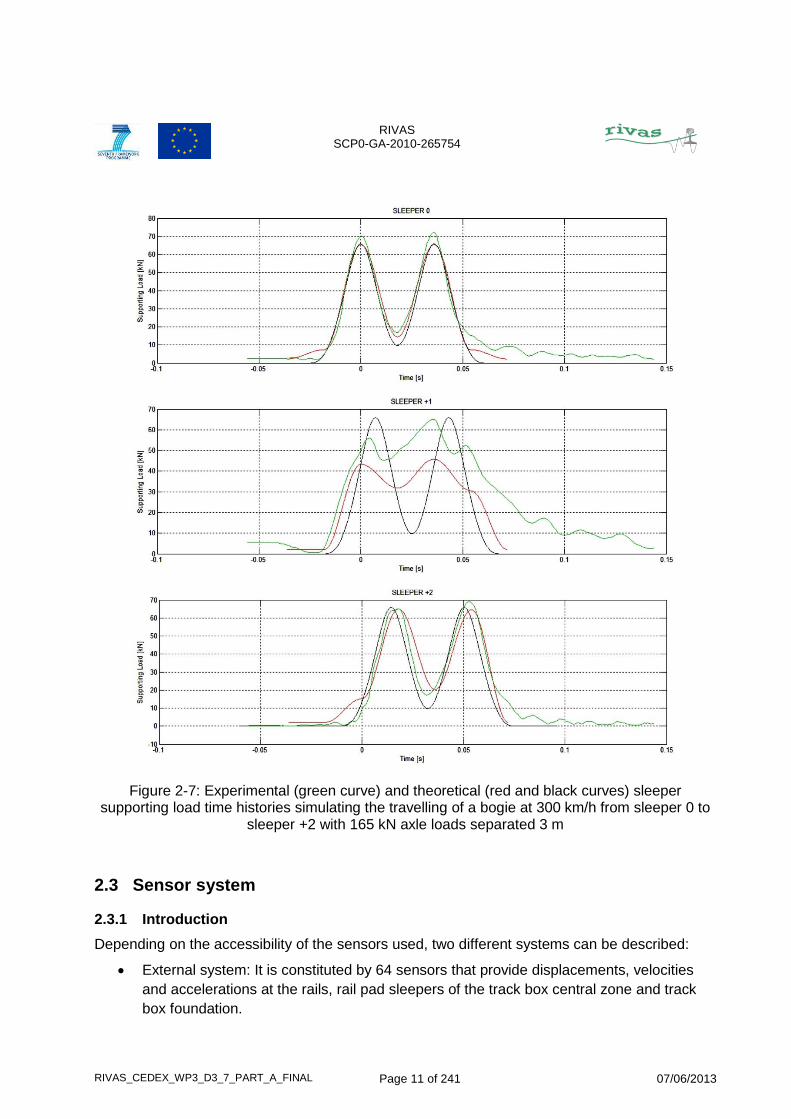
Assuming a Winkler elastic type of behaviour for the track in the box, with K = 125 kN/mm (as measured) and a corresponding elastic value L = 0.740 m, Figure 2-6 shows in black, for sleeper – 3 to sleeper + 3 in Zone 0 of the track box, the supporting load time history of each sleeper (the same for all of them and the same that could be expected in a real line) when a bogie of the Eurostar train is travelling at 300 km/h from sleeper – 3 to sleeper + 3; and in red, the theoretical cylinder combined effect. The curves for sleepers 0, + 1 and + 2 have been enlarged in Figure 2-7, where the experimental sleeper supporting load time histories obtained by means of shear strain bands attached to the rail webs between the sleepers, as illustrated in Figure 2-5, have been incorporated in green. It can be observed in Figure 2-7 that the two peaks of the experimental curve for sleeper + 1 (green curve) approach the two peaks of the accepted bogie effect (black curve) even better than Winkler theory would predict (red curve).
Figure 2-5: Shear strain gage bands to determine experimentally the supporting load time history of sleepers S to S+2 under the effect of the three pairs of actuators deployed at cross
sections A, B and C with a time lag between them of 18 ms simulating the pass by of a bogie at 300 km/h between S-3 and S+3
RIVAS SCP0-GA-2010-265754
RIVAS_CEDEX_WP3_D3_7_PART_A_FINAL Page 10 of 241 07/06/2013
Figure 2-6: Theoretical sleeper supporting load time histories, according to Winkler theory, simulating the travelling of a bogie at 300 km/h from sleeper -3 to sleeper +3 with 165 kN axle loads separated 3 m: In black, what can be expected in a real line and in red what that theory predicts for the three pairs of actuators deployed at cross sections A, B and C in Zone 0 of the
track box
RIVAS SCP0-GA-2010-265754
RIVAS_CEDEX_WP3_D3_7_PART_A_FINAL Page 11 of 241 07/06/2013
Figure 2-7: Experimental (green curve) and theoretical (red and black curves) sleeper supporting load time histories simulating the travelling of a bogie at 300 km/h from sleeper 0 to
sleeper +2 with 165 kN axle loads separated 3 m
2.3 Sensor system
2.3.1 Introduction
Depending on the accessibility of the sensors used, two different systems can be described:
External system: It is constituted by 64 sensors that provide displacements, velocities
and accelerations at the rails, rail pad sleepers of the track box central zone and track
box foundation.
RIVAS SCP0-GA-2010-265754
RIVAS_CEDEX_WP3_D3_7_PART_A_FINAL Page 12 of 241 07/06/2013
Internal system: It has been made up of 24 sensors distributed in the ballast layer, the
bituminous subballast layer and the form layer, embankment at cross sections -2, 0 and
+2.
2.3.2 External System
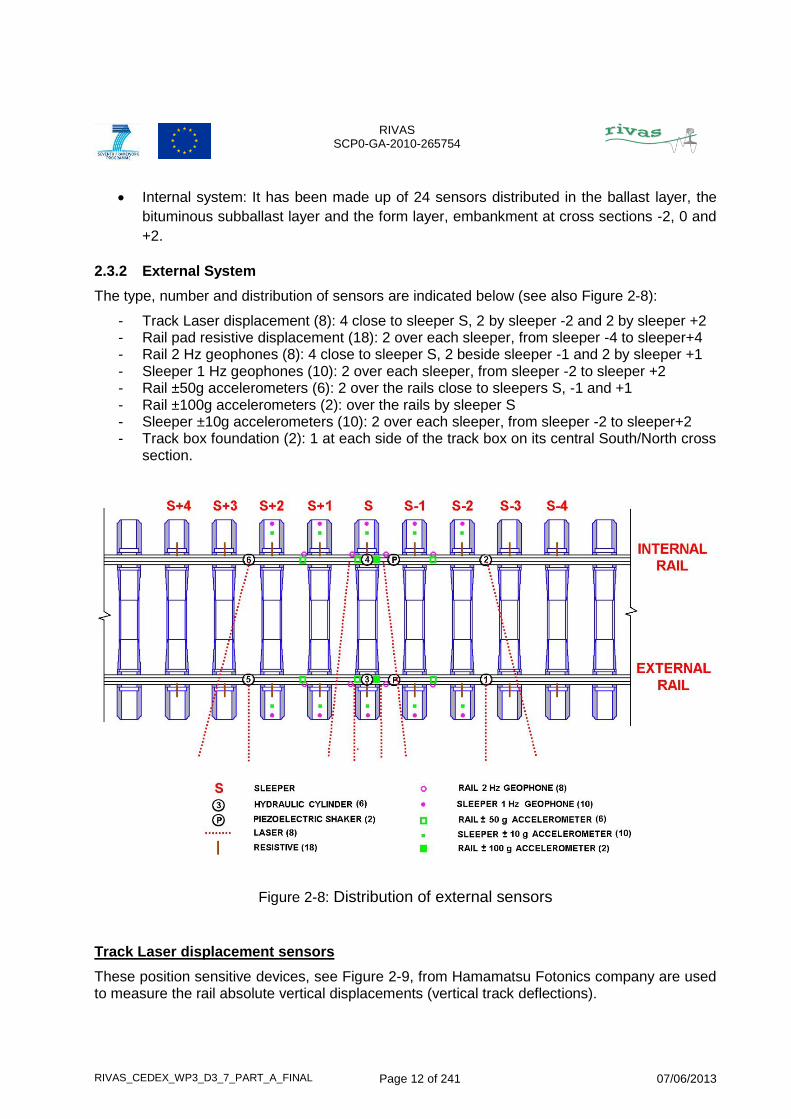
The type, number and distribution of sensors are indicated below (see also Figure 2-8):
- Track Laser displacement (8): 4 close to sleeper S, 2 by sleeper -2 and 2 by sleeper +2 - Rail pad resistive displacement (18): 2 over each sleeper, from sleeper -4 to sleeper+4 - Rail 2 Hz geophones (8): 4 close to sleeper S, 2 beside sleeper -1 and 2 by sleeper +1 - Sleeper 1 Hz geophones (10): 2 over each sleeper, from sleeper -2 to sleeper +2 - Rail ±50g accelerometers (6): 2 over the rails close to sleepers S, -1 and +1 - Rail ±100g accelerometers (2): over the rails by sleeper S - Sleeper ±10g accelerometers (10): 2 over each sleeper, from sleeper -2 to sleeper+2 - Track box foundation (2): 1 at each side of the track box on its central South/North cross
section.
Figure 2-8: Distribution of external sensors
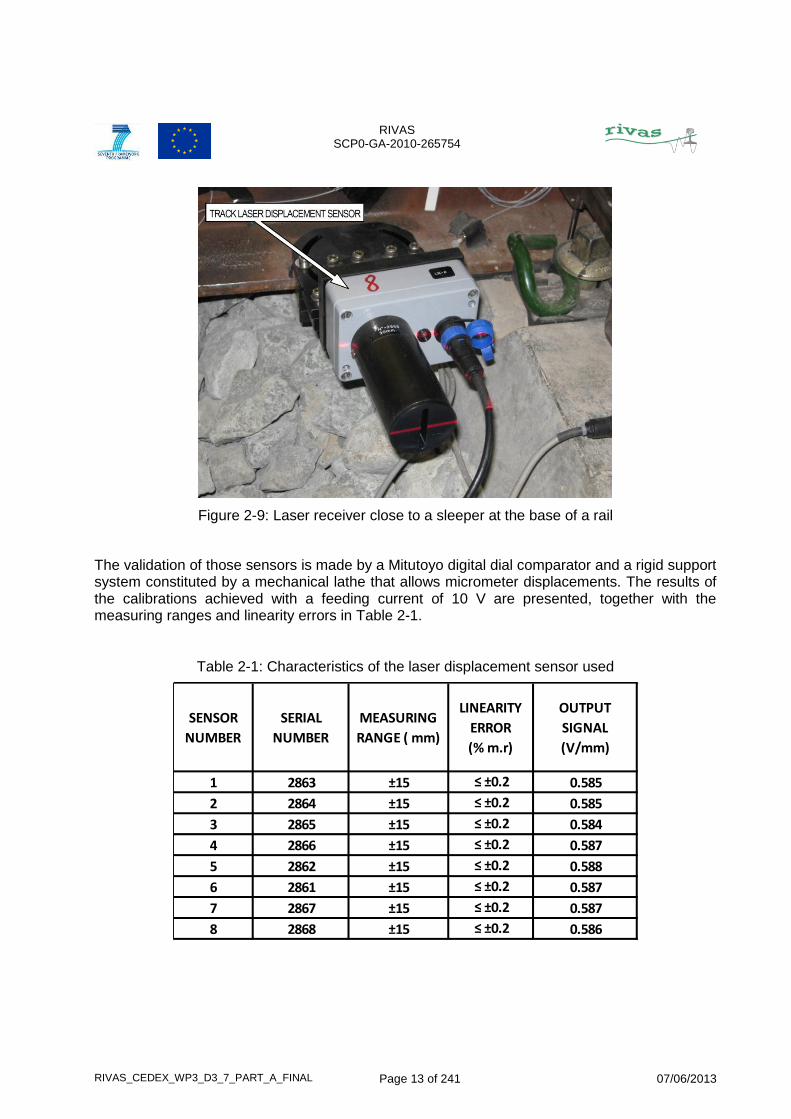
Track Laser displacement sensors
These position sensitive devices, see Figure 2-9, from Hamamatsu Fotonics company are used to measure the rail absolute vertical displacements (vertical track deflections).
RIVAS SCP0-GA-2010-265754
RIVAS_CEDEX_WP3_D3_7_PART_A_FINAL Page 13 of 241 07/06/2013
Figure 2-9: Laser receiver close to a sleeper at the base of a rail
The validation of those sensors is made by a Mitutoyo digital dial comparator and a rigid support system constituted by a mechanical lathe that allows micrometer displacements. The results of the calibrations achieved with a feeding current of 10 V are presented, together with the measuring ranges and linearity errors in Table 2-1.
Table 2-1: Characteristics of the laser displacement sensor used
SENSOR
NUMBER
SERIAL
NUMBER
MEASURING
RANGE ( mm)
LINEARITY
ERROR
(% m.r)
OUTPUT
SIGNAL
(V/mm)
1 2863 ±15 ≤ ±0.2 0.585
2 2864 ±15 ≤ ±0.2 0.585
3 2865 ±15 ≤ ±0.2 0.584
4 2866 ±15 ≤ ±0.2 0.587
5 2862 ±15 ≤ ±0.2 0.588
6 2861 ±15 ≤ ±0.2 0.587
7 2867 ±15 ≤ ±0.2 0.587
8 2868 ±15 ≤ ±0.2 0.586
RIVAS SCP0-GA-2010-265754
RIVAS_CEDEX_WP3_D3_7_PART_A_FINAL Page 14 of 241 07/06/2013
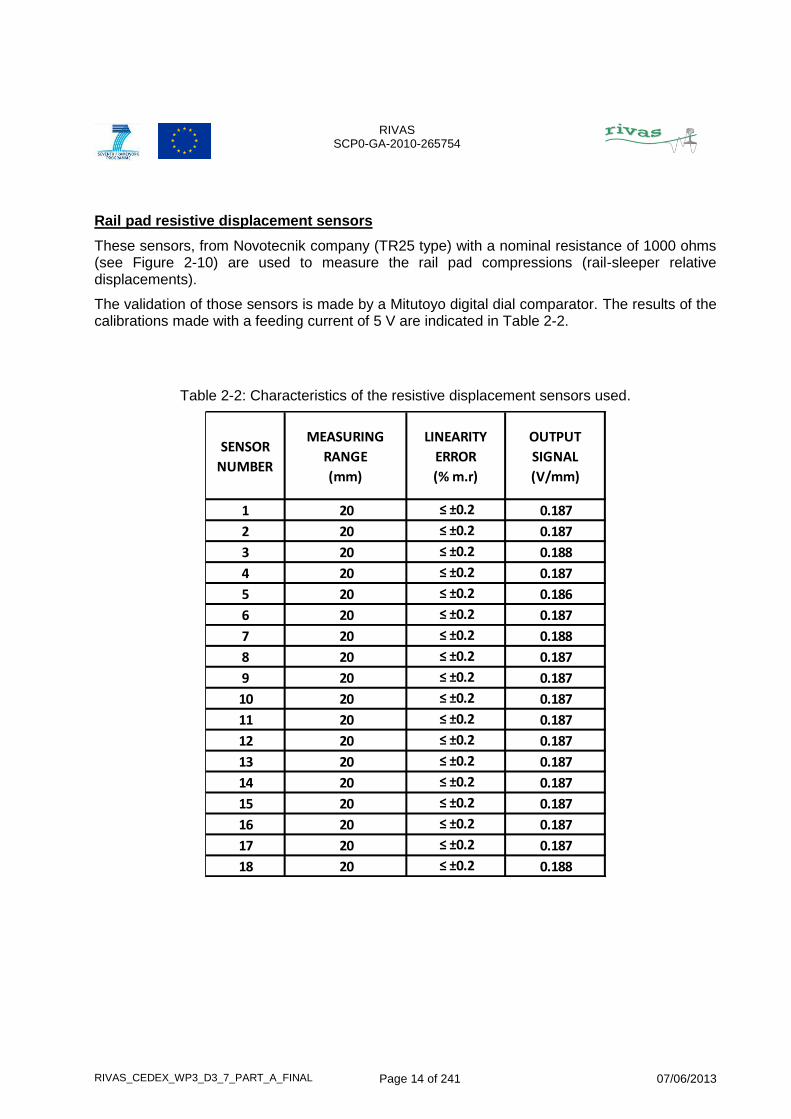
Rail pad resistive displacement sensors
These sensors, from Novotecnik company (TR25 type) with a nominal resistance of 1000 ohms (see Figure 2-10) are used to measure the rail pad compressions (rail-sleeper relative displacements).
The validation of those sensors is made by a Mitutoyo digital dial comparator. The results of the calibrations made with a feeding current of 5 V are indicated in Table 2-2.
Table 2-2: Characteristics of the resistive displacement sensors used.
SENSOR
NUMBER
MEASURING
RANGE
(mm)
LINEARITY
ERROR
(% m.r)
OUTPUT
SIGNAL
(V/mm)
1 20 ≤ ±0.2 0.187
2 20 ≤ ±0.2 0.187
3 20 ≤ ±0.2 0.188
4 20 ≤ ±0.2 0.187
5 20 ≤ ±0.2 0.186
6 20 ≤ ±0.2 0.187
7 20 ≤ ±0.2 0.188
8 20 ≤ ±0.2 0.187
9 20 ≤ ±0.2 0.187
10 20 ≤ ±0.2 0.187
11 20 ≤ ±0.2 0.187
12 20 ≤ ±0.2 0.187
13 20 ≤ ±0.2 0.187
14 20 ≤ ±0.2 0.187
15 20 ≤ ±0.2 0.187
16 20 ≤ ±0.2 0.187
17 20 ≤ ±0.2 0.187
18 20 ≤ ±0.2 0.188
RIVAS SCP0-GA-2010-265754
RIVAS_CEDEX_WP3_D3_7_PART_A_FINAL Page 15 of 241 07/06/2013
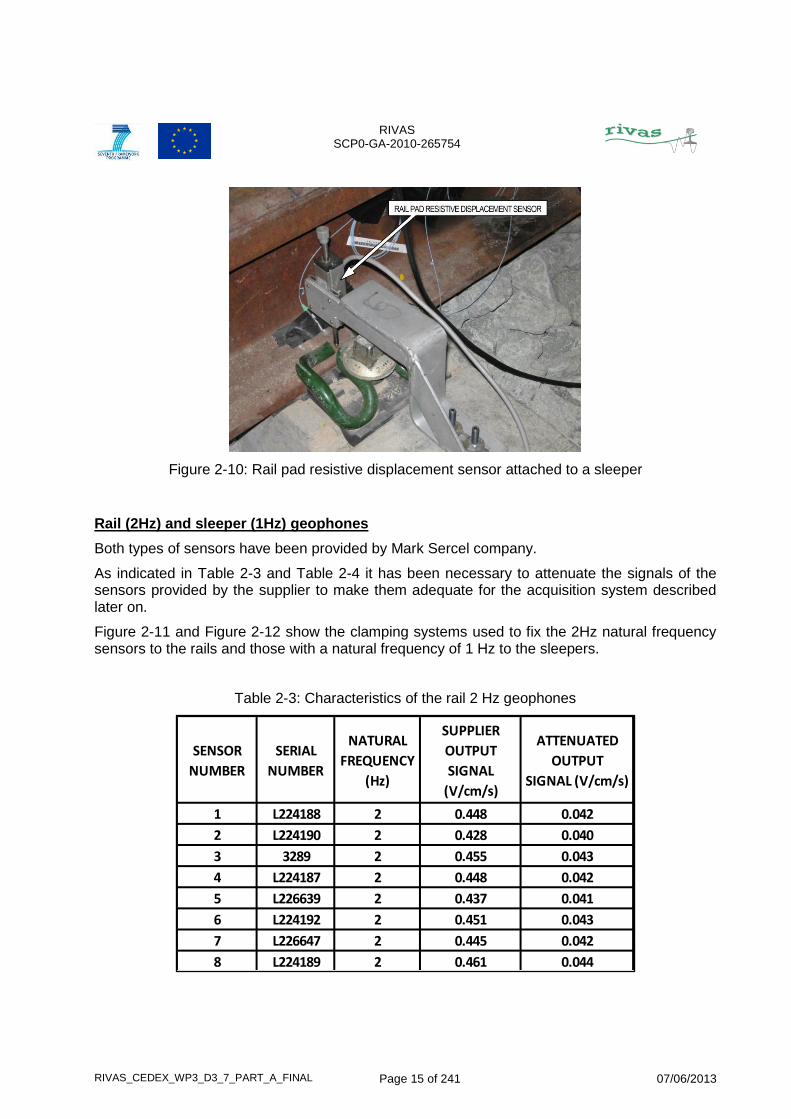
Figure 2-10: Rail pad resistive displacement sensor attached to a sleeper
Rail (2Hz) and sleeper (1Hz) geophones
Both types of sensors have been provided by Mark Sercel company.
As indicated in Table 2-3 and Table 2-4 it has been necessary to attenuate the signals of the sensors provided by the supplier to make them adequate for the acquisition system described later on.
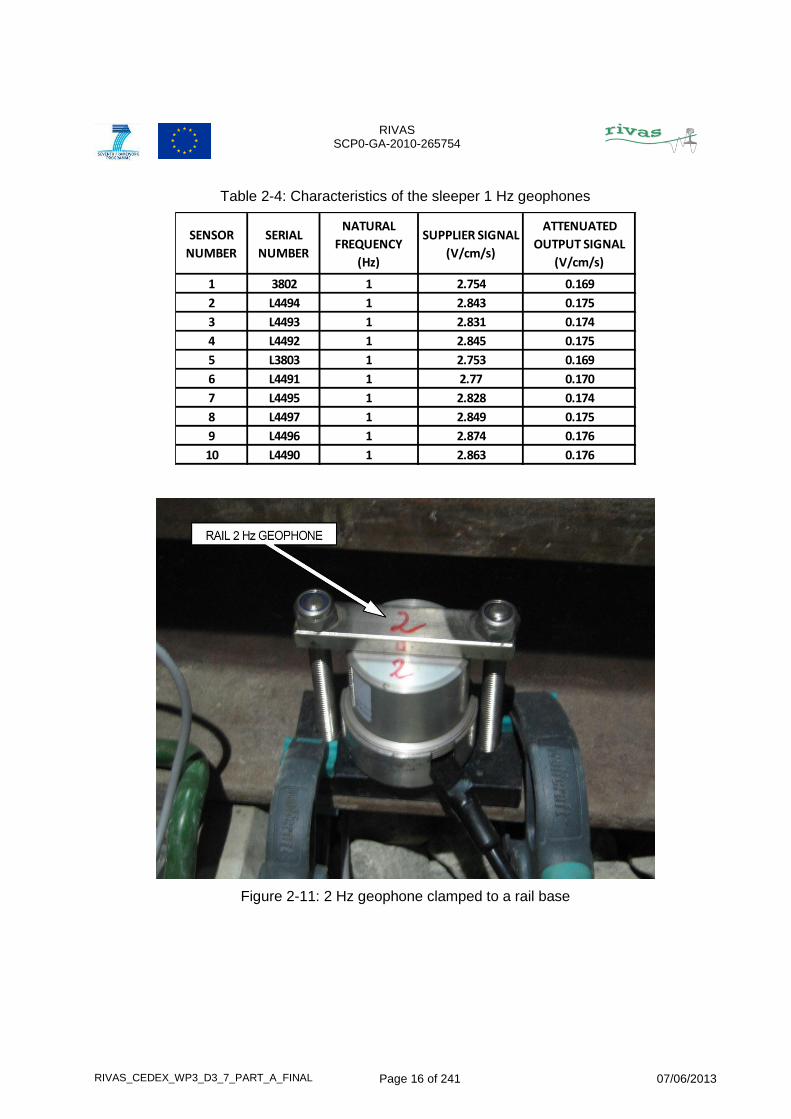
Figure 2-11 and Figure 2-12 show the clamping systems used to fix the 2Hz natural frequency sensors to the rails and those with a natural frequency of 1 Hz to the sleepers.
Table 2-3: Characteristics of the rail 2 Hz geophones
SENSOR
NUMBER
SERIAL
NUMBER
NATURAL
FREQUENCY
(Hz)
SUPPLIER
OUTPUT
SIGNAL
(V/cm/s)
ATTENUATED
OUTPUT
SIGNAL (V/cm/s)
1 L224188 2 0.448 0.042
2 L224190 2 0.428 0.040
3 3289 2 0.455 0.043
4 L224187 2 0.448 0.042
5 L226639 2 0.437 0.041
6 L224192 2 0.451 0.043
7 L226647 2 0.445 0.042
8 L224189 2 0.461 0.044
0.447 0.042AVERAGE
RIVAS SCP0-GA-2010-265754
RIVAS_CEDEX_WP3_D3_7_PART_A_FINAL Page 16 of 241 07/06/2013
Table 2-4: Characteristics of the sleeper 1 Hz geophones
Figure 2-11: 2 Hz geophone clamped to a rail base
SENSOR
NUMBER
SERIAL
NUMBER
NATURAL
FREQUENCY
(Hz)
SUPPLIER SIGNAL
(V/cm/s)
ATTENUATED
OUTPUT SIGNAL
(V/cm/s)
1 3802 1 2.754 0.169
2 L4494 1 2.843 0.175
3 L4493 1 2.831 0.174
4 L4492 1 2.845 0.175
5 L3803 1 2.753 0.169
6 L4491 1 2.77 0.170
7 L4495 1 2.828 0.174
8 L4497 1 2.849 0.175
9 L4496 1 2.874 0.176
10 L4490 1 2.863 0.176
2.827 0.174AVERAGE
RIVAS SCP0-GA-2010-265754
RIVAS_CEDEX_WP3_D3_7_PART_A_FINAL Page 17 of 241 07/06/2013
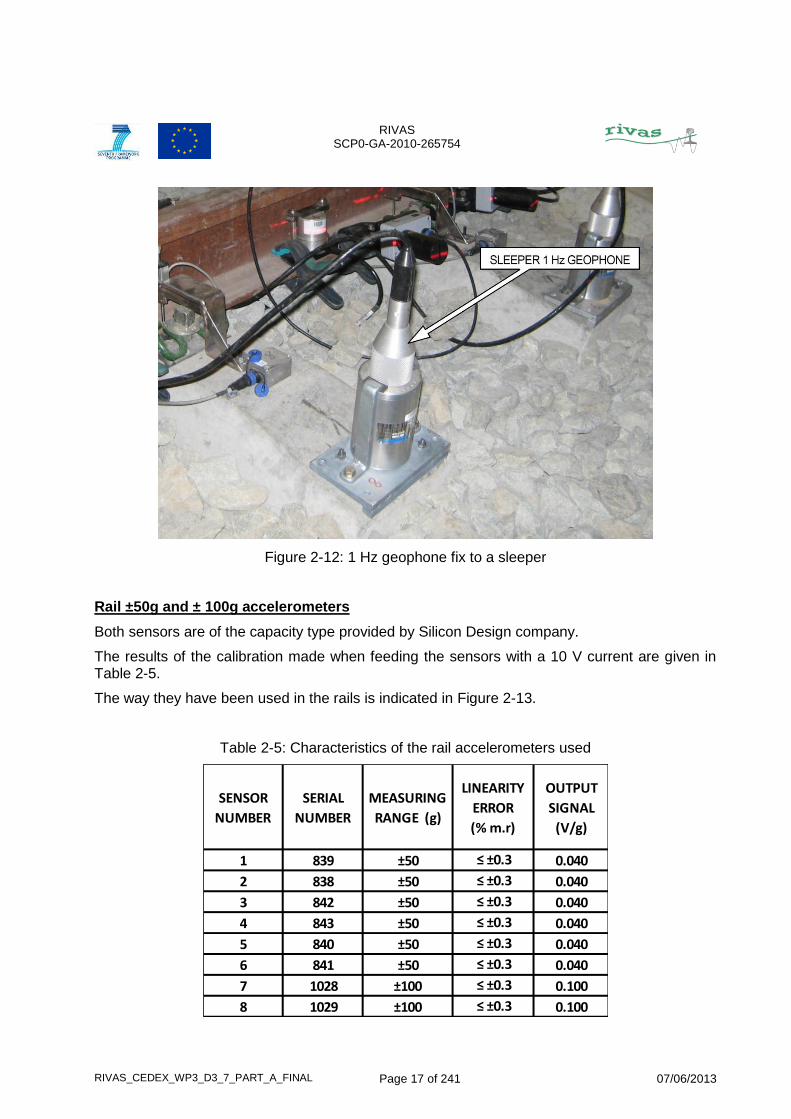
Figure 2-12: 1 Hz geophone fix to a sleeper
Rail ±50g and ± 100g accelerometers
Both sensors are of the capacity type provided by Silicon Design company.
The results of the calibration made when feeding the sensors with a 10 V current are given in Table 2-5.
The way they have been used in the rails is indicated in Figure 2-13.
Table 2-5: Characteristics of the rail accelerometers used
SENSOR
NUMBER
SERIAL
NUMBER
MEASURING
RANGE (g)
LINEARITY
ERROR
(% m.r)
OUTPUT
SIGNAL
(V/g)
1 839 ±50 ≤ ±0.3 0.040
2 838 ±50 ≤ ±0.3 0.040
3 842 ±50 ≤ ±0.3 0.040
4 843 ±50 ≤ ±0.3 0.040
5 840 ±50 ≤ ±0.3 0.040
6 841 ±50 ≤ ±0.3 0.040
7 1028 ±100 ≤ ±0.3 0.100
8 1029 ±100 ≤ ±0.3 0.100
RIVAS SCP0-GA-2010-265754
RIVAS_CEDEX_WP3_D3_7_PART_A_FINAL Page 18 of 241 07/06/2013
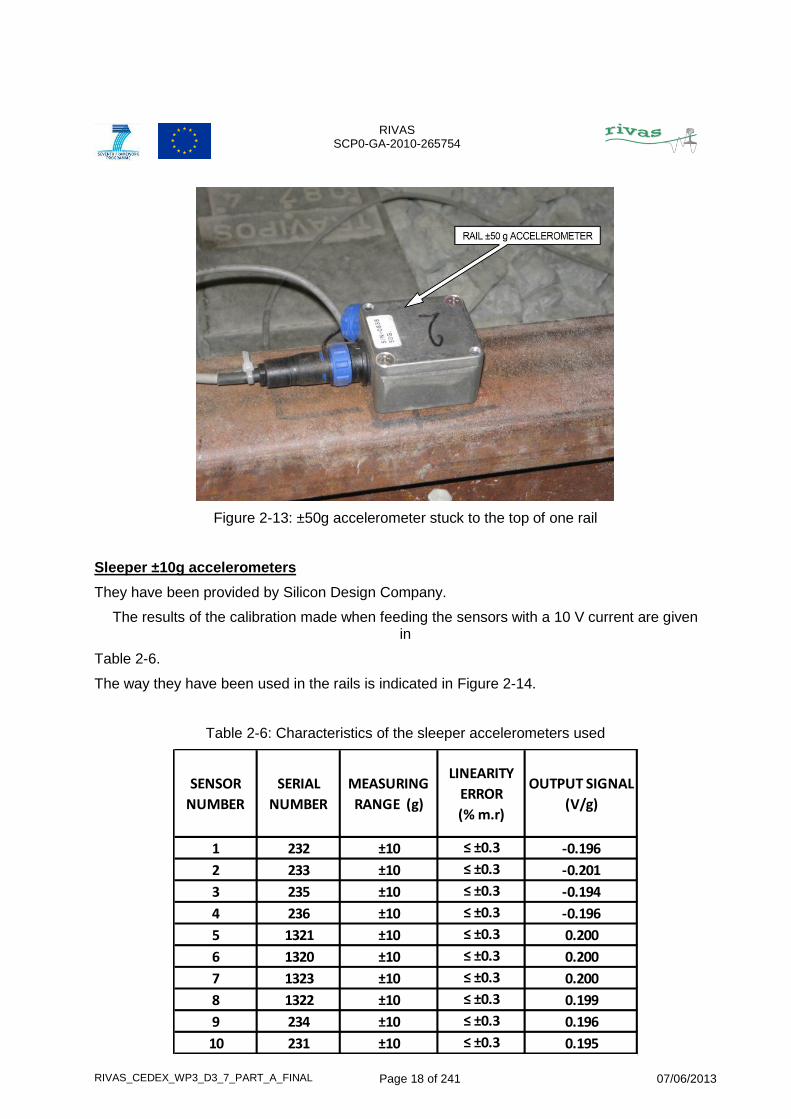
Figure 2-13: ±50g accelerometer stuck to the top of one rail
Sleeper ±10g accelerometers
They have been provided by Silicon Design Company.
The results of the calibration made when feeding the sensors with a 10 V current are given in
Table 2-6.
The way they have been used in the rails is indicated in Figure 2-14.
Table 2-6: Characteristics of the sleeper accelerometers used
SENSOR
NUMBER
SERIAL
NUMBER
MEASURING
RANGE (g)
LINEARITY
ERROR
(% m.r)
OUTPUT SIGNAL
(V/g)
1 232 ±10 ≤ ±0.3 -0.196
2 233 ±10 ≤ ±0.3 -0.201
3 235 ±10 ≤ ±0.3 -0.194
4 236 ±10 ≤ ±0.3 -0.196
5 1321 ±10 ≤ ±0.3 0.200
6 1320 ±10 ≤ ±0.3 0.200
7 1323 ±10 ≤ ±0.3 0.200
8 1322 ±10 ≤ ±0.3 0.199
9 234 ±10 ≤ ±0.3 0.196
10 231 ±10 ≤ ±0.3 0.195
RIVAS SCP0-GA-2010-265754
RIVAS_CEDEX_WP3_D3_7_PART_A_FINAL Page 19 of 241 07/06/2013
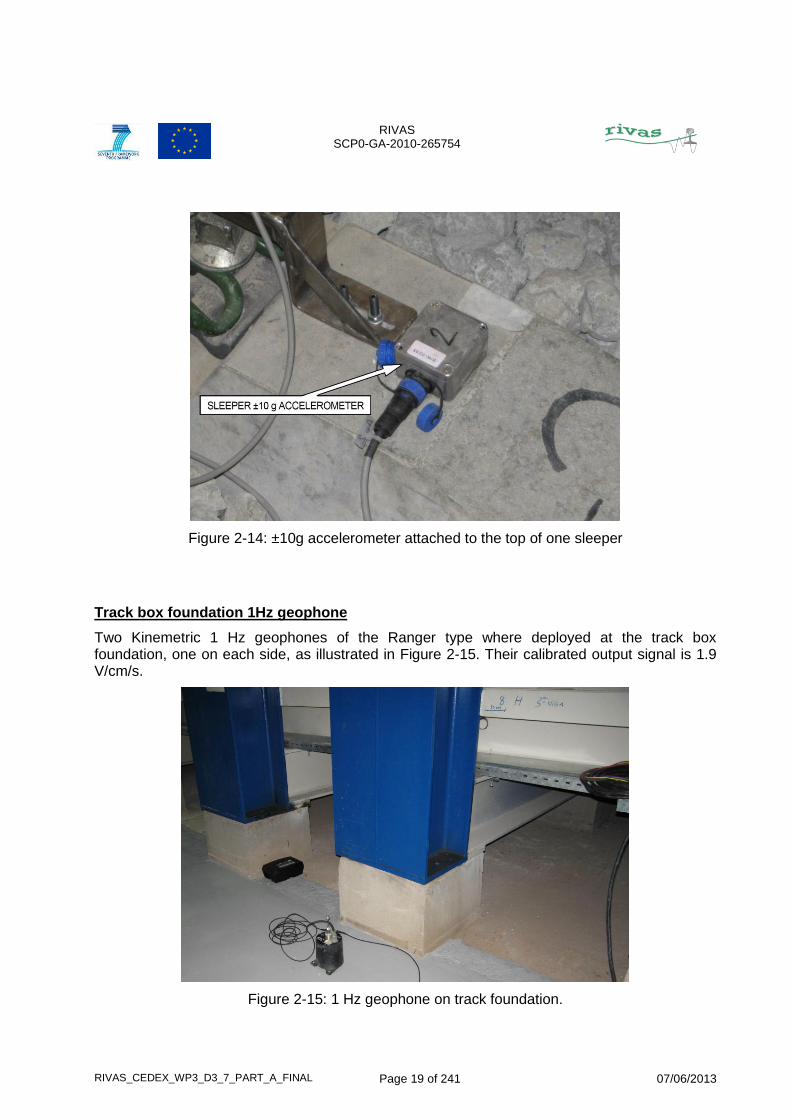
Figure 2-14: ±10g accelerometer attached to the top of one sleeper
Track box foundation 1Hz geophone
Two Kinemetric 1 Hz geophones of the Ranger type where deployed at the track box foundation, one on each side, as illustrated in Figure 2-15. Their calibrated output signal is 1.9 V/cm/s.
Figure 2-15: 1 Hz geophone on track foundation.
RIVAS SCP0-GA-2010-265754
RIVAS_CEDEX_WP3_D3_7_PART_A_FINAL Page 20 of 241 07/06/2013
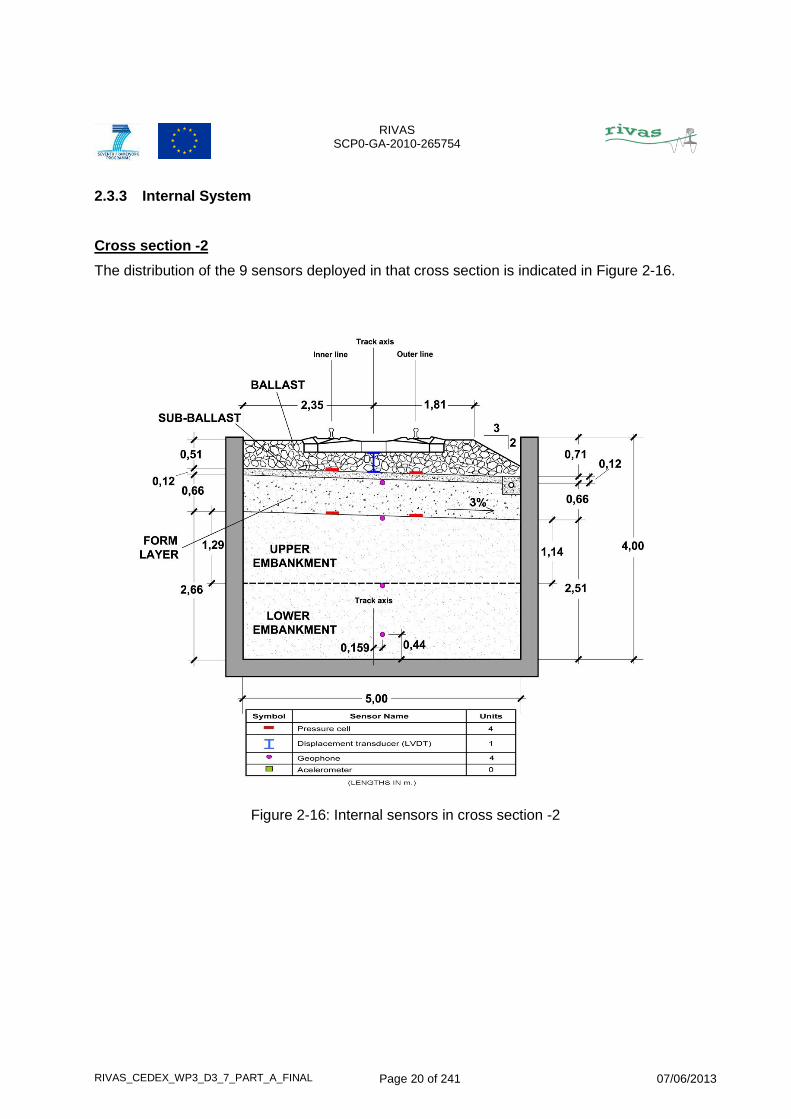
2.3.3 Internal System
Cross section -2
The distribution of the 9 sensors deployed in that cross section is indicated in Figure 2-16.
Figure 2-16: Internal sensors in cross section -2
RIVAS SCP0-GA-2010-265754
RIVAS_CEDEX_WP3_D3_7_PART_A_FINAL Page 21 of 241 07/06/2013
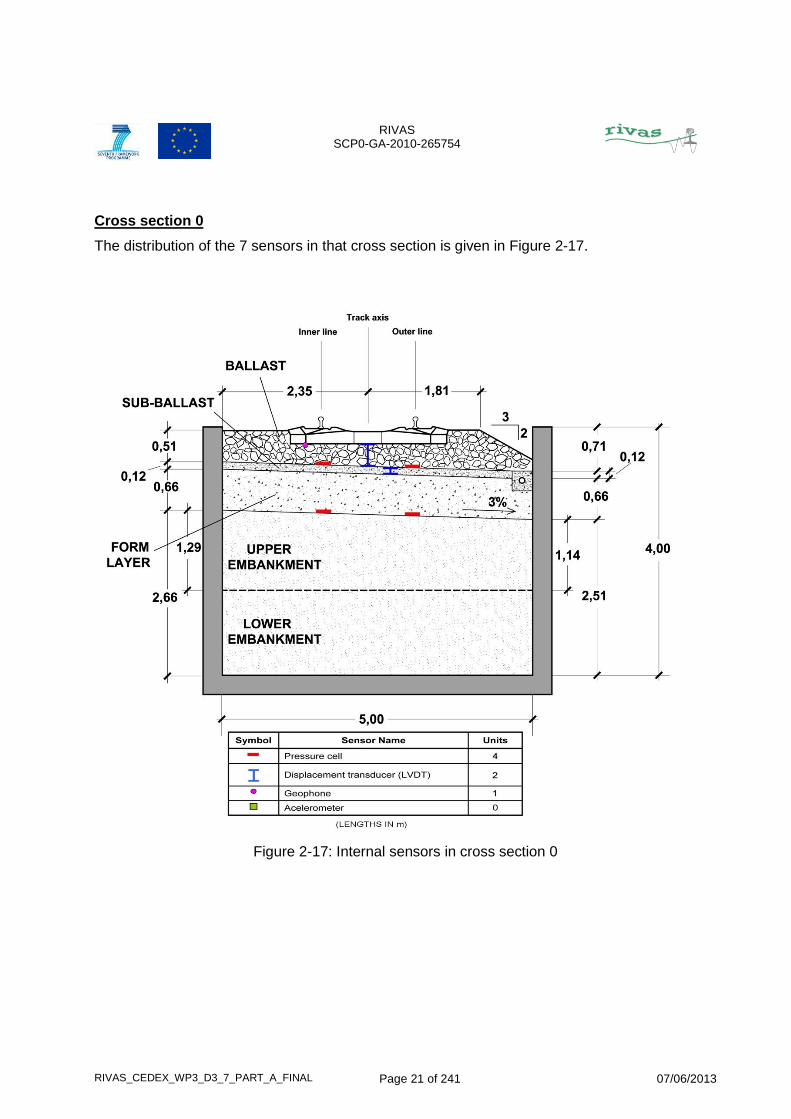
Cross section 0
The distribution of the 7 sensors in that cross section is given in Figure 2-17.
Figure 2-17: Internal sensors in cross section 0
RIVAS SCP0-GA-2010-265754
RIVAS_CEDEX_WP3_D3_7_PART_A_FINAL Page 22 of 241 07/06/2013
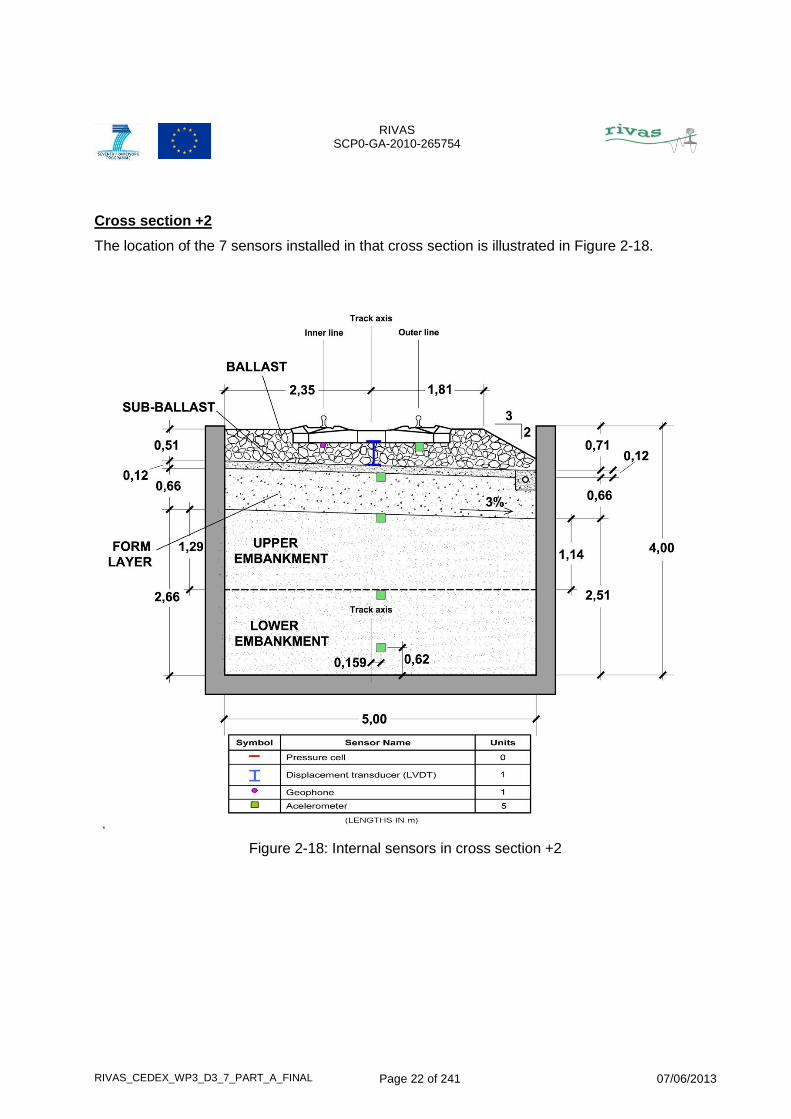
Cross section +2
The location of the 7 sensors installed in that cross section is illustrated in Figure 2-18.
.
Figure 2-18: Internal sensors in cross section +2
RIVAS SCP0-GA-2010-265754
RIVAS_CEDEX_WP3_D3_7_PART_A_FINAL Page 23 of 241 07/06/2013
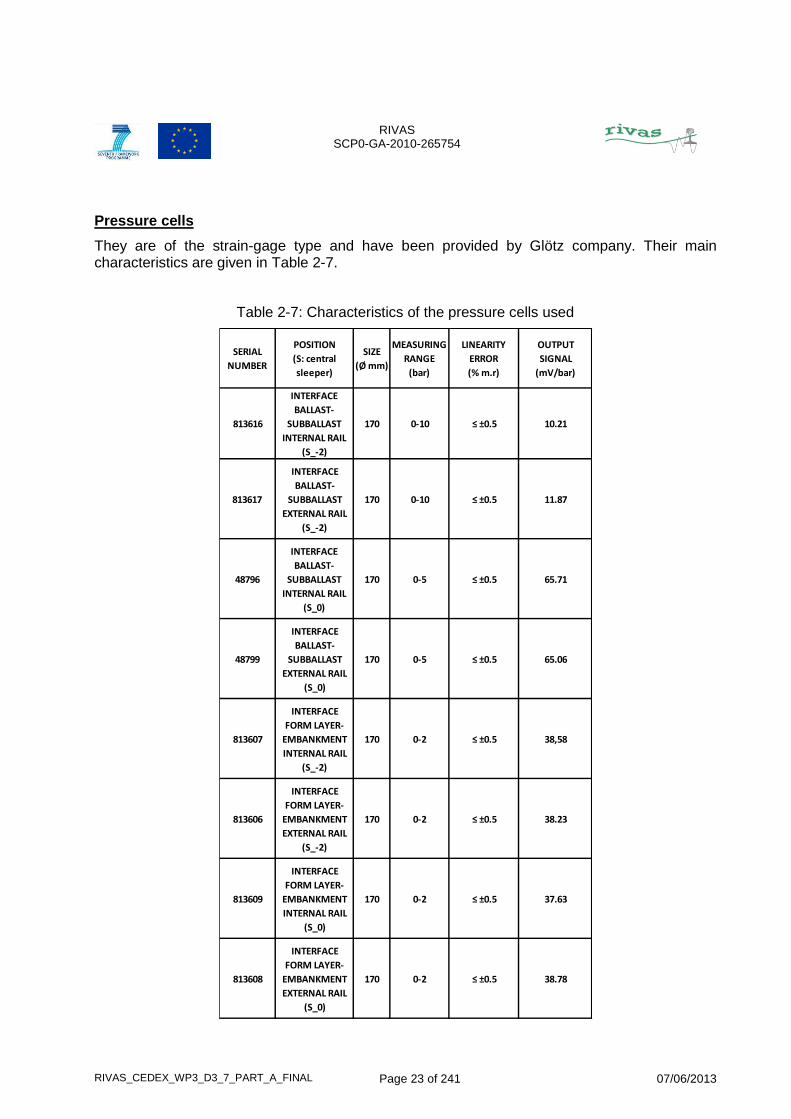
Pressure cells
They are of the strain-gage type and have been provided by Glötz company. Their main characteristics are given in Table 2-7.
Table 2-7: Characteristics of the pressure cells used
SERIAL
NUMBER
POSITION
(S: central
sleeper)
SIZE
(Ø mm)
MEASURING
RANGE
(bar)
LINEARITY
ERROR
(% m.r)
OUTPUT
SIGNAL
(mV/bar)
813616
INTERFACE
BALLAST-
SUBBALLAST
INTERNAL RAIL
(S_-2)
170 0-10 ≤ ±0.5 10.21
813617
INTERFACE
BALLAST-
SUBBALLAST
EXTERNAL RAIL
(S_-2)
170 0-10 ≤ ±0.5 11.87
48796
INTERFACE
BALLAST-
SUBBALLAST
INTERNAL RAIL
(S_0)
170 0-5 ≤ ±0.5 65.71
48799
INTERFACE
BALLAST-
SUBBALLAST
EXTERNAL RAIL
(S_0)
170 0-5 ≤ ±0.5 65.06
813607
INTERFACE
FORM LAYER-
EMBANKMENT
INTERNAL RAIL
(S_-2)
170 0-2 ≤ ±0.5 38,58
813606
INTERFACE
FORM LAYER-
EMBANKMENT
EXTERNAL RAIL
(S_-2)
170 0-2 ≤ ±0.5 38.23
813609
INTERFACE
FORM LAYER-
EMBANKMENT
INTERNAL RAIL
(S_0)
170 0-2 ≤ ±0.5 37.63
813608
INTERFACE
FORM LAYER-
EMBANKMENT
EXTERNAL RAIL
(S_0)
170 0-2 ≤ ±0.5 38.78
RIVAS SCP0-GA-2010-265754
RIVAS_CEDEX_WP3_D3_7_PART_A_FINAL Page 24 of 241 07/06/2013
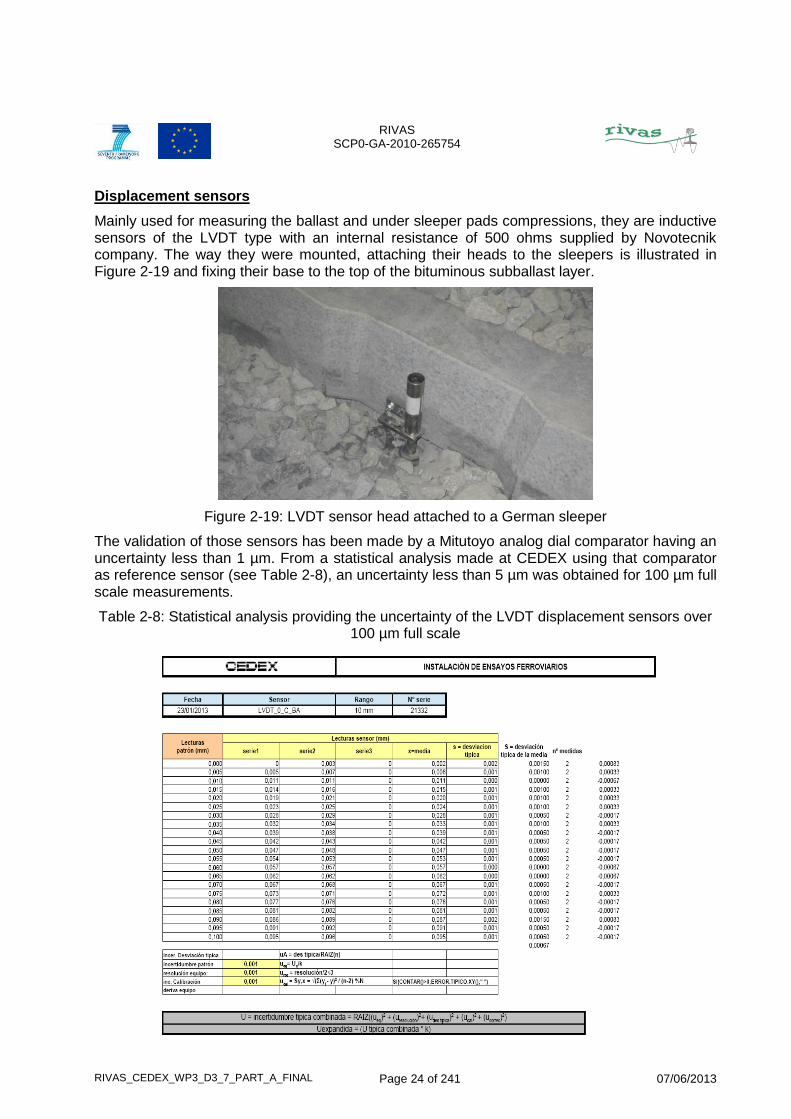
Displacement sensors
Mainly used for measuring the ballast and under sleeper pads compressions, they are inductive sensors of the LVDT type with an internal resistance of 500 ohms supplied by Novotecnik company. The way they were mounted, attaching their heads to the sleepers is illustrated in Figure 2-19 and fixing their base to the top of the bituminous subballast layer.
Figure 2-19: LVDT sensor head attached to a German sleeper
The validation of those sensors has been made by a Mitutoyo analog dial comparator having an uncertainty less than 1 µm. From a statistical analysis made at CEDEX using that comparator as reference sensor (see Table 2-8), an uncertainty less than 5 µm was obtained for 100 µm full scale measurements.
Table 2-8: Statistical analysis providing the uncertainty of the LVDT displacement sensors over 100 µm full scale
RIVAS SCP0-GA-2010-265754
RIVAS_CEDEX_WP3_D3_7_PART_A_FINAL Page 25 of 241 07/06/2013
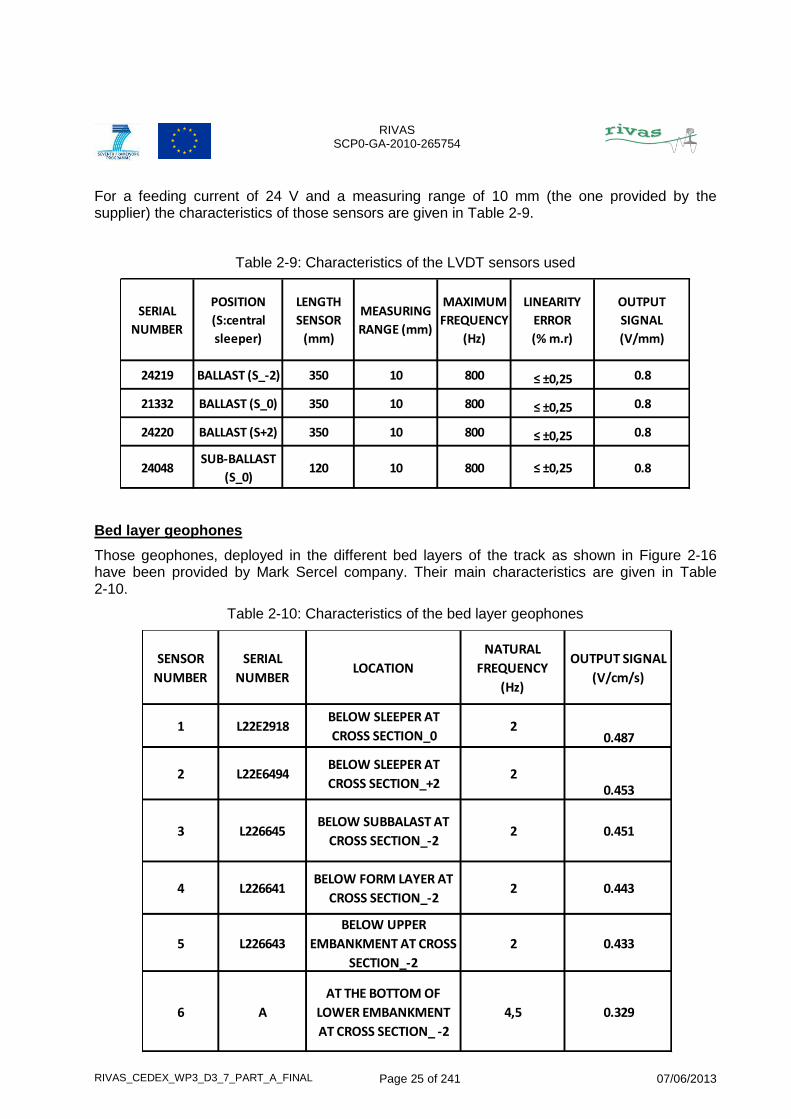
For a feeding current of 24 V and a measuring range of 10 mm (the one provided by the supplier) the characteristics of those sensors are given in Table 2-9.
Table 2-9: Characteristics of the LVDT sensors used
Bed layer geophones
Those geophones, deployed in the different bed layers of the track as shown in Figure 2-16 have been provided by Mark Sercel company. Their main characteristics are given in Table 2-10.
Table 2-10: Characteristics of the bed layer geophones
SERIAL
NUMBER
POSITION
(S:central
sleeper)
LENGTH
SENSOR
(mm)
MEASURING
RANGE (mm)
MAXIMUM
FREQUENCY
(Hz)
LINEARITY
ERROR
(% m.r)
OUTPUT
SIGNAL
(V/mm)
24219 BALLAST (S_-2) 350 10 800 ≤ ±0,25 0.8
21332 BALLAST (S_0) 350 10 800 ≤ ±0,25 0.8
24220 BALLAST (S+2) 350 10 800 ≤ ±0,25 0.8
24048SUB-BALLAST
(S_0)120 10 800 ≤ ±0,25 0.8
SENSOR
NUMBER
SERIAL
NUMBERLOCATION
NATURAL
FREQUENCY
(Hz)
OUTPUT SIGNAL
(V/cm/s)
1 L22E2918BELOW SLEEPER AT
CROSS SECTION_02
0.487
2 L22E6494BELOW SLEEPER AT
CROSS SECTION_+22
0.453
3 L226645BELOW SUBBALAST AT
CROSS SECTION_-22 0.451
4 L226641BELOW FORM LAYER AT
CROSS SECTION_-22 0.443
5 L226643
BELOW UPPER
EMBANKMENT AT CROSS
SECTION_-2
2 0.433
6 A
AT THE BOTTOM OF
LOWER EMBANKMENT
AT CROSS SECTION_ -2
4,5 0.329
RIVAS SCP0-GA-2010-265754
RIVAS_CEDEX_WP3_D3_7_PART_A_FINAL Page 26 of 241 07/06/2013
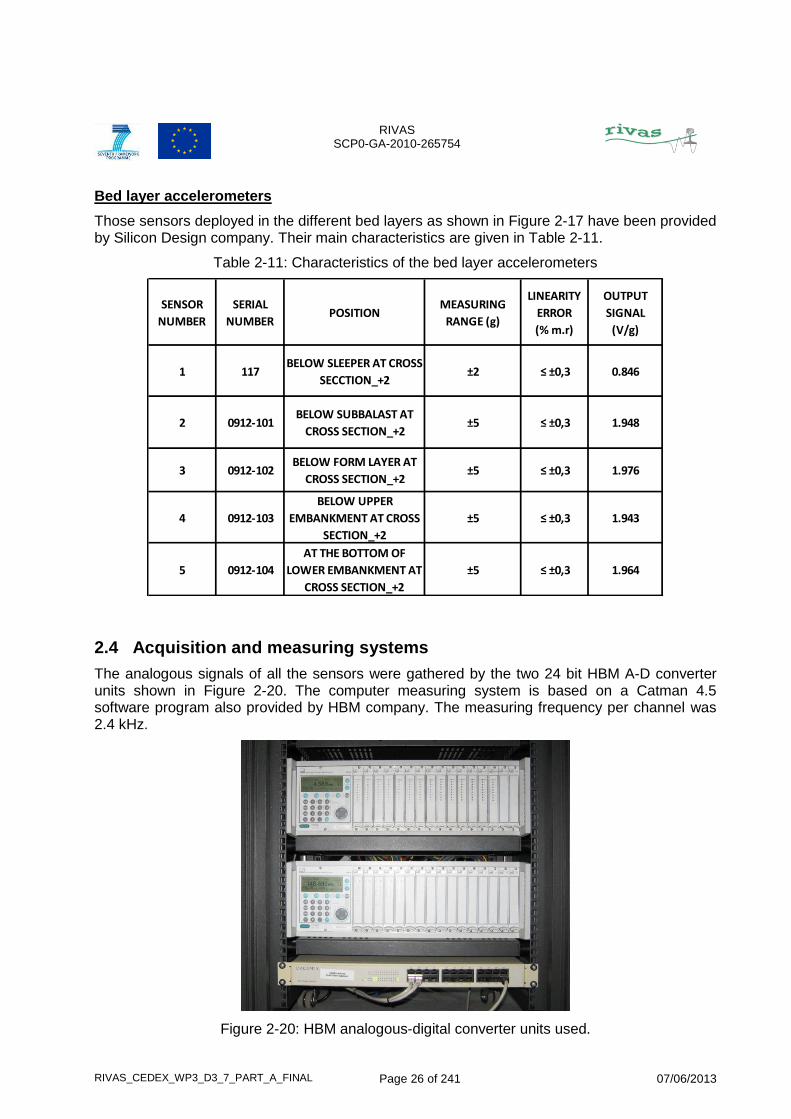
Bed layer accelerometers
Those sensors deployed in the different bed layers as shown in Figure 2-17 have been provided by Silicon Design company. Their main characteristics are given in Table 2-11.
Table 2-11: Characteristics of the bed layer accelerometers
2.4 Acquisition and measuring systems
The analogous signals of all the sensors were gathered by the two 24 bit HBM A-D converter units shown in Figure 2-20. The computer measuring system is based on a Catman 4.5 software program also provided by HBM company. The measuring frequency per channel was 2.4 kHz.
Figure 2-20: HBM analogous-digital converter units used.
SENSOR
NUMBER
SERIAL
NUMBERPOSITION
MEASURING
RANGE (g)
LINEARITY
ERROR
(% m.r)
OUTPUT
SIGNAL
(V/g)
1 117BELOW SLEEPER AT CROSS
SECCTION_+2±2 ≤ ±0,3 0.846
2 0912-101BELOW SUBBALAST AT
CROSS SECTION_+2±5 ≤ ±0,3 1.948
3 0912-102BELOW FORM LAYER AT
CROSS SECTION_+2±5 ≤ ±0,3 1.976
4 0912-103
BELOW UPPER
EMBANKMENT AT CROSS
SECTION_+2
±5 ≤ ±0,3 1.943
5 0912-104
AT THE BOTTOM OF
LOWER EMBANKMENT AT
CROSS SECTION_+2
±5 ≤ ±0,3 1.964
RIVAS SCP0-GA-2010-265754
RIVAS_CEDEX_WP3_D3_7_PART_A_FINAL Page 27 of 241 07/06/2013
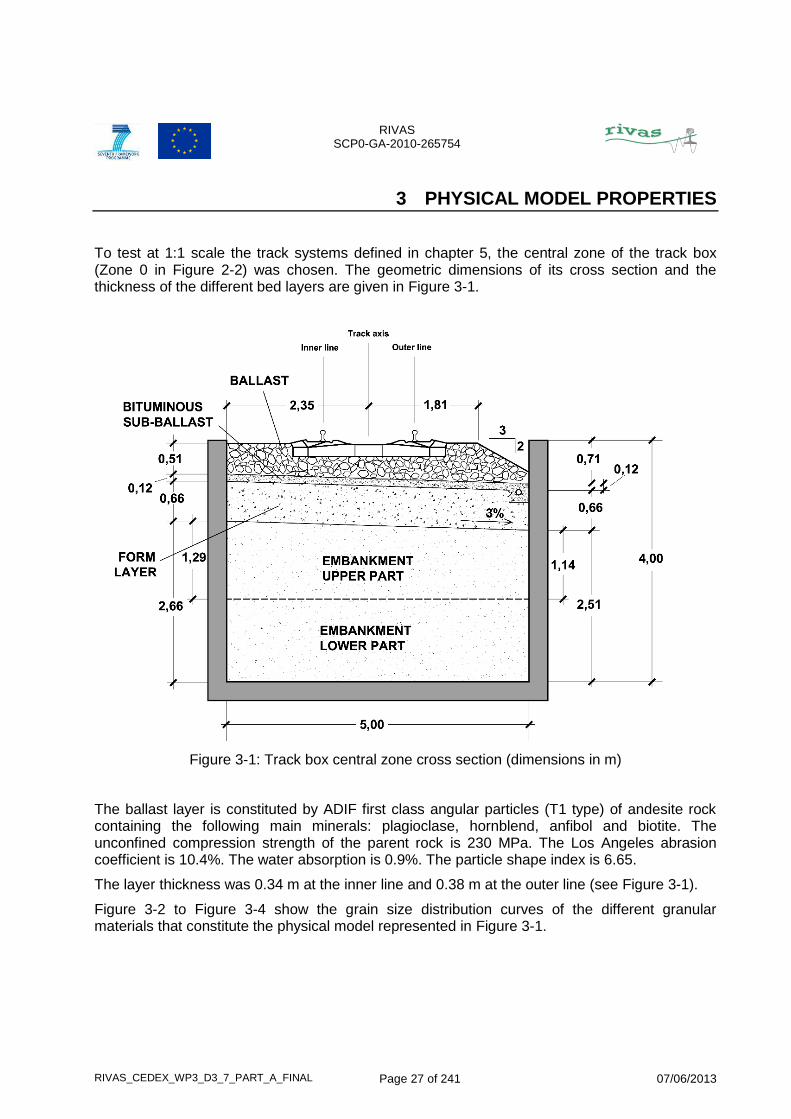
3 PHYSICAL MODEL PROPERTIES
To test at 1:1 scale the track systems defined in chapter 5, the central zone of the track box (Zone 0 in Figure 2-2) was chosen. The geometric dimensions of its cross section and the thickness of the different bed layers are given in Figure 3-1.
Figure 3-1: Track box central zone cross section (dimensions in m)
The ballast layer is constituted by ADIF first class angular particles (T1 type) of andesite rock containing the following main minerals: plagioclase, hornblend, anfibol and biotite. The unconfined compression strength of the parent rock is 230 MPa. The Los Angeles abrasion coefficient is 10.4%. The water absorption is 0.9%. The particle shape index is 6.65.
The layer thickness was 0.34 m at the inner line and 0.38 m at the outer line (see Figure 3-1).
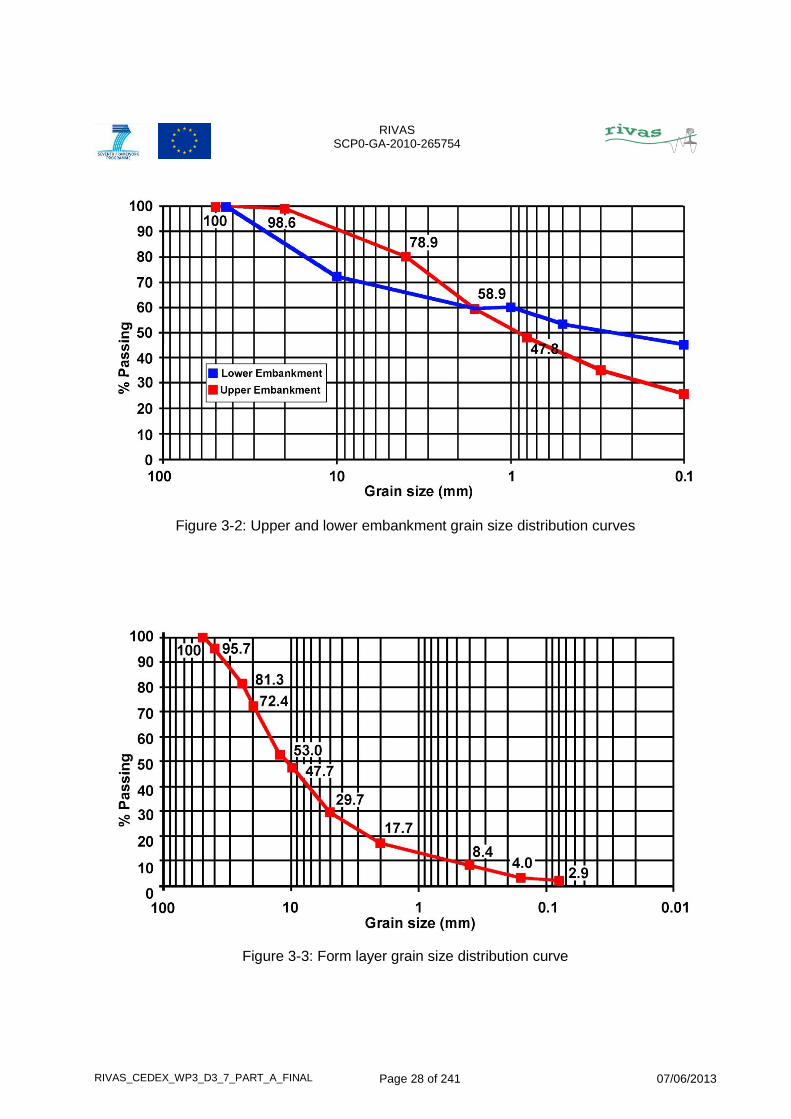
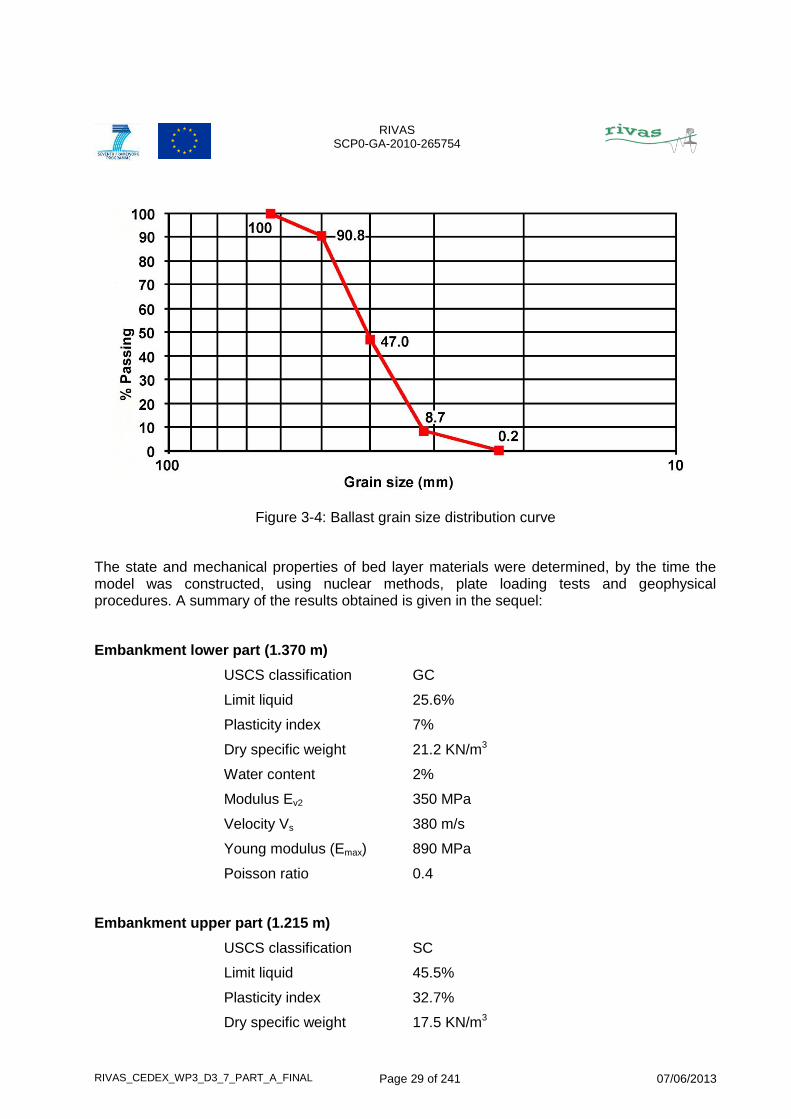
Figure 3-2 to Figure 3-4 show the grain size distribution curves of the different granular materials that constitute the physical model represented in Figure 3-1.
RIVAS SCP0-GA-2010-265754
RIVAS_CEDEX_WP3_D3_7_PART_A_FINAL Page 28 of 241 07/06/2013
Figure 3-2: Upper and lower embankment grain size distribution curves
Figure 3-3: Form layer grain size distribution curve
RIVAS SCP0-GA-2010-265754
RIVAS_CEDEX_WP3_D3_7_PART_A_FINAL Page 29 of 241 07/06/2013
Figure 3-4: Ballast grain size distribution curve
The state and mechanical properties of bed layer materials were determined, by the time the model was constructed, using nuclear methods, plate loading tests and geophysical procedures. A summary of the results obtained is given in the sequel:
Embankment lower part (1.370 m)
USCS classification GC
Limit liquid 25.6%
Plasticity index 7%
Dry specific weight 21.2 KN/m3
Water content 2%
Modulus Ev2 350 MPa
Velocity Vs 380 m/s
Young modulus (Emax) 890 MPa
Poisson ratio 0.4
Embankment upper part (1.215 m)
USCS classification SC
Limit liquid 45.5%
Plasticity index 32.7%
Dry specific weight 17.5 KN/m3
RIVAS SCP0-GA-2010-265754
RIVAS_CEDEX_WP3_D3_7_PART_A_FINAL Page 30 of 241 07/06/2013
Water content 10%
Modulus Ev2 170 MPa
Velocity Vs 280 m/s
Young modulus (Emax) 433 MPa
Poisson ratio 0.4
Form layer (0.660 m)
USCS classificatioin GP
Limit liquid No plastic material
Plasticity index No plastic material
Dry specific weight 22.5 KN/m3
Water content 3.5%
Modulus Ev2 420 MPa
Velocity Vs 400 m/s
Young modulus (Emax) 995 MPa
Poisson ratio 0.3
Bituminous subballast (0.120 m)
PG-3 classification S20 type
Specific weight 22.38 KN/m3
Young modulus (Emax) 250 MPa
Poisson ratio 0.4
Ballast (0.360 m)
ADIF classification 1st class andesite rock
Dry specific weight 16,5 KN/m3
Young modulus (0.1% shear strain)
100 MPa
Poisson ratio 0.2
Track box foundation
It is constituted by one 0.70 m thick 25 m long and 8 m wide reinforced concrete slab supported by a hard granular soil of the Miocene epoch with a shear wave velocity of 450 m/s.
RIVAS SCP0-GA-2010-265754
RIVAS_CEDEX_WP3_D3_7_PART_A_FINAL Page 31 of 241 07/06/2013
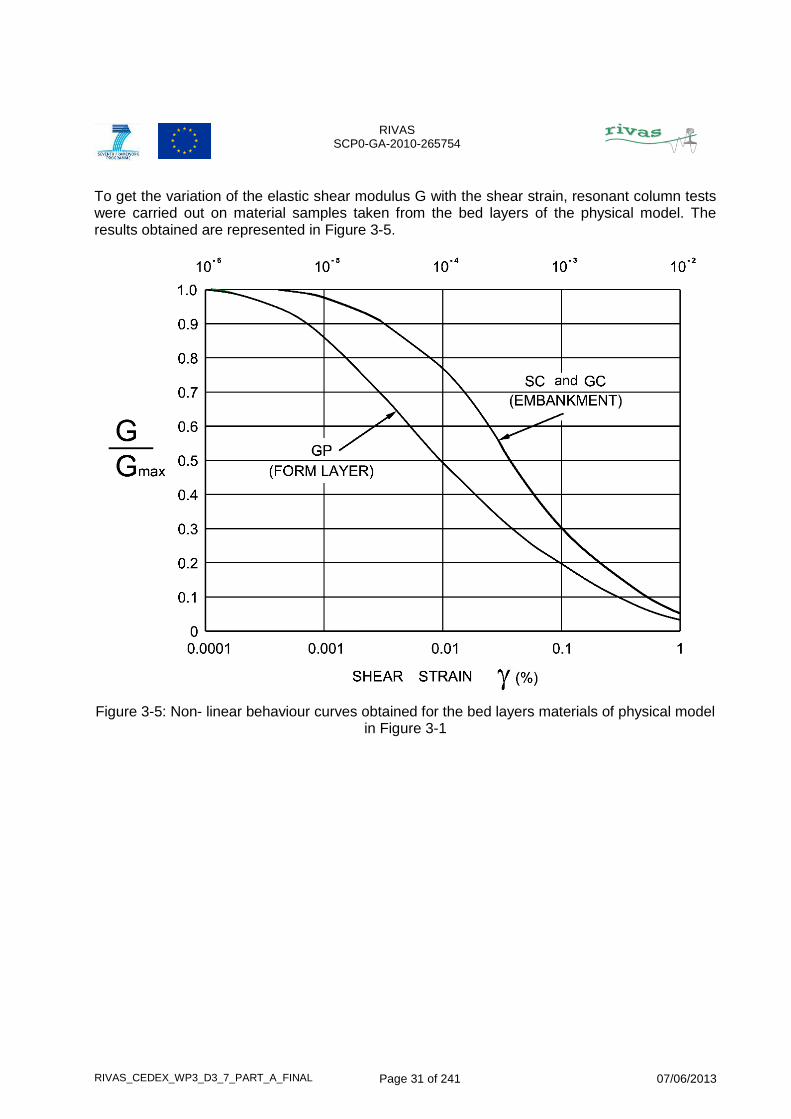
To get the variation of the elastic shear modulus G with the shear strain, resonant column tests were carried out on material samples taken from the bed layers of the physical model. The results obtained are represented in Figure 3-5.
Figure 3-5: Non- linear behaviour curves obtained for the bed layers materials of physical model in Figure 3-1

RIVAS SCP0-GA-2010-265754
RIVAS_CEDEX_WP3_D3_7_PART_A_FINAL Page 32 of 241 07/06/2013
RIVAS SCP0-GA-2010-265754
RIVAS_CEDEX_WP3_D3_7_PART_A_FINAL Page 33 of 241 07/06/2013
4 LOADING TIME HISTORIES
4.1 Introduction
Two types of loading time history have been used in the tests made:
Quasi-static
Dynamic
Concerning the quasi-static type of loadings, constant high amplitude load time histories with frequencies up to 30 Hz, incorporating the effects of the wheel and bogie configurations for passenger and freight trains normally used in the EU, have been defined.
In relation to the dynamic type of loading, the procedure used to derive the variable low amplitude load time history applied in the tests has been fully described and the PSD function chosen, to consider the effects of the track vertical irregularities, has been compared with those suggested by ORE.
4.2 Quasi-static loads
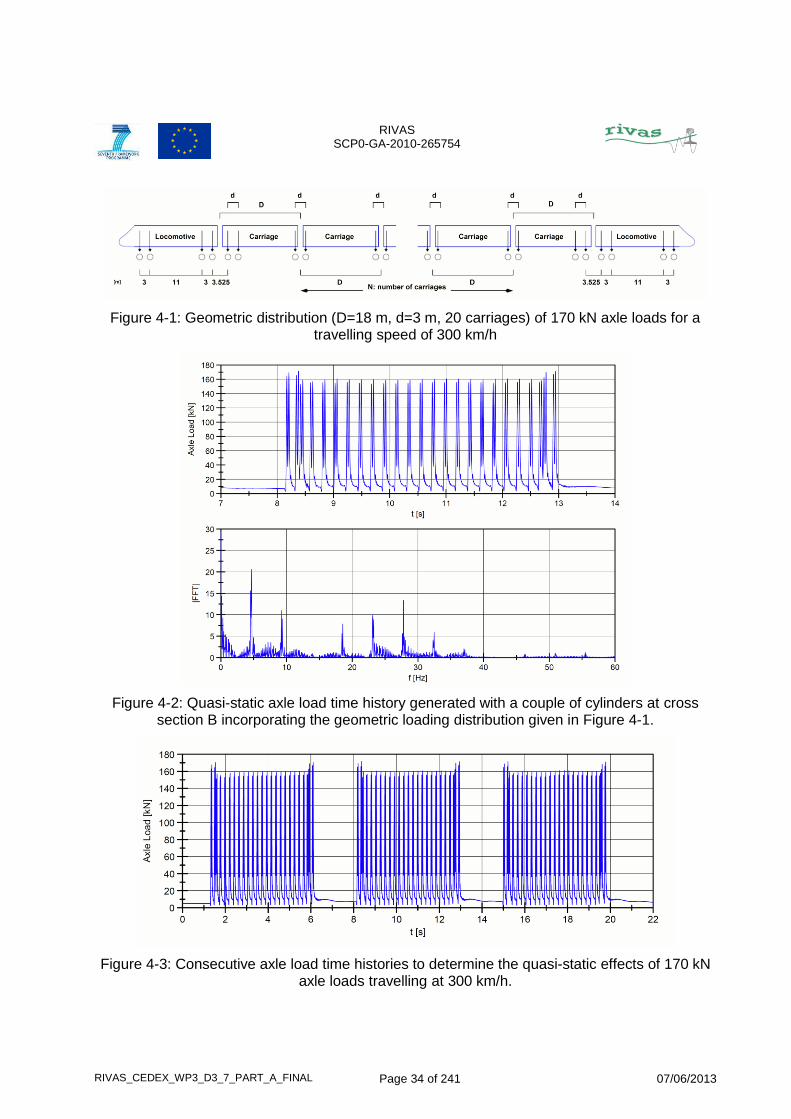
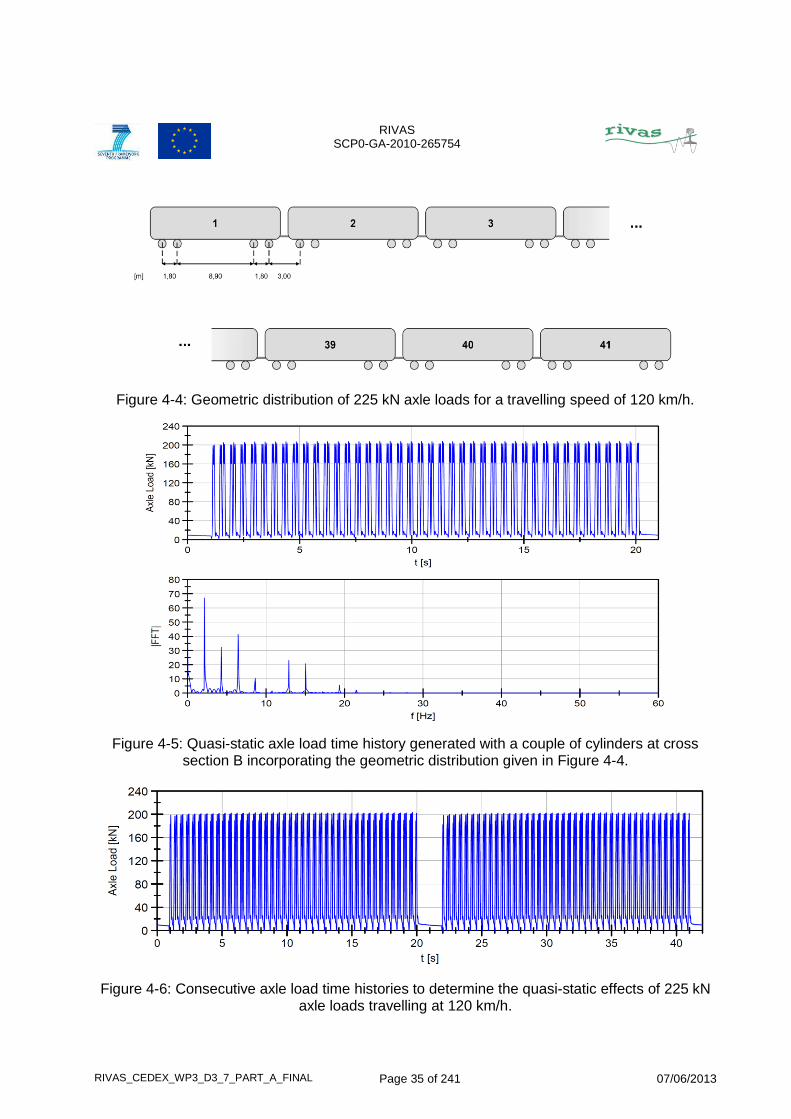
Figure 4-1 and Figure 4-4 show the geometric definition of the types of loading configuration used for testing the track systems described in chapter 5 under the pass by of 170 kN quasi-static axle loads at 300 km/h and 225 kN axle loads at 120 km/h respectively.
The amplitudes of 160 kN and 200 kN that can be observed in the load time histories represented in Figure 4-2 and Figure 4-5 respectively do not correspond to the values of 170 kN and 225 kN initially stated. That is because those amplitudes match those generated by the pair of cylinders deployed at cross section B in Zone 0 of the track box for which a multiplying factor of 0.941 has been applied to the stated value of 170 kN (to take into account the interaction effect between pairs of cylinders located at 1.5 m from each other) and a factor of 0.888 to the stated value of 225 kN.
The magnitude and distribution of loads given in Figure 4-1 are similar to those of a Eurostar type train with 2 locomotives and 20 wagons. On the other hand, the train parameters given in Figure 4-4 do not correspond to a complete train but to a reference freight vehicle constituted by 82 bogies of the Y25 type defined in the RIVAS report elaborated by VIBRATEC(3).
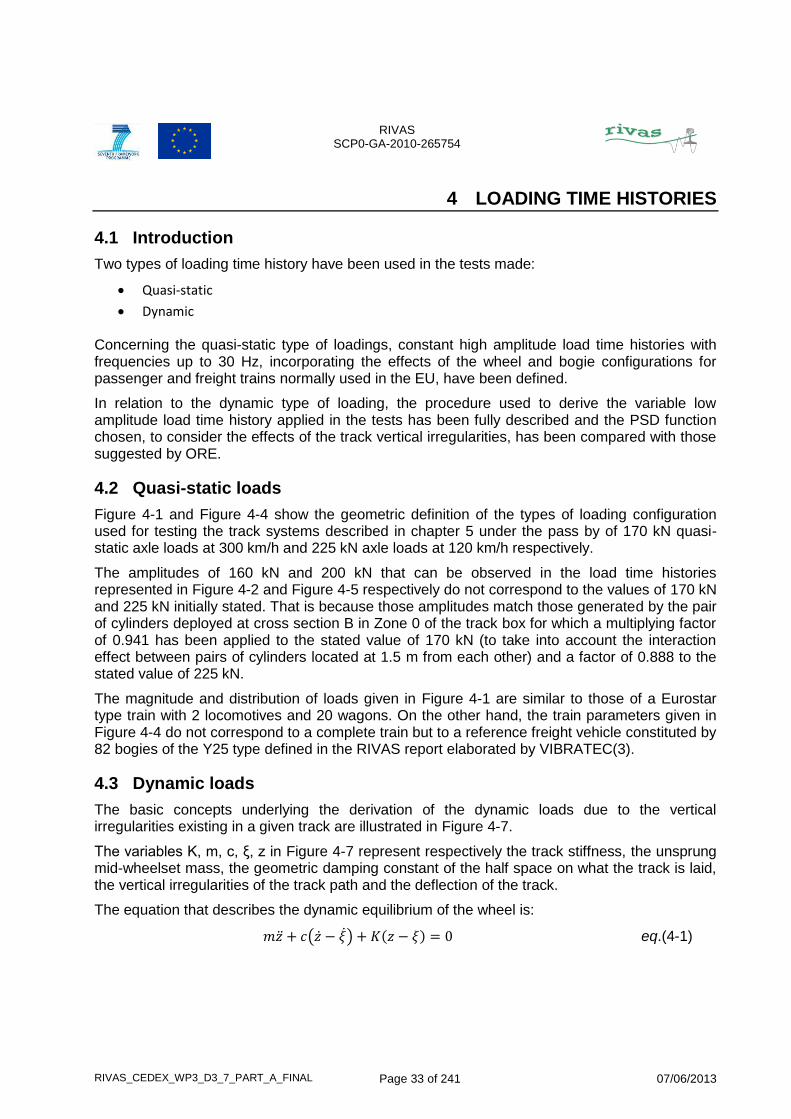
4.3 Dynamic loads
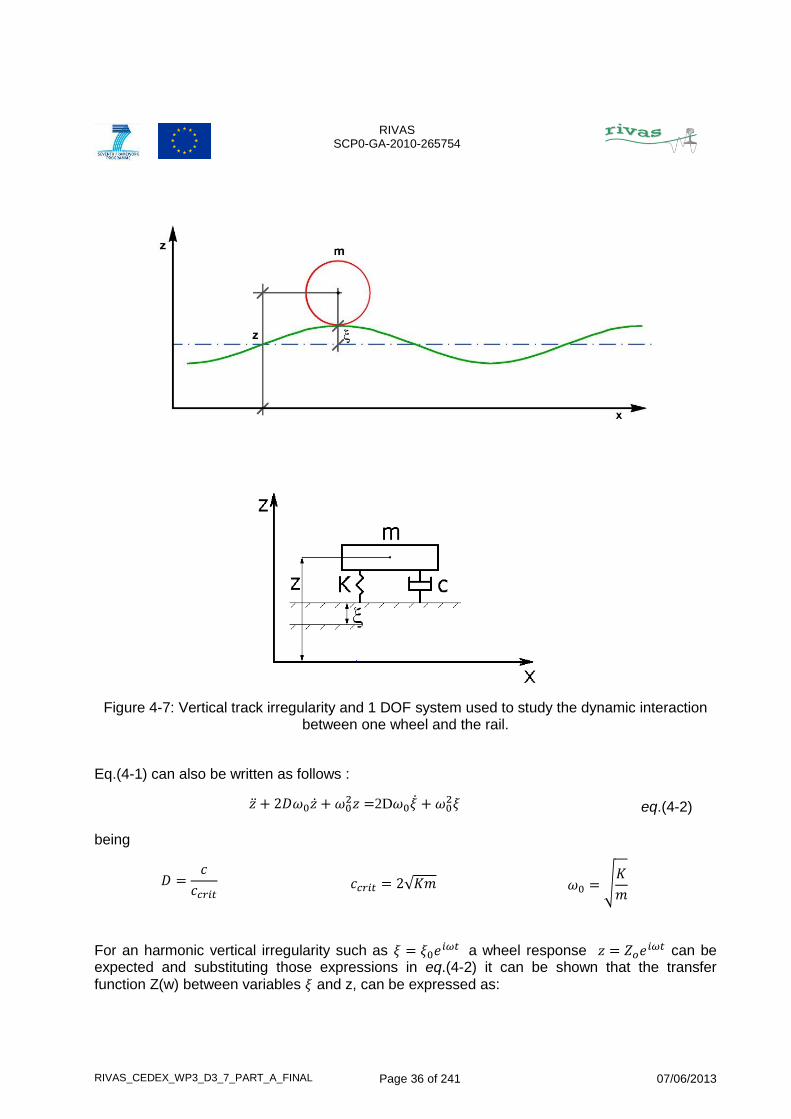
The basic concepts underlying the derivation of the dynamic loads due to the vertical irregularities existing in a given track are illustrated in Figure 4-7.
The variables K, m, c, ξ, z in Figure 4-7 represent respectively the track stiffness, the unsprung mid-wheelset mass, the geometric damping constant of the half space on what the track is laid, the vertical irregularities of the track path and the deflection of the track.
The equation that describes the dynamic equilibrium of the wheel is:
( ) ( ) eq.(4-1)
RIVAS SCP0-GA-2010-265754
RIVAS_CEDEX_WP3_D3_7_PART_A_FINAL Page 34 of 241 07/06/2013
Figure 4-1: Geometric distribution (D=18 m, d=3 m, 20 carriages) of 170 kN axle loads for a travelling speed of 300 km/h
Figure 4-2: Quasi-static axle load time history generated with a couple of cylinders at cross section B incorporating the geometric loading distribution given in Figure 4-1.
Figure 4-3: Consecutive axle load time histories to determine the quasi-static effects of 170 kN axle loads travelling at 300 km/h.
RIVAS SCP0-GA-2010-265754
RIVAS_CEDEX_WP3_D3_7_PART_A_FINAL Page 35 of 241 07/06/2013
Figure 4-4: Geometric distribution of 225 kN axle loads for a travelling speed of 120 km/h.
Figure 4-5: Quasi-static axle load time history generated with a couple of cylinders at cross section B incorporating the geometric distribution given in Figure 4-4.
Figure 4-6: Consecutive axle load time histories to determine the quasi-static effects of 225 kN axle loads travelling at 120 km/h.
RIVAS SCP0-GA-2010-265754
RIVAS_CEDEX_WP3_D3_7_PART_A_FINAL Page 36 of 241 07/06/2013
Figure 4-7: Vertical track irregularity and 1 DOF system used to study the dynamic interaction between one wheel and the rail.
Eq.(4-1) can also be written as follows :
2D
eq.(4-2)
being
√ √
For an harmonic vertical irregularity such as a wheel response
can be expected and substituting those expressions in eq.(4-2) it can be shown that the transfer
function Z(w) between variables and z, can be expressed as:
RIVAS SCP0-GA-2010-265754
RIVAS_CEDEX_WP3_D3_7_PART_A_FINAL Page 37 of 241 07/06/2013
( )
(
)
eq.(4-3)
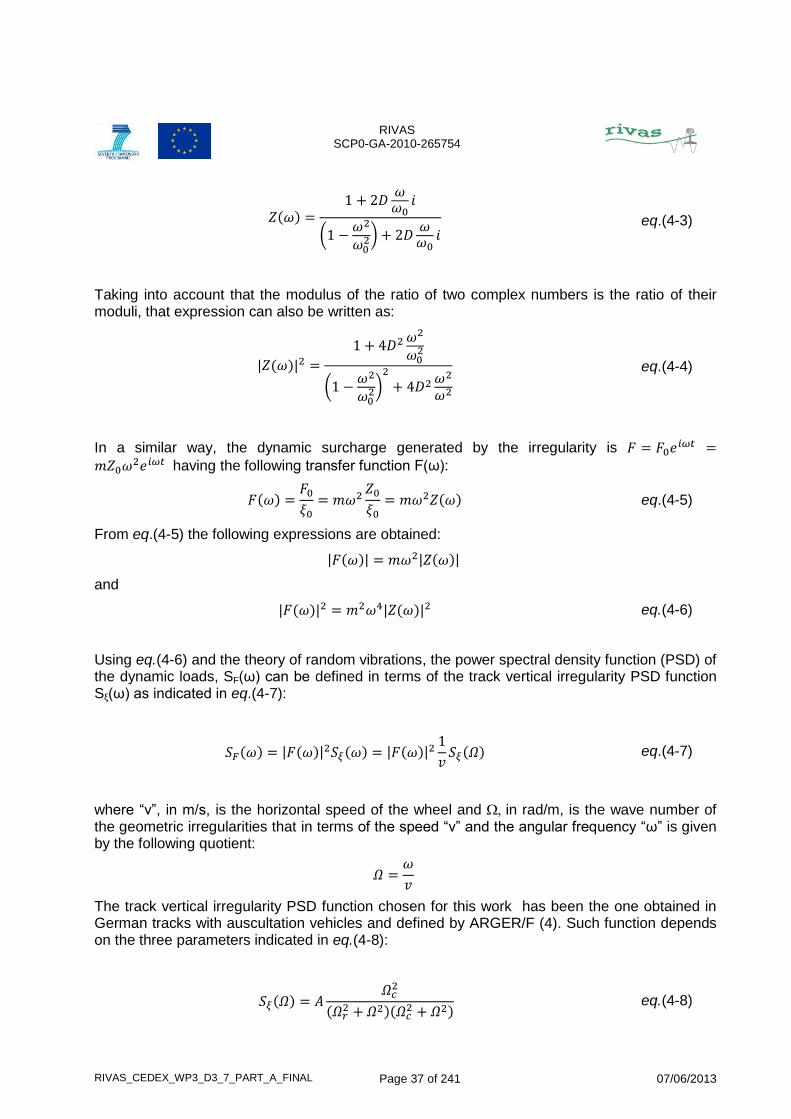
Taking into account that the modulus of the ratio of two complex numbers is the ratio of their moduli, that expression can also be written as:
( )
(
)
eq.(4-4)
In a similar way, the dynamic surcharge generated by the irregularity is
having the following transfer function F(ω):
( )
( ) eq.(4-5)
From eq.(4-5) the following expressions are obtained:
( ) ( )
and
( ) ( ) eq.(4-6)
Using eq.(4-6) and the theory of random vibrations, the power spectral density function (PSD) of the dynamic loads, SF(ω) can be defined in terms of the track vertical irregularity PSD function Sξ(ω) as indicated in eq.(4-7):
( ) ( ) ( ) ( )
( ) eq.(4-7)
where “v”, in m/s, is the horizontal speed of the wheel and in rad/m, is the wave number of the geometric irregularities that in terms of the speed “v” and the angular frequency “ω” is given by the following quotient:
The track vertical irregularity PSD function chosen for this work has been the one obtained in German tracks with auscultation vehicles and defined by ARGER/F (4). Such function depends on the three parameters indicated in eq.(4-8):
( )
( )(
) eq.(4-8)
RIVAS SCP0-GA-2010-265754
RIVAS_CEDEX_WP3_D3_7_PART_A_FINAL Page 38 of 241 07/06/2013
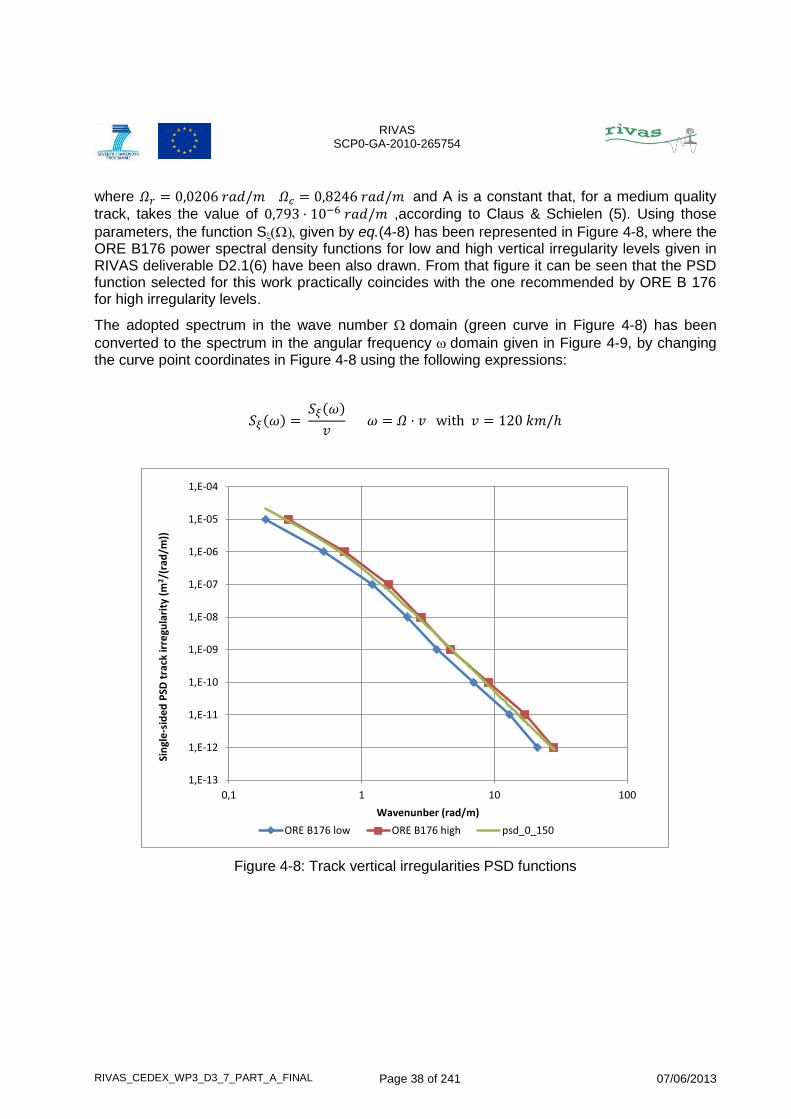
where and A is a constant that, for a medium quality
track, takes the value of ,according to Claus & Schielen (5). Using those
parameters, the function Sgiven by eq.(4-8) has been represented in Figure 4-8, where the ORE B176 power spectral density functions for low and high vertical irregularity levels given in RIVAS deliverable D2.1(6) have been also drawn. From that figure it can be seen that the PSD function selected for this work practically coincides with the one recommended by ORE B 176 for high irregularity levels.
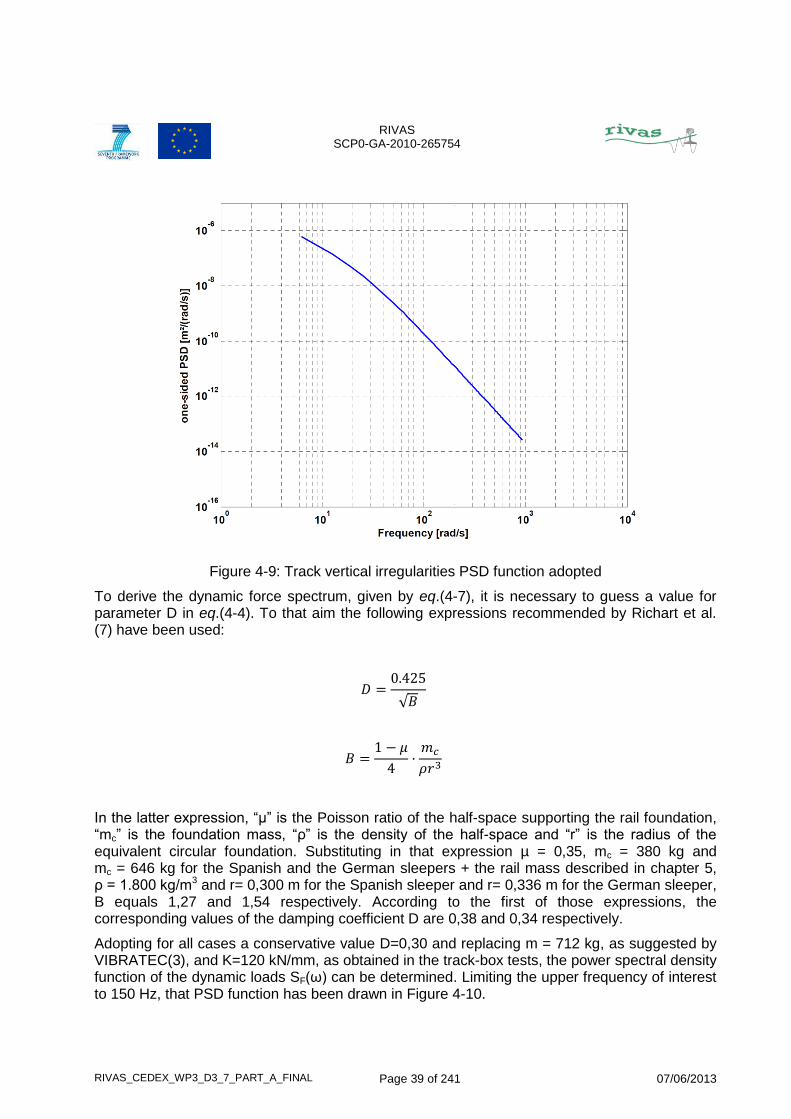
The adopted spectrum in the wave number domain (green curve in Figure 4-8) has been
converted to the spectrum in the angular frequency domain given in Figure 4-9, by changing the curve point coordinates in Figure 4-8 using the following expressions:
( ) ( )
Figure 4-8: Track vertical irregularities PSD functions
1,E-13
1,E-12
1,E-11
1,E-10
1,E-09
1,E-08
1,E-07
1,E-06
1,E-05
1,E-04
0,1 1 10 100
Sin
gle
-sid
ed
PSD
tra
ck ir
regu
lari
ty (
m2/(
rad
/m))
Wavenunber (rad/m)
ORE B176 low ORE B176 high psd_0_150
RIVAS SCP0-GA-2010-265754
RIVAS_CEDEX_WP3_D3_7_PART_A_FINAL Page 39 of 241 07/06/2013
Figure 4-9: Track vertical irregularities PSD function adopted
To derive the dynamic force spectrum, given by eq.(4-7), it is necessary to guess a value for parameter D in eq.(4-4). To that aim the following expressions recommended by Richart et al. (7) have been used:
√
In the latter expression, “µ” is the Poisson ratio of the half-space supporting the rail foundation, “mc” is the foundation mass, “ρ” is the density of the half-space and “r” is the radius of the equivalent circular foundation. Substituting in that expression µ = 0,35, mc = 380 kg and mc = 646 kg for the Spanish and the German sleepers + the rail mass described in chapter 5, ρ = 1.800 kg/m3 and r= 0,300 m for the Spanish sleeper and r= 0,336 m for the German sleeper, B equals 1,27 and 1,54 respectively. According to the first of those expressions, the corresponding values of the damping coefficient D are 0,38 and 0,34 respectively.
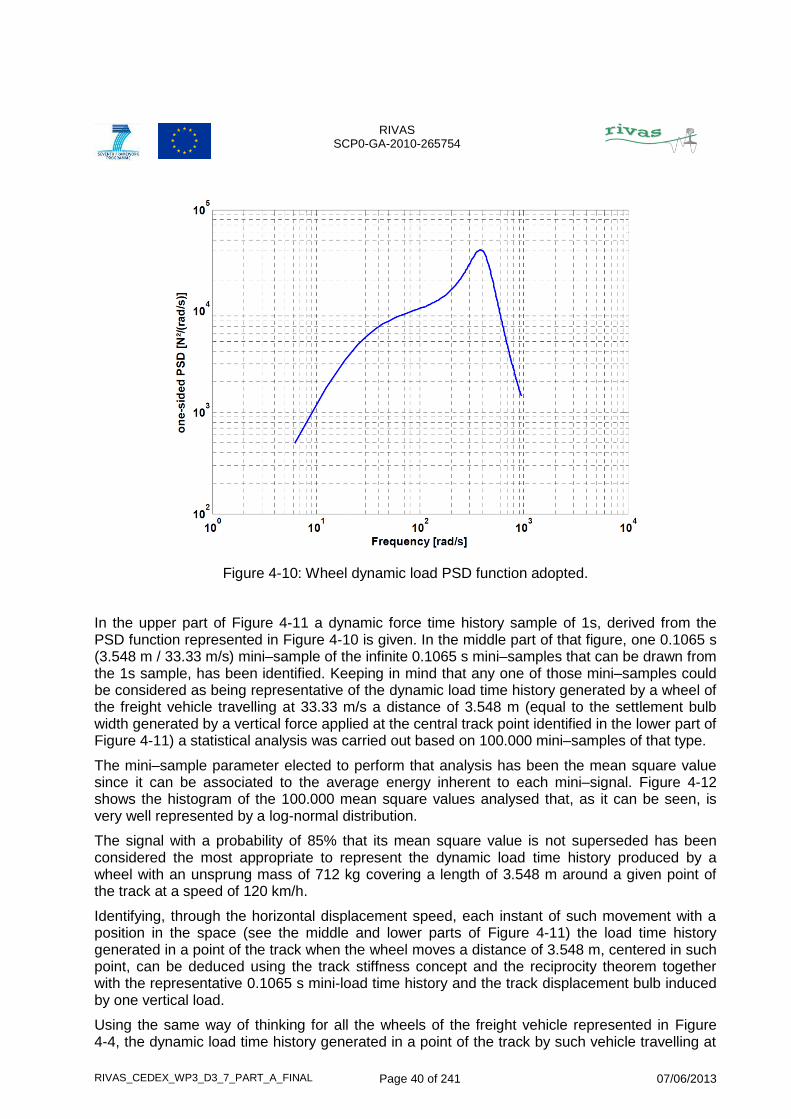
Adopting for all cases a conservative value D=0,30 and replacing m = 712 kg, as suggested by VIBRATEC(3), and K=120 kN/mm, as obtained in the track-box tests, the power spectral density function of the dynamic loads SF(ω) can be determined. Limiting the upper frequency of interest to 150 Hz, that PSD function has been drawn in Figure 4-10.
RIVAS SCP0-GA-2010-265754
RIVAS_CEDEX_WP3_D3_7_PART_A_FINAL Page 40 of 241 07/06/2013
Figure 4-10: Wheel dynamic load PSD function adopted.
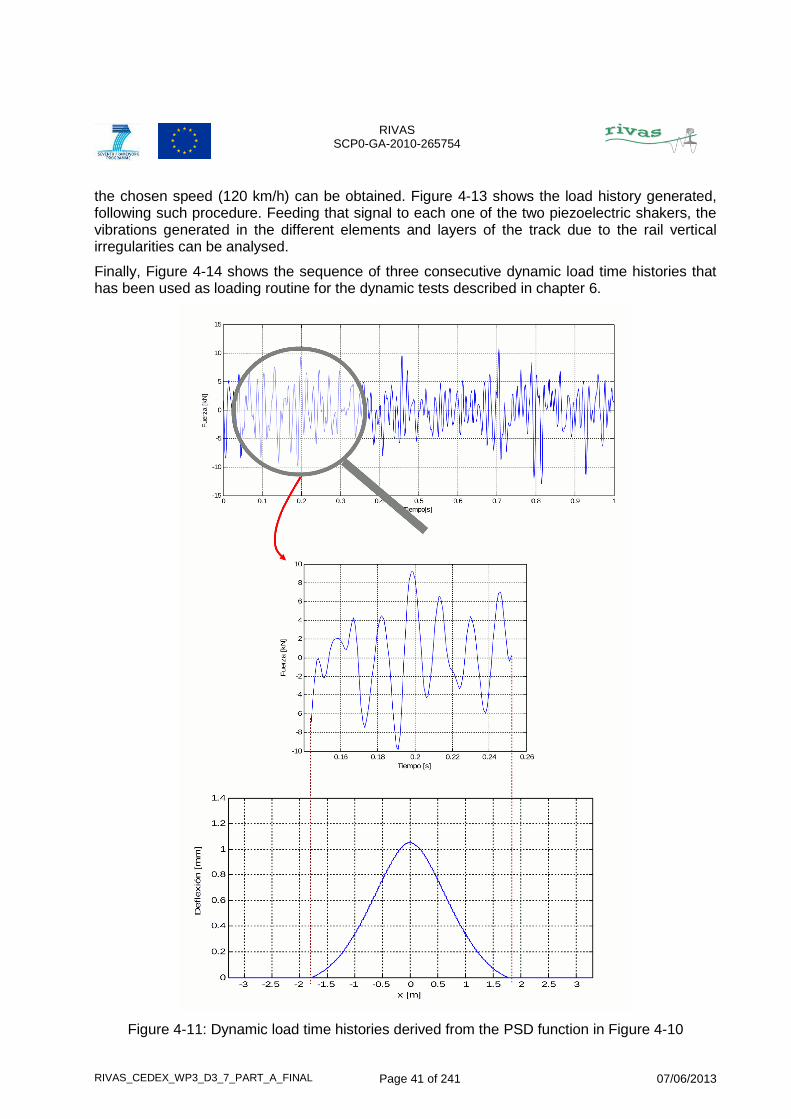
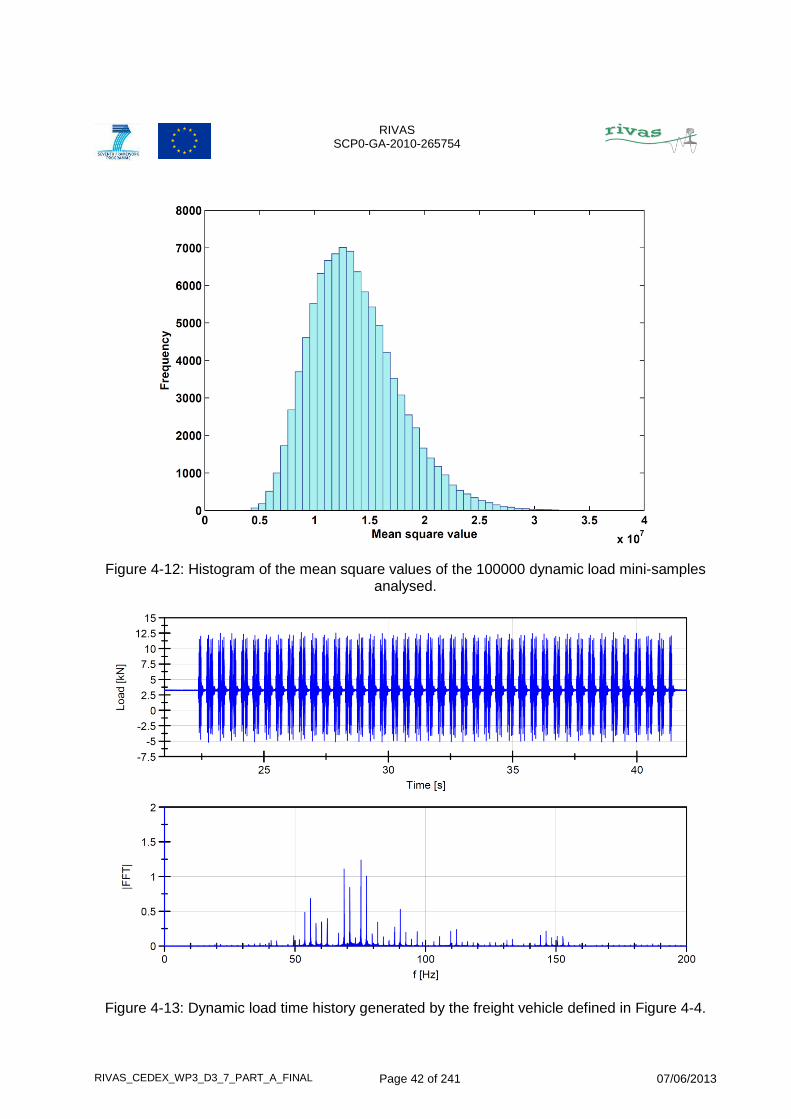
In the upper part of Figure 4-11 a dynamic force time history sample of 1s, derived from the PSD function represented in Figure 4-10 is given. In the middle part of that figure, one 0.1065 s (3.548 m / 33.33 m/s) mini–sample of the infinite 0.1065 s mini–samples that can be drawn from the 1s sample, has been identified. Keeping in mind that any one of those mini–samples could be considered as being representative of the dynamic load time history generated by a wheel of the freight vehicle travelling at 33.33 m/s a distance of 3.548 m (equal to the settlement bulb width generated by a vertical force applied at the central track point identified in the lower part of Figure 4-11) a statistical analysis was carried out based on 100.000 mini–samples of that type.
The mini–sample parameter elected to perform that analysis has been the mean square value since it can be associated to the average energy inherent to each mini–signal. Figure 4-12 shows the histogram of the 100.000 mean square values analysed that, as it can be seen, is very well represented by a log-normal distribution.
The signal with a probability of 85% that its mean square value is not superseded has been considered the most appropriate to represent the dynamic load time history produced by a wheel with an unsprung mass of 712 kg covering a length of 3.548 m around a given point of the track at a speed of 120 km/h.
Identifying, through the horizontal displacement speed, each instant of such movement with a position in the space (see the middle and lower parts of Figure 4-11) the load time history generated in a point of the track when the wheel moves a distance of 3.548 m, centered in such point, can be deduced using the track stiffness concept and the reciprocity theorem together with the representative 0.1065 s mini-load time history and the track displacement bulb induced by one vertical load.
Using the same way of thinking for all the wheels of the freight vehicle represented in Figure 4-4, the dynamic load time history generated in a point of the track by such vehicle travelling at
RIVAS SCP0-GA-2010-265754
RIVAS_CEDEX_WP3_D3_7_PART_A_FINAL Page 41 of 241 07/06/2013
the chosen speed (120 km/h) can be obtained. Figure 4-13 shows the load history generated, following such procedure. Feeding that signal to each one of the two piezoelectric shakers, the vibrations generated in the different elements and layers of the track due to the rail vertical irregularities can be analysed.
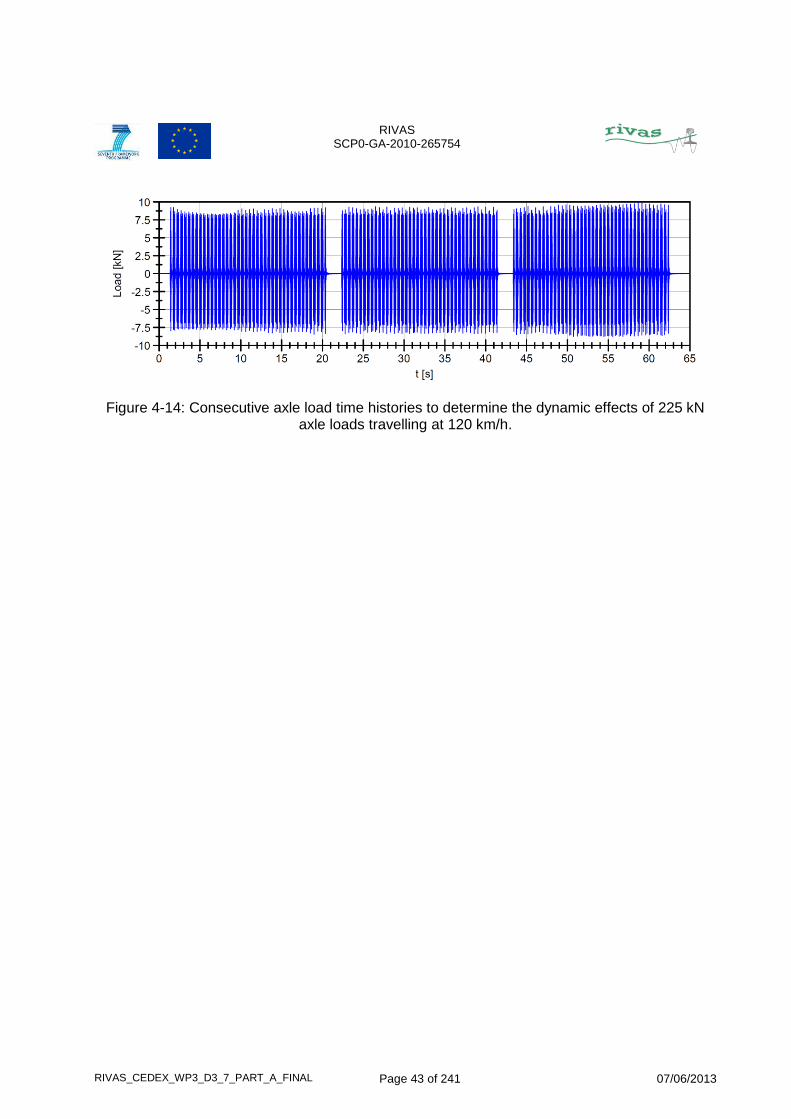
Finally, Figure 4-14 shows the sequence of three consecutive dynamic load time histories that has been used as loading routine for the dynamic tests described in chapter 6.
Figure 4-11: Dynamic load time histories derived from the PSD function in Figure 4-10
RIVAS SCP0-GA-2010-265754
RIVAS_CEDEX_WP3_D3_7_PART_A_FINAL Page 42 of 241 07/06/2013
Figure 4-12: Histogram of the mean square values of the 100000 dynamic load mini-samples analysed.
Figure 4-13: Dynamic load time history generated by the freight vehicle defined in Figure 4-4.
RIVAS SCP0-GA-2010-265754
RIVAS_CEDEX_WP3_D3_7_PART_A_FINAL Page 43 of 241 07/06/2013
Figure 4-14: Consecutive axle load time histories to determine the dynamic effects of 225 kN axle loads travelling at 120 km/h.

RIVAS SCP0-GA-2010-265754
RIVAS_CEDEX_WP3_D3_7_PART_A_FINAL Page 44 of 241 07/06/2013
RIVAS SCP0-GA-2010-265754
RIVAS_CEDEX_WP3_D3_7_PART_A_FINAL Page 45 of 241 07/06/2013
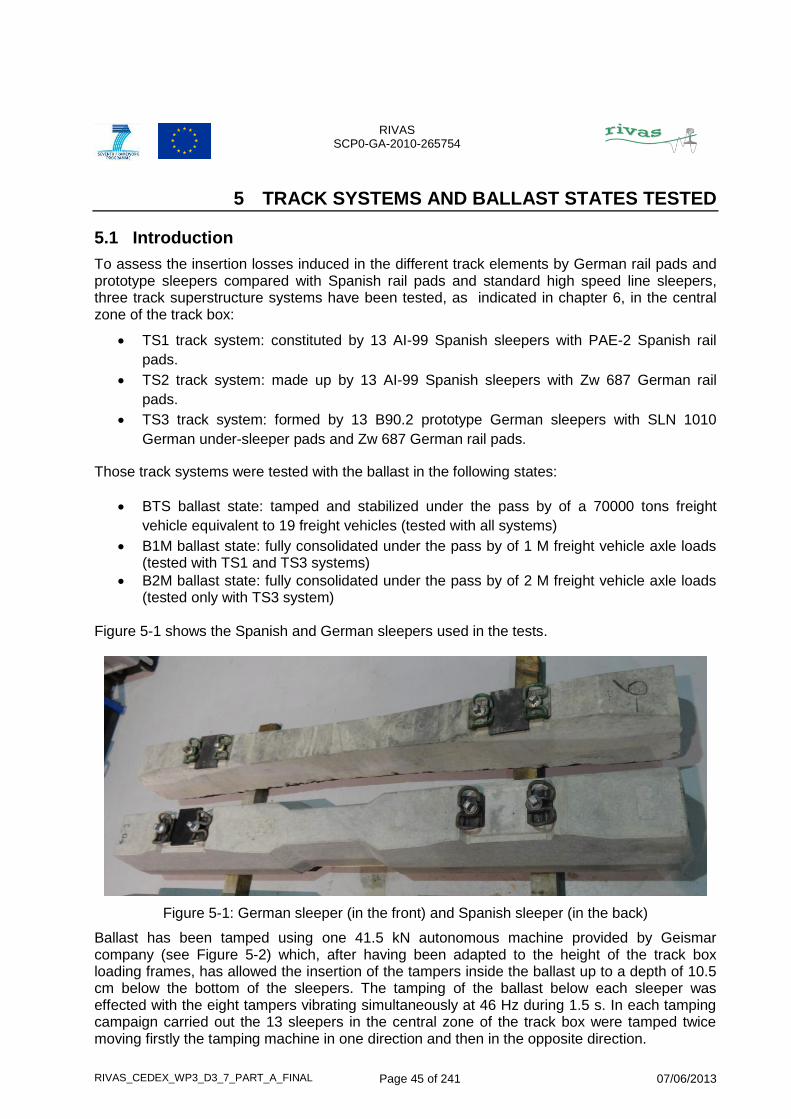
5 TRACK SYSTEMS AND BALLAST STATES TESTED
5.1 Introduction
To assess the insertion losses induced in the different track elements by German rail pads and prototype sleepers compared with Spanish rail pads and standard high speed line sleepers, three track superstructure systems have been tested, as indicated in chapter 6, in the central zone of the track box:
TS1 track system: constituted by 13 AI-99 Spanish sleepers with PAE-2 Spanish rail
pads.
TS2 track system: made up by 13 AI-99 Spanish sleepers with Zw 687 German rail
pads.
TS3 track system: formed by 13 B90.2 prototype German sleepers with SLN 1010
German under-sleeper pads and Zw 687 German rail pads.
Those track systems were tested with the ballast in the following states:
BTS ballast state: tamped and stabilized under the pass by of a 70000 tons freight
vehicle equivalent to 19 freight vehicles (tested with all systems)
B1M ballast state: fully consolidated under the pass by of 1 M freight vehicle axle loads (tested with TS1 and TS3 systems)
B2M ballast state: fully consolidated under the pass by of 2 M freight vehicle axle loads (tested only with TS3 system)
Figure 5-1 shows the Spanish and German sleepers used in the tests.
Figure 5-1: German sleeper (in the front) and Spanish sleeper (in the back)
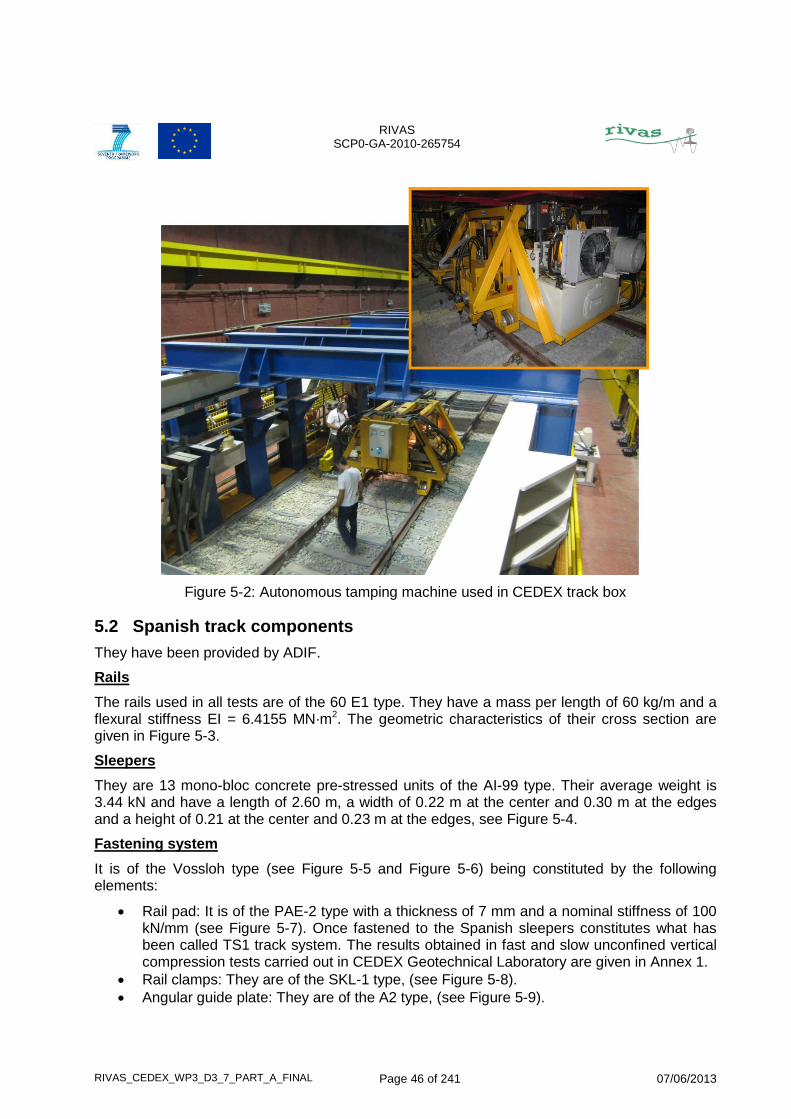
Ballast has been tamped using one 41.5 kN autonomous machine provided by Geismar company (see Figure 5-2) which, after having been adapted to the height of the track box loading frames, has allowed the insertion of the tampers inside the ballast up to a depth of 10.5 cm below the bottom of the sleepers. The tamping of the ballast below each sleeper was effected with the eight tampers vibrating simultaneously at 46 Hz during 1.5 s. In each tamping campaign carried out the 13 sleepers in the central zone of the track box were tamped twice moving firstly the tamping machine in one direction and then in the opposite direction.
RIVAS SCP0-GA-2010-265754
RIVAS_CEDEX_WP3_D3_7_PART_A_FINAL Page 46 of 241 07/06/2013
Figure 5-2: Autonomous tamping machine used in CEDEX track box
5.2 Spanish track components
They have been provided by ADIF.
Rails
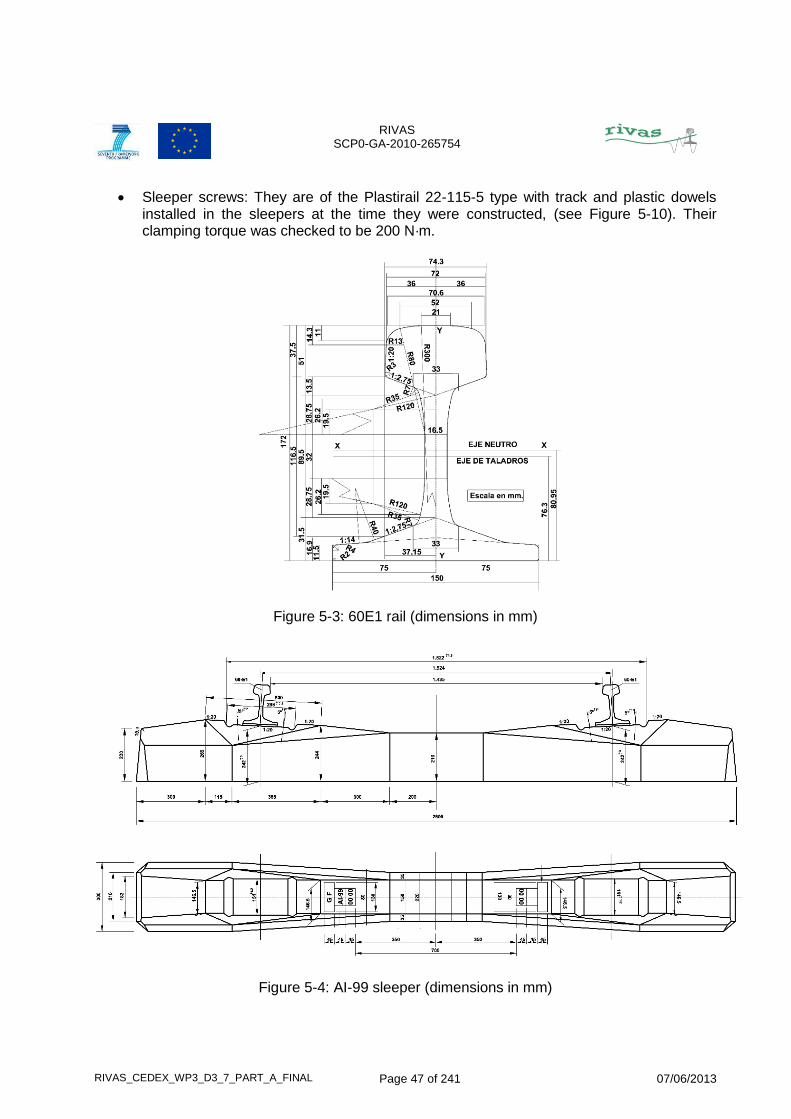
The rails used in all tests are of the 60 E1 type. They have a mass per length of 60 kg/m and a flexural stiffness EI = 6.4155 MN·m2. The geometric characteristics of their cross section are given in Figure 5-3.
Sleepers
They are 13 mono-bloc concrete pre-stressed units of the AI-99 type. Their average weight is 3.44 kN and have a length of 2.60 m, a width of 0.22 m at the center and 0.30 m at the edges and a height of 0.21 at the center and 0.23 m at the edges, see Figure 5-4.
Fastening system
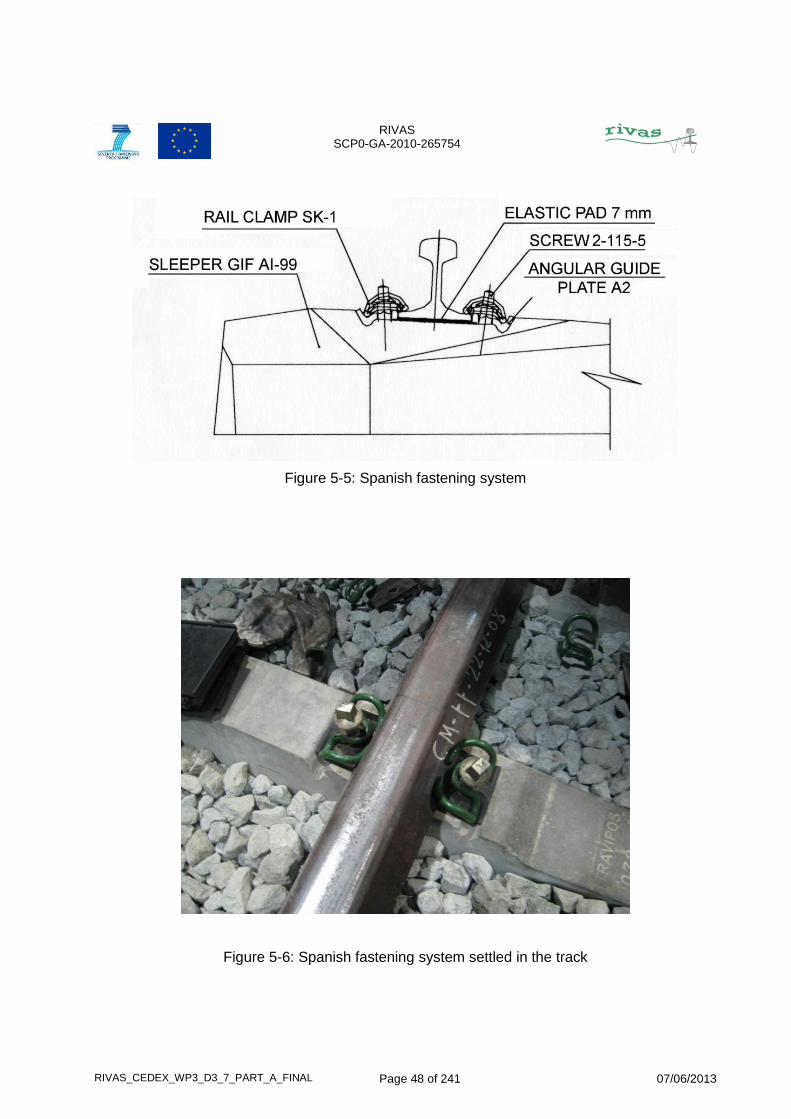
It is of the Vossloh type (see Figure 5-5 and Figure 5-6) being constituted by the following elements:
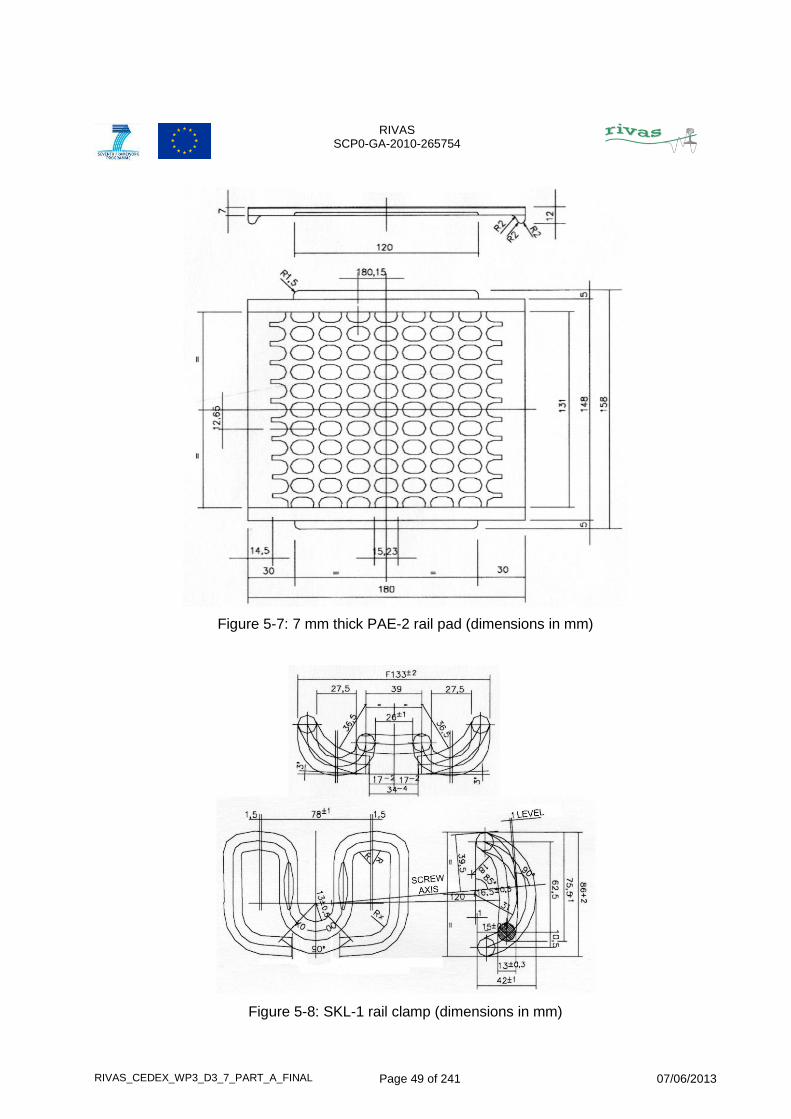
Rail pad: It is of the PAE-2 type with a thickness of 7 mm and a nominal stiffness of 100 kN/mm (see Figure 5-7). Once fastened to the Spanish sleepers constitutes what has been called TS1 track system. The results obtained in fast and slow unconfined vertical compression tests carried out in CEDEX Geotechnical Laboratory are given in Annex 1.
Rail clamps: They are of the SKL-1 type, (see Figure 5-8).
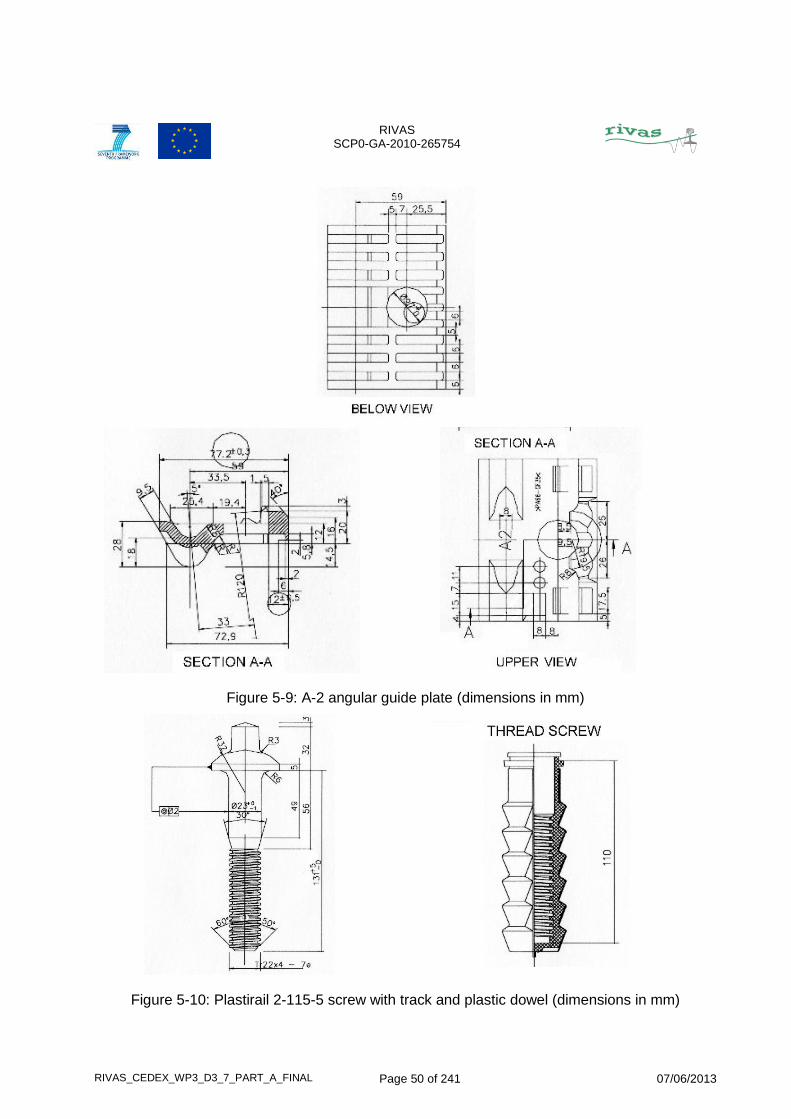
Angular guide plate: They are of the A2 type, (see Figure 5-9).
RIVAS SCP0-GA-2010-265754
RIVAS_CEDEX_WP3_D3_7_PART_A_FINAL Page 47 of 241 07/06/2013
Sleeper screws: They are of the Plastirail 22-115-5 type with track and plastic dowels installed in the sleepers at the time they were constructed, (see Figure 5-10). Their clamping torque was checked to be 200 N·m.
Figure 5-3: 60E1 rail (dimensions in mm)
Figure 5-4: AI-99 sleeper (dimensions in mm)
RIVAS SCP0-GA-2010-265754
RIVAS_CEDEX_WP3_D3_7_PART_A_FINAL Page 48 of 241 07/06/2013
Figure 5-5: Spanish fastening system
Figure 5-6: Spanish fastening system settled in the track
RIVAS SCP0-GA-2010-265754
RIVAS_CEDEX_WP3_D3_7_PART_A_FINAL Page 49 of 241 07/06/2013
Figure 5-7: 7 mm thick PAE-2 rail pad (dimensions in mm)
Figure 5-8: SKL-1 rail clamp (dimensions in mm)
RIVAS SCP0-GA-2010-265754
RIVAS_CEDEX_WP3_D3_7_PART_A_FINAL Page 50 of 241 07/06/2013
Figure 5-9: A-2 angular guide plate (dimensions in mm)
Figure 5-10: Plastirail 2-115-5 screw with track and plastic dowel (dimensions in mm)
RIVAS SCP0-GA-2010-265754
RIVAS_CEDEX_WP3_D3_7_PART_A_FINAL Page 51 of 241 07/06/2013
5.3 German track components
They have been provided by RAILONE.
Sleepers
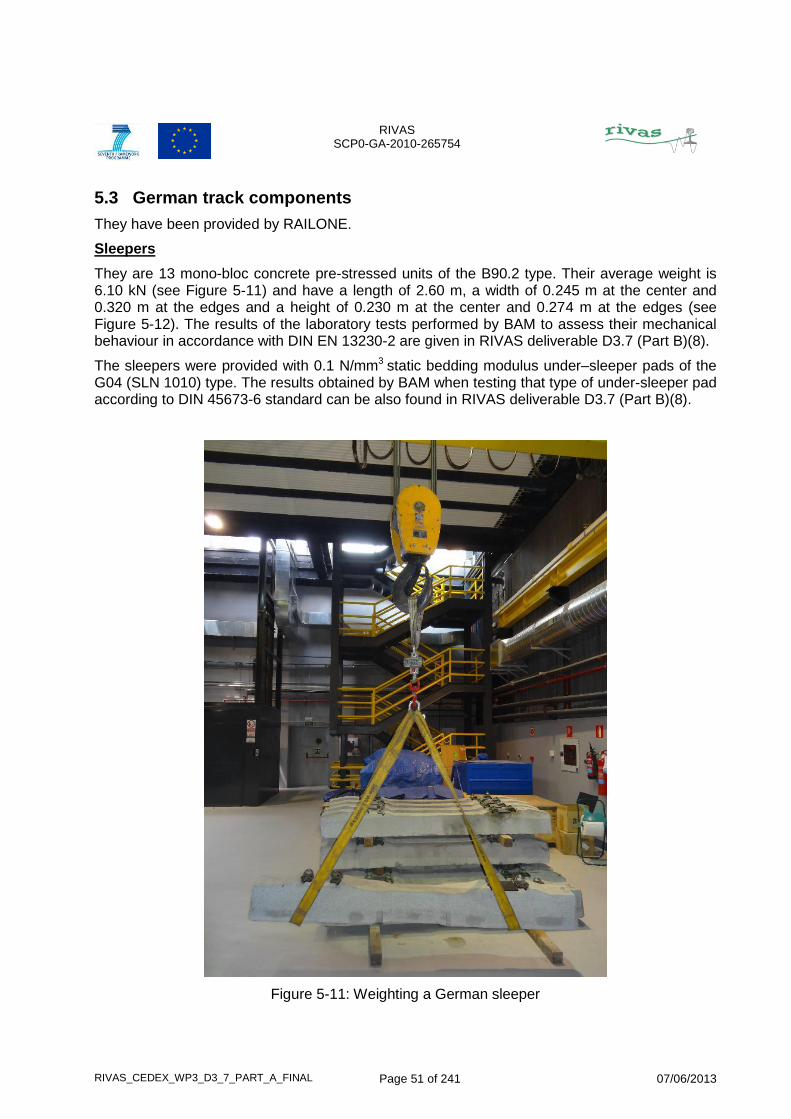
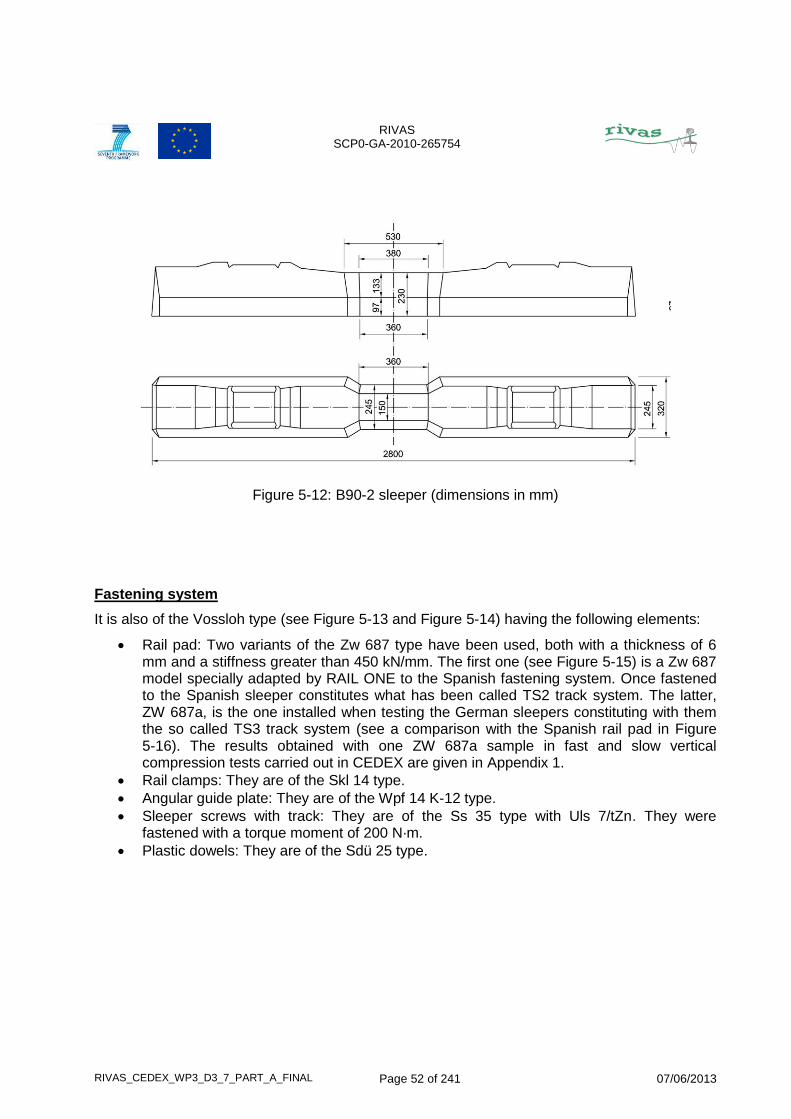
They are 13 mono-bloc concrete pre-stressed units of the B90.2 type. Their average weight is 6.10 kN (see Figure 5-11) and have a length of 2.60 m, a width of 0.245 m at the center and 0.320 m at the edges and a height of 0.230 m at the center and 0.274 m at the edges (see Figure 5-12). The results of the laboratory tests performed by BAM to assess their mechanical behaviour in accordance with DIN EN 13230-2 are given in RIVAS deliverable D3.7 (Part B)(8).
The sleepers were provided with 0.1 N/mm3 static bedding modulus under–sleeper pads of the G04 (SLN 1010) type. The results obtained by BAM when testing that type of under-sleeper pad according to DIN 45673-6 standard can be also found in RIVAS deliverable D3.7 (Part B)(8).
Figure 5-11: Weighting a German sleeper
RIVAS SCP0-GA-2010-265754
RIVAS_CEDEX_WP3_D3_7_PART_A_FINAL Page 52 of 241 07/06/2013
Figure 5-12: B90-2 sleeper (dimensions in mm)
Fastening system
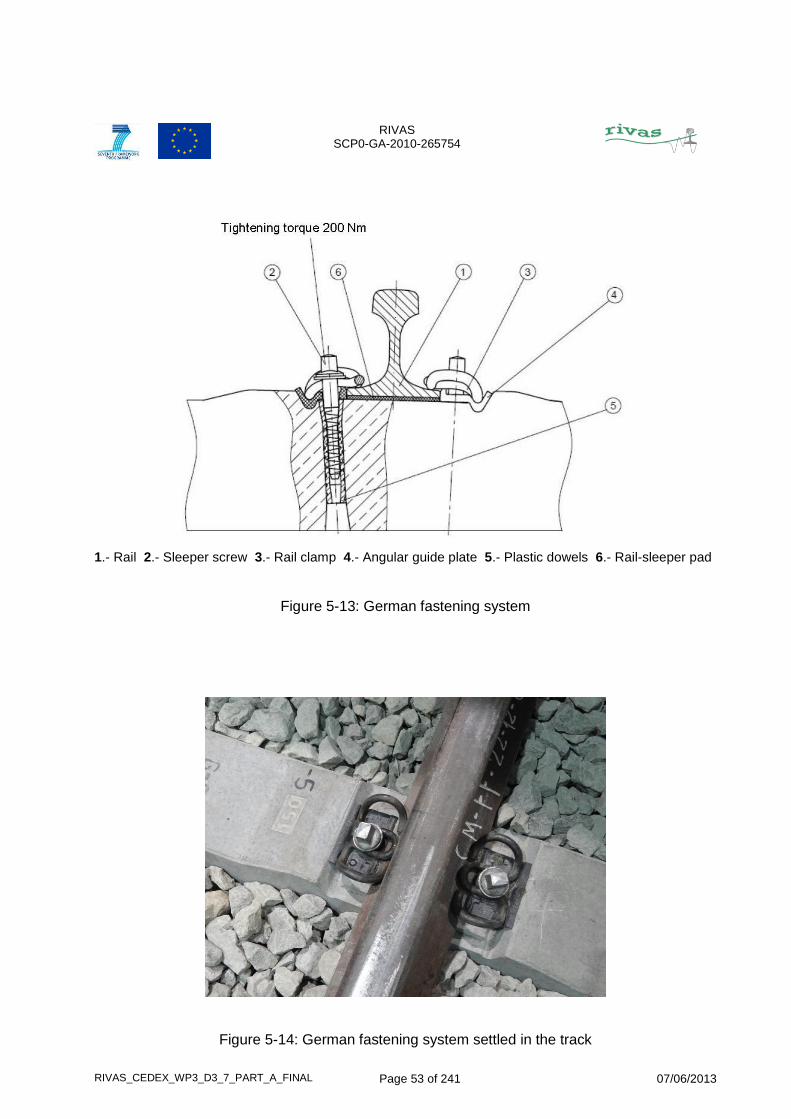
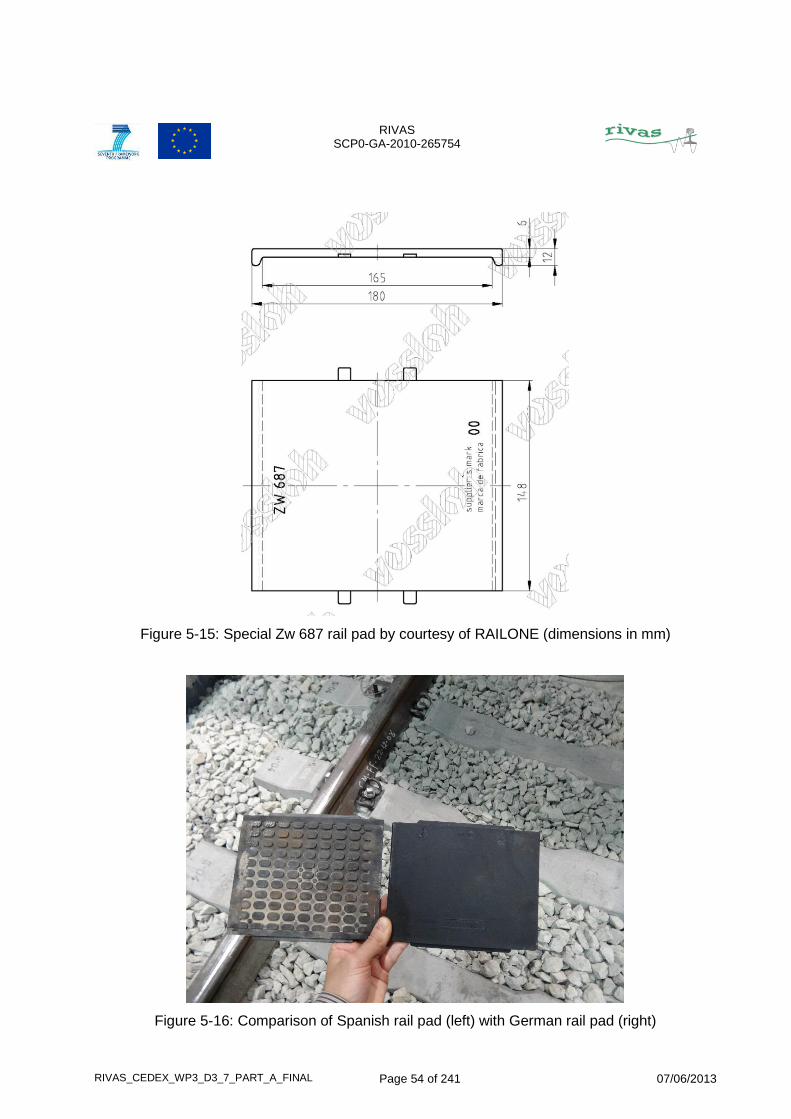
It is also of the Vossloh type (see Figure 5-13 and Figure 5-14) having the following elements:
Rail pad: Two variants of the Zw 687 type have been used, both with a thickness of 6 mm and a stiffness greater than 450 kN/mm. The first one (see Figure 5-15) is a Zw 687 model specially adapted by RAIL ONE to the Spanish fastening system. Once fastened to the Spanish sleeper constitutes what has been called TS2 track system. The latter, ZW 687a, is the one installed when testing the German sleepers constituting with them the so called TS3 track system (see a comparison with the Spanish rail pad in Figure 5-16). The results obtained with one ZW 687a sample in fast and slow vertical compression tests carried out in CEDEX are given in Appendix 1.
Rail clamps: They are of the Skl 14 type.
Angular guide plate: They are of the Wpf 14 K-12 type.
Sleeper screws with track: They are of the Ss 35 type with Uls 7/tZn. They were fastened with a torque moment of 200 N·m.
Plastic dowels: They are of the Sdü 25 type.
RIVAS SCP0-GA-2010-265754
RIVAS_CEDEX_WP3_D3_7_PART_A_FINAL Page 53 of 241 07/06/2013
1.- Rail 2.- Sleeper screw 3.- Rail clamp 4.- Angular guide plate 5.- Plastic dowels 6.- Rail-sleeper pad
Figure 5-13: German fastening system
Figure 5-14: German fastening system settled in the track
RIVAS SCP0-GA-2010-265754
RIVAS_CEDEX_WP3_D3_7_PART_A_FINAL Page 54 of 241 07/06/2013
Figure 5-15: Special Zw 687 rail pad by courtesy of RAILONE (dimensions in mm)
Figure 5-16: Comparison of Spanish rail pad (left) with German rail pad (right)
RIVAS SCP0-GA-2010-265754
RIVAS_CEDEX_WP3_D3_7_PART_A_FINAL Page 55 of 241 07/06/2013
6 TESTS PERFORMED
6.1 Introduction
In this chapter the following types of tests performed for the RIVAS project have been described:
Receptance tests
Static tests
Quasi-static tests
Dynamic tests
The objective of the receptance tests has been to characterize in the most simply way the different track systems described in chapter 5. They will also enable the comparison of the results obtained in the track box with those collected in other test sites having similar track receptance values. Additionally, useful information will also be gathered concerning the influence that the ballast thickness (34 cm in the inner rail and 38 cm in the outer rail) and the ballast state, either tamped and stabilized (BTS state) or fully consolidated under 1M (B1M state) and 2M (B2M state) freight vehicle axle load applications, has had on the results obtained.
The static tests have been performed to determine the mechanical behaviour of the TS3 track system with the ballast in the following states:
After tamped and stabilized with 70000 freight vehicle tones: BTS state
After consolidated under the pass by of 1M freight vehicle axle loads: B1M state
After consolidated under the pass by of 2M freight vehicle axle loads: B2M state
Two types of quasi-static tests were run:
Long lasting test
Short lasting tests
The long lasting quasi-static test was aimed to analyse for TS3 track system the evolution of the static and kinematic parameters of the different track components along two millions of freight vehicle axle loads.
The short lasting tests were carried out to assess the efficiency of the German pads and sleepers in abating vibrations generated by constant high amplitude and low frequency forces induced by the wheel and bogie configurations adopted for passenger and freight trains in the EU travelling at 300 and 120 km/h respectively.
Finally, short lasting dynamic test have been also run to determine the capacity of the German track components mentioned above to reduce vibrations generated by variable low amplitudes and high frequency forces generated by EU freight vehicles travelling over the vertical irregularities of a given track.
6.2 Receptance test
Recognizing the difficulty to identify track receptance values in the low frequency range from the results provided by classical hammer stroke tests, advantage has been taken from the possibility offered by the track box for generating force impulses with the same force peaks that
RIVAS SCP0-GA-2010-265754
RIVAS_CEDEX_WP3_D3_7_PART_A_FINAL Page 56 of 241 07/06/2013
those created with the hammer strokes bur with much greater rising times giving place to much lower frequency signals.
Accordingly, high and low frequency receptance tests, with the track loaded and unloaded, have been carried out in both rails at the central zone of CEDEX track box to characterize the track box configurations indicated in Table 6-1:
Table 6-1: Receptance tests performed
DATE TRACK SYSTEM BALLAST STATE
14 & 30/11/2012 TS1 B1M
31/01/2013 TS1 BTS
11/02/2013 TS2 BTS
26/02/2013 TS3 BTS
29/04/2013 TS3 B1M
13/05/2013 TS3 B2M
6.2.1 High frequency tests
They have been carried out in both rails using the impact hammer method recommended in D1.2 Annex (8). Two Brüel and Kjaer sledge hammers equipped with piezoelectric load cells have been used: one light hammer (0.45 kg mass) of the 8207 type with soft and hard tips (see Figure 6-1) and one heavy sledge hammer (5.44 kg mass) of the 8210 type with hard tip, (see Figure 6-2).
Figure 6-1: Light sledge hammer (inner rail)
RIVAS SCP0-GA-2010-265754
RIVAS_CEDEX_WP3_D3_7_PART_A_FINAL Page 57 of 241 07/06/2013
Figure 6-2: Heavy sledge hammer (outer rail)
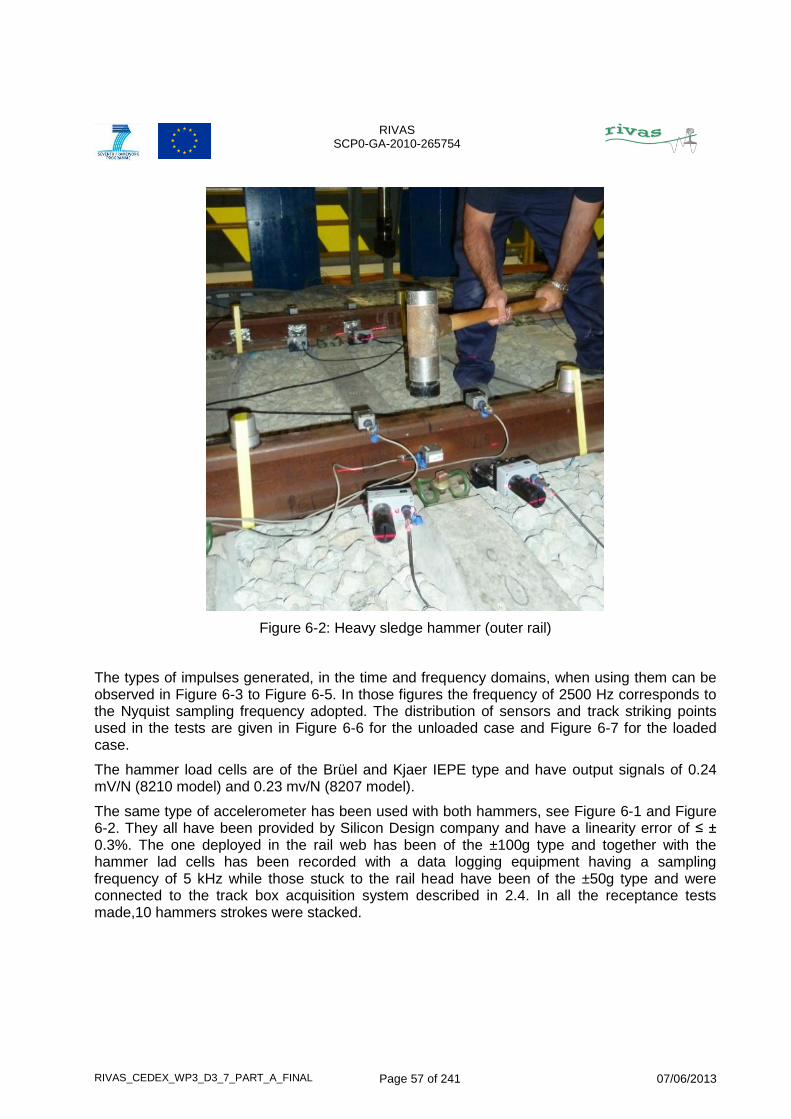
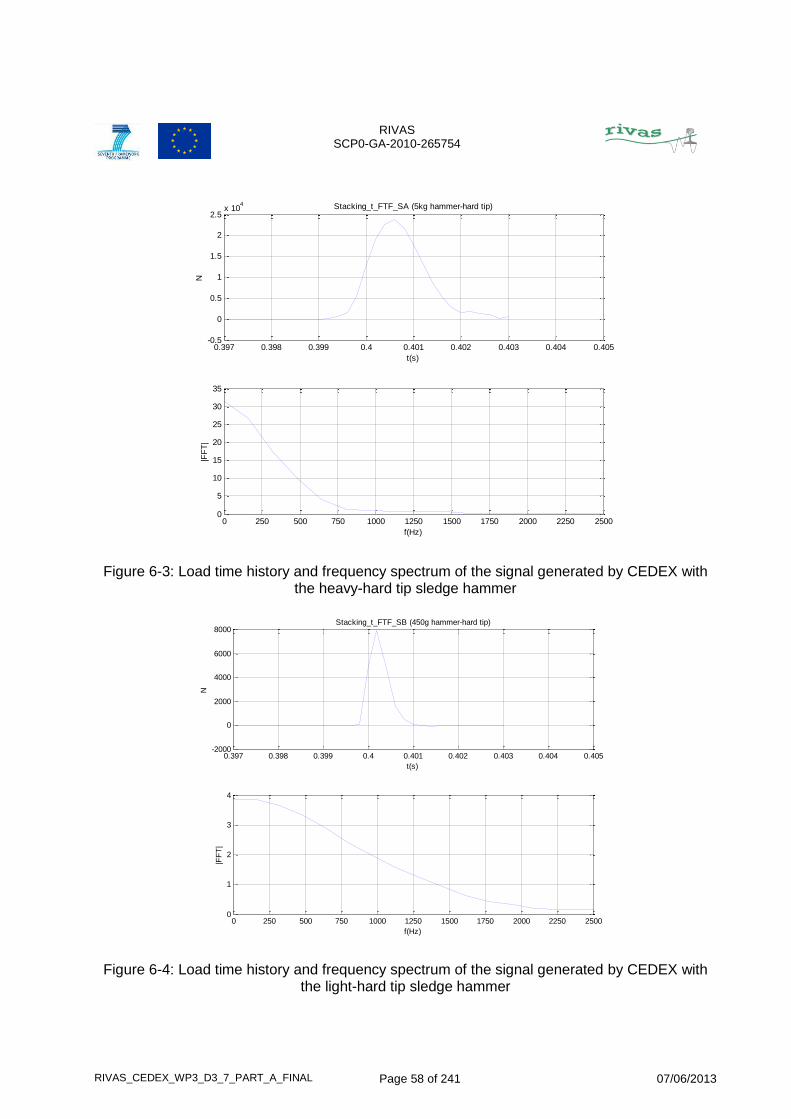
The types of impulses generated, in the time and frequency domains, when using them can be observed in Figure 6-3 to Figure 6-5. In those figures the frequency of 2500 Hz corresponds to the Nyquist sampling frequency adopted. The distribution of sensors and track striking points used in the tests are given in Figure 6-6 for the unloaded case and Figure 6-7 for the loaded case.
The hammer load cells are of the Brüel and Kjaer IEPE type and have output signals of 0.24 mV/N (8210 model) and 0.23 mv/N (8207 model).
The same type of accelerometer has been used with both hammers, see Figure 6-1 and Figure 6-2. They all have been provided by Silicon Design company and have a linearity error of ≤ ± 0.3%. The one deployed in the rail web has been of the ±100g type and together with the hammer lad cells has been recorded with a data logging equipment having a sampling frequency of 5 kHz while those stuck to the rail head have been of the ±50g type and were connected to the track box acquisition system described in 2.4. In all the receptance tests made,10 hammers strokes were stacked.
RIVAS SCP0-GA-2010-265754
RIVAS_CEDEX_WP3_D3_7_PART_A_FINAL Page 58 of 241 07/06/2013
Figure 6-3: Load time history and frequency spectrum of the signal generated by CEDEX with the heavy-hard tip sledge hammer
Figure 6-4: Load time history and frequency spectrum of the signal generated by CEDEX with the light-hard tip sledge hammer
0.397 0.398 0.399 0.4 0.401 0.402 0.403 0.404 0.405-0.5
0
0.5
1
1.5
2
2.5x 10
4 Stacking_t_FTF_SA (5kg hammer-hard tip)
t(s)
N
0 250 500 750 1000 1250 1500 1750 2000 2250 25000
5
10
15
20
25
30
35
f(Hz)
|FF
T|
0.397 0.398 0.399 0.4 0.401 0.402 0.403 0.404 0.405-2000
0
2000
4000
6000
8000Stacking_t_FTF_SB (450g hammer-hard tip)
t(s)
N
0 250 500 750 1000 1250 1500 1750 2000 2250 25000
1
2
3
4
f(Hz)
|FF
T|
RIVAS SCP0-GA-2010-265754
RIVAS_CEDEX_WP3_D3_7_PART_A_FINAL Page 59 of 241 07/06/2013
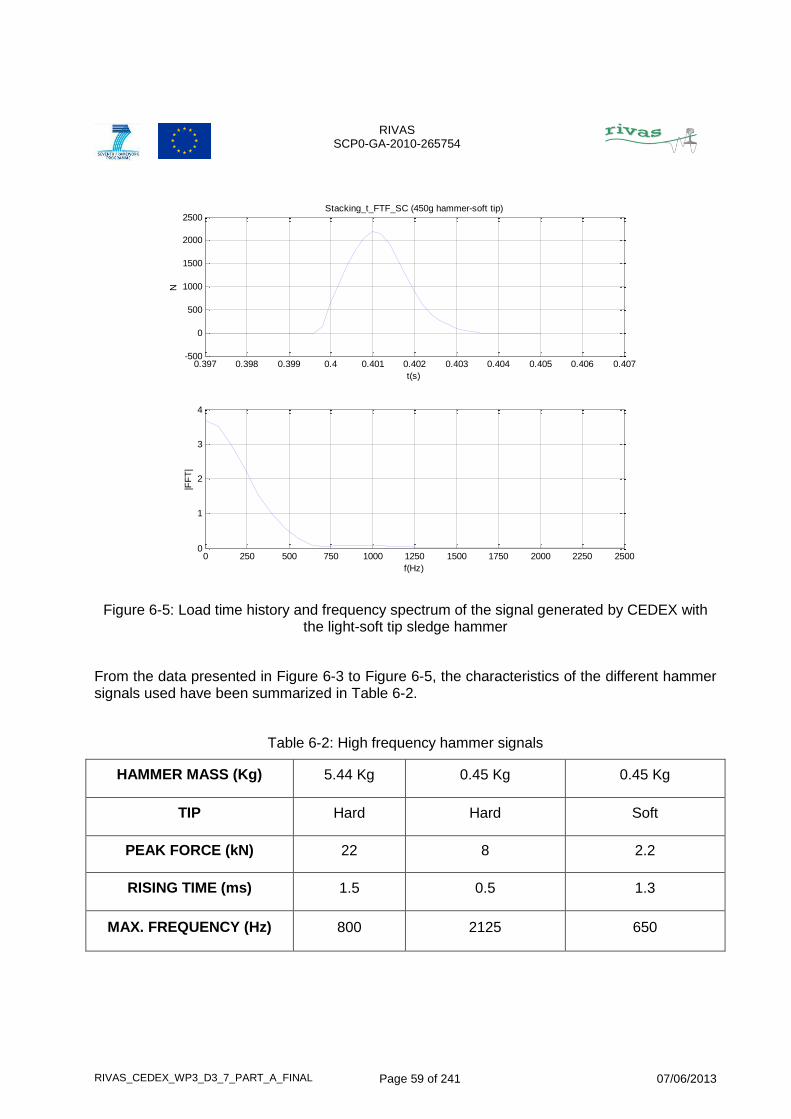
Figure 6-5: Load time history and frequency spectrum of the signal generated by CEDEX with the light-soft tip sledge hammer
From the data presented in Figure 6-3 to Figure 6-5, the characteristics of the different hammer signals used have been summarized in Table 6-2.
Table 6-2: High frequency hammer signals
HAMMER MASS (Kg) 5.44 Kg 0.45 Kg 0.45 Kg
TIP Hard Hard Soft
PEAK FORCE (kN) 22 8 2.2
RISING TIME (ms) 1.5 0.5 1.3
MAX. FREQUENCY (Hz) 800 2125 650
0.397 0.398 0.399 0.4 0.401 0.402 0.403 0.404 0.405 0.406 0.407-500
0
500
1000
1500
2000
2500Stacking_t_FTF_SC (450g hammer-soft tip)
t(s)
N
0 250 500 750 1000 1250 1500 1750 2000 2250 25000
1
2
3
4
f(Hz)
|FF
T|
RIVAS SCP0-GA-2010-265754
RIVAS_CEDEX_WP3_D3_7_PART_A_FINAL Page 60 of 241 07/06/2013
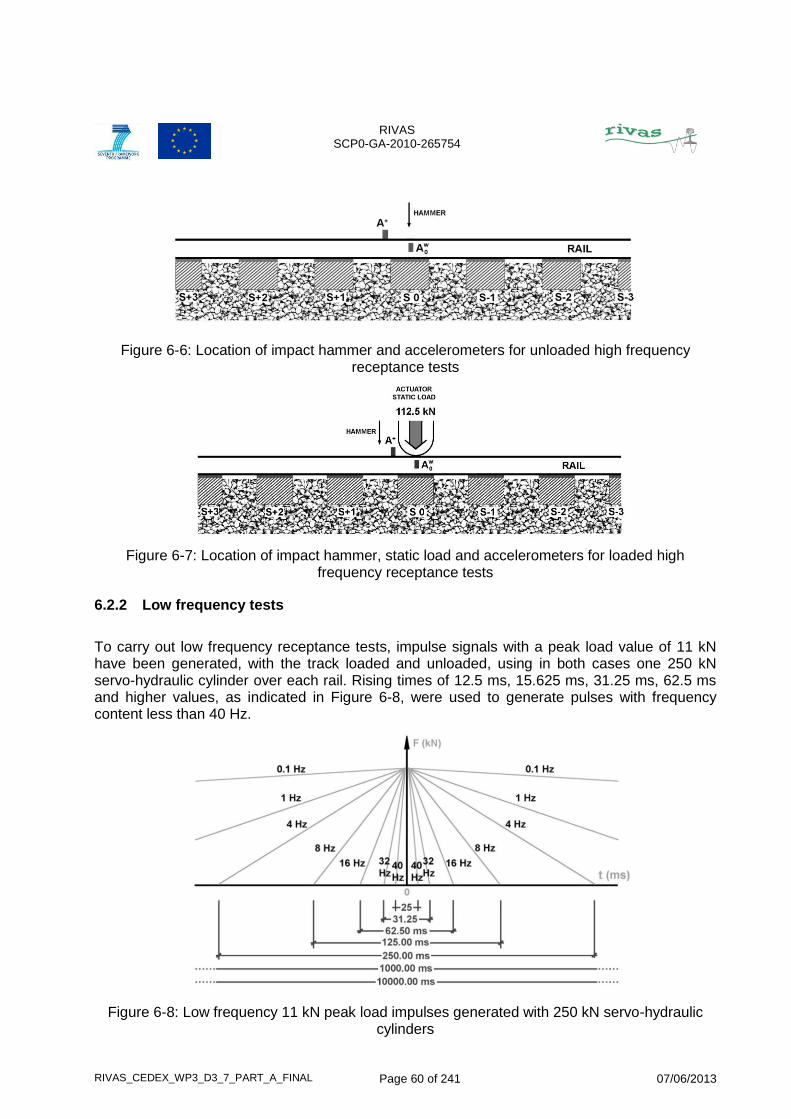
Figure 6-6: Location of impact hammer and accelerometers for unloaded high frequency receptance tests
Figure 6-7: Location of impact hammer, static load and accelerometers for loaded high frequency receptance tests
6.2.2 Low frequency tests
To carry out low frequency receptance tests, impulse signals with a peak load value of 11 kN have been generated, with the track loaded and unloaded, using in both cases one 250 kN servo-hydraulic cylinder over each rail. Rising times of 12.5 ms, 15.625 ms, 31.25 ms, 62.5 ms and higher values, as indicated in Figure 6-8, were used to generate pulses with frequency content less than 40 Hz.
Figure 6-8: Low frequency 11 kN peak load impulses generated with 250 kN servo-hydraulic cylinders
RIVAS SCP0-GA-2010-265754
RIVAS_CEDEX_WP3_D3_7_PART_A_FINAL Page 61 of 241 07/06/2013
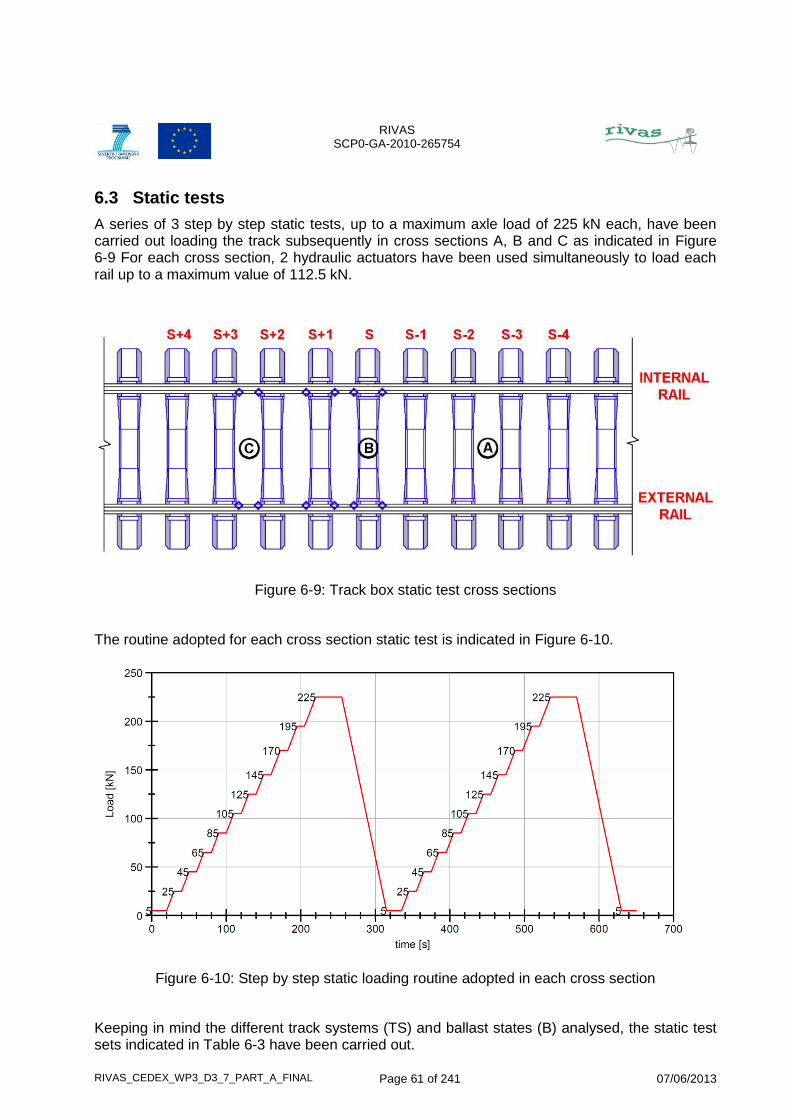
6.3 Static tests
A series of 3 step by step static tests, up to a maximum axle load of 225 kN each, have been carried out loading the track subsequently in cross sections A, B and C as indicated in Figure 6-9 For each cross section, 2 hydraulic actuators have been used simultaneously to load each rail up to a maximum value of 112.5 kN.
Figure 6-9: Track box static test cross sections
The routine adopted for each cross section static test is indicated in Figure 6-10.
Figure 6-10: Step by step static loading routine adopted in each cross section
Keeping in mind the different track systems (TS) and ballast states (B) analysed, the static test sets indicated in Table 6-3 have been carried out.
RIVAS SCP0-GA-2010-265754
RIVAS_CEDEX_WP3_D3_7_PART_A_FINAL Page 62 of 241 07/06/2013
Table 6-3: Static tests performed
DATE TRACK SYSTEM BALLAST STATE
25/02/2013 TS3 BT
25/02/2013 TS3 BTS
26/04/2013 TS3 B1M
09/05/2013 TS3 B2M
The following sets of sensors were used for each static test set:
8 laser beam systems: 4 for cross section B and 2 for each one of cross sections
A and C
16 inductive rail-pad displacement sensors: 8 for each rail
3 inductive sleeper displacement sensors with probe tip: 1 for each cross section.
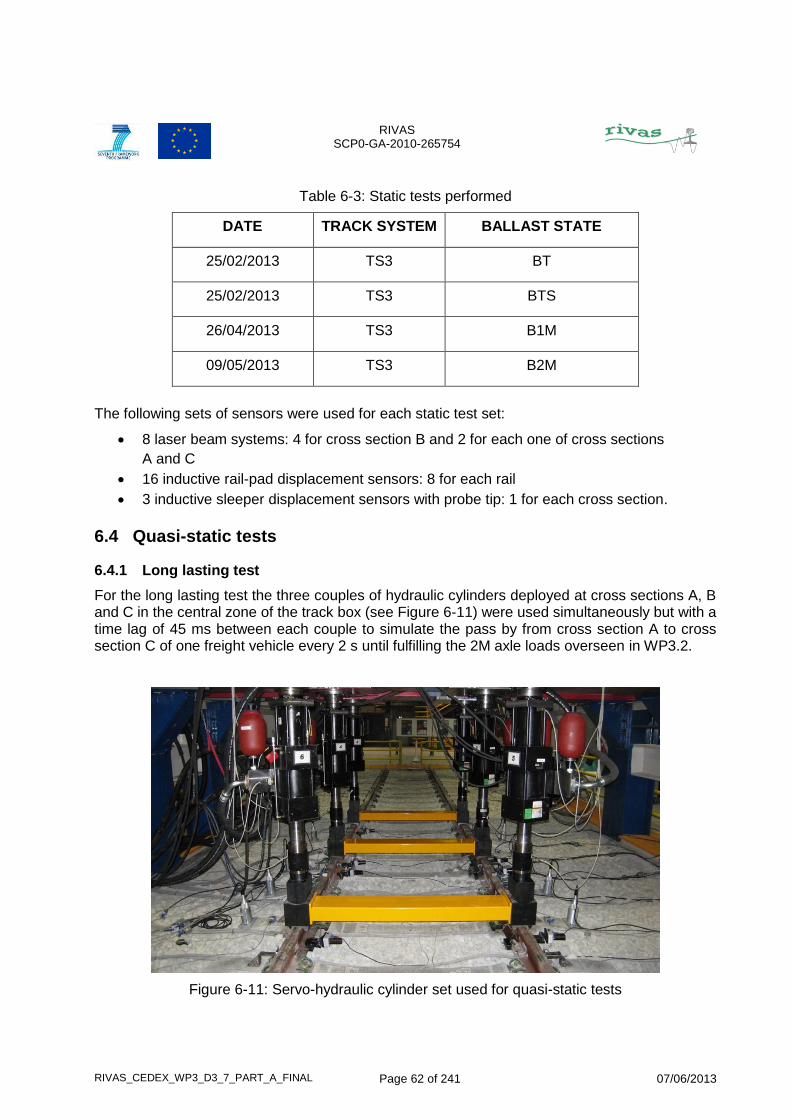
6.4 Quasi-static tests
6.4.1 Long lasting test
For the long lasting test the three couples of hydraulic cylinders deployed at cross sections A, B and C in the central zone of the track box (see Figure 6-11) were used simultaneously but with a time lag of 45 ms between each couple to simulate the pass by from cross section A to cross section C of one freight vehicle every 2 s until fulfilling the 2M axle loads overseen in WP3.2.
Figure 6-11: Servo-hydraulic cylinder set used for quasi-static tests
RIVAS SCP0-GA-2010-265754
RIVAS_CEDEX_WP3_D3_7_PART_A_FINAL Page 63 of 241 07/06/2013
The test, which was performed on TS3 track system, was initiated on 16/04/2013 and ended on 09/05/2013. On 26/04/2013, after having applied 1M axle loads, a set of static tests were run to assess the evolution of the different track components mechanical behaviour.
During each working day the pass by of 1220 freight vehicles has been executed making a total of 200000 axle load applications per day. Every day the pass by of one complete freight vehicle has been recorded, with both the internal and external sensor systems described in chapter 2, four times: for vehicles 1, 60, 750 and 1220. Besides, LVDT data of irreversible compressions in ballast and under sleeper pad were obtained independently, along the whole test, after the pass by of trains 1, 4, 8, 15, 25, 37, 50, and then every 60 trains until completing the total number of 2M axle load.
6.4.2 Short lasting tests
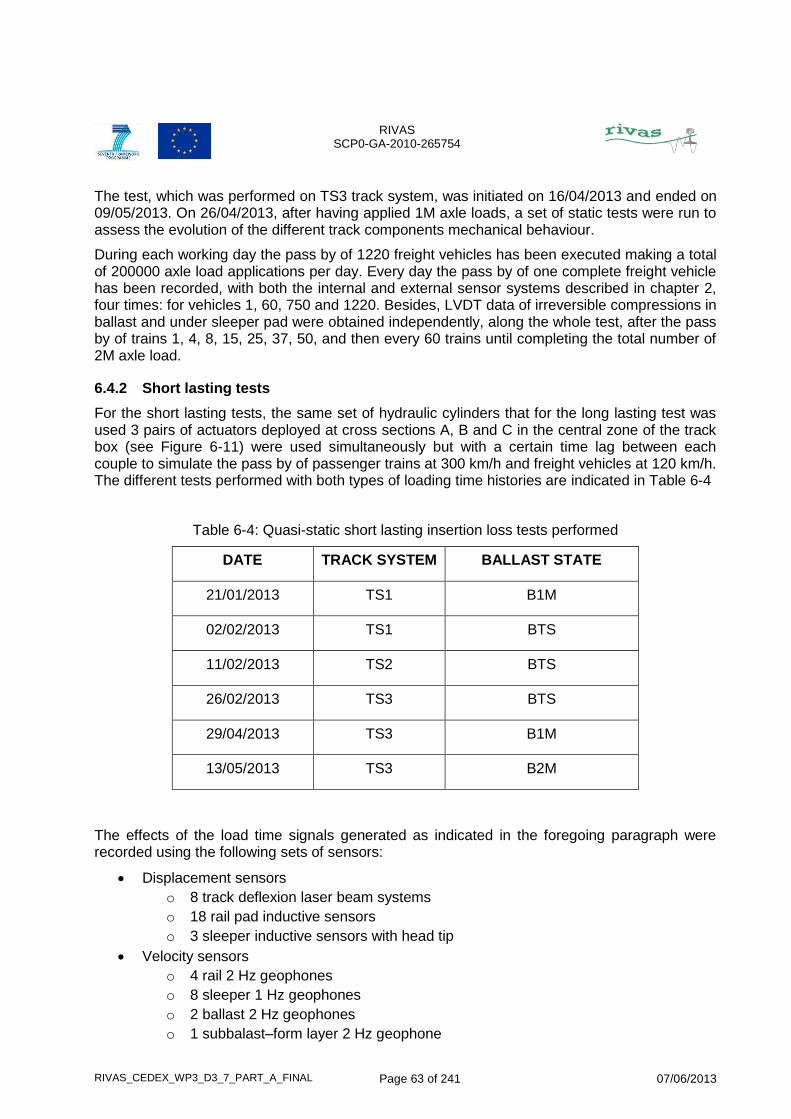
For the short lasting tests, the same set of hydraulic cylinders that for the long lasting test was used 3 pairs of actuators deployed at cross sections A, B and C in the central zone of the track box (see Figure 6-11) were used simultaneously but with a certain time lag between each couple to simulate the pass by of passenger trains at 300 km/h and freight vehicles at 120 km/h. The different tests performed with both types of loading time histories are indicated in Table 6-4
Table 6-4: Quasi-static short lasting insertion loss tests performed
DATE TRACK SYSTEM BALLAST STATE
21/01/2013 TS1 B1M
02/02/2013 TS1 BTS
11/02/2013 TS2 BTS
26/02/2013 TS3 BTS
29/04/2013 TS3 B1M
13/05/2013 TS3 B2M
The effects of the load time signals generated as indicated in the foregoing paragraph were recorded using the following sets of sensors:
Displacement sensors
o 8 track deflexion laser beam systems
o 18 rail pad inductive sensors
o 3 sleeper inductive sensors with head tip
Velocity sensors
o 4 rail 2 Hz geophones
o 8 sleeper 1 Hz geophones
o 2 ballast 2 Hz geophones
o 1 subbalast–form layer 2 Hz geophone
RIVAS SCP0-GA-2010-265754
RIVAS_CEDEX_WP3_D3_7_PART_A_FINAL Page 64 of 241 07/06/2013
o 1 form layer- embankment 2 Hz geophone
o 1 middle embankment 2Hz geophone
o 1 bottom embankment 4 Hz geophone
o 2 track box foundation 1 Hz geophone
Acceleration sensors
o 4 rail ± 50 g accelerometers
o 4 sleeper ± 10 g accelerometers
o 2 ballast ± 5 g accelerometers
o 1 subbalast–form layer ± 5 g accelerometer
o 1 form layer- embankment ± 5 g accelerometer
o 1 middle embankment ± 5 g accelerometer
o 1 bottom embankment ± 5 g accelerometer
With passenger train
To carry out this type of test the couple of cylinders at cross section B were fed up with the load time signal indicated in Figure 4-2 while a multiplying factor of 1.125 was applied to the amplitude of the loads in that signal when feeding the cylinders at cross sections A and C. The time lag between adjacent pair of actuators to simulate a travelling speed of 300 km/h was 18 ms.
For each test, the testing routine indicated in Figure 4-3 was used to generate 10 consecutive load time histories. Only the track effects of the last one were recorded with all sensors indicated in 6.3.
With freight vehicle
To carry out this type of test the couple of cylinders at cross section B were fed up with the load time signal indicated in Figure 4-5 while a multiplying factor of 1.125 was applied to the amplitude of the loads in that signal when feeding the cylinders at cross sections A and C. The time lag between adjacent pair of actuators to simulate a travelling speed of 120 km/h was 45 ms.
For each test, the testing routine indicated in
Figure 4-6 was used to generate 10 consecutive load time histories. Only the track effects of the last one were recorded with all the sensors indicated in 6.3.
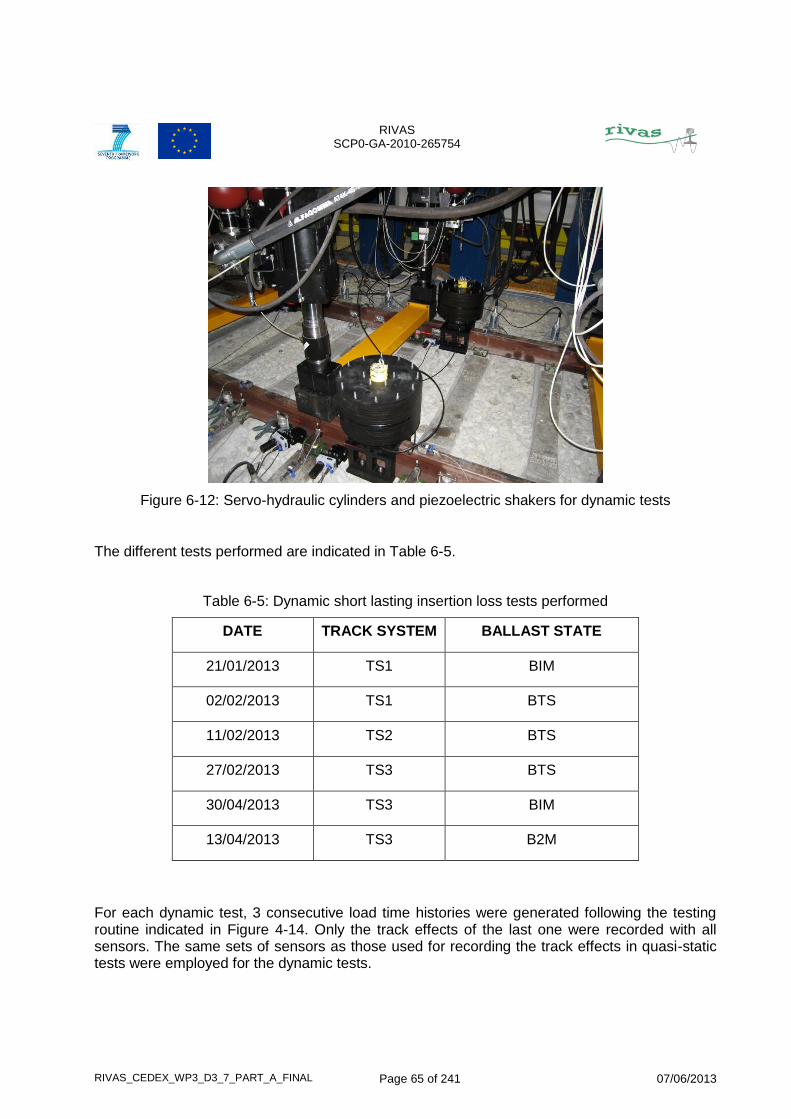
6.5 Dynamic short lasting insertion loss tests
For the dynamic tests, cross section B was loaded statically with 225 kN using a couple of hydraulic actuators which provided 112.5 kN to each rail. Then, the two piezoelectric shakers shown in Figure 2-4 were mounted close to them (see Figure 6-12) to generate on each rail the load time history represented in Figure 4-13.
RIVAS SCP0-GA-2010-265754
RIVAS_CEDEX_WP3_D3_7_PART_A_FINAL Page 65 of 241 07/06/2013
Figure 6-12: Servo-hydraulic cylinders and piezoelectric shakers for dynamic tests
The different tests performed are indicated in Table 6-5.
Table 6-5: Dynamic short lasting insertion loss tests performed
DATE TRACK SYSTEM BALLAST STATE
21/01/2013 TS1 BIM
02/02/2013 TS1 BTS
11/02/2013 TS2 BTS
27/02/2013 TS3 BTS
30/04/2013 TS3 BIM
13/04/2013 TS3 B2M
For each dynamic test, 3 consecutive load time histories were generated following the testing routine indicated in Figure 4-14. Only the track effects of the last one were recorded with all sensors. The same sets of sensors as those used for recording the track effects in quasi-static tests were employed for the dynamic tests.

RIVAS SCP0-GA-2010-265754
RIVAS_CEDEX_WP3_D3_7_PART_A_FINAL Page 66 of 241 07/06/2013
RIVAS SCP0-GA-2010-265754
RIVAS_CEDEX_WP3_D3_7_PART_A_FINAL Page 67 of 241 07/06/2013
7 RESULTS OBTAINED
7.1 Introduction
In this chapter, some sets of curves and tables summarizing the results obtained in the different tests performed for RIVAS project have been given. Although some of the figures and tables are self-conclusive, the main objective of the chapter has been to present data in a comprehensive way for a thoroughly discussion among the Rivas partners.
References have been made to two appendices that complete the information compiled in the different chapter subsections: Appendix 2, where a comparison of the track receptance functions obtained for the different track systems and ballast states considered is effectuated and Appendix 3 providing the insertion loss spectra needed to assess the efficiency of the German rail pad and sleeper to abate vibrations generated in the track by different vibration sources.
7.2 Track receptance tests
The Figures making a comparative analysis of the track receptance functions obtained for TS1, TS2 and TS3 track systems are given in Appendix 2. Depending on the recording length, those curves have been elaborated with a point density of 0.42 to 0.84 points per frequency.
More specifically, the track receptance curves (drawn at logarithmic scales) providing the results obtained in the tests performed on the outer rail (the one with a ballast thickness of 38 cm) are collected in Appendices 2.1 to 2.3, while the track receptance curves corresponding to the tests run on the inner rail (with a ballast thickness of 34 cm) are gathered in Appendices 2.4 to 2.6.
In those appendices, the track receptance curves have been classified, according to the ballast states tested, in three different groups:
Appendices 2.1 and 2.4 for ballast in BTS state
Appendices 2.2 and 2.5 for ballast in B1M state
Appendices 2.3 and 2.6 for ballast in B1M and B2M states
Each one of those appendices consists of eight figures representing the results obtained with the rail loaded (the first four) and the data obtained with the rail unloaded (the last four).
Each figure in Appendices 2.1 and 2.4 compares the results obtained with one striking tool in TS1, TS2 and TS3 track systems with the ballast tamped and stabilized (BTS state).
The figures in Appendices 2.2 and 2.5 compare the results obtained in TS1 and TS3 track systems with the ballast consolidated under the pass by of 1M freight vehicle axle loads.
Figures in Appendices 2.3 and 2.6 compare the results obtained in TS1 track system after the passage of 1M freight vehicle axle loads with those provided by TS3 track system after the passage of 2M freight vehicle axle loads.
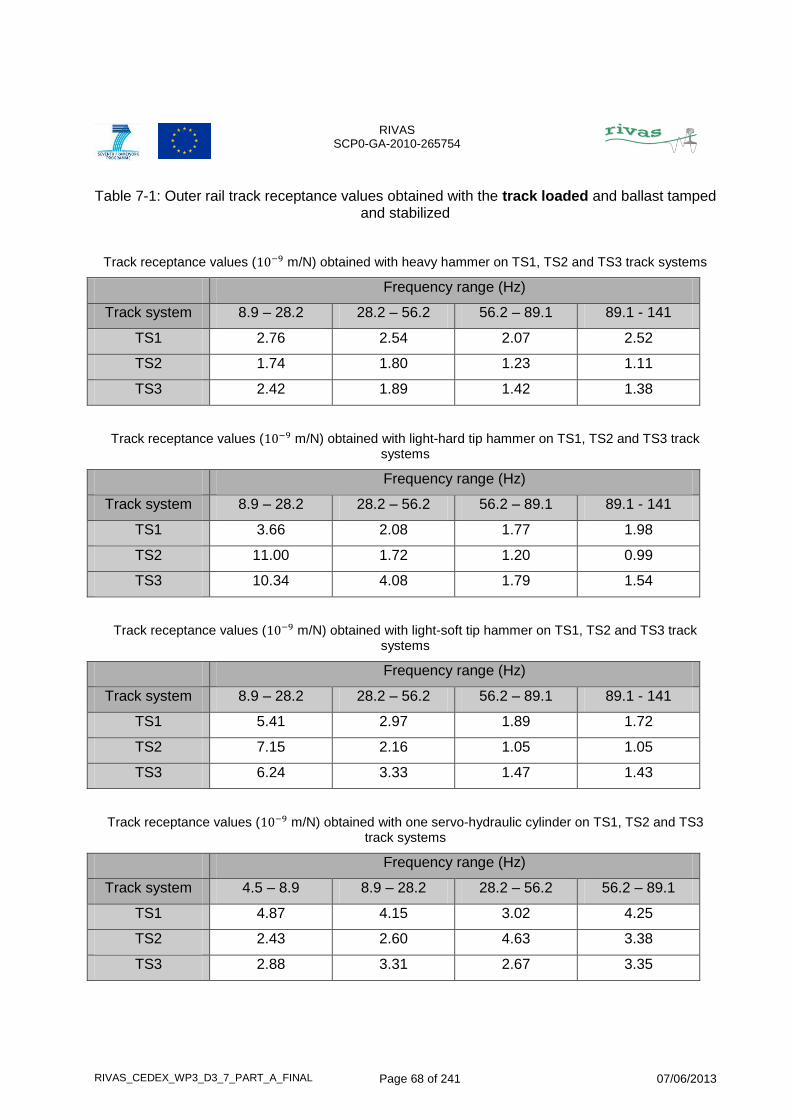
To facilitate the interpretation of the track receptance curves given in Appendix 2, the 10 – 140 Hz range for the curves corresponding to the hammer tests and the 4 – 90 Hz range for those related to the hydraulic cylinder tests have been divided into the five frequency ranges identified in Table 7-1 to Table 7-6 for the outer rail and in Table 7-7 to Table 7-12 for the inner rail. In those tables, the numbers given in the row cells for each one of the track systems considered represent the average values of the receptance point values corresponding to each one of the abovementioned five frequency ranges according to the curve point density previously defined.
RIVAS SCP0-GA-2010-265754
RIVAS_CEDEX_WP3_D3_7_PART_A_FINAL Page 68 of 241 07/06/2013
Table 7-1: Outer rail track receptance values obtained with the track loaded and ballast tamped and stabilized
Track receptance values ( m/N) obtained with heavy hammer on TS1, TS2 and TS3 track systems
Frequency range (Hz)
Track system 8.9 – 28.2 28.2 – 56.2 56.2 – 89.1 89.1 - 141
TS1 2.76 2.54 2.07 2.52
TS2 1.74 1.80 1.23 1.11
TS3 2.42 1.89 1.42 1.38
Track receptance values ( m/N) obtained with light-hard tip hammer on TS1, TS2 and TS3 track systems
Frequency range (Hz)
Track system 8.9 – 28.2 28.2 – 56.2 56.2 – 89.1 89.1 - 141
TS1 3.66 2.08 1.77 1.98
TS2 11.00 1.72 1.20 0.99
TS3 10.34 4.08 1.79 1.54
Track receptance values ( m/N) obtained with light-soft tip hammer on TS1, TS2 and TS3 track systems
Frequency range (Hz)
Track system 8.9 – 28.2 28.2 – 56.2 56.2 – 89.1 89.1 - 141
TS1 5.41 2.97 1.89 1.72
TS2 7.15 2.16 1.05 1.05
TS3 6.24 3.33 1.47 1.43
Track receptance values ( m/N) obtained with one servo-hydraulic cylinder on TS1, TS2 and TS3 track systems
Frequency range (Hz)
Track system 4.5 – 8.9 8.9 – 28.2 28.2 – 56.2 56.2 – 89.1
TS1 4.87 4.15 3.02 4.25
TS2 2.43 2.60 4.63 3.38
TS3 2.88 3.31 2.67 3.35
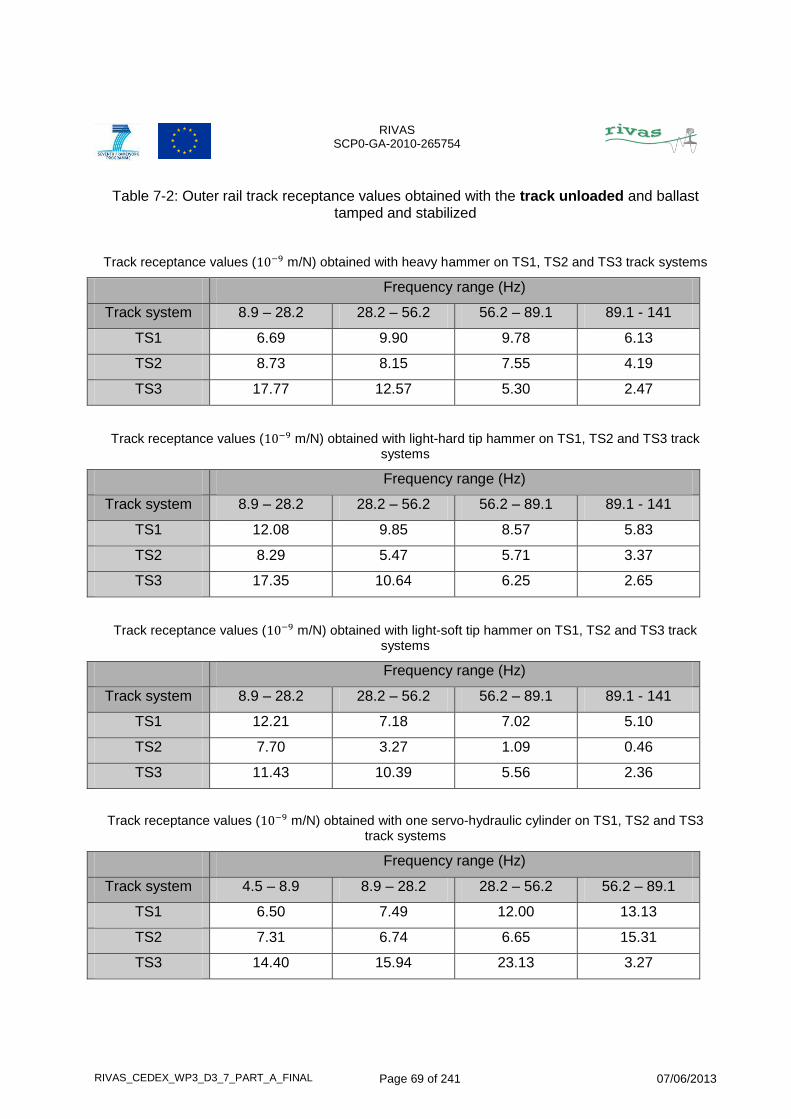
RIVAS SCP0-GA-2010-265754
RIVAS_CEDEX_WP3_D3_7_PART_A_FINAL Page 69 of 241 07/06/2013
Table 7-2: Outer rail track receptance values obtained with the track unloaded and ballast tamped and stabilized
Track receptance values ( m/N) obtained with heavy hammer on TS1, TS2 and TS3 track systems
Frequency range (Hz)
Track system 8.9 – 28.2 28.2 – 56.2 56.2 – 89.1 89.1 - 141
TS1 6.69 9.90 9.78 6.13
TS2 8.73 8.15 7.55 4.19
TS3 17.77 12.57 5.30 2.47
Track receptance values ( m/N) obtained with light-hard tip hammer on TS1, TS2 and TS3 track systems
Frequency range (Hz)
Track system 8.9 – 28.2 28.2 – 56.2 56.2 – 89.1 89.1 - 141
TS1 12.08 9.85 8.57 5.83
TS2 8.29 5.47 5.71 3.37
TS3 17.35 10.64 6.25 2.65
Track receptance values ( m/N) obtained with light-soft tip hammer on TS1, TS2 and TS3 track systems
Frequency range (Hz)
Track system 8.9 – 28.2 28.2 – 56.2 56.2 – 89.1 89.1 - 141
TS1 12.21 7.18 7.02 5.10
TS2 7.70 3.27 1.09 0.46
TS3 11.43 10.39 5.56 2.36
Track receptance values ( m/N) obtained with one servo-hydraulic cylinder on TS1, TS2 and TS3 track systems
Frequency range (Hz)
Track system 4.5 – 8.9 8.9 – 28.2 28.2 – 56.2 56.2 – 89.1
TS1 6.50 7.49 12.00 13.13
TS2 7.31 6.74 6.65 15.31
TS3 14.40 15.94 23.13 3.27
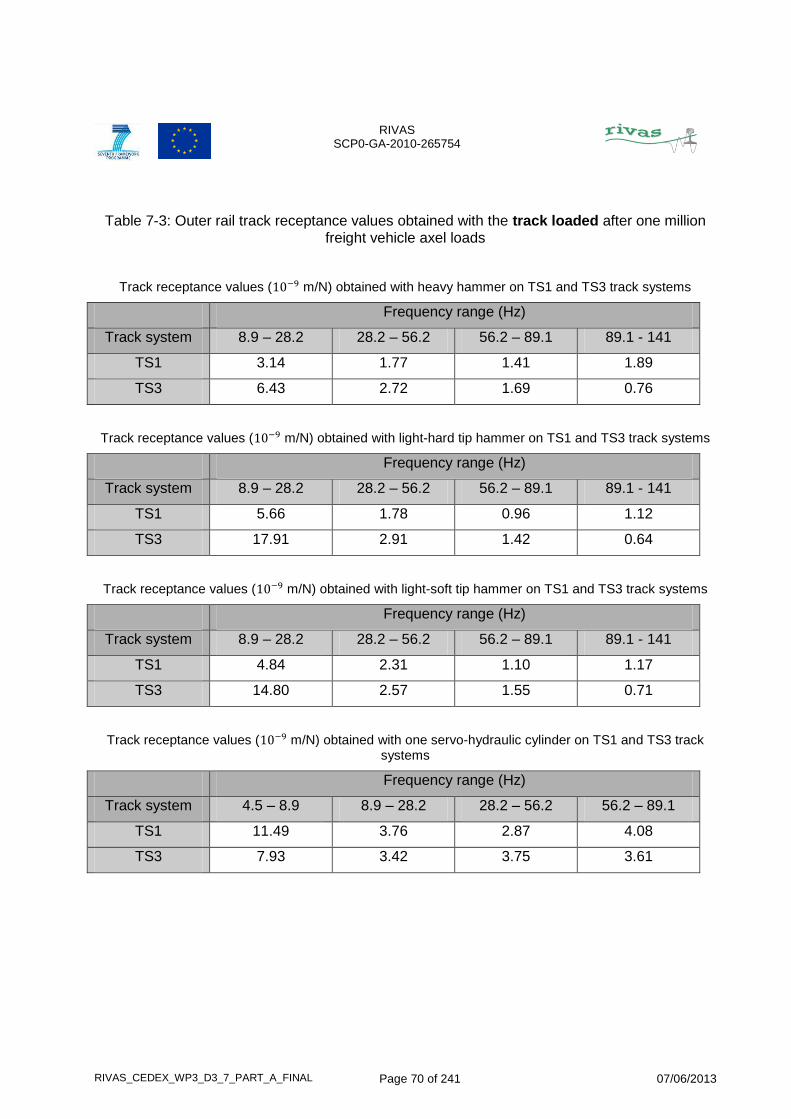
RIVAS SCP0-GA-2010-265754
RIVAS_CEDEX_WP3_D3_7_PART_A_FINAL Page 70 of 241 07/06/2013
Table 7-3: Outer rail track receptance values obtained with the track loaded after one million freight vehicle axel loads
Track receptance values ( m/N) obtained with heavy hammer on TS1 and TS3 track systems
Frequency range (Hz)
Track system 8.9 – 28.2 28.2 – 56.2 56.2 – 89.1 89.1 - 141
TS1 3.14 1.77 1.41 1.89
TS3 6.43 2.72 1.69 0.76
Track receptance values ( m/N) obtained with light-hard tip hammer on TS1 and TS3 track systems
Frequency range (Hz)
Track system 8.9 – 28.2 28.2 – 56.2 56.2 – 89.1 89.1 - 141
TS1 5.66 1.78 0.96 1.12
TS3 17.91 2.91 1.42 0.64
Track receptance values ( m/N) obtained with light-soft tip hammer on TS1 and TS3 track systems
Frequency range (Hz)
Track system 8.9 – 28.2 28.2 – 56.2 56.2 – 89.1 89.1 - 141
TS1 4.84 2.31 1.10 1.17
TS3 14.80 2.57 1.55 0.71
Track receptance values ( m/N) obtained with one servo-hydraulic cylinder on TS1 and TS3 track systems
Frequency range (Hz)
Track system 4.5 – 8.9 8.9 – 28.2 28.2 – 56.2 56.2 – 89.1
TS1 11.49 3.76 2.87 4.08
TS3 7.93 3.42 3.75 3.61
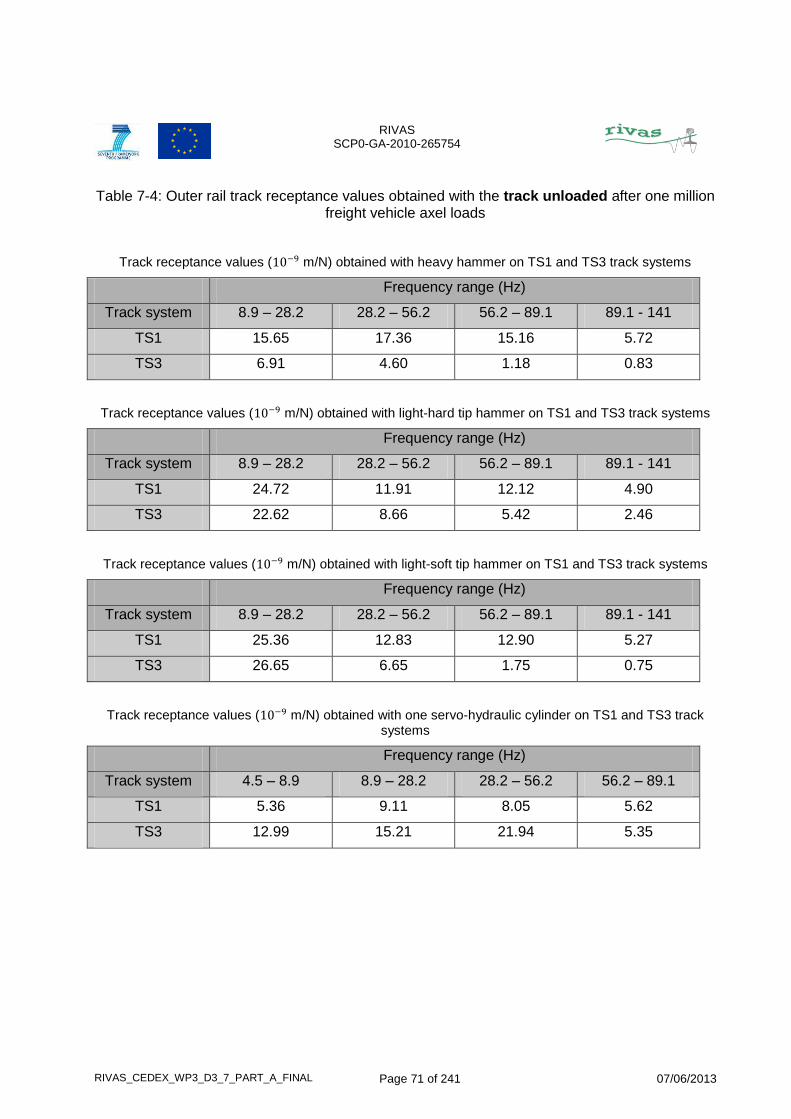
RIVAS SCP0-GA-2010-265754
RIVAS_CEDEX_WP3_D3_7_PART_A_FINAL Page 71 of 241 07/06/2013
Table 7-4: Outer rail track receptance values obtained with the track unloaded after one million freight vehicle axel loads
Track receptance values ( m/N) obtained with heavy hammer on TS1 and TS3 track systems
Frequency range (Hz)
Track system 8.9 – 28.2 28.2 – 56.2 56.2 – 89.1 89.1 - 141
TS1 15.65 17.36 15.16 5.72
TS3 6.91 4.60 1.18 0.83
Track receptance values ( m/N) obtained with light-hard tip hammer on TS1 and TS3 track systems
Frequency range (Hz)
Track system 8.9 – 28.2 28.2 – 56.2 56.2 – 89.1 89.1 - 141
TS1 24.72 11.91 12.12 4.90
TS3 22.62 8.66 5.42 2.46
Track receptance values ( m/N) obtained with light-soft tip hammer on TS1 and TS3 track systems
Frequency range (Hz)
Track system 8.9 – 28.2 28.2 – 56.2 56.2 – 89.1 89.1 - 141
TS1 25.36 12.83 12.90 5.27
TS3 26.65 6.65 1.75 0.75
Track receptance values ( m/N) obtained with one servo-hydraulic cylinder on TS1 and TS3 track systems
Frequency range (Hz)
Track system 4.5 – 8.9 8.9 – 28.2 28.2 – 56.2 56.2 – 89.1
TS1 5.36 9.11 8.05 5.62
TS3 12.99 15.21 21.94 5.35
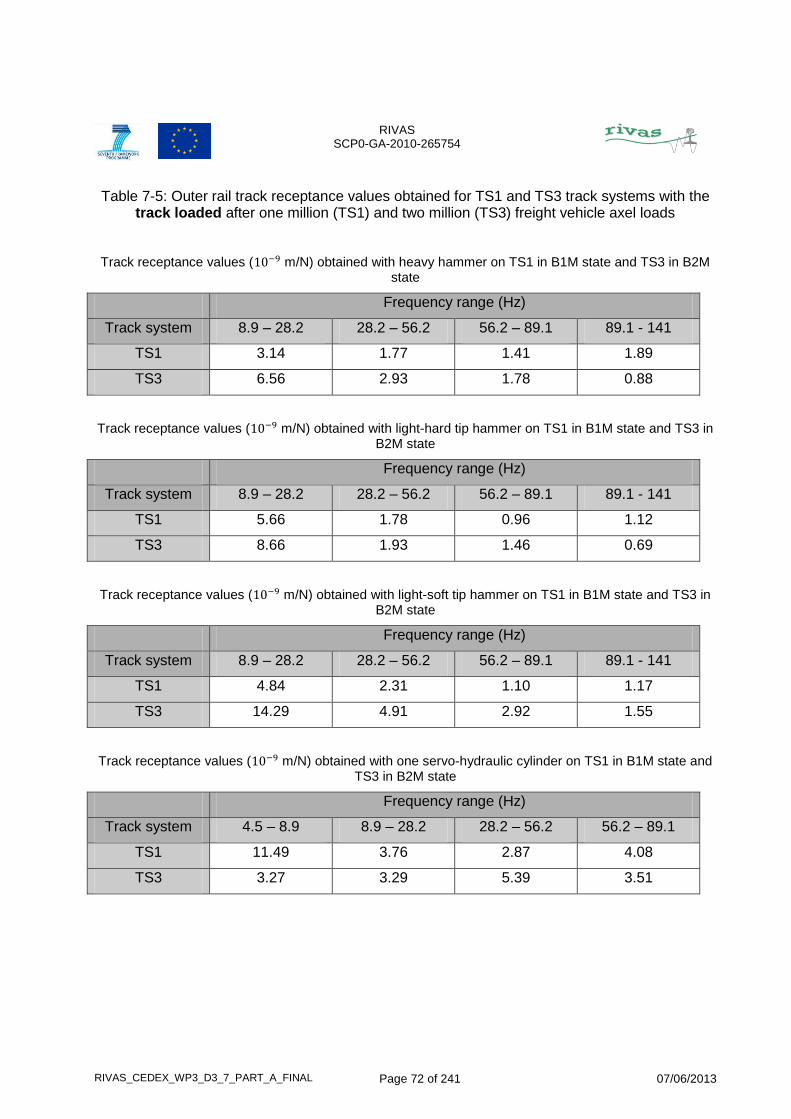
RIVAS SCP0-GA-2010-265754
RIVAS_CEDEX_WP3_D3_7_PART_A_FINAL Page 72 of 241 07/06/2013
Table 7-5: Outer rail track receptance values obtained for TS1 and TS3 track systems with the track loaded after one million (TS1) and two million (TS3) freight vehicle axel loads
Track receptance values ( m/N) obtained with heavy hammer on TS1 in B1M state and TS3 in B2M state
Frequency range (Hz)
Track system 8.9 – 28.2 28.2 – 56.2 56.2 – 89.1 89.1 - 141
TS1 3.14 1.77 1.41 1.89
TS3 6.56 2.93 1.78 0.88
Track receptance values ( m/N) obtained with light-hard tip hammer on TS1 in B1M state and TS3 in B2M state
Frequency range (Hz)
Track system 8.9 – 28.2 28.2 – 56.2 56.2 – 89.1 89.1 - 141
TS1 5.66 1.78 0.96 1.12
TS3 8.66 1.93 1.46 0.69
Track receptance values ( m/N) obtained with light-soft tip hammer on TS1 in B1M state and TS3 in B2M state
Frequency range (Hz)
Track system 8.9 – 28.2 28.2 – 56.2 56.2 – 89.1 89.1 - 141
TS1 4.84 2.31 1.10 1.17
TS3 14.29 4.91 2.92 1.55
Track receptance values ( m/N) obtained with one servo-hydraulic cylinder on TS1 in B1M state and TS3 in B2M state
Frequency range (Hz)
Track system 4.5 – 8.9 8.9 – 28.2 28.2 – 56.2 56.2 – 89.1
TS1 11.49 3.76 2.87 4.08
TS3 3.27 3.29 5.39 3.51

RIVAS SCP0-GA-2010-265754
RIVAS_CEDEX_WP3_D3_7_PART_A_FINAL Page 73 of 241 07/06/2013
Table 7-6: Outer rail track receptance values obtained for TS1 and TS3 track systems with the track unloaded after one million (TS1) and two million (TS3) freight vehicle axel loads
Track receptance values ( m/N) obtained with heavy hammer on TS1 in B1M state and TS3 in B2M state
Frequency range (Hz)
Track system 8.9 – 28.2 28.2 – 56.2 56.2 – 89.1 89.1 - 141
TS1 16.46 19.80 17.50 6.57
TS3 13.91 17.60 5.31 2.48
Track receptance values ( m/N) obtained with light-hard tip hammer on TS1 in B1M state and TS3 in B2M state
Frequency range (Hz)
Track system 8.9 – 28.2 28.2 – 56.2 56.2 – 89.1 89.1 - 141
TS1 24.72 11.91 12.12 4.90
TS3 20.07 13.01 6.91 2.28
Track receptance values ( m/N) obtained with light-soft tip hammer on TS1 in B1M state and TS3 in B2M state
Frequency range (Hz)
Track system 8.9 – 28.2 28.2 – 56.2 56.2 – 89.1 89.1 - 141
TS1 25.36 12.83 12.90 5.27
TS3 8.25 10.67 6.99 2.29
Track receptance values ( m/N) obtained with one servo-hydraulic cylinder on TS1 in B1M state and TS3 in B2M state
Frequency range (Hz)
Track system 4.5 – 8.9 8.9 – 28.2 28.2 – 56.2 56.2 – 89.1
TS1 5.36 9.11 8.05 5.62
TS3 12.60 14.45 20.50 4.76
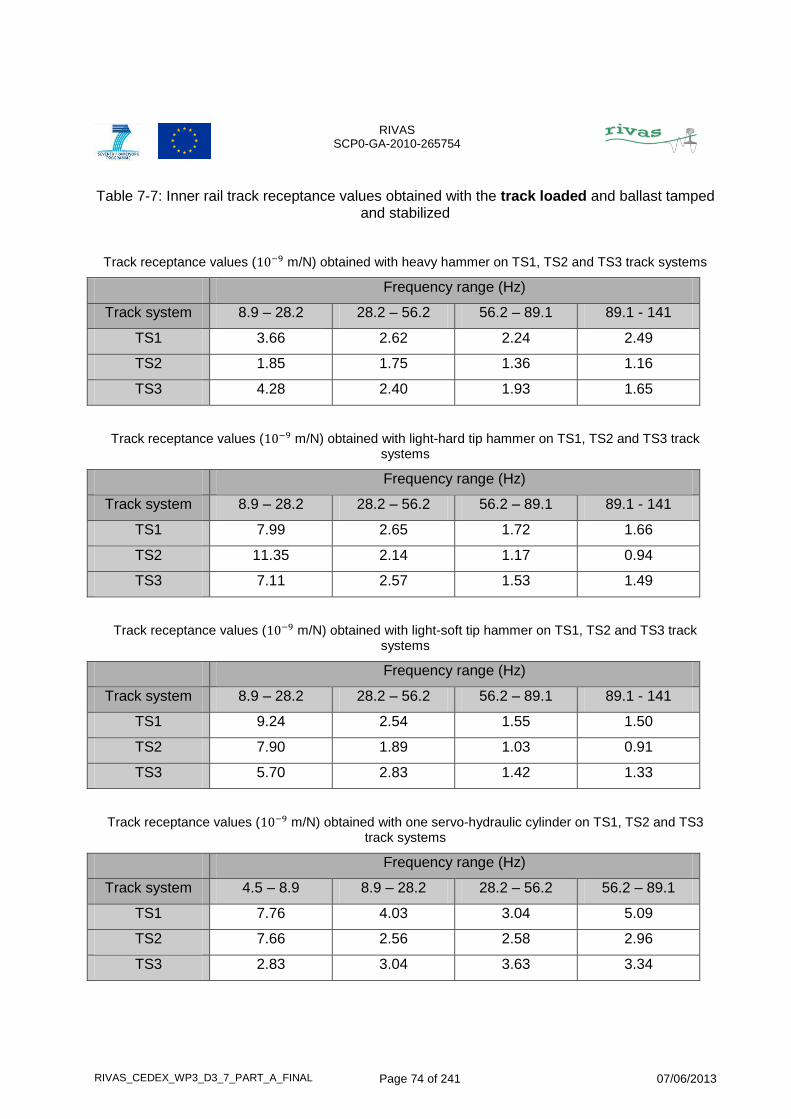
RIVAS SCP0-GA-2010-265754
RIVAS_CEDEX_WP3_D3_7_PART_A_FINAL Page 74 of 241 07/06/2013
Table 7-7: Inner rail track receptance values obtained with the track loaded and ballast tamped and stabilized
Track receptance values ( m/N) obtained with heavy hammer on TS1, TS2 and TS3 track systems
Frequency range (Hz)
Track system 8.9 – 28.2 28.2 – 56.2 56.2 – 89.1 89.1 - 141
TS1 3.66 2.62 2.24 2.49
TS2 1.85 1.75 1.36 1.16
TS3 4.28 2.40 1.93 1.65
Track receptance values ( m/N) obtained with light-hard tip hammer on TS1, TS2 and TS3 track systems
Frequency range (Hz)
Track system 8.9 – 28.2 28.2 – 56.2 56.2 – 89.1 89.1 - 141
TS1 7.99 2.65 1.72 1.66
TS2 11.35 2.14 1.17 0.94
TS3 7.11 2.57 1.53 1.49
Track receptance values ( m/N) obtained with light-soft tip hammer on TS1, TS2 and TS3 track systems
Frequency range (Hz)
Track system 8.9 – 28.2 28.2 – 56.2 56.2 – 89.1 89.1 - 141
TS1 9.24 2.54 1.55 1.50
TS2 7.90 1.89 1.03 0.91
TS3 5.70 2.83 1.42 1.33
Track receptance values ( m/N) obtained with one servo-hydraulic cylinder on TS1, TS2 and TS3 track systems
Frequency range (Hz)
Track system 4.5 – 8.9 8.9 – 28.2 28.2 – 56.2 56.2 – 89.1
TS1 7.76 4.03 3.04 5.09
TS2 7.66 2.56 2.58 2.96
TS3 2.83 3.04 3.63 3.34

RIVAS SCP0-GA-2010-265754
RIVAS_CEDEX_WP3_D3_7_PART_A_FINAL Page 75 of 241 07/06/2013
Table 7-8: : Inner rail track receptance values obtained with the track unloaded and ballast tamped and stabilized
Track receptance values ( m/N) obtained with heavy hammer on TS1, TS2 and TS3 track systems
Frequency range (Hz)
Track system 8.9 – 28.2 28.2 – 56.2 56.2 – 89.1 89.1 - 141
TS1 8.09 9.79 9.85 6.57
TS2 7.97 8.00 8.81 3.83
TS3 17.74 19.01 6.36 2.74
Track receptance values ( m/N) obtained with light-hard tip hammer on TS1, TS2 and TS3 track systems
Frequency range (Hz)
Track system 8.9 – 28.2 28.2 – 56.2 56.2 – 89.1 89.1 - 141
TS1 12.06 5.65 7.12 5.29
TS2 5.12 4.90 6.25 3.21
TS3 8.69 9.22 6.56 2.49
Track receptance values ( m/N) obtained with light-soft tip hammer on TS1, TS2 and TS3 track systems
Frequency range (Hz)
Track system 8.9 – 28.2 28.2 – 56.2 56.2 – 89.1 89.1 - 141
TS1 10.68 8.26 6.58 4.90
TS2 6.64 4.18 1.06 0.51
TS3 7.69 10.76 6.73 2.51
Track receptance values ( m/N) obtained with one servo-hydraulic cylinder on TS1, TS2 and TS3 track systems
Frequency range (Hz)
Track system 4.5 – 8.9 8.9 – 28.2 28.2 – 56.2 56.2 – 89.1
TS1 6.12 7.28 8.24 12.50
TS2 7.93 6.51 5.56 16.99
TS3 14.84 17.59 24.09 5.00

RIVAS SCP0-GA-2010-265754
RIVAS_CEDEX_WP3_D3_7_PART_A_FINAL Page 76 of 241 07/06/2013
Table 7-9: Inner rail track receptance values obtained with the track loaded after one million freight vehicle axel loads
Track receptance values ( m/N) obtained with heavy hammer on TS1 and TS3 track systems
Frequency range (Hz)
Track system 8.9 – 28.2 28.2 – 56.2 56.2 – 89.1 89.1 - 141
TS1 1.72 2.66 1.90 2.21
TS3 2.23 1.98 1.59 1.56
Track receptance values ( m/N) obtained with light-hard tip hammer on TS1 and TS3 track systems
Frequency range (Hz)
Track system 8.9 – 28.2 28.2 – 56.2 56.2 – 89.1 89.1 - 141
TS1 6.48 2.40 1.73 1.79
TS3 10.66 2.70 1.63 1.56
Track receptance values ( m/N) obtained with light-soft tip hammer on TS1 and TS3 track systems
Frequency range (Hz)
Track system 8.9 – 28.2 28.2 – 56.2 56.2 – 89.1 89.1 - 141
TS1 4.33 2.08 1.41 1.59
TS3 25.23 3.26 1.32 1.48
Track receptance values ( m/N) obtained with one servo-hydraulic cylinder on TS1 and TS3 track systems
Frequency range (Hz)
Track system 4.5 – 8.9 8.9 – 28.2 28.2 – 56.2 56.2 – 89.1
TS1 3.78 3.85 3.51 3.44
TS3 5.74 3.28 2.64 3.72