Embed Size (px)
Citation preview
January 17,
2014
STATEWIDE PLANNING TECHNICAL
PAPER Number: #000
ROAD SALT/SAND APPLICATION IN RHODE
ISLAND
Rhode Island Department of Administration Division of Planning
Statewide Planning Program
One Capitol Hill Providence, RI 02908-5870
www.planning.ri.gov
Technical Paper ###: Road Salt/Sand Application in Rhode Island 1/17/14
Page 1
The Rhode Island Statewide Planning Program, Division of Planning, Department of Administration is
established by Rhode Island General Law Chapter 42-11 as the central planning agency for state government. The State Planning Council is comprised of state, local, and public representatives. Federal and other advisors, guide the work of the Program. The objectives of the Program are:
(1) to prepare strategic and systems plans for the State (2) to coordinate activities of the public and private sectors within this framework of policies and
programs (3) to assist local governments in management, and (4) to advise the Governor and others concerned on physical, social, and economic topics. Further, the Division of Planning is authorized by RI General Law 42-11-10 entitled, Statewide Planning
Program, to study and evaluate the needs of the State for current and future energy supply and shall have the following powers:
(1) To adopt, amend and maintain as an element of the State Guide Plan or as an amendment to an existing element of the State Guide Plan, guidelines for the location of eligible renewable energy resources and renewable energy facilities in Rhode Island with due consideration for the location of such resources and facilities in commercial and industrial areas, agricultural areas, areas occupied by public and private institutions, and property of the State and its agencies and corporations, provided such areas are of sufficient size, and in other areas of the State as appropriate. (2) State Guide Plan. The State Guide Plan is comprised of functional elements or plans dealing with land use, physical development and environmental concerns, economic development, housing production, energy supply (including the development of renewable energy resources in Rhode Island), energy access, use, and conservation, human services, and other factors. This publication is based upon publicly supported research and may not be copyrighted. It may be
reprinted, in part or full, with credit acknowledged to the Division of Planning Statewide Planning Program. Copies of this information are also available in a format for the physically challenged and digital format on the Statewide Planning World Wide Web site. http://www.planning.ri.gov Contact the Division of Planning, Statewide Planning Program, One Capitol Hill, Providence, RI, 02908, or (401) 222-7901 for further information.
Technical Paper ###: Road Salt/Sand Application in Rhode Island 1/17/14
Page 2
ABSTRACT
TITLE: Road Salt/Sand Application in Rhode Island SUBJECT: Water Quality DATE: January 14, 2014 AGENCY: Rhode Island Department of Administration Division of Planning Statewide Planning Program One Capitol Hill Providence, RI 02908
(401) 222-7901 www.planning.ri.gov PROJECT: Work Task # 2040, Fiscal Years 2013-14 SERIES: Technical Report Number XX NUMBER OF PAGES: 18 PREPARED & REVIEW BY: Paul Gonsalves, Senior Land Use Planner, Statewide Planning Program Nancy Hess, Supervising Land Use Planner, Statewide Planning Program
Ernie Panciera, Supervising Environmental Scientist (Water Resources),
Department of Environmental Management Sue Kiernan, Deputy Chief of Water Resources, Department of Environmental Management
Jeff Willis, Deputy Director, Coastal Resources Management Council ABSTRACT: This report documents the current state and local policies related to salt and
sand application to Rhode Island’s roads and highways during winter weather events. The effects on water quality are described. Current data, application rates and ratios along with new and proposed policies are explored in this report.
ACKNOWLEDGEMENTS: This paper contains data and information provided by individuals from several
key State Agencies. Special thanks to: Joseph Baker, Administrator of RI Department of Transportation’s Division of
Highway and Bridge Maintenance Clayton Common, Senior Environmental Scientist, RI Department of Health Paul Jordan, Supervising GIS Specialist, RI Department of Environmental
Management
Technical Paper ###: Road Salt/Sand Application in Rhode Island 1/17/14
Page 3
Technical Paper ###: Road Salt/Sand Application in Rhode Island 1/17/14
Page 4
TABLE OF CONTENTS PAGE NO. ABSTRACT 2 TABLE OF CONTENTS 4 ADVISORY COMMITTEE MEMBERS 5 INTRODUCTION 6
Road Salt Application Policies in Rhode Island 6 STATE/RIDOT ROAD SALT / SANDING PRACTICES 6
State Storage Facilities 8 Vehicles and Equipment 9
New Pavement Technologies 9 Roads and Highways Covered 9 Historical Salt Use 9 Current Use of Salt 10
Sodium Chloride 10 Calcium Chloride 10 Magnesium Chloride 10
Brine/Pre-Mix 10 Sand 10
Municipal Road Salting Practices 11
ENVIRONMENTAL IMPACTS AND CONCERNS 11
Effects on Drinking Water Supplies 11 Potential Effects on Wildlife 11 Potential Freshwater Aquatic Impacts 11
Federal Guidelines on Water Quality (Chloride levels) 13 Potential Impacts on Vegetation 13 Impaired Waterbodies In RI 14
BEST MANAGEMENT PRACTICES AND NEW TECHNOLOGIES 14
Successful Reduction Policies in New Hampshire 14 Bio-degradable, Low(er) Impact Alternative Formulas 15
Calcium Magnesium Acetate and Potassium Acetate 15 Carbohydrate-based Solutions 15
RECOMMENDATIONS 16
REFERENCES 18 LIST OF FIGURES
FIGURE 1, Locations of Salt/Sand Stockpiles 9 FIGURE 2, Average Number of Pounds of Salt per Lane Mile 10

Technical Paper ###: Road Salt/Sand Application in Rhode Island 1/17/14
Page 5
Technical Paper ###: Road Salt/Sand Application in Rhode Island 1/17/14
Page 6
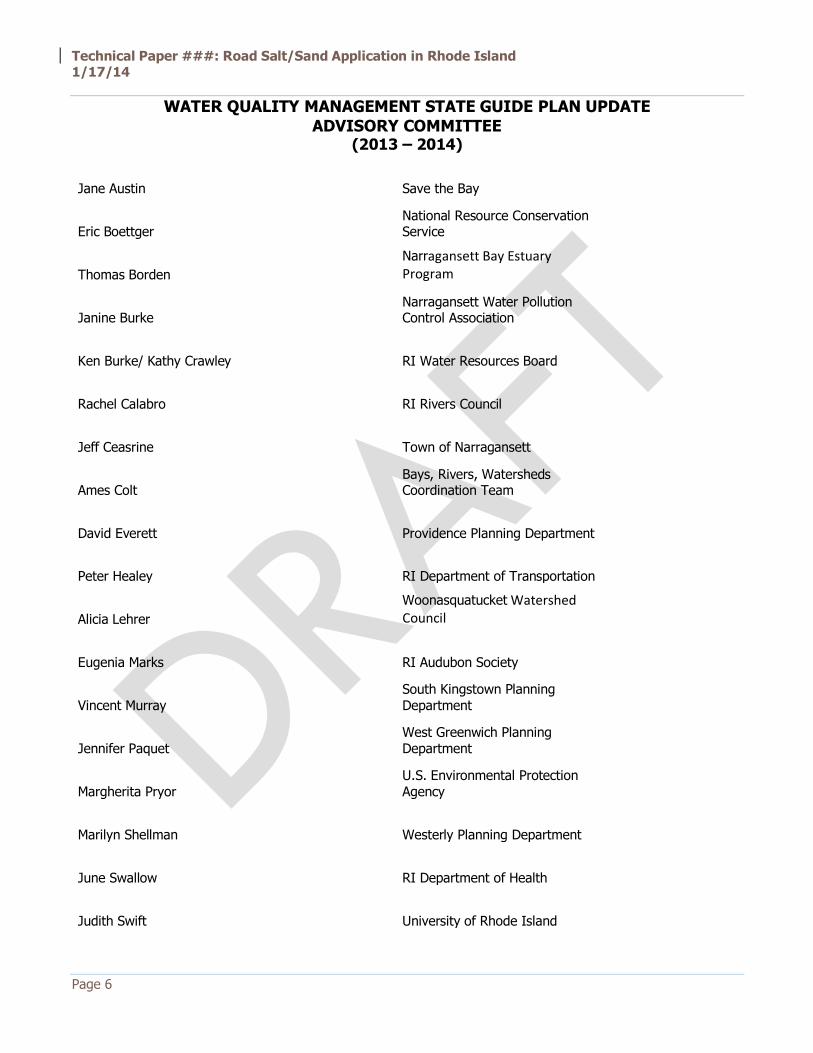
WATER QUALITY MANAGEMENT STATE GUIDE PLAN UPDATE
ADVISORY COMMITTEE (2013 – 2014)
Jane Austin Save the Bay
Eric Boettger National Resource Conservation Service
Thomas Borden
Narragansett Bay Estuary Program
Janine Burke Narragansett Water Pollution Control Association
Ken Burke/ Kathy Crawley RI Water Resources Board
Rachel Calabro RI Rivers Council
Jeff Ceasrine Town of Narragansett
Ames Colt Bays, Rivers, Watersheds Coordination Team
David Everett Providence Planning Department
Peter Healey RI Department of Transportation
Alicia Lehrer
Woonasquatucket Watershed Council
Eugenia Marks RI Audubon Society
Vincent Murray South Kingstown Planning Department
Jennifer Paquet West Greenwich Planning Department
Margherita Pryor U.S. Environmental Protection Agency
Marilyn Shellman Westerly Planning Department
June Swallow RI Department of Health
Judith Swift University of Rhode Island
Technical Paper ###: Road Salt/Sand Application in Rhode Island 1/17/14
Page 7
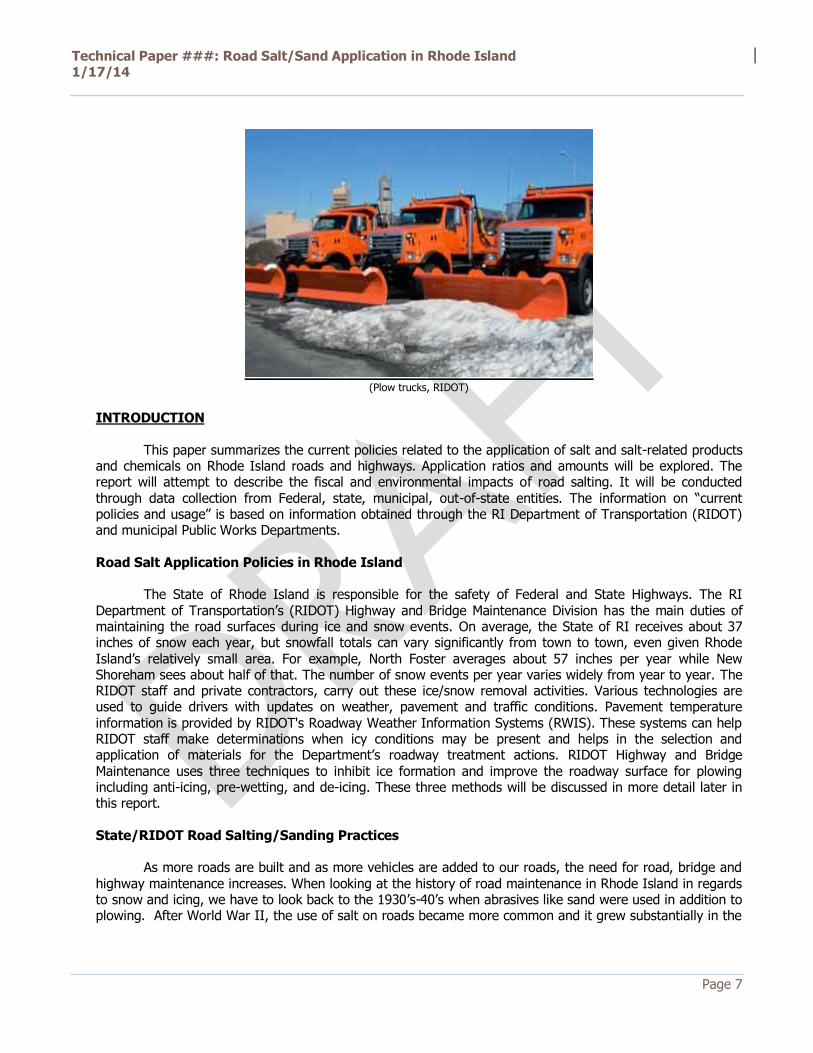
(Plow trucks, RIDOT)
INTRODUCTION
This paper summarizes the current policies related to the application of salt and salt-related products and chemicals on Rhode Island roads and highways. Application ratios and amounts will be explored. The report will attempt to describe the fiscal and environmental impacts of road salting. It will be conducted through data collection from Federal, state, municipal, out-of-state entities. The information on “current policies and usage” is based on information obtained through the RI Department of Transportation (RIDOT) and municipal Public Works Departments. Road Salt Application Policies in Rhode Island
The State of Rhode Island is responsible for the safety of Federal and State Highways. The RI Department of Transportation’s (RIDOT) Highway and Bridge Maintenance Division has the main duties of maintaining the road surfaces during ice and snow events. On average, the State of RI receives about 37 inches of snow each year, but snowfall totals can vary significantly from town to town, even given Rhode
Island’s relatively small area. For example, North Foster averages about 57 inches per year while New Shoreham sees about half of that. The number of snow events per year varies widely from year to year. The RIDOT staff and private contractors, carry out these ice/snow removal activities. Various technologies are used to guide drivers with updates on weather, pavement and traffic conditions. Pavement temperature information is provided by RIDOT's Roadway Weather Information Systems (RWIS). These systems can help RIDOT staff make determinations when icy conditions may be present and helps in the selection and application of materials for the Department’s roadway treatment actions. RIDOT Highway and Bridge
Maintenance uses three techniques to inhibit ice formation and improve the roadway surface for plowing including anti-icing, pre-wetting, and de-icing. These three methods will be discussed in more detail later in this report. State/RIDOT Road Salting/Sanding Practices
As more roads are built and as more vehicles are added to our roads, the need for road, bridge and highway maintenance increases. When looking at the history of road maintenance in Rhode Island in regards to snow and icing, we have to look back to the 1930’s-40’s when abrasives like sand were used in addition to plowing. After World War II, the use of salt on roads became more common and it grew substantially in the
Technical Paper ###: Road Salt/Sand Application in Rhode Island 1/17/14
Page 8
50’s and 60’s. As of 2013, the State spends about $10 million per year on road salting on an annual basis, which is about 25% of RIDOT’s winter maintenance budget.
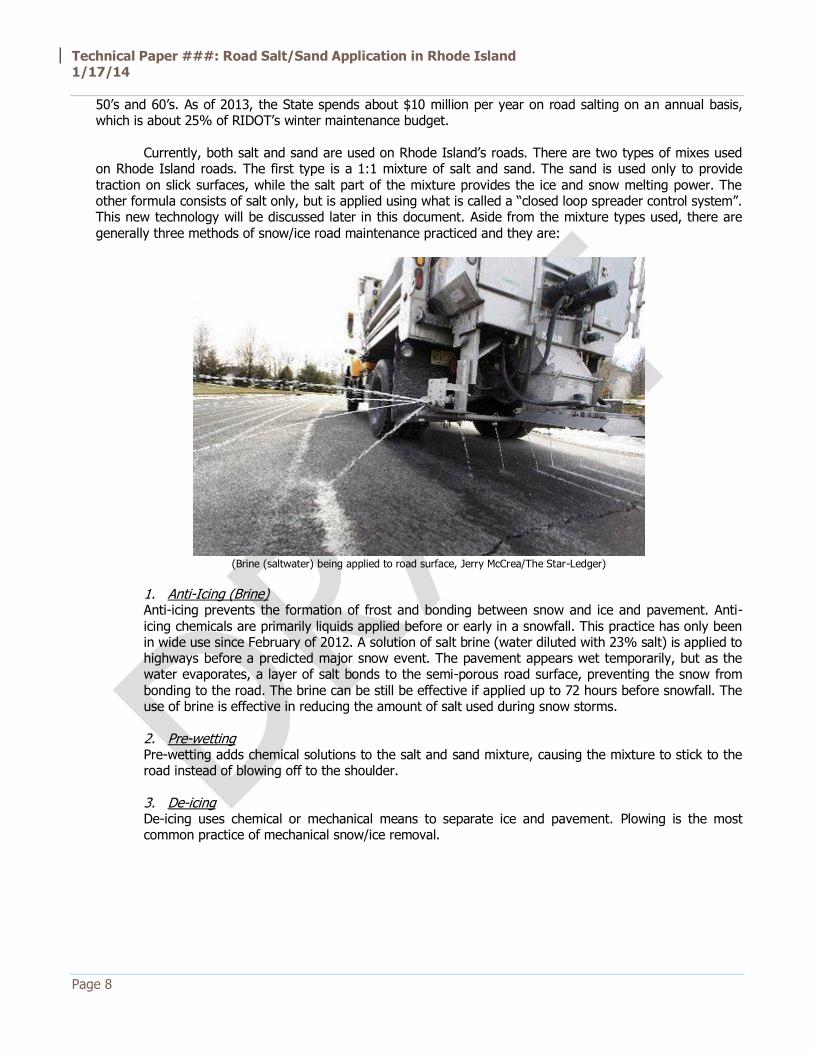
Currently, both salt and sand are used on Rhode Island’s roads. There are two types of mixes used on Rhode Island roads. The first type is a 1:1 mixture of salt and sand. The sand is used only to provide traction on slick surfaces, while the salt part of the mixture provides the ice and snow melting power. The other formula consists of salt only, but is applied using what is called a “closed loop spreader control system”. This new technology will be discussed later in this document. Aside from the mixture types used, there are generally three methods of snow/ice road maintenance practiced and they are:
(Brine (saltwater) being applied to road surface, Jerry McCrea/The Star-Ledger)
1. Anti-Icing (Brine) Anti-icing prevents the formation of frost and bonding between snow and ice and pavement. Anti-icing chemicals are primarily liquids applied before or early in a snowfall. This practice has only been in wide use since February of 2012. A solution of salt brine (water diluted with 23% salt) is applied to highways before a predicted major snow event. The pavement appears wet temporarily, but as the water evaporates, a layer of salt bonds to the semi-porous road surface, preventing the snow from bonding to the road. The brine can be still be effective if applied up to 72 hours before snowfall. The use of brine is effective in reducing the amount of salt used during snow storms. 2. Pre-wetting Pre-wetting adds chemical solutions to the salt and sand mixture, causing the mixture to stick to the road instead of blowing off to the shoulder. 3. De-icing De-icing uses chemical or mechanical means to separate ice and pavement. Plowing is the most common practice of mechanical snow/ice removal.
Technical Paper ###: Road Salt/Sand Application in Rhode Island 1/17/14
Page 9
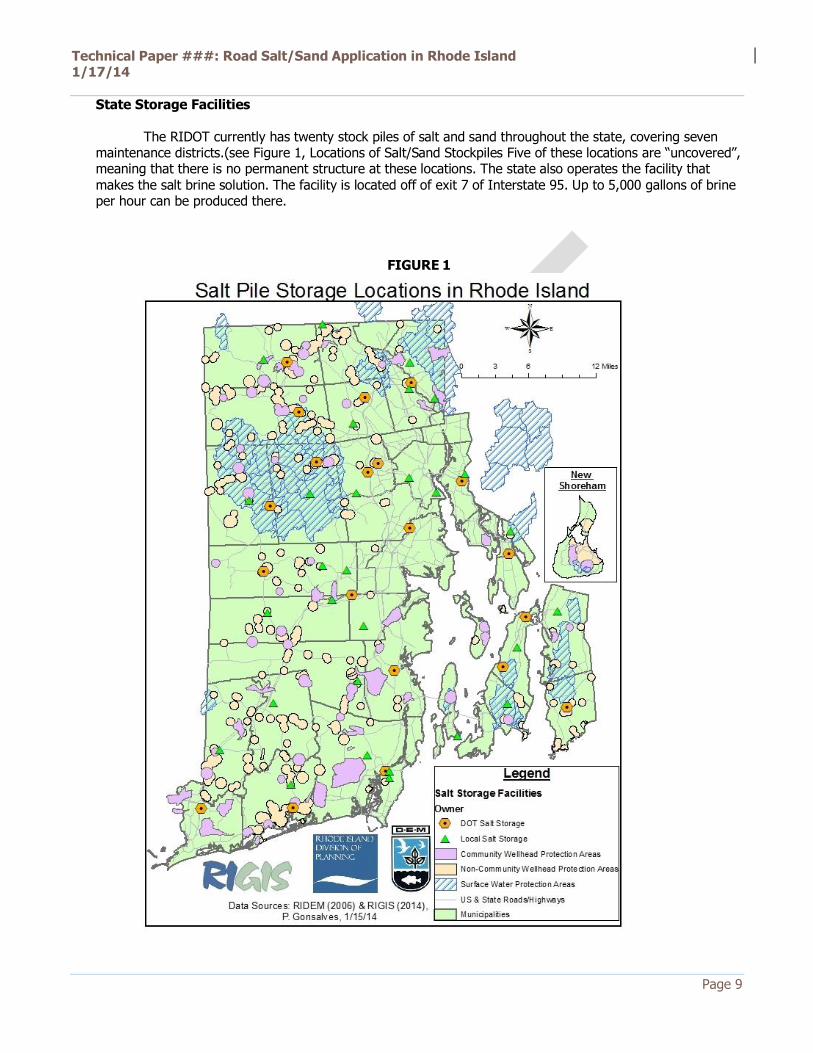
State Storage Facilities
The RIDOT currently has twenty stock piles of salt and sand throughout the state, covering seven maintenance districts.(see Figure 1, Locations of Salt/Sand Stockpiles Five of these locations are “uncovered”, meaning that there is no permanent structure at these locations. The state also operates the facility that makes the salt brine solution. The facility is located off of exit 7 of Interstate 95. Up to 5,000 gallons of brine per hour can be produced there.
FIGURE 1
Technical Paper ###: Road Salt/Sand Application in Rhode Island 1/17/14
Page 10
Vehicles and Equipment
The RIDOT currently has a fleet of 100 snow plow/spreader trucks. Sixty-one of these vehicles are equipped with “closed loop spreader control systems”. These automated additions allow the drivers to accurately administer and monitor the exact amount of salt applied. The equipment also tracks and reports the application ratio in pounds per lane mile (lbs/LM). The Department has seen a significant drop in lbs/LM since the introduction of the closed loop system. As of September 2013, there are seven new closed loop systems being installed on existing trucks. These additions will bring the total number up to sixty eight. That will be just under 70% of the total RIDOT fleet. New Pavement Technologies
The State of RIDOT currently uses real-time information systems capable of monitoring road temperatures. This technology is especially useful in spots such as the Newport Bridge where air temperatures may significantly vary from road surface temperatures. Roads and Highways Covered
The RIDOT has the primary responsibility to plow and salt/sand all Interstate Highway surfaces, as well as State Roads. The Interstate Highways include I-95, I-195 and I-295. Municipalities are generally responsible for their own local roads and side streets.
Historical Salt Use
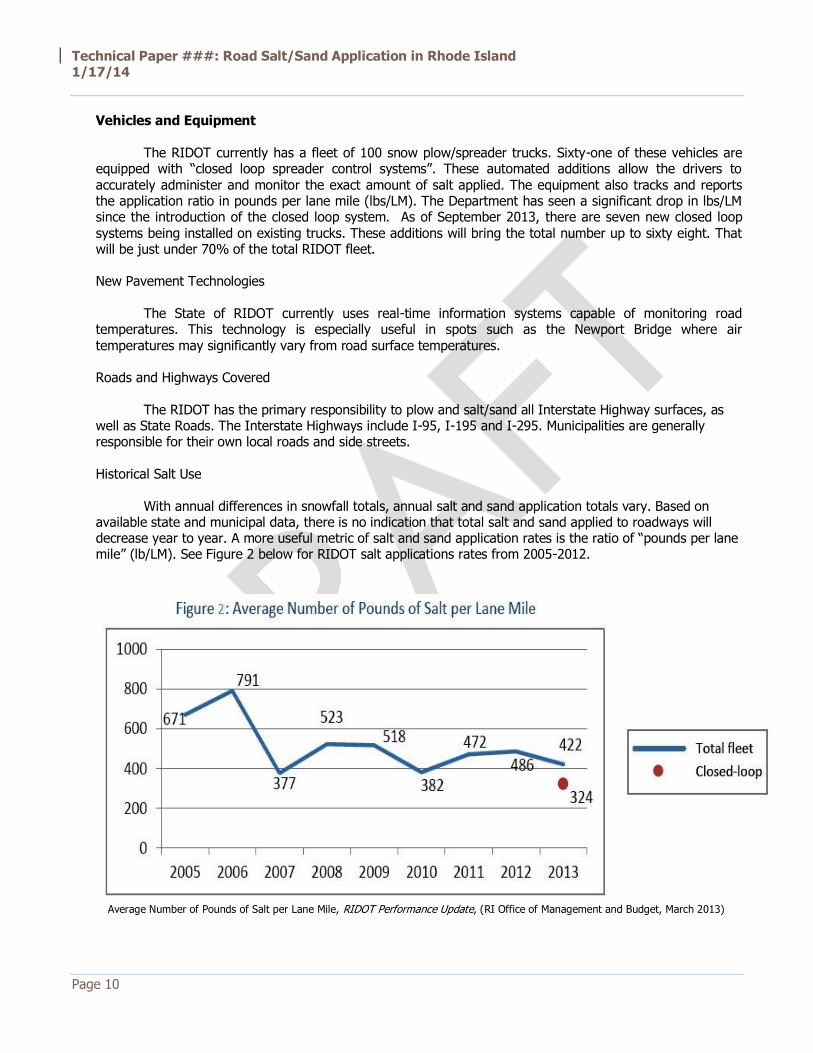
With annual differences in snowfall totals, annual salt and sand application totals vary. Based on available state and municipal data, there is no indication that total salt and sand applied to roadways will decrease year to year. A more useful metric of salt and sand application rates is the ratio of “pounds per lane mile” (lb/LM). See Figure 2 below for RIDOT salt applications rates from 2005-2012.
Average Number of Pounds of Salt per Lane Mile, RIDOT Performance Update, (RI Office of Management and Budget, March 2013)
Technical Paper ###: Road Salt/Sand Application in Rhode Island 1/17/14
Page 11
Current Use of Salt
With difference in snowfall totals and storm events, the total salt used does fluctuate from year to year, but when we look at the average lbs/LM applied by the closed loop equipped trucks vs. the total fleet, the number is approximately 25% lower for the trucks with closed loop systems. Overall, the Department has reduced salt application by more than 27% over the past seven years. There are several types of salt that are used on RI roadways, highways and bridges.
Sodium Chloride (NaCl) Commonly known as “table salt”, is by far the most commonly used road salt. Sodium Chloride is the main salt used in highway and road maintenance and it can only effectively melt snow and ice down to 20 degrees Fahrenheit. Although it is the same chemical composition as basic table salt, the NaCl used on roads is in a “rock salt” form. The granules are much larger than table salt. This salt is often viewed as the most corrosive, but most cost-effective type as it is one of the most abundant minerals on Earth. Calcium Chloride (CaCl)- More expensive than NaCl, but is safer for the natural environment. Calcium Chloride has several advantages over sodium chloride. It is generally seen as a safer alternative to sodium chloride
because c chloride generally does not have the chemical additives that are sometimes found in sodium chloride like phosphorus, nitrogen, copper and cyanide. CaCl is also effective at much lower temperatures than NaCl. The major drawback to CaCl is the cost, which can be up to three times more than NaCl. In 1991, The Providence Water Supply Board started an agreement with RIDOT to use CaCl in the Scituate Reservoir watershed. Upon further studies in conjunction with USGS, it was found that using CaCl instead of NaCl did not lead to decreased chloride levels. Currently, the most common application of CaCl in RI is seen on bridges as it has a much lower freezing point than rock
salt. Magnesium Chloride (MgCl) When compared to calcium chloride, magnesium chloride has similar properties. Although about twice the amount per lane mile is needed, MgCl is generally seen as being safer for the environment than both NaCl and CaCl. It is rarely used in Rhode Island as it could lead to slippery road surfaces, since it does not bond to the road surface as well as NaCl and CaCl. Brine/Pre-Mix The RIDOT has a brine mixing facility off of exit 7 of I-95, which is close to the halfway point of I-95 between the Connecticut and Massachusetts borders. The facility has the capability to mix up to 5,000 gallons per hour. Sand Sand is commonly used with rock salt in a 1:1 ratio on Rhode Island’s highways and roads. The sand does not have any melting properties, as it is only applied to provide increased traction. Most of the sand used in RI is imported from nearby states like Connecticut. Because sand does not melt, it will remain on the pavement until removed either by manual sweeping, or as runoff into catch basins, sewers, shoulders and adjacent water bodies.
Technical Paper ###: Road Salt/Sand Application in Rhode Island 1/17/14
Page 12
Municipal Road Salt Practices For the purposes of acquiring information on local salt and sand application practices, a short survey
was sent to municipal public works departments. About 25% of municipalities replied to the survey. In general, the practices at the local level involved applying only sodium chloride rock salt and sand. Only one municipality reported the use of saltwater brine. The on-board technology used at the State level tends to be more advanced than the municipal counterparts, as there were no reported installations of the ”closed-loop” system on municipal trucks. RIDEM is not aware of any municipal trucks with that system. At the local level, the amount of salt/sand applied per lane mile varies from 250 to 450. Not all municipalities have the equipment to track this info. ENVIRONMENTAL IMPACTS AND CONCERNS
Even though salt (sodium chloride) and sand are natural substances the application of tons of these materials is not without environmental consequences. As of just a few years ago, the State of RI reached a peak in annual salt application of about one hundred tons/year. Although it is spread throughout the state and diluted, the cumulative effects of salt additions at this rate can have significant environmental consequences. Sand removal is a major issue in the state, as only a small fraction (as low as 5% by RIDOT estimates), is swept up due to staff and budget constraints. With each spring/rainy season, the salt and sand that was applied during the winter slowly makes its way to adjacent water bodies and catch basins, making localized flooding more likely to occur. Also, excess sand accumulation at the bottom of adjacent streams and
ponds can lead to the smothering of aquatic life. Normal traffic can act as a grinding agent turning the sand particles in to a dust which can lead to aggravate certain respiratory problems such as asthma. Effects on Drinking Water Supply
As stated in State Guide Plan Element 721: RR Water 2030, “..road salt [can] interrupt natural watershed drainage patterns and degrade water quality.” (p.2-9). Sodium Chloride can enter the water
supply by either direct contact with surface waters or by infiltration to groundwater which can contaminate public and private wells. Increased sodium levels in drinking water can have negative effects for people sensitive to sodium, such as those who suffer from high-blood pressure. Increased sodium levels may be present in drinking water without a noticeable difference in taste, but chloride levels do affect taste. Several private wells have been discovered to contain levels of chloride above the EPA secondary standard of 250 mg/l. mg/l] Sodium Chloride is also known to be corrosive to metals, especially those related to plumbing.
Sodium Levels in Wells (from DOH)
Potential Impacts on Wildlife
The salt and sand can affect aquatic and non-aquatic plants and animals living in or nearby surface
waters. If sand is not recovered in the spring, it can clog catch basins and fill streambeds. Increased salt content in and around roadside vegetation could also attract deer and other mammals to roadsides creating a dangerous situation for the animals and drivers.
Potential Freshwater Aquatic Impacts
Salt and sand can affect microorganism growth by clouding the water. Levels of chloride in water bodies have been increasing and road salting is a major contributor, especially in built-up areas and heavy
Technical Paper ###: Road Salt/Sand Application in Rhode Island 1/17/14
Page 13
traffic roadways. Not only salt use on major roads, but also salt use on secondary roads and parking lots are contributing to these increased chloride levels. Some researchers such as those from the University of Dayton in Ohio conclude that sand is worse than salt for some aquatic systems.
Federal Guidelines Water Quality (Chloride Levels)
The US Environmental Protection Agency in 1988 released a document titled: “AMBIENT AQUATIC LIFE
WATER QUALITY CRITERIA FOR CHLORIDE”. The report addresses water quality by looking at acute and chronic toxicity to animals and toxicity to aquatic plants. The data showed that different species of plants and animals had a wide range of chloride tolerances. The acute sensitivities in freshwater animals ranged from 1,470 milligrams per liter (mg/L) to 11,940 mg/L. Plants had an even wider variation in sensitivities ranging from 71 to 36,400 mg/L. Ultimately, the report concludes that aquatic organisms should not be adversely effected if,
“the four-day average concentration of dissolved chloride, when associated with sodium, does not exceed 230 mg/L more than once every three years on the average and if the one-hour average concentration does not exceed 860 mg/L more than once every three years on the average.” 1
Potential Impacts on Vegetation
Along the shoulders of roadways, salt and sand can degrade vegetation and soil, leading to erosion. In
high concentrations, salt can kill certain types of vegetation. It is important for roadside vegetation to be chosen based on several factors including salt tolerance. Healthy roadside vegetation can combat erosion by increasing the integrity of the soil.
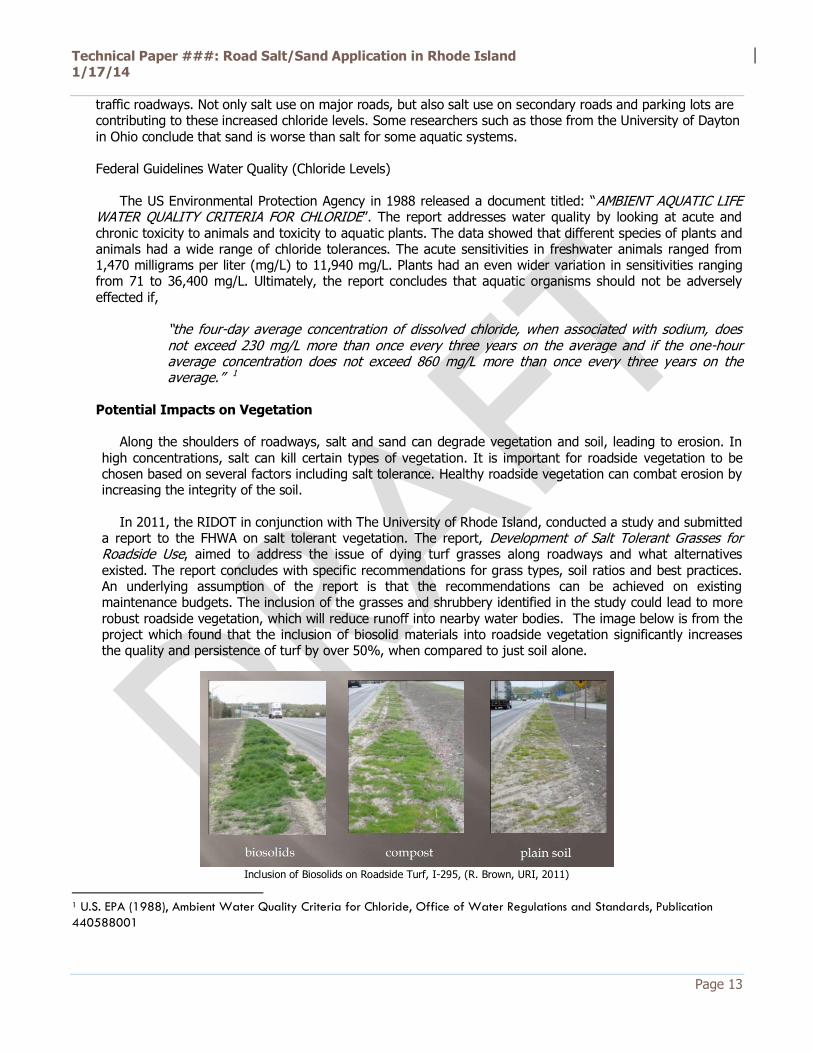
In 2011, the RIDOT in conjunction with The University of Rhode Island, conducted a study and submitted
a report to the FHWA on salt tolerant vegetation. The report, Development of Salt Tolerant Grasses for Roadside Use, aimed to address the issue of dying turf grasses along roadways and what alternatives
existed. The report concludes with specific recommendations for grass types, soil ratios and best practices. An underlying assumption of the report is that the recommendations can be achieved on existing maintenance budgets. The inclusion of the grasses and shrubbery identified in the study could lead to more robust roadside vegetation, which will reduce runoff into nearby water bodies. The image below is from the project which found that the inclusion of biosolid materials into roadside vegetation significantly increases the quality and persistence of turf by over 50%, when compared to just soil alone.
Inclusion of Biosolids on Roadside Turf, I-295, (R. Brown, URI, 2011)
1 U.S. EPA (1988), Ambient Water Quality Criteria for Chloride, Office of Water Regulations and Standards, Publication
440588001
Technical Paper ###: Road Salt/Sand Application in Rhode Island 1/17/14
Page 14
Impaired Waterbodies in RI According to the 2012 RI Integrated Water Quality and Monitoring Assessment Report, two waterbodies in
the state have not met water quality standards for their intended uses because of chloride levels. Those waterbodies are Print Works Pond (Cranston) and the Pocasset River and tributaries from the headwaters to the inlet of Printworks Pond (Cranston, Johnston). There were a total of 96 named waterbodies which were found to have an impairment. Although the majority of impaired waterbodies are impaired for reasons other than chloride levels, it is an important to reduce chloride levels in areas where salt runoff may be a problem.
BEST MANAGEMENT PRACTICES AND NEW TECHNOLOGIES
A Successful Reduction Policy in New England: New Hampshire Case Study
The State of New Hampshire has made strides recently in the reduction of road salt on its roads and
highways. In 2008 New Hampshire listed 19 chloride impaired water bodies under the Clean Water Act. In that same year, Plymouth State University worked with a consultant to produce a report named “Potential Solutions for Reducing Road Salt Use in New Hampshire: A Report to the I-93 Salt Reduction Workgroup”. The report is part a larger effort called the “New Hampshire Road Salt Reduction Initiative”. The report concluded that the only way to prevent chloride from reaching surface and ground water is to reduce the amount applied to our roadways and parking lots without compromising safety. The following
recommendations were highlighted by the project’s focus group: � Use education initiatives on road salt and its impacts on water quality, directed at the driving public, to change driver habits; � Educational and informational efforts should be presented by NHDOT and NHDES in multiple ways and designed for different audiences;
� Provide additional enforcement to reduce speed limits during storm events; � Use technology (cameras, radar, and other devices) to assist with enforcement; � Create “No Salt” areas; � Create additional public transportation alternatives; � Engage employers and delay or cancel work related activities during inclement weather; � Pass a law requiring all drivers to take a winter weather driving course; � Eliminate the legal liability for towns and businesses that reduce their application of salt; and
� Require mandatory use of snow tires on New Hampshire roadways. The report ultimately recommended the following policies:
� Training on treatment practices for maintenance professionals (public and private); � Equipment and infrastructure upgrades; � Behavior change programs to assist with voluntary and mandatory approaches; � Lower speed limit during storm events; and � Mandatory use of snow tires for the public
Following the listing of Chloride Impaired Waterbodies along the I-93 Corridor in Southern New
Hampshire, NH DES, NH Department of Transportation (DOT), and several municipalities and private contractors are working together to reduce chloride while continuing to provide safe passage for traffic and pedestrians. (2013 NH Road Salt Reduction Initiative).
Technical Paper ###: Road Salt/Sand Application in Rhode Island 1/17/14
Page 15
Bio-degradable, Low(er)-Impact Alternative Formulas Calcium Magnesium Acetate and Potassium Acetate
Calcium Magnesium Acetate (CMA) is combination of acetic acid and limestone. It generally works at temperatures down to 20°F. Its known to have less of an environmental impact than other salts and chemicals, less corrosive to concrete and steel, less toxic to aquatic organisms, and has limited impact on ground water in comparison to road salt. Although it costs more than rock salt, the potential benefits may justify the increased cost.. It is currently being used in environmentally sensitive areas and on bridges prone to salt corrosion.
Potassium Acetate (KA) generally works at temperatures down to -15°F and is non-corrosive and
biodegradable. It can cause slick road conditions if applied in excess and can lower oxygen levels in surface waters. This is a commonly used at airports. At the time of this report, there is no indication that CMA or KA are regularly used in Rhode Island.
Carbohydrate-based Solutions Byproducts from corn or beets can be blended with magnesium chloride for use an anti-icing agent. Also, this mixture can be effective as a deicer. The mixture is less corrosive to metal equipment and is considered safe for the environment. These “natural” solutions are mostly proprietary to the manufacturer and can be derived from sources such as beets, corn, grain, alcohol, or molasses. These are not particularly good at melting snow and ice, but they do slow down the formation of ice lowering the freezing point.. They are less corrosive than
conventional materials and often help with traction on road surfaces. They are not known to have environmental impacts in aquatic systems due to their composition.
Technical Paper ###: Road Salt/Sand Application in Rhode Island 1/17/14
Page 16
RECOMMENDATIONS Reduction in Road Salt Applications
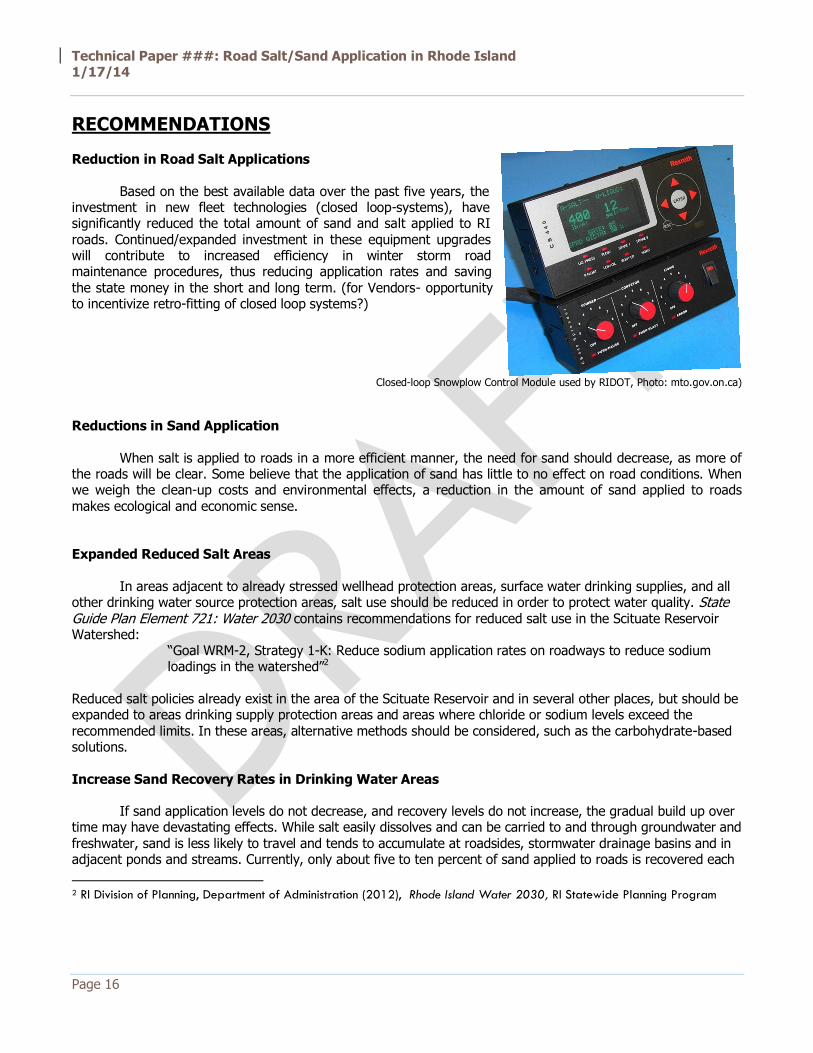
Based on the best available data over the past five years, the investment in new fleet technologies (closed loop-systems), have significantly reduced the total amount of sand and salt applied to RI roads. Continued/expanded investment in these equipment upgrades will contribute to increased efficiency in winter storm road maintenance procedures, thus reducing application rates and saving the state money in the short and long term. (for Vendors- opportunity to incentivize retro-fitting of closed loop systems?)
Closed-loop Snowplow Control Module used by RIDOT, Photo: mto.gov.on.ca)
Reductions in Sand Application
When salt is applied to roads in a more efficient manner, the need for sand should decrease, as more of the roads will be clear. Some believe that the application of sand has little to no effect on road conditions. When we weigh the clean-up costs and environmental effects, a reduction in the amount of sand applied to roads makes ecological and economic sense. Expanded Reduced Salt Areas
In areas adjacent to already stressed wellhead protection areas, surface water drinking supplies, and all
other drinking water source protection areas, salt use should be reduced in order to protect water quality. State Guide Plan Element 721: Water 2030 contains recommendations for reduced salt use in the Scituate Reservoir Watershed:
“Goal WRM-2, Strategy 1-K: Reduce sodium application rates on roadways to reduce sodium loadings in the watershed”2
Reduced salt policies already exist in the area of the Scituate Reservoir and in several other places, but should be expanded to areas drinking supply protection areas and areas where chloride or sodium levels exceed the recommended limits. In these areas, alternative methods should be considered, such as the carbohydrate-based solutions. Increase Sand Recovery Rates in Drinking Water Areas
If sand application levels do not decrease, and recovery levels do not increase, the gradual build up over
time may have devastating effects. While salt easily dissolves and can be carried to and through groundwater and freshwater, sand is less likely to travel and tends to accumulate at roadsides, stormwater drainage basins and in adjacent ponds and streams. Currently, only about five to ten percent of sand applied to roads is recovered each
2 RI Division of Planning, Department of Administration (2012), Rhode Island Water 2030, RI Statewide Planning Program
Technical Paper ###: Road Salt/Sand Application in Rhode Island 1/17/14
Page 17
year, priority should be placed on sand recovery in drinking water protection areas. State Guide Plan Element 721: Water 2030 also contains recommendations for street sweeping in the Scituate Reservoir Watershed:
“Goal WRM-2, Strategy 1-O: Ensure that annual street sweeping is completed in the watershed”3
This strategy should be implemented in all drinking water protections areas for sources both public and private. With more efficient technology and equipment overall, sand application rates are likely to decrease. Until these technologies are widespread throughout state, municipal and private fleets, increased sand recovery is a short-term water protection strategy that should be considered.
3 RI Division of Planning, Department of Administration (2012), Rhode Island Water 2030, RI Statewide Planning Program
Technical Paper ###: Road Salt/Sand Application in Rhode Island 1/17/14
Page 18
REFERENCES Brown, Rebecca, and Gorres, Josef. 2011. Soil Amendments and the Survival of Roadside Turfgrasses. Kingston, RI. MassDOT. 2012. MassDOT Snow & Ice Control Program. Highway Division- Environmental Services. Boston, MA. Montana Department of Transportation. 2004. Chloride Levels in Streams Adjacent to Winter Maintenance Activities. Environmental Services Bureau. RI Department of Administration. 2013. RIDOT Performance Update, RI Office of Management and Budget. Providence, RI RI Department of Environmental Management. 2012. 2012 303(d) LIST OF IMPAIRED WATERS. Office of Water Resources, Providence, RI. RI Division of Planning, Department of Administration. 2012. Rhode Island Water 2030, RI Statewide Planning Program. Providence, RI Sheridan, Richard, Maynard, Brian, Harrison, Bryan, and Manteuffel, Chris.(URI) 2010. RIDOT SALT TOLERANT TREE AND SHRUB GUIDE. Kingston, RI.
Taylor, Jeffery H. & Associates, and The Center for the Environment, Plymouth State University. 2008. Potential Solutions for Reducing Road Salt Use in New Hampshire: A Report to the I-93 Salt Reduction Workgroup. Plymouth, NH. U.S. EPA. 1988. Ambient Water Quality Criteria for Chloride, Office of Water Regulations and Standards, Publication 440588001 U.S. EPA: New England. 2005. Safe Winter Roads and the Environment, Publication EPA 901-F-05-020. Boston, MA