Embed Size (px)
Citation preview

Roadshow Presentation May 2015
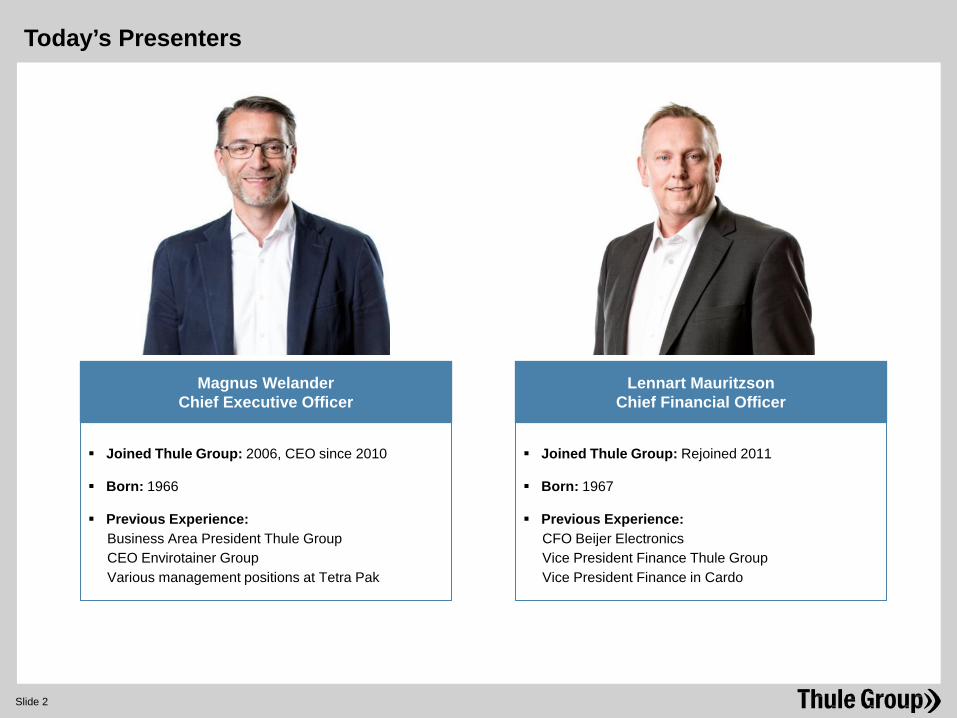
Today’s Presenters
Magnus Welander Chief Executive Officer
Lennart Mauritzson Chief Financial Officer
Slide 2
Joined Thule Group: 2006, CEO since 2010
Born: 1966
Previous Experience: Business Area President Thule Group CEO Envirotainer Group Various management positions at Tetra Pak
Joined Thule Group: Rejoined 2011
Born: 1967
Previous Experience: CFO Beijer Electronics Vice President Finance Thule Group Vice President Finance in Cardo
Slide 3
The Thule Group Vision – Active Life, Simplified
Slide 4
Source: Company information
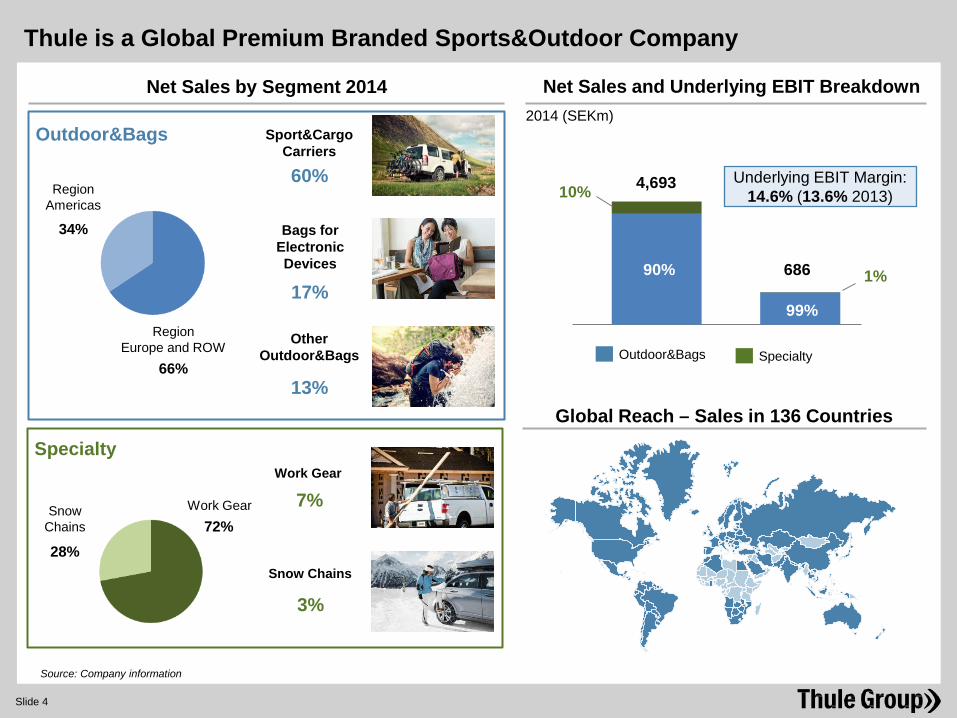
Thule is a Global Premium Branded Sports&Outdoor Company
Net Sales by Segment 2014
Sport&Cargo Carriers
Bags for Electronic Devices
Other Outdoor&Bags
Work Gear
Snow Chains
Outdoor&Bags
Specialty
Region Americas
Region Europe and ROW
Work Gear Snow Chains 72% 28%
34%
66%
Net Sales and Underlying EBIT Breakdown
4,693
686
2014 (SEKm)
Underlying EBIT Margin: 14.6% (13.6% 2013)
Global Reach – Sales in 136 Countries
90%
10%
1%
99%
Outdoor&Bags Specialty
60%
17%
7%
13%
3%
Slide 5
Point 1 2009 2014
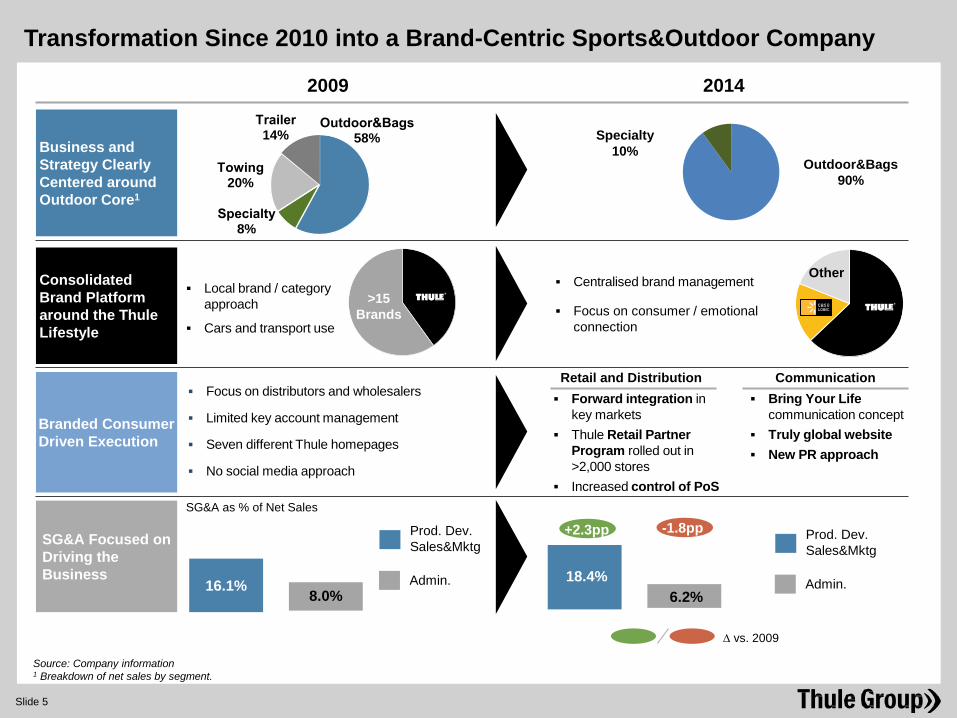
Business and Strategy Clearly Centered around Outdoor Core1
Consolidated Brand Platform around the Thule Lifestyle
Branded Consumer Driven Execution
SG&A Focused on Driving the Business
Local brand / category approach
Cars and transport use
Centralised brand management
Focus on consumer / emotional connection
Focus on distributors and wholesalers
Limited key account management
Seven different Thule homepages
No social media approach
Retail and Distribution Communication Forward integration in
key markets Thule Retail Partner
Program rolled out in >2,000 stores
Increased control of PoS
Bring Your Life communication concept
Truly global website New PR approach
SG&A as % of Net Sales
>15 Brands
Other
Outdoor&Bags58%
Specialty8%
Towing20%
Trailer14%
Source: Company information 1 Breakdown of net sales by segment.
Transformation Since 2010 into a Brand-Centric Sports&Outdoor Company
-1.8pp +2.3pp
∆ vs. 2009
Prod. Dev. Sales&Mktg
Admin.
Prod. Dev. Sales&Mktg
Admin. 16.1% 8.0% 18.4%
6.2%
Outdoor&Bags 90%
Specialty 10%
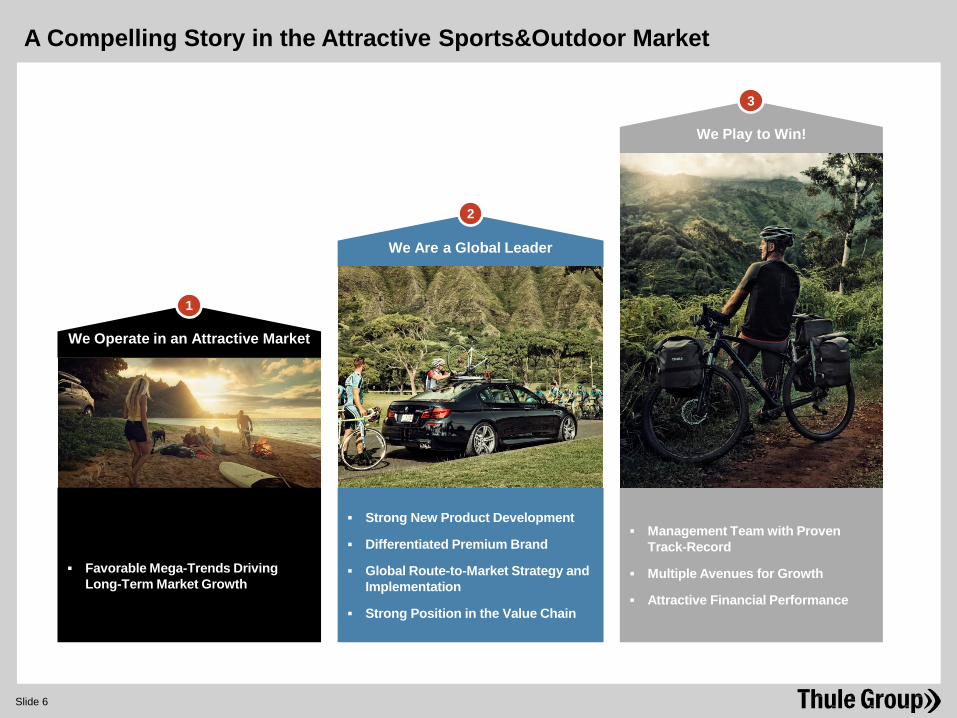
We Are a Global Leader
We Operate in an Attractive Market
Strong New Product Development
Differentiated Premium Brand
Global Route-to-Market Strategy and Implementation
Strong Position in the Value Chain
Management Team with Proven Track-Record
Multiple Avenues for Growth
Attractive Financial Performance
Favorable Mega-Trends Driving
Long-Term Market Growth
We Play to Win!
1
2
3
Slide 6
A Compelling Story in the Attractive Sports&Outdoor Market
Slide 7
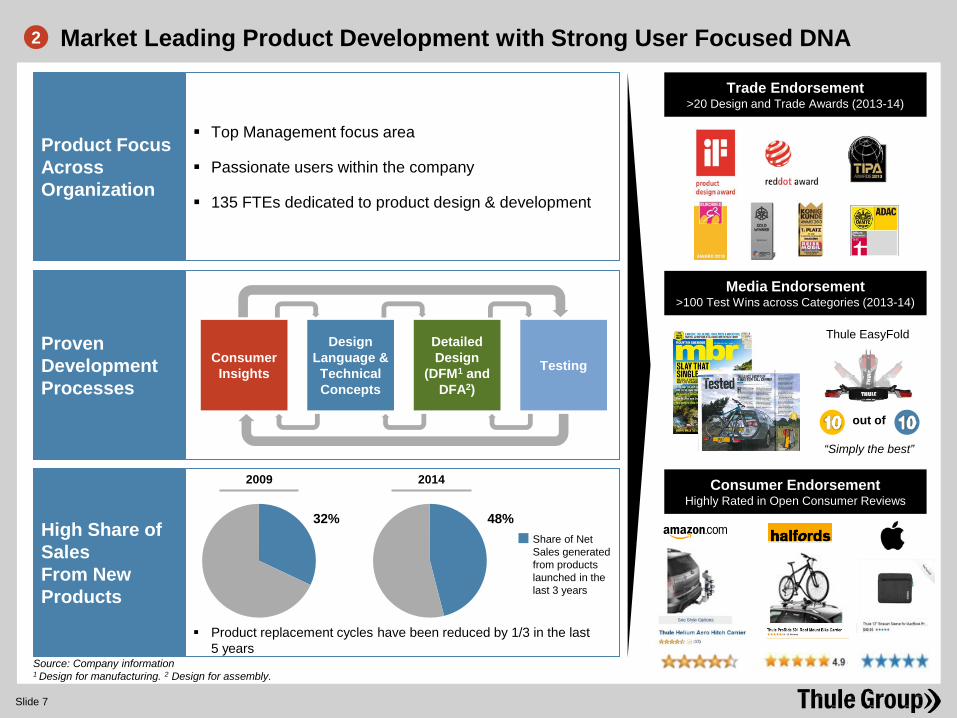
Trade Endorsement >20 Design and Trade Awards (2013-14)
Media Endorsement >100 Test Wins across Categories (2013-14)
Consumer Endorsement Highly Rated in Open Consumer Reviews
Thule EasyFold
“Simply the best”
out of
Proven Development Processes
Product Focus Across Organization
Top Management focus area
Passionate users within the company
135 FTEs dedicated to product design & development
Consumer Insights
Design Language & Technical Concepts
Detailed Design
(DFM1 and DFA2)
Testing
Source: Company information 1 Design for manufacturing. 2 Design for assembly.
Product replacement cycles have been reduced by 1/3 in the last 5 years
High Share of Sales From New Products
32% 48%
2009 2014
Share of Net Sales generated from products launched in the last 3 years
Market Leading Product Development with Strong User Focused DNA 2
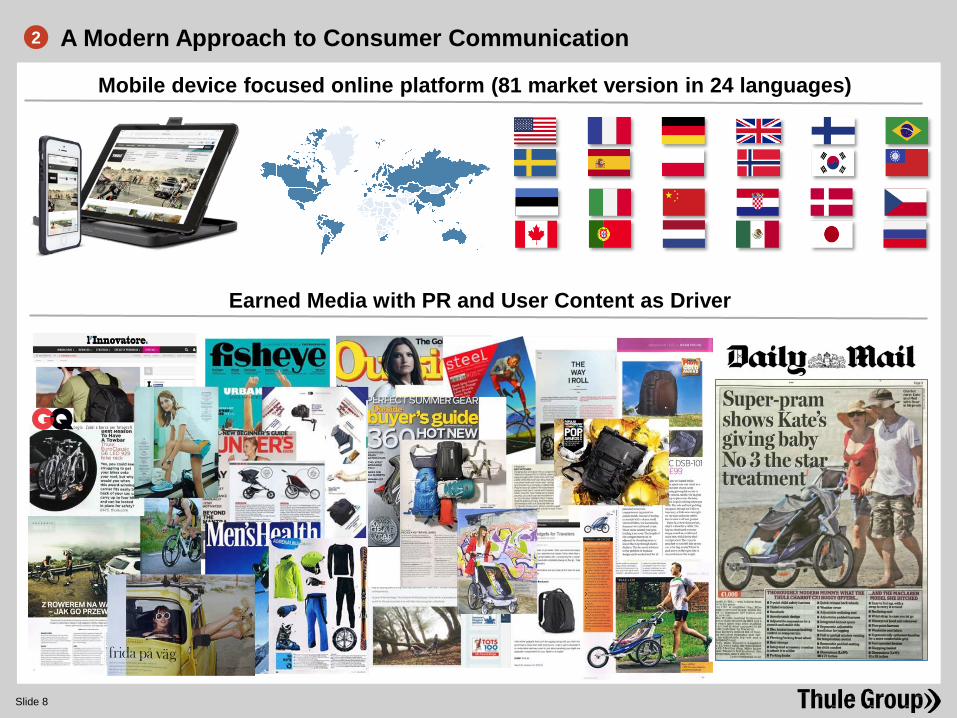
A Modern Approach to Consumer Communication
Slide 8
2
Mobile device focused online platform (81 market version in 24 languages)
Earned Media with PR and User Content as Driver
Slide 9
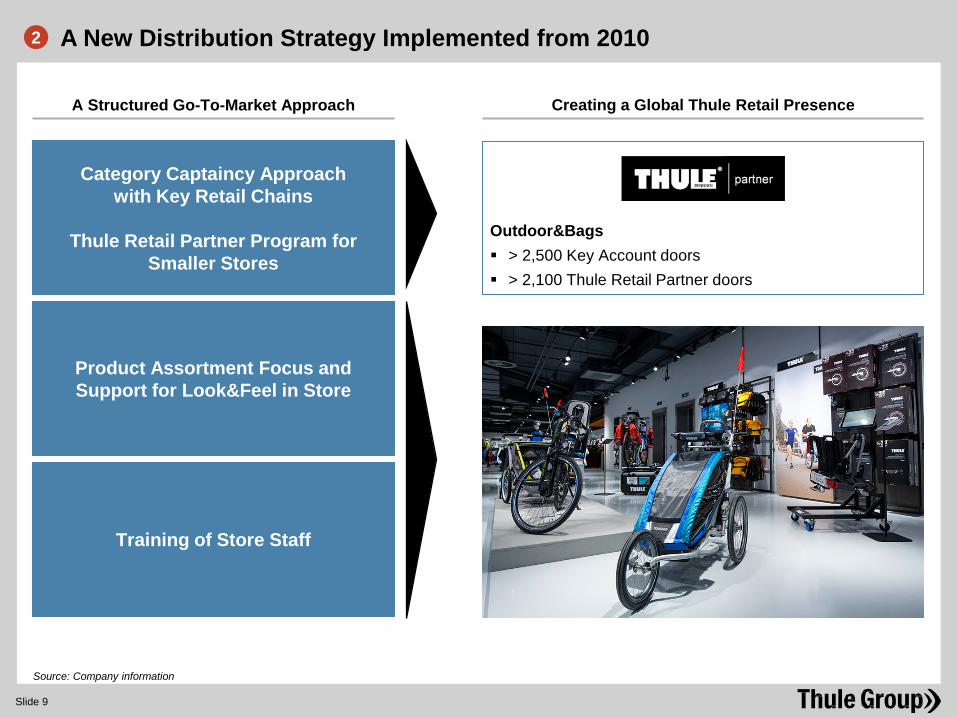
Creating a Global Thule Retail Presence
Category Captaincy Approach with Key Retail Chains
Thule Retail Partner Program for
Smaller Stores
Product Assortment Focus and Support for Look&Feel in Store
Training of Store Staff
A Structured Go-To-Market Approach
Outdoor&Bags > 2,500 Key Account doors > 2,100 Thule Retail Partner doors
Source: Company information
A New Distribution Strategy Implemented from 2010 2
Slide 10
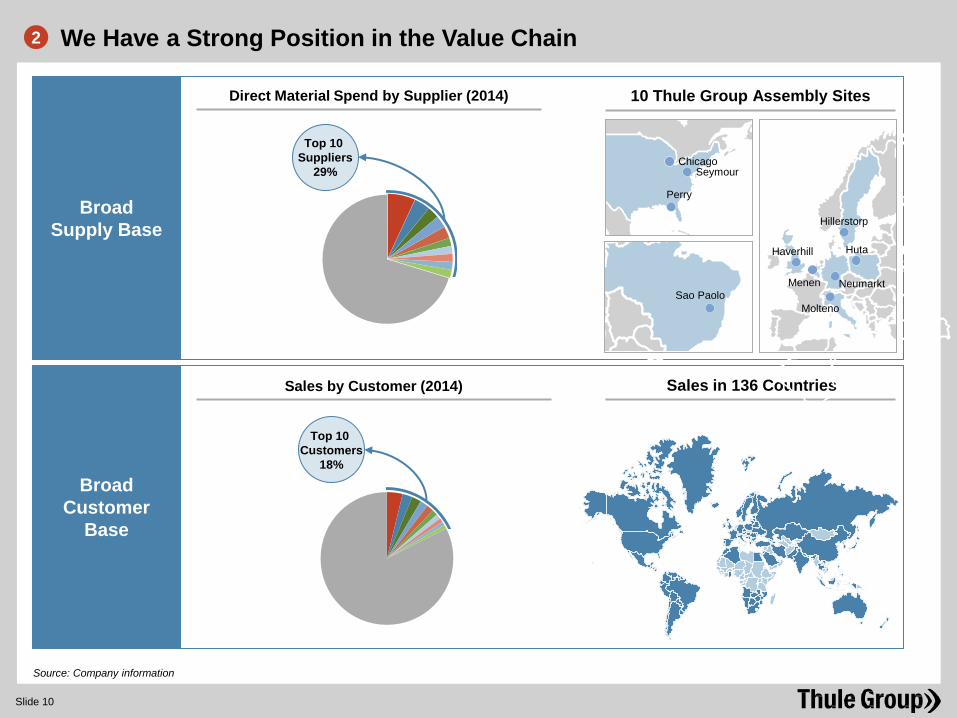
Source: Company information
Broad Supply Base
Broad Customer
Base
Top 10 Suppliers
29%
Direct Material Spend by Supplier (2014)
Top 10 Customers
18%
Sales by Customer (2014)
10 Thule Group Assembly Sites
Sales in 136 Countries
We Have a Strong Position in the Value Chain 2
Perry
Seymour Chicago
Sao Paolo
Huta
Molteno
Hillerstorp
Neumarkt
Haverhill
Menen
Slide 11
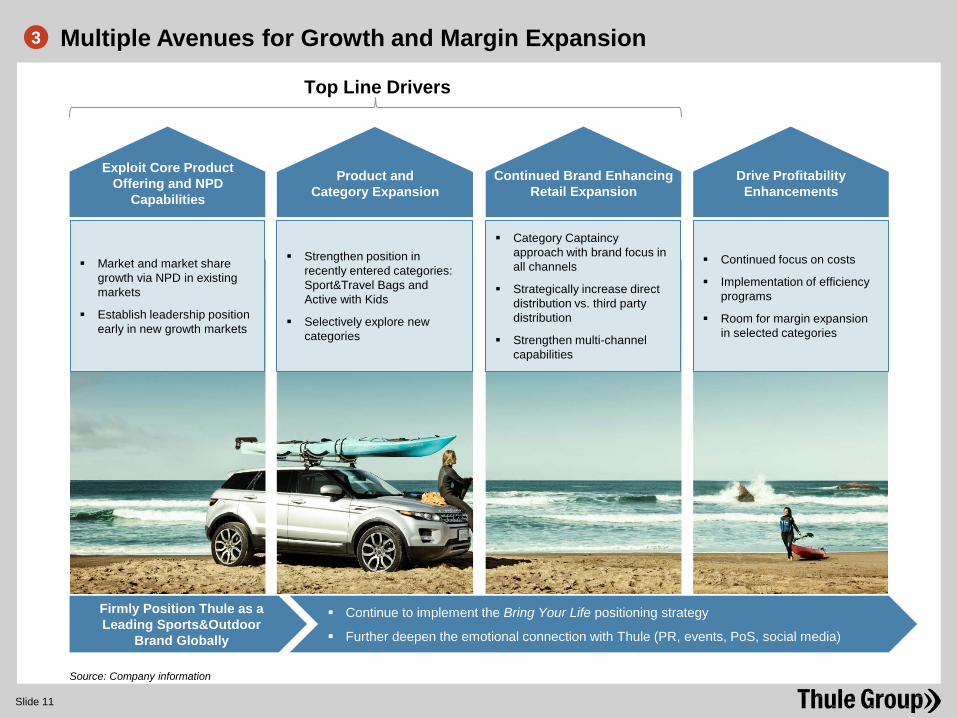
Multiple Avenues for Growth and Margin Expansion 3
Source: Company information
Drive Profitability Enhancements
Continued Brand Enhancing Retail Expansion
Exploit Core Product Offering and NPD
Capabilities
Market and market share growth via NPD in existing markets
Establish leadership position early in new growth markets
Continued focus on costs
Implementation of efficiency programs
Room for margin expansion in selected categories
Firmly Position Thule as a Leading Sports&Outdoor
Brand Globally
Continue to implement the Bring Your Life positioning strategy
Further deepen the emotional connection with Thule (PR, events, PoS, social media)
Product and Category Expansion
Strengthen position in recently entered categories: Sport&Travel Bags and Active with Kids
Selectively explore new categories
Category Captaincy approach with brand focus in all channels
Strategically increase direct distribution vs. third party distribution
Strengthen multi-channel capabilities
Top Line Drivers
Slide 12
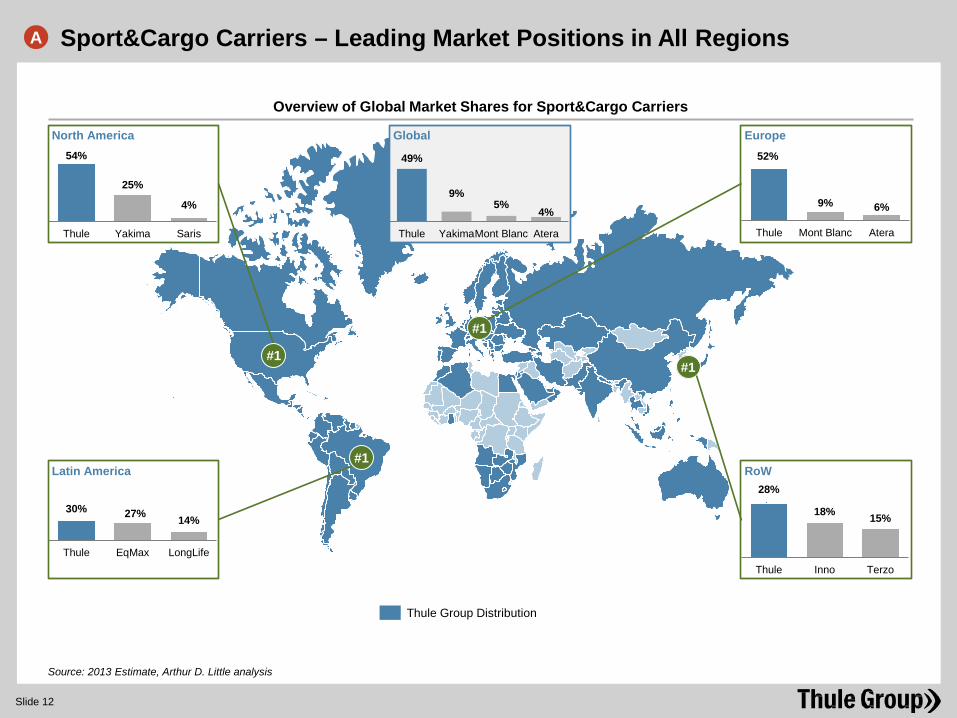
Source: 2013 Estimate, Arthur D. Little analysis
#1
#1
54%
25%
4%
Thule Yakima Saris
North America
Overview of Global Market Shares for Sport&Cargo Carriers
Thule Group Distribution
#1
#1
30% 27% 14%
Thule EqMax LongLife
Latin America
52%
9% 6%
Thule Mont Blanc Atera
Europe
28%
18% 15%
Thule Inno Terzo
RoW
49%
9% 5%
4%
Thule YakimaMont Blanc Atera
Global
Sport&Cargo Carriers – Leading Market Positions in All Regions A
Slide 13
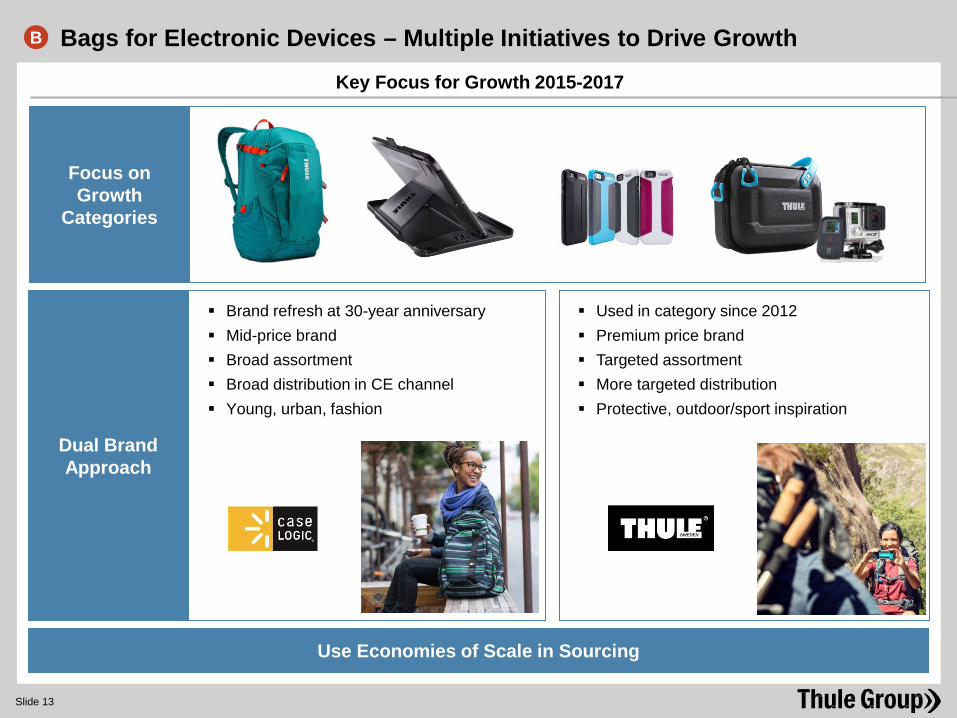
Bags for Electronic Devices – Multiple Initiatives to Drive Growth B
Key Focus for Growth 2015-2017
Dual Brand Approach
Use Economies of Scale in Sourcing
Focus on Growth
Categories
Brand refresh at 30-year anniversary Mid-price brand Broad assortment Broad distribution in CE channel Young, urban, fashion
Used in category since 2012 Premium price brand Targeted assortment More targeted distribution Protective, outdoor/sport inspiration
Slide 14
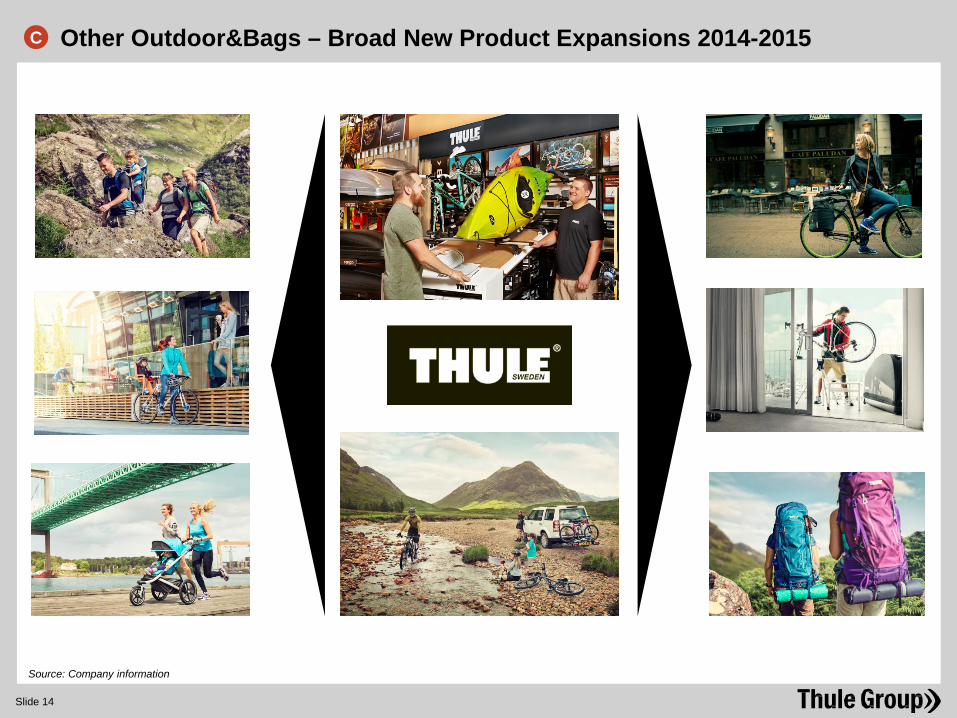
Source: Company information
Other Outdoor&Bags – Broad New Product Expansions 2014-2015 C
2015 Q1 Results
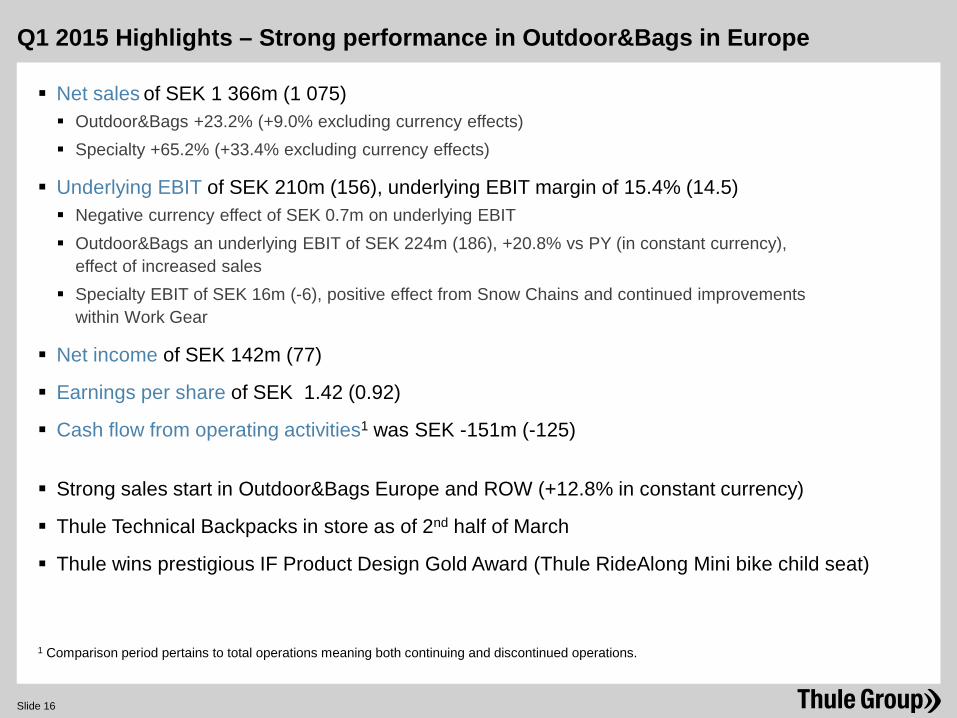
Q1 2015 Highlights – Strong performance in Outdoor&Bags in Europe
Net sales of SEK 1 366m (1 075) Outdoor&Bags +23.2% (+9.0% excluding currency effects) Specialty +65.2% (+33.4% excluding currency effects)
Underlying EBIT of SEK 210m (156), underlying EBIT margin of 15.4% (14.5) Negative currency effect of SEK 0.7m on underlying EBIT Outdoor&Bags an underlying EBIT of SEK 224m (186), +20.8% vs PY (in constant currency),
effect of increased sales Specialty EBIT of SEK 16m (-6), positive effect from Snow Chains and continued improvements
within Work Gear
Net income of SEK 142m (77)
Earnings per share of SEK 1.42 (0.92)
Cash flow from operating activities1 was SEK -151m (-125)
Strong sales start in Outdoor&Bags Europe and ROW (+12.8% in constant currency)
Thule Technical Backpacks in store as of 2nd half of March
Thule wins prestigious IF Product Design Gold Award (Thule RideAlong Mini bike child seat)
1 Comparison period pertains to total operations meaning both continuing and discontinued operations.
Slide 16
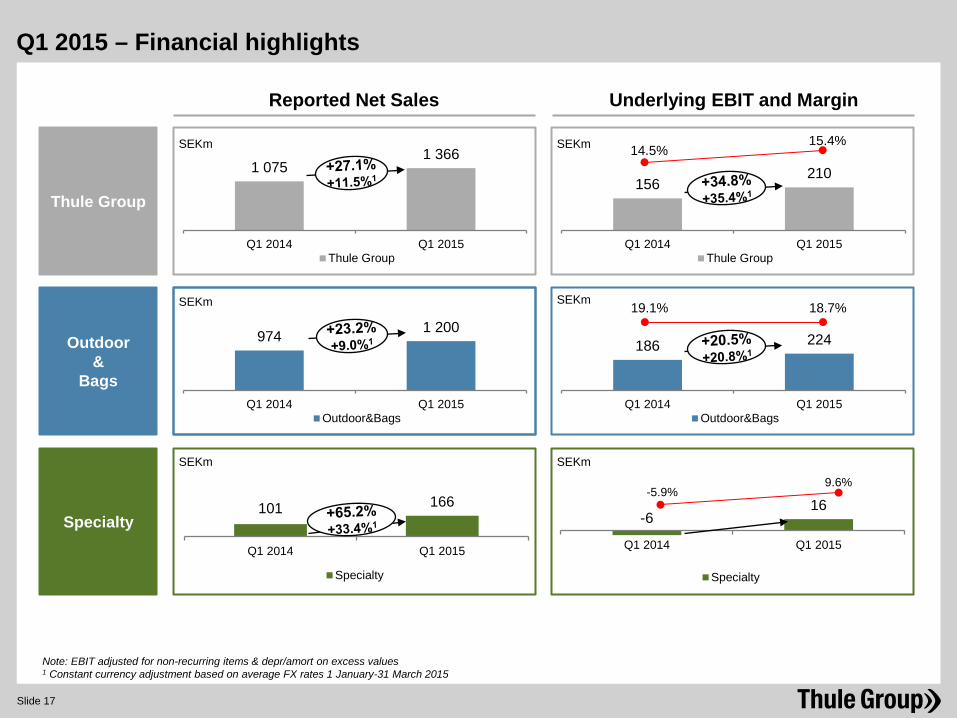
974 1 200
Q1 2014 Q1 2015Outdoor&Bags
1 075 1 366
Q1 2014 Q1 2015Thule Group
Note: EBIT adjusted for non-recurring items & depr/amort on excess values 1 Constant currency adjustment based on average FX rates 1 January-31 March 2015
186 224
Q1 2014 Q1 2015Outdoor&Bags
Reported Net Sales
Outdoor &
Bags
Specialty
Underlying EBIT and Margin
SEKm SEKm
156 210
Q1 2014 Q1 2015Thule Group
Thule Group
SEKm SEKm
-6 16
Q1 2014 Q1 2015
Specialty
O&B Americas
SEKm SEKm
101 166
Q1 2014 Q1 2015
Specialty
Q1 2015 – Financial highlights
14.5% 15.4%
19.1% 18.7%
-5.9% 9.6%
Slide 17
Q1 2015 - Net Sales and EBIT by Segment
Specialty
Outdoor&Bags
Slide 18
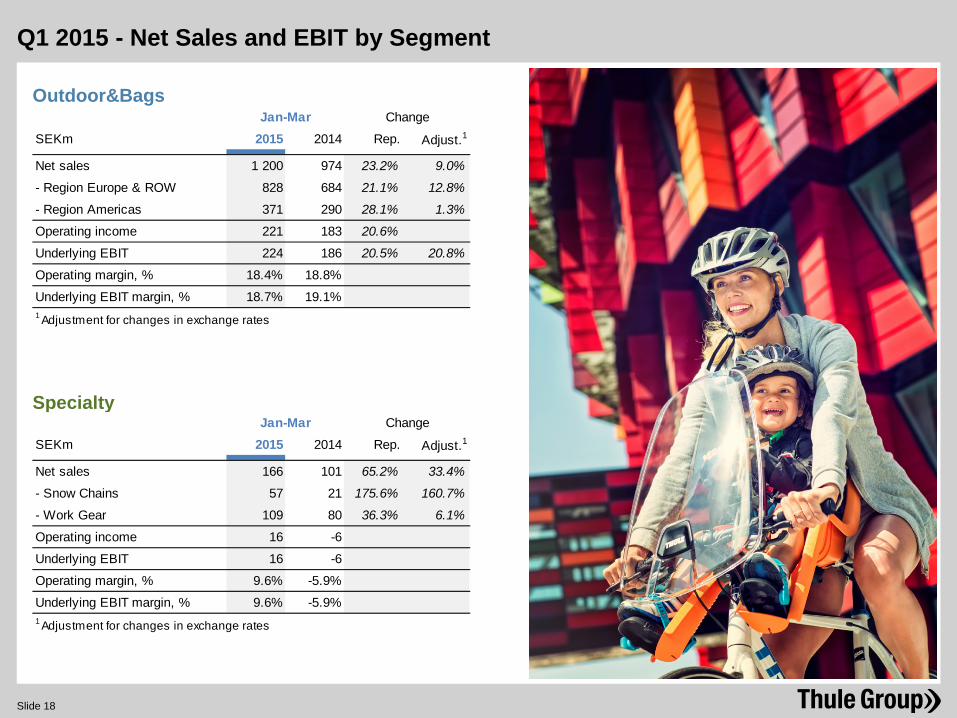
SEKm 2015 2014 Rep. Adjust.1
Net sales 1 200 974 23.2% 9.0%
- Region Europe & ROW 828 684 21.1% 12.8%
- Region Americas 371 290 28.1% 1.3%
Operating income 221 183 20.6%
Underlying EBIT 224 186 20.5% 20.8%
Operating margin, % 18.4% 18.8%
Underlying EBIT margin, % 18.7% 19.1%1 Adjustment for changes in exchange rates
Jan-Mar Change
SEKm 2015 2014 Rep. Adjust.1
Net sales 166 101 65.2% 33.4%
- Snow Chains 57 21 175.6% 160.7%
- Work Gear 109 80 36.3% 6.1%
Operating income 16 -6
Underlying EBIT 16 -6
Operating margin, % 9.6% -5.9%
Underlying EBIT margin, % 9.6% -5.9%1 Adjustment for changes in exchange rates
Jan-Mar Change
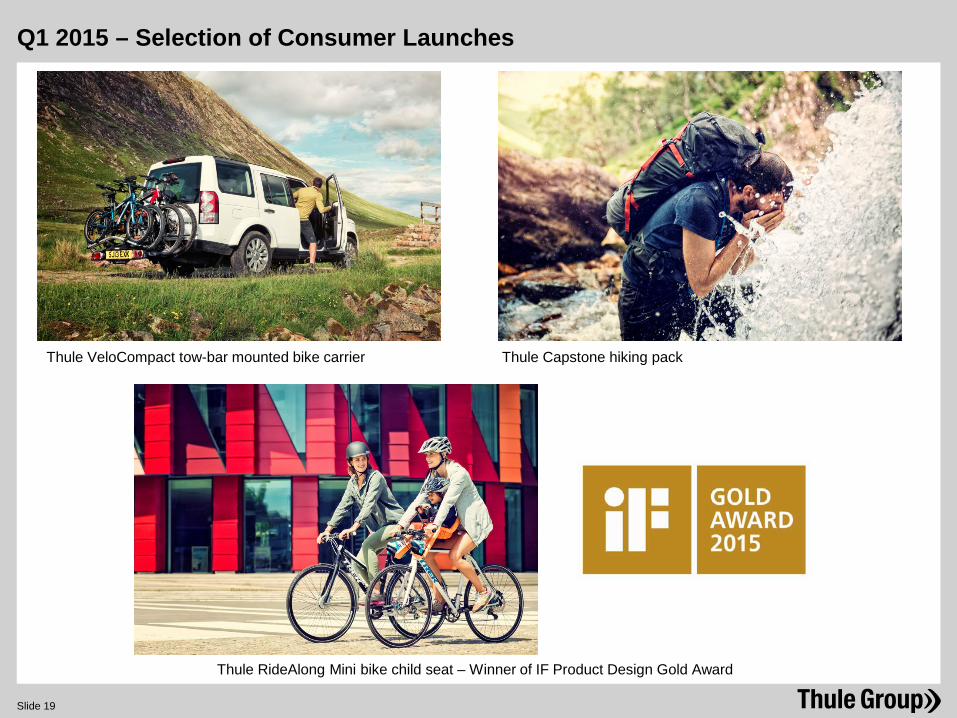
Q1 2015 – Selection of Consumer Launches
Thule RideAlong Mini bike child seat – Winner of IF Product Design Gold Award
Thule VeloCompact tow-bar mounted bike carrier Thule Capstone hiking pack
Slide 19
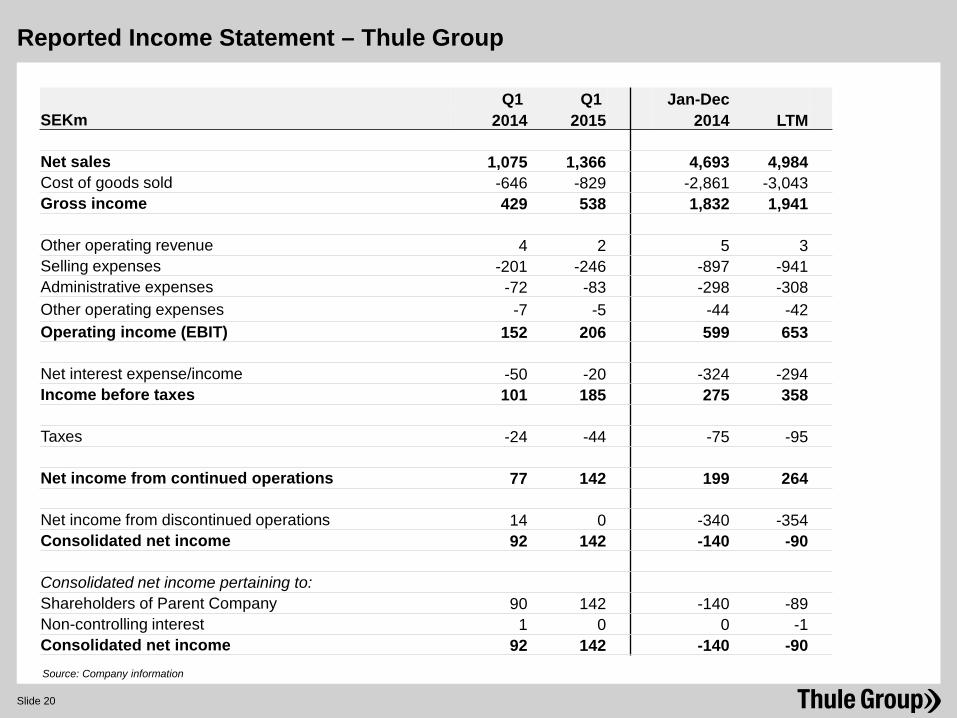
Reported Income Statement – Thule Group
Q1 Q1 Jan-Dec SEKm 2014 2015 2014 LTM Net sales 1,075 1,366 4,693 4,984 Cost of goods sold -646 -829 -2,861 -3,043 Gross income 429 538 1,832 1,941 Other operating revenue 4 2 5 3 Selling expenses -201 -246 -897 -941 Administrative expenses -72 -83 -298 -308 Other operating expenses -7 -5 -44 -42 Operating income (EBIT) 152 206 599 653 Net interest expense/income -50 -20 -324 -294 Income before taxes 101 185 275 358 Taxes -24 -44 -75 -95 Net income from continued operations 77 142 199 264 Net income from discontinued operations 14 0 -340 -354 Consolidated net income 92 142 -140 -90 Consolidated net income pertaining to: Shareholders of Parent Company 90 142 -140 -89 Non-controlling interest 1 0 0 -1 Consolidated net income 92 142 -140 -90 Source: Company information
Slide 20
Source: Company information
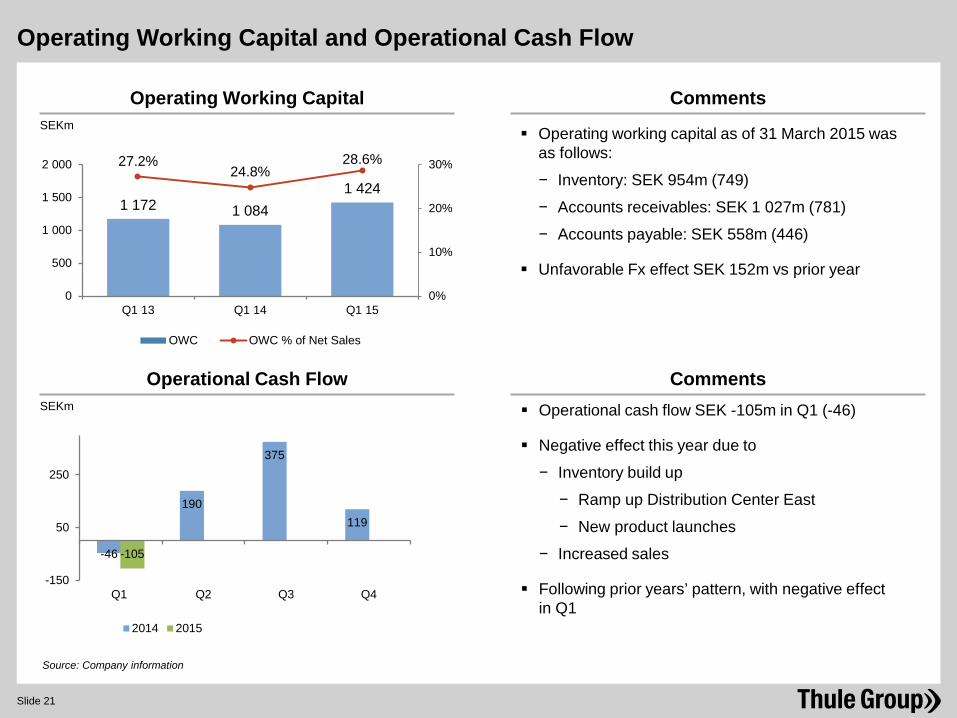
Operating Working Capital and Operational Cash Flow
Operating Working Capital SEKm
Operational Cash Flow
-46
190
375
119
-105
-150
50
250
Q1 Q2 Q3 Q4
2014 2015
SEKm
Comments
Operating working capital as of 31 March 2015 was as follows:
− Inventory: SEK 954m (749)
− Accounts receivables: SEK 1 027m (781)
− Accounts payable: SEK 558m (446)
Unfavorable Fx effect SEK 152m vs prior year
Comments
1 172 1 084 1 424
27.2% 24.8%
28.6%
0%
10%
20%
30%
0
500
1 000
1 500
2 000
Q1 13 Q1 14 Q1 15
OWC OWC % of Net Sales
Slide 21
Operational cash flow SEK -105m in Q1 (-46)
Negative effect this year due to
− Inventory build up
− Ramp up Distribution Center East
− New product launches
− Increased sales
Following prior years’ pattern, with negative effect in Q1
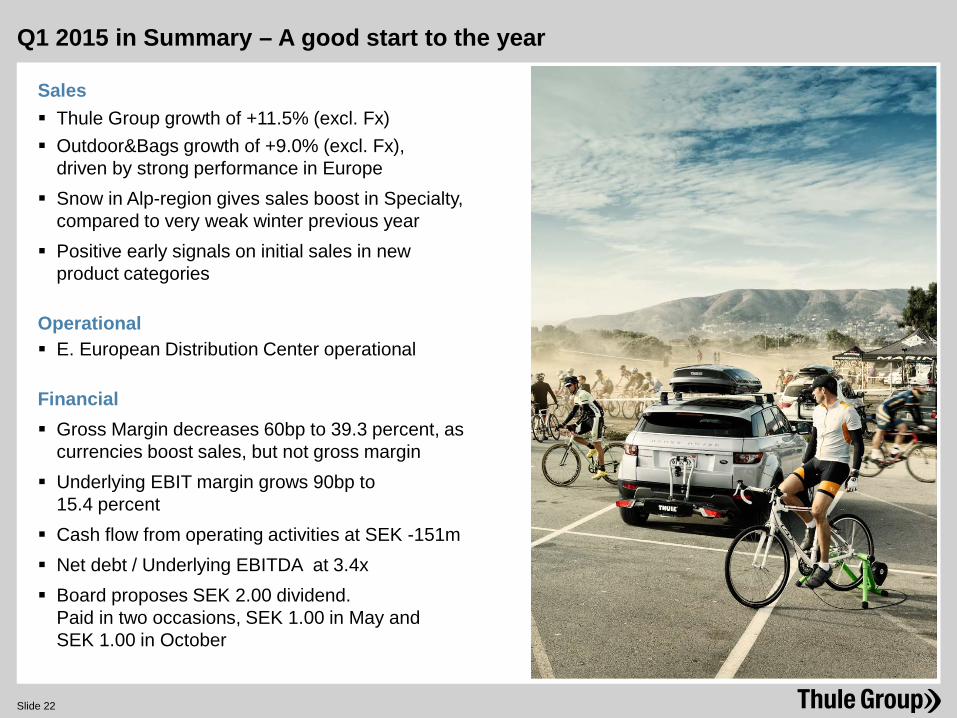
Q1 2015 in Summary – A good start to the year
Sales Thule Group growth of +11.5% (excl. Fx) Outdoor&Bags growth of +9.0% (excl. Fx),
driven by strong performance in Europe Snow in Alp-region gives sales boost in Specialty,
compared to very weak winter previous year Positive early signals on initial sales in new
product categories
Operational E. European Distribution Center operational
Financial Gross Margin decreases 60bp to 39.3 percent, as
currencies boost sales, but not gross margin Underlying EBIT margin grows 90bp to
15.4 percent Cash flow from operating activities at SEK -151m Net debt / Underlying EBITDA at 3.4x Board proposes SEK 2.00 dividend.
Paid in two occasions, SEK 1.00 in May and SEK 1.00 in October
Slide 22
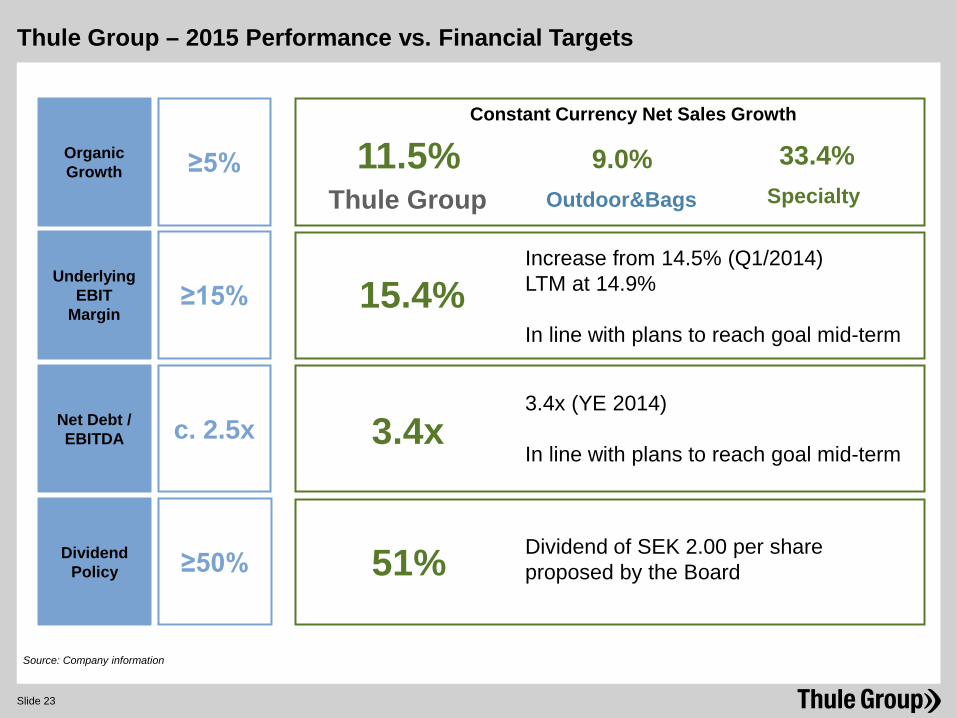
Thule Group – 2015 Performance vs. Financial Targets
Source: Company information
Dividend Policy ≥50%
Organic Growth ≥5%
UnderlyingEBIT
Margin ≥15%
Net Debt / EBITDA c. 2.5x
Constant Currency Net Sales Growth
11.5% Thule Group
9.0% Outdoor&Bags
33.4% Specialty
15.4%
3.4x 3.4x (YE 2014) In line with plans to reach goal mid-term
Increase from 14.5% (Q1/2014) LTM at 14.9% In line with plans to reach goal mid-term
51% Dividend of SEK 2.00 per share proposed by the Board
Slide 23
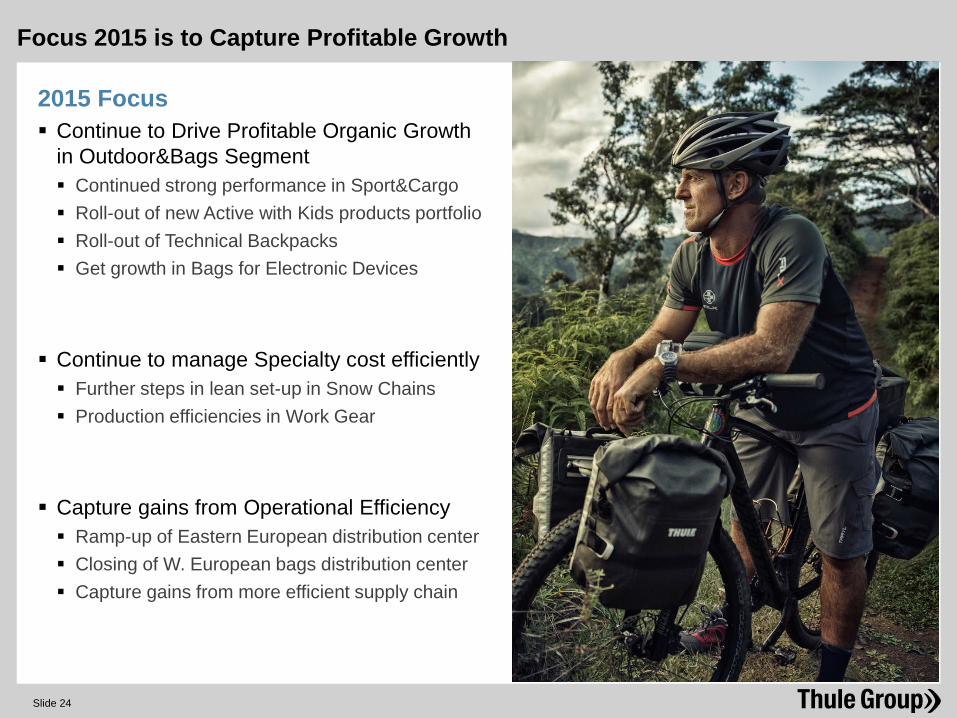
Focus 2015 is to Capture Profitable Growth
2015 Focus Continue to Drive Profitable Organic Growth
in Outdoor&Bags Segment Continued strong performance in Sport&Cargo Roll-out of new Active with Kids products portfolio Roll-out of Technical Backpacks Get growth in Bags for Electronic Devices Continue to manage Specialty cost efficiently Further steps in lean set-up in Snow Chains Production efficiencies in Work Gear Capture gains from Operational Efficiency Ramp-up of Eastern European distribution center Closing of W. European bags distribution center Capture gains from more efficient supply chain
Slide 24
Slide 25
Q&A
Disclaimer
This presentation has been prepared by Thule Group AB (publ) (the “Company”) solely for use at this presentation and is furnished to you solely for your information and may not be reproduced or redistributed, in whole or in part, to any other person. The presentation does not constitute an invitation or offer to acquire, purchase or subscribe for securities. By attending the meeting where this presentation is made, or by reading the presentation slides, you agree to be bound by the following limitations.
Statements in this presentation, which are not historical facts, such as expectations, anticipations, beliefs and estimates, are forward-looking statements within the meaning of the United States Private Securities Litigation Reform Act of 1995. Such statements involve risks and uncertainties which may cause actual results to materially differ from those expressed in such forward-looking statements.
This presentation may contain various forward-looking statements that reflect management’s current views with respect to future events and financial and operational performance. The words “believe,” “expect,” “anticipate,” “intend,” “may,” “plan,” “estimate,” “should,” “could,” “aim,” “target,” “might,” or, in each case, their negative, or similar expressions identify certain of these forward-looking statements. Others can be identified from the context in which the statements are made. These forward-looking statements involve known and unknown risks, uncertainties and other factors, which are in some cases beyond the Company’s control and may cause actual results or performance to differ materially from those expressed or implied from such forward-looking statements. These risks include but are not limited to the Company’s ability to operate profitably, maintain its competitive position, to promote and improve its reputation and the awareness of the brands in its portfolio, to successfully operate its growth strategy and the impact of changes in pricing policies, political and regulatory developments in the markets in which the Company operates, and other risks.
The information and opinions contained in this document are provided as at the date of this presentation and are subject to change without notice.
No representation or warranty (expressed or implied) is made as to, and no reliance should be placed on, the fairness, accuracy or completeness of the information contained herein. Accordingly, none of the Company, or any of its principal shareholders or subsidiary undertakings or any of such person’s officers or employees accepts any liability whatsoever arising directly or indirectly from the use of this document.
www.thulegroup.com