Embed Size (px)
Citation preview
Available online at www.sciencedirect.com
www.elsevier.com/locate/solener
Solar Energy 83 (2009) 1370–1378
Robust maximum power point tracking method for photovoltaiccells: A sliding mode control approach
Chen-Chi Chu a, Chieh-Li Chen b,*
a Aerospace Engineering and Mechanics, University of Minnesota, Minneapolis, USAb Department of Aeronautics and Astronautics, National Cheng Kung University, 1 University Rd., Tainan, Taiwan
Received 30 April 2007; received in revised form 26 January 2009; accepted 2 March 2009Available online 31 March 2009
Communicated by: Associate Editor Elias Stefanakos
Abstract
Due to nonlinear I-V characteristics of photovoltaic cells, an maximum power point tracking algorithm is adopted to maximize theoutput power. In this paper, an approach for peak power tracking using the sliding mode control is proposed. The proposed controller isrobust to environment changes and load variations. The stability and robustness of the controller are addressed. The performance of thecontroller is verified through simulations and experiments. It demonstrated that the proposed approach can be implemented effectivelyand economically.� 2009 Elsevier Ltd. All rights reserved.
Keywords: Photovoltaic cells; Sliding mode control; Robustness; Maximum power point tracking
1. Introduction
Due to the rising oil price and environmental regula-tions, the demand of utilizing alternative power sources isincreased dramatically. Alternative energy and its applica-tions have been heavily studied for the last decade. Solarenergy is a promising candidate in many applications.Among solar energy applications, the photovoltaic (PV)has received much attention with many feasible applica-tions. However, the performance of PV depends on solarinsolation, ambient temperature, and load impedance. Toachieve maximum power point (MPP) output of a PV sys-tem is essential for its applications. Different approach totrack the MPP has been addressed in many literatures.Among these algorithms, hill-climbing (Xiao and Dunford,2004; Koutroulis et al., 2001; Veerachary et al., 2001) andperturbation methods (Hua and Lin, 2003; Femia et al.,
0038-092X/$ - see front matter � 2009 Elsevier Ltd. All rights reserved.
doi:10.1016/j.solener.2009.03.005
* Corresponding author.E-mail address: [email protected] (C.-L. Chen).
2005) were commonly used due to their straightforwardand low-cost implementation. These two methods sharethe same principle by perturbing duty cycle (or PV voltage)and observing the power output, which provides usefulinformation for tuning duty cycle. The drawback of thesemethods is that, at steady state, the operation point (OP)oscillates around MPP, which propositional to perturba-tion size. Alternative approach to overcome this defect iscalled the increment conductance (IncCond) (Kuo et al.,2001; Hussein and Mota, 1995; Yu et al., 2004) method,which is based on the fact that the MPP is defined bydP PV=dV PV ¼ 0. When dP PV=dV PV > 0 (or dP PV=dV PV<0),then the operation point is on the left (or right) of theMPP, and should be tuned toward opposite direction,where PPV denotes power output of PV and VPV and IPV
are PV voltage and PV current, respectively. The expres-sion of dP PV=dV PV can be replaced by measurable parame-ters dIPV=dV PV þ IPV=V PV. However, both perturbation (orhill-climbing) and IncCond methods did not perform wellduring rapid changing of atmospheric conditions. There-fore, modified methods (Simoes et al., 1998; Wilamowski
Nomenclature
VPV PV voltageIPV PV currentPPV PV generate PowerRPV VPV/IPV
VOC PV open-circuit voltageISC PV short-circuit currentVmpp Maximum power output voltageImpp Maximum power output current
C CapacitanceL InductanceRL Load resistanced Duty ratioiL Inductor current (= IPV)Vo Output voltageV Lyapunov functionr Sliding surface
C.-C. Chu, C.-L. Chen / Solar Energy 83 (2009) 1370–1378 1371
and Li, 2002; Hiyama et al., 1995; Noguchi et al., 2002)have also been proposed to improve tracking performance.
The algorithms mentioned above are sharing the sameidea of ‘‘searching for MPP”. Since PV exhibits nonlinearI-V characteristics, solutions of MPP are difficult to bedetermined analytically. Another approach called propor-tional open-circuit voltage (or short-circuit current) isaddressed in Chu and Chen (2008), Duru (2006), whichassumed that voltage (Vmpp) and current (Impp) of MPPis proportion to PV open-circuit voltage (Voc) and short-circuit current (Isc), respectively. However, the estimatedVmpp is only an approximation of true Vmpp and the pro-portional constant will change if the PV module ages, inother words, the performance degraded with time.
Variable structure control approach for PV conversionsystem was proposed and evaluated by numerical studyin Battista and Mantz (2002). Further study was alsoproposed in Fossas and Biel (1996), Tan et al. (2004),Kim (2007), however, these approaches required refer-ence current for control law synthesis and may lead toa lack of robustness to operation conditions. By deliber-ately defining the sliding surface a robust approach wasproposed in this paper. This paper is organized as fol-lows: In Section 2, PV characteristic is described. Thesystem model of the proposed sliding control approachMPPT is discussed in Section 3. The sliding approachis given in Section 4. Simulation and experimental resultsare given in Sections 5 and 6, respectively. Conclusion isaddressed in the last section.
Fig. 1. Equivalent circuit model of PV.
2. PV characteristic
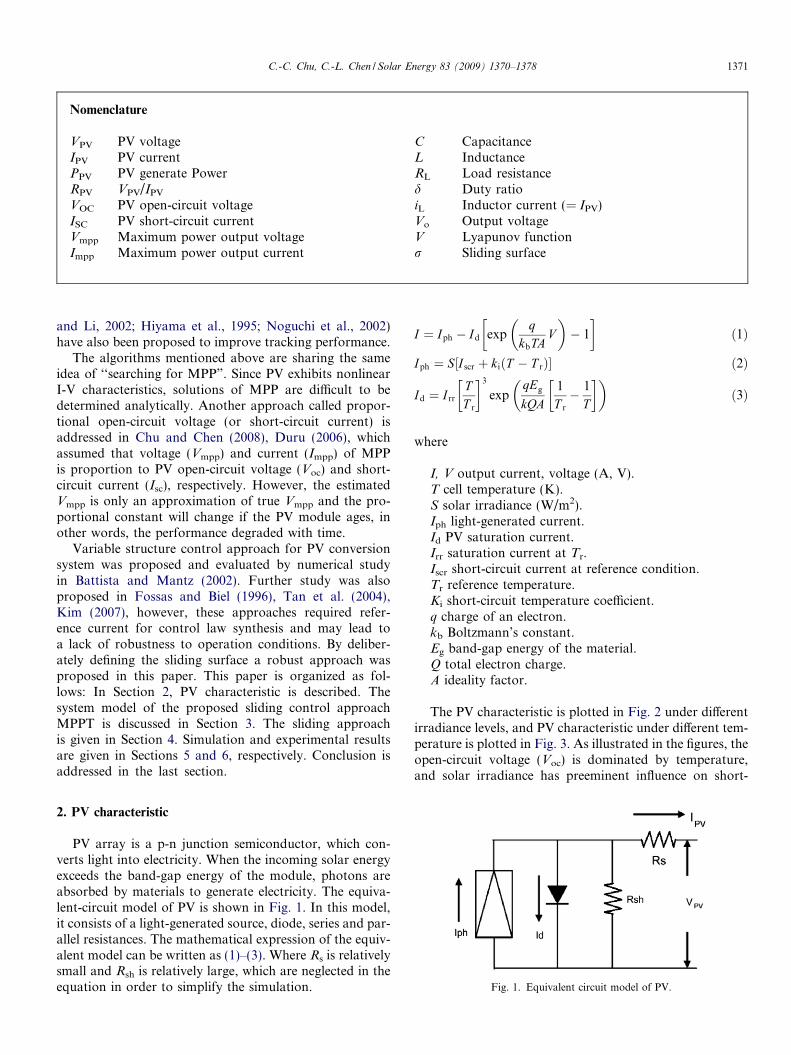
PV array is a p-n junction semiconductor, which con-verts light into electricity. When the incoming solar energyexceeds the band-gap energy of the module, photons areabsorbed by materials to generate electricity. The equiva-lent-circuit model of PV is shown in Fig. 1. In this model,it consists of a light-generated source, diode, series and par-allel resistances. The mathematical expression of the equiv-alent model can be written as (1)–(3). Where Rs is relativelysmall and Rsh is relatively large, which are neglected in theequation in order to simplify the simulation.
I ¼ Iph � Id expq
kbTAV
� �� 1
� �ð1Þ
Iph ¼ S I scr þ kiðT � T rÞ½ � ð2Þ
Id ¼ I rr
TT r
� �3
expqEg
kQA1
T r
� 1
T
� �� �ð3Þ
where
I, V output current, voltage (A, V).T cell temperature (K).S solar irradiance (W/m2).Iph light-generated current.Id PV saturation current.Irr saturation current at Tr.Iscr short-circuit current at reference condition.Tr reference temperature.Ki short-circuit temperature coefficient.q charge of an electron.kb Boltzmann’s constant.Eg band-gap energy of the material.Q total electron charge.A ideality factor.
The PV characteristic is plotted in Fig. 2 under differentirradiance levels, and PV characteristic under different tem-perature is plotted in Fig. 3. As illustrated in the figures, theopen-circuit voltage (Voc) is dominated by temperature,and solar irradiance has preeminent influence on short-
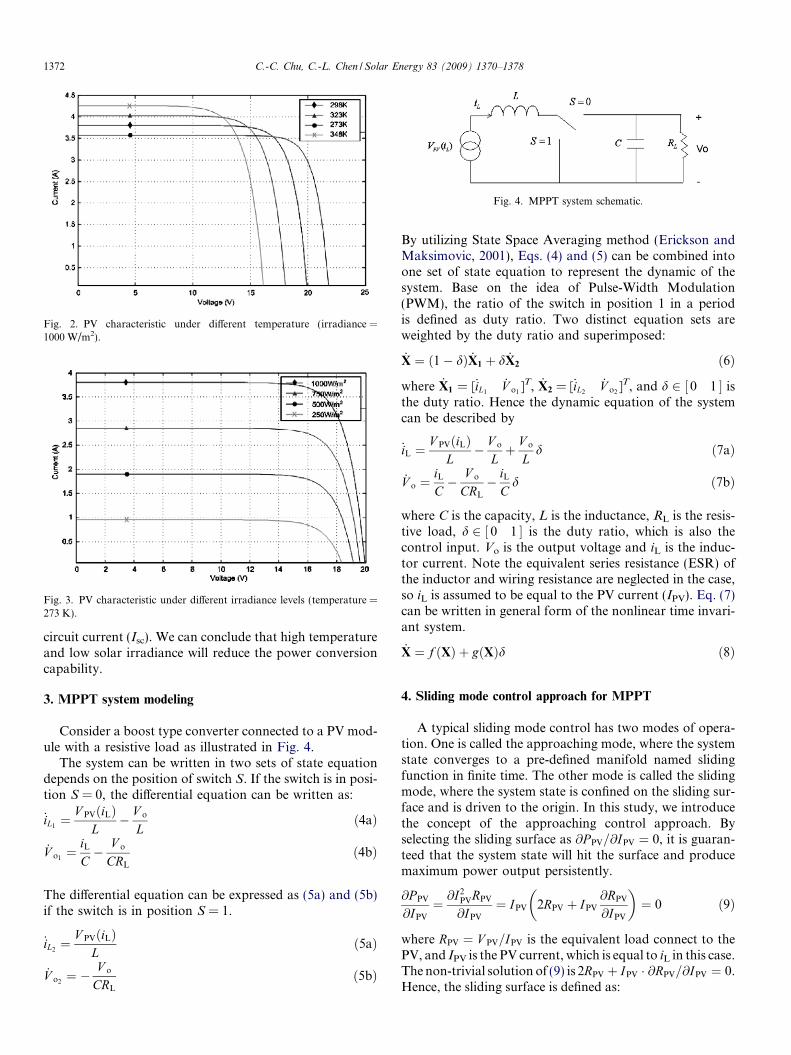
Fig. 2. PV characteristic under different temperature (irradiance =1000 W/m2).
Fig. 3. PV characteristic under different irradiance levels (temperature =273 K).
Fig. 4. MPPT system schematic.
1372 C.-C. Chu, C.-L. Chen / Solar Energy 83 (2009) 1370–1378
circuit current (Isc). We can conclude that high temperatureand low solar irradiance will reduce the power conversioncapability.
3. MPPT system modeling
Consider a boost type converter connected to a PV mod-ule with a resistive load as illustrated in Fig. 4.
The system can be written in two sets of state equationdepends on the position of switch S. If the switch is in posi-tion S = 0, the differential equation can be written as:
_iL1¼ V PVðiLÞ
L� V o
Lð4aÞ
_V o1¼ iL
C� V o
CRL
ð4bÞ
The differential equation can be expressed as (5a) and (5b)if the switch is in position S = 1.
_iL2¼ V PVðiLÞ
Lð5aÞ
_V o2¼ � V o
CRL
ð5bÞ
By utilizing State Space Averaging method (Erickson andMaksimovic, 2001), Eqs. (4) and (5) can be combined intoone set of state equation to represent the dynamic of thesystem. Base on the idea of Pulse-Width Modulation(PWM), the ratio of the switch in position 1 in a periodis defined as duty ratio. Two distinct equation sets areweighted by the duty ratio and superimposed:
_X ¼ ð1� dÞ _X1 þ d _X2 ð6Þ
where _X1 = [_iL1_V o1
]T, _X2 = [_iL2_V o2
]T, and d 2 ½ 0 1 � isthe duty ratio. Hence the dynamic equation of the systemcan be described by
_iL ¼V PVðiLÞ
L� V o
Lþ V o
Ld ð7aÞ
_V o ¼iL
C� V o
CRL
� iL
Cd ð7bÞ
where C is the capacity, L is the inductance, RL is the resis-tive load, d 2 ½ 0 1 � is the duty ratio, which is also thecontrol input. Vo is the output voltage and iL is the induc-tor current. Note the equivalent series resistance (ESR) ofthe inductor and wiring resistance are neglected in the case,so iL is assumed to be equal to the PV current (IPV). Eq. (7)can be written in general form of the nonlinear time invari-ant system.
_X ¼ f ðXÞ þ gðXÞd ð8Þ
4. Sliding mode control approach for MPPT
A typical sliding mode control has two modes of opera-tion. One is called the approaching mode, where the systemstate converges to a pre-defined manifold named slidingfunction in finite time. The other mode is called the slidingmode, where the system state is confined on the sliding sur-face and is driven to the origin. In this study, we introducethe concept of the approaching control approach. Byselecting the sliding surface as @P PV=@IPV ¼ 0, it is guaran-teed that the system state will hit the surface and producemaximum power output persistently.
@P PV
@IPV
¼ @I2PVRPV
@IPV
¼ IPV 2RPV þ IPV
@RPV
@IPV
� �¼ 0 ð9Þ
where RPV ¼ V PV=IPV is the equivalent load connect to thePV, and IPV is the PV current, which is equal to iL in this case.The non-trivial solution of (9) is 2RPV þ IPV � @RPV=@IPV ¼ 0.Hence, the sliding surface is defined as:
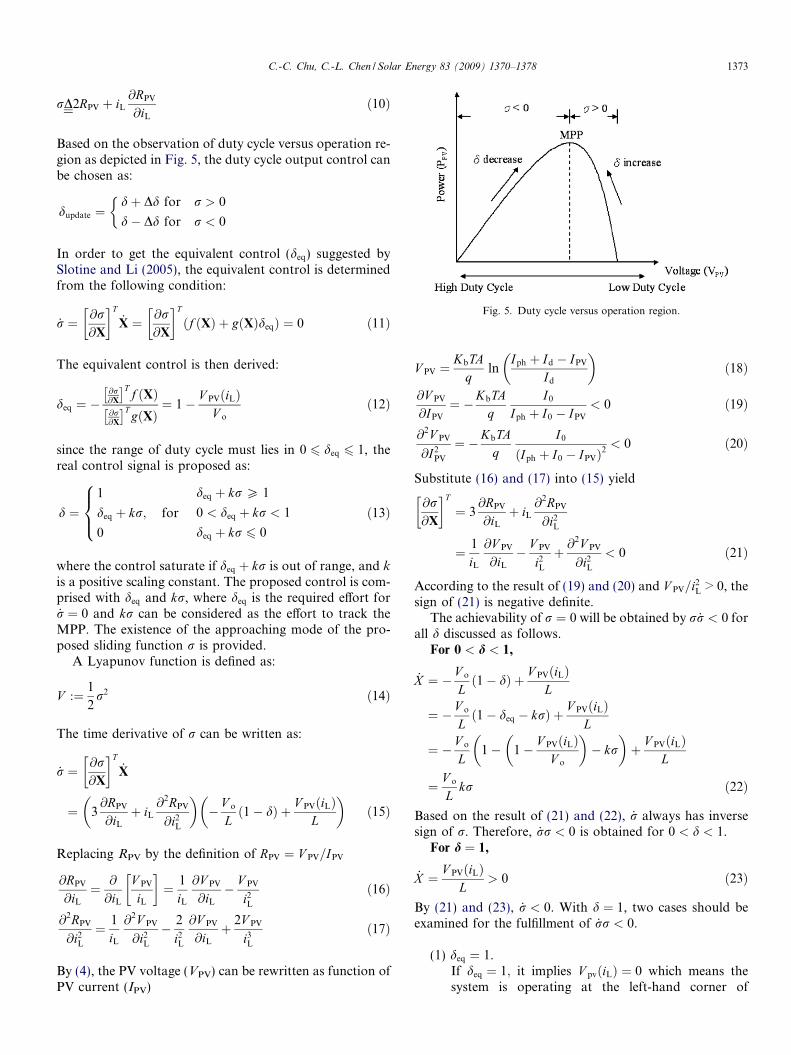
Fig. 5. Duty cycle versus operation region.
C.-C. Chu, C.-L. Chen / Solar Energy 83 (2009) 1370–1378 1373
rD2RPV þ iL
@RPV
@iL
ð10Þ
Based on the observation of duty cycle versus operation re-gion as depicted in Fig. 5, the duty cycle output control canbe chosen as:
dupdate ¼dþ Dd for r > 0
d� Dd for r < 0
�
In order to get the equivalent control (deq) suggested bySlotine and Li (2005), the equivalent control is determinedfrom the following condition:
_r ¼ @r@X
� �T
_X ¼ @r@X
� �T
ðf ðXÞ þ gðXÞdeqÞ ¼ 0 ð11Þ
The equivalent control is then derived:
deq ¼ �@r@X
� �Tf ðXÞ
@r@X
� �TgðXÞ
¼ 1� V PVðiLÞV o
ð12Þ
since the range of duty cycle must lies in 0 6 deq 6 1, thereal control signal is proposed as:
d ¼1
deq þ kr; for
0
8><>:
deq þ kr P 1
0 < deq þ kr < 1
deq þ kr 6 0
ð13Þ
where the control saturate if deq þ kr is out of range, and k
is a positive scaling constant. The proposed control is com-prised with deq and kr, where deq is the required effort for_r ¼ 0 and kr can be considered as the effort to track theMPP. The existence of the approaching mode of the pro-posed sliding function r is provided.
A Lyapunov function is defined as:
V :¼ 1
2r2 ð14Þ
The time derivative of r can be written as:
_r ¼ @r@X
� �T
_X
¼ 3@RPV
@iL
þ iL
@2RPV
@i2L
� �� V o
Lð1� dÞ þ V PVðiLÞ
L
� �ð15Þ
Replacing RPV by the definition of RPV ¼ V PV=IPV
@RPV
@iL
¼ @
@iL
V PV
iL
� �¼ 1
iL
@V PV
@iL
� V PV
i2L
ð16Þ
@2RPV
@i2L
¼ 1
iL
@2V PV
@i2L
� 2
i2L
@V PV
@iL
þ 2V PV
i3L
ð17Þ
By (4), the PV voltage (VPV) can be rewritten as function ofPV current (IPV)
V PV ¼KbTA
qln
Iph þ Id � IPV
Id
� �ð18Þ
@V PV
@IPV
¼ �KbTAq
I0
Iph þ I0 � IPV
< 0 ð19Þ
@2V PV
@I2PV
¼ �KbTAq
I0
ðIph þ I0 � IPVÞ2< 0 ð20Þ
Substitute (16) and (17) into (15) yield
@r@X
� �T
¼ 3@RPV
@iL
þ iL
@2RPV
@i2L
¼ 1
iL
@V PV
@iL
� V PV
i2L
þ @2V PV
@i2L
< 0 ð21Þ
According to the result of (19) and (20) and V PV=i2L > 0, the
sign of (21) is negative definite.The achievability of r ¼ 0 will be obtained by r _r < 0 for
all d discussed as follows.For 0 < d < 1,
_X ¼ � V o
Lð1� dÞ þ V PVðiLÞ
L
¼ � V o
Lð1� deq � krÞ þ V PVðiLÞ
L
¼ � V o
L1� 1� V PVðiLÞ
V o
� �� kr
� �þ V PVðiLÞ
L
¼ V o
Lkr ð22Þ
Based on the result of (21) and (22), _r always has inversesign of r. Therefore, _rr < 0 is obtained for 0 < d < 1.
For d ¼ 1,
_X ¼ V PVðiLÞL
> 0 ð23Þ
By (21) and (23), _r < 0. With d ¼ 1, two cases should beexamined for the fulfillment of _rr < 0.
(1) deq ¼ 1.If deq ¼ 1; it implies V pvðiLÞ ¼ 0 which means thesystem is operating at the left-hand corner of
1374 C.-C. Chu, C.-L. Chen / Solar Energy 83 (2009) 1370–1378
Fig. 5, and r is negative for this case. Therefore,deq þ kr will be less than 1, which contradicts tothe assumption of d ¼ 1.
(2) deq < 1 and deq þ kr P 1.If deq < 1, butdeq þ kr P 1, it implies r > 0 and_rr < 0.
It concludes that _rr < 0 for d ¼ 1.For d ¼ 0,
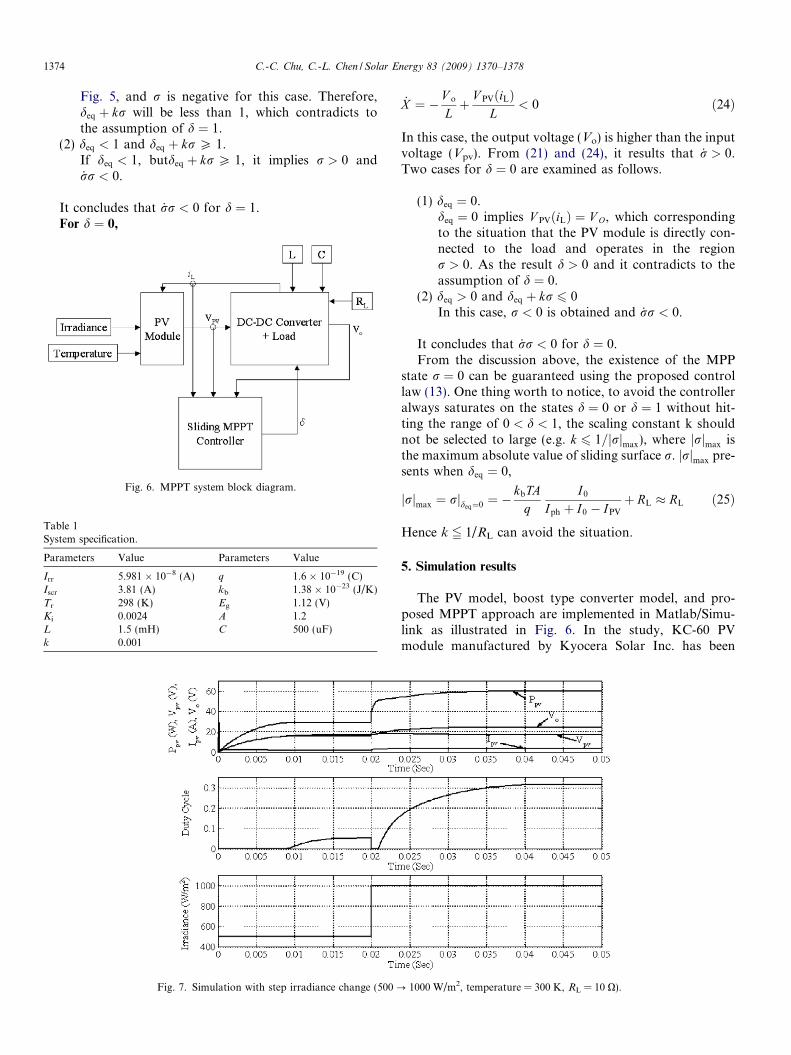
Fig. 7. Simulation with step irradiance change (500 ?
Fig. 6. MPPT system block diagram.
Table 1System specification.
Parameters Value Parameters Value
Irr 5.981 � 10�8 (A) q 1.6 � 10�19 (C)Iscr 3.81 (A) kb 1.38 � 10�23 (J/K)Tr 298 (K) Eg 1.12 (V)Ki 0.0024 A 1.2L 1.5 (mH) C 500 (uF)k 0.001
_X ¼ � V o
Lþ V PVðiLÞ
L< 0 ð24Þ
In this case, the output voltage (Vo) is higher than the inputvoltage (Vpv). From (21) and (24), it results that _r > 0.Two cases for d ¼ 0 are examined as follows.
(1) deq ¼ 0.deq ¼ 0 implies V PVðiLÞ ¼ V O, which correspondingto the situation that the PV module is directly con-nected to the load and operates in the regionr > 0. As the result d > 0 and it contradicts to theassumption of d ¼ 0.
(2) deq > 0 and deq þ kr 6 0In this case, r < 0 is obtained and _rr < 0.
It concludes that _rr < 0 for d ¼ 0.From the discussion above, the existence of the MPP
state r ¼ 0 can be guaranteed using the proposed controllaw (13). One thing worth to notice, to avoid the controlleralways saturates on the states d ¼ 0 or d ¼ 1 without hit-ting the range of 0 < d < 1, the scaling constant k shouldnot be selected to large (e.g. k 6 1=jrjmax), where jrjmax isthe maximum absolute value of sliding surface r. jrjmax pre-sents when deq ¼ 0,
jrjmax ¼ rjdeq¼0 ¼ �kbTA
qI0
Iph þ I0 � IPV
þ RL � RL ð25Þ
Hence k 5 1/RL can avoid the situation.
5. Simulation results
The PV model, boost type converter model, and pro-posed MPPT approach are implemented in Matlab/Simu-link as illustrated in Fig. 6. In the study, KC-60 PVmodule manufactured by Kyocera Solar Inc. has been
1000 W/m2, temperature = 300 K, RL = 10 X).
C.-C. Chu, C.-L. Chen / Solar Energy 83 (2009) 1370–1378 1375
selected as PV power source, and the parameter of the com-ponents are chosen to deliver maximum 60 W of powergenerated by KC-60. The specification of the system is tab-ulated in Table 1. The proposed MPPT is evaluated fromthree aspects: robustness to irradiance, temperature, andload. In each figures, two different values of irradiance,temperature or load are presented for comparison in orderto show the robustness.
Fig. 7 illustrates the tracking result with step irradianceinput (500 ? 1000 W/m2) under the same temperatureand load. The system reaches steady state of both irradi-ance levels within the order of milliseconds, which ismuch faster compare to the other MPPT tracking tech-
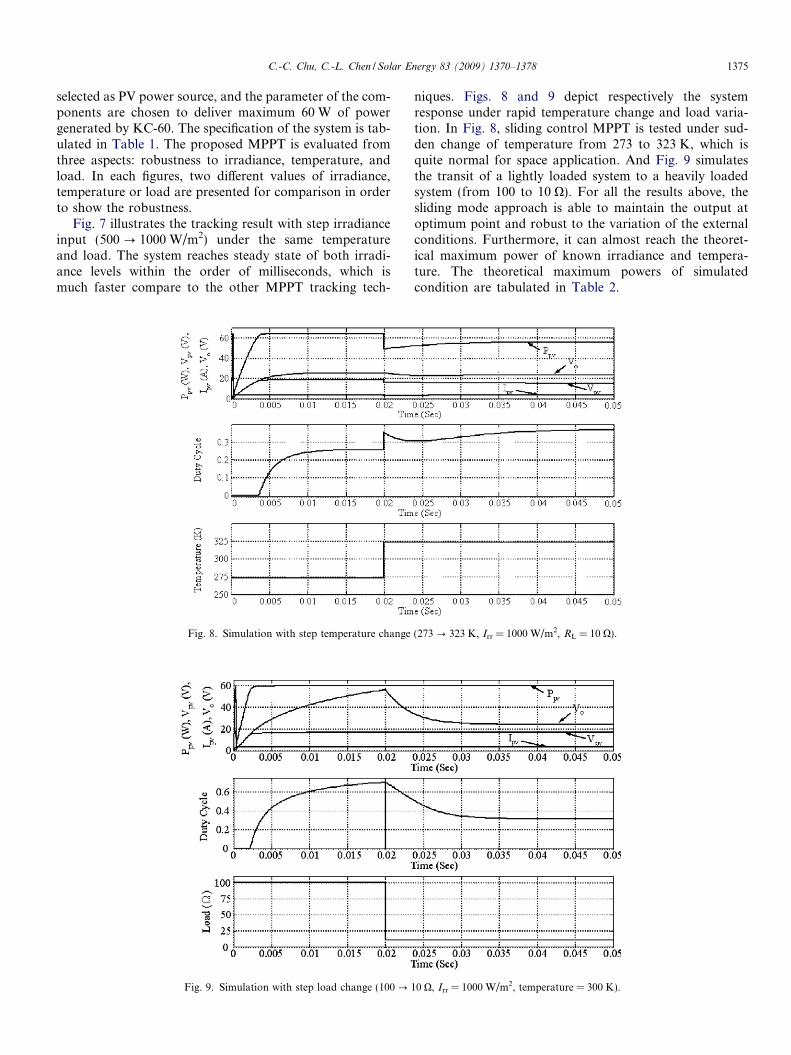
Fig. 9. Simulation with step load change (100 ? 1
Fig. 8. Simulation with step temperature change
niques. Figs. 8 and 9 depict respectively the systemresponse under rapid temperature change and load varia-tion. In Fig. 8, sliding control MPPT is tested under sud-den change of temperature from 273 to 323 K, which isquite normal for space application. And Fig. 9 simulatesthe transit of a lightly loaded system to a heavily loadedsystem (from 100 to 10 X). For all the results above, thesliding mode approach is able to maintain the output atoptimum point and robust to the variation of the externalconditions. Furthermore, it can almost reach the theoret-ical maximum power of known irradiance and tempera-ture. The theoretical maximum powers of simulatedcondition are tabulated in Table 2.
0 X, Irr = 1000 W/m2, temperature = 300 K).
(273 ? 323 K, Irr = 1000 W/m2, RL = 10 X).
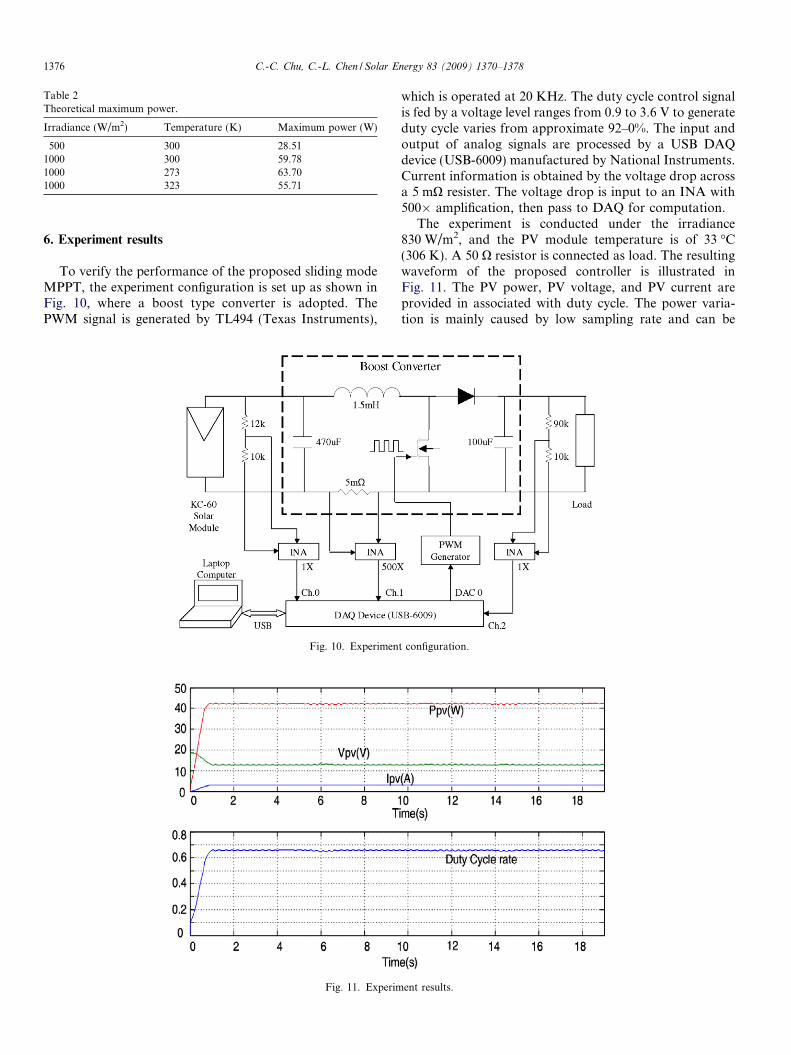
Table 2Theoretical maximum power.
Irradiance (W/m2) Temperature (K) Maximum power (W)
500 300 28.511000 300 59.781000 273 63.701000 323 55.71
1376 C.-C. Chu, C.-L. Chen / Solar Energy 83 (2009) 1370–1378
6. Experiment results
To verify the performance of the proposed sliding modeMPPT, the experiment configuration is set up as shown inFig. 10, where a boost type converter is adopted. ThePWM signal is generated by TL494 (Texas Instruments),
Fig. 11. Experim
Fig. 10. Experimen
which is operated at 20 KHz. The duty cycle control signalis fed by a voltage level ranges from 0.9 to 3.6 V to generateduty cycle varies from approximate 92–0%. The input andoutput of analog signals are processed by a USB DAQdevice (USB-6009) manufactured by National Instruments.Current information is obtained by the voltage drop acrossa 5 mX resister. The voltage drop is input to an INA with500� amplification, then pass to DAQ for computation.
The experiment is conducted under the irradiance830 W/m2, and the PV module temperature is of 33 �C(306 K). A 50 X resistor is connected as load. The resultingwaveform of the proposed controller is illustrated inFig. 11. The PV power, PV voltage, and PV current areprovided in associated with duty cycle. The power varia-tion is mainly caused by low sampling rate and can be
ent results.
t configuration.
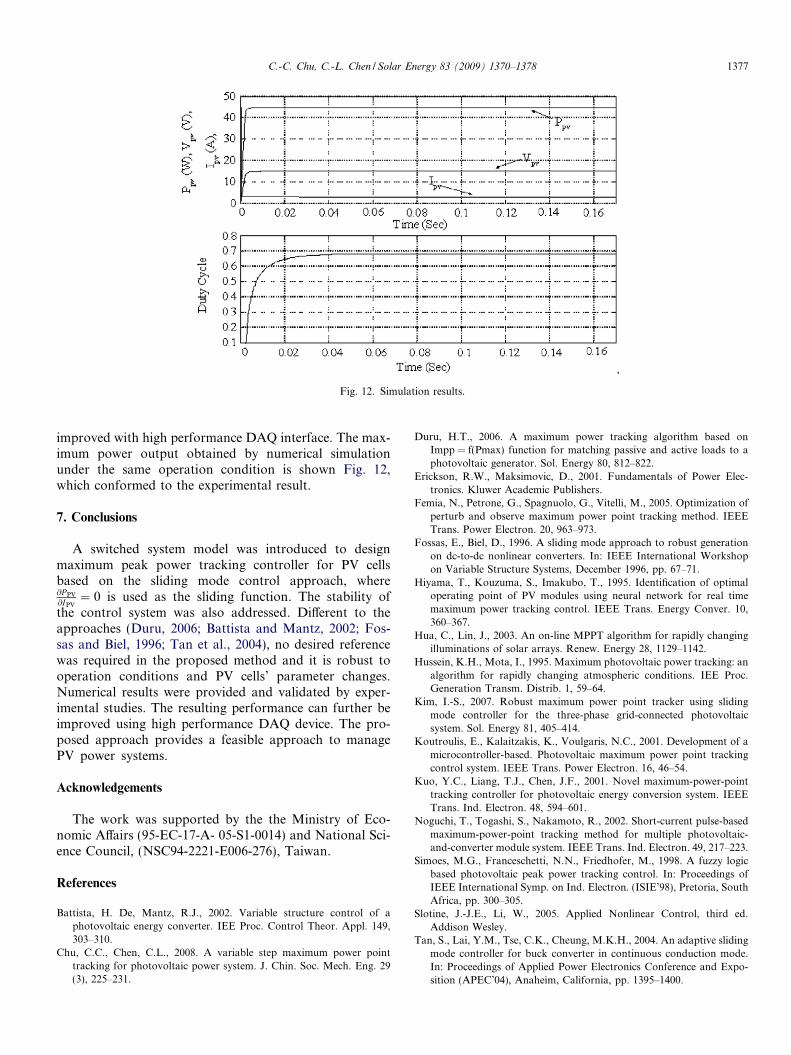
Fig. 12. Simulation results.
C.-C. Chu, C.-L. Chen / Solar Energy 83 (2009) 1370–1378 1377
improved with high performance DAQ interface. The max-imum power output obtained by numerical simulationunder the same operation condition is shown Fig. 12,which conformed to the experimental result.
7. Conclusions
A switched system model was introduced to designmaximum peak power tracking controller for PV cellsbased on the sliding mode control approach, where@P PV
@IPV¼ 0 is used as the sliding function. The stability of
the control system was also addressed. Different to theapproaches (Duru, 2006; Battista and Mantz, 2002; Fos-sas and Biel, 1996; Tan et al., 2004), no desired referencewas required in the proposed method and it is robust tooperation conditions and PV cells’ parameter changes.Numerical results were provided and validated by exper-imental studies. The resulting performance can further beimproved using high performance DAQ device. The pro-posed approach provides a feasible approach to managePV power systems.
Acknowledgements
The work was supported by the the Ministry of Eco-nomic Affairs (95-EC-17-A- 05-S1-0014) and National Sci-ence Council, (NSC94-2221-E006-276), Taiwan.
References
Battista, H. De, Mantz, R.J., 2002. Variable structure control of aphotovoltaic energy converter. IEE Proc. Control Theor. Appl. 149,303–310.
Chu, C.C., Chen, C.L., 2008. A variable step maximum power pointtracking for photovoltaic power system. J. Chin. Soc. Mech. Eng. 29(3), 225–231.
Duru, H.T., 2006. A maximum power tracking algorithm based onImpp = f(Pmax) function for matching passive and active loads to aphotovoltaic generator. Sol. Energy 80, 812–822.
Erickson, R.W., Maksimovic, D., 2001. Fundamentals of Power Elec-tronics. Kluwer Academic Publishers.
Femia, N., Petrone, G., Spagnuolo, G., Vitelli, M., 2005. Optimization ofperturb and observe maximum power point tracking method. IEEETrans. Power Electron. 20, 963–973.
Fossas, E., Biel, D., 1996. A sliding mode approach to robust generationon dc-to-dc nonlinear converters. In: IEEE International Workshopon Variable Structure Systems, December 1996, pp. 67–71.
Hiyama, T., Kouzuma, S., Imakubo, T., 1995. Identification of optimaloperating point of PV modules using neural network for real timemaximum power tracking control. IEEE Trans. Energy Conver. 10,360–367.
Hua, C., Lin, J., 2003. An on-line MPPT algorithm for rapidly changingilluminations of solar arrays. Renew. Energy 28, 1129–1142.
Hussein, K.H., Mota, I., 1995. Maximum photovoltaic power tracking: analgorithm for rapidly changing atmospheric conditions. IEE Proc.Generation Transm. Distrib. 1, 59–64.
Kim, I.-S., 2007. Robust maximum power point tracker using slidingmode controller for the three-phase grid-connected photovoltaicsystem. Sol. Energy 81, 405–414.
Koutroulis, E., Kalaitzakis, K., Voulgaris, N.C., 2001. Development of amicrocontroller-based. Photovoltaic maximum power point trackingcontrol system. IEEE Trans. Power Electron. 16, 46–54.
Kuo, Y.C., Liang, T.J., Chen, J.F., 2001. Novel maximum-power-pointtracking controller for photovoltaic energy conversion system. IEEETrans. Ind. Electron. 48, 594–601.
Noguchi, T., Togashi, S., Nakamoto, R., 2002. Short-current pulse-basedmaximum-power-point tracking method for multiple photovoltaic-and-converter module system. IEEE Trans. Ind. Electron. 49, 217–223.
Simoes, M.G., Franceschetti, N.N., Friedhofer, M., 1998. A fuzzy logicbased photovoltaic peak power tracking control. In: Proceedings ofIEEE International Symp. on Ind. Electron. (ISIE’98), Pretoria, SouthAfrica, pp. 300–305.
Slotine, J.-J.E., Li, W., 2005. Applied Nonlinear Control, third ed.Addison Wesley.
Tan, S., Lai, Y.M., Tse, C.K., Cheung, M.K.H., 2004. An adaptive slidingmode controller for buck converter in continuous conduction mode.In: Proceedings of Applied Power Electronics Conference and Expo-sition (APEC’04), Anaheim, California, pp. 1395–1400.

1378 C.-C. Chu, C.-L. Chen / Solar Energy 83 (2009) 1370–1378
Veerachary, M., Senjyu, T., Uezato, K., 2001. Maximum power pointtracking control of IDB converter supplied PV system. IEE Proc.Electron. Power Appl. 148, 494–502.
Wilamowski, B.M., Li, X., 2002. Fuzzy system based maximum powerpoint tracking for PV system. In: Proceedings of IEEE 2002 28thAnnual Conference of the Industrial Electronics Society (IECON 02),Sevilla, Spain, pp. 3280–3284.
Xiao, W., Dunford, W.G., 2004. A modified adaptive hill climbing MPPTmethod for photovoltaic power systems. In: Proceedings of 35thAnnual IEEE Power Electronics. Specialists Conference, Aachen,Germany. pp. 1957–1963.
Yu, G.J., Jung, Y.S., Choi, J.Y., Kim, G.S., 2004. A novel two-modeMPPT control algorithm based on comparative study of existingalgorithms. Sol. Energy 76, 455–463.


![Robust Fuzzy-Second Order Sliding Mode based …thesai.org/...Robust_Fuzzy_Second_Order_Sliding_Mode_based...Con… · Robust Fuzzy-Second Order Sliding Mode based ... [3]. Sliding-mode](https://img.pdfslide.net/doc/110x75/5b7a16407f8b9a483c8b5dce/robust-fuzzy-second-order-sliding-mode-based-robust-fuzzy-second-order-sliding.jpg)