Embed Size (px)
Citation preview
10/20/2009
1
Robust Product and Process DesignsRobust Product and Process Designs
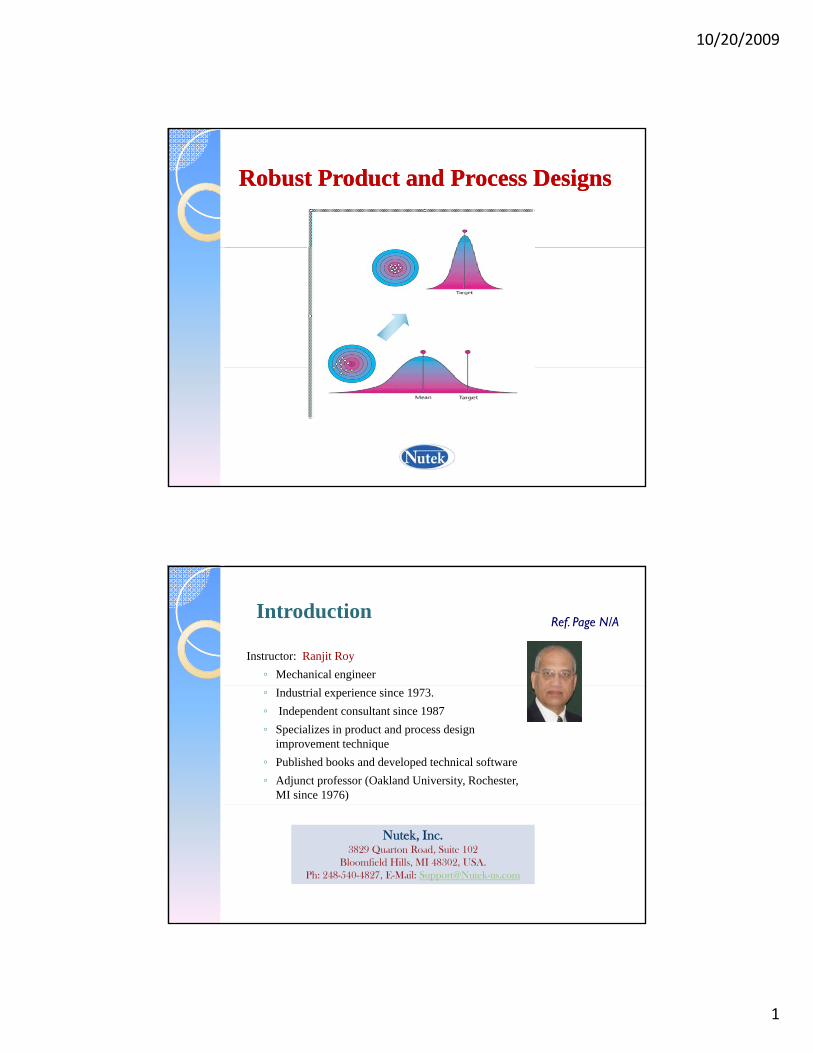
Instructor: Ranjit Roy◦ Mechanical engineer
IntroductionRef. Page N/A
◦ Industrial experience since 1973.◦ Independent consultant since 1987◦ Specializes in product and process design
improvement technique◦ Published books and developed technical software◦ Adjunct professor (Oakland University, Rochester,
MI since 1976)
Nutek, Inc. 3829 Quarton Road, Suite 102
Bloomfield Hills, MI 48302, USA.Ph: 248-540-4827, E-Mail: [email protected]
10/20/2009
2
What is Robustness?What is Robustness?
Robust Product & Process designs
Ref. Page 1-1
Sturdy, Rugged,Consistent, Dependable,..
What are examples of robust products and processes?
Built Strong to Last Long
Nutek, Inc. All Rights Reserved Robust Product and Process Designs www.Nutek-us.com Version 0804
Why design robust products?g g
It takes the licking, but keeps on ticking
Product Quality and RobustnessProduct Quality and Robustness
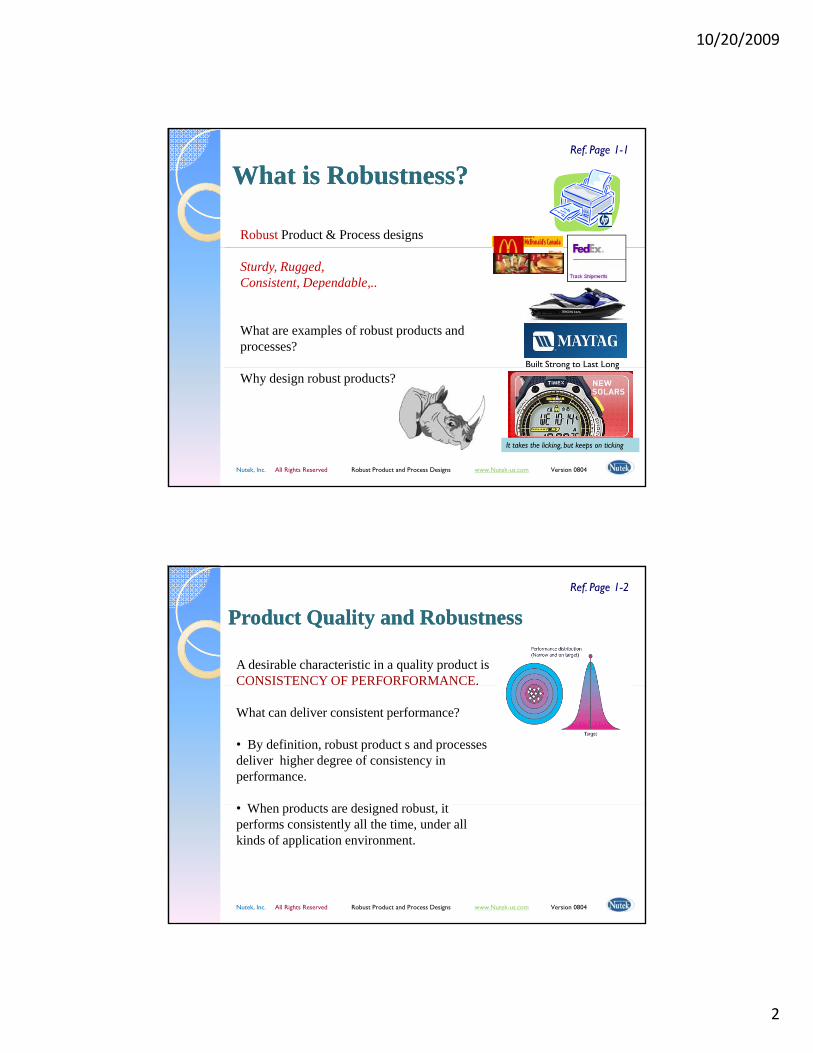
A desirable characteristic in a quality product is CONSISTENCY OF PERFORFORMANCE.
Ref. Page 1-2
What can deliver consistent performance?
• By definition, robust product s and processes deliver higher degree of consistency in performance.
Wh d t d i d b t it
Nutek, Inc. All Rights Reserved Robust Product and Process Designs www.Nutek-us.com Version 0804
• When products are designed robust, it performs consistently all the time, under all kinds of application environment.
10/20/2009
3
How do you design robust
Ref. Page N/A
products and processes?
What is the approach?
Nutek, Inc. All Rights Reserved Robust Product and Process Designs www.Nutek-us.com Version 0804
Enemy of Consistency of PerformanceEnemy of Consistency of Performance
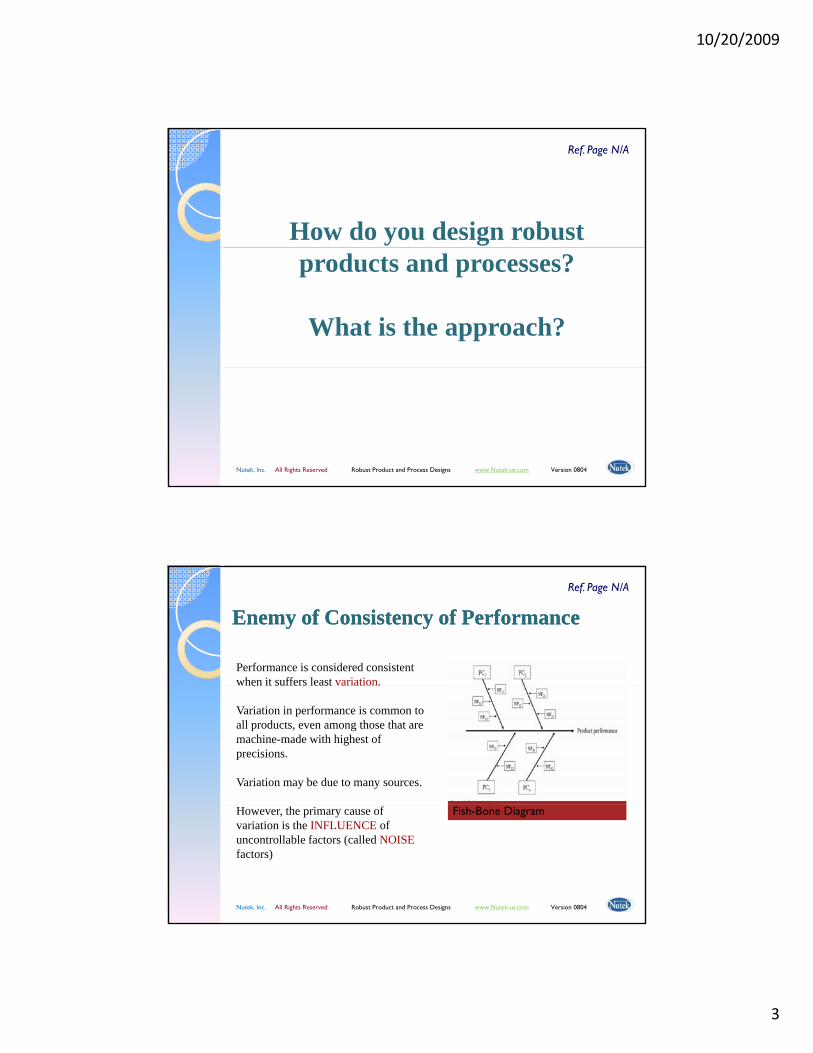
Performance is considered consistent when it suffers least variation.
Ref. Page N/A
when it suffers least variation.
Variation in performance is common to all products, even among those that are machine-made with highest of precisions.
Variation may be due to many sources.
Nutek, Inc. All Rights Reserved Robust Product and Process Designs www.Nutek-us.com Version 0804
However, the primary cause of variation is the INFLUENCE of uncontrollable factors (called NOISEfactors)
Fish-Bone Diagram
10/20/2009
4
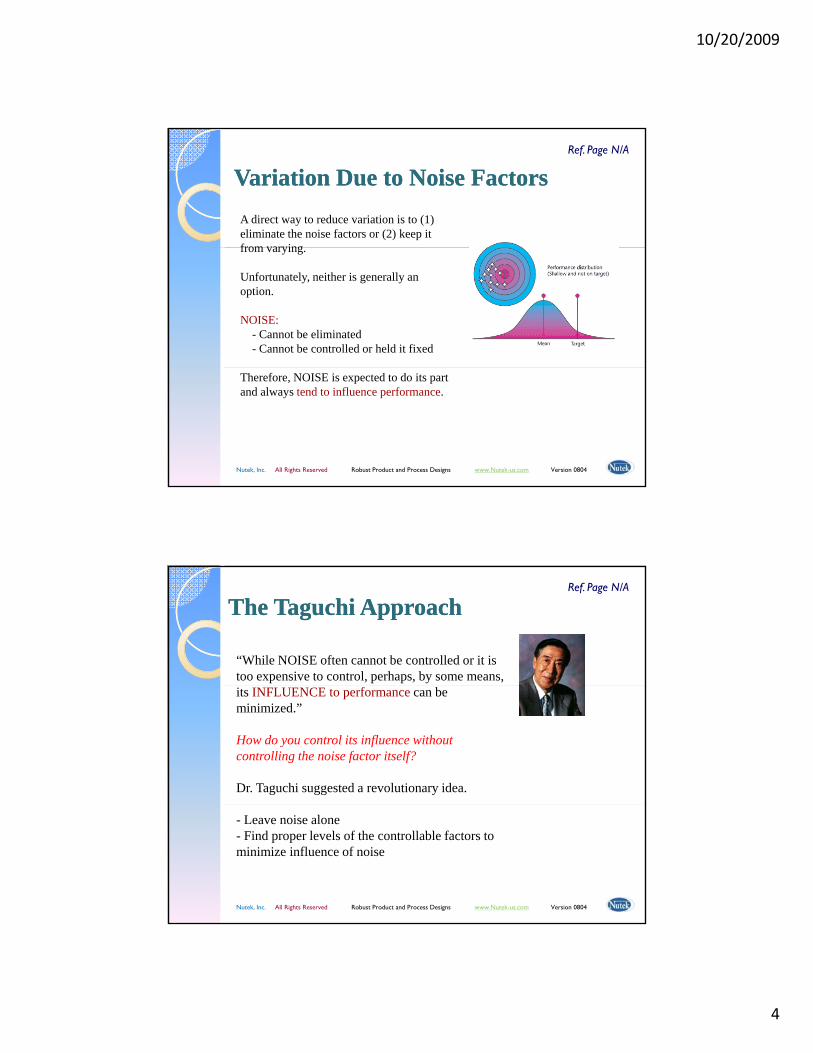
Variation Due to Noise FactorsVariation Due to Noise FactorsA direct way to reduce variation is to (1) eliminate the noise factors or (2) keep it from varying
Ref. Page N/A
from varying.
Unfortunately, neither is generally an option.
NOISE:- Cannot be eliminated- Cannot be controlled or held it fixed
Nutek, Inc. All Rights Reserved Robust Product and Process Designs www.Nutek-us.com Version 0804
Therefore, NOISE is expected to do its part and always tend to influence performance.
The Taguchi ApproachThe Taguchi Approach
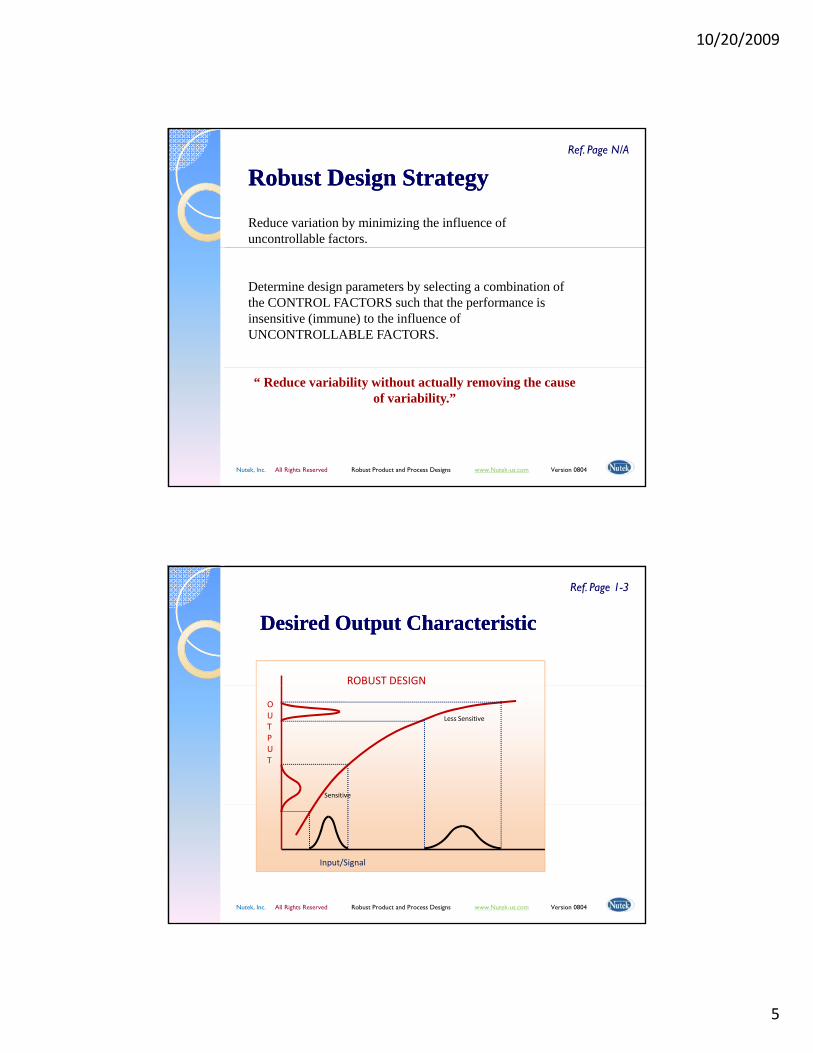
“While NOISE often cannot be controlled or it is too expensive to control, perhaps, by some means,
Ref. Page N/A
its INFLUENCE to performance can be minimized.”
How do you control its influence without controlling the noise factor itself?
Dr. Taguchi suggested a revolutionary idea.
Nutek, Inc. All Rights Reserved Robust Product and Process Designs www.Nutek-us.com Version 0804
- Leave noise alone- Find proper levels of the controllable factors to minimize influence of noise
10/20/2009
5
Robust Design StrategyRobust Design Strategy
Reduce variation by minimizing the influence of uncontrollable factors.
Ref. Page N/A
Determine design parameters by selecting a combination of the CONTROL FACTORS such that the performance is insensitive (immune) to the influence of UNCONTROLLABLE FACTORS.
Nutek, Inc. All Rights Reserved Robust Product and Process Designs www.Nutek-us.com Version 0804
“ Reduce variability without actually removing the cause of variability.”
Desired Output Characteristic Desired Output Characteristic
ROBUST DESIGN
Ref. Page 1-3
Sensitive
OUTPUT
Less Sensitive
Nutek, Inc. All Rights Reserved Robust Product and Process Designs www.Nutek-us.com Version 0804
Input/Signal

10/20/2009
6
Robust Design Application MethodologiesRobust Design Application Methodologies
Methods: Undertake experimental studies with hardware or
Ref. Page 1-3
analytical simulation
When: The earlier the better. The return on investment is highest when applied in product design and development phases.
Specific Method:- Taguchi experimental design (PARAMETER DESIGN)- Outer array designs with NOISE factors (Process diagram & Ideal
Nutek, Inc. All Rights Reserved Robust Product and Process Designs www.Nutek-us.com Version 0804
Outer array designs with NOISE factors (Process diagram & Ideal function)
- Analysis ( Two step optimization, Signal-to-noise, Loss function, etc.)
(First part of this seminar will be dedicated to learning the experimental design techniques)
History of Quality ImprovementHistory of Quality Improvement
Ref. Page N/A
History of Quality Improvement History of Quality Improvement Activities and the Taguchi Activities and the Taguchi
Experimental Design TechniquesExperimental Design Techniques
Nutek, Inc. All Rights Reserved Robust Product and Process Designs www.Nutek-us.com Version 0804
10/20/2009
7
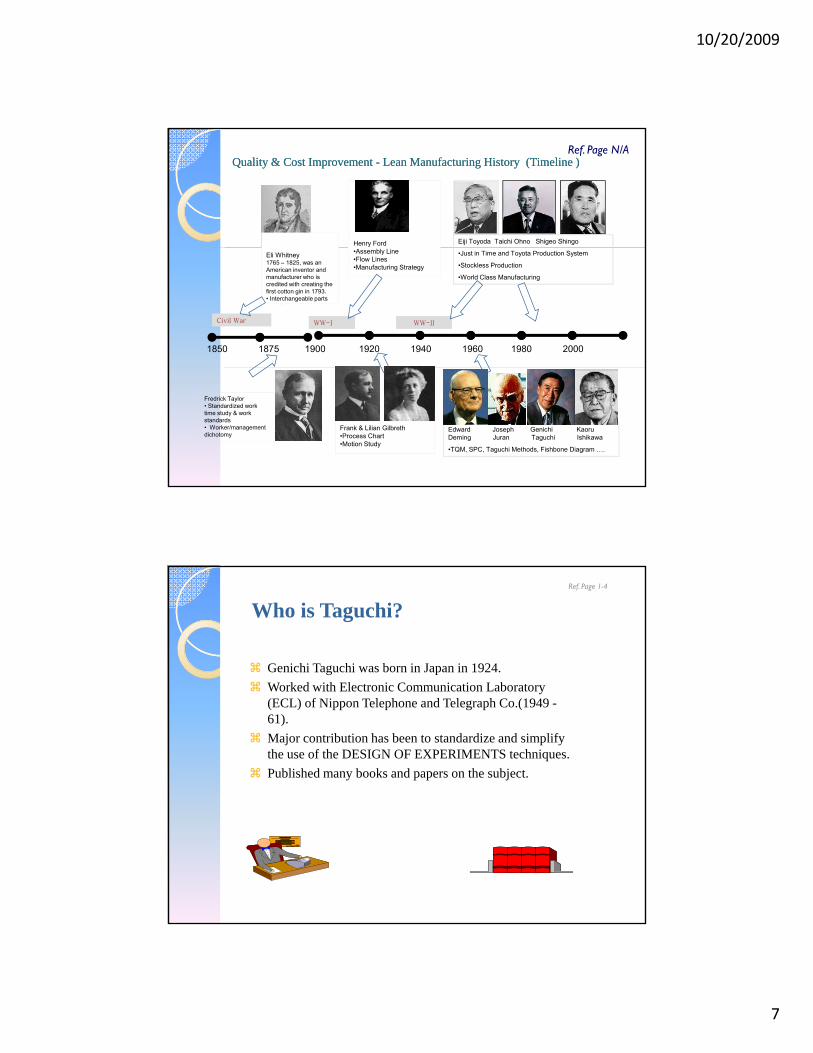
Quality & Cost Improvement Quality & Cost Improvement -- Lean Manufacturing History (Timeline )Lean Manufacturing History (Timeline )
Henry Ford Eiji Toyoda Taichi Ohno Shigeo Shingo
Ref. Page N/A
1850 1875 1900 1920 1940 1960 1980 2000
WW-I WW-IICivil War
Eli Whitney1765 – 1825, was an American inventor and manufacturer who is credited with creating the first cotton gin in 1793. • Interchangeable parts
•Assembly Line•Flow Lines•Manufacturing Strategy
•Just in Time and Toyota Production System
•Stockless Production
•World Class Manufacturing
Fredrick Taylor• Standardized work time study & work standards• Worker/management dichotomy
Frank & Lilian Gilbreth•Process Chart•Motion Study
Edward Joseph Genichi Kaoru Deming Juran Taguchi Ishikawa
•TQM, SPC, Taguchi Methods, Fishbone Diagram ….
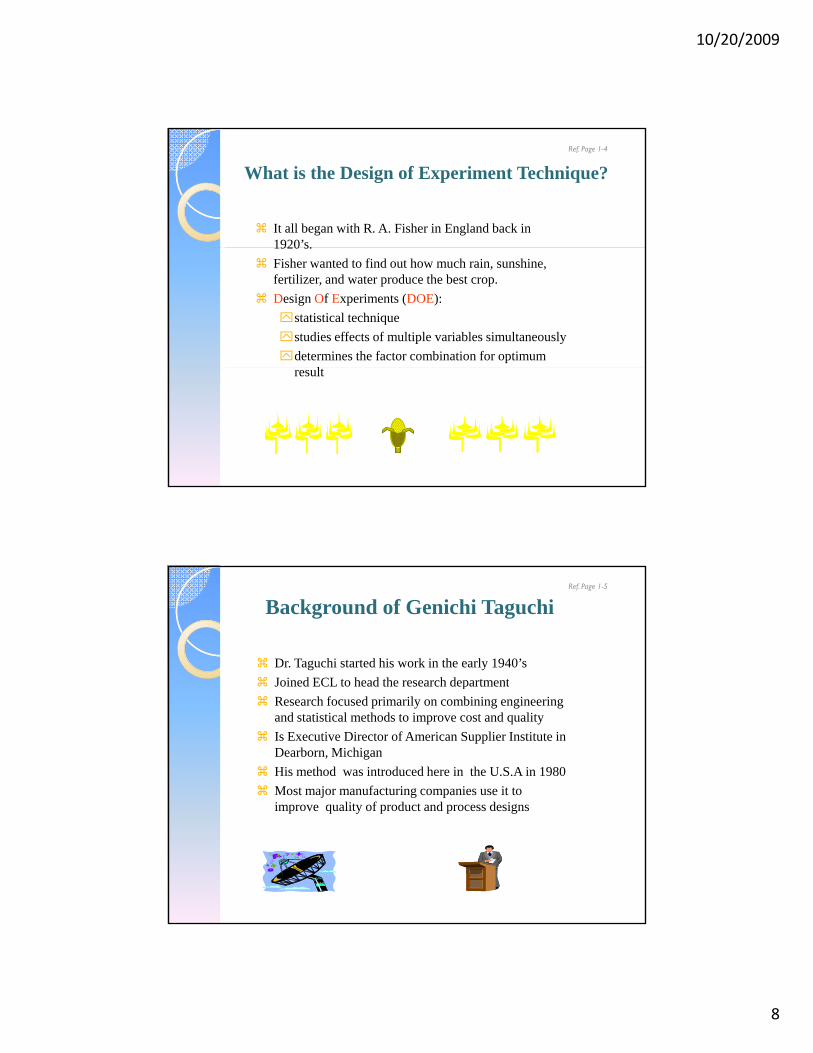
Genichi Taguchi was born in Japan in 1924.W k d ith El t i C i ti L b t
Who is Taguchi?Ref. Page 1-4
Worked with Electronic Communication Laboratory (ECL) of Nippon Telephone and Telegraph Co.(1949 -61). Major contribution has been to standardize and simplify the use of the DESIGN OF EXPERIMENTS techniques. Published many books and papers on the subject.
10/20/2009
8
It all began with R. A. Fisher in England back in 1920’s.
What is the Design of Experiment Technique?Ref. Page 1-4
1920 s.Fisher wanted to find out how much rain, sunshine, fertilizer, and water produce the best crop.Design Of Experiments (DOE):
statistical technique studies effects of multiple variables simultaneouslydetermines the factor combination for optimum
lresult
Dr. Taguchi started his work in the early 1940’s Joined ECL to head the research department
Background of Genichi TaguchiRef. Page 1-5
Joined ECL to head the research departmentResearch focused primarily on combining engineering and statistical methods to improve cost and qualityIs Executive Director of American Supplier Institute in Dearborn, Michigan His method was introduced here in the U.S.A in 1980Most major manufacturing companies use it to i lit f d t d d iimprove quality of product and process designs
10/20/2009
9
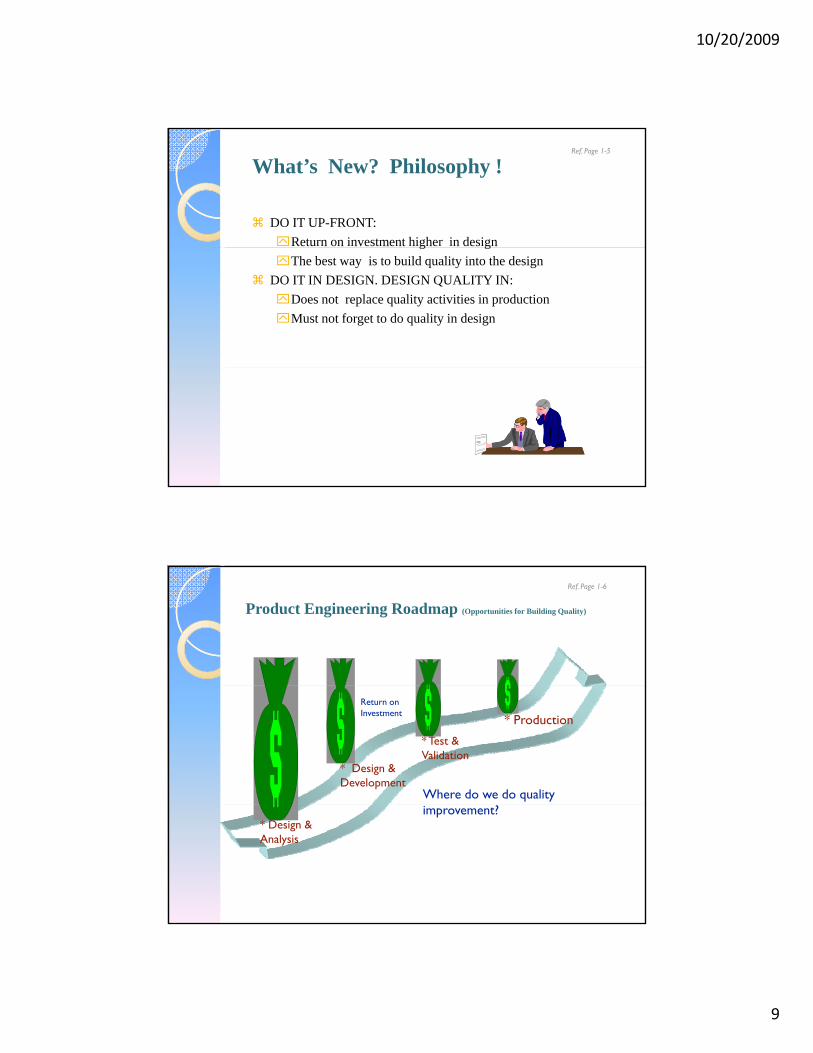
DO IT UP-FRONT: Return on investment higher in design
What’s New? Philosophy !Ref. Page 1-5
g gThe best way is to build quality into the design
DO IT IN DESIGN. DESIGN QUALITY IN:Does not replace quality activities in productionMust not forget to do quality in design
Product Engineering Roadmap (Opportunities for Building Quality)
Ref. Page 1-6
Where do we do quality
* Design & Development
* Test & Validation
* ProductionReturn on Investment
improvement?* Design & Analysis
10/20/2009
10
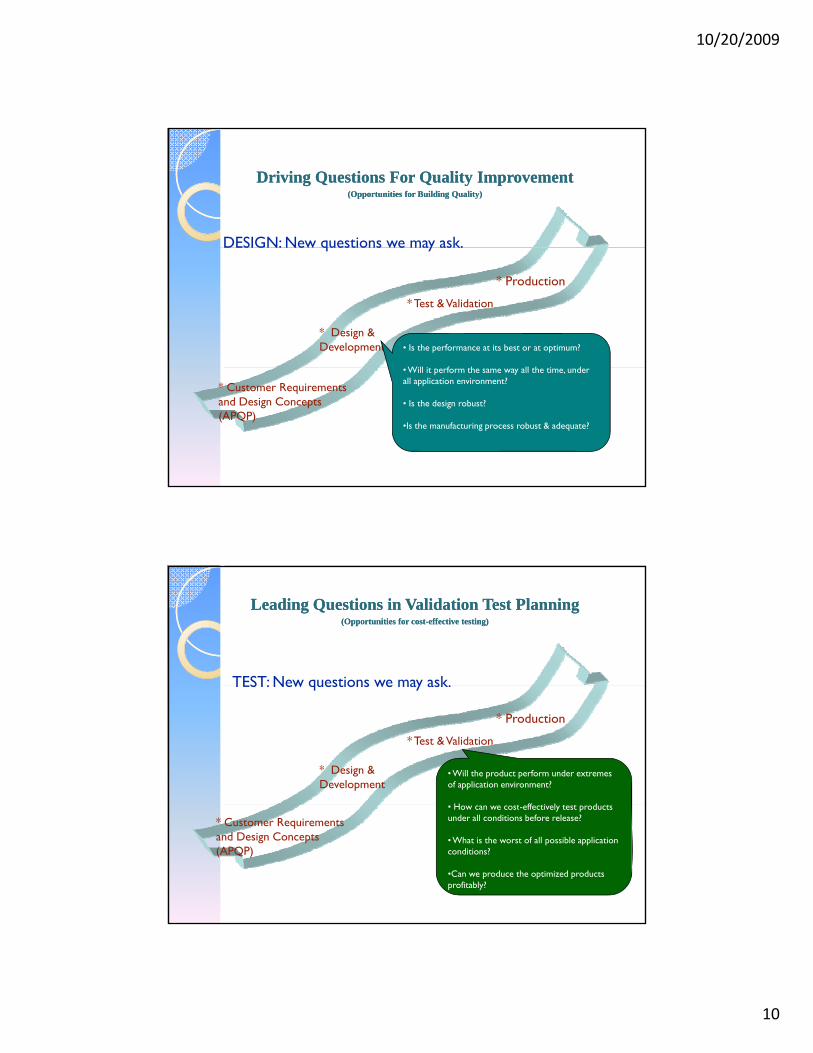
Driving Questions For Quality ImprovementDriving Questions For Quality Improvement(Opportunities for Building Quality)(Opportunities for Building Quality)
DESIGN: New questions we may ask.
* Design & Development
* Test & Validation
* Production
• Is the performance at its best or at optimum?
Will i f h ll h i d
DESIGN: New questions we may ask.
* Customer Requirements and Design Concepts (APQP)
• Will it perform the same way all the time, under all application environment?
• Is the design robust?
•Is the manufacturing process robust & adequate?
Leading Questions in Validation Test PlanningLeading Questions in Validation Test Planning(Opportunities for cost(Opportunities for cost--effective testing)effective testing)
TEST: New questions we may ask
* Design & Development
* Test & Validation
* Production
• Will the product perform under extremes of application environment?
H t ff ti l t t d t
TEST: New questions we may ask.
* Customer Requirements and Design Concepts (APQP)
• How can we cost-effectively test products under all conditions before release?
• What is the worst of all possible application conditions?
•Can we produce the optimized products profitably?
10/20/2009
11
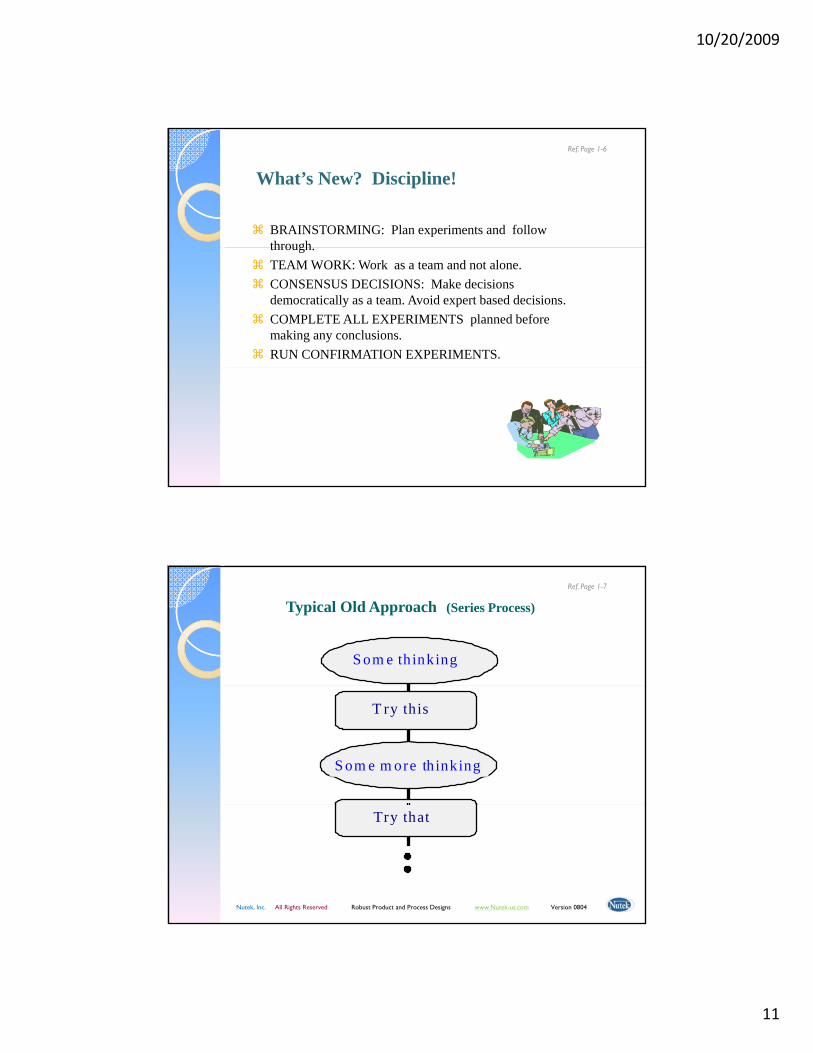
BRAINSTORMING: Plan experiments and follow through
What’s New? Discipline!
Ref. Page 1-6
through.TEAM WORK: Work as a team and not alone.CONSENSUS DECISIONS: Make decisions democratically as a team. Avoid expert based decisions.COMPLETE ALL EXPERIMENTS planned before making any conclusions.RUN CONFIRMATION EXPERIMENTS.
S om e th inking
Typical Old Approach (Series Process)
Ref. Page 1-7
S om e m ore thinking
T ry this
Nutek, Inc. All Rights Reserved Robust Product and Process Designs www.Nutek-us.com Version 0804
Try that
10/20/2009
12
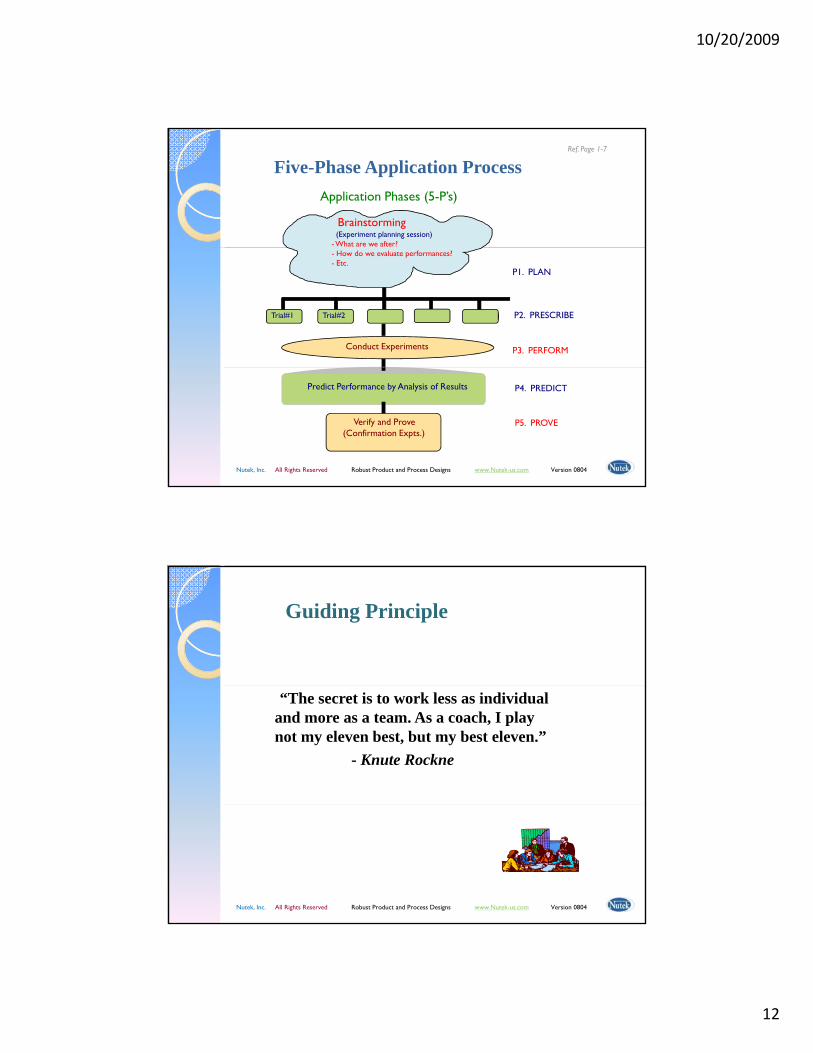
Brainstorming
Application Phases (5-P’s)
(Experiment planning session)- What are we after?
Five-Phase Application ProcessRef. Page 1-7
Trial#1 Trial#2
P1. PLAN
P2. PRESCRIBE
P3. PERFORMConduct Experiments
- How do we evaluate performances?- Etc.
Nutek, Inc. All Rights Reserved Robust Product and Process Designs www.Nutek-us.com Version 0804
Predict Performance by Analysis of Results P4. PREDICT
P5. PROVEVerify and Prove (Confirmation Expts.)
Guiding Principle
“The secret is to work less as individual and more as a team. As a coach, I play not my eleven best, but my best eleven.”
- Knute Rockne
Nutek, Inc. All Rights Reserved Robust Product and Process Designs www.Nutek-us.com Version 0804
10/20/2009
13
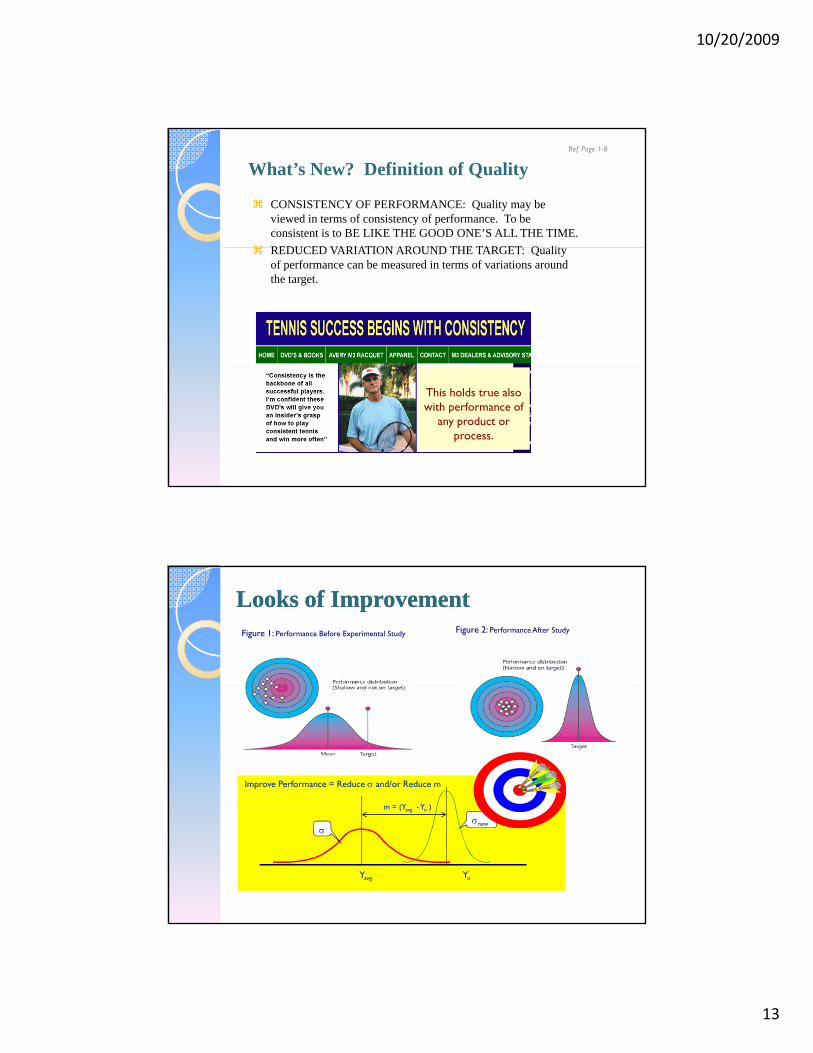
CONSISTENCY OF PERFORMANCE: Quality may be viewed in terms of consistency of performance. To be consistent is to BE LIKE THE GOOD ONE’S ALL THE TIME. REDUCED VARIATION AROUND THE TARGET Q lit
What’s New? Definition of QualityRef. Page 1-8
REDUCED VARIATION AROUND THE TARGET: Quality of performance can be measured in terms of variations around the target.
This holds true also with performance of
any product or process.
Looks of ImprovementLooks of ImprovementFigure 1: Performance Before Experimental Study Figure 2: Performance After Study
(Y Y )
Improve Performance = Reduce σ and/or Reduce m
m = (Yavg -Yo )
Yavg. Yo
σσnew
10/20/2009
14
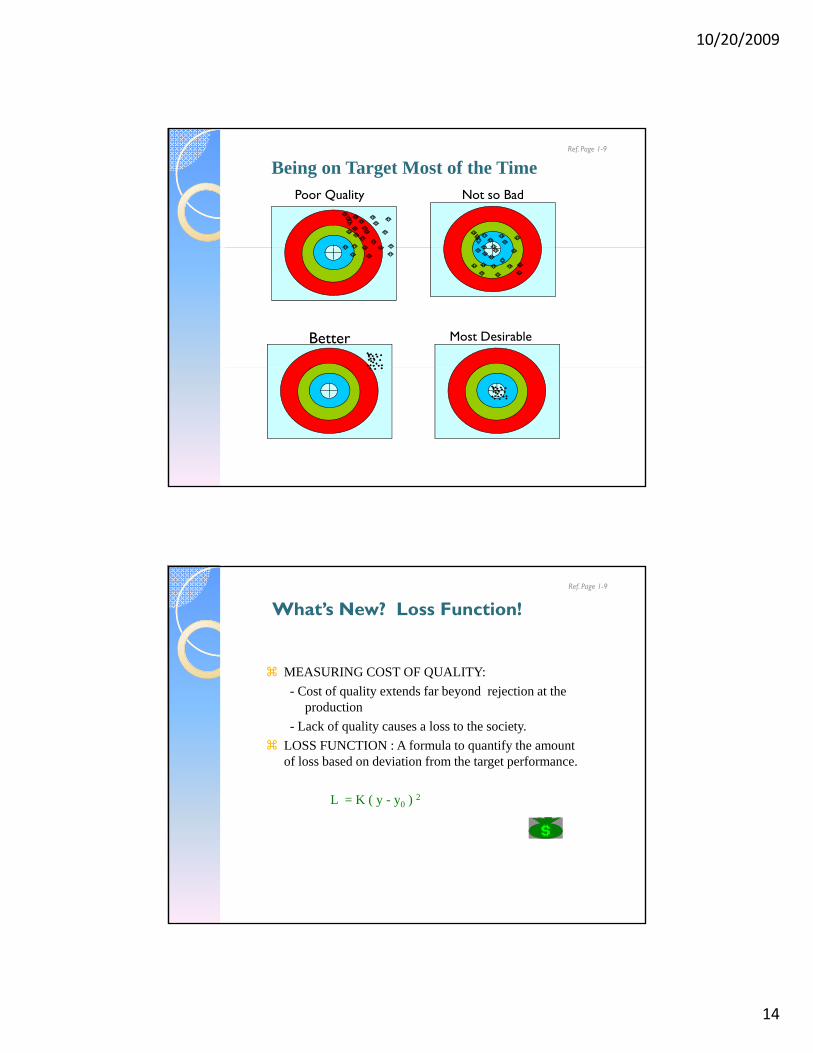
Poor Quality Not so Bad
Being on Target Most of the Time Ref. Page 1-9
Better Most Desirable
MEASURING COST OF QUALITY:
What’s New? Loss Function!Ref. Page 1-9
- Cost of quality extends far beyond rejection at the production
- Lack of quality causes a loss to the society. LOSS FUNCTION : A formula to quantify the amount of loss based on deviation from the target performance.
L = K ( y - y0 ) 2( y y0 )
10/20/2009
15
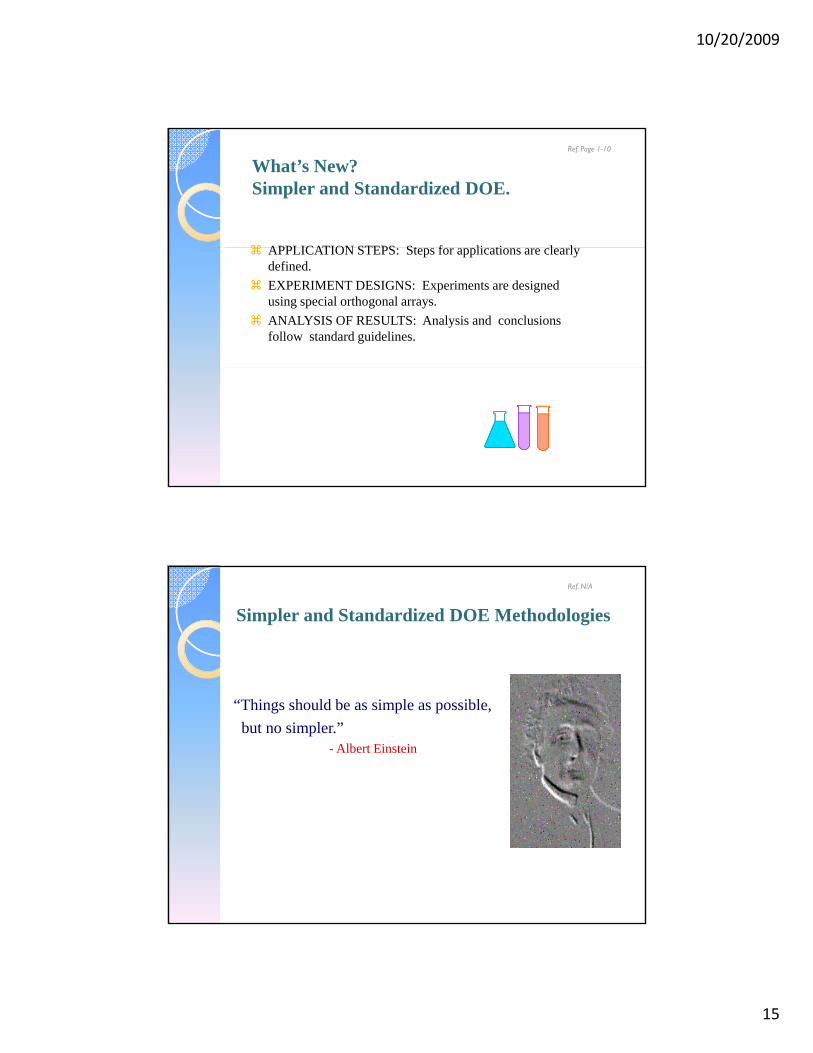
APPLICATION STEPS St f li ti l l
What’s New? Simpler and Standardized DOE.
Ref. Page 1-10
APPLICATION STEPS: Steps for applications are clearly defined.EXPERIMENT DESIGNS: Experiments are designed using special orthogonal arrays.ANALYSIS OF RESULTS: Analysis and conclusions follow standard guidelines.
Simpler and Standardized DOE Methodologies
Ref. N/A
“Things should be as simple as possible, but no simpler.”
- Albert Einstein

10/20/2009
16
PARAMETER DESIGN: Taguchi approach generally refers to the parameter design phase of the three quality engineering
DOE - the Taguchi Approach - Seminar ContentsRef. Page 1-11
the parameter design phase of the three quality engineering activities (SYSTEM DESIGN, PARAMETER DESIGN and TOLERANCE DESIGN) proposed by Taguchi.Off-line Quality Control Quality Loss FunctionSignal To Noise Ratio(s/n) For AnalysisReduced Variability, a Measure Of Quality
EXAMPLE APPLICATIONIt is an experimental technique that determines the solution
How Does DOE Technique Work?
Ref. Page 1-11
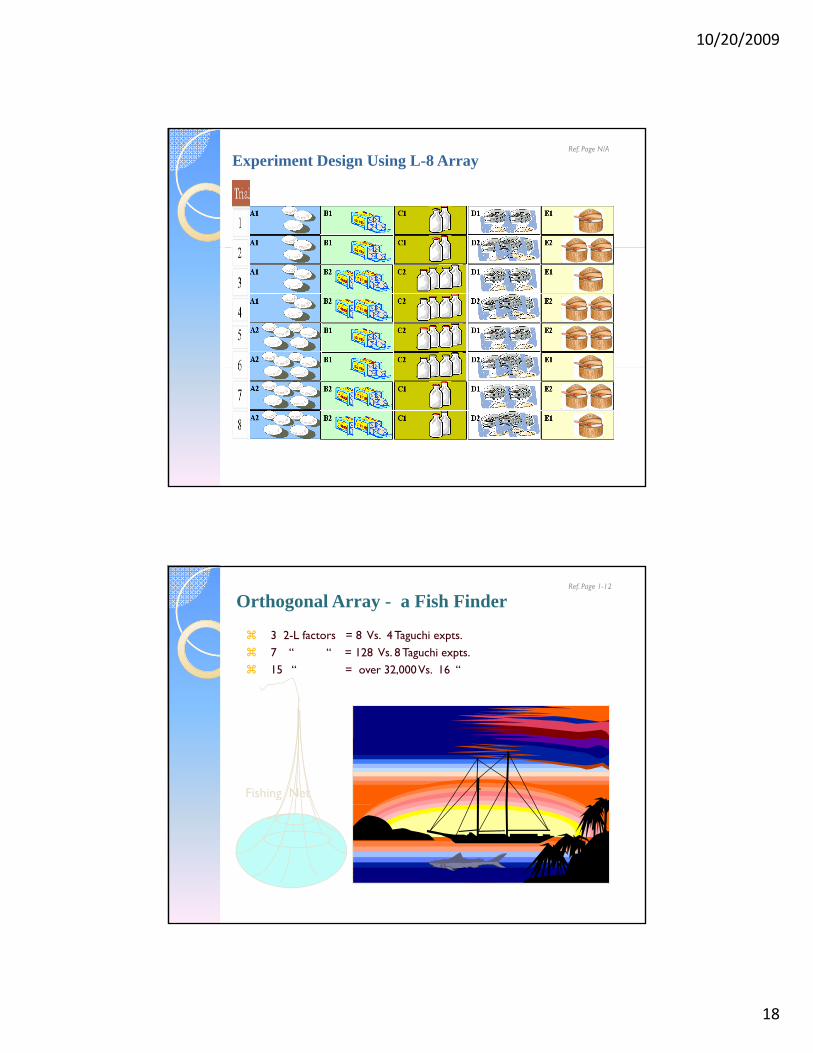
It is an experimental technique that determines the solution with minimum effort.In a POUND CAKE baking process with 5 ingredients, and with options to take HIGH and LOW values of each, it can determine the recipe with only 8 experiments. Full factorial calls for 32 experiments. Taguchi approach requires only 8
10/20/2009
17
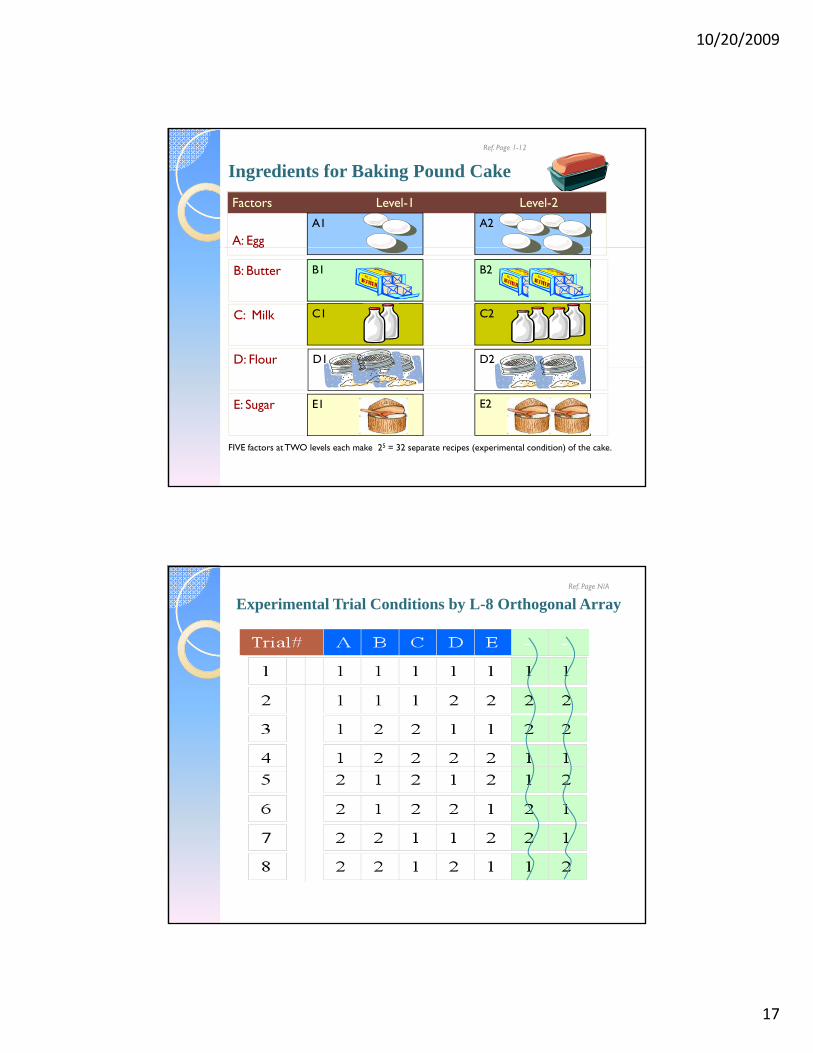
Ingredients for Baking Pound CakeFactors Level-1 Level-2
A: EggA2A1
Ref. Page 1-12
gg
B: Butter
C: Milk
D: Flour
B1 B2
C1 C2
D2D1
FIVE factors at TWO levels each make 25 = 32 separate recipes (experimental condition) of the cake.
E: Sugar E1 E2
Experimental Trial Conditions by L-8 Orthogonal ArrayRef. Page N/A
10/20/2009
18
Experiment Design Using L-8 ArrayRef. Page N/A
3 2-L factors = 8 Vs. 4 Taguchi expts.7 ‘‘ ‘‘ = 128 Vs. 8 Taguchi expts.15 ‘‘ = over 32,000 Vs. 16 ‘‘
Orthogonal Array - a Fish FinderRef. Page 1-12
Fishing Net
10/20/2009
19
Standardized application and data analysis
Benefits of the Taguchi DOE?
Ref. Page 1-12
Higher probability of successOption to confirm predicted improvementImprovement quantified in terms of dollars
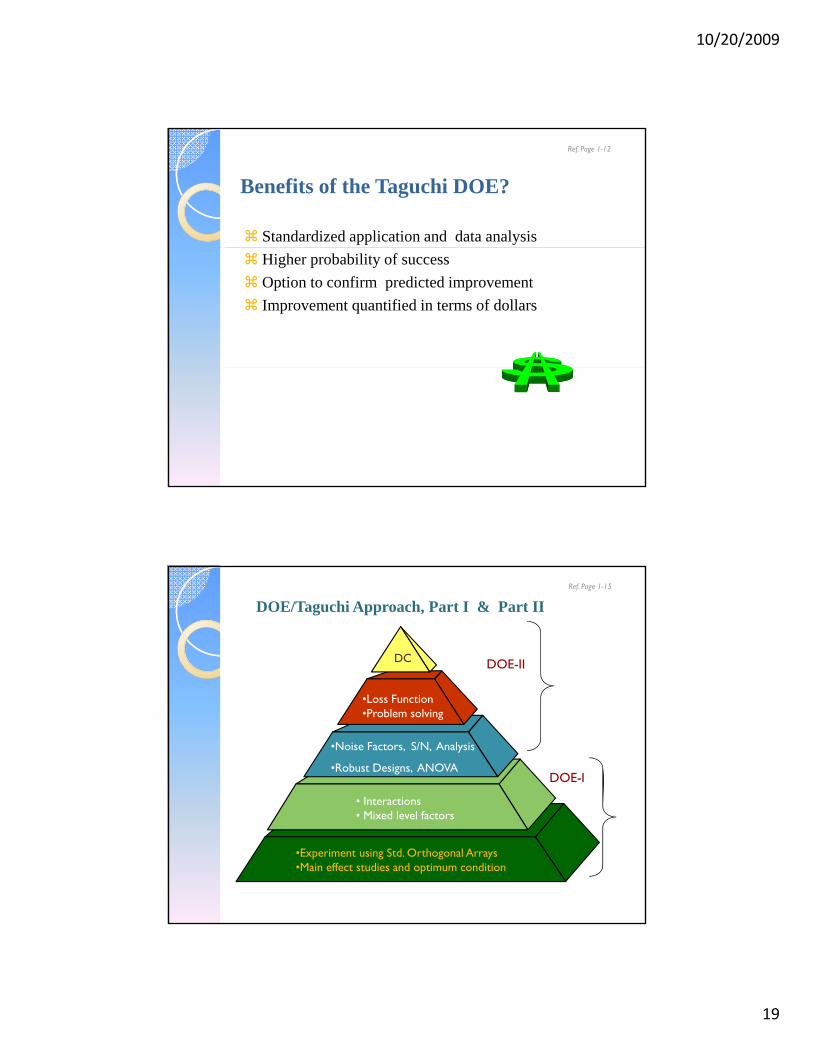
DC DOE-II
DOE/Taguchi Approach, Part I & Part IIRef. Page 1-15
• Interactions
•Loss Function •Problem solving
•Noise Factors, S/N, Analysis
•Robust Designs, ANOVADOE-I
•Experiment using Std. Orthogonal Arrays•Main effect studies and optimum condition
Interactions• Mixed level factors
10/20/2009
20
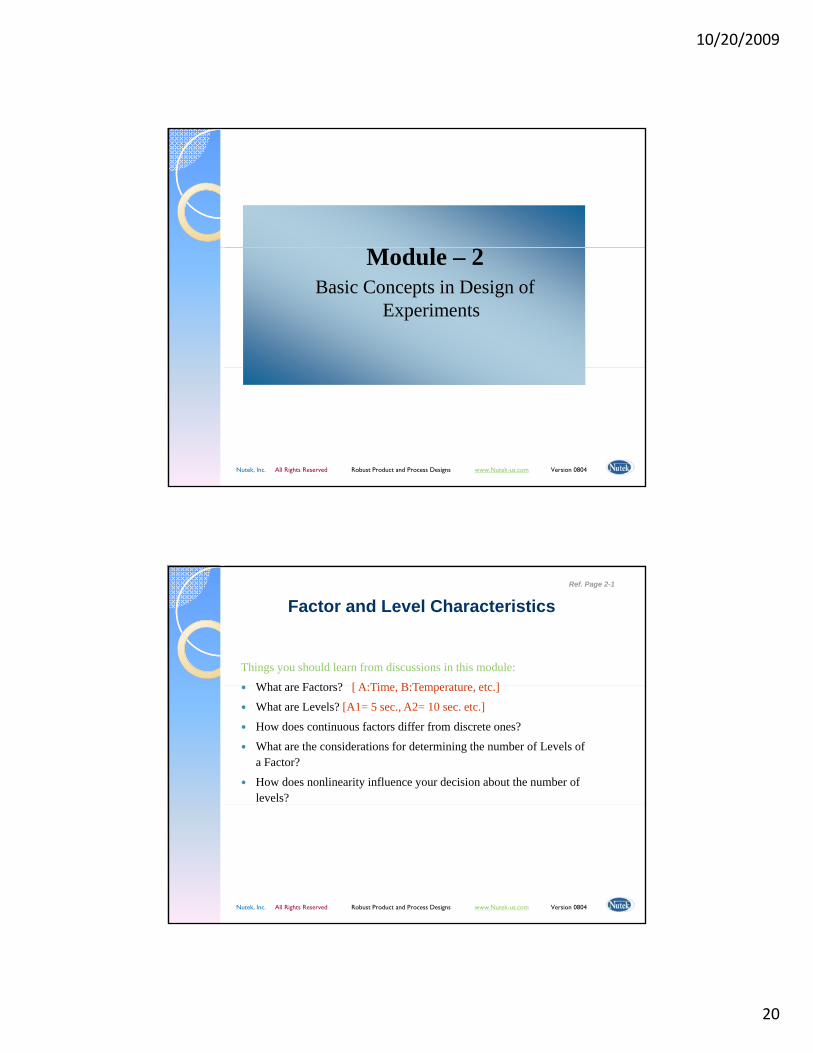
Module – 2Basic Concepts in Design of
Experiments
Nutek, Inc. All Rights Reserved Robust Product and Process Designs www.Nutek-us.com Version 0804
Things you should learn from discussions in this module:
Wh t F t ? [ A Ti B T t t ]
Factor and Level Characteristics Ref. Page 2-1
What are Factors? [ A:Time, B:Temperature, etc.]
What are Levels? [A1= 5 sec., A2= 10 sec. etc.]
How does continuous factors differ from discrete ones?
What are the considerations for determining the number of Levels of a Factor?
How does nonlinearity influence your decision about the number of levels?
Nutek, Inc. All Rights Reserved Robust Product and Process Designs www.Nutek-us.com Version 0804
10/20/2009
21
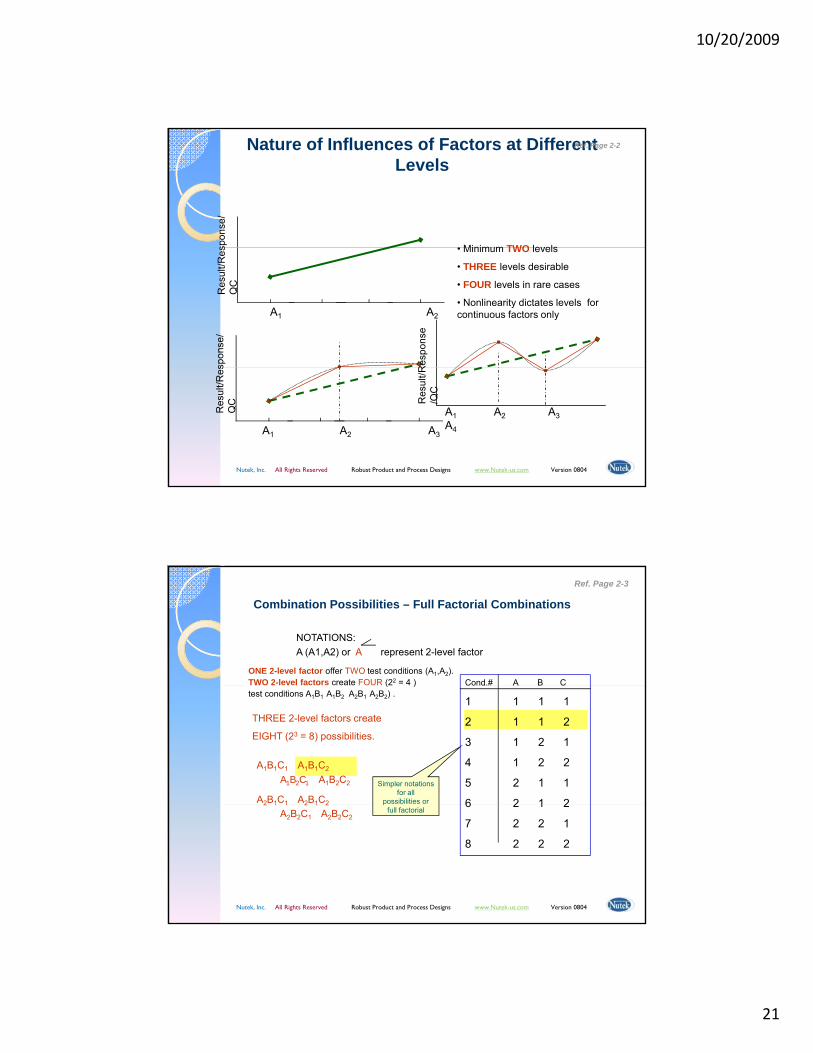
Nature of Influences of Factors at Different Levels
spon
se/
• Minimum TWO levels
Ref. Page 2-2
Res
ult/R
esQ
C
A1 A2 A3 A2
spon
se/
Res
pons
e
• Minimum TWO levels
• THREE levels desirable
• FOUR levels in rare cases
• Nonlinearity dictates levels for continuous factors only
Nutek, Inc. All Rights Reserved Robust Product and Process Designs www.Nutek-us.com Version 0804
Res
ult/R
esQ
C
A1 A2 A3R
esul
t/R/Q
C
A1 A2 A3 A4
Combination Possibilities – Full Factorial Combinations
ONE 2-level factor offer TWO test conditions (A1,A2).TWO 2-level factors create FOUR (22 = 4 )
NOTATIONS:A (A1,A2) or A represent 2-level factor
Cond.# A B C
Ref. Page 2-3
TWO 2 level factors create FOUR (2 4 ) test conditions A1B1 A1B2 A2B1 A2B2) .
THREE 2-level factors create
EIGHT (23 = 8) possibilities.
A1B1C1 A1B1C2
A1B2C1 A1B2C2
A2B1C1 A2B1C2
Simpler notations for all
possibilities or
Cond.# A B C
1 1 1 1
2 1 1 2
3 1 2 1
4 1 2 2
5 2 1 1
6 2 1 2
Nutek, Inc. All Rights Reserved Robust Product and Process Designs www.Nutek-us.com Version 0804
2 1 1 2 1 2
A2B2C1 A2B2C2
pfull factorial
6 2 1 2
7 2 2 1
8 2 2 2
10/20/2009
22
3 Factors at 2 le el 23 8
Full Factorial Experiments Based on Factors and Levels
Ref. Page 2-4
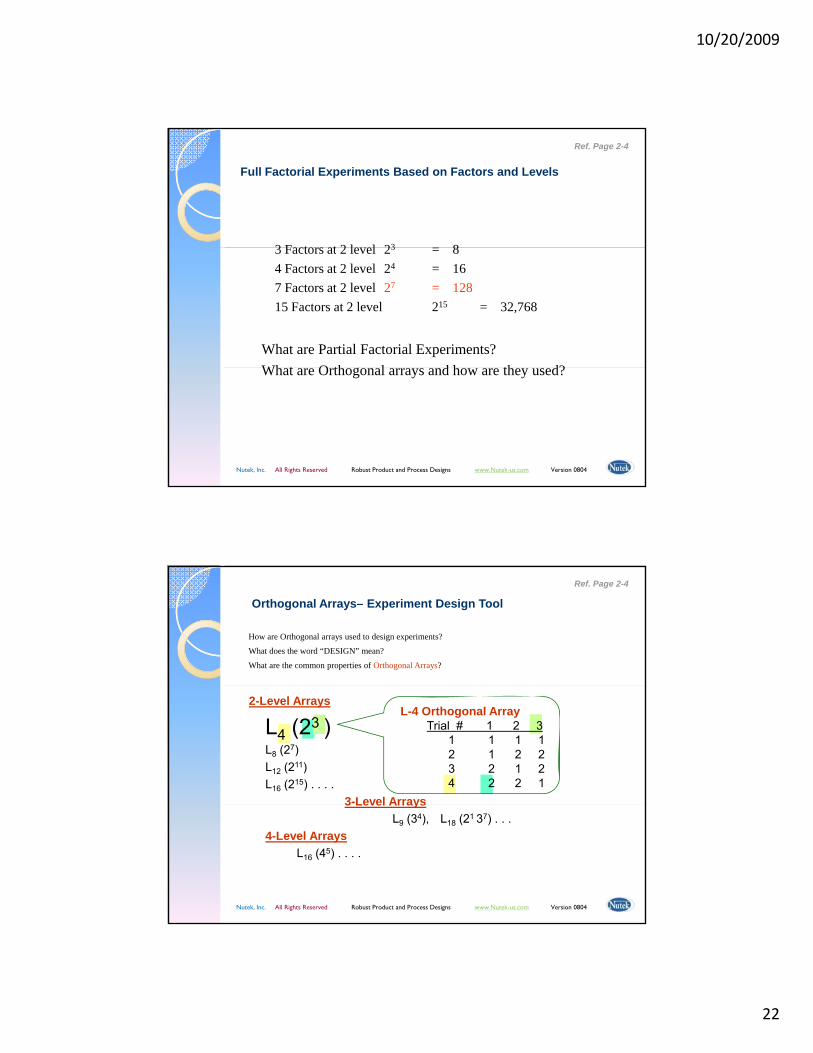
3 Factors at 2 level 23 = 84 Factors at 2 level 24 = 167 Factors at 2 level 27 = 12815 Factors at 2 level 215 = 32,768
What are Partial Factorial Experiments?Wh t O th l d h th d?
Nutek, Inc. All Rights Reserved Robust Product and Process Designs www.Nutek-us.com Version 0804
What are Orthogonal arrays and how are they used?
How are Orthogonal arrays used to design experiments?
What does the word “DESIGN” mean?
What are the common properties of Orthogonal Arrays?
Orthogonal Arrays– Experiment Design Tool
Ref. Page 2-4
2-Level Arrays
L4 (23 )L8 (27)L12 (211)L16 (215) . . . .
3-Level Arrays
L-4 Orthogonal ArrayTrial # 1 2 3
1 1 1 12 1 2 23 2 1 2 4 2 2 1
Nutek, Inc. All Rights Reserved Robust Product and Process Designs www.Nutek-us.com Version 0804
3 Level ArraysL9 (34), L18 (21 37) . . .
4-Level ArraysL16 (45) . . . .
10/20/2009
23
L-4 Orthogonal ArrayTrial #A B C1 1 1 12 1 2 23 2 1 2
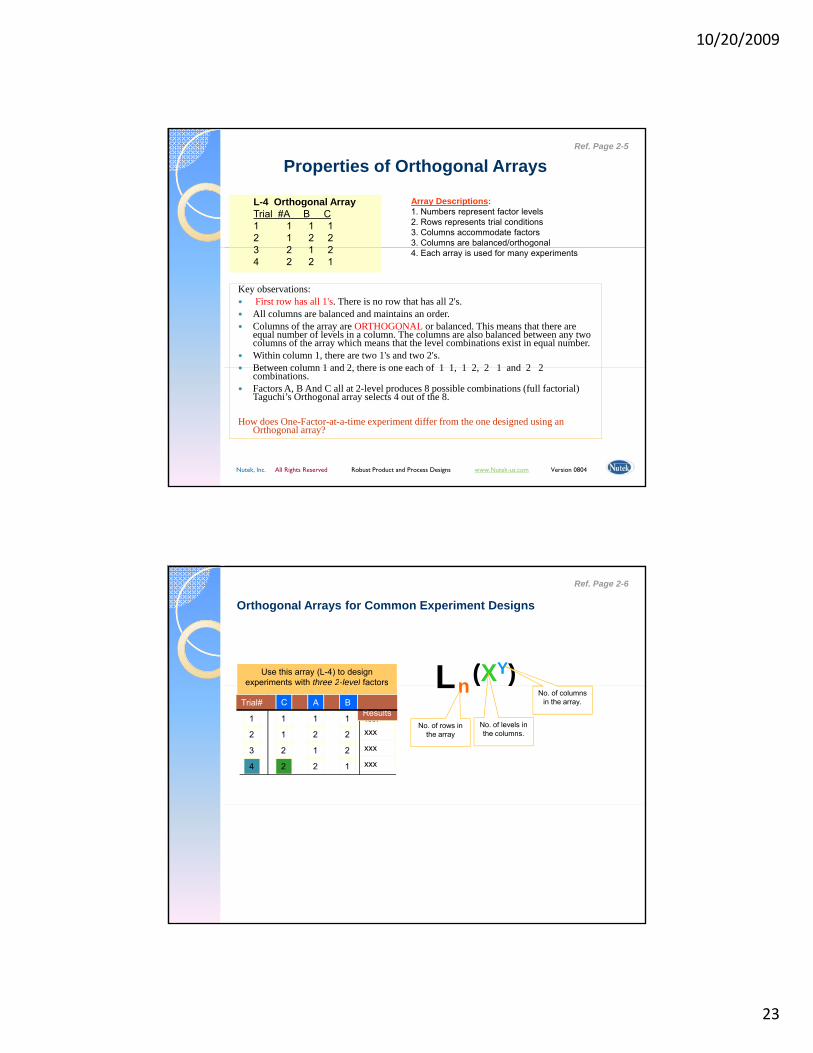
Array Descriptions:1. Numbers represent factor levels2. Rows represents trial conditions3. Columns accommodate factors 3. Columns are balanced/orthogonal
Properties of Orthogonal ArraysRef. Page 2-5
Key observations: First row has all 1's. There is no row that has all 2's. All columns are balanced and maintains an order. Columns of the array are ORTHOGONAL or balanced. This means that there are equal number of levels in a column. The columns are also balanced between any two columns of the array which means that the level combinations exist in equal number. Within column 1, there are two 1's and two 2's. Between column 1 and 2 there is one each of 1 1 1 2 2 1 and 2 2
3 2 1 2 4 2 2 1
4. Each array is used for many experiments
Nutek, Inc. All Rights Reserved Robust Product and Process Designs www.Nutek-us.com Version 0804
Between column 1 and 2, there is one each of 1 1, 1 2, 2 1 and 2 2 combinations. Factors A, B And C all at 2-level produces 8 possible combinations (full factorial) Taguchi’s Orthogonal array selects 4 out of the 8.
How does One-Factor-at-a-time experiment differ from the one designed using an Orthogonal array?
Orthogonal Arrays for Common Experiment Designs
L (XY)nUse this array (L-4) to design
experiments with three 2-level factors
Ref. Page 2-6
L ( )n
No. of rows in the array
No. of levels in the columns.
No. of columns in the array.
e pe e ts t t ee e e acto s
1
1
2
2
1
2
2
1
1
2
1
2
1
2
4
3
xxxxxx
xxx
xxx
C A BTrial#Results
10/20/2009
24
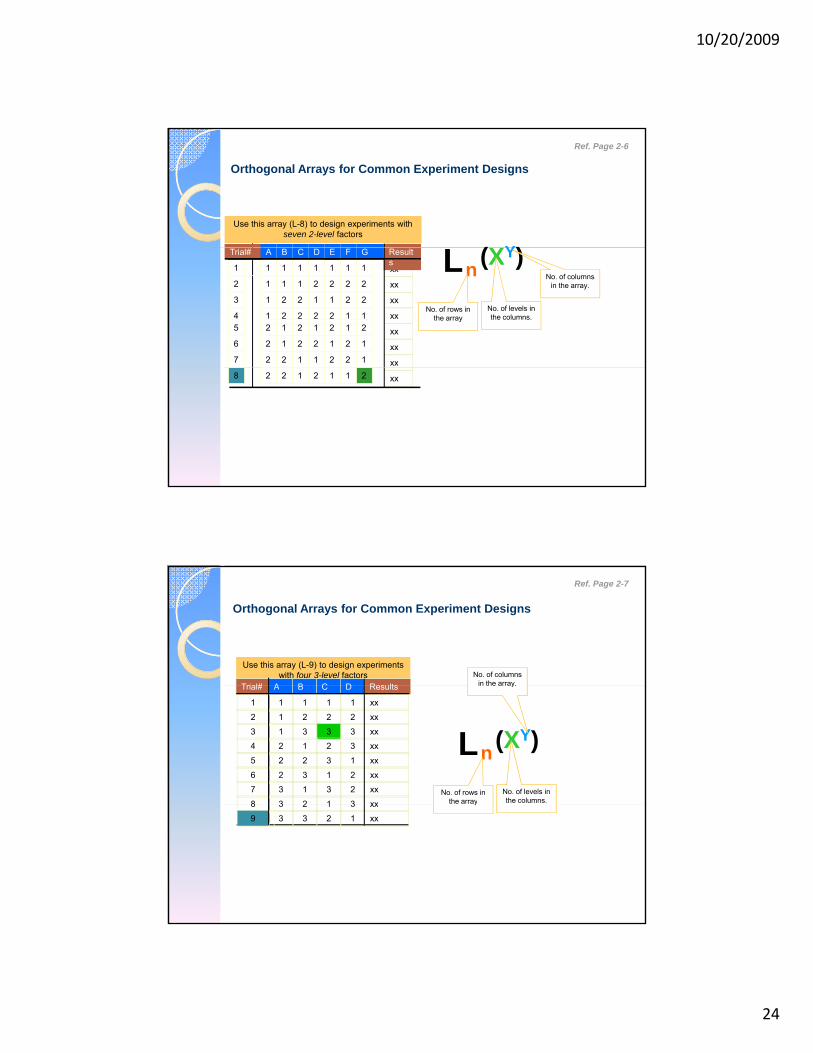
Orthogonal Arrays for Common Experiment Designs
(XY)Use this array (L-8) to design experiments with
seven 2-level factors
Ref. Page 2-6
L (XY)n
No. of rows in the array
No. of levels in the columns.
No. of columns in the array.
xx
xx
xx
xx
xx
xx
xx
1
1
1
1
2
2
2
1
2
4
3
5
6
7
1
2
1
2
2
1
1
1
1
2
2
2
2
1
1
2
2
1
1
2
1
1
2
2
1
2
1
2
1
2
1
2
1
2
2
1
1
2
2
1
1
2
Results
ETrial# A CB FD G
xx28 21 2 1 12
Orthogonal Arrays for Common Experiment Designs
No. of columns in the array.
Use this array (L-9) to design experiments with four 3-level factors
Trial# A B C D Res lts
Ref. Page 2-7
L (XY)n
No. of rows in the array
No. of levels in the columns.
in the array.Trial# A B C D Results
1 1 1 1 1 xx
2 1 2 2 2 xx
3 1 3 3 3 xx
4 2 1 2 3 xx
5 2 2 3 1 xx
6 2 3 1 2 xx
7 3 1 3 2 xx
8 3 2 1 3 xx y8 3 2 1 3 xx
9 3 3 2 1 xx
10/20/2009
25
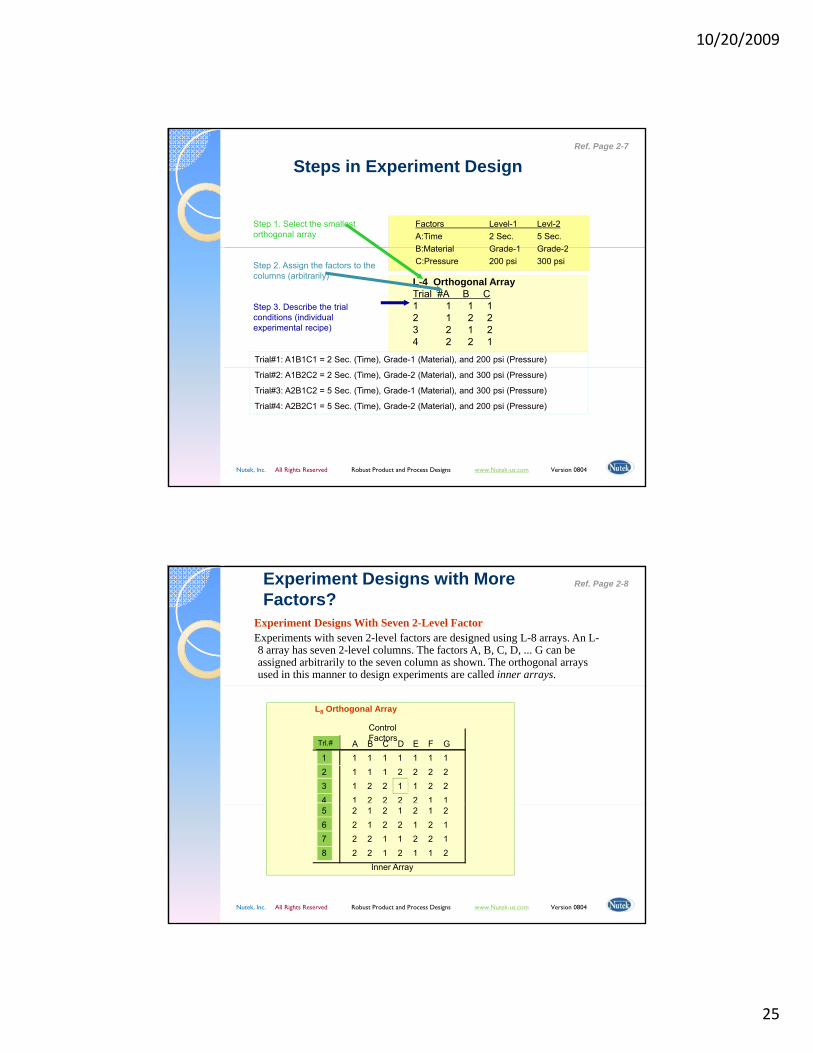
Steps in Experiment Design
Factors Level-1 Levl-2A:Time 2 Sec. 5 Sec.B:Material Grade 1 Grade 2
Step 1. Select the smallest orthogonal array
Ref. Page 2-7
B:Material Grade-1 Grade-2C:Pressure 200 psi 300 psi
L-4 Orthogonal ArrayTrial #A B C1 1 1 12 1 2 23 2 1 2 4 2 2 1
Step 2. Assign the factors to the columns (arbitrarily)
Step 3. Describe the trial conditions (individual experimental recipe)
Trial#1: A1B1C1 = 2 Sec. (Time), Grade-1 (Material), and 200 psi (Pressure)
Nutek, Inc. All Rights Reserved Robust Product and Process Designs www.Nutek-us.com Version 0804
Trial#2: A1B2C2 = 2 Sec. (Time), Grade-2 (Material), and 300 psi (Pressure)
Trial#3: A2B1C2 = 5 Sec. (Time), Grade-1 (Material), and 300 psi (Pressure)
Trial#4: A2B2C1 = 5 Sec. (Time), Grade-2 (Material), and 200 psi (Pressure)
Experiment Designs With Seven 2-Level FactorExperiments with seven 2-level factors are designed using L-8 arrays. An L-8 array has seven 2-level columns. The factors A, B, C, D, ... G can be assigned arbitrarily to the seven column as shown. The orthogonal arrays used in this manner to design experiments are called inner arrays.
Experiment Designs with More Factors?
Ref. Page 2-8
L8 Orthogonal Array
11
11
12
43
12
12
11
22
12
21
12
21
12
12
11
22
ETrl.# A CB FD G
Control Factors
Nutek, Inc. All Rights Reserved Robust Product and Process Designs www.Nutek-us.com Version 0804
22
22
56
87
21
21
22
11
12
21
21
12
12
12
11
22
Inner Array
10/20/2009
26
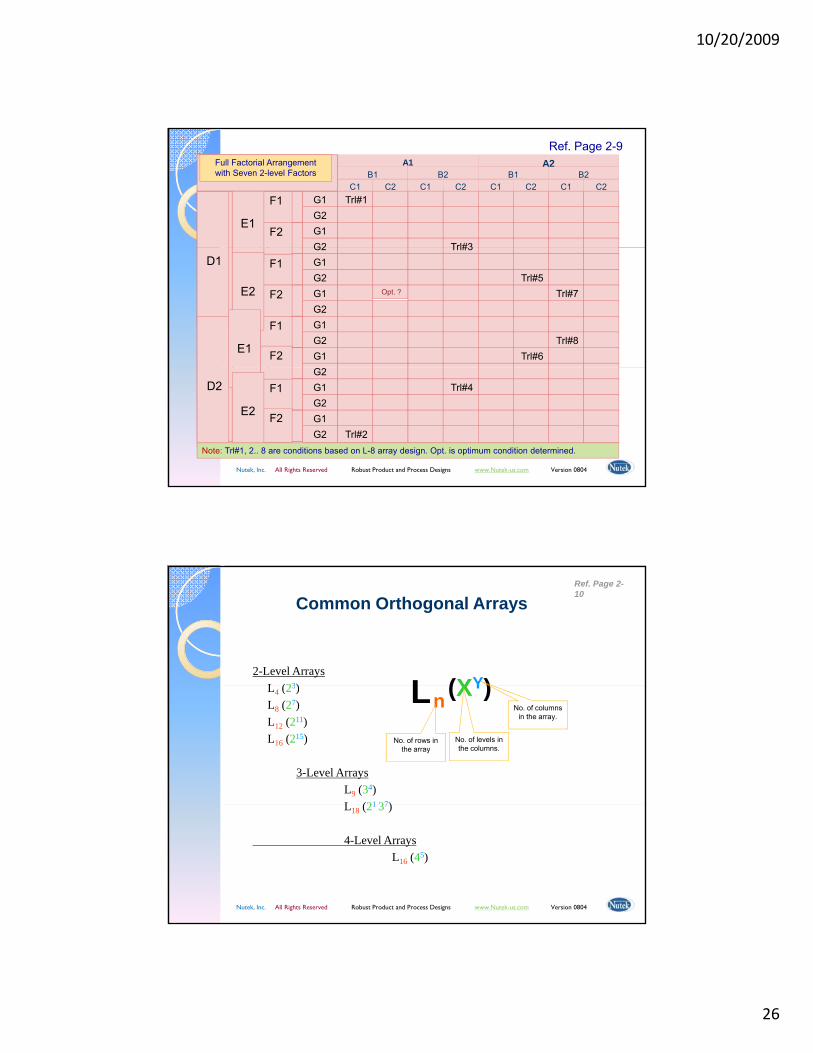
Ref. Page 2-9
C1 C2 C1 C2 C1 C2 C1 C2B1 B2
A1 A2B1 B2
G1 Trl#1G2G1G2 Trl#3
F1
F2E1
Full Factorial Arrangement with Seven 2-level Factors
G2 Trl#3G1G2 Trl#5G1 Opt. ? Trl#7G2G1G2 Trl#8G1 Trl#6
F1
F2
F1
F2
E2
E1
D1
Nutek, Inc. All Rights Reserved Robust Product and Process Designs www.Nutek-us.com Version 0804
G2G1 Trl#4G2G1G2 Trl#2
F1
F2E2
D2
Note: Trl#1, 2.. 8 are conditions based on L-8 array design. Opt. is optimum condition determined.
2-Level ArraysL (23)
Common Orthogonal Arrays
L (XY)
Ref. Page 2-10
L4 (23)L8 (27)L12 (211)L16 (215)
3-Level ArraysL9 (34)L (21 37)
L (XY)n
No. of rows in the array
No. of levels in the columns.
No. of columns in the array.
Nutek, Inc. All Rights Reserved Robust Product and Process Designs www.Nutek-us.com Version 0804
L18 (21 37)
4-Level ArraysL16 (45)

10/20/2009
27
PLANIdentify Project and Select Project Team
Define Project objectives Evaluation Criteria
Planning Before Designing ExperimentsRef. Page 2-10
Determine System Parameters (Control Factors, Noise Factors, Ideal Function, etc.)
DESIGN
Select Array and Assign Factors to the columns (inner and outer arrays)
CONDUCT EXPERIMENTS
Nutek, Inc. All Rights Reserved Robust Product and Process Designs www.Nutek-us.com Version 0804
CONDUCT EXPERIMENTS
ANALYZE RESULTS
Factor Effects, Optimum Condition, Predicted Performance, etc.
An ordinary kernel of corn, a little yellow seed, it just sits there. But add some oil, turn up the heat, and, pow. Withi d ti k
Popcorn Machine Performance Study (Example Experiment)
Ref. Page 2-11
Within a second, an aromatic snack sensation has come into being: a fat, fluffy popcorn.
Note: C. Cretors & Company in the U.S. was the first company to develop popcorn machines, about 100 years ago.
Nutek, Inc. All Rights Reserved Robust Product and Process Designs www.Nutek-us.com Version 0804
This example is used to demonstrate “cradle to grave”, mini planning, design, and analyses tasks involved in DOE.
10/20/2009
28
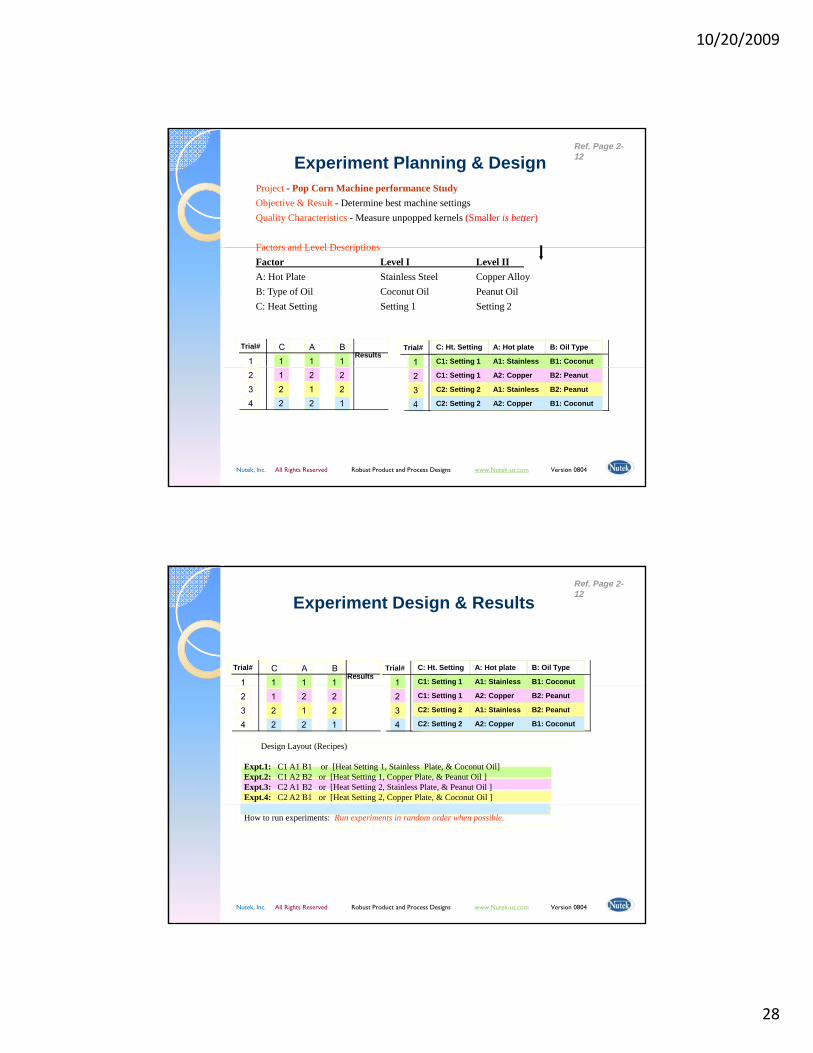
Project - Pop Corn Machine performance StudyObjective & Result - Determine best machine settingsQuality Characteristics - Measure unpopped kernels (Smaller is better)
Factors and Level Descriptions
Experiment Planning & DesignRef. Page 2-12
Factors and Level DescriptionsFactor Level I Level IIA: Hot Plate Stainless Steel Copper AlloyB: Type of Oil Coconut Oil Peanut OilC: Heat Setting Setting 1 Setting 2
1
Trial# C: Ht. Setting A: Hot plate B: Oil Type
C1: Setting 1 A1: Stainless B1: Coconut1C A B
1 11
Trial#Results
Nutek, Inc. All Rights Reserved Robust Product and Process Designs www.Nutek-us.com Version 0804
2
43
C1: Setting 1
C2: Setting 2
C2: Setting 2
A2: Copper
A1: Stainless
A2: Copper
B2: Peanut
B2: Peanut
B1: Coconut
1
22
2
21
2
12
2
43
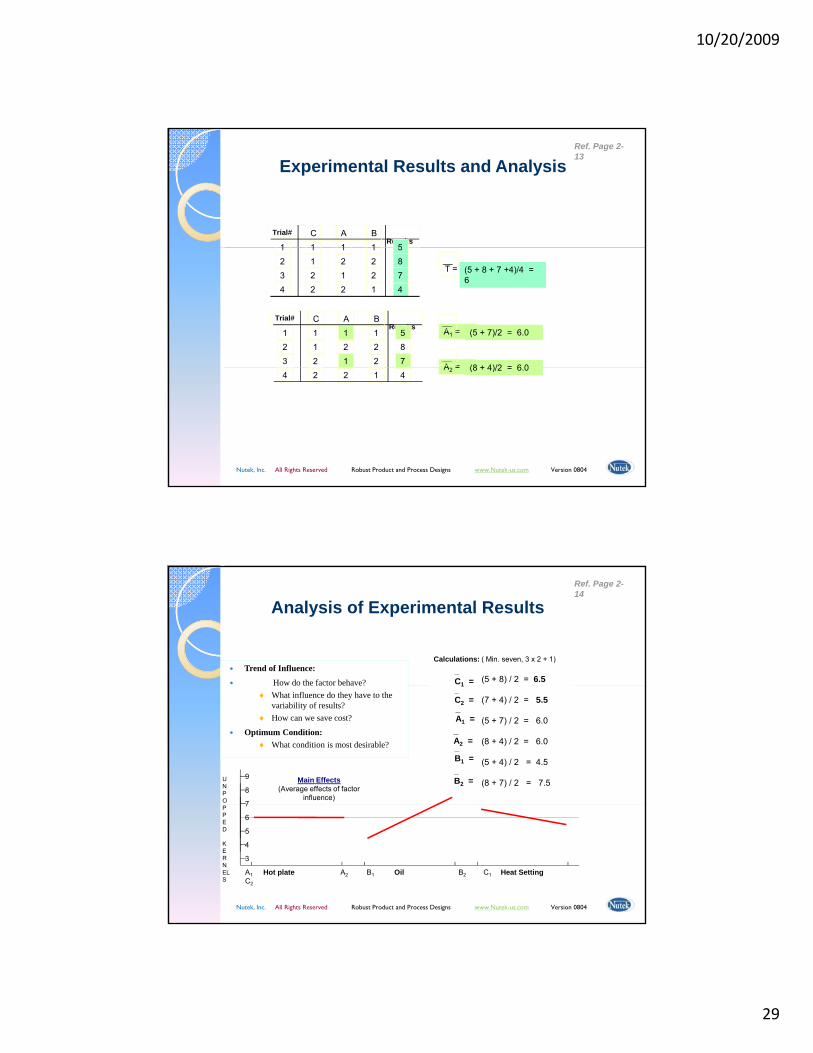
Experiment Design & Results
1
Trial# C: Ht. Setting A: Hot plate B: Oil Type
C1: Setting 1 A1: Stainless B1: Coconut1C A B
1 11
Trial#Results
Ref. Page 2-12
12
43
g
C1: Setting 1
C2: Setting 2
C2: Setting 2
A2: Copper
A1: Stainless
A2: Copper
B2: Peanut
B2: Peanut
B1: Coconut
11
22
12
21
12
12
12
43
Design Layout (Recipes)
Expt.1: C1 A1 B1 or [Heat Setting 1, Stainless Plate, & Coconut Oil]Expt.2: C1 A2 B2 or [Heat Setting 1, Copper Plate, & Peanut Oil ]Expt.3: C2 A1 B2 or [Heat Setting 2, Stainless Plate, & Peanut Oil ]Expt.4: C2 A2 B1 or [Heat Setting 2, Copper Plate, & Coconut Oil ]
Nutek, Inc. All Rights Reserved Robust Product and Process Designs www.Nutek-us.com Version 0804
How to run experiments: Run experiments in random order when possible.
10/20/2009
29
Experimental Results and Analysis
1C A B
1 11
Trial#Results
5
Ref. Page 2-13
A1 =__
(5 + 7)/2 = 6.0
11
22
12
21
12
12
12
43
58
47
__T = (5 + 8 + 7 +4)/4 =
6
112
C A B121
122
123
Trial#Results
587 A =
__(8 + 4)/2 = 6 0
Nutek, Inc. All Rights Reserved Robust Product and Process Designs www.Nutek-us.com Version 0804
2 2 14 4A2 = (8 + 4)/2 = 6.0
Trend of Influence:
How do the factor behave?
Calculations: ( Min. seven, 3 x 2 + 1)
(5 + 8) / 2 = 6.5_C1 =
Analysis of Experimental ResultsRef. Page 2-14
How do the factor behave?♦ What influence do they have to the
variability of results?♦ How can we save cost?
Optimum Condition:♦ What condition is most desirable?
(7 + 4) / 2 = 5.5
(5 + 7) / 2 = 6.0
(8 + 4) / 2 = 6.0
(5 + 4) / 2 = 4.5
(8 + 7) / 2 = 7.5
_C2 =
1
_A2 =
_A1 =
_B1 = _B2 =
7
8
9UNPO
Main Effects(Average effects of factor
influence)
Nutek, Inc. All Rights Reserved Robust Product and Process Designs www.Nutek-us.com Version 0804
A1 Hot plate A2 B1 Oil B2 C1 Heat SettingC2
3
4
6
5
7PPED
KERNELS
10/20/2009
30
Nutek I
QC Plays a key roles in:◦ Understanding factor influence ◦ Determination of the most desirable condition
Role of Quality Characteristics (QC)Ref. Page 2-14
k, Inc.www.nutek
-us.co
mAll
Rights
Reserved
Design of
Determination of the most desirable condition.
Quality Characteristics
ExamplesNominal is Best: 5” dia. Shaft,12 volt battery, etc.Smaller is Better: noise, loss, rejects, surface roughness, etc.
Nutek, Inc. All Rights Reserved Robust Product and Process Designs www.Nutek-us.com Version 0804
Experiment
s Using the
Taguchi
Approach Sep
2005
Bigger is Better: strength, efficiency, S/N ratio, Income, etc.
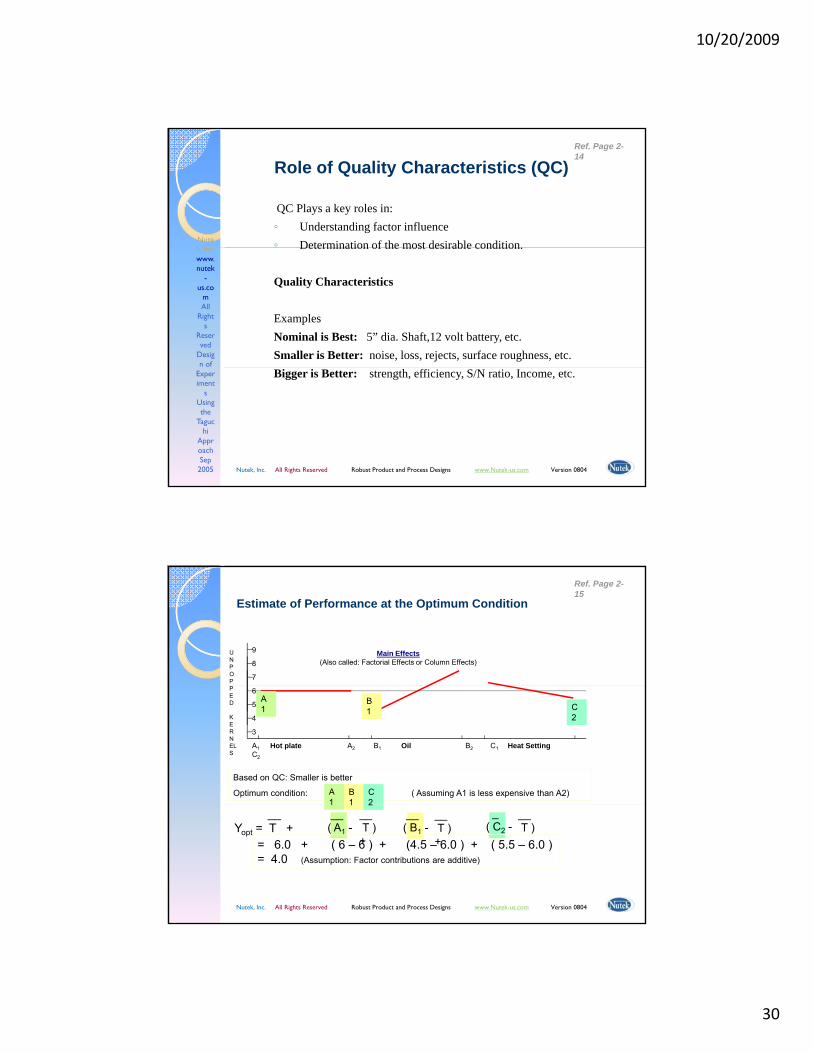
Estimate of Performance at the Optimum Condition
7
8
9UNPOP
Main Effects(Also called: Factorial Effects or Column Effects)
Ref. Page 2-15
A1 Hot plate A2 B1 Oil B2 C1 Heat SettingC2
3
4
6
5
PED
KERNELS
A1
B1 C
2
Based on QC: Smaller is better
Optimum condition: ( Assuming A1 is less expensive than A2)A1
B1
C2
Nutek, Inc. All Rights Reserved Robust Product and Process Designs www.Nutek-us.com Version 0804
1 1 2
= 6.0 + ( 6 – 6 ) + (4.5 – 6.0 ) + ( 5.5 – 6.0 )= 4.0 (Assumption: Factor contributions are additive)
__Yopt = T +
__( A1 -
_( C2 -
__T )
__( B1 -
__T ) +
__T ) +
10/20/2009
31
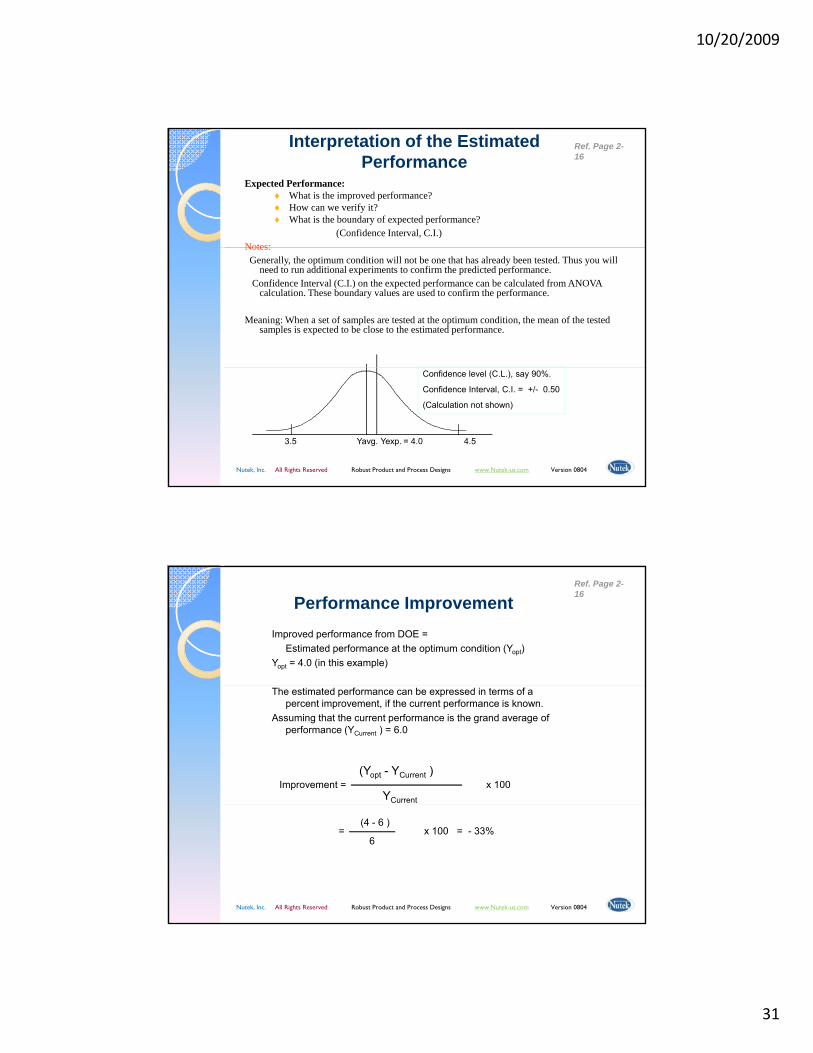
Expected Performance:♦ What is the improved performance?♦ How can we verify it?♦ What is the boundary of expected performance?
(Confidence Interval, C.I.)Notes:
Interpretation of the Estimated Performance
Ref. Page 2-16
Notes:Generally, the optimum condition will not be one that has already been tested. Thus you will
need to run additional experiments to confirm the predicted performance.Confidence Interval (C.I.) on the expected performance can be calculated from ANOVA
calculation. These boundary values are used to confirm the performance.
Meaning: When a set of samples are tested at the optimum condition, the mean of the tested samples is expected to be close to the estimated performance.
Nutek, Inc. All Rights Reserved Robust Product and Process Designs www.Nutek-us.com Version 0804
3.5 Yavg. Yexp. = 4.0 4.5
Confidence level (C.L.), say 90%.
Confidence Interval, C.I. = +/- 0.50
(Calculation not shown)
Performance ImprovementImproved performance from DOE =
Estimated performance at the optimum condition (Yopt)Yopt = 4.0 (in this example)
Ref. Page 2-16
The estimated performance can be expressed in terms of a percent improvement, if the current performance is known.
Assuming that the current performance is the grand average of performance (YCurrent ) = 6.0
Improvement = x 100(Yopt - YCurrent )
YCurrent
Nutek, Inc. All Rights Reserved Robust Product and Process Designs www.Nutek-us.com Version 0804
= x 100 = - 33%(4 - 6 )
6

10/20/2009
32
Example 1: Plastic Molding ProcessFACTORS and LEVELSA: Injection Pressure A1 = 250 psi A2 = 350 psiB: Mold Temperature B1 = 150 deg. B2 = 200 deg.
An Example ExperimentRef. Page 2-16
C: Set Time C1 = 6 sec. C2 = 9 sec.
Where did these factors and levels come from?How do you determine:
Number of factors to include in the experimentNumber of levels for each factorThe values of the levels- for 2-level factors- for 3 or 4-level factors
Nutek, Inc. All Rights Reserved Robust Product and Process Designs www.Nutek-us.com Version 0804
- for 3 or 4-level factors
The first step in every experiment must be the experiment planning discussion with the project team.
Preparation for Meeting◦ Identify Project
One that gives “the biggest bang for the buck”.
◦ Form Team (3 – 12 people)
Planning –The Essential First StepRef. Page 2-17
( p p )People with first hand knowledgeInternal customersPeople responsible for implementation
◦ Schedule and convene an all-day experiment planning meeting with the team.
Inform and prepare all for a full day of meeting.
◦ As the project leader, invite all team members to attend the planning meeting.
Nutek, Inc. All Rights Reserved Robust Product and Process Designs www.Nutek-us.com Version 0804
p j , p g gSecure commitment to attend the meetingEncourage team members to bring all project information to the meeting, but discourage any formal research or documentations.Study subject project and bring information with respect to details of system breakdown (system into sub-systems, products into components) to the meeting.
10/20/2009
33
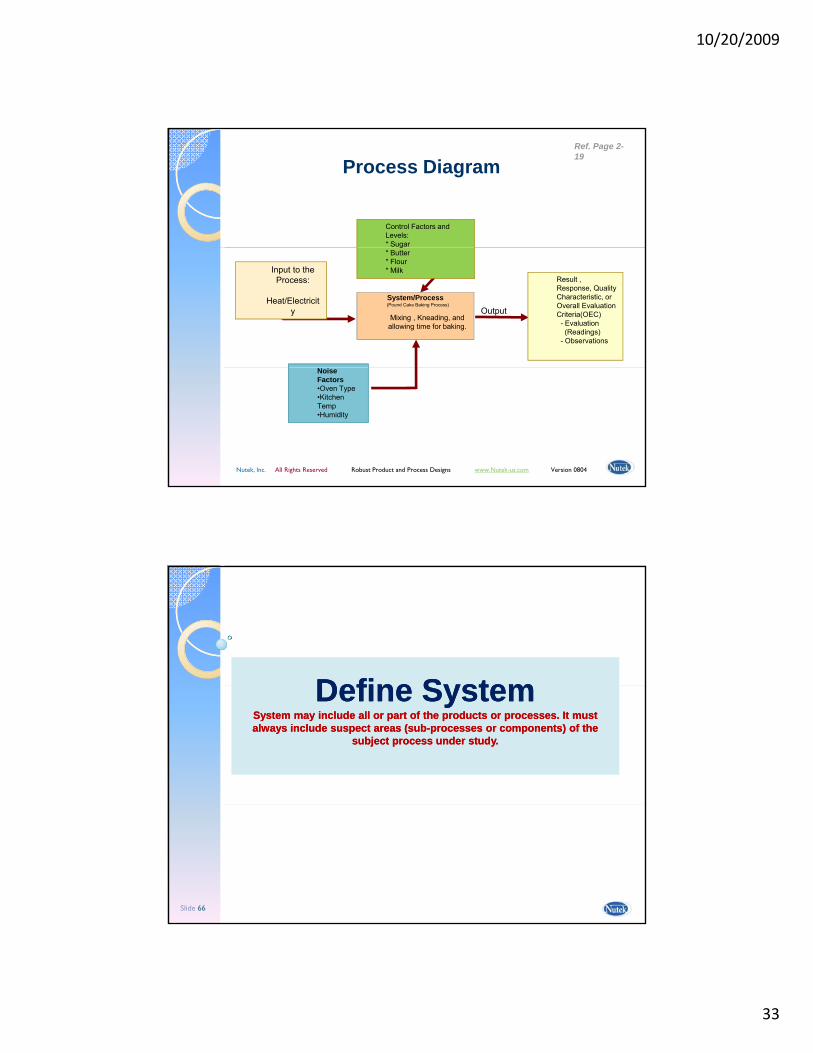
Process Diagram
Control Factors and Levels:* Sugar
Ref. Page 2-19
System/Process(Pound Cake Baking Process)
Mixing , Kneading, and allowing time for baking.
Input Output
Input to the Process:
Heat/Electricity
g* Butter* Flour* Milk
Result , Response, Quality Characteristic, or Overall Evaluation Criteria(OEC)- Evaluation(Readings)
- Observations
Nutek, Inc. All Rights Reserved Robust Product and Process Designs www.Nutek-us.com Version 0804
Noise Factors•Oven Type•Kitchen Temp•Humidity
Define SystemDefine SystemDefine SystemDefine SystemSystem may include all or part of the products or processes. It must System may include all or part of the products or processes. It must always include suspect areas (subalways include suspect areas (sub--processes or components) of the processes or components) of the
subject process under study. subject process under study.
Slide 66
10/20/2009
34
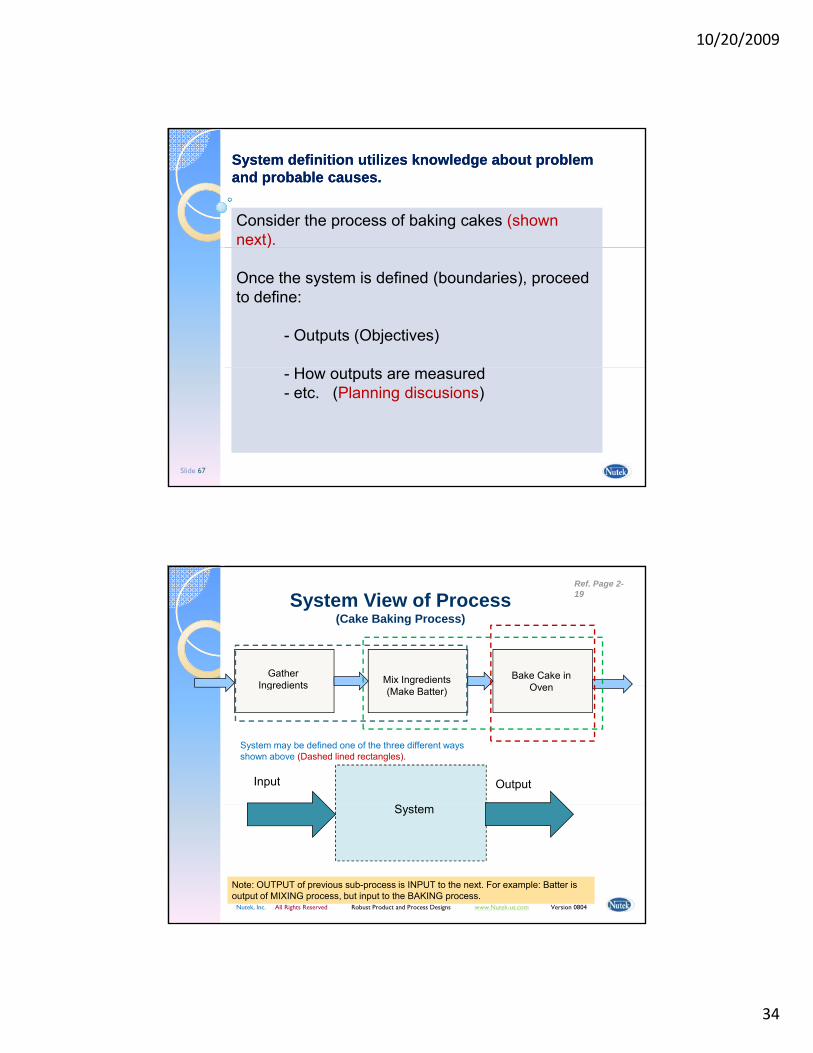
System definition utilizes knowledge about problem System definition utilizes knowledge about problem and probable causes.and probable causes.
Consider the process of baking cakes (shown next).)
Once the system is defined (boundaries), proceed to define:
- Outputs (Objectives)
Slide 67
- How outputs are measured- etc. (Planning discusions)
System View of Process(Cake Baking Process)
Ref. Page 2-19
Gather Ingredients Mix Ingredients Bake Cake in
O
Input Output
S
Ingredients (Make Batter) Oven
System may be defined one of the three different ways shown above (Dashed lined rectangles).
Nutek, Inc. All Rights Reserved Robust Product and Process Designs www.Nutek-us.com Version 0804
System
Note: OUTPUT of previous sub-process is INPUT to the next. For example: Batter is output of MIXING process, but input to the BAKING process.
10/20/2009
35
5 Steps Process Study Roadmap5 Steps Process Study Roadmap
43
5Run Tests to Confirm Solutions
Nutek & Team – on siteNutek off site
12Design and Describe Test
Analyze Test Results and Prescribe Solutions
3Carry Out Planned Tests and Collect Results
Nutek – off site
Project Team & Nutek
Slide 69
1Hold Experiment Planning Discussions
Recipes
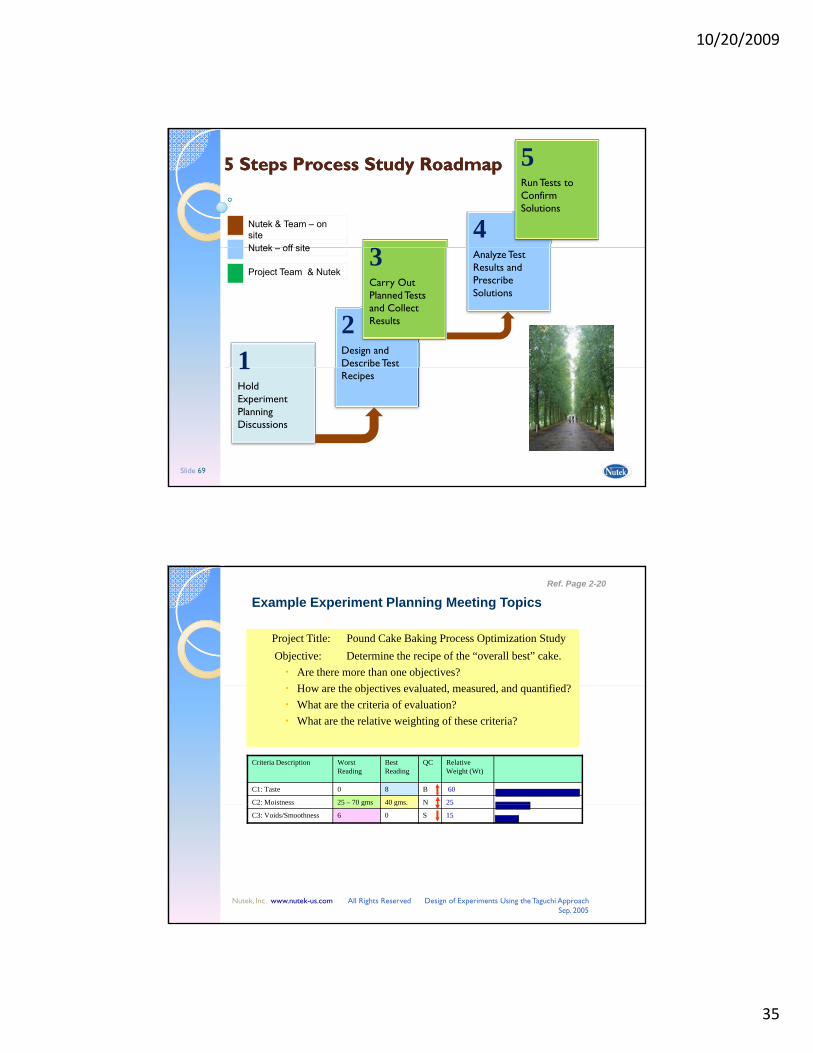
Example Experiment Planning Meeting Topics
Project Title: Pound Cake Baking Process Optimization StudyObjective: Determine the recipe of the “overall best” cake.
Are there more than one objectives?H h bj i l d d d ifi d?
Ref. Page 2-20
How are the objectives evaluated, measured, and quantified?What are the criteria of evaluation?What are the relative weighting of these criteria?
Criteria Description Worst Reading
Best Reading
QC Relative Weight (Wt)
C1: Taste 0 8 B 60
C2: Moistness 25 – 70 gms 40 gms. N 25
Nutek, Inc. www.nutek-us.com All Rights Reserved Design of Experiments Using the Taguchi Approach Sep. 2005
g g
C3: Voids/Smoothness 6 0 S 15
10/20/2009
36
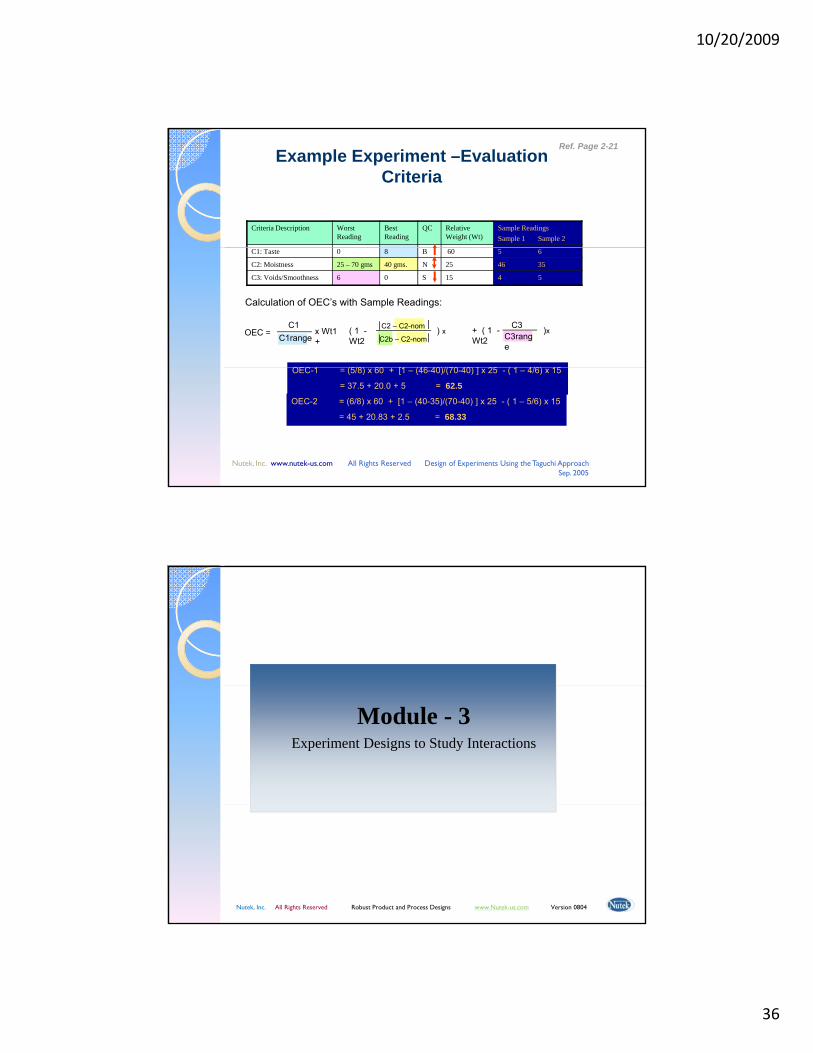
Example Experiment –Evaluation Criteria
Criteria Description Worst Reading
Best Reading
QC Relative Weight (Wt)
Sample ReadingsSample 1 Sample 2
Ref. Page 2-21
C1: Taste 0 8 B 60 5 6
C2: Moistness 25 – 70 gms 40 gms. N 25 46 35
C3: Voids/Smoothness 6 0 S 15 4 5
OEC = C1
C1rangex Wt1 +
( 1 - ) x Wt2 C2b – C2-nom
C2 – C2-nom + ( 1 - )x Wt2 C3rang
e
C3
OEC 1 (5/8) 60 [1 (46 40)/(70 40) ] 25 ( 1 4/6) 15
Calculation of OEC’s with Sample Readings:
Nutek, Inc. www.nutek-us.com All Rights Reserved Design of Experiments Using the Taguchi Approach Sep. 2005
OEC-1 = (5/8) x 60 + [1 – (46-40)/(70-40) ] x 25 - ( 1 – 4/6) x 15
= 37.5 + 20.0 + 5 = 62.5
OEC-2 = (6/8) x 60 + [1 – (40-35)/(70-40) ] x 25 - ( 1 – 5/6) x 15
= 45 + 20.83 + 2.5 = 68.33
Module - 3Experiment Designs to Study Interactions
Nutek, Inc. All Rights Reserved Robust Product and Process Designs www.Nutek-us.com Version 0804
10/20/2009
37
Things you should learn from discussions in this module:What is interaction?
Experiments to Study Interaction Between Factors
Ref. Pg. 3-1
Is interaction like a factor? Is it an input or an output?How many kinds of Interaction are there?Where does interactions show up?What can we do in our design to study interaction?How can you tell which interaction is stronger?
Nutek, Inc. All Rights Reserved Robust Product and Process Designs www.Nutek-us.com Version 0804
How can you tell which interaction is stronger?When Interactions are too many, what is a good way to design the experiment?
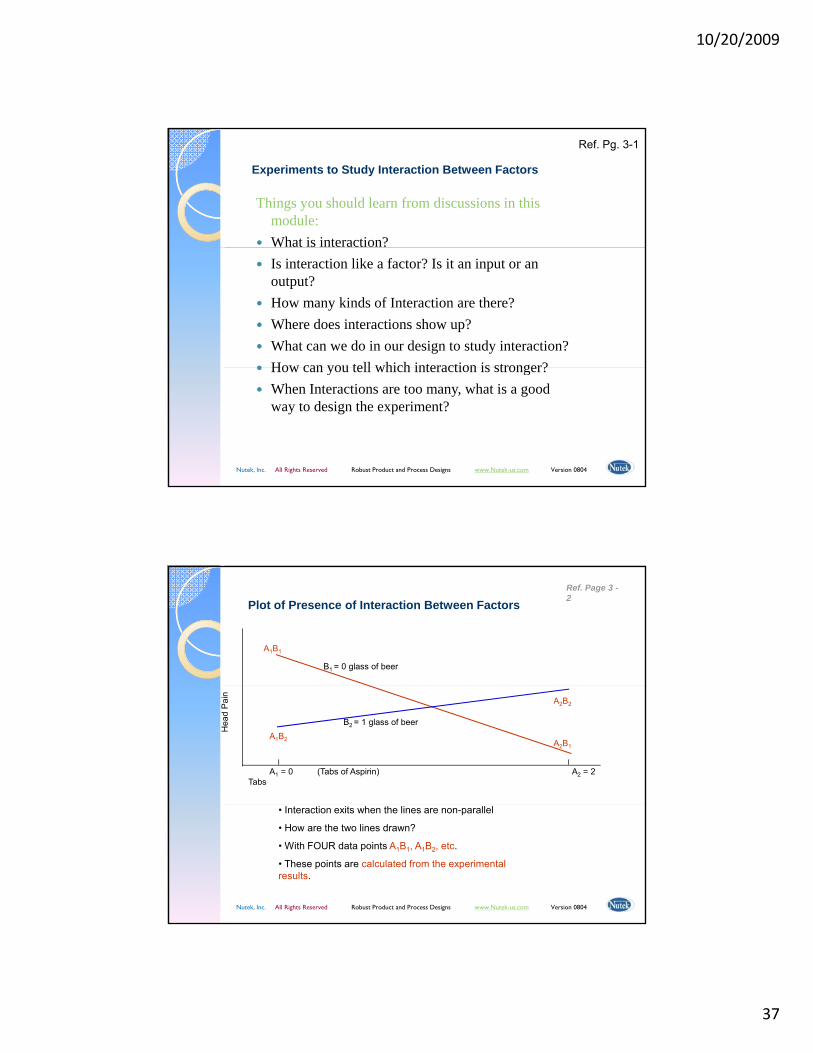
B1 = 0 glass of beer
A1B1
Plot of Presence of Interaction Between FactorsRef. Page 3 -2
A1 = 0 (Tabs of Aspirin) A2 = 2 Tabs
Hea
d P
ain
B2 = 1 glass of beer
A2B1
A2B2
A1B2
Nutek, Inc. All Rights Reserved Robust Product and Process Designs www.Nutek-us.com Version 0804
• Interaction exits when the lines are non-parallel
• How are the two lines drawn?
• With FOUR data points A1B1, A1B2, etc.
• These points are calculated from the experimental results.
10/20/2009
38
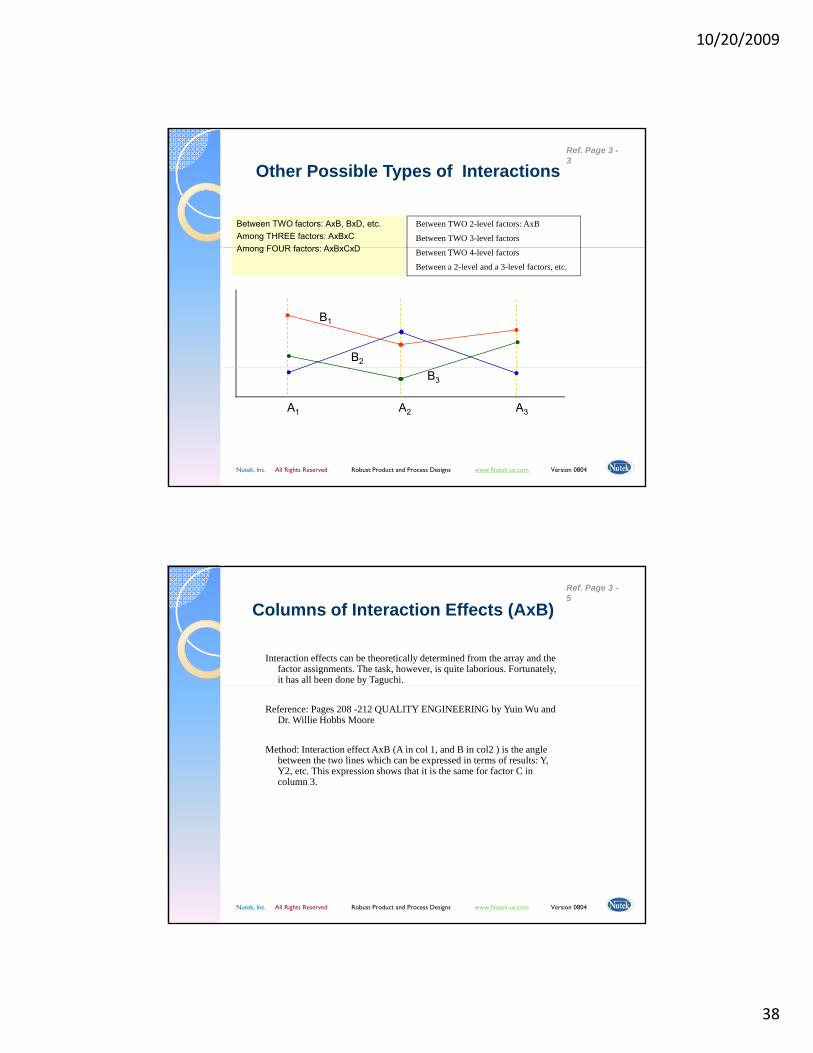
Between TWO 2-level factors: AxB
Between TWO 3-level factors
Other Possible Types of Interactions
Between TWO factors: AxB, BxD, etc.Among THREE factors: AxBxCAmong FOUR factors: AxBxCxD
Ref. Page 3 -3
Between TWO 4-level factors
Between a 2-level and a 3-level factors, etc.
B1
B2
Among FOUR factors: AxBxCxD
Nutek, Inc. All Rights Reserved Robust Product and Process Designs www.Nutek-us.com Version 0804
A1 A2 A3
B3
Interaction effects can be theoretically determined from the array and the factor assignments. The task, however, is quite laborious. Fortunately, it has all been done by Taguchi.
Columns of Interaction Effects (AxB)Ref. Page 3 -5
Reference: Pages 208 -212 QUALITY ENGINEERING by Yuin Wu and Dr. Willie Hobbs Moore
Method: Interaction effect AxB (A in col 1, and B in col2 ) is the angle between the two lines which can be expressed in terms of results: Y, Y2, etc. This expression shows that it is the same for factor C in column 3.
Nutek, Inc. All Rights Reserved Robust Product and Process Designs www.Nutek-us.com Version 0804
10/20/2009
39
Number of Possible Factor Main Effects and Interaction EffectsAvg. Effect 2-factor 3-factor 4-factor 5-factor 6-factor 7-factor1 7 21 35 35 21 7 1
Obtainable Information from Full-Factorial, 27 = 128
Ref. Page 3 -5
(1 + 7 + 21 + 35 + 35 + 21 + 7 + 1) = 128 (27 = 128)
Calculation method: Two-Factor Interaction - two (say A and B) taken out of seven factors (The combination formula):
nCr = n!/[(n-r)! R! ] = 7 x 6 x 5! / [5!x 2 ] = 21
Nutek, Inc. All Rights Reserved Robust Product and Process Designs www.Nutek-us.com Version 0804
Ref: Page 374, STATISTICS FOR EXPERIMENTERS by Box, Hunter and Hunter
Scopes of Seminar: Learn how to study and make corrections for interactions between TWO 2-Level factors (AxB, BxC, etc)
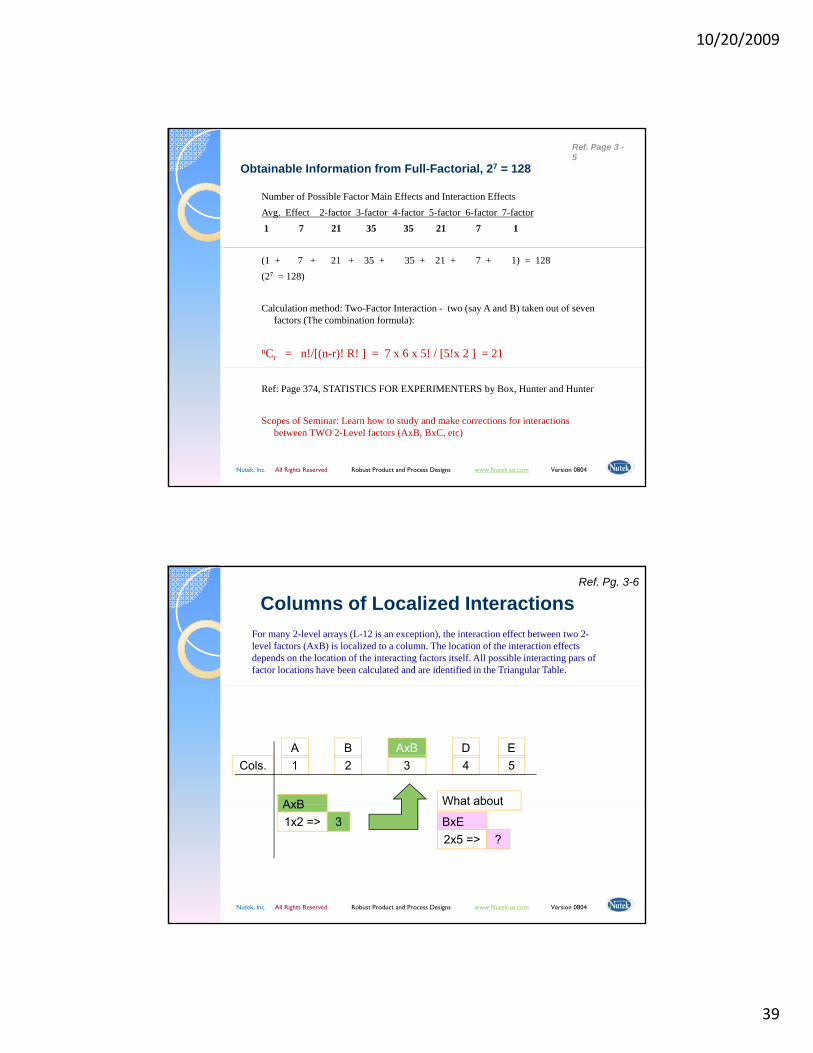
For many 2-level arrays (L-12 is an exception), the interaction effect between two 2-level factors (AxB) is localized to a column. The location of the interaction effects depends on the location of the interacting factors itself. All possible interacting pars of factor locations have been calculated and are identified in the Triangular Table.
Columns of Localized InteractionsRef. Pg. 3-6
A1
B2
AxB3
AxB
D4Cols.
E5
What about
Nutek, Inc. All Rights Reserved Robust Product and Process Designs www.Nutek-us.com Version 0804
AxB1x2 => 3 BxE
2x5 => ?
at about

10/20/2009
40
Table for Determining the Interaction Location
Example: Interaction effects between two factors in column 2 and 4 will be mixed with factors (or interactions) in column 6.
Triangular Table for Two-Level Orthogonal Arrays
Ref. Pg. 3-6
1 2 3 4 5 6 7 8 9 10 11 12 13 14 15
(1) 23 5 74 6 89 11 1310 12 1415
(2) 61 7 54 10 811 9 1514 12 13
(3) 67 5 114 10 89 15 1314 12
(4) 21 3 1312 14 815 9 1110
(5) 23 13 1512 14 89 11 10
(6) 141 15 1312 10 811 9
(7) 1415 13 1112 10 89
(8) 21 3 54 6 7
2 x 4 => 6
5 x 10 => 15
Nutek, Inc. All Rights Reserved Robust Product and Process Designs www.Nutek-us.com Version 0804
(8) 21 3 54 6 7
(9) 23 5 74 6
(10) 61 7 54
Etc. xxxx xx
Linear Graphs for Interaction DesignLinear graphs are graphical representations of the interaction readings from the Triangular Table.
Linear Graphs – Selected Readings of the TTRef. Pg. 3-7
13 2 1
35
1
23
45
7
A BAxB
Nutek, Inc. All Rights Reserved Robust Product and Process Designs www.Nutek-us.com Version 0804
2466
7
10/20/2009
41
Facts:◦ Factors identified are generally more than what is possible to
study.◦ Interactions between two 2-level factors alone are always more
than the number of factors.
Selecting Interactions to Study – A Difficult Compromise
Ref. Pg. 3-8
◦ Most often the knowledge about interactions is absent or unavailable.
◦ Discussions about whether to study interactions or not, arises only after the factors to study and their levels are identified, late in the planning day (3 PM or later).
◦ When experimental scopes are firm, interaction studies are done at a cost of factors.
◦ A compromise between the number of factors and number interactions to be studied need to be determined by team consensus.
Nutek, Inc. All Rights Reserved Robust Product and Process Designs www.Nutek-us.com Version 0804
Conclusion:Number of interaction to study and selecting the ones to study among all possible pairs, are challenging tasks that the project team must accomplish by consensus (no data or science is applicable)
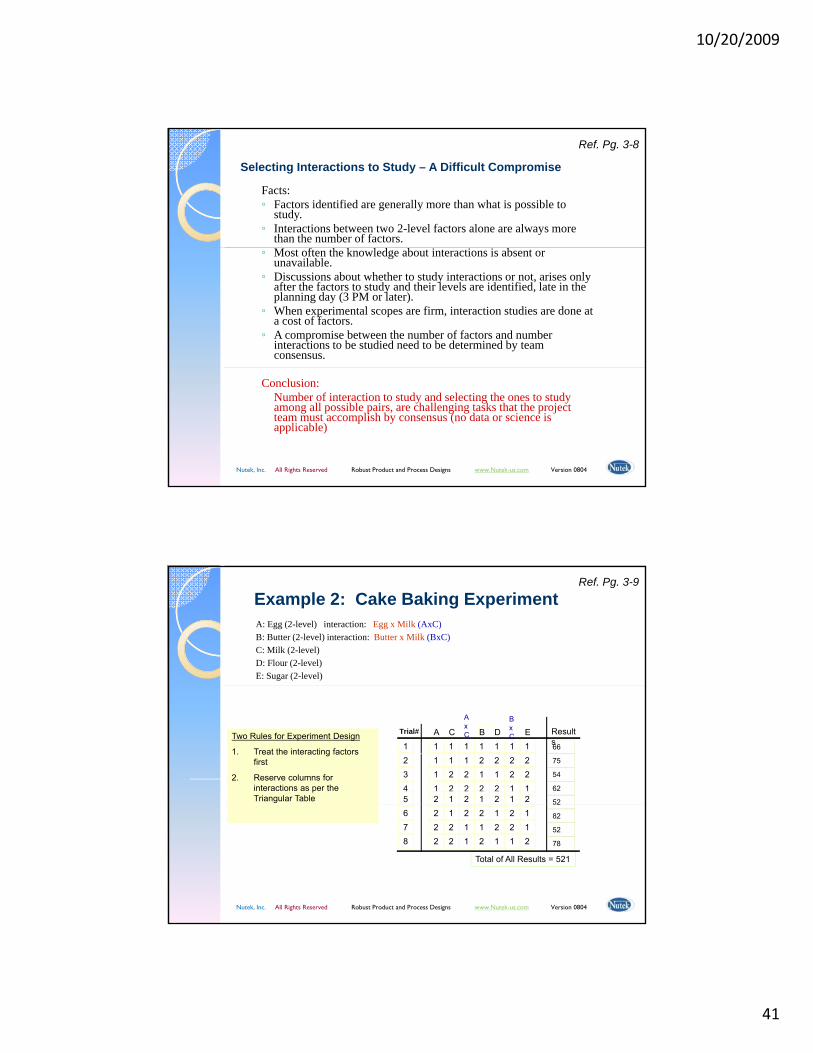
A: Egg (2-level) interaction: Egg x Milk (AxC)B: Butter (2-level) interaction: Butter x Milk (BxC)C: Milk (2-level)D: Flour (2-level)E: Sugar (2-level)
Example 2: Cake Baking ExperimentRef. Pg. 3-9
11
11
2
12
43
5
12
12
2
11
22
2
12
21
1
12
21
2
12
12
1
11
22
1
DTrial# A
AxCC
BxCB E Result
s66
75
54
62
52
Two Rules for Experiment Design
1. Treat the interacting factors first
2. Reserve columns for interactions as per the Triangular Table
Nutek, Inc. All Rights Reserved Robust Product and Process Designs www.Nutek-us.com Version 0804
2
22
6
87
1
21
2
11
2
21
1
12
2
12
1
22
82
52
78
Total of All Results = 521
10/20/2009
42
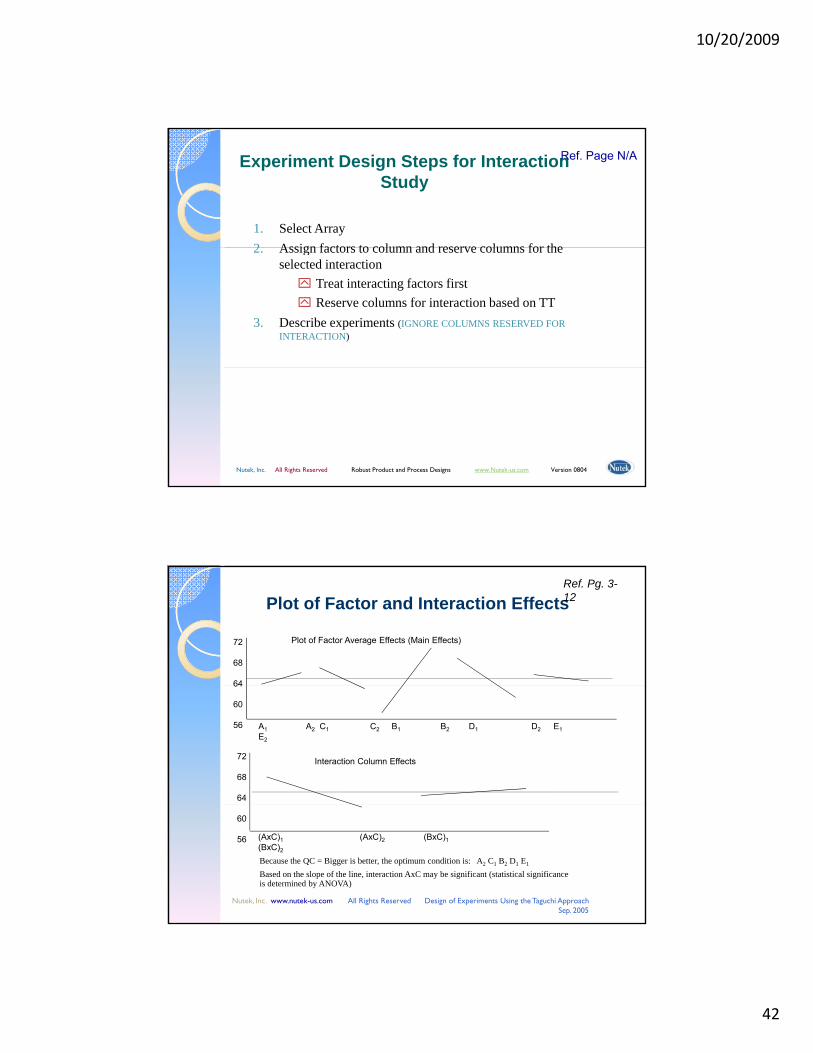
1. Select Array2 Assign factors to column and reserve columns for the
Experiment Design Steps for Interaction Study
Ref. Page N/A
2. Assign factors to column and reserve columns for the selected interaction
Treat interacting factors firstReserve columns for interaction based on TT
3. Describe experiments (IGNORE COLUMNS RESERVED FOR INTERACTION)
Nutek, Inc. All Rights Reserved Robust Product and Process Designs www.Nutek-us.com Version 0804
72
68
64
Plot of Factor Average Effects (Main Effects)
Plot of Factor and Interaction EffectsRef. Pg. 3-12
A1 A2 C1 C2 B1 B2 D1 D2 E1 E2
64
60
56
72
68
64
Interaction Column Effects
Nutek, Inc. www.nutek-us.com All Rights Reserved Design of Experiments Using the Taguchi Approach Sep. 2005
Because the QC = Bigger is better, the optimum condition is: A2 C1 B2 D1 E1
Based on the slope of the line, interaction AxC may be significant (statistical significance is determined by ANOVA)
(AxC)1 (AxC)2 (BxC)1(BxC)2
60
56

10/20/2009
43
Average effect of A1C1 is found byaveraging results which contain the
ff t f b th A & C
Test Data for Test of Presence of Interactions Plot
DTrial# A
AxCC
BxCB E Result
Ref. Pg. 3-13
effects of both A1 & C1._____(A1C1) = (66 + 75)/2 = 70.50
(The first two trial results only)Similarly_____(A1C2) = (54 + 62)/2 = 58.00___(A2C1) = (52 + 82)/2 = 67.00 and
11
11
22
22
12
43
56
87
12
12
21
21
11
22
22
11
12
21
12
21
12
21
21
12
12
12
12
12
11
22
11
22
C s66
75
54
62
52
82
52
78
Total of All Results = 521
Nutek, Inc. All Rights Reserved Robust Product and Process Designs www.Nutek-us.com Version 0804
_____(A2C2) = (52 + 78)/2 = 65.00
Total of All Results = 521
Pots for Test of Presence of Interaction
B1 = 0 glass of beer
A1B1
Ref. Pg. 3-14
A1 = 0 (Tabs of Aspirin) A2 = 2 Tabs
Hea
d Pa
in
B2 = 1 glass of beer
A2B1
A2B2
A1B2
• Interaction exits when the lines are non parallel
Nutek, Inc. All Rights Reserved Robust Product and Process Designs www.Nutek-us.com Version 0804
• Interaction exits when the lines are non-parallel• How are the two lines drawn?• With FOUR data points A1B1, A1B2, etc.• These points are calculated from the experimental results.
10/20/2009
44
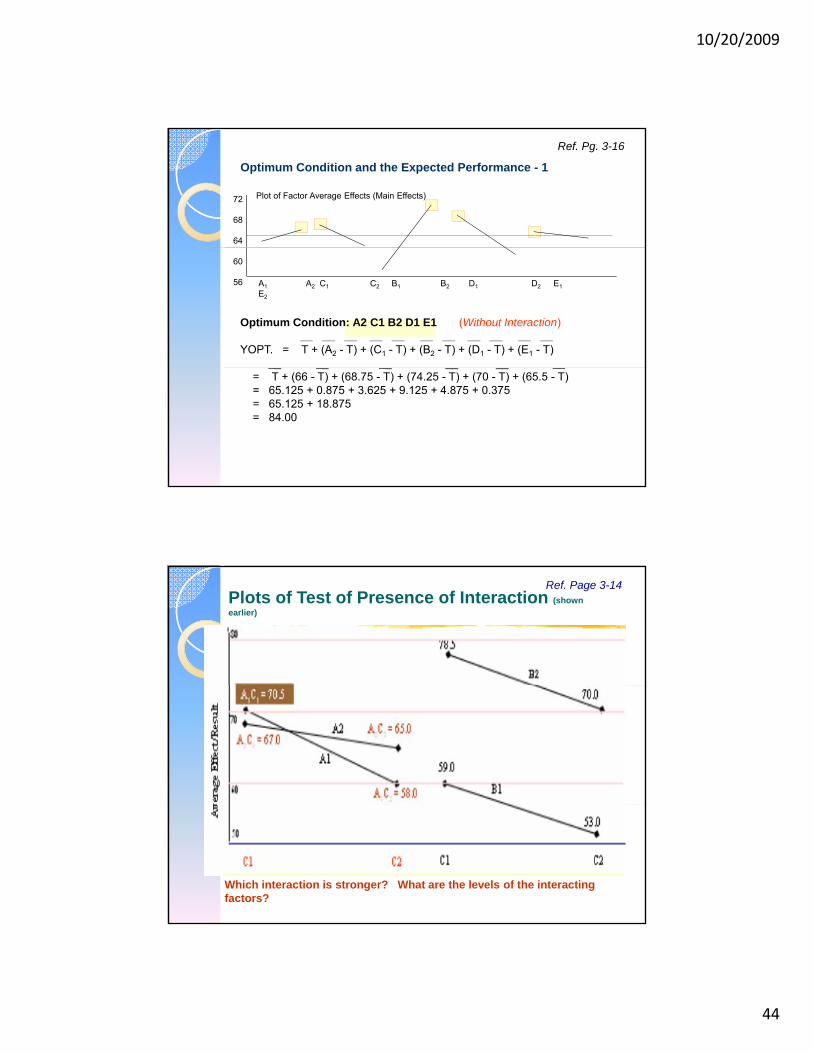
Optimum Condition and the Expected Performance - 1
72
68
64
Plot of Factor Average Effects (Main Effects)
Ref. Pg. 3-16
A1 A2 C1 C2 B1 B2 D1 D2 E1 E2
60
56
Optimum Condition: A2 C1 B2 D1 E1 (Without Interaction)__ __ __ __ __ __ __ __ __ __ __
YOPT. = T + (A2 - T) + (C1 - T) + (B2 - T) + (D1 - T) + (E1 - T) __ __ __ __ __ __
= T + (66 - T) + (68.75 - T) + (74.25 - T) + (70 - T) + (65.5 - T)= 65.125 + 0.875 + 3.625 + 9.125 + 4.875 + 0.375= 65.125 + 18.875 = 84.00
Plots of Test of Presence of Interaction (shown earlier)
Ref. Page 3-14
Which interaction is stronger? What are the levels of the interacting factors?
10/20/2009
45
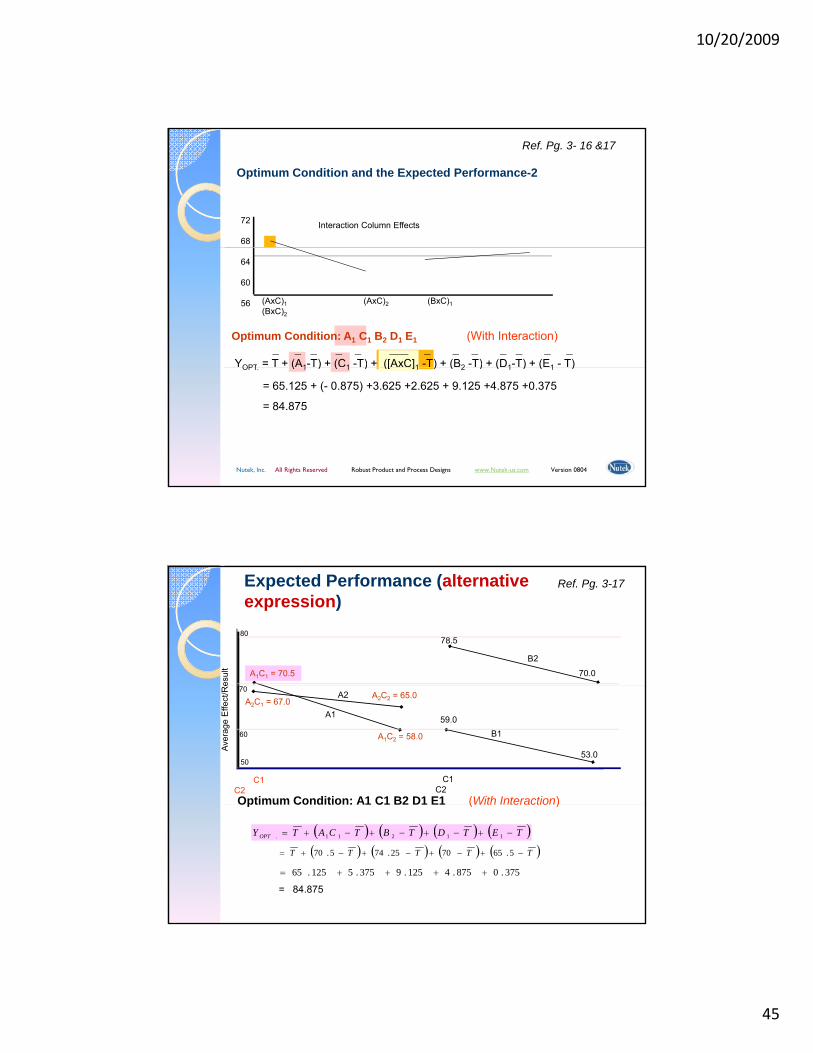
Optimum Condition and the Expected Performance-2
72
68
Interaction Column Effects
Ref. Pg. 3- 16 &17
(AxC)1 (AxC)2 (BxC)1(BxC)2
64
60
56
Optimum Condition: A1 C1 B2 D1 E1 (With Interaction)_ _ _ _ _ ___ _ _ _ _ _ _ _
YOPT = T + (A1-T) + (C1 -T) + ([AxC]1 -T) + (B2 -T) + (D1-T) + (E1 - T)
Nutek, Inc. All Rights Reserved Robust Product and Process Designs www.Nutek-us.com Version 0804
OPT. ( 1 ) ( 1 ) ([ ]1 ) ( 2 ) ( 1 ) ( 1 )
= 65.125 + (- 0.875) +3.625 +2.625 + 9.125 +4.875 +0.375
= 84.875
Expected Performance (alternative expression)
78.5
70.0
80
esul
t
A1C1 = 70.5
Ref. Pg. 3-17
C1 C2
C1 C2
A1
A2
B159.0
53.0
Aver
age
Effe
ct/R
e
A1C2 = 58.0
A2C1 = 67.0A2C2 = 65.0
60
70
50
Optimum Condition: A1 C1 B2 D1 E1 (With Interaction)
( ) ( ) ( ) ( )TTTTT −+−+−+−+= 5.657025.745.70
375.0875.4125.9375.5125.65 ++++=
( ) ( ) ( ) ( )TETDTBTCATY OPT −+−+−+−+= 11211.
= 84.875
p ( )
10/20/2009
46
M d l 4Module - 4Experiment Designs with Mixed-Level Factors
Nutek, Inc. All Rights Reserved Robust Product and Process Designs www.Nutek-us.com Version 0804
Things you should learn from discussions in this module:
Standard orthogonal arrays are modified to use it for many
Designing Experiments with Mixed Factor Levels
Ref. Pg. 4-1
Standard orthogonal arrays are modified to use it for many experiment designs with mixed level factors.What is degrees of freedom (DOF)?How to determine requirements for the experiment in terms of DOF?How to determine which array is most suitable for modification?How to upgrade columns?H t d d l ?
Nutek, Inc. All Rights Reserved Robust Product and Process Designs www.Nutek-us.com Version 0804
How to downgrade columns?What is a combination design?
10/20/2009
47
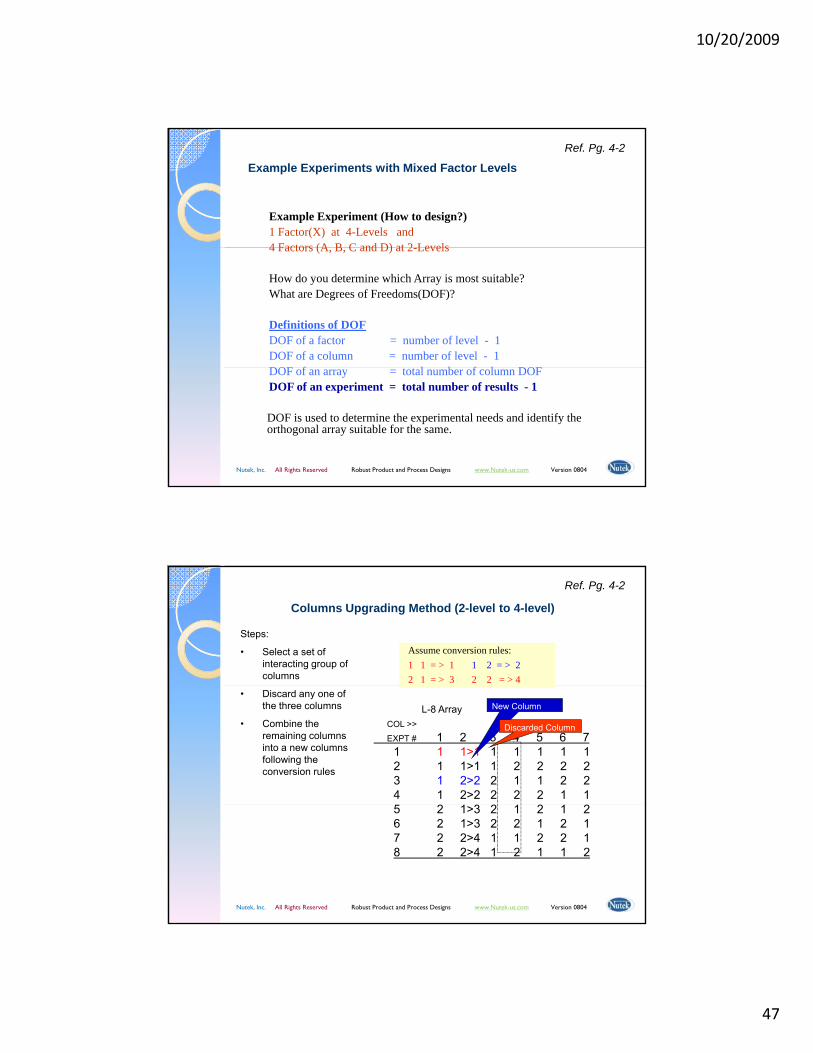
Example Experiment (How to design?)1 Factor(X) at 4-Levels and 4 Factors (A B C and D) at 2 Levels
Example Experiments with Mixed Factor LevelsRef. Pg. 4-2
4 Factors (A, B, C and D) at 2-Levels
How do you determine which Array is most suitable?What are Degrees of Freedoms(DOF)?
Definitions of DOFDOF of a factor = number of level - 1DOF of a column = number of level - 1DOF f l b f l DOF
Nutek, Inc. All Rights Reserved Robust Product and Process Designs www.Nutek-us.com Version 0804
DOF of an array = total number of column DOFDOF of an experiment = total number of results - 1
DOF is used to determine the experimental needs and identify the orthogonal array suitable for the same.
Assume conversion rules:1 1 = > 1 1 2 = > 22 1 = > 3 2 2 = > 4
Columns Upgrading Method (2-level to 4-level)
Steps:
• Select a set of interacting group of columns
Ref. Pg. 4-2
L-8 ArrayCOL >>
EXPT # 1 2 3 4 5 6 71 1 1>1 1 1 1 1 12 1 1>1 1 2 2 2 23 1 2>2 2 1 1 2 24 1 2>2 2 2 2 1 15 2 1 3 2 1 2 1 2
New Column
Discarded Column
• Discard any one of the three columns
• Combine the remaining columns into a new columns following the conversion rules
Nutek, Inc. All Rights Reserved Robust Product and Process Designs www.Nutek-us.com Version 0804
5 2 1>3 2 1 2 1 26 2 1>3 2 2 1 2 17 2 2>4 1 1 2 2 18 2 2>4 1 2 1 1 2
10/20/2009
48
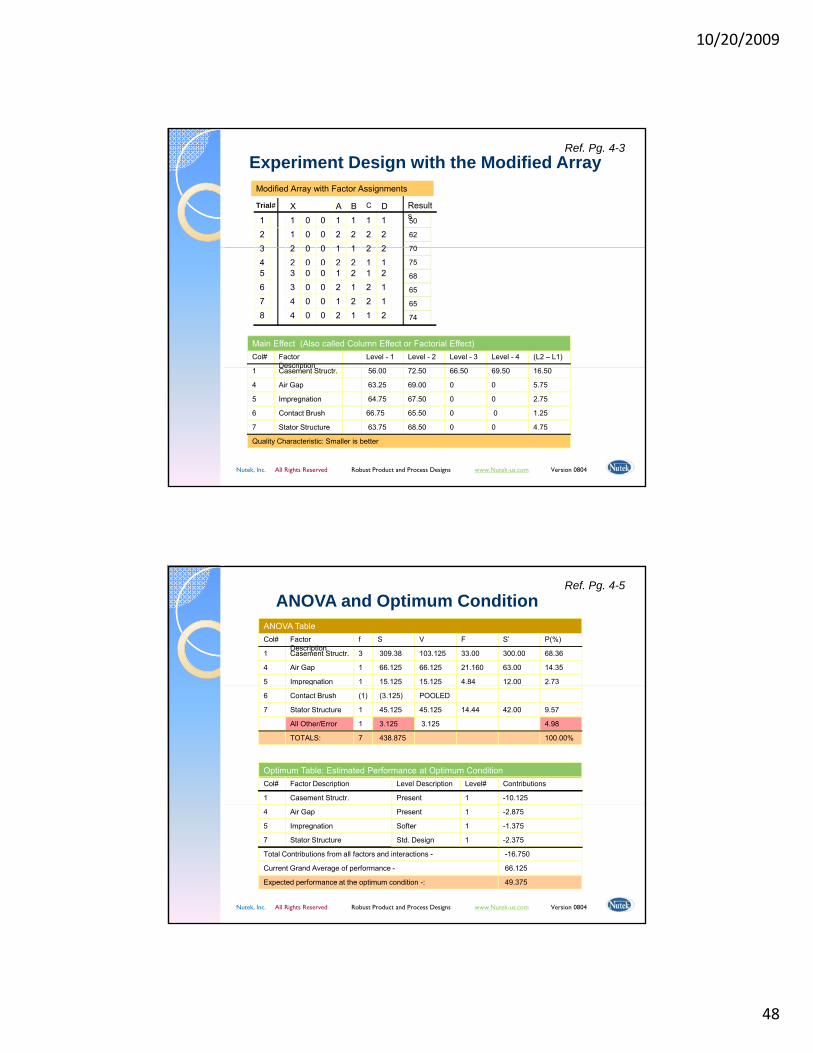
Experiment Design with the Modified Array
112
123
122
000
121
121
122
000
BTrial# X CA D Results50
62
70
Modified Array with Factor Assignments
Ref. Pg. 4-3
Col# Factor Description
Level - 1 Level - 2 Level - 3 Level - 4 (L2 – L1)
Main Effect (Also called Column Effect or Factorial Effect)
22
33
44
43
56
87
12
21
21
00
00
00
21
12
21
21
21
12
12
12
12
00
00
00
70
75
68
65
65
74
Nutek, Inc. All Rights Reserved Robust Product and Process Designs www.Nutek-us.com Version 0804
Description
7 Stator Structure 63.75 68.50 0 0 4.75
6 Contact Brush 66.75 65.50 0 0 1.25
5 Impregnation 64.75 67.50 0 0 2.75
4 Air Gap 63.25 69.00 0 0 5.75
1 Casement Structr. 56.00 72.50 66.50 69.50 16.50
Quality Characteristic: Smaller is better
ANOVA and Optimum Condition
Col# Factor Description
f S V F S’ P(%)
ANOVA Table
5 Impregnation 1 15.125 15.125 4.84 12.00 2.73
4 Air Gap 1 66.125 66.125 21.160 63.00 14.35
1 Casement Structr. 3 309.38 103.125 33.00 300.00 68.36
Ref. Pg. 4-5
Optimum Table: Estimated Performance at Optimum Condition
1 Casement Structr.
Col# Factor Description Level Description Level# Contributions
Present 1 -10.125
7 Stator Structure 1 45.125 45.125 14.44 42.00 9.57
All Other/Error 1 3.125 3.125 4.98
6 Contact Brush (1) (3.125) POOLED
p g
TOTALS: 7 438.875 100.00%
Nutek, Inc. All Rights Reserved Robust Product and Process Designs www.Nutek-us.com Version 0804
7 Stator Structure
5 Impregnation
4 Air Gap
Total Contributions from all factors and interactions - -16.750
Std. Design 1 -2.375
Present 1 -2.875
Softer 1 -1.375
Expected performance at the optimum condition -: 49.375
Current Grand Average of performance - 66.125
10/20/2009
49
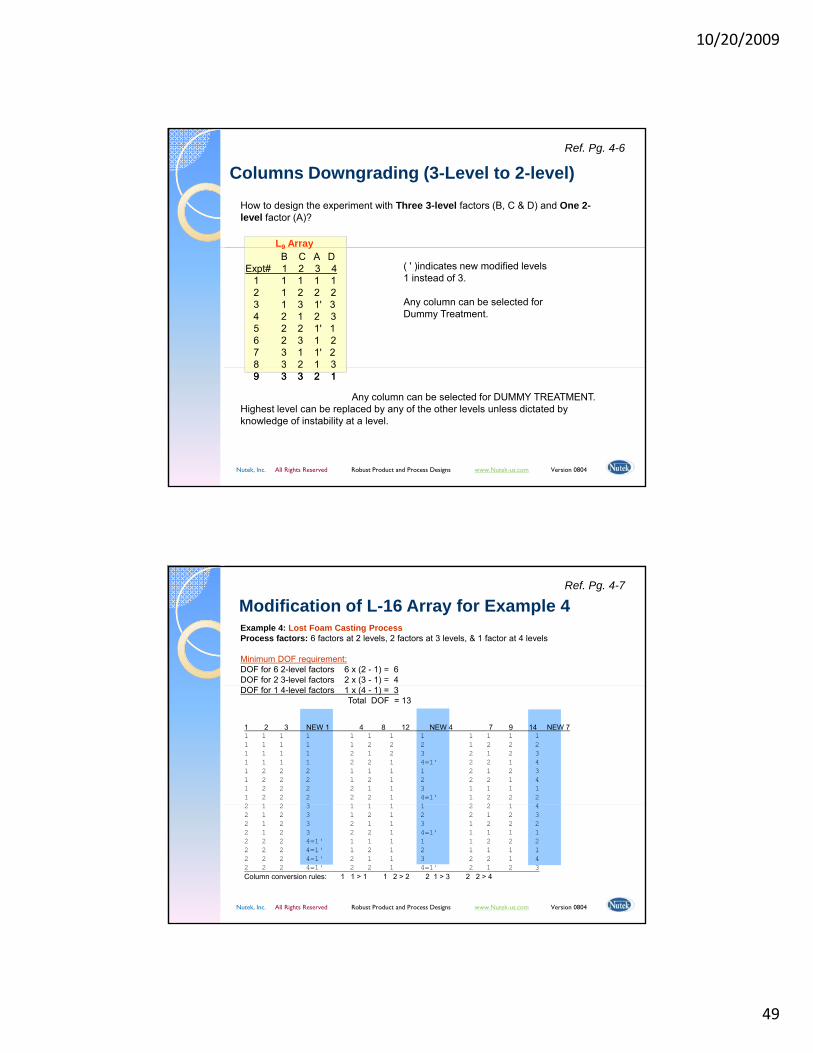
How to design the experiment with Three 3-level factors (B, C & D) and One 2-level factor (A)?
L9 Array
Columns Downgrading (3-Level to 2-level)Ref. Pg. 4-6
9 yB C A D
Expt# 1 2 3 41 1 1 1 12 1 2 2 23 1 3 1' 34 2 1 2 35 2 2 1' 16 2 3 1 27 3 1 1' 28 3 2 1 3
( ' )indicates new modified levels 1 instead of 3.
Any column can be selected for Dummy Treatment.
Nutek, Inc. All Rights Reserved Robust Product and Process Designs www.Nutek-us.com Version 0804
Any column can be selected for DUMMY TREATMENT.Highest level can be replaced by any of the other levels unless dictated by knowledge of instability at a level.
9 3 3 2 18 3 2 1 39 3 3 2 1
Example 4: Lost Foam Casting ProcessProcess factors: 6 factors at 2 levels, 2 factors at 3 levels, & 1 factor at 4 levels
Minimum DOF requirement:DOF for 6 2-level factors 6 x (2 - 1) = 6DOF for 2 3-level factors 2 x (3 - 1) = 4
Modification of L-16 Array for Example 4 Ref. Pg. 4-7
DOF for 1 4-level factors 1 x (4 - 1) = 3Total DOF = 13
1 2 3 NEW 1 4 8 12 NEW 4 7 9 14 NEW 7 1 1 1 1 1 1 1 1 1 1 1 11 1 1 1 1 2 2 2 1 2 2 21 1 1 1 2 1 2 3 2 1 2 31 1 1 1 2 2 1 4=1' 2 2 1 41 2 2 2 1 1 1 1 2 1 2 31 2 2 2 1 2 1 2 2 2 1 41 2 2 2 2 1 1 3 1 1 1 11 2 2 2 2 2 1 4=1' 1 2 2 22 1 2 3 1 1 1 1 2 2 1 4
Nutek, Inc. All Rights Reserved Robust Product and Process Designs www.Nutek-us.com Version 0804
2 1 2 3 1 1 1 1 2 2 1 42 1 2 3 1 2 1 2 2 1 2 32 1 2 3 2 1 1 3 1 2 2 22 1 2 3 2 2 1 4=1' 1 1 1 12 2 2 4=1' 1 1 1 1 1 2 2 22 2 2 4=1' 1 2 1 2 1 1 1 12 2 2 4=1' 2 1 1 3 2 2 1 42 2 2 4=1' 2 2 1 4=1' 2 1 2 3Column conversion rules: 1 1 > 1 1 2 > 2 2 1 > 3 2 2 > 4
10/20/2009
50
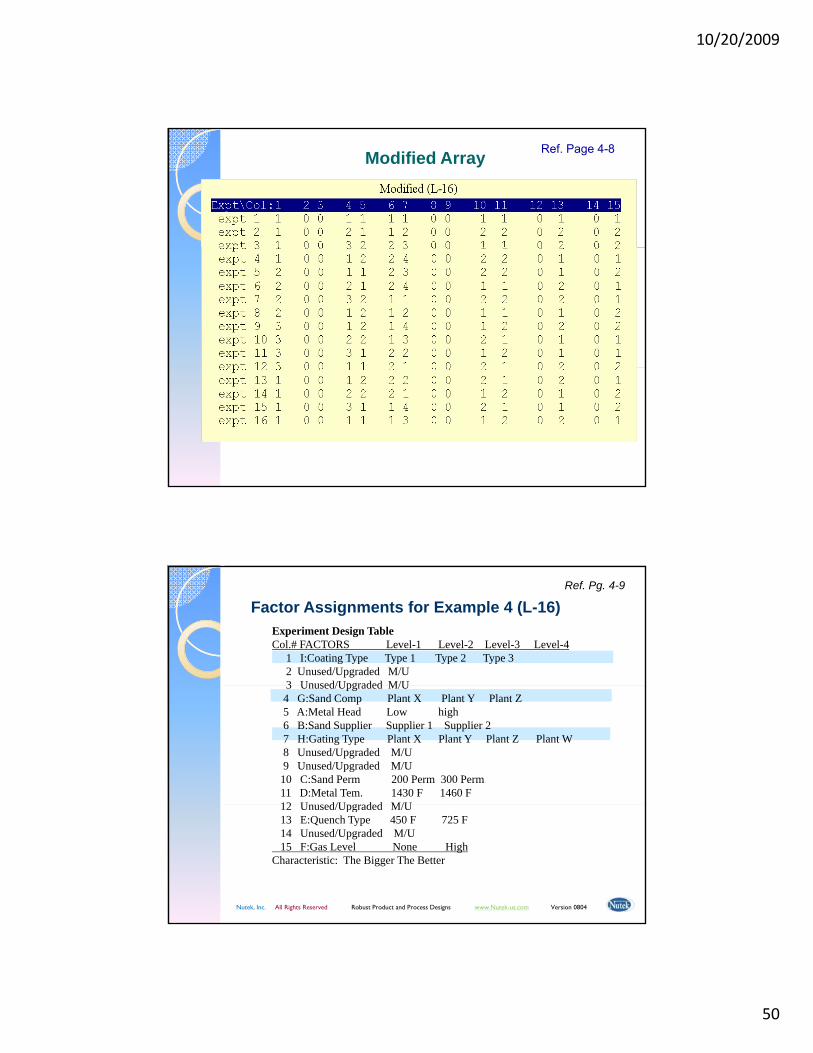
Modified Array Ref. Page 4-8
Factor Assignments for Example 4 (L-16)Experiment Design Table Col.# FACTORS Level-1 Level-2 Level-3 Level-4
1 I:Coating Type Type 1 Type 2 Type 3 2 Unused/Upgraded M/U 3 Unused/Upgraded M/U
Ref. Pg. 4-9
3 Unused/Upgraded M/U 4 G:Sand Comp Plant X Plant Y Plant Z 5 A:Metal Head Low high 6 B:Sand Supplier Supplier 1 Supplier 2 7 H:Gating Type Plant X Plant Y Plant Z Plant W 8 Unused/Upgraded M/U 9 Unused/Upgraded M/U
10 C:Sand Perm 200 Perm 300 Perm 11 D:Metal Tem. 1430 F 1460 F 12 Un sed/Upgraded M/U
Nutek, Inc. All Rights Reserved Robust Product and Process Designs www.Nutek-us.com Version 0804
12 Unused/Upgraded M/U 13 E:Quench Type 450 F 725 F 14 Unused/Upgraded M/U 15 F:Gas Level None High
Characteristic: The Bigger The Better
10/20/2009
51
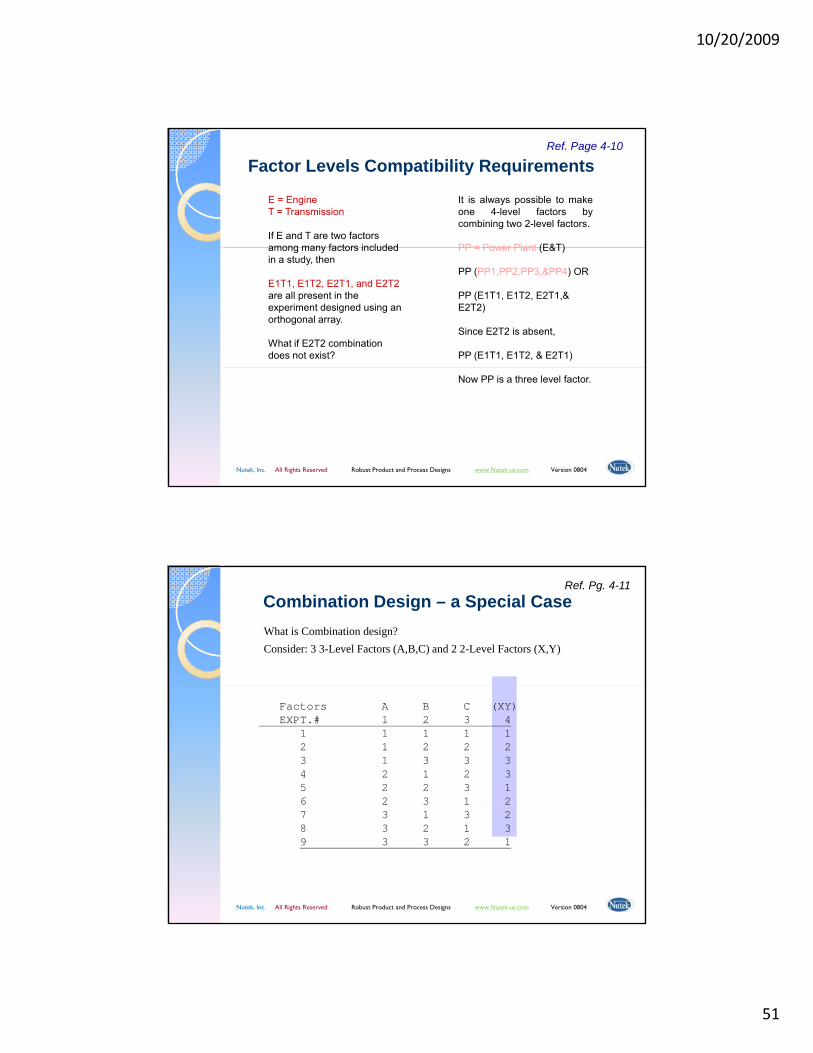
E = EngineT = Transmission
If E and T are two factors among many factors included
Factor Levels Compatibility Requirements
It is always possible to makeone 4-level factors bycombining two 2-level factors.
PP = Power Plant (E&T)
Ref. Page 4-10
among many factors included in a study, then
E1T1, E1T2, E2T1, and E2T2are all present in the experiment designed using an orthogonal array.
What if E2T2 combination does not exist?
PP = Power Plant (E&T)
PP (PP1,PP2,PP3,&PP4) OR
PP (E1T1, E1T2, E2T1,& E2T2)
Since E2T2 is absent,
PP (E1T1, E1T2, & E2T1)
Nutek, Inc. All Rights Reserved Robust Product and Process Designs www.Nutek-us.com Version 0804
Now PP is a three level factor.
What is Combination design?Consider: 3 3-Level Factors (A,B,C) and 2 2-Level Factors (X,Y)
Combination Design – a Special CaseRef. Pg. 4-11
Factors A B C (XY)EXPT.# 1 2 3 4
1 1 1 1 12 1 2 2 23 1 3 3 34 2 1 2 35 2 2 3 16 2 3 1 2
Nutek, Inc. All Rights Reserved Robust Product and Process Designs www.Nutek-us.com Version 0804
7 3 1 3 28 3 2 1 39 3 3 2 1
10/20/2009
52
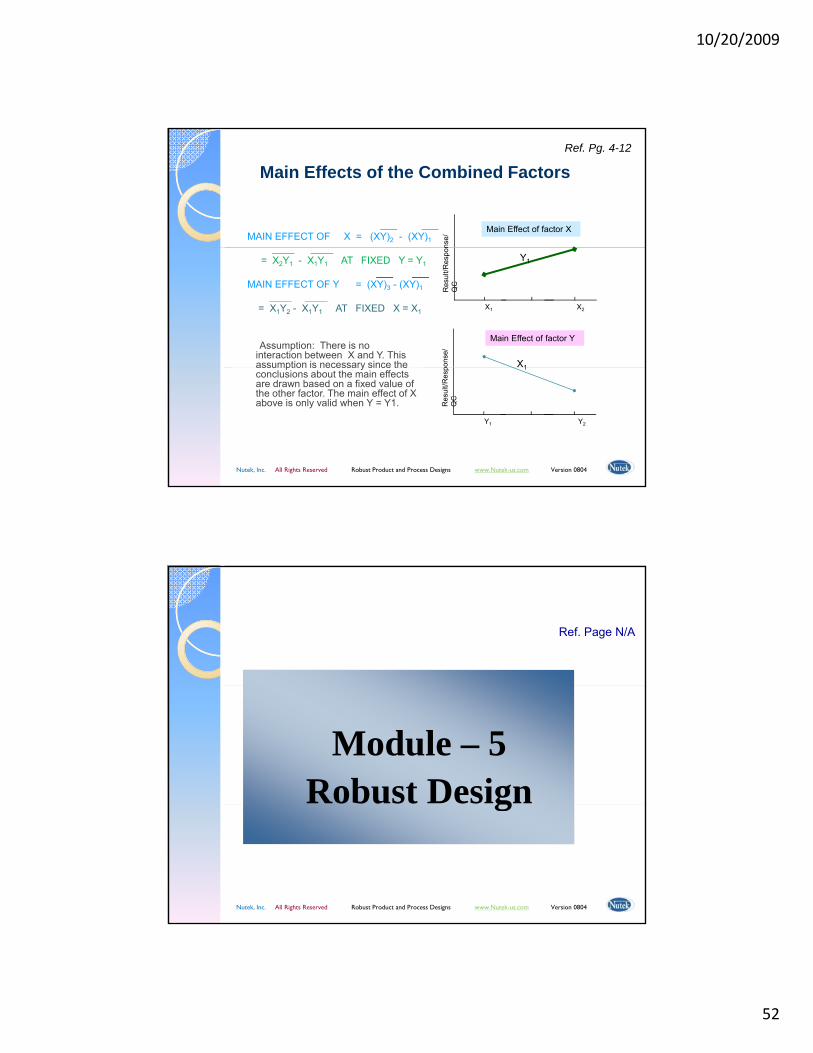
___ ___MAIN EFFECT OF X = (XY)2 - (XY)1
Main Effects of the Combined Factors
nse/
Main Effect of factor X
Ref. Pg. 4-12
Assumption: There is no interaction between X and Y. This assumption is necessary since the
____ ____= X2Y1 - X1Y1 AT FIXED Y = Y1
___ ___MAIN EFFECT OF Y = (XY)3 - (XY)1
____ ____= X1Y2 - X1Y1 AT FIXED X = X1
Res
ult/R
espo
nQ
C
X1 A3 X2
pons
e/
Y1
X1
Main Effect of factor Y
Nutek, Inc. All Rights Reserved Robust Product and Process Designs www.Nutek-us.com Version 0804
assumption is necessary since the conclusions about the main effects are drawn based on a fixed value of the other factor. The main effect of X above is only valid when Y = Y1. R
esul
t/Res
pQ
C
Y1 A3 Y2
1
Ref. Page N/A
Module – 5Robust Design
Nutek, Inc. All Rights Reserved Robust Product and Process Designs www.Nutek-us.com Version 0804
g
10/20/2009
53
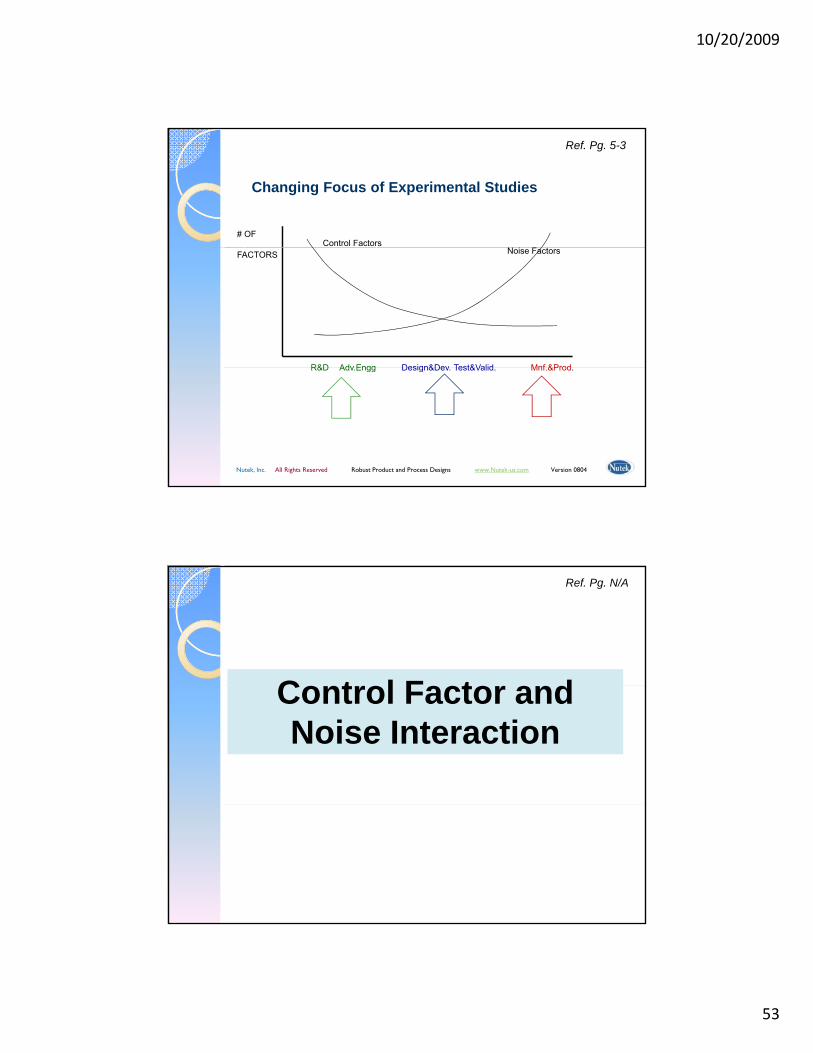
Changing Focus of Experimental Studies
# OFControl Factors
N i F
Ref. Pg. 5-3
FACTORS
R&D Adv Engg Design&Dev Test&Valid Mnf &Prod
Noise Factors
Nutek, Inc. All Rights Reserved Robust Product and Process Designs www.Nutek-us.com Version 0804
R&D Adv.Engg Design&Dev. Test&Valid. Mnf.&Prod.
Ref. Pg. N/A
C t l F t dControl Factor and Noise Interaction
10/20/2009
54
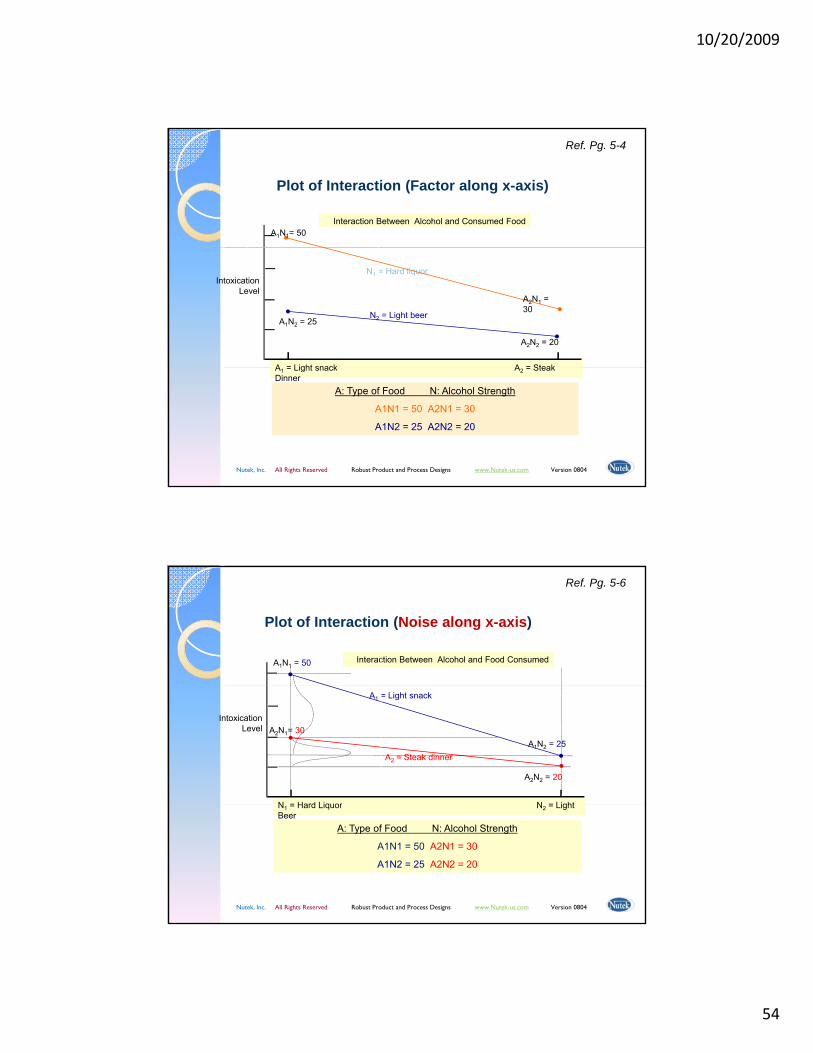
Plot of Interaction (Factor along x-axis)
A1N1= 50Interaction Between Alcohol and Consumed Food
Ref. Pg. 5-4
N1 = Hard liquorIntoxication
Level
A = Light snack A = Steak
N2 = Light beerA1N2 = 25
A2N2 = 20
A2N1 = 30
Nutek, Inc. All Rights Reserved Robust Product and Process Designs www.Nutek-us.com Version 0804
A1 = Light snack A2 = Steak Dinner
A: Type of Food N: Alcohol Strength
A1N1 = 50 A2N1 = 30
A1N2 = 25 A2N2 = 20
Plot of Interaction (Noise along x-axis)
A1N1 = 50 Interaction Between Alcohol and Food Consumed
Ref. Pg. 5-6
A1 = Light snack
A2N2 = 20
A2N1= 30
A2 = Steak dinnerA1N2 = 25
Intoxication Level
N = Hard Liquor N = Light
Nutek, Inc. All Rights Reserved Robust Product and Process Designs www.Nutek-us.com Version 0804
N1 = Hard Liquor N2 = Light Beer
A: Type of Food N: Alcohol Strength
A1N1 = 50 A2N1 = 30
A1N2 = 25 A2N2 = 20
10/20/2009
55
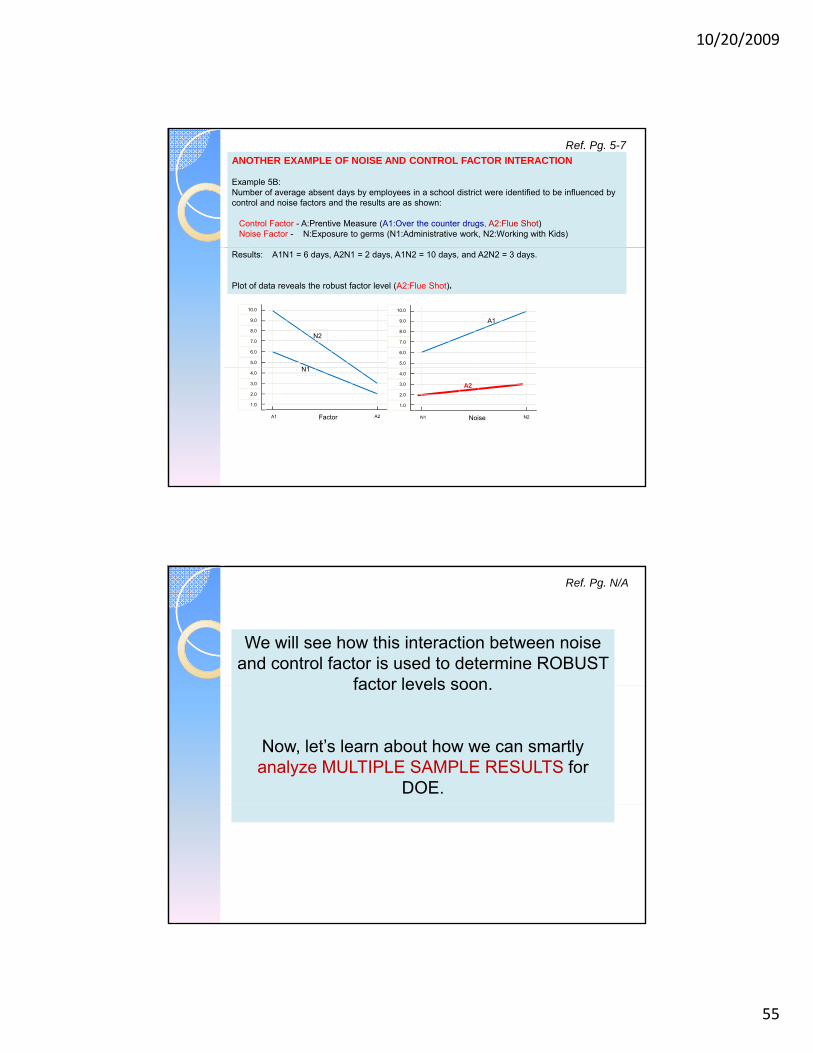
ANOTHER EXAMPLE OF NOISE AND CONTROL FACTOR INTERACTION
Example 5B:Number of average absent days by employees in a school district were identified to be influenced by control and noise factors and the results are as shown:
Control Factor - A:Prentive Measure (A1:Over the counter drugs, A2:Flue Shot)Noise Factor - N:Exposure to germs (N1:Administrative work, N2:Working with Kids)
Ref. Pg. 5-7
8.0
7.0
6.0
5.0
10.0
9.0
N2
N1
8.0
7.0
6.0
5.0
10.0
9.0 A1
Results: A1N1 = 6 days, A2N1 = 2 days, A1N2 = 10 days, and A2N2 = 3 days.
Plot of data reveals the robust factor level (A2:Flue Shot).
4.0
3.0
2.0
1.0
A2A1 Factor
N14.0
3.0
2.0
1.0
N2N1 Noise
A2
We will see how this interaction between noise and control factor is used to determine ROBUST
factor levels soon
Ref. Pg. N/A
factor levels soon.
Now, let’s learn about how we can smartly analyze MULTIPLE SAMPLE RESULTS for
DOE.
10/20/2009
56
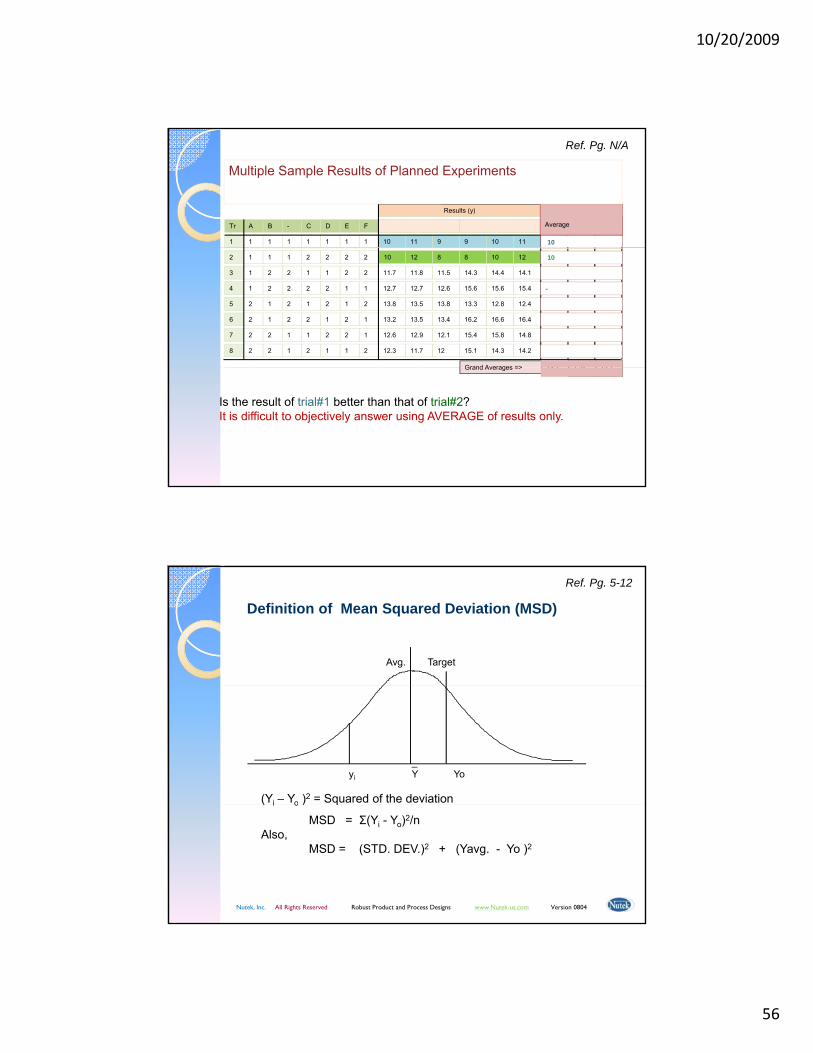
11 1 1 1 1 1 1
ETr A B - C D F yz z z z z z Sd S/N
12.810 11 9 9 10 11 1.45 -22.2
Results (y)__
Average
10
Multiple Sample Results of Planned Experiments
Ref. Pg. N/A
22 1 1 1 2 2 2
23 1 2 2 1 1 2
14 1 2 2 2 2 1
15 2 1 2 1 2 2
26 2 1 2 2 1 1
27 2 2 1 1 2 1
18 2 2 1 2 1 2
9.310 12 8 8 10 12 0.85 9.3
12.911.7 11.8 11.5 14.3 14.4 14.1 1.43 12.9
14.112.7 12.7 12.6 15.6 15.6 15.4 1.57 14.1
13.213.8 13.5 13.8 13.3 12.8 12.4 0.56 13.2
14.913.2 13.5 13.4 16.2 16.6 16.4 1.67 14.9
13.912.6 12.9 12.1 15.4 15.8 14.8 1.59 13.9
13.312.3 11.7 12 15.1 14.3 14.2 1.43 13.3
Grand Averages => 13 1 1 32 13 1
-
10
Grand Averages => 13.1 1.32 13.1
Is the result of trial#1 better than that of trial#2?It is difficult to objectively answer using AVERAGE of results only.
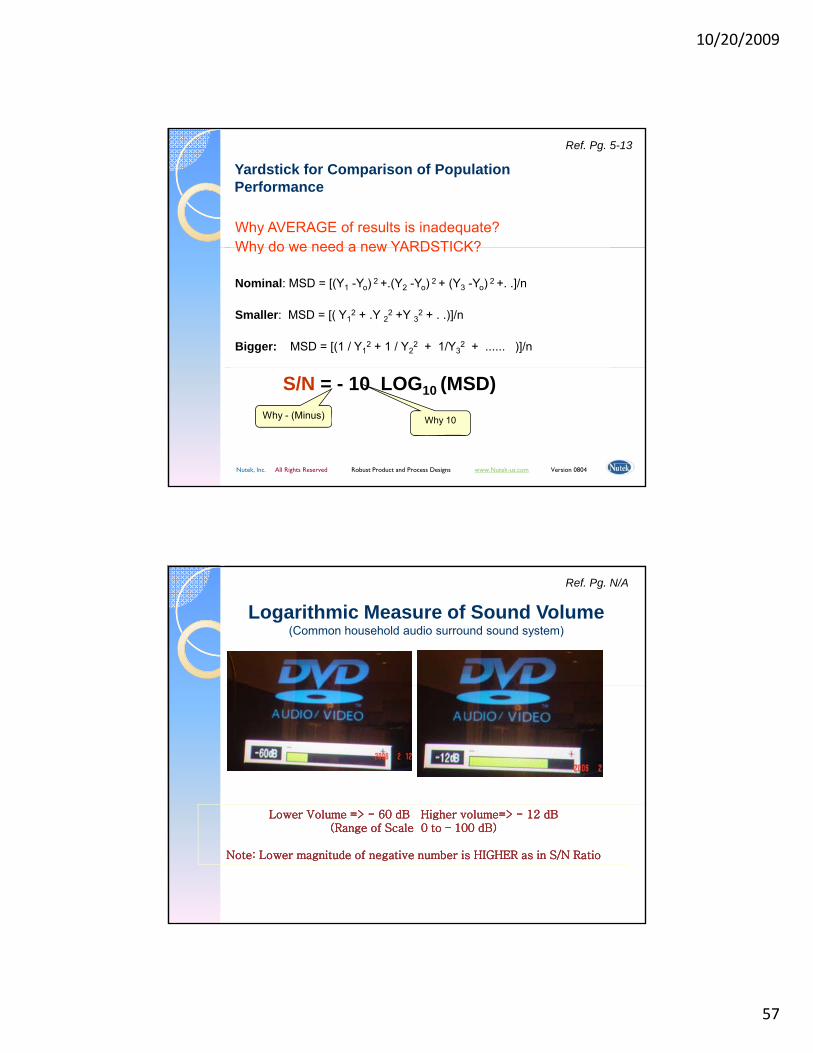
Definition of Mean Squared Deviation (MSD)
Avg. Target
Ref. Pg. 5-12
_yi Y Yo
(Yi – Yo )2 = Squared of the deviation
Nutek, Inc. All Rights Reserved Robust Product and Process Designs www.Nutek-us.com Version 0804
( i o ) q
MSD = Σ(Yi - Yo)2/nAlso,
MSD = (STD. DEV.)2 + (Yavg. - Yo )2
10/20/2009
57
Why AVERAGE of results is inadequate?Why do we need a new YARDSTICK?
Yardstick for Comparison of Population Performance
Ref. Pg. 5-13
Why do we need a new YARDSTICK?
Nominal: MSD = [(Y1 -Yo) 2 +.(Y2 -Yo) 2 + (Y3 -Yo) 2 +. .]/n
Smaller: MSD = [( Y12 + .Y 2
2 +Y 32 + . .)]/n
Bigger: MSD = [(1 / Y12 + 1 / Y2
2 + 1/Y32 + ...... )]/n
Nutek, Inc. All Rights Reserved Robust Product and Process Designs www.Nutek-us.com Version 0804
S/N = - 10 LOG10 (MSD)Why - (Minus) Why 10
Logarithmic Measure of Sound Volume(Common household audio surround sound system)
Ref. Pg. N/A
Lower Volume => Lower Volume => -- 60 dB Higher volume=> 60 dB Higher volume=> -- 12 dB 12 dB (Range of Scale 0 to (Range of Scale 0 to –– 100 dB)100 dB)
Note: Lower magnitude of negative number is HIGHER as in S/N RatioNote: Lower magnitude of negative number is HIGHER as in S/N Ratio

10/20/2009
58
The magnitude of most earthquakes is measured on the Richter scale, invented by Charles F. Richter in 1934. The Richter magnitude is calculated from the amplitude of the largest seismic wave recorded for the earthquake, no matter what type of wave was the strongest.
The Richter magnitudes are based on a logarithmic scale (base 10). What this means is that for each whole number you go up on the Richter scale, the amplitude of the ground motion recorded by a seismograph goes up ten times.U i thi l it d 5 th k ld lt i t ti th l l f d
Ref. Pg. N/A
Using this scale, a magnitude 5 earthquake would result in ten times the level of ground shaking as a magnitude 4 earthquake (and 32 times as much energy would be released). To give you an idea how these numbers can add up, think of it in terms of the energy released by explosives: a magnitude 1 seismic wave releases as much energy as blowing up 6 ounces of TNT. A magnitude 8 earthquake releases as much energy as detonating 6 million tons of TNT. Pretty impressive, huh? Fortunately, most of the earthquakes that occur each year are magnitude 2.5 or less, too small to be felt by most people.
Body-wave magnitude formula:
l (A/T) Q(D h)
Nutek, Inc. All Rights Reserved Robust Product and Process Designs www.Nutek-us.com Version 0804
mb = log(A/T) + Q(D,h)
where A is the ground motion (in microns)T is the wave's period (in seconds), and Q(D,h) is a correction factor that depends on distance to the quake's epicenter D (in degrees) and focal depth h (in kilometers).
How are S/N Ratios compared? (QUALITEK-4 software output, SEM-EX06.Q4W)
How can we transform S/N Ratios back into
Benefits of Transforming MSD to Log Scale (S/N)
Ref. Pg. 5-14
expected results?
EXPT. A B C R1 R2 R3 S/N AVG.1 1 1 1 2 3 4 -9.86 32 1 2 2 4 5 3 -12.2 43 2 1 2 4 5 6 -14.1 54 2 2 1 3 5 7 -14.4 5
An experiment with three2-level factors (A, B and C)and 3 samples per trialyielded the followingresults (QC = Smaller isBetter)
Nutek, Inc. All Rights Reserved Robust Product and Process Designs www.Nutek-us.com Version 0804
Based on averages, condition results of trials 3 & 4 are equal.Based on S/N ratios, condition 3 is better, since comparing
-14.1 > -14.4 ( -14.1 is bigger than -14.4)
10/20/2009
59
Plot of Factor Average Effects
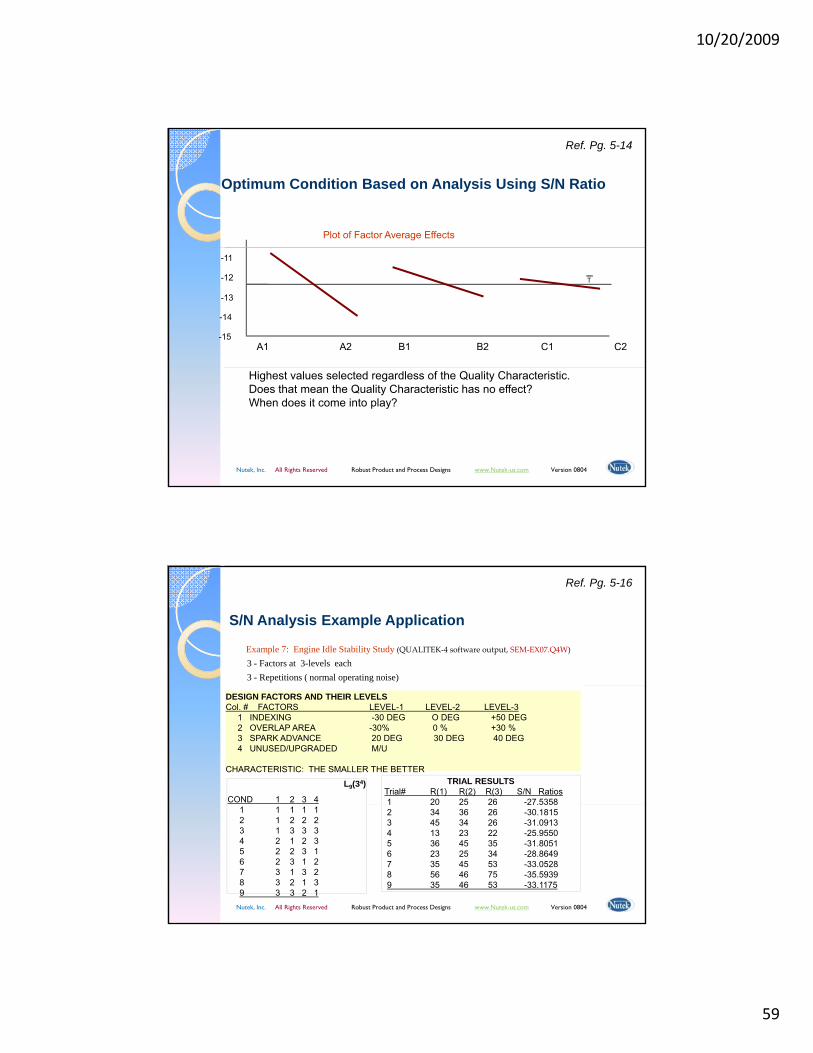
Optimum Condition Based on Analysis Using S/N Ratio
Ref. Pg. 5-14
A1 A2 B1 B2 C1 C2
T
-15
-14
-13
-11
-12
Nutek, Inc. All Rights Reserved Robust Product and Process Designs www.Nutek-us.com Version 0804
Highest values selected regardless of the Quality Characteristic.Does that mean the Quality Characteristic has no effect?When does it come into play?
Example 7: Engine Idle Stability Study (QUALITEK‐4 software output, SEM‐EX07.Q4W)
3 - Factors at 3-levels each3 - Repetitions ( normal operating noise)
S/N Analysis Example Application
Ref. Pg. 5-16
DESIGN FACTORS AND THEIR LEVELSCol. # FACTORS LEVEL-1 LEVEL-2 LEVEL-3
1 INDEXING -30 DEG O DEG +50 DEG2 OVERLAP AREA -30% 0 % +30 %3 SPARK ADVANCE 20 DEG 30 DEG 40 DEG4 UNUSED/UPGRADED M/U
CHARACTERISTIC: THE SMALLER THE BETTER
L9(34)
COND 1 2 3 4
TRIAL RESULTS Trial# R(1) R(2) R(3) S/N Ratios 1 20 25 26 -27.5358
Nutek, Inc. All Rights Reserved Robust Product and Process Designs www.Nutek-us.com Version 0804
1 1 1 1 12 1 2 2 23 1 3 3 34 2 1 2 35 2 2 3 1 6 2 3 1 27 3 1 3 28 3 2 1 39 3 3 2 1
0 5 6 53582 34 36 26 -30.1815 3 45 34 26 -31.0913 4 13 23 22 -25.9550 5 36 45 35 -31.8051 6 23 25 34 -28.86497 35 45 53 -33.0528 8 56 46 75 -35.5939 9 35 46 53 -33.1175
10/20/2009
60
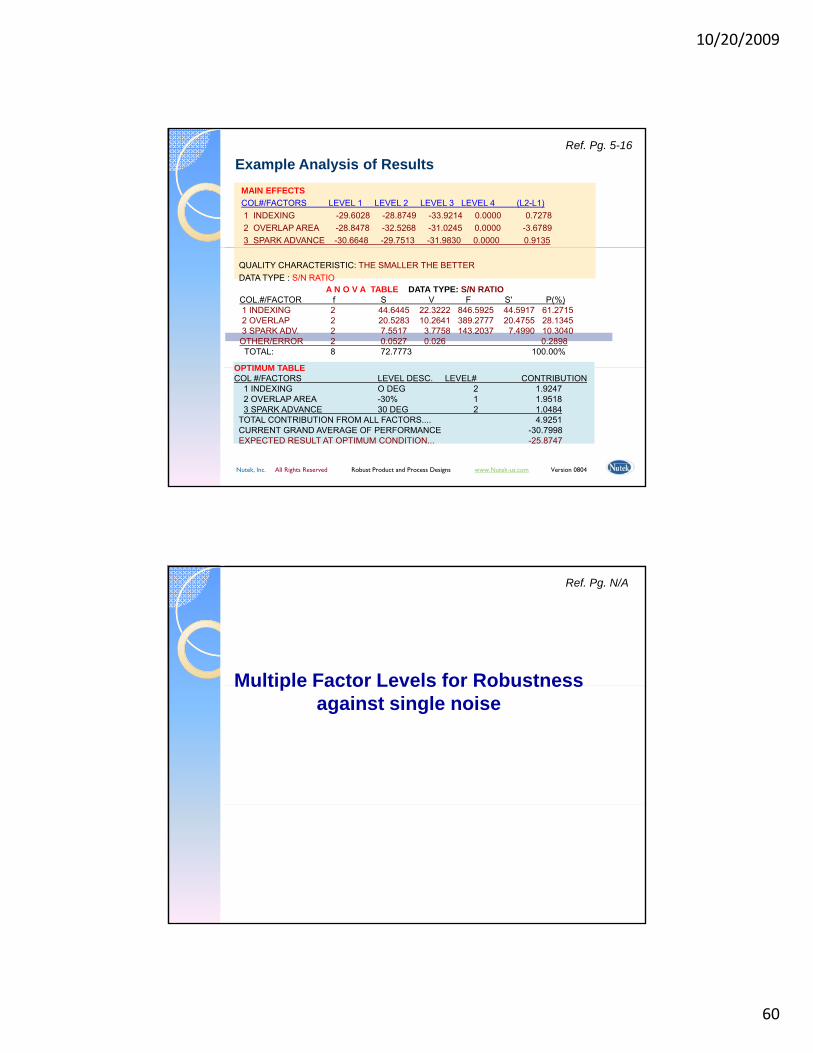
Example Analysis of ResultsMAIN EFFECTSCOL#/FACTORS LEVEL 1 LEVEL 2 LEVEL 3 LEVEL 4 (L2-L1)1 INDEXING -29.6028 -28.8749 -33.9214 0.0000 0.72782 OVERLAP AREA -28.8478 -32.5268 -31.0245 0.0000 -3.67893 SPARK ADVANCE -30.6648 -29.7513 -31.9830 0.0000 0.9135
Ref. Pg. 5-16
QUALITY CHARACTERISTIC: THE SMALLER THE BETTERDATA TYPE : S/N RATIO
OPTIMUM TABLE
A N O V A TABLE DATA TYPE: S/N RATIO COL.#/FACTOR f S V F S' P(%)1 INDEXING 2 44.6445 22.3222 846.5925 44.5917 61.27152 OVERLAP 2 20.5283 10.2641 389.2777 20.4755 28.13453 SPARK ADV. 2 7.5517 3.7758 143.2037 7.4990 10.3040
OTHER/ERROR 2 0.0527 0.026 0.2898TOTAL: 8 72.7773 100.00%
Nutek, Inc. All Rights Reserved Robust Product and Process Designs www.Nutek-us.com Version 0804
OPTIMUM TABLECOL #/FACTORS LEVEL DESC. LEVEL# CONTRIBUTION
1 INDEXING O DEG 2 1.92472 OVERLAP AREA -30% 1 1.95183 SPARK ADVANCE 30 DEG 2 1.0484
TOTAL CONTRIBUTION FROM ALL FACTORS.... 4.9251CURRENT GRAND AVERAGE OF PERFORMANCE -30.7998EXPECTED RESULT AT OPTIMUM CONDITION... -25.8747
Multiple Factor Levels for Robustness
Ref. Pg. N/A
Multiple Factor Levels for Robustness against single noise
10/20/2009
61
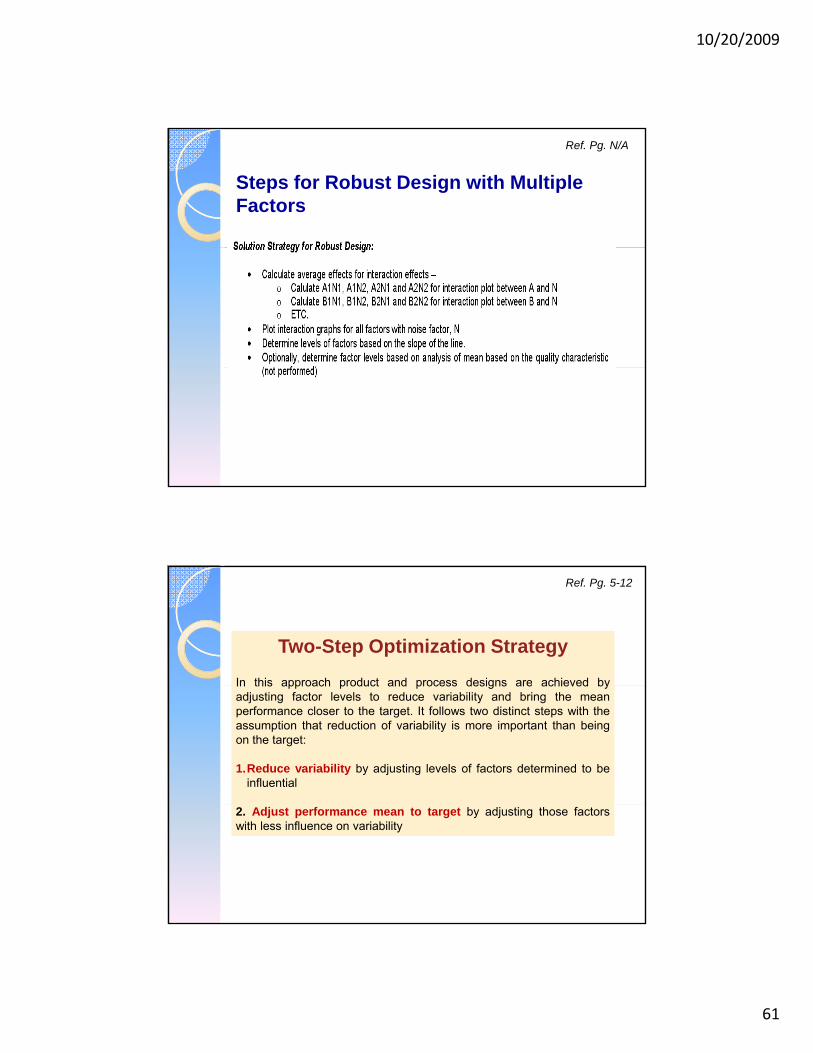
Steps for Robust Design with Multiple Factors
Ref. Pg. N/A
Two-Step Optimization Strategy
In this approach product and process designs are achieved by
Ref. Pg. 5-12
In this approach product and process designs are achieved byadjusting factor levels to reduce variability and bring the meanperformance closer to the target. It follows two distinct steps with theassumption that reduction of variability is more important than beingon the target:
1.Reduce variability by adjusting levels of factors determined to beinfluential
2. Adjust performance mean to target by adjusting those factorswith less influence on variability
10/20/2009
62
Notation Factor Description Level 1 Level 2
A Injection Pressure 1,800 psi 2,250 psi
B Mold Closing Speed Low(Not revealed)
Moderate
C Mold Pressure 600 psi (4.1 950 psi
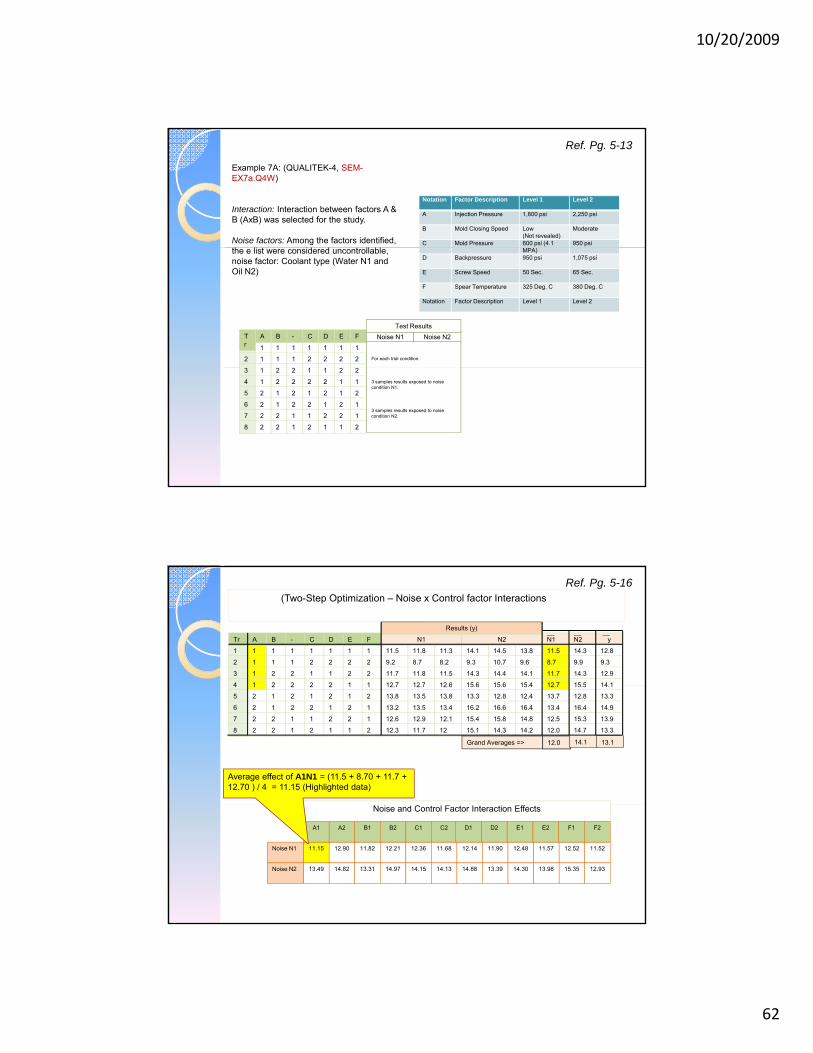
Example 7A: (QUALITEK-4, SEM-EX7a.Q4W)
Interaction: Interaction between factors A & B (AxB) was selected for the study.
Noise factors: Among the factors identified, th li t id d t ll bl
Ref. Pg. 5-13
11 1 1 1 1 1 1
22 1 1 1 2 2 2
ETr
A B - C D F Noise N1 Noise N2Test Results
For each trial condition:
MPA)D Backpressure 950 psi 1,075 psi
E Screw Speed 50 Sec. 65 Sec.
F Spear Temperature 325 Deg. C 380 Deg. C
Notation Factor Description Level 1 Level 2
the e list were considered uncontrollable, noise factor: Coolant type (Water N1 and Oil N2)
23 1 2 2 1 1 2
14 1 2 2 2 2 1
15 2 1 2 1 2 2
26 2 1 2 2 1 1
27 2 2 1 1 2 1
18 2 2 1 2 1 2
3 samples results exposed to noise condition N1.
3 samples results exposed to noise condition N2.
11 1 1 1 1 1 1
22 1 1 1 2 2 2
23 1 2 2 1 1 2
14 1 2 2 2 2 1
ETr A B - C D F N1z z z z z z N2 y
11.511.5 11.8 11.3 14.1 14.5 13.8 14.3 12.8
8.79.2 8.7 8.2 9.3 10.7 9.6 9.9 9.3
11.711.7 11.8 11.5 14.3 14.4 14.1 14.3 12.9
12 712 7 12 7 12 6 15 6 15 6 15 4 15 5 14 1
N1 N2
Results (y) ______
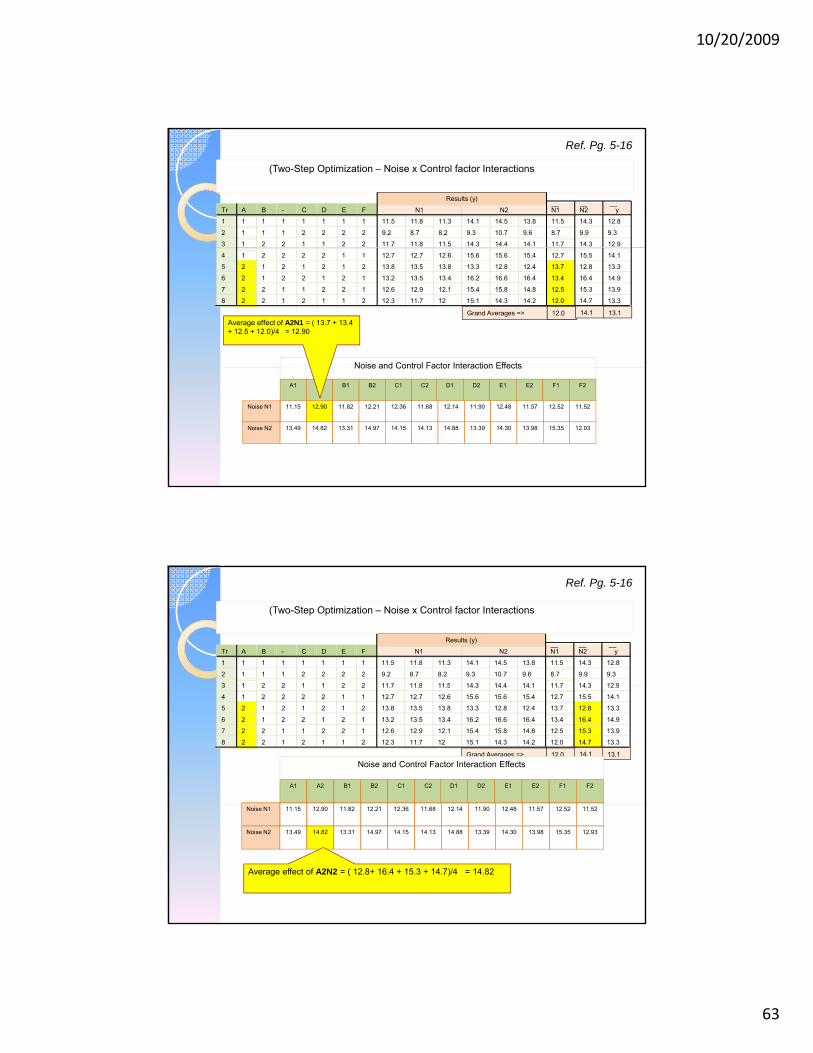
(Two-Step Optimization – Noise x Control factor InteractionsRef. Pg. 5-16
14 1 2 2 2 2 1
15 2 1 2 1 2 2
26 2 1 2 2 1 1
27 2 2 1 1 2 1
18 2 2 1 2 1 2
12.712.7 12.7 12.6 15.6 15.6 15.4 15.5 14.1
13.713.8 13.5 13.8 13.3 12.8 12.4 12.8 13.3
13.413.2 13.5 13.4 16.2 16.6 16.4 16.4 14.9
12.512.6 12.9 12.1 15.4 15.8 14.8 15.3 13.9
12.012.3 11.7 12 15.1 14.3 14.2 14.7 13.3
Grand Averages => 12.0 14.1 13.1
Average effect of A1N1 = (11.5 + 8.70 + 11.7 + 12.70 ) / 4 = 11.15 (Highlighted data)
Noise and Control Factor Interaction Effects
Noise N1
Noise N2
11.15 12.90 11.82 12.21 12.36 11.68 12.14 11.90 12.48 11.57 12.52 11.52
13.49 14.82 13.31 14.97 14.15 14.13 14.88 13.39 14.30 13.98 15.35 12.93
A1 A2 B1 B2 C1 C2 D1 D2 E1 E2 F1 F2
10/20/2009
63
11 1 1 1 1 1 1
22 1 1 1 2 2 2
23 1 2 2 1 1 2
ETr A B - C D F N1z z z z z z N2 y
11.511.5 11.8 11.3 14.1 14.5 13.8 14.3 12.8
8.79.2 8.7 8.2 9.3 10.7 9.6 9.9 9.3
11.711.7 11.8 11.5 14.3 14.4 14.1 14.3 12.9
N1 N2
Results (y) ______
(Two-Step Optimization – Noise x Control factor Interactions
Ref. Pg. 5-16
14 1 2 2 2 2 1
15 2 1 2 1 2 2
26 2 1 2 2 1 1
27 2 2 1 1 2 1
18 2 2 1 2 1 2
12.712.7 12.7 12.6 15.6 15.6 15.4 15.5 14.1
13.713.8 13.5 13.8 13.3 12.8 12.4 12.8 13.3
13.413.2 13.5 13.4 16.2 16.6 16.4 16.4 14.9
12.512.6 12.9 12.1 15.4 15.8 14.8 15.3 13.9
12.012.3 11.7 12 15.1 14.3 14.2 14.7 13.3
Grand Averages => 12.0 14.1 13.1
Noise and Control Factor Interaction Effects
Average effect of A2N1 = ( 13.7 + 13.4 + 12.5 + 12.0)/4 = 12.90
Noise and Control Factor Interaction Effects
Noise N1
Noise N2
11.15 12.90 11.82 12.21 12.36 11.68 12.14 11.90 12.48 11.57 12.52 11.52
13.49 14.82 13.31 14.97 14.15 14.13 14.88 13.39 14.30 13.98 15.35 12.93
A1 A2 B1 B2 C1 C2 D1 D2 E1 E2 F1 F2
11 1 1 1 1 1 1
22 1 1 1 2 2 2
23 1 2 2 1 1 2
ETr A B - C D F N1z z z z z z N2 y
11.511.5 11.8 11.3 14.1 14.5 13.8 14.3 12.8
8.79.2 8.7 8.2 9.3 10.7 9.6 9.9 9.3
11 711 7 11 8 11 5 14 3 14 4 14 1 14 3 12 9
N1 N2
Results (y) ______
(Two-Step Optimization – Noise x Control factor Interactions
Ref. Pg. 5-16
23 1 2 2 1 1 2
14 1 2 2 2 2 1
15 2 1 2 1 2 2
26 2 1 2 2 1 1
27 2 2 1 1 2 1
18 2 2 1 2 1 2
11.711.7 11.8 11.5 14.3 14.4 14.1 14.3 12.9
12.712.7 12.7 12.6 15.6 15.6 15.4 15.5 14.1
13.713.8 13.5 13.8 13.3 12.8 12.4 12.8 13.3
13.413.2 13.5 13.4 16.2 16.6 16.4 16.4 14.9
12.512.6 12.9 12.1 15.4 15.8 14.8 15.3 13.9
12.012.3 11.7 12 15.1 14.3 14.2 14.7 13.3
Grand Averages => 12.0 14.1 13.1Noise and Control Factor Interaction Effects
A1 A2 B1 B2 C1 C2 D1 D2 E1 E2 F1 F2
Noise N1
Noise N2
11.15 12.90 11.82 12.21 12.36 11.68 12.14 11.90 12.48 11.57 12.52 11.52
13.49 14.82 13.31 14.97 14.15 14.13 14.88 13.39 14.30 13.98 15.35 12.93
Average effect of A2N2 = ( 12.8+ 16.4 + 15.3 + 14.7)/4 = 14.82
10/20/2009
64
Noise and Control Factor Interaction Effects
Noise N1
Noise N2
11.15 12.90 11.82 12.21 12.36 11.68 12.14 11.90 12.48 11.57 12.52 11.52
13.49 14.82 13.31 14.97 14.15 14.13 14.88 13.39 14.30 13.98 15.35 12.93
A1 A2 B1 B2 C1 C2 D1 D2 E1 E2 F1 F2
14.50
14.00
15.50
15.00
A2 B2
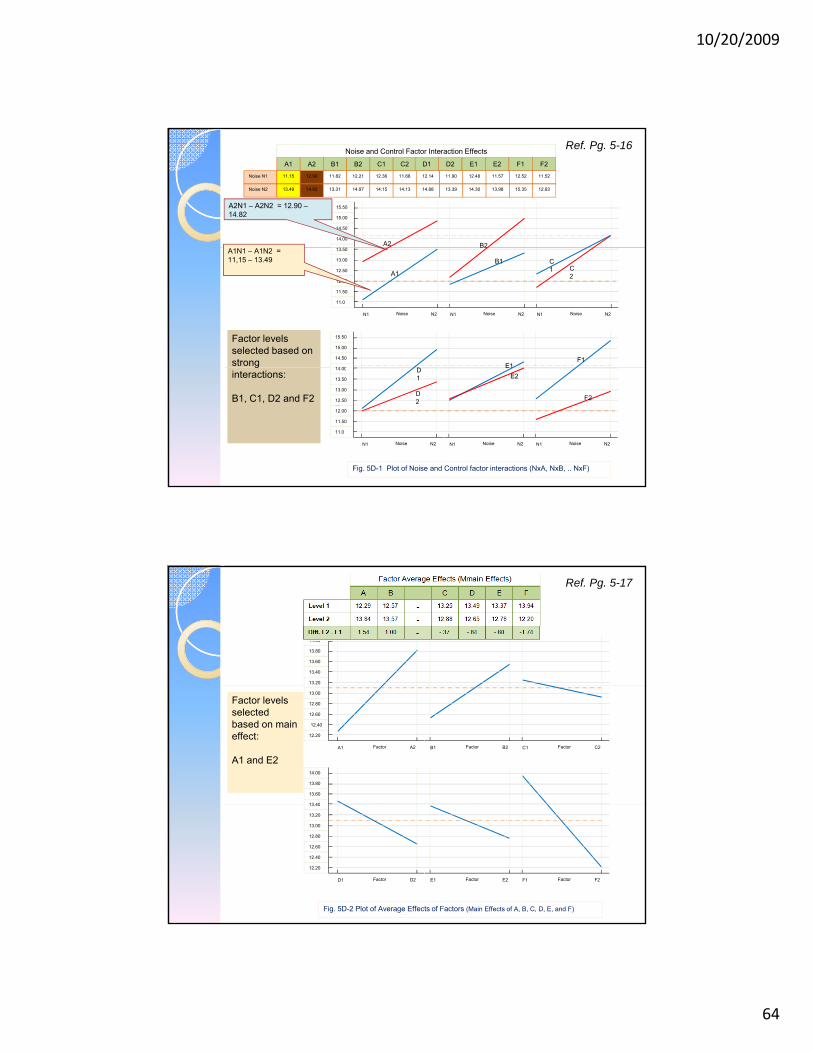
A2N1 – A2N2 = 12.90 –14.82
Ref. Pg. 5-16
13.50
13.00
12.50xx12.00
11.50
11.0
N2N1 Noise N2N1 Noise N2N1 Noise
B1
A1
C1
B2
C2
14.50
14 00
15.50
15.00
E1F1
A1N1 – A1N2 = 11,15 – 13.49
Factor levels selected based on strong
14.00
13.50
13.00
12.50xx12.00
11.50
11.0
N2N1 Noise N2N1 Noise N2N1 Noise
D1
E1
D2
E2
F2
Fig. 5D-1 Plot of Noise and Control factor interactions (NxA, NxB, .. NxF)
ginteractions:
B1, C1, D2 and F2
13.60
13.40
13.20
14.00
13.80
Ref. Pg. 5-17
13.00
12.80
12.60
12.40
12.20
A2A1 Factor B2B1 Factor C2C1 Factor
13.60
13 40
14.00
13.80
Factor levels selected based on main effect:
A1 and E2
13.40
13.20
13.00
12.80
12.60
12.40
12.20
D2D1 Factor E2E1 Factor F2F1 Factor
Fig. 5D-2 Plot of Average Effects of Factors (Main Effects of A, B, C, D, E, and F)
10/20/2009
65
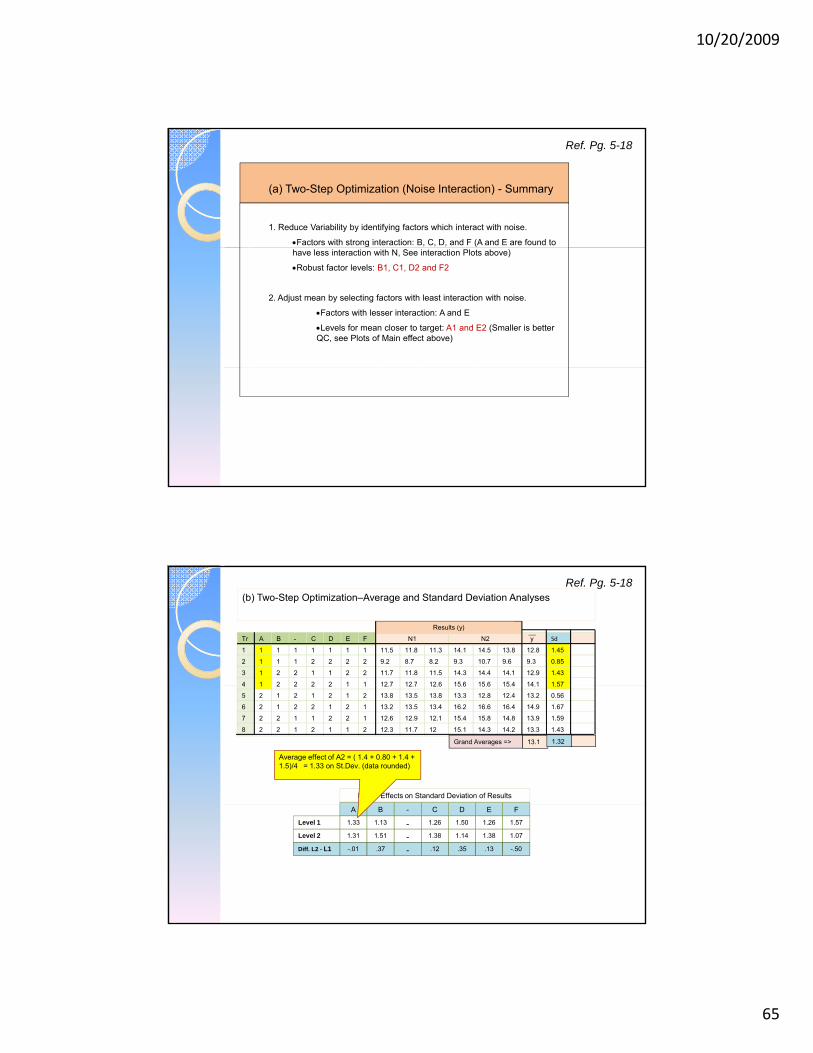
(a) Two-Step Optimization (Noise Interaction) - Summary
1. Reduce Variability by identifying factors which interact with noise.
•Factors with strong interaction: B, C, D, and F (A and E are found to
Ref. Pg. 5-18
have less interaction with N, See interaction Plots above)
•Robust factor levels: B1, C1, D2 and F2
2. Adjust mean by selecting factors with least interaction with noise.
•Factors with lesser interaction: A and E
•Levels for mean closer to target: A1 and E2 (Smaller is better QC, see Plots of Main effect above)
11 1 1 1 1 1 1
22 1 1 1 2 2 2
23 1 2 2 1 1 2
14 1 2 2 2 2 1
ETr A B - C D F yz z z z z z Sd
12.811.5 11.8 11.3 14.1 14.5 13.8 1.45
9.39.2 8.7 8.2 9.3 10.7 9.6 0.85
12.911.7 11.8 11.5 14.3 14.4 14.1 1.43
14 112 7 12 7 12 6 15 6 15 6 15 4 1 57
N1 N2
Results (y) __
(b) Two-Step Optimization–Average and Standard Deviation AnalysesRef. Pg. 5-18
14 1 2 2 2 2 1
15 2 1 2 1 2 2
26 2 1 2 2 1 1
27 2 2 1 1 2 1
18 2 2 1 2 1 2
14.112.7 12.7 12.6 15.6 15.6 15.4 1.57
13.213.8 13.5 13.8 13.3 12.8 12.4 0.56
14.913.2 13.5 13.4 16.2 16.6 16.4 1.67
13.912.6 12.9 12.1 15.4 15.8 14.8 1.59
13.312.3 11.7 12 15.1 14.3 14.2 1.43
Grand Averages => 13.1 1.32
Factor Effects on Standard Deviation of Results
Average effect of A2 = ( 1.4 + 0.80 + 1.4 + 1.5)/4 = 1.33 on St.Dev. (data rounded)
A B - C D E F
1.33 1.13 - 1.26 1.50 1.26 1.57Level 1
1.31 1.51 - 1.38 1.14 1.38 1.07Level 2
-.01 .37 - .12 .35 .13 -.50Diff. L2 - L1
10/20/2009
66
1.40
1.35
1.30
1.25
1.20
1.15
1.10
1.50
1.45
Ref. Pg. 5-19
1.05
A2A1 Factor B2B1 Factor C2C1 Factor
1.40
1.35
1.30
1.25
1.50
1.45
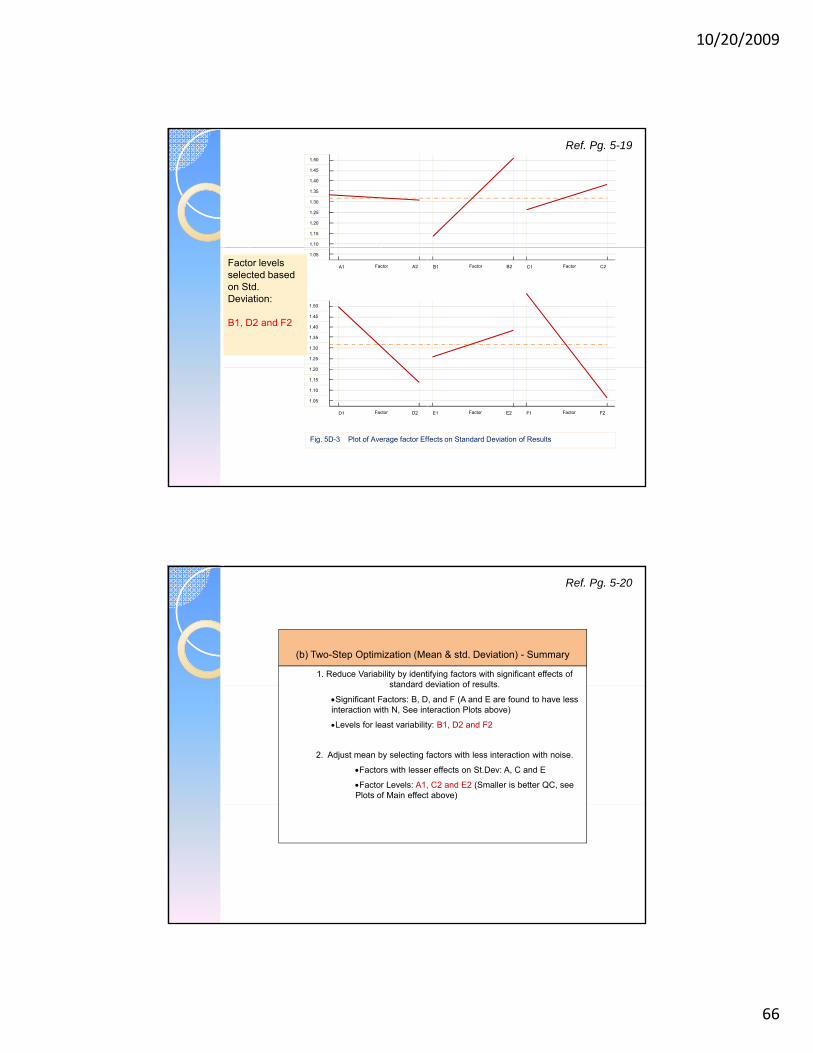
Factor levels selected based on Std. Deviation:
B1, D2 and F2
1.20
1.15
1.10
1.05
D2D1 Factor E2E1 Factor F2F1 Factor
Fig. 5D-3 Plot of Average factor Effects on Standard Deviation of Results
(b) Two-Step Optimization (Mean & std. Deviation) - Summary
1. Reduce Variability by identifying factors with significant effects of standard deviation of results
Ref. Pg. 5-20
standard deviation of results.
•Significant Factors: B, D, and F (A and E are found to have less interaction with N, See interaction Plots above)
•Levels for least variability: B1, D2 and F2
2. Adjust mean by selecting factors with less interaction with noise.
•Factors with lesser effects on St.Dev: A, C and E
•Factor Levels: A1, C2 and E2 (Smaller is better QC, see Plots of Main effect above)
10/20/2009
67
11 1 1 1 1 1 1
22 1 1 1 2 2 2
23 1 2 2 1 1 2
14 1 2 2 2 2 1
ETr A B - C D F yz z z z z z Sd S/N
12.811.5 11.8 11.3 14.1 14.5 13.8 1.45 -22.2
9.39.2 8.7 8.2 9.3 10.7 9.6 0.85 9.3
12.911.7 11.8 11.5 14.3 14.4 14.1 1.43 12.9
14 112 7 12 7 12 6 15 6 15 6 15 4 1 57 14 1
N1 N2
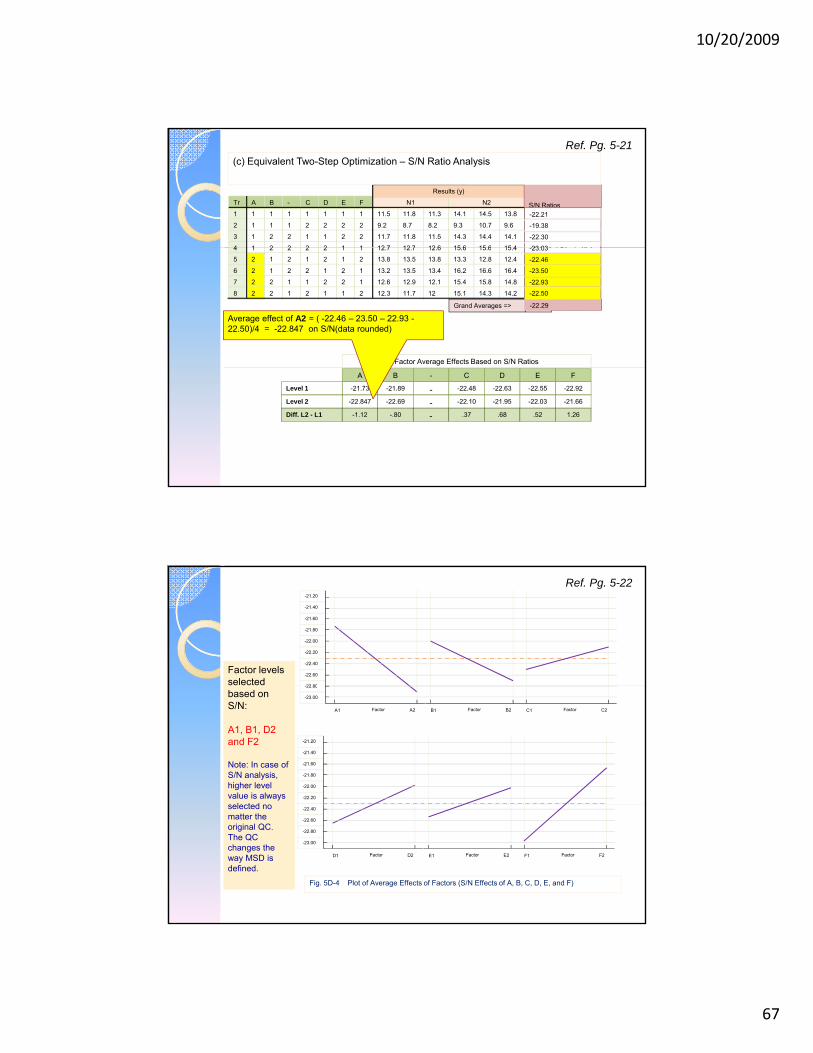
Results (y) __S/N Ratios
-22.30
23 03
-22.21
-19.38
(c) Equivalent Two-Step Optimization – S/N Ratio AnalysisRef. Pg. 5-21
14 1 2 2 2 2 1
15 2 1 2 1 2 2
26 2 1 2 2 1 1
27 2 2 1 1 2 1
18 2 2 1 2 1 2
14.112.7 12.7 12.6 15.6 15.6 15.4 1.57 14.1
13.213.8 13.5 13.8 13.3 12.8 12.4 0.56 13.2
14.913.2 13.5 13.4 16.2 16.6 16.4 1.67 14.9
13.912.6 12.9 12.1 15.4 15.8 14.8 1.59 13.9
13.312.3 11.7 12 15.1 14.3 14.2 1.43 13.3
Grand Averages => 13.1 1.32 13.1-22.29
-23.03
-22.93
-22.50
-22.46
-23.50
Factor Average Effects Based on S/N Ratios
Average effect of A2 = ( -22.46 – 23.50 – 22.93 -22.50)/4 = -22.847 on S/N(data rounded)
A B - C D E F
-21.73 -21.89 - -22.48 -22.63 -22.55 -22.92Level 1
-22.847 -22.69 - -22.10 -21.95 -22.03 -21.66Level 2
-1.12 -.80 - .37 .68 .52 1.26Diff. L2 - L1
-21.60
-21.80
-22.00
-22.20
-22.40
-22.60
22 80
-21.20
-21.40
Factor levels selected
Ref. Pg. 5-22
-22.80
-23.00
A2A1 Factor B2B1 Factor C2C1 Factor
-21.60
-21.80
-22.00
-22.20
-21.20
-21.40
se ectedbased on S/N:
A1, B1, D2 and F2
Note: In case of S/N analysis, higher level value is always selected no -22.40
-22.60
-22.80
-23.00
D2D1 Factor E2E1 Factor F2F1 Factor
Fig. 5D-4 Plot of Average Effects of Factors (S/N Effects of A, B, C, D, E, and F)
selected no matter the original QC. The QC changes the way MSD is defined.
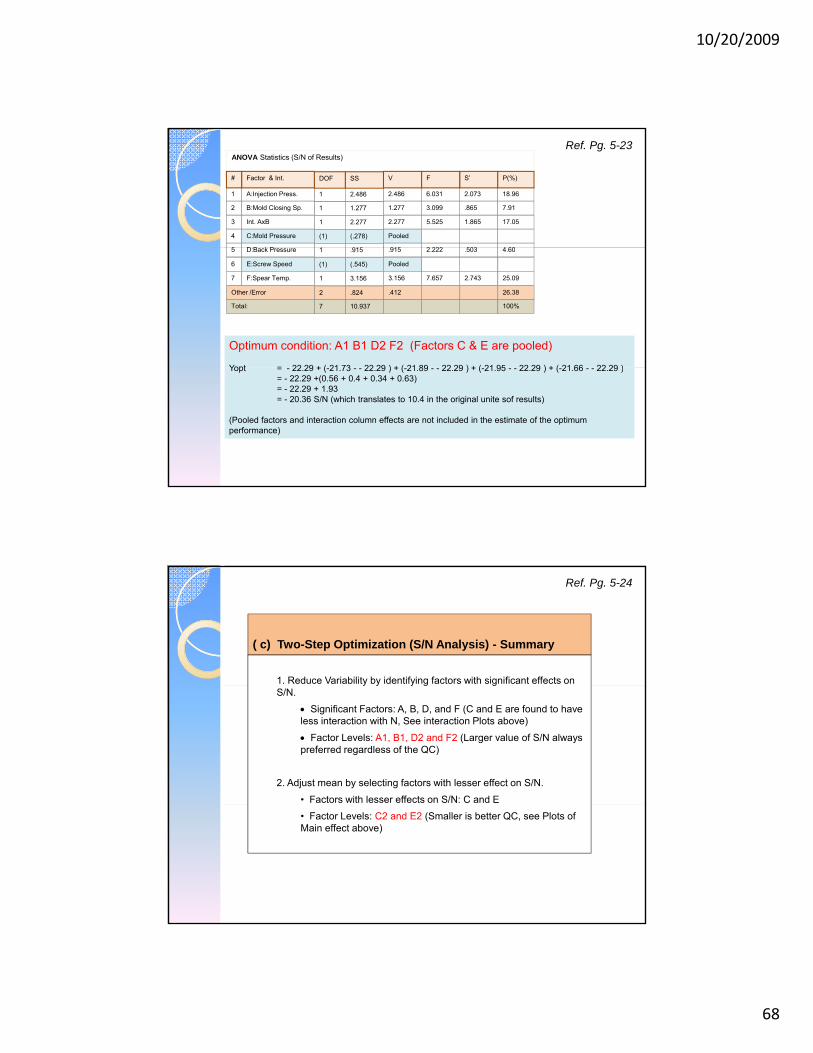
10/20/2009
68
1 1A:Injection Press. 2.073 18.966.0312.4862.486
2 1B:Mold Closing Sp. .865 7.913.0991.2771.277
3 1Int. AxB 1.865 17.055.5252.2772.277
4 (1)C:Mold Pressure Pooled(.278)
5 1D B k P 503 4 602 222915915
ANOVA Statistics (S/N of Results)
# DOFFactor & Int. S’ P(%)FVSS
Ref. Pg. 5-23
2Other /Error 26.38.412.824
7Total: 100%10.937
5 1D:Back Pressure .503 4.602.222.915.915
6 (1)E:Screw Speed Pooled(.545)
7 1F:Spear Temp. 2.743 25.097.6573.1563.156
Optimum condition: A1 B1 D2 F2 (Factors C & E are pooled)
Yopt = 22 29 + ( 21 73 22 29 ) + ( 21 89 22 29 ) + ( 21 95 22 29 ) + ( 21 66 22 29 )Yopt = - 22.29 + (-21.73 - - 22.29 ) + (-21.89 - - 22.29 ) + (-21.95 - - 22.29 ) + (-21.66 - - 22.29 )= - 22.29 +(0.56 + 0.4 + 0.34 + 0.63)= - 22.29 + 1.93= - 20.36 S/N (which translates to 10.4 in the original unite sof results)
(Pooled factors and interaction column effects are not included in the estimate of the optimum performance)
( c) Two-Step Optimization (S/N Analysis) - Summary
1. Reduce Variability by identifying factors with significant effects on
Ref. Pg. 5-24
y y y g gS/N.
• Significant Factors: A, B, D, and F (C and E are found to have less interaction with N, See interaction Plots above)
• Factor Levels: A1, B1, D2 and F2 (Larger value of S/N always preferred regardless of the QC)
2. Adjust mean by selecting factors with lesser effect on S/N.
• Factors with lesser effects on S/N: C and E
• Factor Levels: C2 and E2 (Smaller is better QC, see Plots of Main effect above)
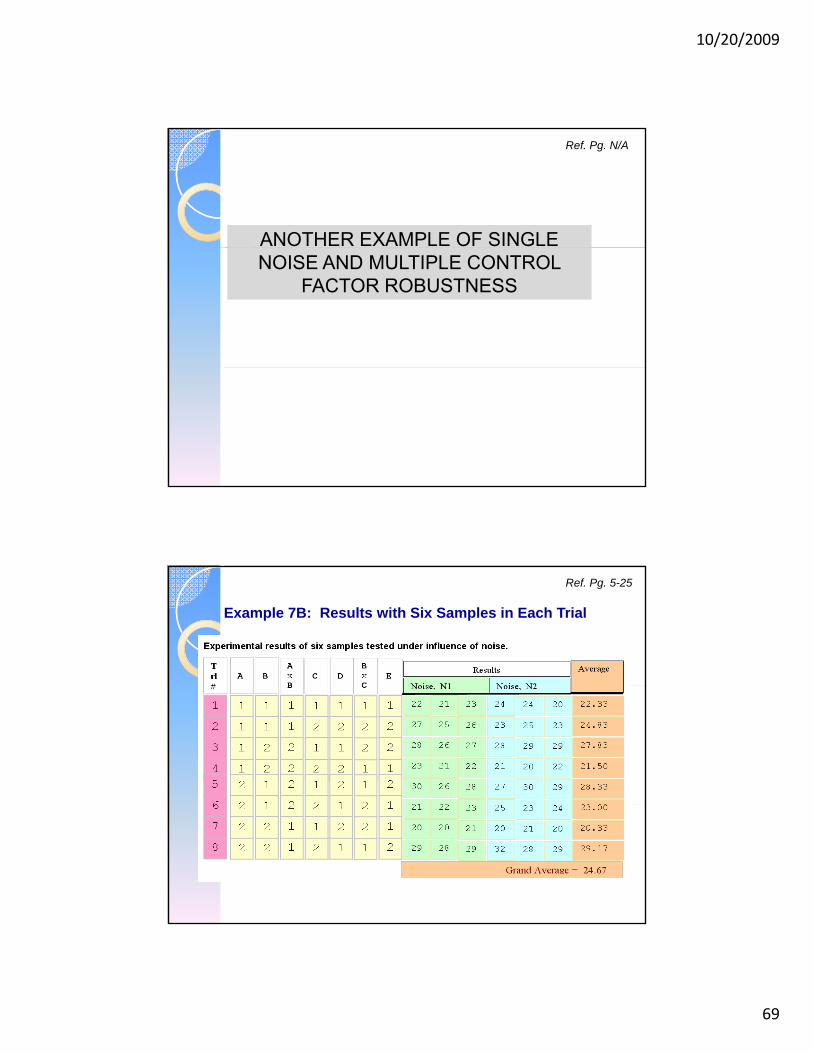
10/20/2009
69
ANOTHER EXAMPLE OF SINGLE
Ref. Pg. N/A
NOISE AND MULTIPLE CONTROL FACTOR ROBUSTNESS
Example 7B: Results with Six Samples in Each Trial
Ref. Pg. 5-25
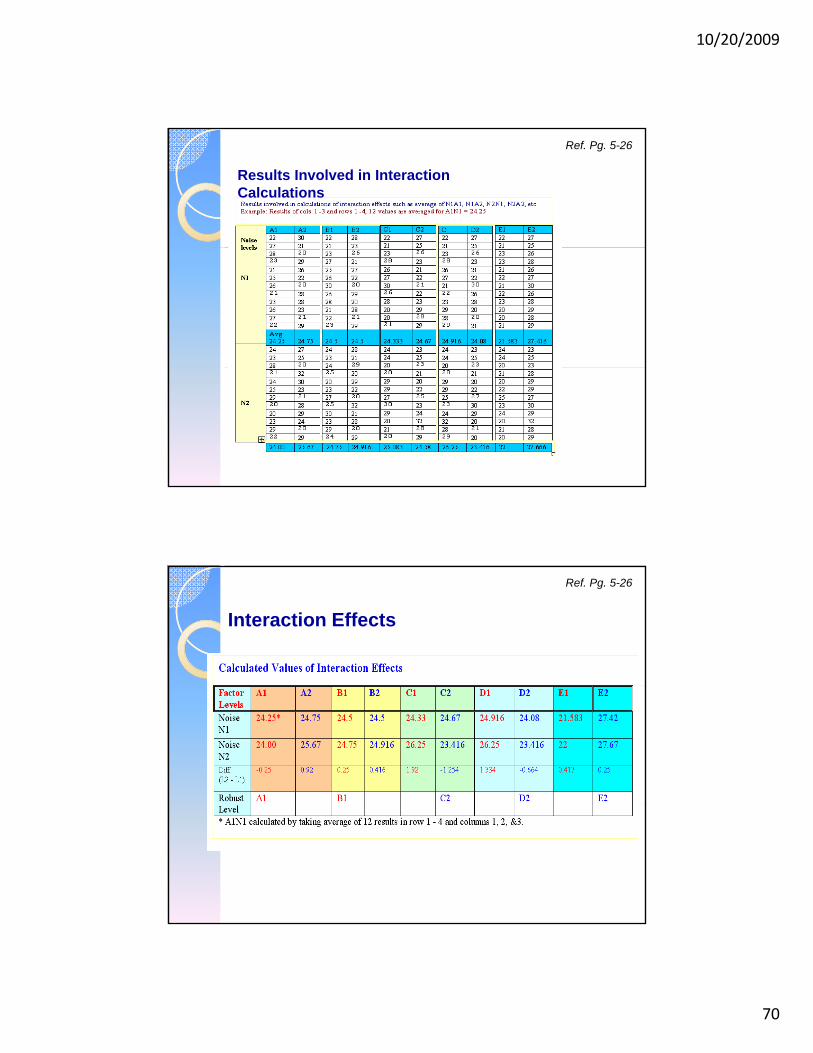
10/20/2009
70
Results Involved in Interaction Calculations
Ref. Pg. 5-26
Interaction Effects
Ref. Pg. 5-26
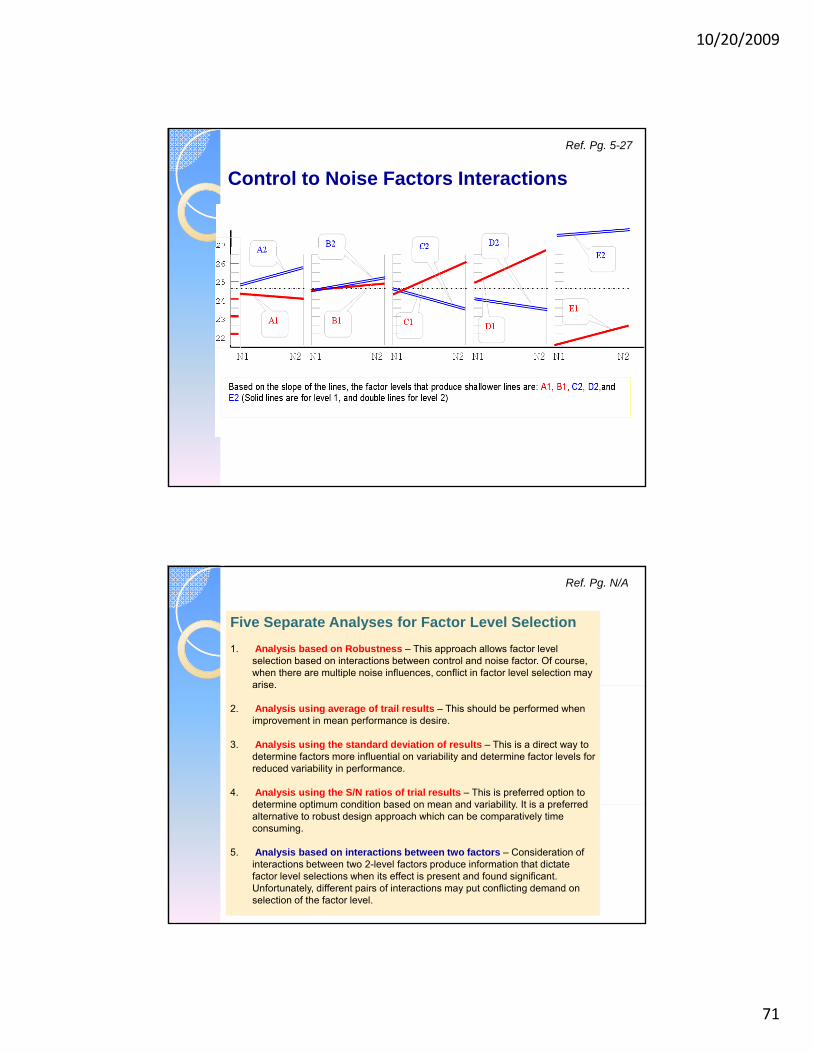
10/20/2009
71
Control to Noise Factors Interactions
Ref. Pg. 5-27
Five Separate Analyses for Factor Level Selection1. Analysis based on Robustness – This approach allows factor level
selection based on interactions between control and noise factor. Of course, when there are multiple noise influences, conflict in factor level selection may arise
Ref. Pg. N/A
arise.
2. Analysis using average of trail results – This should be performed when improvement in mean performance is desire.
3. Analysis using the standard deviation of results – This is a direct way to determine factors more influential on variability and determine factor levels for reduced variability in performance.
4. Analysis using the S/N ratios of trial results – This is preferred option to determine optimum condition based on mean and variability It is a preferreddetermine optimum condition based on mean and variability. It is a preferred alternative to robust design approach which can be comparatively time consuming.
5. Analysis based on interactions between two factors – Consideration of interactions between two 2-level factors produce information that dictate factor level selections when its effect is present and found significant. Unfortunately, different pairs of interactions may put conflicting demand on selection of the factor level.
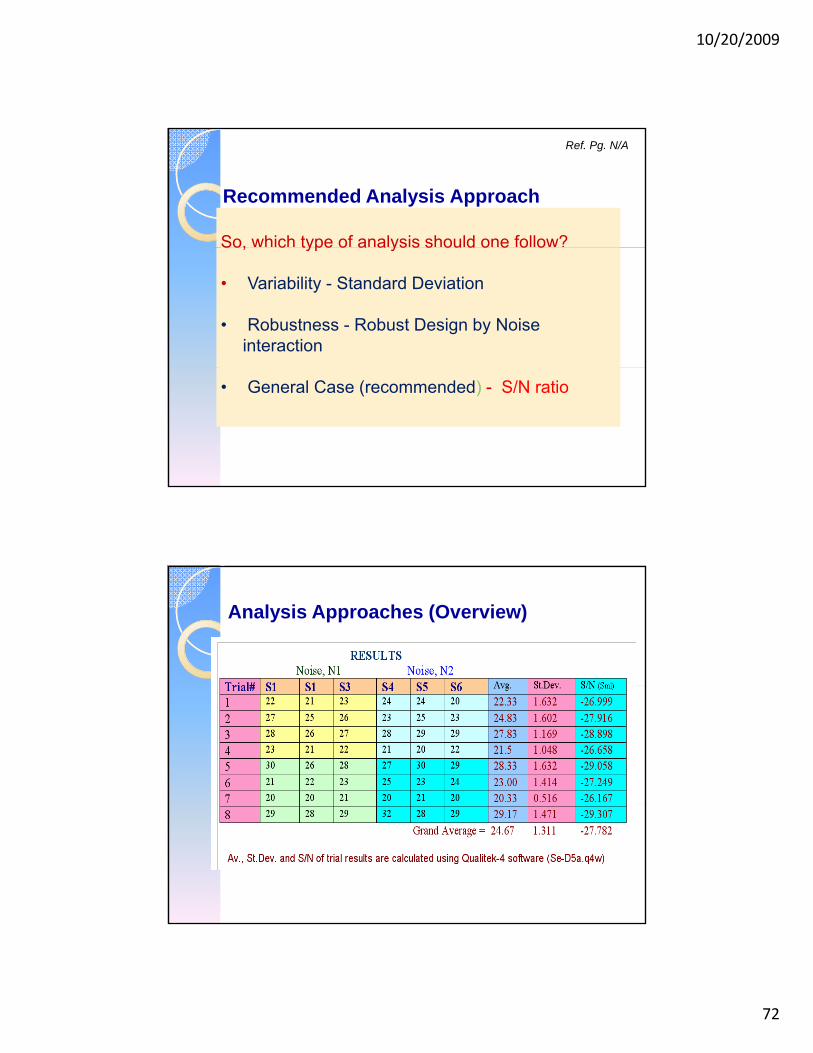
10/20/2009
72
So, which type of analysis should one follow?
Recommended Analysis Approach
Ref. Pg. N/A
So, c type o a a ys s s ou d o e o o
• Variability - Standard Deviation
• Robustness - Robust Design by Noise interaction
• General Case (recommended) - S/N ratio
Analysis Approaches (Overview)

10/20/2009
73
AN EXAMPLE OF MULTIPLE NOISE AND MULTIPLE CONTROL FACTOR
Ref. Pg. N/A
AND MULTIPLE CONTROL FACTOR ROBUSTNESS
Structure and Information in Designs with Noise factors Ref. Pg. 5-33
ETr A B - C D F
Outer Array (L-4)
NC
NB
NA
1
1
1
1
2
2
2
1
3
2
1
2
4
1
2
2Control Factors
Noise
NA:Oven Type, NB:Tempertaure, NC:Humidity
11 1 1 1 1 1 1
22 1 1 1 2 2 2
23 1 2 2 1 1 2
14 1 2 2 2 2 1
15 2 1 2 1 2 2
26 2 1 2 2 1 1
27 2 2 1 1 2 1
18 2 2 1 2 1 2
Inner Array (L-8)
R12
R22
R32
R42
R52
R62
R72
R82
R11
R21
R31
R41
R51
R61
R71
R81
R13
R23
R33
R43
R51
R63
R73
R83
R14
R24
R34
R44
R54
R64
R74
R84
Nutek, Inc. All Rights Reserved Robust Product and Process Designs www.Nutek-us.com Version 0804
Order of Sophistication in Experiment Design (From most to least desirable options)
1. Formal treatment of noise factors by outer array design
2. Repeating experiments with "RANDOM NOISE“
3. Run multiple samples per trial (Simply repeat)
4. Run one sample per trial (Poor man's experiment)
e ay ( 8)
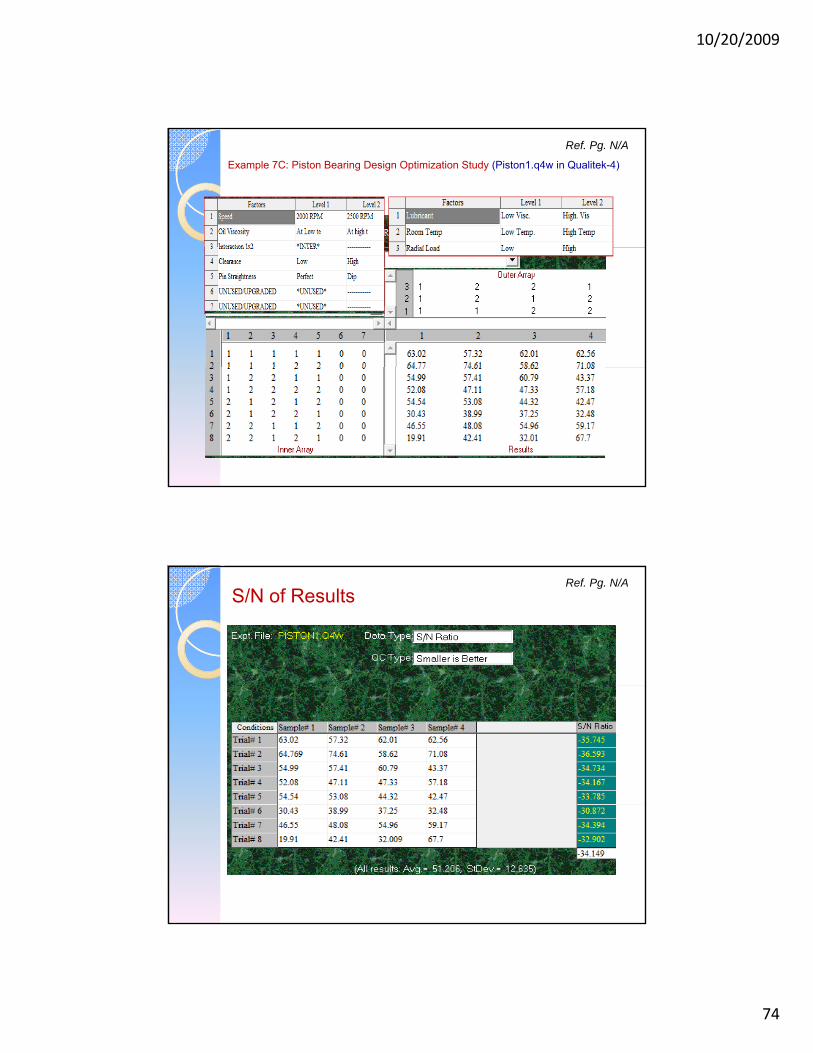
10/20/2009
74
Ref. Pg. N/A
Example 7C: Piston Bearing Design Optimization Study (Piston1.q4w in Qualitek-4)
Ref. Pg. N/AS/N of Results
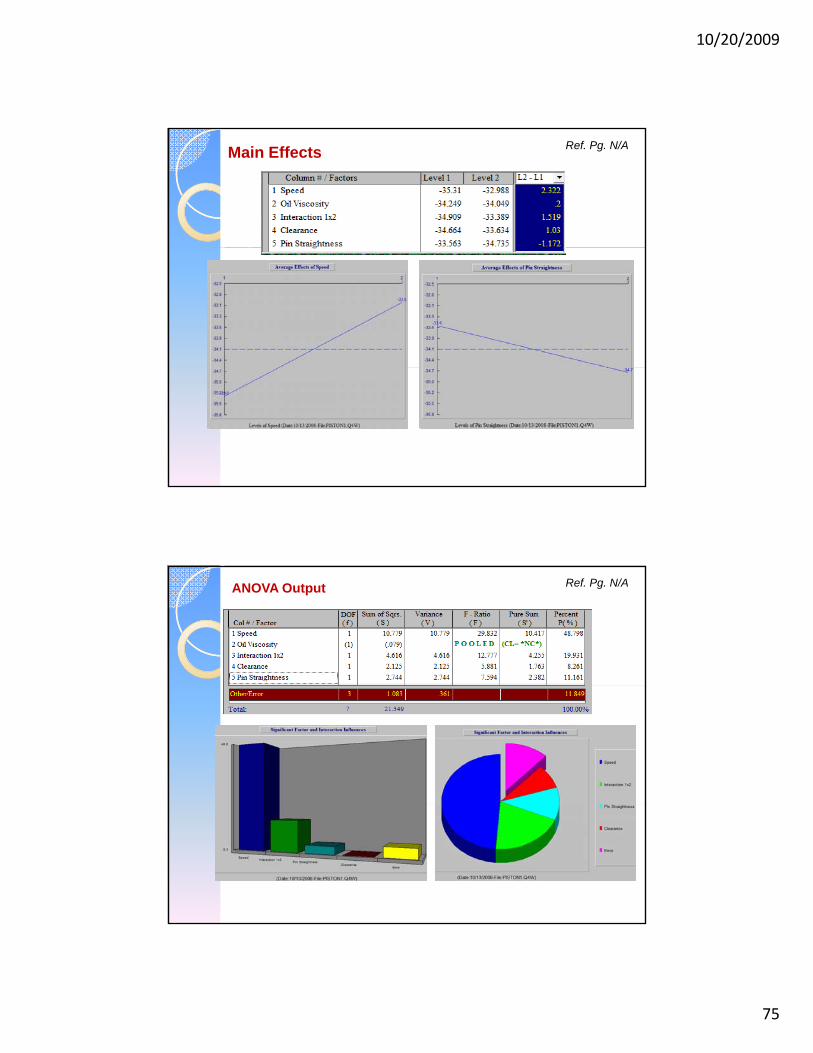
10/20/2009
75
Ref. Pg. N/AMain Effects
Ref. Pg. N/AANOVA Output
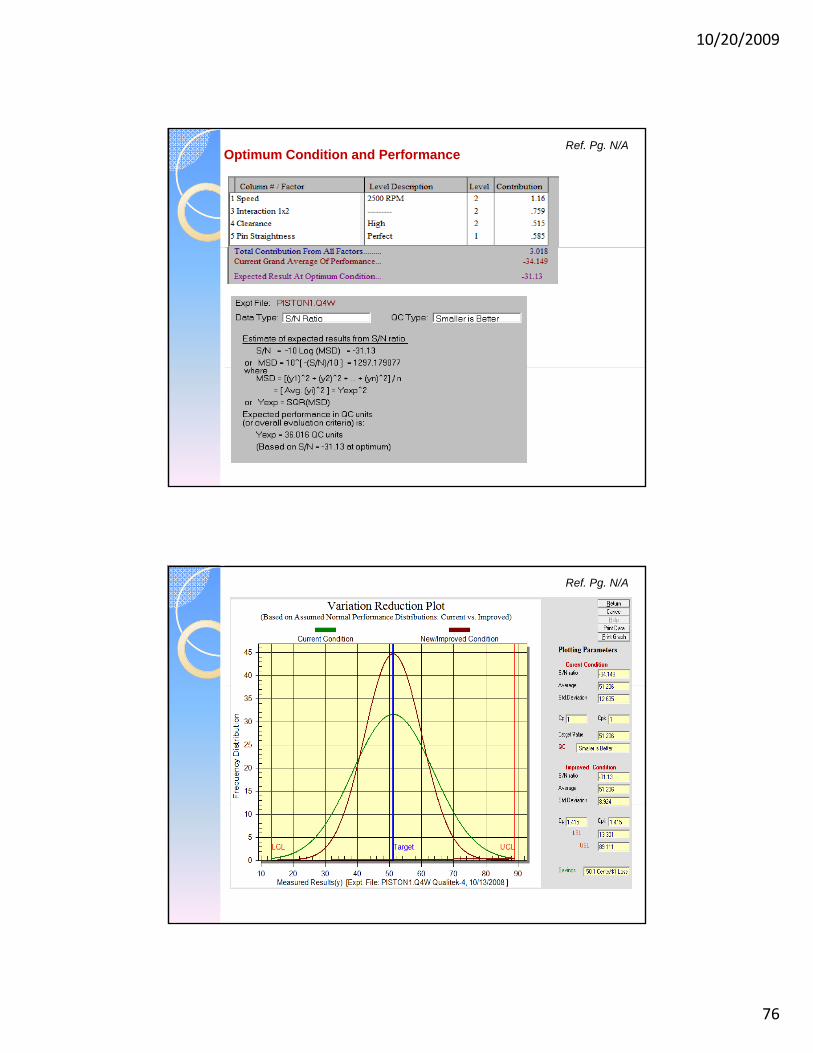
10/20/2009
76
Ref. Pg. N/AOptimum Condition and Performance
Ref. Pg. N/A
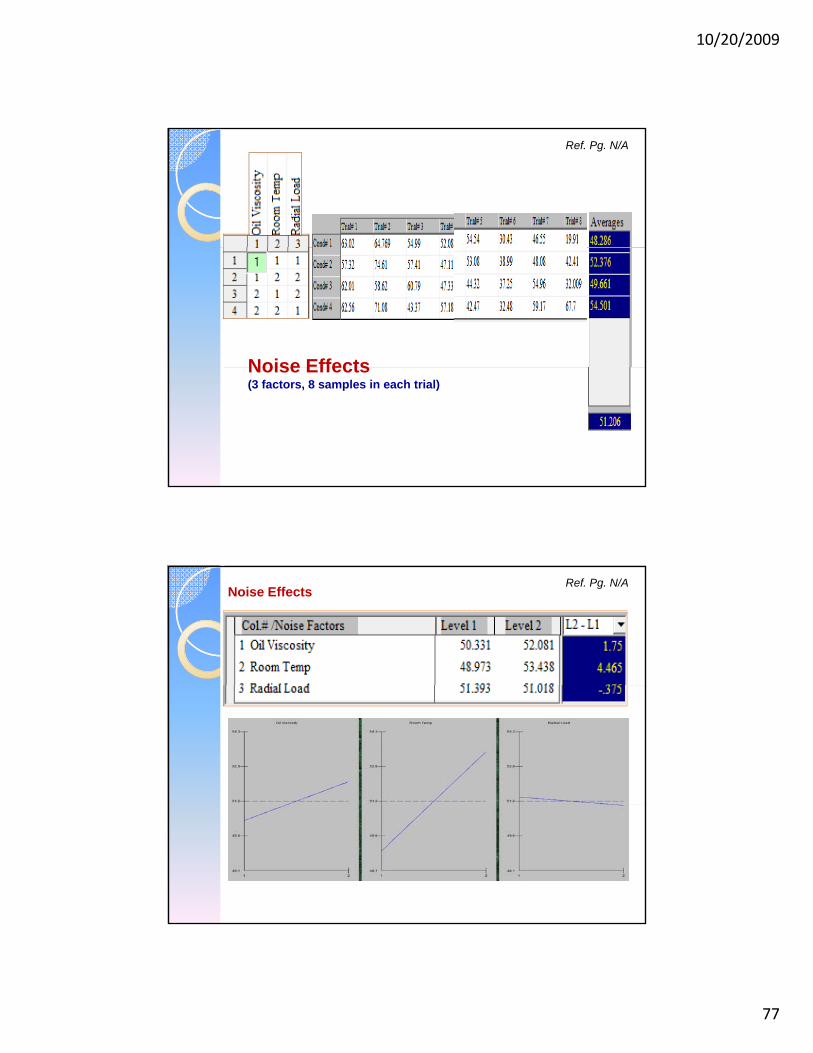
10/20/2009
77
Ref. Pg. N/A
Noise EffectsNoise Effects (3 factors, 8 samples in each trial)
Ref. Pg. N/ANoise Effects
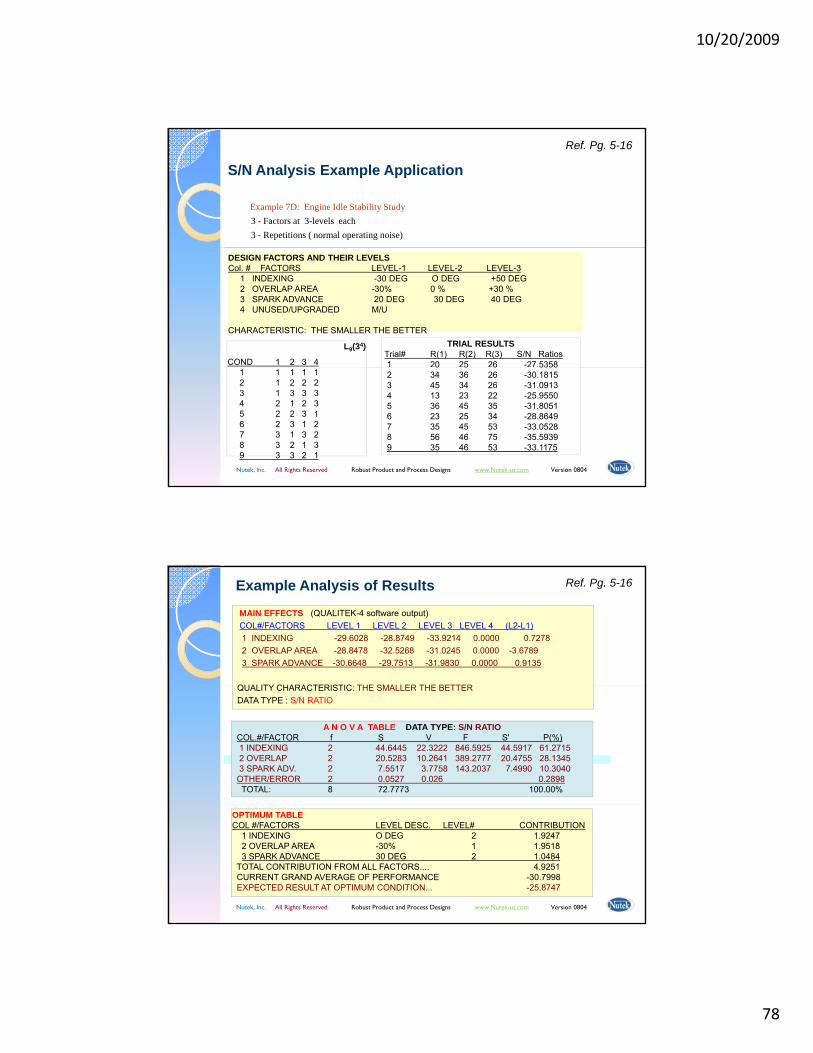
10/20/2009
78
Example 7D: Engine Idle Stability Study3 - Factors at 3-levels each3 - Repetitions ( normal operating noise)
S/N Analysis Example Application
Ref. Pg. 5-16
DESIGN FACTORS AND THEIR LEVELSCol. # FACTORS LEVEL-1 LEVEL-2 LEVEL-3
1 INDEXING -30 DEG O DEG +50 DEG2 OVERLAP AREA -30% 0 % +30 %3 SPARK ADVANCE 20 DEG 30 DEG 40 DEG4 UNUSED/UPGRADED M/U
CHARACTERISTIC: THE SMALLER THE BETTER
L9(34)
COND 1 2 3 4
TRIAL RESULTS Trial# R(1) R(2) R(3) S/N Ratios 1 20 25 26 -27.5358
Nutek, Inc. All Rights Reserved Robust Product and Process Designs www.Nutek-us.com Version 0804
1 1 1 1 12 1 2 2 23 1 3 3 34 2 1 2 35 2 2 3 1 6 2 3 1 27 3 1 3 28 3 2 1 39 3 3 2 1
0 5 6 53582 34 36 26 -30.1815 3 45 34 26 -31.0913 4 13 23 22 -25.9550 5 36 45 35 -31.8051 6 23 25 34 -28.86497 35 45 53 -33.0528 8 56 46 75 -35.5939 9 35 46 53 -33.1175
Example Analysis of Results
MAIN EFFECTS (QUALITEK-4 software output)COL#/FACTORS LEVEL 1 LEVEL 2 LEVEL 3 LEVEL 4 (L2-L1)1 INDEXING -29.6028 -28.8749 -33.9214 0.0000 0.72782 OVERLAP AREA -28.8478 -32.5268 -31.0245 0.0000 -3.67893 SPARK ADVANCE -30.6648 -29.7513 -31.9830 0.0000 0.9135
QUALITY CHARACTERISTIC THE SMALLER THE BETTER
Ref. Pg. 5-16
QUALITY CHARACTERISTIC: THE SMALLER THE BETTERDATA TYPE : S/N RATIO
A N O V A TABLE DATA TYPE: S/N RATIO COL.#/FACTOR f S V F S' P(%)1 INDEXING 2 44.6445 22.3222 846.5925 44.5917 61.27152 OVERLAP 2 20.5283 10.2641 389.2777 20.4755 28.13453 SPARK ADV. 2 7.5517 3.7758 143.2037 7.4990 10.3040
OTHER/ERROR 2 0.0527 0.026 0.2898TOTAL: 8 72.7773 100.00%
Nutek, Inc. All Rights Reserved Robust Product and Process Designs www.Nutek-us.com Version 0804
OPTIMUM TABLECOL #/FACTORS LEVEL DESC. LEVEL# CONTRIBUTION
1 INDEXING O DEG 2 1.92472 OVERLAP AREA -30% 1 1.95183 SPARK ADVANCE 30 DEG 2 1.0484
TOTAL CONTRIBUTION FROM ALL FACTORS.... 4.9251CURRENT GRAND AVERAGE OF PERFORMANCE -30.7998EXPECTED RESULT AT OPTIMUM CONDITION... -25.8747
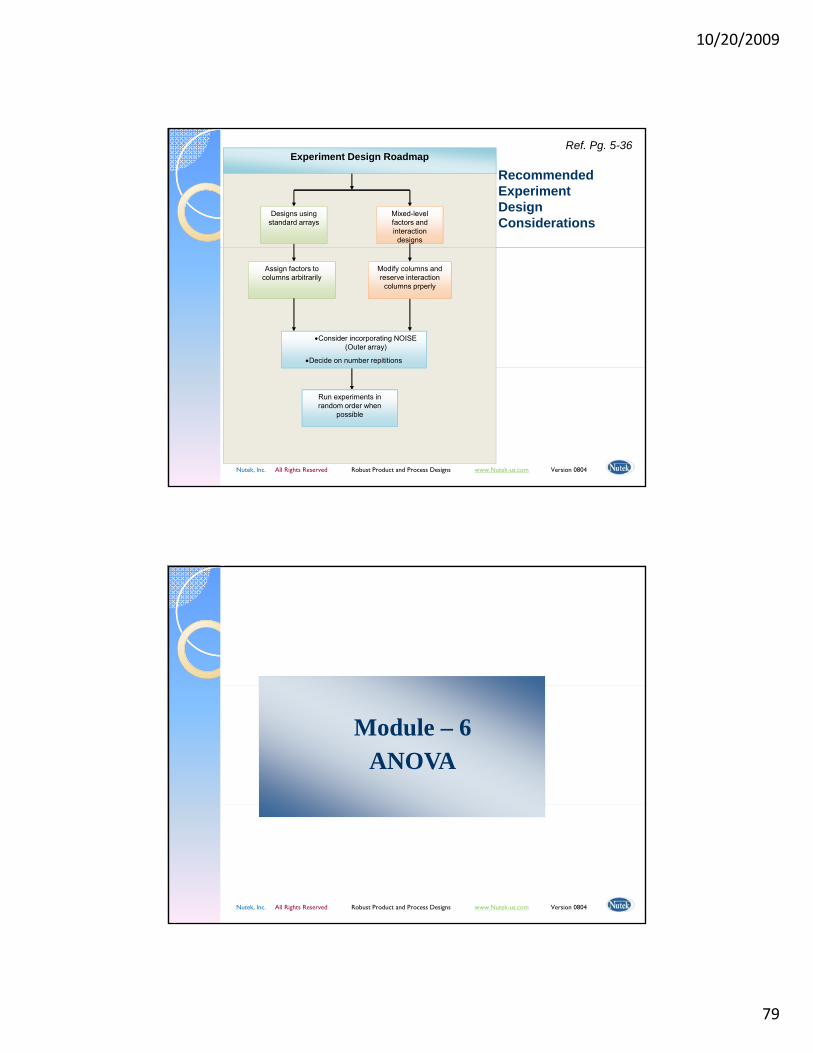
10/20/2009
79
Recommended Experiment Design Considerations
Ref. Pg. 5-36Experiment Design Roadmap
Designs using standard arrays
g
Mixed-level factors and interaction
designs
•Consider incorporating NOISE (Outer array)
•Decide on number repititions
Assign factors to columns arbitrarily
Modify columns and reserve interaction
columns prperly
Nutek, Inc. All Rights Reserved Robust Product and Process Designs www.Nutek-us.com Version 0804
Run experiments in random order when
possible
Module – 6ANOVA
Nutek, Inc. All Rights Reserved Robust Product and Process Designs www.Nutek-us.com Version 0804
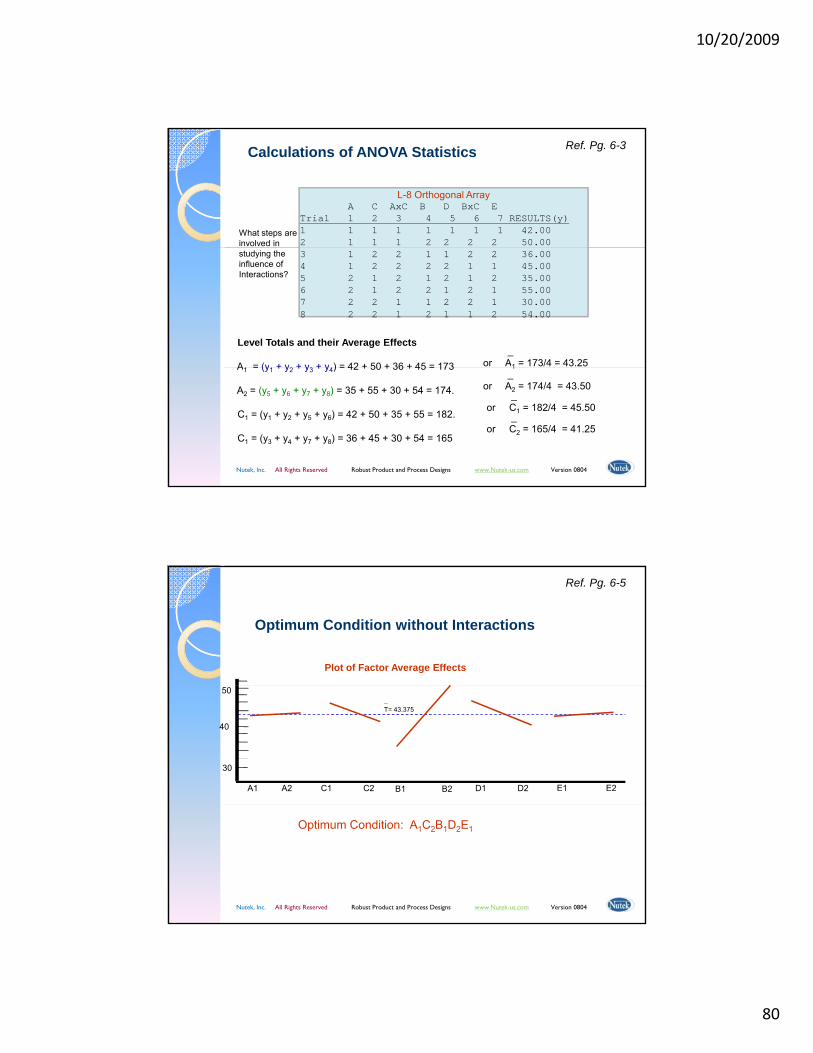
10/20/2009
80
What steps are involved in
L-8 Orthogonal ArrayA C AxC B D BxC E
Trial 1 2 3 4 5 6 7 RESULTS(y)1 1 1 1 1 1 1 1 42.00 2 1 1 1 2 2 2 2 50.00
Calculations of ANOVA Statistics Ref. Pg. 6-3
studying the influence of Interactions?
8 2 2 1 2 1 1 2 54.00
3 1 2 2 1 1 2 2 36.00 4 1 2 2 2 2 1 1 45.00 5 2 1 2 1 2 1 2 35.00 6 2 1 2 2 1 2 1 55.00 7 2 2 1 1 2 2 1 30.00 8 2 2 1 2 1 1 2 54.00
_or A1 = 173/4 = 43.25
Level Totals and their Average Effects
A = (y + y + y + y ) = 42 + 50 + 36 + 45 = 173
Nutek, Inc. All Rights Reserved Robust Product and Process Designs www.Nutek-us.com Version 0804
1_
or A2 = 174/4 = 43.50_
or C1 = 182/4 = 45.50_
or C2 = 165/4 = 41.25
A1 = (y1 + y2 + y3 + y4) = 42 + 50 + 36 + 45 = 173
A2 = (y5 + y6 + y7 + y8) = 35 + 55 + 30 + 54 = 174.
C1 = (y1 + y2 + y5 + y6) = 42 + 50 + 35 + 55 = 182.
C1 = (y3 + y4 + y7 + y8) = 36 + 45 + 30 + 54 = 165
Plot of Factor Average Effects
Optimum Condition without Interactions
Ref. Pg. 6-5
A1 A2 D1 D2C1 C2 B1 B2 E1 E2
30
40
50
T= 43.375_
Nutek, Inc. All Rights Reserved Robust Product and Process Designs www.Nutek-us.com Version 0804
Optimum Condition: A1C2B1D2E1
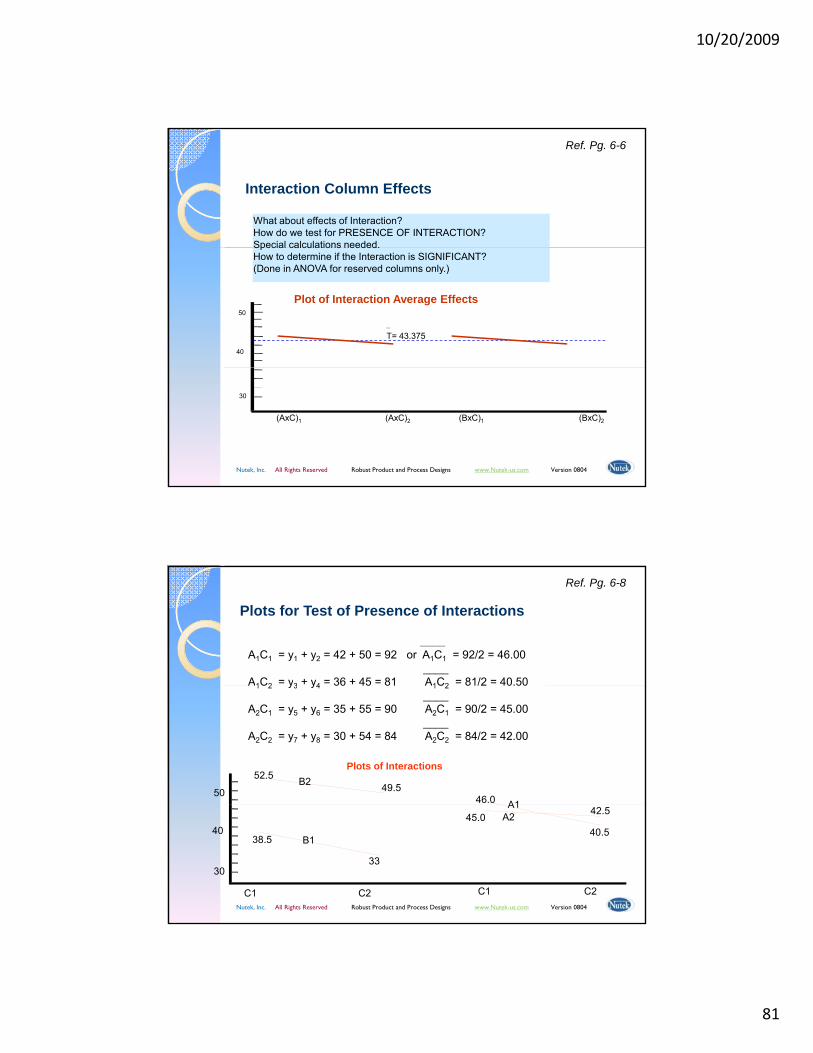
10/20/2009
81
What about effects of Interaction?How do we test for PRESENCE OF INTERACTION?Special calculations needed.
Interaction Column Effects
Ref. Pg. 6-6
Special calculations needed.How to determine if the Interaction is SIGNIFICANT?(Done in ANOVA for reserved columns only.)
40
50
T= 43.375_
Plot of Interaction Average Effects
Nutek, Inc. All Rights Reserved Robust Product and Process Designs www.Nutek-us.com Version 0804
(AxC)1 (AxC)2 (BxC)1 (BxC)2
30
____A1C1 = y1 + y2 = 42 + 50 = 92 or A1C1 = 92/2 = 46.00
____A1C2 = y3 + y4 = 36 + 45 = 81 A1C2 = 81/2 = 40.50
Plots for Test of Presence of Interactions
Ref. Pg. 6-8
A1C2 y3 y4 36 45 81 A1C2 81/2 40.50____
A2C1 = y5 + y6 = 35 + 55 = 90 A2C1 = 90/2 = 45.00____
A2C2 = y7 + y8 = 30 + 54 = 84 A2C2 = 84/2 = 42.00
50
Plots of Interactions52.5
49.5B2
46.0 A1
Nutek, Inc. All Rights Reserved Robust Product and Process Designs www.Nutek-us.com Version 0804
C1 C2
30
40
C1 C2
38.5
33
B1
45.040.5
42.5A1A2
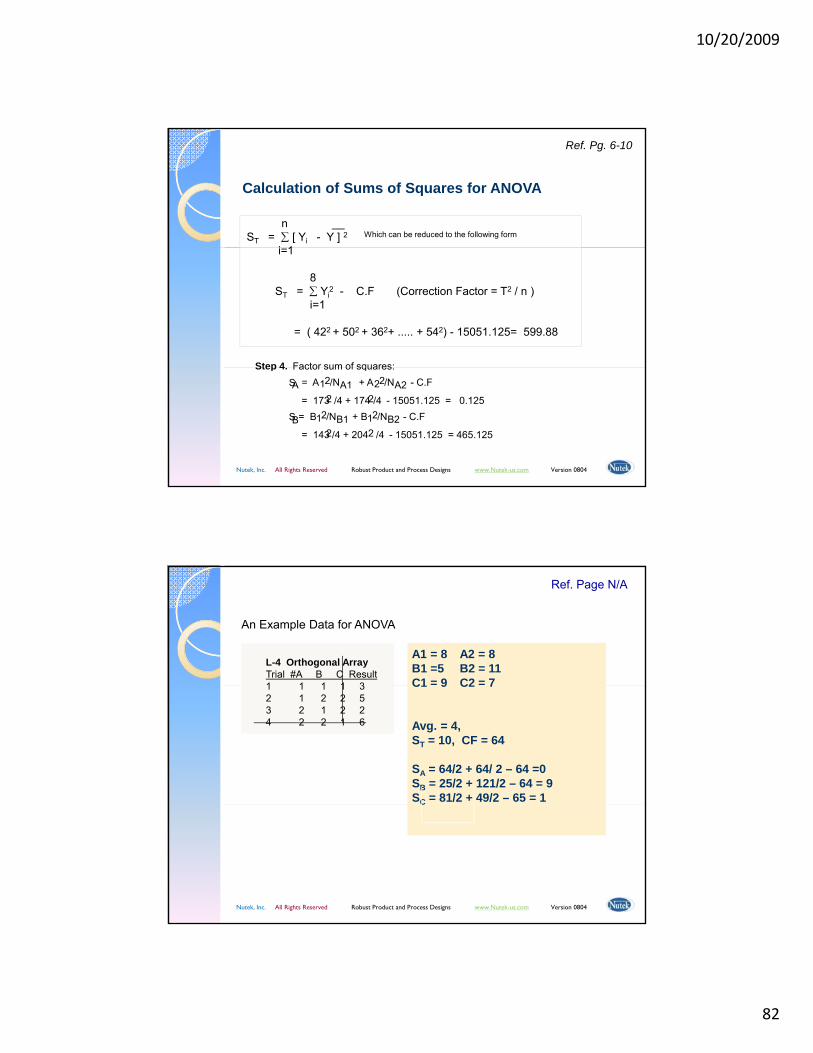
10/20/2009
82
Calculation of Sums of Squares for ANOVA
n __ST = ∑ [ Yi - Y ] 2 Which can be reduced to the following form
i 1
Ref. Pg. 6-10
Step 4 Factor sum of squares:
i=1
8ST = ∑ Yi
2 - C.F (Correction Factor = T2 / n )i=1
= ( 422 + 502 + 362+ ..... + 542) - 15051.125= 599.88
Nutek, Inc. All Rights Reserved Robust Product and Process Designs www.Nutek-us.com Version 0804
Step 4. Factor sum of squares:
SA = A12/NA1 + A22/NA2 - C.F
= 1732 /4 + 1742/4 - 15051.125 = 0.125SB= B12/NB1 + B12/NB2 - C.F
= 1432 /4 + 2042 /4 - 15051.125 = 465.125
A1 = 8 A2 = 8B1 =5 B2 = 11C1 = 9 C2 = 7
L-4 Orthogonal ArrayTrial #A B C Result1 1 1 1 3
An Example Data for ANOVA
Ref. Page N/A
C1 9 C2 7
Avg. = 4,ST = 10, CF = 64
SA = 64/2 + 64/ 2 – 64 =0SB = 25/2 + 121/2 – 64 = 9SC = 81/2 + 49/2 – 65 = 1
1 1 1 1 32 1 2 2 53 2 1 2 24 2 2 1 6
Nutek, Inc. All Rights Reserved Robust Product and Process Designs www.Nutek-us.com Version 0804
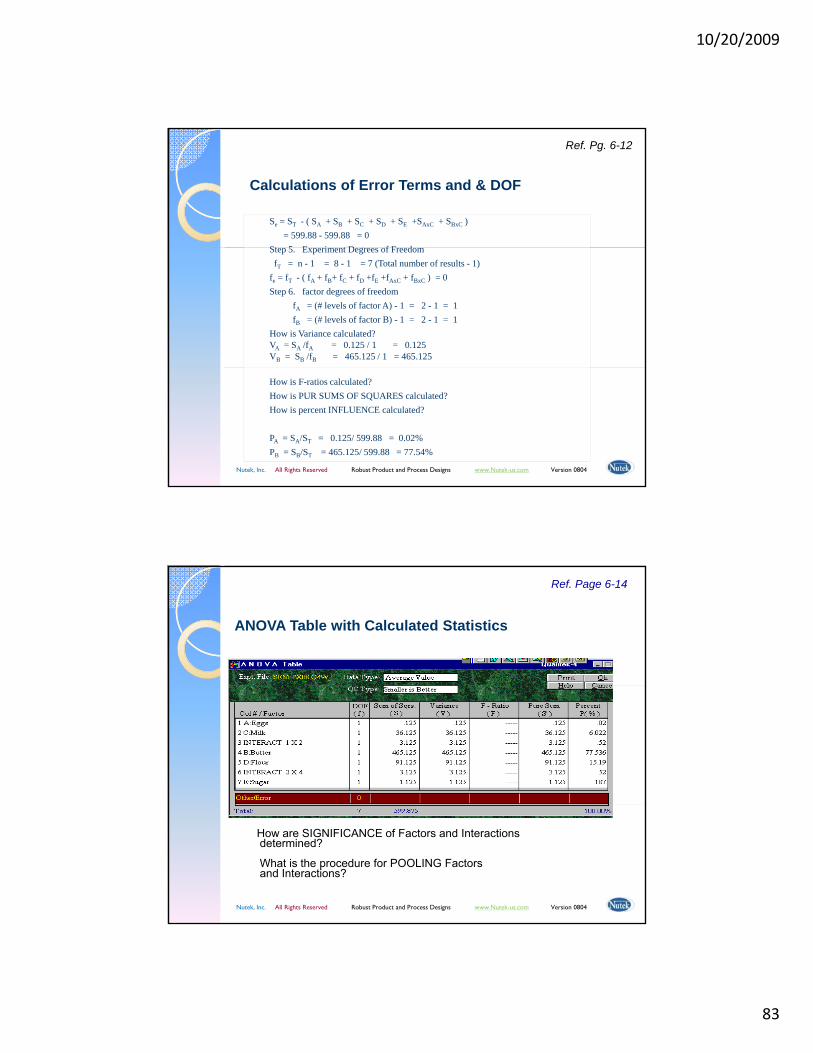
10/20/2009
83
Se = ST - ( SA + SB + SC + SD + SE +SAxC + SBxC )= 599.88 - 599.88 = 0
St 5 E i t D f F d
Calculations of Error Terms and & DOF
Ref. Pg. 6-12
Step 5. Experiment Degrees of FreedomfT = n - 1 = 8 - 1 = 7 (Total number of results - 1)
fe = fT - ( fA + fB+ fC + fD +fE +fAxC + fBxC ) = 0Step 6. factor degrees of freedom
fA = (# levels of factor A) - 1 = 2 - 1 = 1fB = (# levels of factor B) - 1 = 2 - 1 = 1
How is Variance calculated?VA = SA /fA = 0.125 / 1 = 0.125VB = SB /fB = 465.125 / 1 = 465.125
Nutek, Inc. All Rights Reserved Robust Product and Process Designs www.Nutek-us.com Version 0804
How is F-ratios calculated?How is PUR SUMS OF SQUARES calculated?How is percent INFLUENCE calculated?
PA = SA/ST = 0.125/ 599.88 = 0.02%PB = SB/ST = 465.125/ 599.88 = 77.54%
ANOVA Table with Calculated Statistics
Ref. Page 6-14
Nutek, Inc. All Rights Reserved Robust Product and Process Designs www.Nutek-us.com Version 0804
How are SIGNIFICANCE of Factors and Interactionsdetermined?
What is the procedure for POOLING Factorsand Interactions?
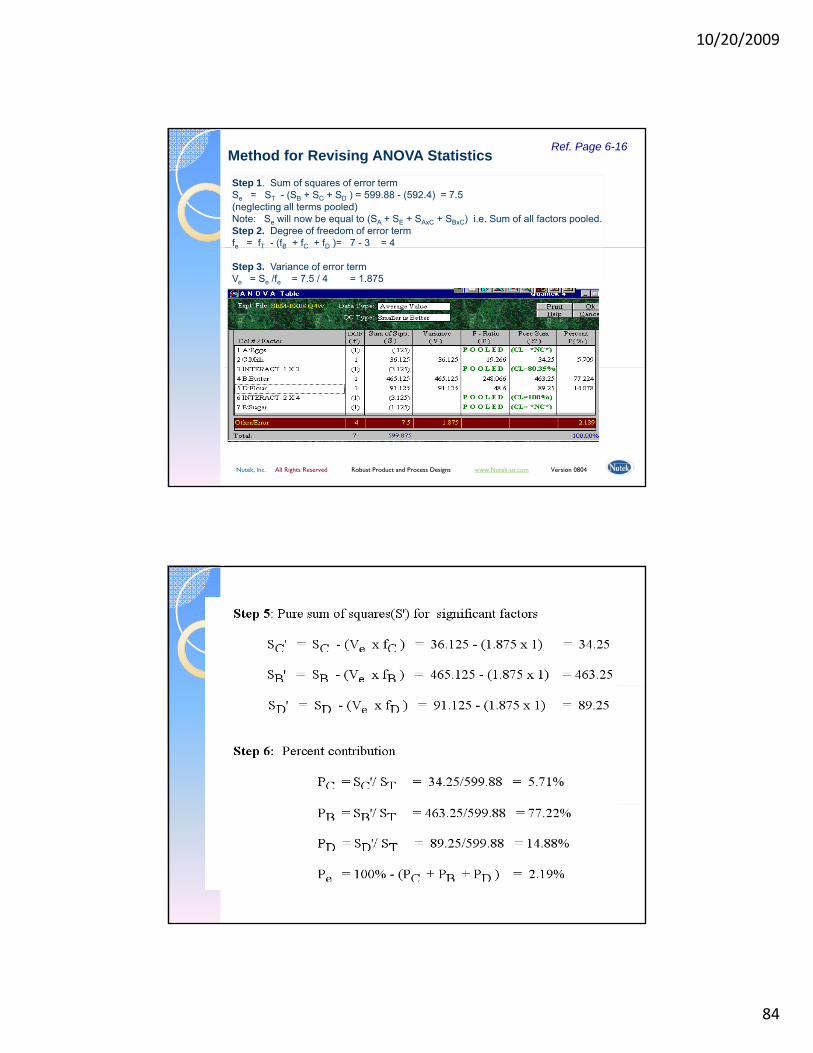
10/20/2009
84
Step 1. Sum of squares of error termSe = ST - (SB + SC + SD ) = 599.88 - (592.4) = 7.5(neglecting all terms pooled)Note: Se will now be equal to (SA + SE + SAxC + SBxC) i.e. Sum of all factors pooled.Step 2. Degree of freedom of error termfe = fT - (fB + fC + fD )= 7 - 3 = 4
Method for Revising ANOVA Statistics Ref. Page 6-16
e T ( B C D )
Step 3. Variance of error termVe = Se /fe = 7.5 / 4 = 1.875
Nutek, Inc. All Rights Reserved Robust Product and Process Designs www.Nutek-us.com Version 0804
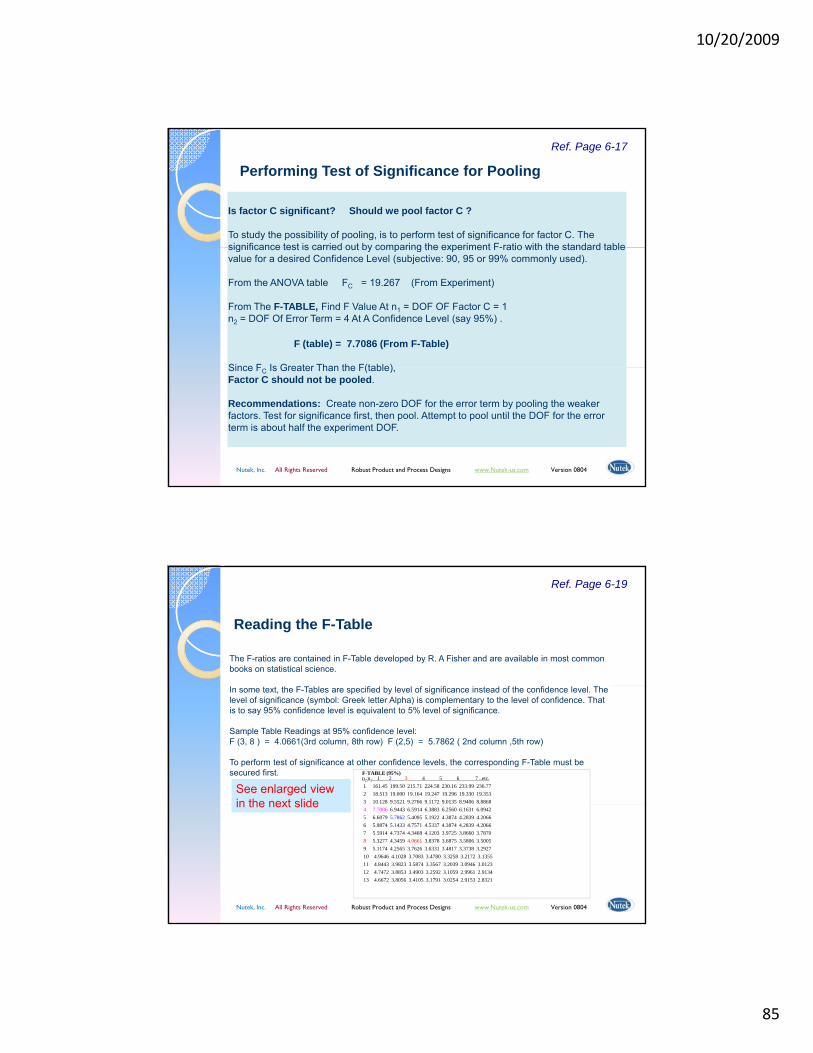
10/20/2009
85
Is factor C significant? Should we pool factor C ?
To study the possibility of pooling, is to perform test of significance for factor C. The significance test is carried out by comparing the experiment F-ratio with the standard table
Performing Test of Significance for Pooling
Ref. Page 6-17
significance test is carried out by comparing the experiment F-ratio with the standard table value for a desired Confidence Level (subjective: 90, 95 or 99% commonly used).
From the ANOVA table FC = 19.267 (From Experiment)
From The F-TABLE, Find F Value At n1 = DOF OF Factor C = 1n2 = DOF Of Error Term = 4 At A Confidence Level (say 95%) .
F (table) = 7.7086 (From F-Table)
Since F Is Greater Than the F(table)
Nutek, Inc. All Rights Reserved Robust Product and Process Designs www.Nutek-us.com Version 0804
Since FC Is Greater Than the F(table),Factor C should not be pooled.
Recommendations: Create non-zero DOF for the error term by pooling the weaker factors. Test for significance first, then pool. Attempt to pool until the DOF for the error term is about half the experiment DOF.
The F-ratios are contained in F-Table developed by R. A Fisher and are available in most common books on statistical science.
Reading the F-Table
Ref. Page 6-19
In some text, the F-Tables are specified by level of significance instead of the confidence level. The level of significance (symbol: Greek letter Alpha) is complementary to the level of confidence. That is to say 95% confidence level is equivalent to 5% level of significance.
Sample Table Readings at 95% confidence level: F (3, 8 ) = 4.0661(3rd column, 8th row) F (2,5) = 5.7862 ( 2nd column ,5th row)
To perform test of significance at other confidence levels, the corresponding F-Table must be secured first. F-TABLE (95%)
n2\n1 1 2 3 4 5 6 7 ..etc.1 161.45 199.50 215.71 224.58 230.16 233.99 236.77 2 18.513 19.000 19.164 19.247 19.296 19.330 19.353 3 10.128 9.5521 9.2766 9.1172 9.0135 8.9406 8.8868
See enlarged view in the next slide
Nutek, Inc. All Rights Reserved Robust Product and Process Designs www.Nutek-us.com Version 0804
4 7.7086 6.9443 6.5914 6.3883 6.2560 6.1631 6.09425 6.6079 5.7862 5.4095 5.1922 4.3874 4.2839 4.2066 6 5.9874 5.1433 4.7571 4.5337 4.3874 4.2839 4.2066 7 5.5914 4.7374 4.3468 4.1203 3.9725 3.8660 3.7870 8 5.3277 4.3459 4.0661 3.8378 3.6875 3.5806 3.5005 9 5.1174 4.2565 3.7626 3.6331 3.4817 3.3738 3.2927 10 4.9646 4.1028 3.7083 3.4780 3.3258 3.2172 3.1355 11 4.8443 3.9823 3.5874 3.3567 3.2039 3.0946 3.0123 12 4.7472 3.8853 3.4903 3.2592 3.1059 2.9961 2.9134 13 4.6672 3.8056 3.4105 3.1791 3.0254 2.9153 2.8321
in the next slide
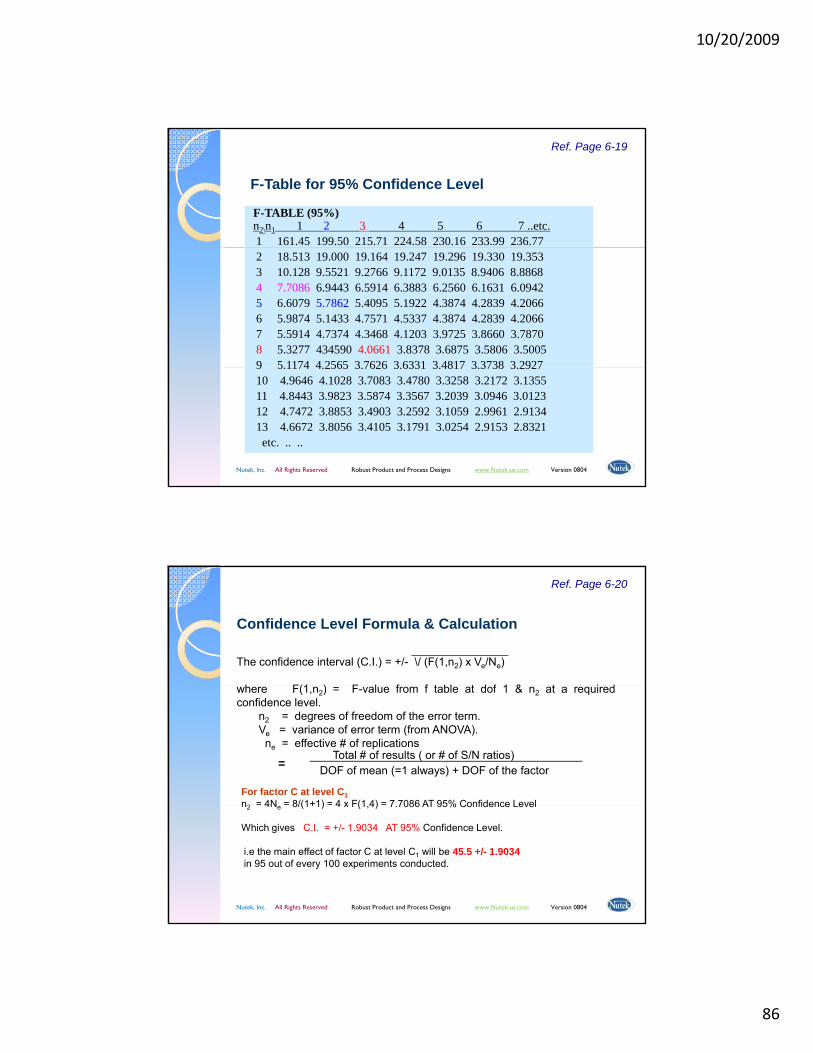
10/20/2009
86
F-TABLE (95%)n2\n1 1 2 3 4 5 6 7 ..etc.1 161.45 199.50 215.71 224.58 230.16 233.99 236.77
F-Table for 95% Confidence Level
Ref. Page 6-19
2 18.513 19.000 19.164 19.247 19.296 19.330 19.353 3 10.128 9.5521 9.2766 9.1172 9.0135 8.9406 8.8868 4 7.7086 6.9443 6.5914 6.3883 6.2560 6.1631 6.09425 6.6079 5.7862 5.4095 5.1922 4.3874 4.2839 4.2066 6 5.9874 5.1433 4.7571 4.5337 4.3874 4.2839 4.2066 7 5.5914 4.7374 4.3468 4.1203 3.9725 3.8660 3.7870 8 5.3277 434590 4.0661 3.8378 3.6875 3.5806 3.5005 9 5 1174 4 2565 3 7626 3 6331 3 4817 3 3738 3 2927
Nutek, Inc. All Rights Reserved Robust Product and Process Designs www.Nutek-us.com Version 0804
9 5.1174 4.2565 3.7626 3.6331 3.4817 3.3738 3.2927 10 4.9646 4.1028 3.7083 3.4780 3.3258 3.2172 3.1355 11 4.8443 3.9823 3.5874 3.3567 3.2039 3.0946 3.0123 12 4.7472 3.8853 3.4903 3.2592 3.1059 2.9961 2.9134 13 4.6672 3.8056 3.4105 3.1791 3.0254 2.9153 2.8321 etc. .. ..
The confidence interval (C.I.) = +/- \/ (F(1,n2) x Ve/Ne)
h F(1 ) F l f f t bl t d f 1 & t i d
Confidence Level Formula & Calculation
Ref. Page 6-20
For factor C at level C1n2 = 4N = 8/(1+1) = 4 x F(1 4) = 7 7086 AT 95% Confidence Level
where F(1,n2) = F-value from f table at dof 1 & n2 at a requiredconfidence level.
n2 = degrees of freedom of the error term.Ve = variance of error term (from ANOVA).
ne = effective # of replications
= DOF of mean (=1 always) + DOF of the factorTotal # of results ( or # of S/N ratios)
Nutek, Inc. All Rights Reserved Robust Product and Process Designs www.Nutek-us.com Version 0804
n2 = 4Ne = 8/(1+1) = 4 x F(1,4) = 7.7086 AT 95% Confidence Level
Which gives C.I. = +/- 1.9034 AT 95% Confidence Level.
i.e the main effect of factor C at level C1 will be 45.5 +/- 1.9034in 95 out of every 100 experiments conducted.
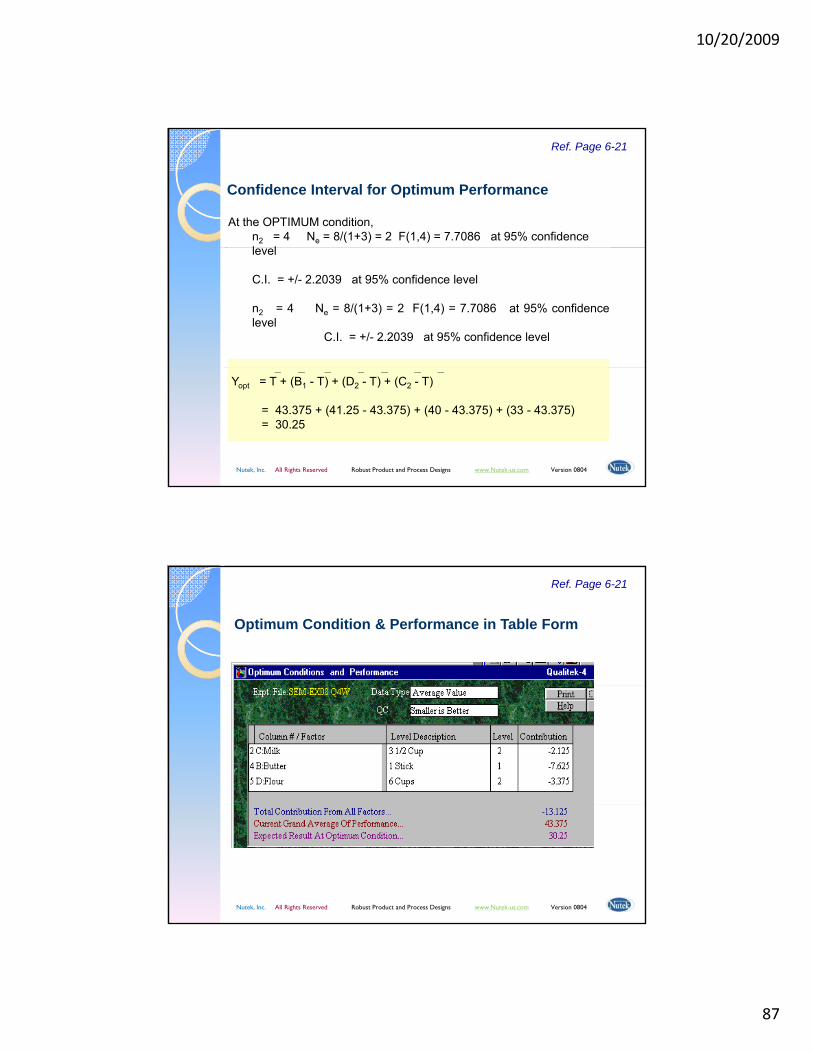
10/20/2009
87
At the OPTIMUM condition,n2 = 4 Ne = 8/(1+3) = 2 F(1,4) = 7.7086 at 95% confidence l l
Confidence Interval for Optimum Performance
Ref. Page 6-21
level
C.I. = +/- 2.2039 at 95% confidence level
n2 = 4 Ne = 8/(1+3) = 2 F(1,4) = 7.7086 at 95% confidencelevel
C.I. = +/- 2.2039 at 95% confidence level
Nutek, Inc. All Rights Reserved Robust Product and Process Designs www.Nutek-us.com Version 0804
__Grand average of performance: T = 347 / 8 = 43.375
_ _ _ _ _ _ _Yopt = T + (B1 - T) + (D2 - T) + (C2 - T)
= 43.375 + (41.25 - 43.375) + (40 - 43.375) + (33 - 43.375)= 30.25
Optimum Condition & Performance in Table Form
Ref. Page 6-21
Nutek, Inc. All Rights Reserved Robust Product and Process Designs www.Nutek-us.com Version 0804

10/20/2009
88
6.7 Example 8B: Standard analysis with multiple runsQC= Smaller is better (Same design as Ex. 8A)
Trial \ Results R1 R2 R3 Average
ANOVA for Multiple Samples Test Results
Ref. Page 6-25
g1 38.00 42.00 46.00 42.002 45.00 50.00 55.00 50.003 38.00 36.00 34.00 36.004 55.00 45.00 35.00 45.005 30.00 35.00 40.00 35.006 65.00 55.00 45.00 55.007 40.00 30.00 20.00 30.008 58.00 54.00 50.00 54.00
Nutek, Inc. All Rights Reserved Robust Product and Process Designs www.Nutek-us.com Version 0804
DOF = 8 x 3 - 1 = 23
DOF with Multiple Samples Test Results
Ref. Page 6-26
B1 = (38.0 + 42.0 + 46.0) + (38.0 + 36.0 + 34.0)+ (30.0 + 35.0 + 40.0) + (40.0 + 30.0 + 20.0) = 429
Note: B1 is obtained from results of trial conditions 1, 3, 5 & 7.
Nutek, Inc. All Rights Reserved Robust Product and Process Designs www.Nutek-us.com Version 0804
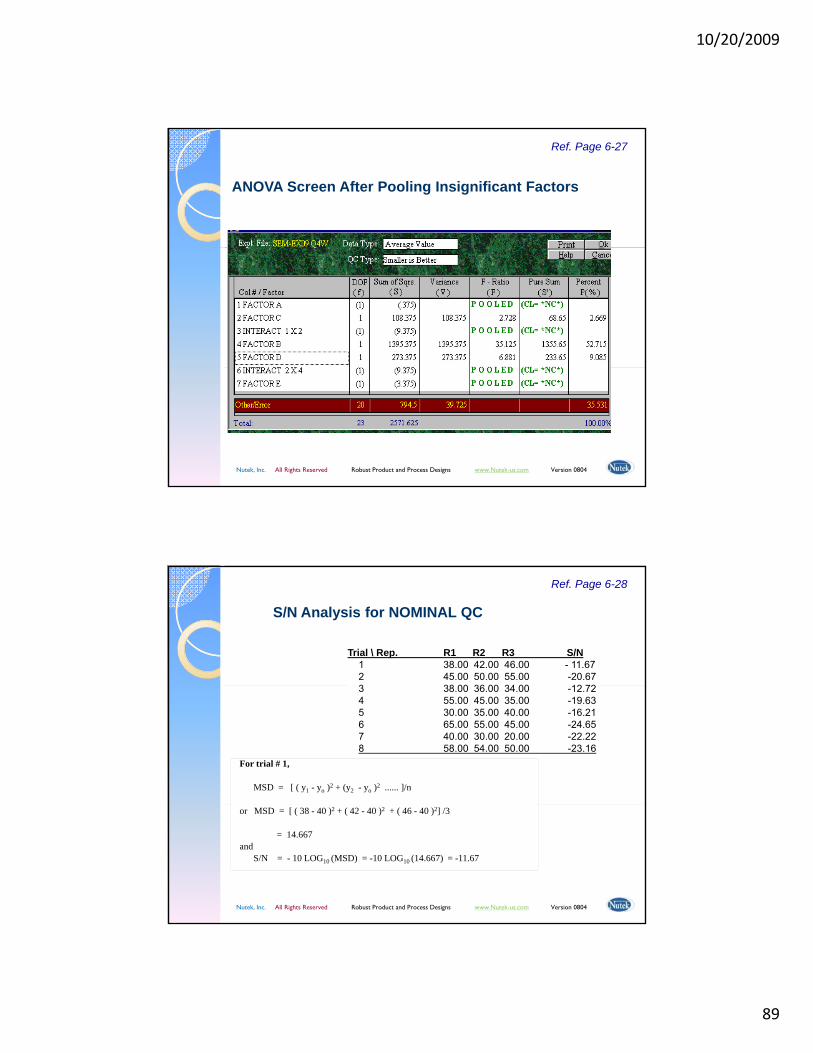
10/20/2009
89
ANOVA Screen After Pooling Insignificant Factors
Ref. Page 6-27
Nutek, Inc. All Rights Reserved Robust Product and Process Designs www.Nutek-us.com Version 0804
Trial \ Rep. R1 R2 R3 S/N1 38.00 42.00 46.00 - 11.672 45.00 50.00 55.00 -20.673 38 00 36 00 34 00 12 72
S/N Analysis for NOMINAL QC
Ref. Page 6-28
For trial # 1,
MSD = [ ( y1 - yo )2 + (y2 - yo )2 ...... ]/n
3 38.00 36.00 34.00 -12.724 55.00 45.00 35.00 -19.635 30.00 35.00 40.00 -16.216 65.00 55.00 45.00 -24.657 40.00 30.00 20.00 -22.228 58.00 54.00 50.00 -23.16
Nutek, Inc. All Rights Reserved Robust Product and Process Designs www.Nutek-us.com Version 0804
or MSD = [ ( 38 - 40 )2 + ( 42 - 40 )2 + ( 46 - 40 )2] /3
= 14.667and
S/N = - 10 LOG10 (MSD) = -10 LOG10 (14.667) = -11.67
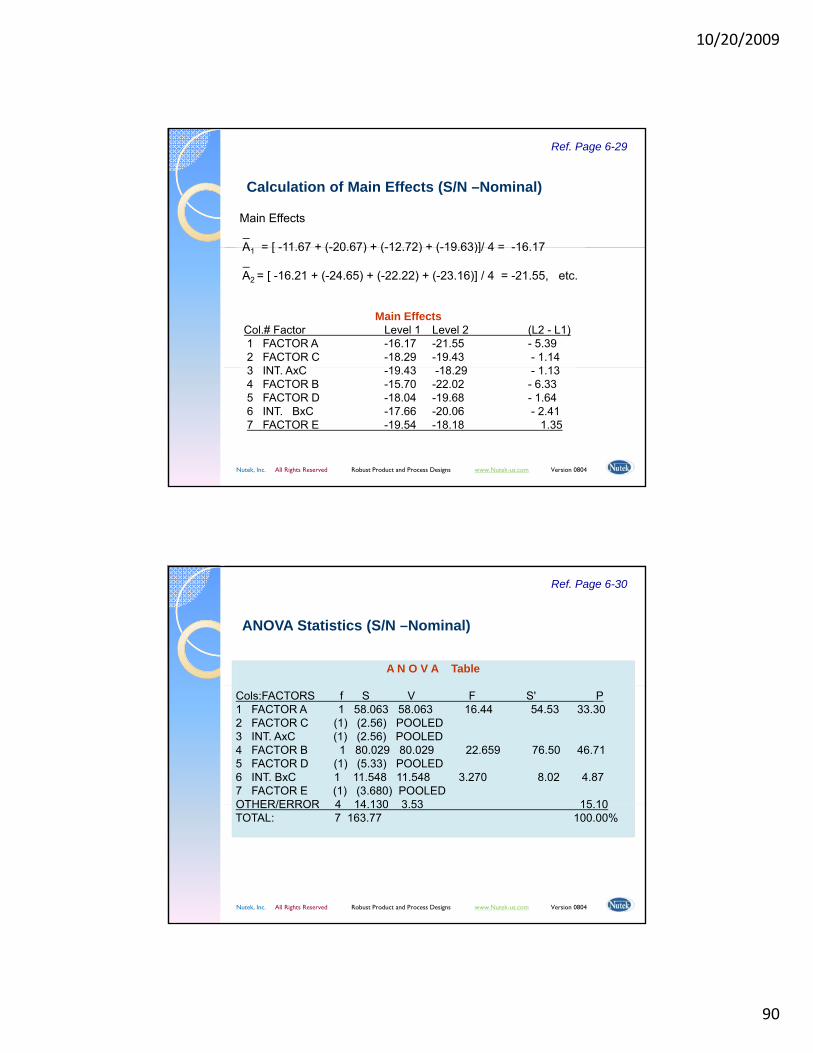
10/20/2009
90
Main Effects_A = [ -11 67 + (-20 67) + (-12 72) + (-19 63)]/ 4 = -16 17
Calculation of Main Effects (S/N –Nominal)
Ref. Page 6-29
A1 = [ -11.67 + (-20.67) + (-12.72) + (-19.63)]/ 4 = -16.17_A2 = [ -16.21 + (-24.65) + (-22.22) + (-23.16)] / 4 = -21.55, etc.
Main EffectsCol.# Factor Level 1 Level 2 (L2 - L1)1 FACTOR A -16.17 -21.55 - 5.392 FACTOR C -18.29 -19.43 - 1.143 INT A C 19 43 18 29 1 13
Nutek, Inc. All Rights Reserved Robust Product and Process Designs www.Nutek-us.com Version 0804
3 INT. AxC -19.43 -18.29 - 1.134 FACTOR B -15.70 -22.02 - 6.335 FACTOR D -18.04 -19.68 - 1.646 INT. BxC -17.66 -20.06 - 2.417 FACTOR E -19.54 -18.18 1.35
A N O V A Table
ANOVA Statistics (S/N –Nominal)
Ref. Page 6-30
Cols:FACTORS f S V F S' P1 FACTOR A 1 58.063 58.063 16.44 54.53 33.302 FACTOR C (1) (2.56) POOLED3 INT. AxC (1) (2.56) POOLED4 FACTOR B 1 80.029 80.029 22.659 76.50 46.715 FACTOR D (1) (5.33) POOLED6 INT. BxC 1 11.548 11.548 3.270 8.02 4.877 FACTOR E (1) (3.680) POOLEDOTHER/ERROR 4 14 130 3 53 15 10
Nutek, Inc. All Rights Reserved Robust Product and Process Designs www.Nutek-us.com Version 0804
OTHER/ERROR 4 14.130 3.53 15.10TOTAL: 7 163.77 100.00%
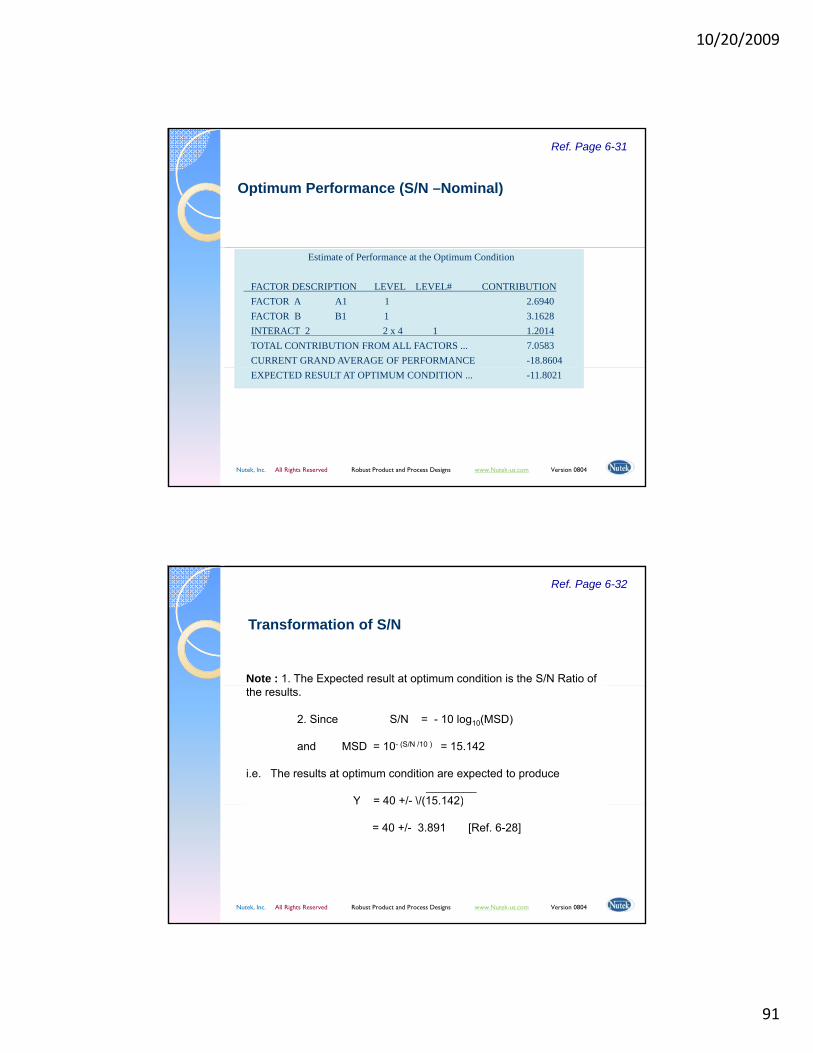
10/20/2009
91
Optimum Performance (S/N –Nominal)
Ref. Page 6-31
Estimate of Performance at the Optimum Condition
FACTOR DESCRIPTION LEVEL LEVEL# CONTRIBUTIONFACTOR A A1 1 2.6940 FACTOR B B1 1 3.1628 INTERACT 2 2 x 4 1 1.2014TOTAL CONTRIBUTION FROM ALL FACTORS ... 7.0583 CURRENT GRAND AVERAGE OF PERFORMANCE -18.8604
Nutek, Inc. All Rights Reserved Robust Product and Process Designs www.Nutek-us.com Version 0804
EXPECTED RESULT AT OPTIMUM CONDITION ... -11.8021
Note : 1. The Expected result at optimum condition is the S/N Ratio of
Transformation of S/N
Ref. Page 6-32
the results.
2. Since S/N = - 10 log10(MSD)
and MSD = 10- (S/N /10 ) = 15.142
i.e. The results at optimum condition are expected to produce________
Y = 40 +/- \/(15.142)
Nutek, Inc. All Rights Reserved Robust Product and Process Designs www.Nutek-us.com Version 0804
( )
= 40 +/- 3.891 [Ref. 6-28]

10/20/2009
92
6. 9 Example 9B: S/N Analysis - Smaller is better(Same experiment as example 8A)
S/N Analysis with Bigger and Smaller QC
Ref. Page 6-32
MSD = ( Y12 + Y2
2 + Y32 + ......) /n
For Trial # 1MSD = ( 382 + 422 + 462 ) / 3 = 1774.666S/N = -10 LOG10(MSD) = -32.50
6.10 Example 9C: S/N analysis - Bigger is better (Same example 8B)MSD = [ 1/y1
2+ 1/y22 + ........ ] / n
Nutek, Inc. All Rights Reserved Robust Product and Process Designs www.Nutek-us.com Version 0804
For Trial # 1MSD = ( 1/382 + 1/422 + 1/462 ) / 3 = 5.773 x 10
S/N = - 10 Log10(MSD) = 32.38
Expression for Confidence Interval
Ref. Page 6-38
Expected Range of Results (at 90% C I )
Nutek, Inc. All Rights Reserved Robust Product and Process Designs www.Nutek-us.com Version 0804
Expected Range of Results (at 90% C. I.)
Lower limit: S/N = 34.2975Result = 51.86Mean Value: S/N = 35.349 Result = 58.54Upper Limit: S/N = 36.4005 Result = 66.07
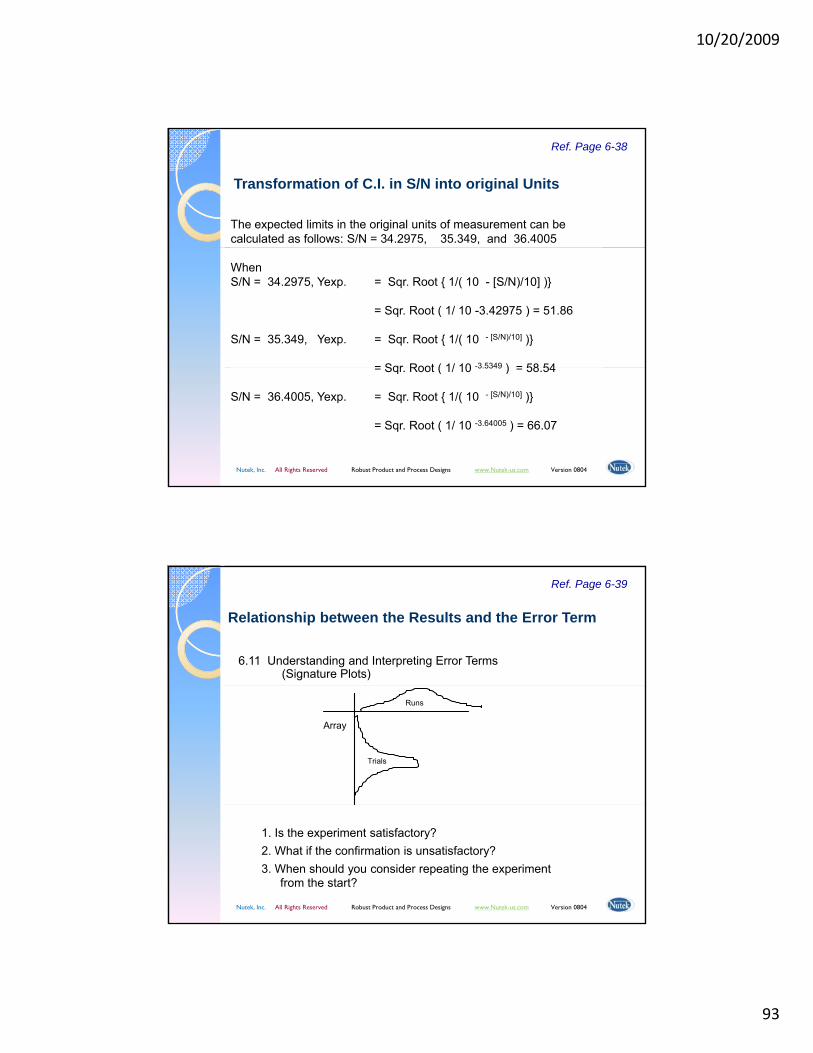
10/20/2009
93
The expected limits in the original units of measurement can be calculated as follows: S/N = 34.2975, 35.349, and 36.4005
Transformation of C.I. in S/N into original Units
Ref. Page 6-38
WhenS/N = 34.2975, Yexp. = Sqr. Root { 1/( 10 - [S/N)/10] )}
= Sqr. Root ( 1/ 10 -3.42975 ) = 51.86
S/N = 35.349, Yexp. = Sqr. Root { 1/( 10 - [S/N)/10] )}
= Sqr Root ( 1/ 10 -3 5349 ) = 58 54
Nutek, Inc. All Rights Reserved Robust Product and Process Designs www.Nutek-us.com Version 0804
= Sqr. Root ( 1/ 10 3.5349 ) = 58.54
S/N = 36.4005, Yexp. = Sqr. Root { 1/( 10 - [S/N)/10] )}
= Sqr. Root ( 1/ 10 -3.64005 ) = 66.07
6.11 Understanding and Interpreting Error Terms(Signature Plots)
Relationship between the Results and the Error Term
Ref. Page 6-39
Trials
Array
Runs
Nutek, Inc. All Rights Reserved Robust Product and Process Designs www.Nutek-us.com Version 0804
1. Is the experiment satisfactory?2. What if the confirmation is unsatisfactory?3. When should you consider repeating the experiment
from the start?
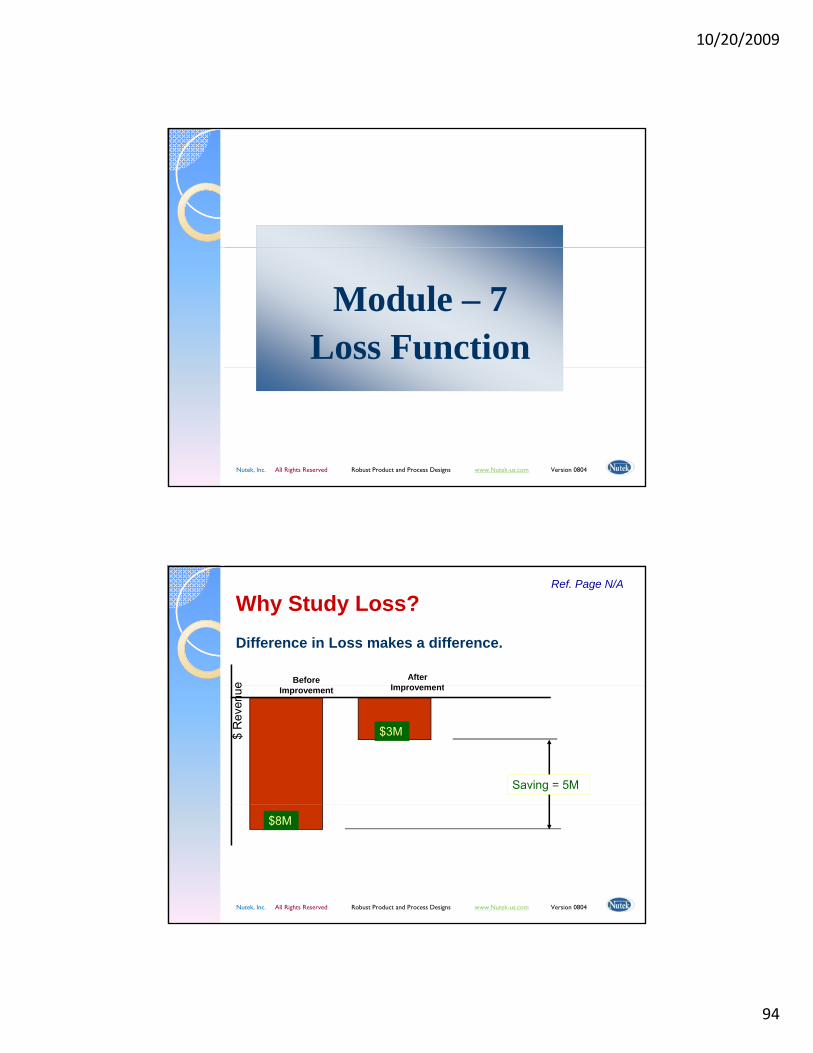
10/20/2009
94
Module – 7Loss Function
Nutek, Inc. All Rights Reserved Robust Product and Process Designs www.Nutek-us.com Version 0804
Why Study Loss?Difference in Loss makes a difference.
Ref. Page N/A
e
After I t
Before
$3M$ R
even
ue ImprovementImprovement
Saving = 5M
Nutek, Inc. All Rights Reserved Robust Product and Process Designs www.Nutek-us.com Version 0804
$8M
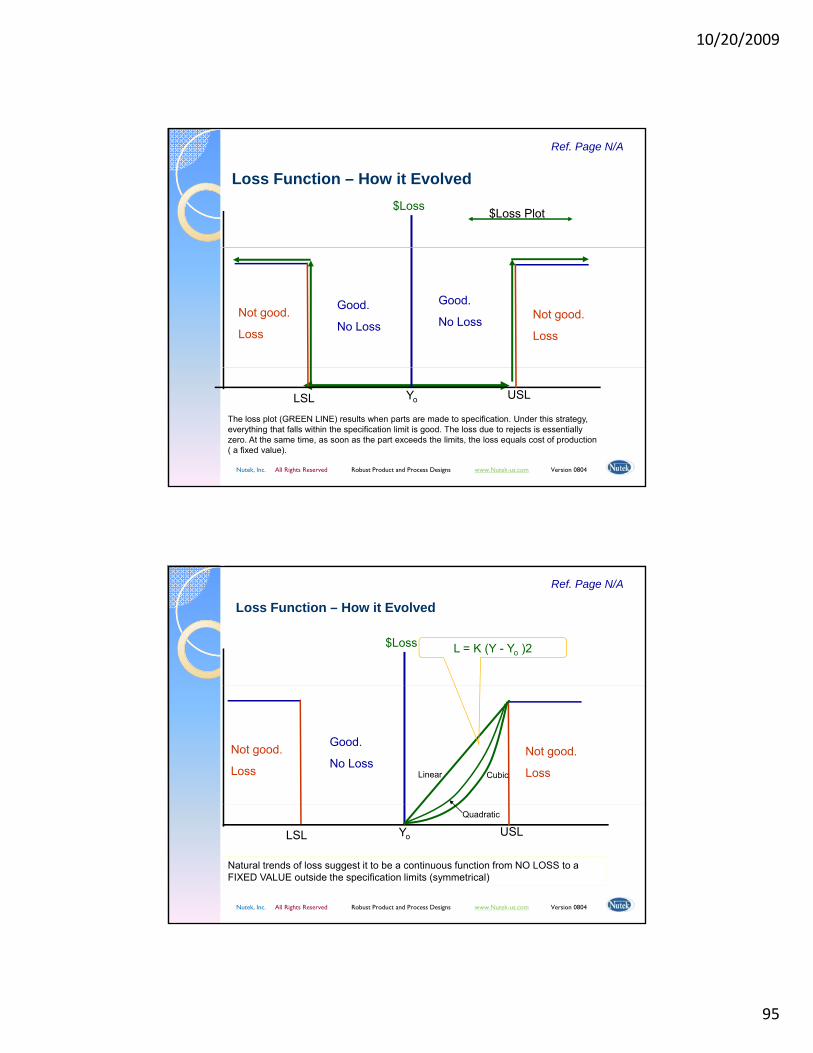
10/20/2009
95
Loss Function – How it Evolved
Ref. Page N/A
$Loss $Loss Plot
Not good.
Loss
Not good.
Loss
Good.
No LossGood.
No Loss
Nutek, Inc. All Rights Reserved Robust Product and Process Designs www.Nutek-us.com Version 0804
Yo USL LSL The loss plot (GREEN LINE) results when parts are made to specification. Under this strategy, everything that falls within the specification limit is good. The loss due to rejects is essentially zero. At the same time, as soon as the part exceeds the limits, the loss equals cost of production ( a fixed value).
Loss Function – How it Evolved
Ref. Page N/A
$Loss L = K (Y - Yo )2
Not good.
Loss
Not good.
Loss
Good.
No LossLinear Cubic
Nutek, Inc. All Rights Reserved Robust Product and Process Designs www.Nutek-us.com Version 0804
Yo USL LSL
Natural trends of loss suggest it to be a continuous function from NO LOSS to a FIXED VALUE outside the specification limits (symmetrical)
Quadratic

10/20/2009
96
L = K (y - yo)2 $ Per unit of product for single unitFor multiple product the loss equation becomes:
Computation of Savings from Loss Function
Ref. Page 7-3
p p qL = K (MSD) $/Unit productWhereL = loss/unit product in $k = a constantyo = target value y = performance measure
Monthly production = 2,000 unitsM thl j ti 50 it
Nutek, Inc. All Rights Reserved Robust Product and Process Designs www.Nutek-us.com Version 0804
Monthly rejection = 50 unitCost of rejection = $8 per unit
Therefore: Loss=(50 x $ 8 )/2000 = $ 0.50/unit
Input for Saving Computation from Loss FunctionRef. Page 7-4
Nutek, Inc. All Rights Reserved Robust Product and Process Designs www.Nutek-us.com Version 0804
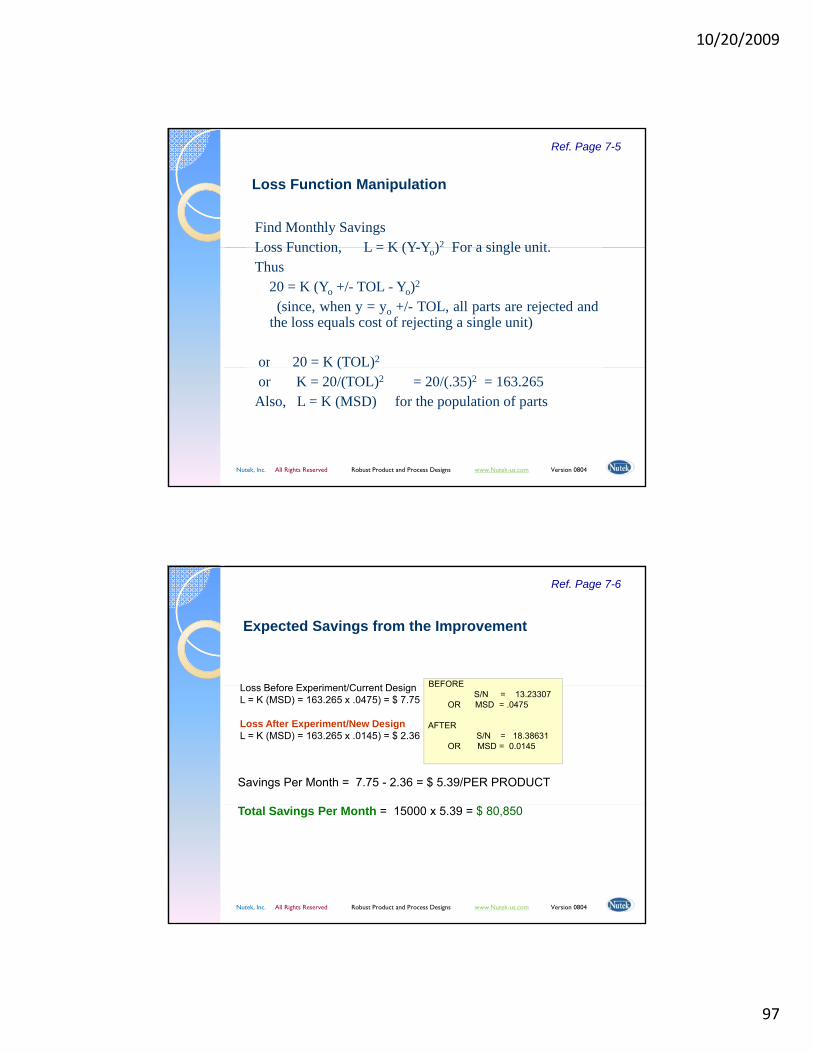
10/20/2009
97
Find Monthly SavingsLoss Function L = K (Y Y )2 For a single unit
Loss Function Manipulation
Ref. Page 7-5
Loss Function, L = K (Y-Yo) For a single unit.Thus
20 = K (Yo +/- TOL - Yo)2
(since, when y = yo +/- TOL, all parts are rejected andthe loss equals cost of rejecting a single unit)
or 20 = K (TOL)2
Nutek, Inc. All Rights Reserved Robust Product and Process Designs www.Nutek-us.com Version 0804
( )or K = 20/(TOL)2 = 20/(.35)2 = 163.265Also, L = K (MSD) for the population of parts
L B f E i t/C t D i BEFORE
Expected Savings from the Improvement
Ref. Page 7-6
Loss Before Experiment/Current DesignL = K (MSD) = 163.265 x .0475) = $ 7.75
Loss After Experiment/New DesignL = K (MSD) = 163.265 x .0145) = $ 2.36
BEFORES/N = 13.23307
OR MSD = .0475
AFTER S/N = 18.38631
OR MSD = 0.0145
Savings Per Month = 7.75 - 2.36 = $ 5.39/PER PRODUCT
Nutek, Inc. All Rights Reserved Robust Product and Process Designs www.Nutek-us.com Version 0804
Total Savings Per Month = 15000 x 5.39 = $ 80,850
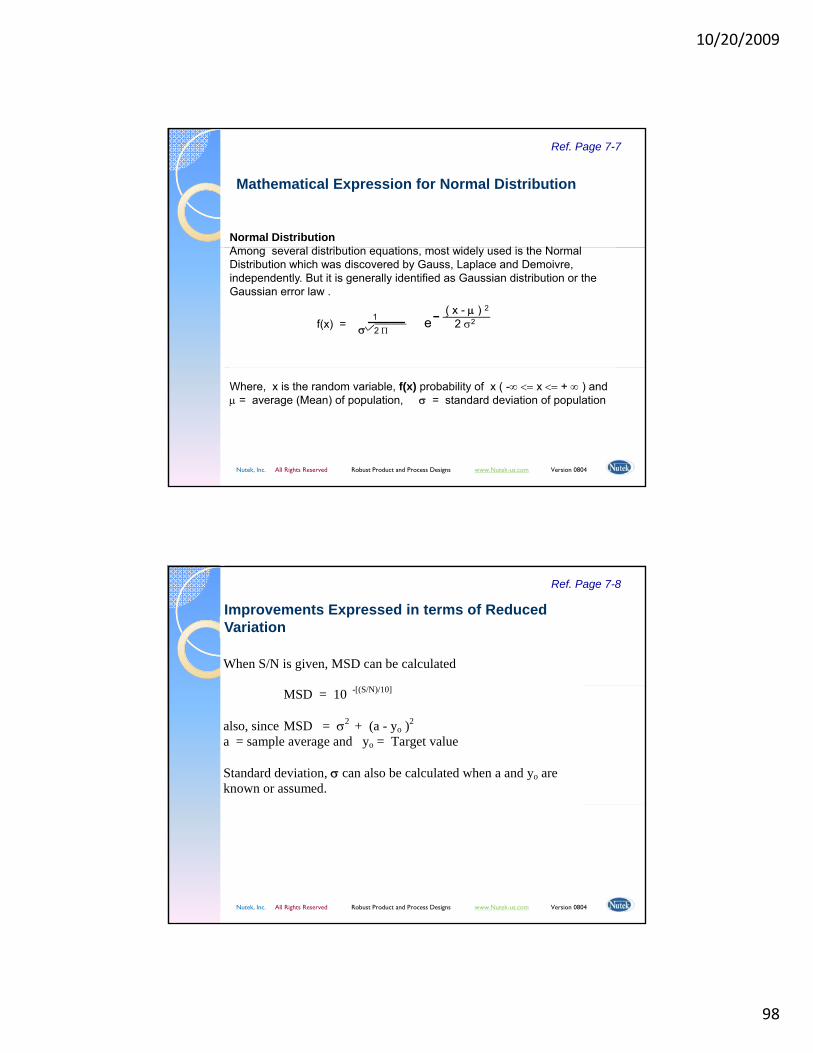
10/20/2009
98
Normal DistributionA l di t ib ti ti t id l d i th N l
Mathematical Expression for Normal Distribution
Ref. Page 7-7
Among several distribution equations, most widely used is the Normal Distribution which was discovered by Gauss, Laplace and Demoivre, independently. But it is generally identified as Gaussian distribution or the Gaussian error law .
1 σ 2 Π
f(x) = e( x - μ ) 2
2 σ2
Nutek, Inc. All Rights Reserved Robust Product and Process Designs www.Nutek-us.com Version 0804
Where, x is the random variable, f(x) probability of x ( -∞ <= x <= + ∞ ) and μ = average (Mean) of population, σ = standard deviation of population
When S/N is given, MSD can be calculated
Improvements Expressed in terms of Reduced Variation
Ref. Page 7-8
MSD = 10 -[(S/N)/10]
also, since MSD = σ2 + (a - yo )2 a = sample average and yo = Target value Standard deviation, σ can also be calculated when a and yo are known or assumed.
Nutek, Inc. All Rights Reserved Robust Product and Process Designs www.Nutek-us.com Version 0804
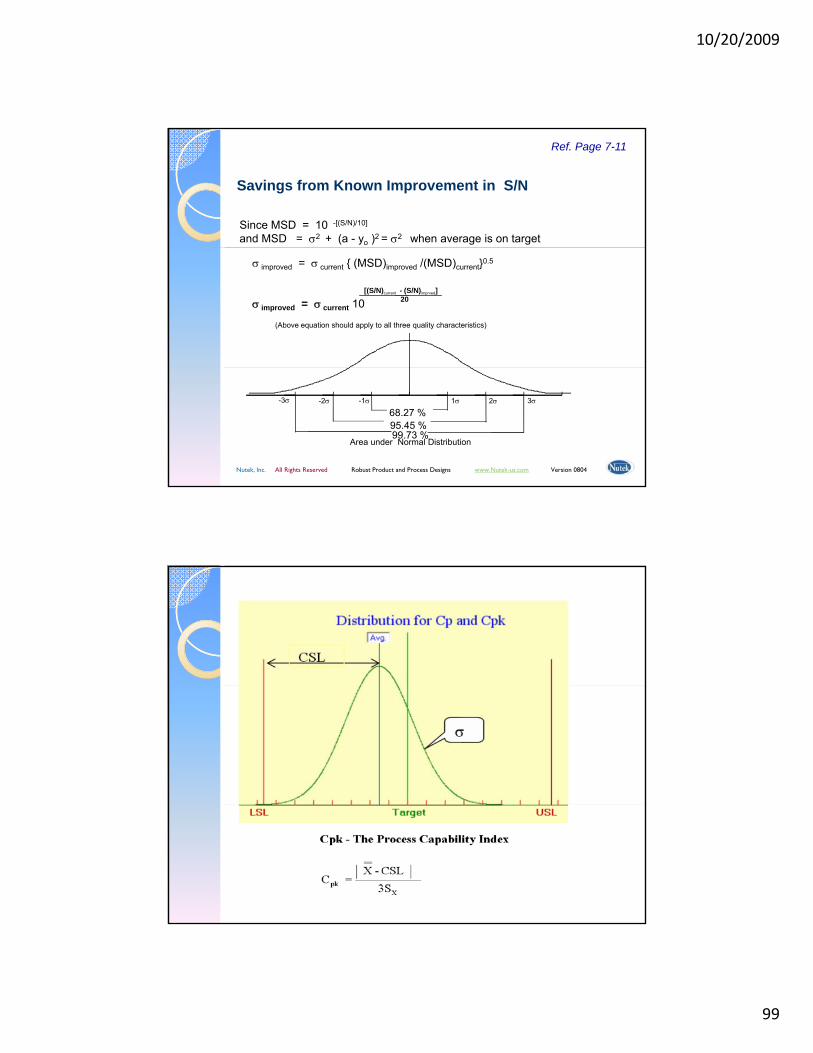
10/20/2009
99
Since MSD = 10 -[(S/N)/10]
and MSD = σ2 + (a - yo )2 = σ2 when average is on target
Savings from Known Improvement in S/N
Ref. Page 7-11
σ improved = σ current { (MSD)improved /(MSD)current}0.5
σ improved = σ current 10
(Above equation should apply to all three quality characteristics)
[(S/N)current - (S/N)imprved]20
Nutek, Inc. All Rights Reserved Robust Product and Process Designs www.Nutek-us.com Version 0804
99.73 %95.45 %68.27 %
1σ-1σ 2σ-2σ 3σ-3σ
Area under Normal Distribution
10/20/2009
100
Module – 8Application Steps
Nutek, Inc. All Rights Reserved Robust Product and Process Designs www.Nutek-us.com Version 0804
◦ Can you measure results (Performance)?
Should you do it? (DOE APPLICABILITY TEST)
◦ Is it possible for you to test (4 -9)?
◦ Do you suspect many factors to influence results?
If answer to above questions is YES, you have much to gain from t t d i t h DOE
Nutek, Inc. All Rights Reserved Robust Product and Process Designs www.Nutek-us.com Version 0804
structured experiments such as a DOE.

10/20/2009
101
Things you should learn from discussions in this module:
Application Guidelines
HOW TO APPLY- Planning- Experiment Design- Analysis of results
HOW TO PREPARE & PRESENT REPORT (Appendix)
Nutek, Inc. All Rights Reserved Robust Product and Process Designs www.Nutek-us.com Version 0804
8.1 Description of Application Steps1. Project Selection: Look for a project to apply2. Planning : Arrange for the planning/brainstorming session.
Application Guidelines
Ref. Page 8-1
3. Designing : Design experiment & Describe trial conditions.4. Doing :Carry out experiments5. Analyzing: Analyze results6. Confirming: Run confirmation tests
8.2 Brainstorming for Design of Experiments (DOE)Purpose of brainstorming session Who should conduct?Who should host the session?Who should attend?How many should attend?Topics of Discussions
Nutek, Inc. All Rights Reserved Robust Product and Process Designs www.Nutek-us.com Version 0804
Topics of Discussions
1. Objective of the study (What are you after?)2. Design Factors and their Levels3. Interaction Studies (Which factors are likely to interact?)4. "Noise" Variables (How to create a robust design?)5. Tasks Descriptions and Assignments (Who will do what, how and when?)

10/20/2009
102
1. Know how to plan experiments and conduct brainstorming session. Understand basic principles ofconsensus decision making process while working as a team. Know how to:- select criteria and prepare evaluation table- prepare data collection tables- select factors for experiments
Application and Analysis Check List Ref. Page 8-7
p- decide on the number and values of the levels- compromise on number of factors and interactions- allocate the work assignments for the project (tasks)
2. Know how to design experiments when:- all factors are at the same level (2, 3 or 4 levels)- you wish to study interactions between two 2-level factors- factors are at mixed levels(2, 3 or 4 levels)
3. Can carry out computations for factor average effects and determine:- main effects- optimum condition- performance at the optimum condition
4 Understand the philosophy behind robust design
Nutek, Inc. All Rights Reserved Robust Product and Process Designs www.Nutek-us.com Version 0804
4. Understand the philosophy behind robust design5. 5. Be familiar with the transformation of results to MSD and S/N, and know how to interpret the
conclusions from the analysis.6. Understand the purpose and mechanics of ANOVA calculations:
- interpret the ERROR term & implications of the experimental results - why to pool factors and when to pool them- carry out test for significance and pool factors- calculate confidence interval and what it means
7. Know how to apply the principles of brainstorming problem solving
Taguchi Experimental Design TechniquesTaguchi Experimental Design Techniques
OUR SERVICESOUR SERVICES
Training & Workshop
Assistance with application
Text Books
Software (Free DEMO download)
Ranjit Roy, Ph.D.,P.E.,PMPAuthor, Trainer, Consultant
Nutek, Inc.3 829 Quarton Road
Bloomfield Hills, MI 48302.Tel : 1‐248‐540‐4827 Info@Nutek‐us.com
www.Nutek‐us.com

10/20/2009
103
Th k YThank YouWe appreciate your taking the time to
view our seminar slides.
Nutek Inc
Nutek, Inc. All Rights Reserved Robust Product and Process Designs www.Nutek-us.com Version 0804
Nutek, Inc. 3829 Quarton Road, Suite 102
Bloomfield Hills, MI 48302, USA.Ph: 248-540-4827, E-Mail: [email protected]