Embed Size (px)
Citation preview
ROLES OF DRUG BASICITY, MELANIN BINDING, AND CELLULAR
TRANSPORT IN DRUG INCORPORATION INTO HAIR
by
Chad Randolph Borges
A dissertation submitted to the faculty of The University of Utah
in partial fulfillment of the requirements for the degree of
Doctor of Philosophy
Department of Pharmacology and Toxicology
University of Utah
December 2001

Copyright © Chad Randolph Borges 2001
All Rights Reserved

THE UNIVERSITY OF UTAH GRADUATE SCHOOL
SUPERVISORY COMMITTEE APPROVAL
of a dissertation submitted by
Chad R. Borges
This dissertation has been read by each member of the following supervisory committtee and by majority vote has been found to be satisfactory.
ffi'1l I '} , dO 0 /
Diana G. Wilkins
Jeane te,c. Roberts
� I
Cz-----
�
THE UNIVERSITY OF UTAH GRADUATE SCHOOL
FINAL READING APPROVAL
To the Graduate Council of the University of Utah:
I have read the dissertation of Chad R. Borges in its final form and have found that (1) its format, citations, and bibliographic style are consistent and acceptable: (2) its illustrative materials including figures, tables, and charts are in place; and (3) the final manuscript is satisfactory to the supervisory committee and is �adY for submission to The Gra(r � Av1fI'h t 2-7 LOO I �L� �. �4� Date
I
Douglas E. Rollins Chair, Supervisory Committee
Approved for the Major Department
Chair/Dean
Approved for the Graduate Council
David S. Chapman Dean of the Graduate School

ABSTRi\CT
Hair has become a widely accepted alternative matrix for forensic drug testing.
This project examined the roles of drug basicity, drug-melanin binding, and cellular
transport of drugs in the phenomenon of preferential incorporation of drugs into darker
versus lighter colored hair.
Validated assays were developed then used to profile the melanin content in
human hair of various colors. Melanin content was then correlated with codeine
incorporation into the analyzed hair.
Black hair from rats dosed with the basic drug amphetamine was found to contain
three times the concentration of amphetamine than white hair from the same rats. In
contrast, no difference in N-acetylamphetamine (N-AcAp) content was found between
black hair and white hair from rats dosed with N-AcAp, a nonbasic amphetamine analog.
Cocaine and amphetamine, two drugs that show a hair color bias, bound to
eumelanins and mixed eu-/pheomelanins to varying degrees, but not to pure
pheomelanin. Benzoylecgonine (BE) and N-AcAp, drugs that do not show a hair color
bias, did not to bind to any subtype of melanin.
Pigmented melanocytes (PM) took up large amounts of the basic drugs
amphetamine and cocaine (levels of uptake dependent on melanin content), while
keratinocytes and non-pigmented melanocytes (NPM) took up only small amounts of
amphetamine. None of the studied cells took up N-AcAp above background levels.
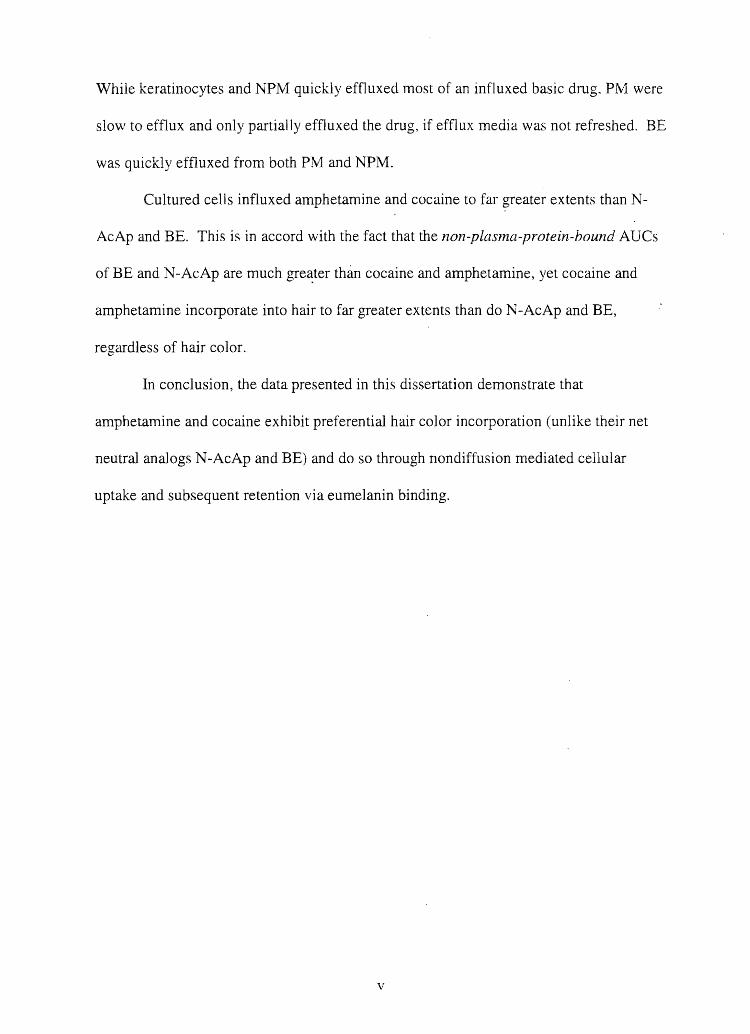
While keratinocytes and NPM quickly effluxed most of an influxed basic drug, PM were
slow to efflux and only partially effluxed the drug, if efflux media was not refreshed. BE
was quickly effluxed from both PM and NPM.
Cultured cells influxed amphetamine and cocaine to far greater extents than N-
AcAp and This is in accord with the fact that the non-plasma-protein-bound AUCs
of BE and N-AcAp are much gre~ter than cocaine and amphetamine, yet cocaine and
amphetamine incorporate into hair to far greater extents than do N-AcAp and BE,
regardless of hair color.
In conclusion, the data presented in this dissertation demonstrate that
amphetamine and cocaine exhibit preferential hair color incorporation (unlike their net
neutral analogs N-AcAp and BE) and do so through nondiffusion mediated cellular
uptake and subsequent retention via eumelanin binding.
v
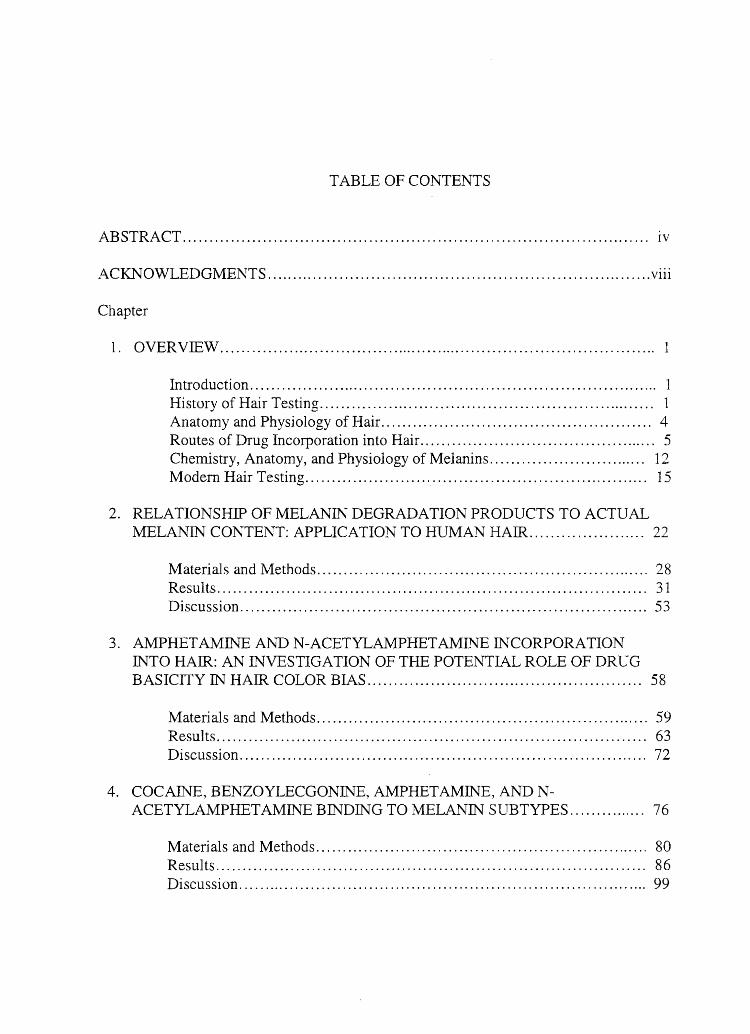
T ABLE OF CONTENTS
ABSTRACT ........................................................................................ iv
.l·\CKNOWLEDGMENTS ......................................................................... viii
Chapter
1. OVERVlEW .................................................................................... 1
Introduction. . . . . . . . . . . . . . . . . .... . . . . . . . . . . . . . . . . . . . . . . . . . . . . . . . . . . . . . . . . . . . . . . . . . . .. . . ... 1 History of Hair Testing ................................................................ 1 Anatomy and Physiology of Hair .................................................. , 4 Routes of Drug Incorporation into Hair.. .. .. .. . . . .. . .. .. .. . .. . .. . .. . .. .. .. . . . ... ... 5 Chemistry, Anatomy, and Physiology of Melanins .............................. 12 Modem Hair Testing... .. .... ...... .. . ...... . .. ......... ...... ......... . . ...... ...... 15
2. RELATIONSHIP OF MELANIN DEGRADATION PRODUCTS TO ACTUAL MELANIN CONTENT: APPLICATION TO HUMAN HAIR ...................... 22
Materials and Methods. . .. .. . .. .. . .. . . . . . .. . . . .. .. . .. .. . . . . .. .. . .. . .. . . . . . . . . .. ... ... 28 Results ................................................................................. 31 Discussion ............................................................................. 53
3. AMPHETAMINE AND N-ACETYLAMPHETAMINE INCORPORATION INTO HAIR: AN INVESTIGATION OF THE POTENTIAL ROLE OF DRUG BASICITY IN HAIR COLOR BIAS .............. , ..... . .. . . . .... . .. . . . . .. . ... .. . . . . ... 58
Materials and Methods ............................................................... 59 Results ................................................................................. 63 Discussion .............................. '" ............................................ 72
4. COCAINE, BENZOYLECGONINE, AMPHETAMINE, AND N-ACETYLAMPHETAMINE BINDING TO MELANIN SUBTYPES ............... 76
Materials and Methods. . . . . . . . . . . . . . . . . . . . . . . . . . . . . . . . . . . . . . . . . . . . . . . . . . . . . . . . . .. . . .. 80 Results ................................................................................. 86 Discussion .............................................................................. 99
5. INFLUX AND EFFLUX OF AMPHETAMINE, N-ACETYLAMPHETAMINE, COCAINE, AND BENZOYLECGONINE IN KERATLNOCYTES, PIGMENTED MELANOCYTES, AND NON-PIGMENTED MELANOCYTES ....................................................... ] 16
Materials and Methods. . . . . . . . . . . . . . . . . . . . . . . . . . . . . . . . . . . . . . . . . . . . . . . . . . . . . . . . . . . .. 119 Reslllts ................................................................................ 127 Discussion. . . . . .... . . . . . . . . . . . . . . . . . . . . . . . . . . . . . . . . . . . . . . . . . . . . . . . . . . . . . . . . . . . . . . . . . .. 159
6. SUMMARY AND SIGNIFICANCE ................................................... 165
Summary .............................................................................. 165 Significance.......................................................................... 166
APPENDIX ...................................................................................... 169
REFERENCES... . . . . . . ... . .. . ..... .. . ......... . .... . ... . .. ...... ... .. . . . . .. ... . .. . ... ..... . ... 192
vii
ACKNOWLEDG!vlENTS
I would like to extend much thanks and appreciation to my advisors, Dr. Douglas
E. Rollins and Dr. Diana G. Wilkins, for their guidance and counsel in my graduate
research and study. Their instruction has been of great value in teaching me the ways of
the anal yti cal laboratory.
I would also like to thank the other members of my dissertation committee: Dr.
Garold S. Yost, Dr. Jeanette C. Roberts, and Dr. Laurence J. Meyer. I have had the
pleasure of working in each of their laboratories for a significant period of time during
my graduate training. They have each brought a unique and valuable perspective to this
project.
The rest of the staff at the Center for Human Toxicology has been a great group of
people to work with. In particular, I am grateful to Dr. Matthew H. Slawson and Dr.
Deanna Hubbard who have provided me with hands-on training for some of the various
aspects of this project.
In addition, I would like to thank all the additional professors and students here at
the University of Utah and at my undergraduate alma matter, Walla Walla College, who
have taught me many things and helped shape my scientific philosophy.
The concluding research on this project wouid not even have been possible
without the valuable cell culture donations of Dr. Dorothy Bennett and Mr. Simon Hill of
St. George~s Hospital.rvledical School, London, UK and Dr. Gerald Krueger and Ms.
Cynthia Jorgensen of the University of Utah. To them I am greatly indebted.
I also express my thanks to the National Institutes of Health and the University of
Utah Graduate School, which have provided the financial support for my graduate
education.
Finally, I would .like to express my heartfelt thanks to my family-to my wife,
Laurie, who has been my number one fan and supporter, to my parents, James and Joanne
Borges, for their unending encouragement and love, and to my extended family, for their
constant support and enthusiasm.
This acknowledgments section would not be complete without an expression of
gratitude to my Creator, the Alpha the Omega, "Trust in the Lord with all thine heart; and
lean not unto thine own understanding. In all thy ways acknowledge Him, and He shall
direct thy paths." Proverbs 3:5, 6.
ix
CHAPTER 1
OVERVIE\V
Introduction
Hair analysis for xenobiotics began in 1858 with efforts to determine arsenic
levels in the hair of a corpse (1). Modern hair testing took another century to begin
development. The know ledge about and technology for hair testing has expanded
dramatically since the mid 1950s. Today, however, there are still many poorly
understood aspects of hair testing, particularly in regard to the fundamental chemistry and
biology of how different drugs with their unique and distinctive chemical features
incorporate into hair. Ideally, hair testing would be a convenient, non-invasive technique
with a long window of detection for monitoring all drugs of abuse. While many drugs
are currently tested for in hair, our fundamental knowledge regarding the characteristics
and mechanisms for the incorporation of certain drugs into certain hair types is
incomplete. What roles, for example, do external exposure, hair treatments, and even
hair color play in the incorporation of each tested drug in hair? Fair and accurate hair
testing relies upon our knowledge and understanding of these factors. As such, the
research presented herein seeks to more fully investigate the roles of hair color
(pigmentation), and hair cell drug transport in drug incorporation into hair.
History of Hair Testing
The history of hair analysis for xenobiotics began in 1858 with the publication of
Casper's 'Praktisches Handbuch der Gerichtlichen Medizin' (1) , which translated means,
'Practical Guide to Legal Medicine'. The account describes the determination of arsenic
in the hair of a body exhumed 11 years after buriaL The modern saga of hair analysis
begins in 1954, with the publication of research conducted by Goldblum et al. describing
the detection of barbiturates in guinea pig hair via ultravio.let spectrophotometry (after
sample extraction) (2). Twenty years later Harrison et al. (3) described the incorporation
of 14C radiolabeled D-amphetamine into guinea pig hair. In a 1979 review of the
potentia] of hair as a diagnostic tool, Maugh (4) described efforts to use hair as both a
forensic tool and matrix for medical diagnoses. Original efforts to employ hair as a
forensic tool sought to use trace element profiles from hair to link suspect(s) to the scene
of a crime. Such efforts were soon shown to be futile due to the fact that trace element
profiles vary with time and location of head hair. Evidence of severe exposure to trace
elements such as lead, arsenic, cadmium, and mercury (4) was, however, obtainable.
Ideas to develop elemental analysis of hair as a diagnostic tool were fairly widespread at
the time. Efforts in this arena attempted to diagnose disorders such as cystic fibrosis,
celiac disease, phenylketonuria, protein-calorie malnutrition (Kwashiorkor), zinc
deficiency (ironically, severe zinc deficiency causes hair loss), iron deficiency, juvenile
onset diabetes, and learning deficiencies. These efforts, however, did not make a
significant contribution to modern medicine. Perhaps due to the excitement surrounding
mineral analysis in hair, laboratories began to spring up that would offer nutritional
consulting through hair analysis. Surprisingly, this practice is still under debate (5-9).
3
Early hair analysis for trace elements was accomplished through the use of techniques
such as neutron activation analysis, photon activation analysis. atomic absorption
spectroscopy, and particle-induced x-ray emission. Detection of foreign nonmetallic (i.e.,
organic or drug) substances in hair was, at the ~ime, essentially precluded due to the lack
of techniques sensitive enough to quantitate the low levels of drugs present in hair
samples from donors who had not been given repeated, near lethal doses of the drug in
question. Research into hair analysis for drugs continued, and in 1979 a seminal paper by
Baumgartner et al. (10) demonstrated the detection of opiates in hair through the use of
radioimmunoassay (RIA). In addition to their novel techniques, Baumgartner and co
workers succeeded in demonstrating the presence of opiates in hair three months after
drug administration as well as time dependent drug deposition along the hair shaft. Soon
the field began to grow with regular publications beginning in the early 1980s 01-15).
Initial applications of hair testing focused primarily on opiates, phencyclidine,
phenobarbital, and cocaine. This was probably due to the availability of antibodies
against these drugs. The next major advancement involved the development of electron
impact ionization mass spectrometric (EI-MS) methods for the identification of
methamphetamine in hair (16). The use of this technology was soon extended to the
analysis of tricyclic antidepressants (17), nicotine (17), chloroquine (18) and
monodesethylchloroquine (8). Interestingly, although it was not a goal of their
investigation, the study by Ishiyama et al. (7) provided the first evidence of a potential
hair color bias in drug incorporation into hair. Their results indicate an approximate four
fold greater concentration of methamphetamine in the hair of C57 black mice versus the
hair of ddY white mice. The only comment made by the authors in regard to this
4
occurrence stated that Harrison's (3) data (which suggested that amphetamine might be
incorporating into or binding to melanin in hair) was not supported by their data because
they observed methamphetamine in white hair as well as black hair. Thus they suggested
that drugs probably bind to protein rather than melanin. An additional improvenlent to
the previous EI-MS methods was provided by Suzuki et al. (19) in applying chemical
ionization techniques for mass spectrometric analysis of amphetamines in hair. This
resulted in significantly better sensitivity and paved the way to modern techniques for
drug detection in hair.
Anatomy and Physiology of Hair
In humans, hair formation first begins primarily on the head when an embryo is
approximately 60 days old with the formation of a rudimentary dermal papilla (20). The
dermal papilla is a group of specialized undifferentiated fibroblast cells, derived from the
mesoderm, that initially form as a clump of cells in the dermis just below the epidermis.
The entire hair follicle including associated modified structures such as sebaceous glands,
are ultimately derived from the dermal papilla. After the initial cellular organization of
the dermal papilla, a peg of cells begins growing into the dermis, pushing the dermal
papilla deeper into the dermis and eventually forming an involution. At this stage, the
forming hair shaft begins to differentiate, initiating anagen, the first phase of the hair
growth cycle, discussed below. During this phase, undifferentiated keratogenic
epidermal matrix cells from the dermal papilla begi~ to move upward. Their anatomical
fate as part of the hair structure is determined by their initial position relative to the
dermal papilla, which remains at the base of the hair follicle (21-24). As cells migrate
upward, the hair shaft begins to form from the middle matrix cells. These cells produce
large amounts of keratin proteins and eventually harden in a process known as
keratinization, which, chemically, is the result of crosslinking of sulfhydryl groups of
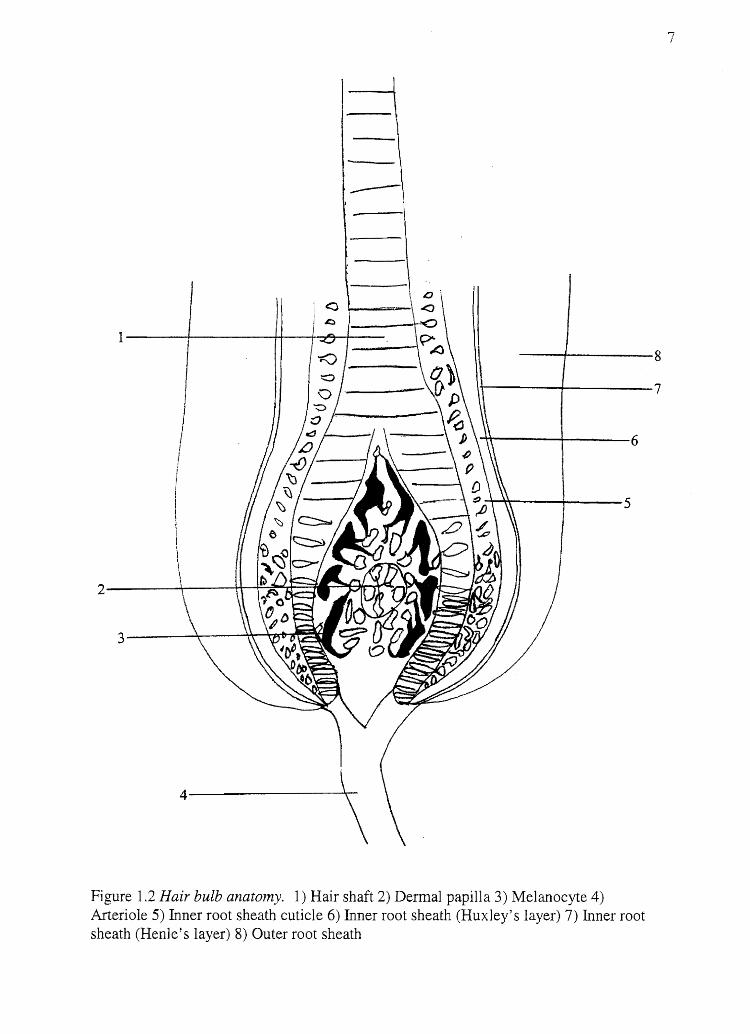
keratin proteins to form disulfide bonds. Anatomy of the fully formed hair bulb and hair
follicle with surrounding structures can be seen in Figures 1.1 (adapted from Robbins
(25)) and 1.2, respectively. The ultimate chemical composition of hair varies with
location on the body and between individuals, however, it may be of interest in
relationship to proceeding sections, that hair consists of protein (65-95%), water (15-
35%), lipids (1-9%), melanin (0.2-1.5%) (see Chapter 2), and trace amounts of minerals
(0.25-0.95%) (26).
5
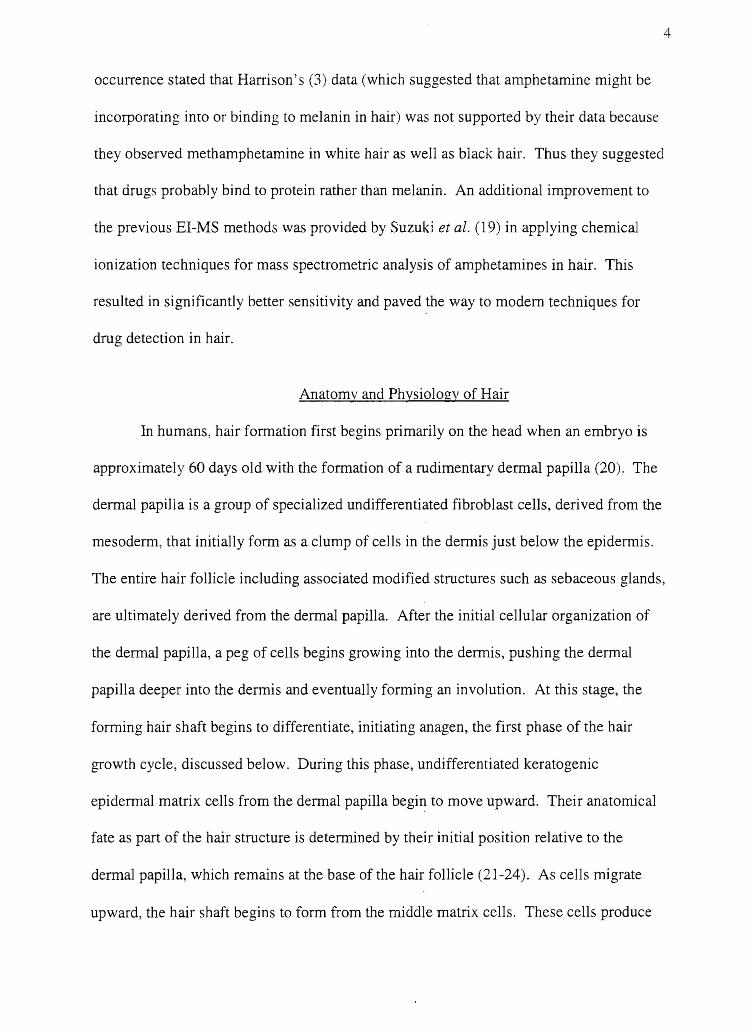
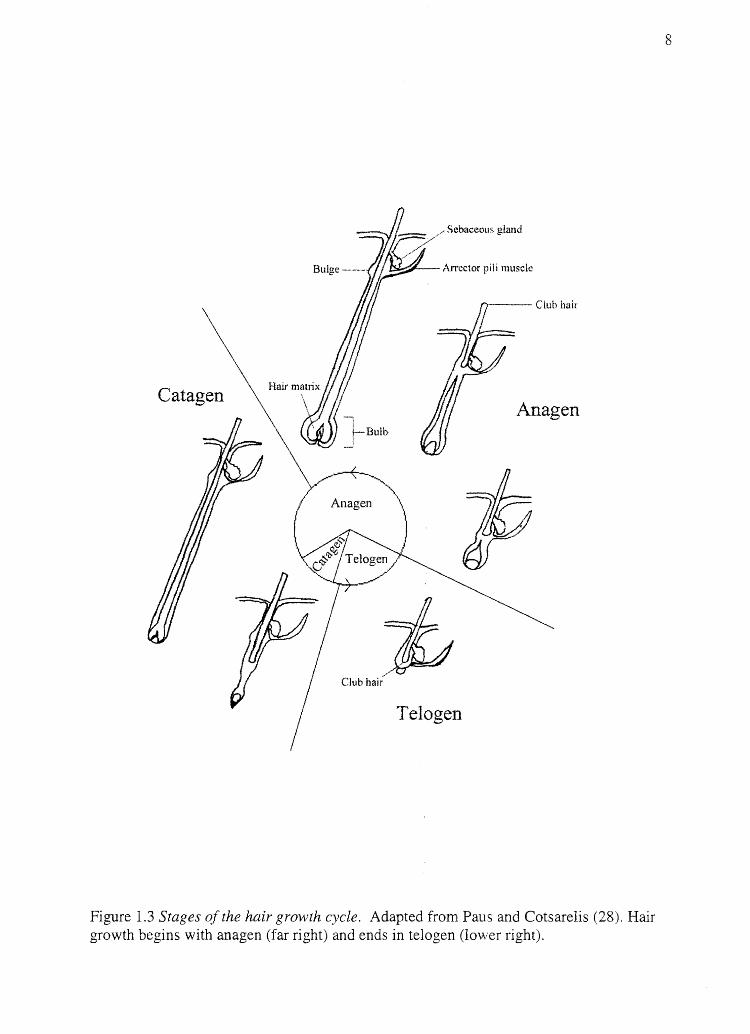
Hair follicles do not continue to grow forever. Rather, after a certain period of
growth (anagen), hair follicles undergo a transitional phase, known as catagen, during
which cell division halts, the base of the hair shaft keratinizes, and the bulb begins to
degenerate. At this point, the hair follicle enters a resting phase, known as telogen, where
no cellular proliferation occurs and the now fully keratinized hair shaft can easily be
removed from the follicular canal. An increase in metabolic and proliferative activity of
the matrix cells reinitiates anagen. This increase in activity is now thought to be due to
the divisjon and migration of stem cells from the bulge of the outer root sheath located
near the connection point of the arrector pili muscle (27). Figure 1.3 (adapted from Paus
and Cotsarelis (28)) demonstrates the relative amount of time spent in each phase of the
hair growth cycle.
Routes of Drug Incorporation into Hair
Drugs can be deposited into and onto hair via a number of routes including
through systemic circulation, perspiration, sebum, skin, and the external environment

,..-------14 ;-"---13
...---1'"""7'-----12
8--------------~
--== --+1---11
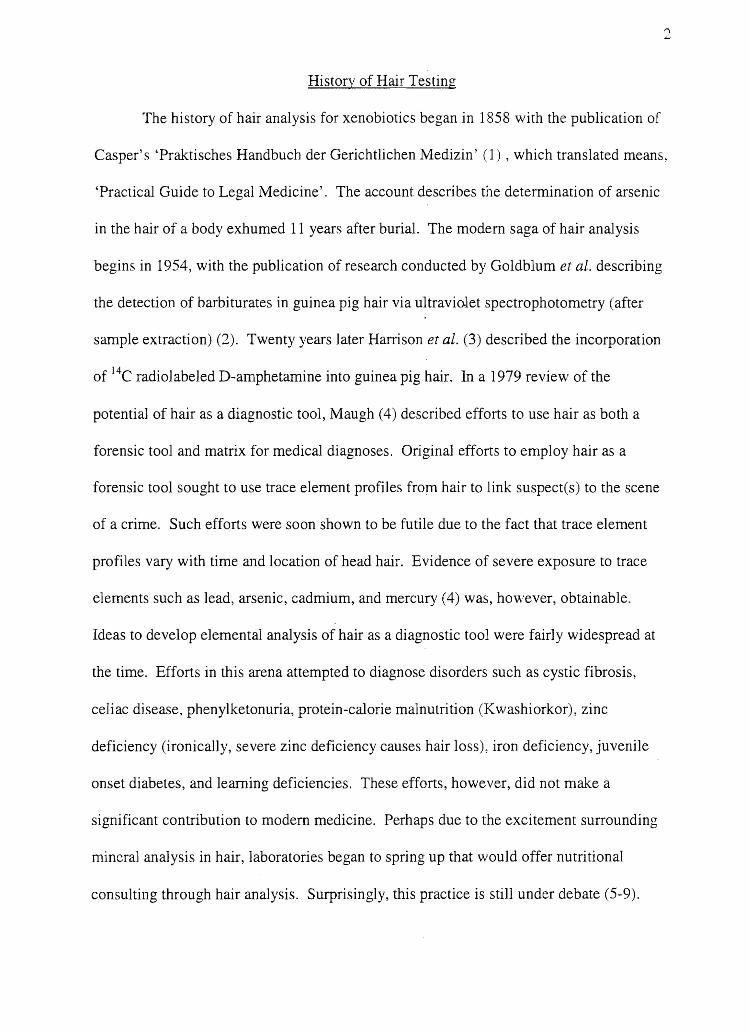
Figure 1.1 Hair follicle anatomy. Adapted from Robbins (25) 1) Stratum corneum 2) Epidermis 3) Arrector pili muscle 4) Bulge 5) Dermis 6) Melanocyte 7) Dermal papilla 8) Arteriole 9) Outer root sheath 10) Inner root sheath 11) Sebaceous gland 12) Cuticle 13) Cortex 14) Medulla
6
1------4-------~+--+~~---
----1-----8
\+-------~--------7
~------~------6
-1--l~--1----5
2-------4-----+~~~~
4------\-\-
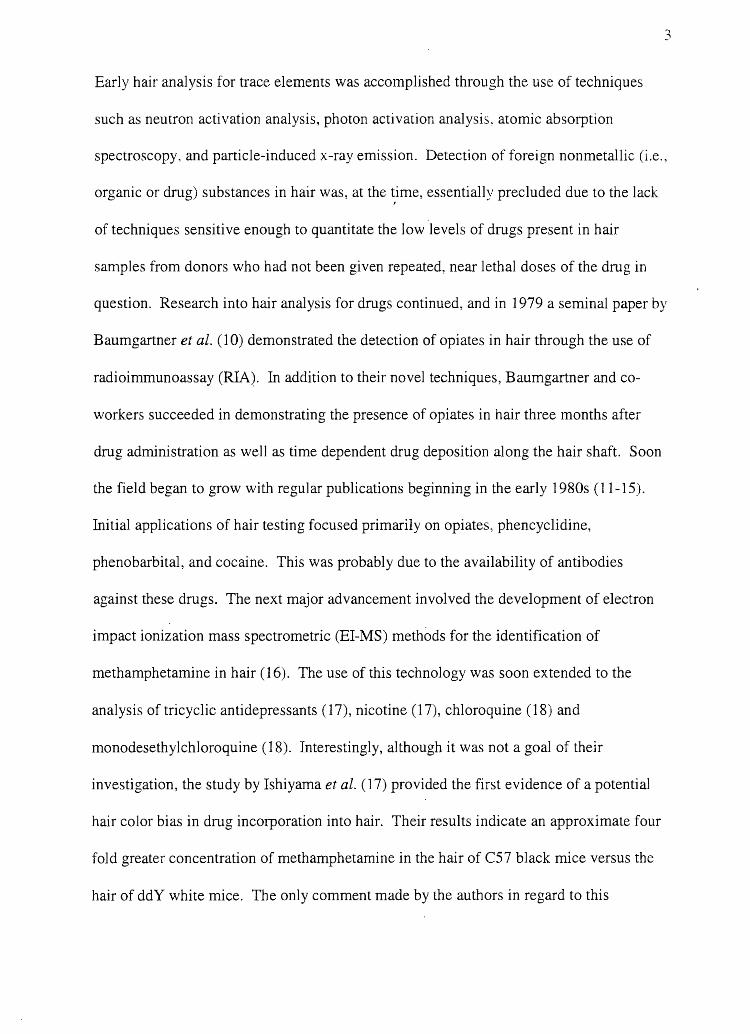
\ Figure 1.2 Hair bulb anatomy. 1) Hair shaft 2) Dermal papilla 3) Melanocyte 4) Arteriole 5) Inner root sheath cuticle 6) Inner root sheath (Huxley's layer) 7) Inner root sheath (Henle's layer) 8) Outer root sheath
7
Sebaceous gland
~'7-- Arrector pili muscle
Anagen
=:t Club hair
Telogen
Figure 1.3 Stages of the hair growth cycle. Adapted from Paus and Cotsarelis (28). Hair growth begins with anagen (far right) and ends in telogen (lower right).
8
9
(29, 30). Perspiration, sebum, and the external environment can only deposit drug on the
outside of the hair follicle. For most hair testing purposes this is an undesirable situation,
since drug on the external surface of hair is not indicative of ingestion. In an ideal
situation, hair testing would only analyze drug incorporated into hair through systemic
circulation. This would allow for the least number of interferences and inconsistencies,
e.g., drug from smoke or other residue in the environment, and inconsistencies due to
inter-individual differences in perspiration and sebum secretion. This would also
eliminate the need for hair washing procedures prior to analysis. The real situation is not
ideal, however, as each of the above routes may substantially contribute to drug
incorporation into hair.
Nevertheless, hair analysis relies on the fact that drugs can be incorporated from
systemic circulation into hair follicles. This route for drug incorporation into hair is
arguably the most important because it provides the basis for consistent, reliable
measurements of drug ingestion, and, at least in rat models, is the route by which the
majority of drug is incorporated into hair. (Environmental exposure is easily controlled
in animal studies, and, except for the soles of their feet, rats lack sweat glands.) The
simplest model for drug incorporation into hair from the bloodstream involves passive
diffusion of drug from arterial capillaries to extracellular fluid to the inside of hair
forming cells. Once inside the cells, the drug must be retained long enough for the cell to
move up and out of the zone of differentiation and biological synthesis. While in certain
drug-animal models, drugs may incorporate into hair from the bloodstream in a linear,
dose-dependent manner suggestive of passive diffusion down a concentration gradient
from blood into hair (31), accumulating evjdence argues that this model is probably not
10
accurate (29). A number of drugs incorporate into hair to a greater extent than their
metabolites or related compounds despite the fact that the area under the plasma
concentration versus time curve (AUC) is much greater for the compounds that are barely
detected in hair. For example, in various animal and human models, tJ.9_
tetrahydrocannabinol (THC) (32-35), cocaine (29, 36-39), nicotine (40), amphetamine
(41,42) and 6-acetylmorphine (43), all are found in greater concentrations in hair than
Il-nor-9-carboxy-tJ.9 -tetrahydrocannabinol (THC-COOH), BE and ecgonine methyl ester,
cotinine, N-AcA.p, and morphine, respectively, while the AUCs or plasma concentrations
of the metabolites (or related compounds) are much greater than the plasma
concentrations of the parent compound. These data suggest that factors other than
passive diffusion down a concentration gradient or even simple selective diffusion
through a semipermeable membrane may be important. Factors such as selective
. .
transport of certain drug molecules into hair forming cells and binding of drugs by hair
components (i.e., protein, melanin, and possibly lipids) may play major roles in
determining the amount of a given drug incorporated into hair. Although little, if any, ~.
research has been conducted to determine whether hair cells may take up drugs by
mechanisms other than passive diffusion through the cell membrane, a fair amount of
research has been done to characterize the binding of drugs to hair components (i.e.,
protein (44-49), melanin (50-62), and lipids (63)). A major controversy still exists in this
area, especially in relation to the ability of drugs to bind to melanin, and whether or not
this can produce a hair color bias (40, 63-74).
Nakahara (75) (and others) have carried out a large amount of research to
determine what physicochemical factors are most important for a drug to be incorporated
into hair. Findings indicate that the greater the melanin affinity (40,43,63-71),
lipophilicity (41, 75), and basicity (41, 42, 75) of a drug, the more it incorporates into
hair.
11
Melanin affinity is important because it represents a mechanism whereby
significant amounts of drug can bind inside hair cells and be retained as the cells
keratinize and move up into the hair shaft. A large number of drugs have .been shown to
bind to melanin, including amphetamine (55, 56, 76), chloroquine (51, 53, 57),
chlorpromazine (47,48,51,54), cocaine (55,56,76), phencyclidine,
methylenedioxymethamphetamine (43), tricyclic antidepressants (56), 1-methyl-4-
phenylpyridinium (MPP+) (77,78), clenbuterol, nortestosterone, diethylstilbesterol (54),
paraquat (50,51), and streptomycin (79) to name a few. Even some cationic metals such
as iron, manganese, copper, lead, nickel, magnesium, zinc, cadmium, aluminum,
scandium, lanthanum, and indium (51, 80-83) are documented to bind to melanin. The
exact chemical nature of drug-melanin binding is not well understood, but it is thought to
involve various types of binding interactions between drugs and melanin orthoquinones,
phenolic groups, carboxylic acids, indole-amines, and/or van der Waals interactions
between stacked indole units (50, 51, 53, 83). Because of their affinity for certain types
of drugs (e.g., basic drugs), melanins appear to playa major role in the incorporation of
such drugs into pigmented hair (40,63-71). Interestingly, drugs can also bind to'
melanins in locations throughout the body other thaJ? hair. In fact, many of these cases
have implicated toxicological effects (58). For example, drug binding to the uveal tract
of the eye (84,85), ear (cochlear) (86, 87), and neuromelanin (77,78,88, 89) has been
implicated in the negative toxic effects of the drugs to surrounding tissues. Lipophilicity
12
is important because it is thought to allow permeation through biomembranes such as in
capillary beds and hair cell membranes. Interestingly, Nakahara (43) showed that for 19
drugs, when melanin affinity (Ka) is multiplied by lipophilicity (log P, see Kaliszan et al.
(90)) and correlated to the hair incorporation ratio ((ICR) = [Drug in Hair]lPlasma AUC),
an R2 value of 0.979 is obtained. Basicity is probably related to melanin affinity, i.e.
positively charged, basic drugs bind best to negatively charged, acidic melanin. The
isoelectric point of hair is approximately 3.7 (91) and is probably mostly derived from the
acidity of melanin, however, acidic sites on hair keratin cannot be ruled out as drug
binding sites (45). Data from Dehn et al. (92) suggest that drugs such as nicotine and
cotinine may be covalently incorporated into the melanin polymer. While this
phenomenon is of interest from a biochemical standpoint, it cannot contribute to drug
detection in hair because the drug molecules would have to be cleaved during the
extraction process at the exact carbon-carbon juncture where they were initially joined to
the melanin polymer. Covalently bound compounds would not be detectable with
currently available techniques.
Chemistry, Anatomy, and Physiology of Melanins
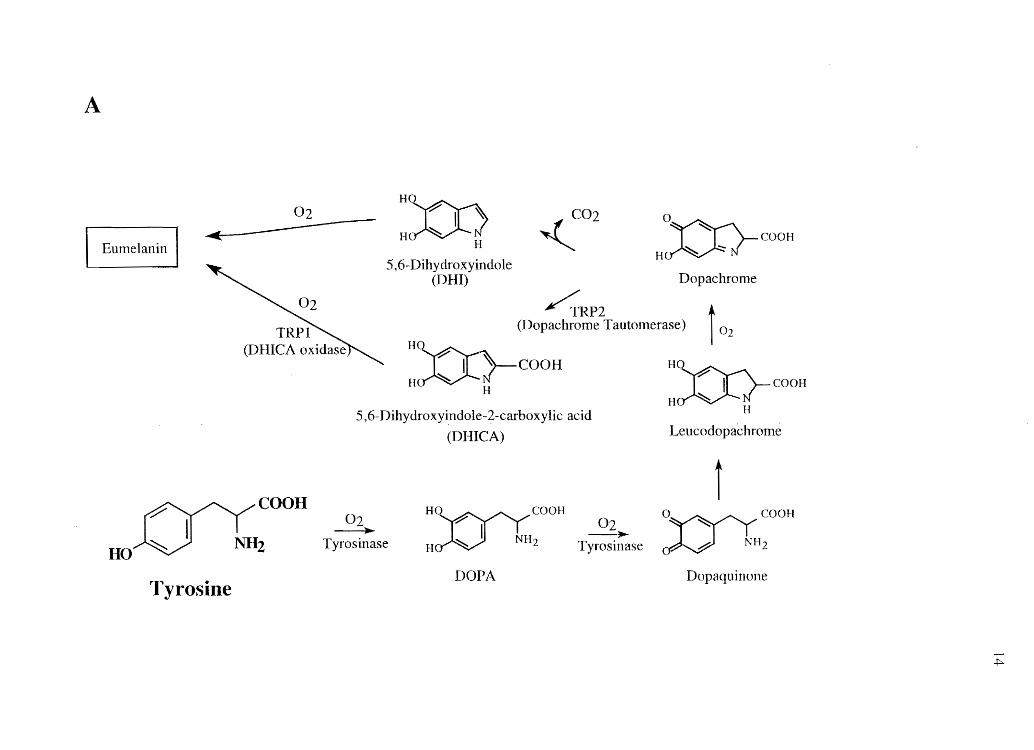
The two critical ingredients for cellular biosynthesis of melanin are the amino
acid tyrosine and the rate limiting enzyme tyrosinase. In the Golgi apparatus-derived
(93) melanosome, tyrosine undergoes a series of oxidations to produce both the black
colored eumelanin and the reddish-brown colored pheomelanin polymers (Figure 1.4).
The structures of eumelanin and pheomelanin are not shown because they are varied and
not well characterized. Eumelanin is a polymeric combination of carbon-carbon linked
indolequinones and carboxylated pyrroles derived primarily from 5,6-dihydroxyindole
13
Figure 1.4 Biosynthetic pathways of (A) eumelanin and (B) pheomelanin.
A
----... Eurnelanin
02 --------
~COOH
HXJo .p' " H ~ I
H
5,6-Dihydroxyindole (DHI)
ZC02 o
HM-COOH
Dopachrome
~P2 t (Dopachrome Tautomerase) I 02
H~ COOH H~r
H
5,6-Dihydroxyindole-2-carboxylic acid
(DHICA)
02 -----... H ~COOH
H~ COOH
H~r H
Leucodopachrome
r O~COOH
HO~ NIIz Tyrosinase HAJ NH2 02 -...
Tyrosinase ~V NH2
Tyrosine DOPA Dopaquinone
~

B ~COOH
HO~ MI2
Tyrosine
02 -... Tyrosinase
Pheomelanin
nxn:COOH ~ 02
'NH ~ H ~ 2 Tyrosinase
DOPA
o ~~COOH
~ NH2
Dopaquinone
r Cysteine
H ~COOH
HOY NH2 HM-t, NH2
S
~COOH NH2
5 -S -Cystei n y ldopa
~ H~COOH
~ NH2
HOO~S
!
+ ~ COOH H . S
~COOH NH2
2-S-Cysteinyldopa
+ I NH2 llMt~
HOO~~ COOH
Benzothiazine derivatives Ul
(DR!) and 5,6-dihydroxyindole-2-carboxylic acid (DRICA), while pheomelanin also
includes related benzothiazine units derived primarily from 2-cysteinyl-S-Dopa (2-
CysDOPA) and 5-cysteinyl-S-Dopa (5-CysDOPA) (94, 95).
16
Melanocytes derived from the neural crest associate with the matrix cells in a
relationship whereby melanin granules, known as melanosomes, are transferred to the
keratogenic matrix cells (96-98). This process, which gives hair its color, is thought to
occur through both exocytosis of melanosomes and uptake by keratinocytes andlor
keratinocyte phagocytosis of invading melanocyte dendrites (93, 98-102). As with most
other biological processes, melanin biosynthesis is under the control of honnones,
receptors, and enzymes. Pro-opiomelanocortin is produced in the pituitary gland and (as
relates to melanogenesis) is cleaved to produce adrenocorticotropin and modified to
produce a-melanocyte stimulating honnone (103). These peptide hormones activate G
protein coupled melanocortin receptors (l04) which activate adenylyl cyclase and lead to
an increase in intracellular cyclic adenosine monophosphate (cAMP) (103, 105). cAMP
activates protein kinase C beta which. in tum, activates tyrosinase through
phosphorylation of serine residues in the cytoplasmic domain of the melanosomal
membrane bound protein (105, 106).
Melanogenesis is also regulated by light during the tanning process. Light
produces two tanning phases-immediate tanning and delayed tanning (107). Melanin
formed during immediate tanning appears to be structurally different from constitutive
melanin. Although exact structures are not known, it is derived from photo-oxidation
polymerization products of melanogenic precursors such as DHI and DRICA. Its
fonnation is oxygen dependent (107). Delayed tanning is not oxygen dependent and
17
produces a longer lasting tan due to increased melanin synthesis, melanin transfer to, and
distribution in epidermal cells (07). Although the biochemical pathway for delayed
tanning is not well understood, studies by Schallreuter and co-workers (104) suggest that
UVB can release TNF-a, which induces GTP-cyclohydrolase 1, which, in tum,
synthesizes L-erythro-5,6,7,8-tetrahydrobiopterin (6BH4), a cofactor for phenylalanine
hydroxylase which converts phenylalanine to tyrosine-the amino acid required for
melanin synthesis. 6BH4 is known to inhibit tyrosinase by a noncompetitive allosteric
mechanism (108), but UVB light can photo-oxidize 6BH4 to 7,8-dihydroxanthopterin,
reactivating tyrosinase and overall enhancing pigmentation (104, 109). Evidence
presented by Palumbo et aI. (110), suggests that in addition to its well known copper
cofactor, tyrosinase may also require Fe2+ to act as a redox exchanger with the cupric ions
at the active site of the enzyme. The summary of scientific literature available on
tyrosinase research suggests that it is indeed a complexly regulated enzyme. Other,
perhaps indepe'ndent, pathways may also be involved in delayed tanning. Additional data
suggest that DNA damage induced by UV light can induce melanin production (111).
Interestingly a primary mediator of this response appears to be the thymine dinucleotides
produced during DNA excision repair after UV irradiation. Presented to cells alone in
the absence of UV light, such dinucleotide dimers can induce melanin production that
closely mimics that induced by UV irradiation itself. The biochemical pathways
underlying this process, as well as UV light-induced, tanning in general, however, remain
to be confirmed and fully elucidated.
18
Modem Hair Testing
Applications for Hair Testing
Even though all the time course, metabolic, and potential hair color bias effects
have not been completely worked out for hair testing, hair testing is now the most widely
accepted alternative to urinalysis for drug testing in the United States (112). Among hair
testing's applications include preemployment screening, drug recidivism screening for
patients in antiabuse programs, athlete testing, school drug testing, and home hair: testing
kits (for parents to screen their children). Hair testing has been applied to virtually every
drug-testing situation. An interesting proposal for the use of hair testing would be in
compliance monitoring programs (113-119). The purposes of such analyses would
include monitoring patient compliance of prescribed medications (Le., neuroleptics,
antiepileptics, buprenorphine, and methadone) and even potentially using an "inert" drug
such as ofloxacin that moves up in the hair shaft with time to track another drug's
ingestion during a specified monitoring period. In theory, drugs stay with the hair cells
they incorporate into and move along with the hair shaft as it grows. This phenomenon
has been documented for ofloxacin (120), rhodamine, and fluorescein (49).
Advantages of Hair Testing
There are two primary advantages that hair testing provides over traditional
urinalysis and plasma testing methods. First, hair testing is less invasive; collecting a few
hairs from the scalp takes less effort for both laboratory personnel and the patient than
does acquiring a urine or plasma specimen. Integrity of the sample can also be ensured
because laboratory personnel (or potential employers) can collect the sample directly
from the subject without the difficulties of having to trust the subject or having to observe
19
urination. Second, hair testing provides a larger window of detection than does plasma or
urinalysis. A commonly sited time frame for detection of common drugs of abuse is 90
days (112)l although this has not been rigorously tested for every drug tested for in hair.
Disadvantages of Hair Testing
There are a few difficulties specific to hair testing that are not encountered with
traditional plasma and urine testing. First, drugs from the environment (i.e., smoke) can
adhere to the outside of hair and produce a positive test result even if no drug has been
ingested systemically. This can be a problem with all drugs that are smoked (which,
unfortunately, includes all the major drugs of abuse). In theory it may be possible to
circumvent this difficulty by applying a proper wash procedure to the hair prior to
analysis. The wash procedure must be documented to wash off only external drug
contamination (without removing systemically incorporated drug, presumably inside the
hair shaft) and to remove all external contamination. Paulsen et al. (121) have
demonstrated that several currently employed laboratory hair wash procedures (including
methanol, 0.1 M phosphate, pH 6.0 and pH 8.0, and isopropanol and phosphate buffer,
pH 5.5) can significantly alter the reported levels of cocaine in hair from systemic
incorporation. Unpublished data from the Center fot Human Toxicology at the
University of Utah indicate that both rat and human hair exposed to cocaine freebase
smoke, even after washing with phosphate buffer, pH 5.5 and methanol, contains enough
cocaine to potentially be reported positive for drug abuse-if benzoylecgonine (BE) is
not taken into account. If not handled carefully and appropriately, the former
phenomenon can lead to false negative results and the latter to false positive results.
Therefore special care to properly interpret hair testing results, e.g., employing a BE to
20
cocaine ITlinimum ratio (that is, a metabolite to parent dnlg minimum ratio) for a positive
test and performing thorough validation studies, must be taken to produce accurate hair
testing reports.
In addition to smoke, drugs can also be deposited on the hair from perspiration
and sebum. It would not present a problem if this route of incorporation produced a
positive test, but interindividual differences in the concentration of drug in perspiration
and sebum and the amount of perspiration and sebum secreted are just starting to be
investigated (122, 123) and may play significant roles in determining hair test outcomes
if wash procedures are routinely employed.
A second major difficulty involving hair testing is the effect of hair treatments
such as bleaching and dyeing on ~air test outcomes. Included in this category is head
shaving, which, if head hair is the only validated hair type for drug testing, could easily
provide a means of evading hair testing. The effects of hair treatments such as bleaching
and dyeing on hair drug test outcomes are not well investigated. However, studies by
Kidwell and DeLauder (124, 125) suggest that cosmetic hair treatments may alter the
physical properties of hair, thereby altering its drug binding capacity and increasing its
accessibility to external contamination; thus potentially altering a hair test outcome.
A third problem plaguing hair testing and a major focus of this dissertation is the
potential for hair color bias; that is, the phenomenon where more drug is incorporated
into dark hair than light colored hair-all else held equal. Hair color bias arises for a
drug because of its binding affinity for the hair melanin itself. As mentioned above,
because of their affinity for certain types of drugs (e.g., basic drugs) (50-62), melanins
appear to playa major role in the incorporation of such drugs into pigmented hair (40,
21
63-71). The existence of a hair color bias means that for hair testing to be fair to all
members of society, hair testing for drugs that demonstrate a hair color bias must include
normalization to the amount of melanin in hair-especially, and perhaps specifically, the
amount of eumelanin in hair. Studies at the Center for Human Toxicology at the
University of Utah (126) have shown that incorporation of codeine into human hair is
highly correlated with the amount of eumelanin in hair while the amount of pheomelanin
does not seem to matter much. This is in agreement with studies to be presented later in
this dissertation showing that pure eumelanins bind basic drugs but that pure
pheomelanins do not bind basic drugs.
In summary, hair testing provides advantages over traditional drug testing
techniques that make it a very attractive alternative matrix for drug detection. As hair
testing technology becomes more popular, however, we must make sure not to extend
hair testing beyond our fundamental knowledge of the chemical and biological processes
involved in drug incorporation into hair. Only in this manner can society be assured of
fair and accurate drug testing outcomes from this innovative technique.
Research Objectives
The overall objectives of this research were to assess the ability of basic and non
basic related drugs to incorporate into black and white hair, bind to melanin, and move
into and out of hair cells. The following hypotheses and specific aims were designed to
accomplish these goals:
1. Hypothesis: The amount of melanin in hair is directly proportional to the
amount of systemically administered codeine that is incorporated into hair.
22
Specific Aim 1 a: Establish subtype specific melanin assays for quantitating the amounts
of DRI, DHICA, 2-CysDOPA, and 5-CysDOPA-derived melanin in biological melanin
containing samples.
Specific Aim 1 b: Correlate the amount of each melanin sUbtype in hair to the amount of
codeine incorporated into the hair through linear regression analysis.
2. Hvpothesis: Amphetamine will show a hair color bias while its non-basic
analog N -AcAp will not.
Specific Aim 2: Determine the concentrations of amphetamine and N-AcAp in black and
white rat hair (from the same animal) after systemic administration of the drugs.
3. Hypothesis: Drugs that demonstrate a hair color bias will bind to DHICA
melanin with the same affinity, but greater capacity than to DHI-melanin, and with lower
affinities and capacities for 2-CysDOPA-melanin and 5-CysDOPA-melanin. Analogs of
these drugs that do not demonstrate a hair color bias will not bind to any type of melanin.
Specific Aim 3: Determine the in vitro binding affinities and capacities of cocaine, BE,
amphetamine, and N-AcAp for DHICA-melanin, DHI-melanin, mixed DHII2-CysDOPA
melanin, mixed DHII5-CysDOPA-melanin, and pure 5-CysDOPA-melanin.
4. Hypothesis: Drugs that incorporate into hair to greater extents than their net
neutral congeners will be taken up faster, be effluxed slower, and have higher equilibrium
uptake concentrations than their congeners-in keratinocytes, PM, and NPM. In
addition, basic drugs will be transported at the same rate into PM and NPM, but will have
higher equilibrium concentrations in PM than their nonbasic analogs. Finally, plasma
protein binding will not completely account for the drug to metabolite or congener ratio
differences seen in plasma and hair. That is, hair cell selectivity (as opposed to free drug
concentration in plasma) is suspected as the major factor in determining how much of a
drug gets into hair cells.
Specific Aim 4a: Profile the influx and efflux time courses of cocaine, BE, amphetamine
and N-AcAp in cultured keratinocytes, PM, and NPM, and relate this data to in vivo data
for drug incorporation into hair.
Specific Aim 4b: Determine the extent of plasma protein binding of cocaine, BE,
amphetamine, and N-AcAp to assess the relative amounts of free cocaine vs. free BE in
plasma (after cocaine administration), and free amphetamine vs. free N-AcAp (after equi-
dosing of either drug).
CHAPTER 2
RELATIONSHIP OF MELANIN DEGRADATION PRODUCTS TO ACTUAL
MELANIN CONTENT: APPLICATION TO HUMAN HAIRa
Numerous studies have confinned that melanin pigments play an important role in
the incorporation of drugs into hair (3, 40,63-65,69-71, 127, 128). This may lead to a
hair color bias in the interpretation of hair testing results. The purpose of this
investigation was to detennine the yield of melanin subtype-specific chemical markers
produced from chemical degradations of pure melanin subtypes, then apply this
information to profile the melanin content and character of a range of human hair types.
Melanins are highly heterogeneous pigment polymers that give hair and skin their
color. These pigments are typically divided into two categories: the black eumelanins
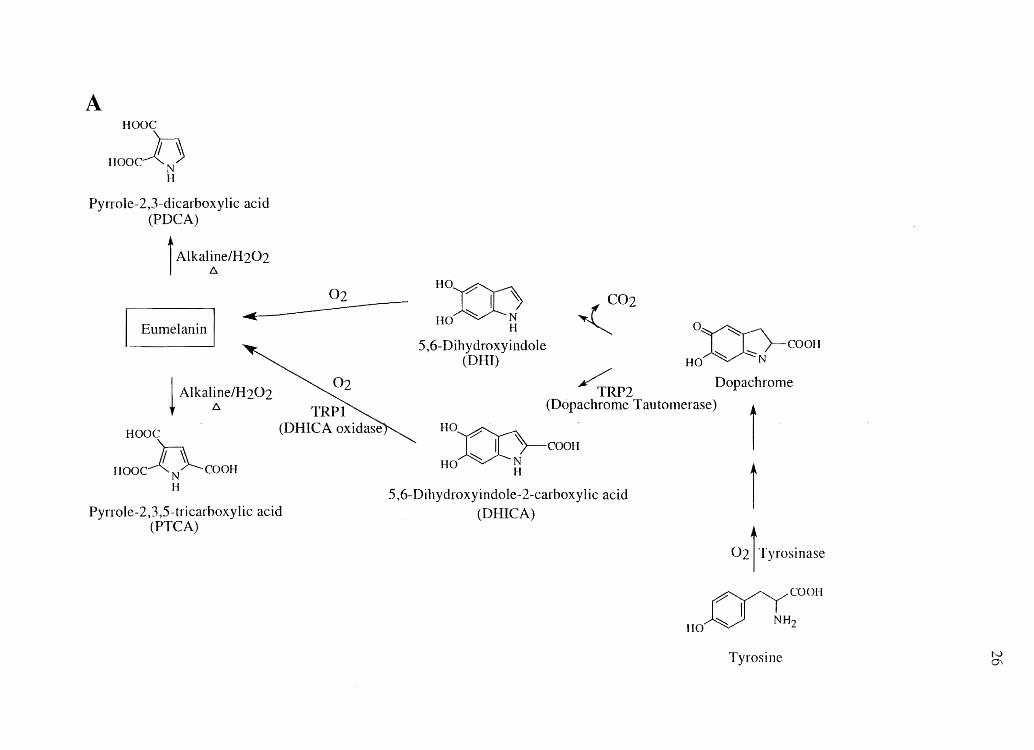
and the reddish-brown pheomelanins. Eumelanin is composed of the tyrosine-derived
indole units DHI and DHICA (129, 130) (Figure 2.1), Pheomelanin is composed of
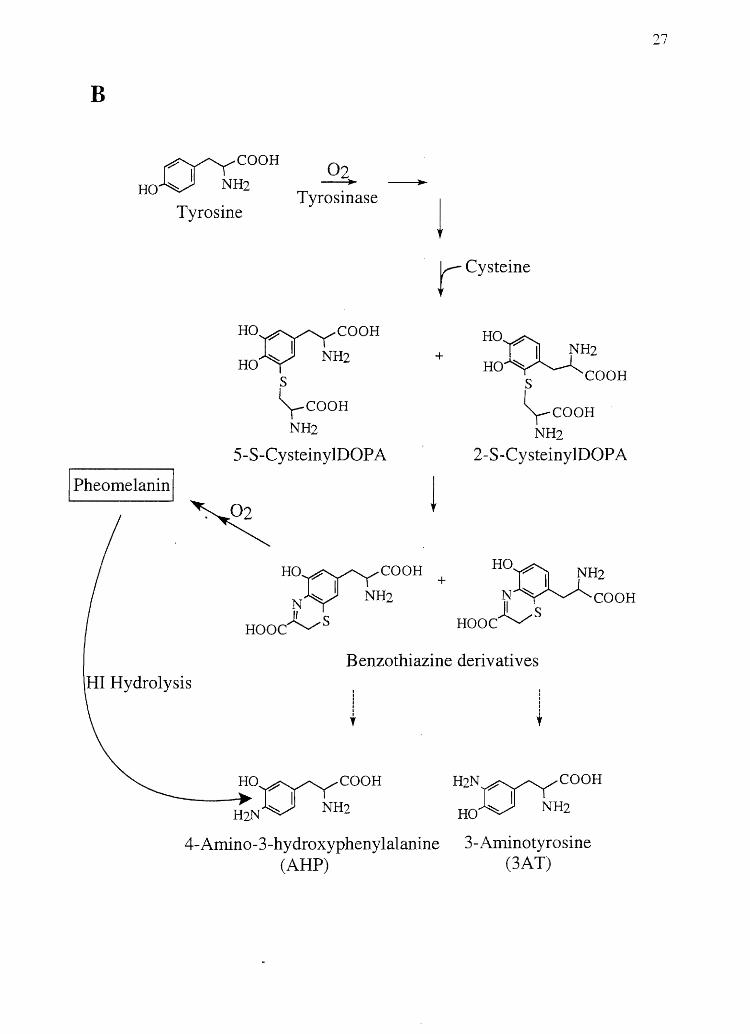
tyrosine and cysteine-derived units, generally thought to be constructed into
benzothiazine monomers that make up the pheomelanin polymer (96). 5-CysDOPA and
2-CysDOPA are thought to be the major pheomelanin building blocks (132) (Figure 2.1).
It must be kept in mind, however, that in vivo, melanins are generally not homopolymers
a Relationship of Melanin Degradation Products to Actual Melanin Content: Application to
Human Hair" by Chad R. et al., from Analytical Biochemistry, Volume 290, 116·125, copyright © 2001 by Academic reprinted, with modification, by permission of the publisher.
25
Figure 2.1 Biological synthesis and chemical degradation pathways of A) eumelanin and
B) pheomelanin. (Adapted from Ozeki et al. (131) and Kolb et al. (132»
A Hooe
Hooch N H
Pyrrole-2,3-dicarboxylic acid (PDCA)
i Alkal~elH202 ..
Eumelanin
02
I Alkaline/H202 ~ tJ. TRP]
Hooe (DHICA oxidase
'In Hooe-l(N~eooH H
Pyrrole-2,3,5-tricarboxylic acid (PTCA)
HO~ ~j
IIO H
5,6-Dihydroxyindole (OHI)
, C02
OX):)-eOOH ~ ~
HO N
~RP2 Dopachrome (Dopachrome Tautomerase)
r , 71~ eOOH
H0:(Jc}- . ~ N
HO H
5,6-Dihydroxyindole-2-carboxylic acid (Ol-I1CA)
02 'TyroSinase
~eOOI'1
HO~ NH2
Tyrosine tv Q\
B
~eOOH 02 HOV NH2 --+-
Tyrosine Tyrosinase
Ho~eOOH
HOY NH2
s \-COOH
NH2
5-S-CysteinylDOP A
rCysteine
+ HO~ ? I NH2
HO ~ eOOH S
\-COOH NH2
2-S-Cysteiny lDOP A
I Pheomelanin I
~
HI Hydrolysis
Ho~eOOH + HO~ ~H2 N ~ I NH2 N~eOOH
~s Hooe~S Hooe
Benzothiazine derivatives
I I I I I I , I
I I I I I ,
______ H~o~eOOH
H2NV NH2
H2N~eOOH
HOV NH2
4-Amino-3-hydroxyphenylalanine (ARP)
3-Aminotyrosine (3AT)
27
of a single building block or even made solely from eumelanin or pheomelanin
monomers-rather they are mostly ill-defined heteropolymers made up of both
eumelanin and pheomelanin building blocks (96).
28
Melanins are biologically synthesized through what is thought to be a free radical
mediated process (133-135) in the melanosomes of melanocytes with the aid of the
enzyme tyrosinase. In the cell, melanins are covalently linked to proteins to produce
structures referred to as melanoproteins. Once melanoproteins are made they are
transferred to keratinocytes (96, 136) where they are effectively displayed on the body's
surface. While the biological role of melanin is not completely understood, it is known
that eumelanin in dark skinned individuals serves in. a photo-protective manner against
damaging ultraviolet light. On the other hand, large amounts of pheomelanin in light
skinned/freckled individuals appears to make them more susceptible to skin cancer (137-
139). The natural role of melanin in hair, however, remains unknown.
It is not a "natural" role, but recent studies have shown that melanin plays a
crucial role in binding many drugs that are incorporated into hair. Interestingly, a number
of drugs with a basic nitrogen moiety such as cocaine (63), methadone, (140), codeine
(127), phencyclidine (69), haloperidol (70), ofloxacin (71), and nicotine (40) have all
been shown to incorporate in greater amounts into hair of darker vs. lighter pigmentation.
At the same time the nonbasic, but nitrogen-containing drug phenobarbital has been
shown to have no preferential incorporation into hair of darker pigmentation over hair of
lighter pigmentation (65). The theme for preferential incorporation into hair of darker
pigmentation appears to be a basic nitrogen moiety. This is not surprising when one
considers both the relatively high content of negatively charged carboxyl groups on
29
melanin (96, 129) and the fact that substances with cationic properties such as amines and
metals are bound to melanin through ionic interactions (58, 83).
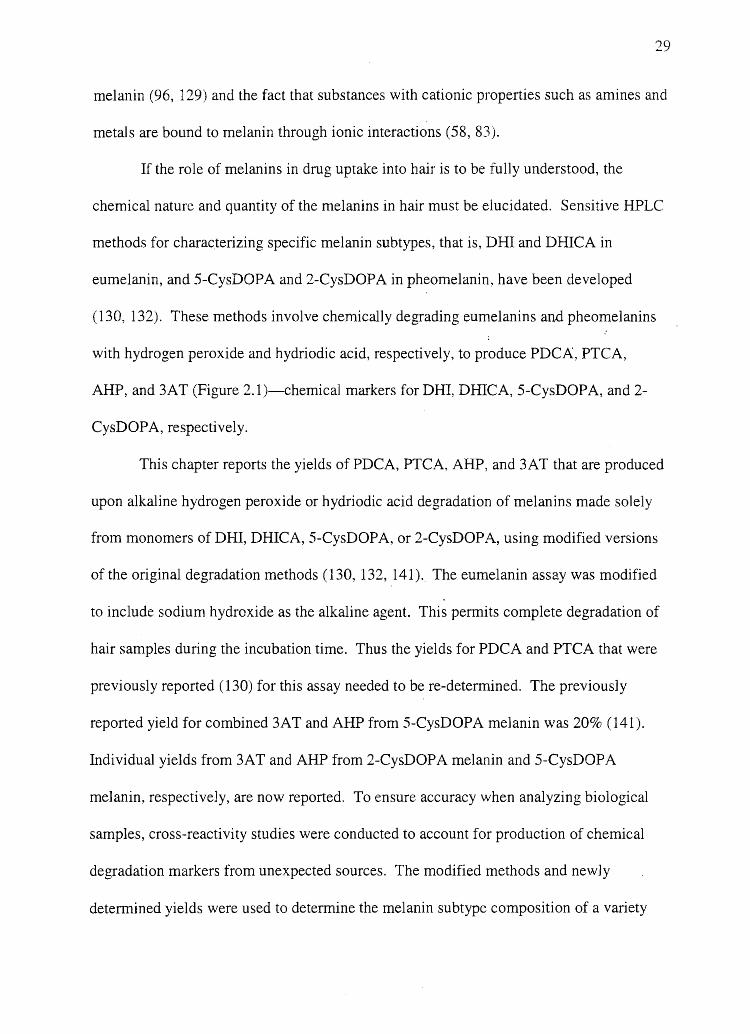
If the role of melanins in drug uptake into hair is to be fully understood, the
chemical nature and quantity of the melanins in hair must be elucidated. Sensitive HPLC
methods for characterizing specific melanin subtypes, that is, DHI and DHICA in
eumelanin, and 5-CysDOPA and 2-CysDOPA in pheomelanin, have been developed
(130, 132). These methods involve chemically degrading eumelanins and pheomelanins
with hydrogen peroxide and hydriodic acid, respectively, to produce PDCA, PTCA,
AHP, and 3AT (Figure 2.1)-chemical markers for DHI, DHICA, 5-CysDOPA, and 2-
CysDOPA, respectively.
This chapter reports the yields of PDCA, PTCA, AHP, and 3AT that are produced
upon alkaline hydrogen peroxide or hydriodic acid degradation of melanins made solely
from monomers of DHI, DHICA, 5-CysDOPA, or 2-CysDOPA, using modified versions
of the original degradation methods (130, 132, 141 )" The eumelanin assay was modified
to include sodium hydroxide as the alkaline agent. This permits complete degradation of
hair samples during the incubation time. Thus the yields for PDCA and PTCA that were
previously reported (130) for this assay needed to be re-determined. The previously
reported yield for combined 3AT and AHP from 5-CysDOPA melanin was 20% (141).
Individual yields from 3AT and AHP from 2-CysDOPA melanin and 5-CysDOPA
melanin, respectively, are now reported. To ensure accuracy when analyzing biological
samples, cross-reactivity studies were conducted to account for production of chemical
degradation markers from unexpected sources. The modified methods and newly
determined yields were used to determine the melanin SUbtype composition of a variety
of human hair samples. Finally, the melanin content was correlated to codeine
incorporation to assess any possible relationship between the two variables.
Materials and Methods
Materials
30
Tyrosinase, 3AT, hydriodic acid, and hydrogen peroxide were purchased from
Sigma Chemical Co. (St. Louis, MO). Hypophosphorous acid (H3P02) was purchased
from Aldrich Chemical Co. (Milwaukee, WI). DHI and DHICA were made according to
the method ofWakamatsu and Ito (142). 5-CysDOPA and 2-CysDOPA were made
according to the method of Ito et aI. (143). PDCA and PTCA were made according to
the method of Ito and Wakamatsu (130). AHP was isolated from hydriodic acid
hydrolyzed 5-CysDOPA melanin by the solid phase extraction method described below
for extraction of AHP and 3AT from hydriodic acid hydrolysates, but using 2 M HCI
instead of 0.3 M KCl to elute AHP from the columns. Eumelanins were made according
to the method of Ito et aI. (144) and pheomelanins were made according to the method of
Ito and Fujita (141). The structure and purity of all synthetic compounds (except
melanins) were confirmed by NMR and/or mass spectrometry (see Appendix). IH NMR
spectra were obtained on a Bruker AF-200 MHz spectrometer. Mass spectra for synthetic
compounds were obtained with a HP 1100 series LCIMSD mass spectrometer in FIA
mode equipped with an electro spray ion source. All other chemicals used were of the
highest purity available.
31
Melanin Analysis
Melanins were prepared for analysis by homogenization in water at a
concentration of 2 mg/m1 using a glass homogenizer operated by a drill press. Hair was
cut into small « 2 mm) pieces prior to being weighed out. Typically 0.2 mg melanin and
S mg hair were used for analysis.
Eumelanin analysis. Samples were chemically degraded then analyzed for PDCA
and PTCA via the method of Ito and Wakamatsu (130) with modifications: To a given
sample (-S mg) in 100 ~l water in a screw-capped tube was added 820 ~l O.S M NaOH,
80 III 3 % H20 2, and 40 nmol phthalic acid as an internal standard. Samples were then
heated in a boiling water bath for 20 min. After cooling, 20 ~I 10% Na2S03 and 2S0 ~1 6
M HCI were added. Samples were then extracted twice with 7 m1 ethyl acetate. The
ethyl acetate was dried under a stream of air at 45°C and the residue redissolved in 1 ml
starting HPLC mobile phase. HPLC analysis was carried out with a Waters 600E
multisolvent delivery system equipped with a Waters 600 controller and Waters 717plus
autosampler. One hundred microliter samples were injected onto a Phenomenex
(Torrance, CA) Luna S Ilm C 18 250 x 4.6 mm column at a temperature of 55°C.
Analytes were detected with a Varian 90S0 variable wavelength UV detector set at 280
nm. HPLC mobile phase consisted of 0.01 M potassium phosphate buffer, pH 2.1, and
methanol at a flow rate of 0.8 ml/min under the following gradient: 98%/2%
Aqueous/organic ramped evenly from time 0 to 14 min to 40%/60% aqueous/organic,
held at 40%/60% aqueous/organic for 6 min followed by ramping back to 98%/2%
aqueous/organic over S min. Amounts of PDCA and PTCA were quantitated using
PDCA:phthalic acid and PTCA:phthalic acid peak height ratios compared to a standard
curve made from pure PDCA and PTCA standards subjected to alkaline hydrogen
peroxide degradation.
Pheomelanin analysis. Samples were analyzed for pheomelanin content
according to the method of Kolb et al. (132) with modifications. To a 100 ~l suspension
of melanin (0.2 mg) or hair (5 mg) in water placed in a screw-capped tube was added 500
J.ll 57% HI, 20 J.lI 50% H3P02, and 20 nmol L-a-methyIDOPA (L-a-MD) as an internal
standard. Samples were capped tightly and hydrolyzed at 130°C in an oil bath for 16
hrs. After cooling, samples were evaporated under reduced pressure in a Savant
(Holbrook, NY) Speed-Vac SPD121P concentrator at 55°C. Users of this device should
note that HI can corrode the top of the lower magnet assembly and thus eventually
compromise the vacuum established in the concentrator. Dried residue was redissolved
in 1 rnl 0.05 M lithium phosphate buffer, pH 4.0, but not adjusted to pH 4.0. AHP and
3AT were extracted with aromatic sulfonic acid (SCX) solid phase extraction (SPE)
columns (International S0rbent Technology, Mid Glamorgan, U.K.) containing 100 mg
sorbent and a 1 ml reservoir volume. SPE columns were washed with 1 ml methanol
(2x), and then 1 mllithium phosphate buffer (3x) prior to sample application. Columns
were washed with 1 ml water (2x) then eluted with 2 ml 0.3 M KCl, pH 8.5. Twenty
microliters of eluant were injected into the same HPLC system used for eumelanin
analysis, but equipped with a Waters 464 pulsed electrochemical detector equipped with
a glassy carbon electrode set at +400 mV relative to a Ag/AgCl reference electrode.
Mobile phase consisted of 99% 0.01 M potassium phosphate buffer, pH 5.7 containing 1
rnM sodium octanesulfonate, and 0.1 mM disodium EDT A/I % methanol at a flow rate
of 0.9 ml/min. Amounts of AHP and 3AT were quantitated using AHP:L-a-MD and
33
3AT:L-a-MD peak height ratios compared to a standard curve made from pure AHP and
3AT standards subjected to hydriodic acid hydrolysis.
Statistical Analysis
Comparisons between groups were made with a two-tailed Student's t-test
assuming homogeneity of variances. Results significant at p :::; 0.05 are reported.
Results
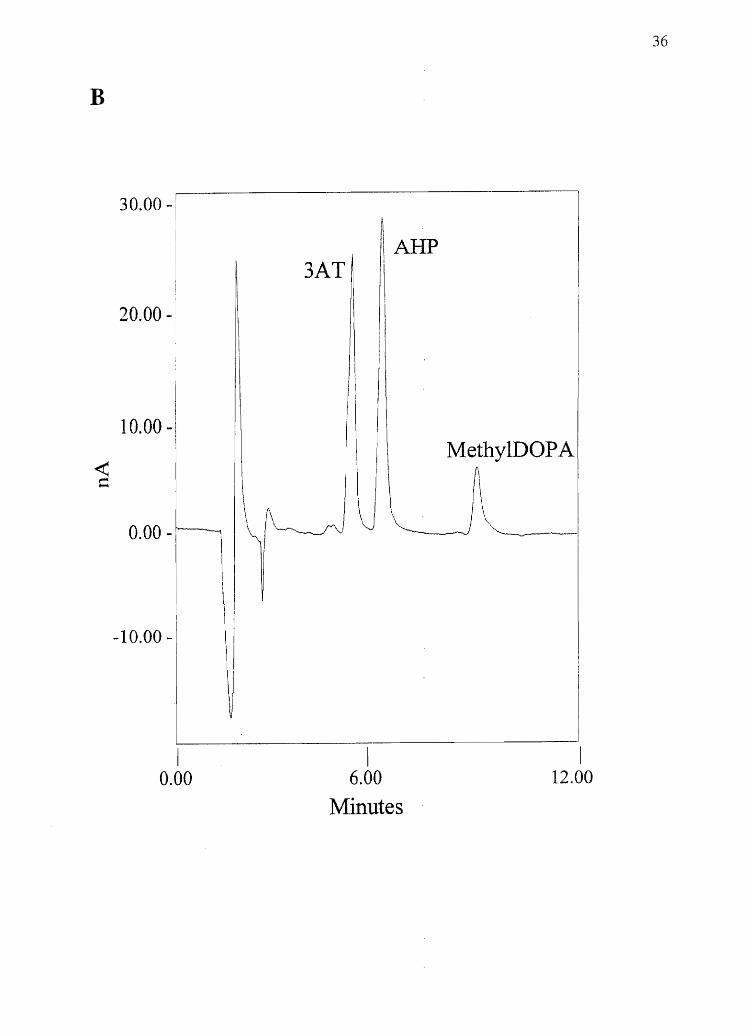
Degradation product yields
Representative chromatograms from melanin samples obtained from alkaline
hydrogen peroxide degradation and hydriodic acid hydrolysis are shown in Figures 2.2A
and B. The small PDCA peak height is explained by the relatively low yield of PDCA.
Degradation product yields from their respective pure melanins as well as overall assay
precision can be seen in Table 2.1. Degradation product yields are based on a nlass /
mass ratio of the amount of degradation product detected / amount melanin degraded. As
seen from these data, yields of melanin degradation products are quite consistent. To
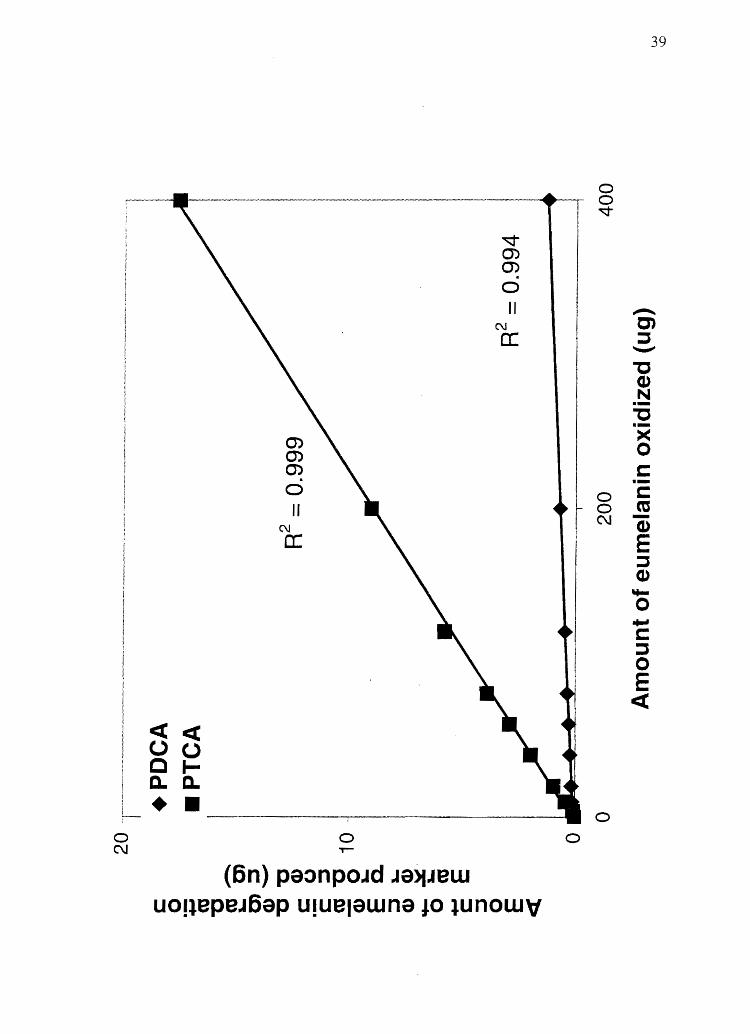
demonstrate assay linearity with different sample sizes, varied amounts of both hair and
melanin were subjected to both eumelanin and pheomelanin analysis. As shown in
Figure 2.3 and Table 2.2, increasing amounts of melanin or hair produce linearly
increasing amounts of melanin degradation markers. Figure 2.3 demonstrates that as
increasing amounts of eumelanin are oxidized, linearly increasing amounts of PDCA and
PTCA are produced. Table 2.2 shows that in general, linear relationships are found for
plots of the amount of degradation marker produced vs. the amount of pure melanin
subtype degraded, and for plots of the amount of melanin subtype found in a hair sample
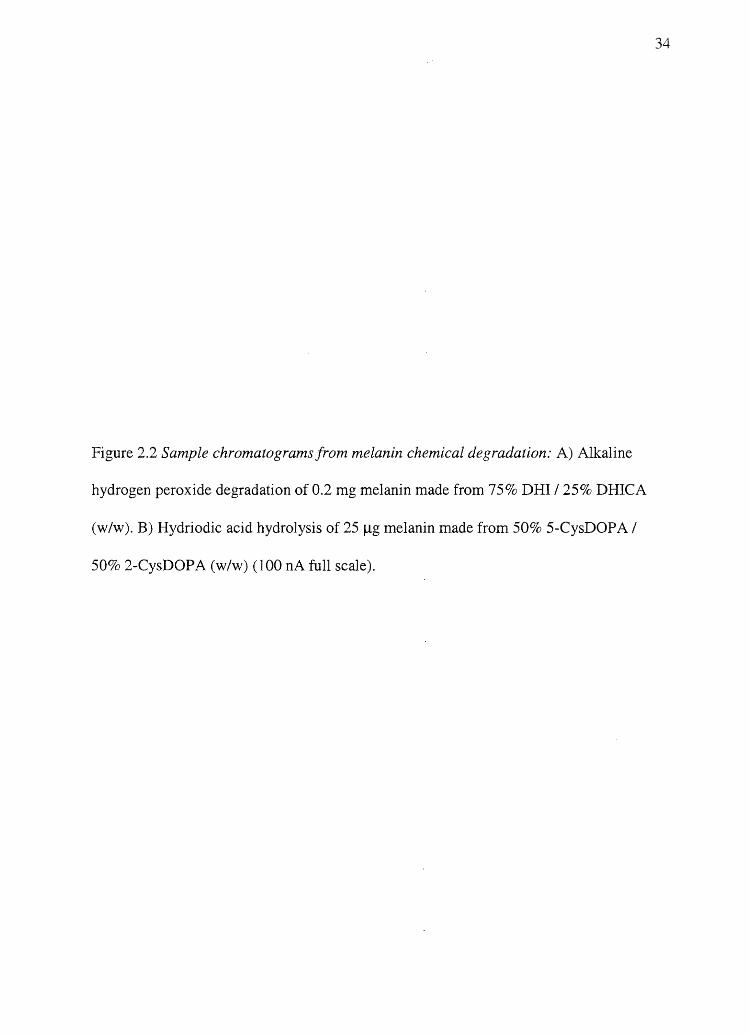
Figure 2.2 Sample chromatogramsfrom melanin chemical degradation: A) Alkaline
hydrogen peroxide degradation of 0.2 mg melanin made from 750/0 DRI/ 25% DHICA
(w/w). B) Hydriodic acid hydrolysis of 25 J,.lg melanin made from 50% 5-CysDOPA /
50% 2-CysDOPA (w/w) (100 nA full scale).
34
35
A
0.10 - PTCA
Phthalic Acid
I I I 0.00 15.00 30.00
Minutes
B
30.00 -
20.00 -
10.00 - I
~ \ I I \ Me~hYIDOP A
O,OOJ-'II~~~
-10.00 - \ I
II
I 0.00
V
I 6.00
Minutes
I 12.00
36
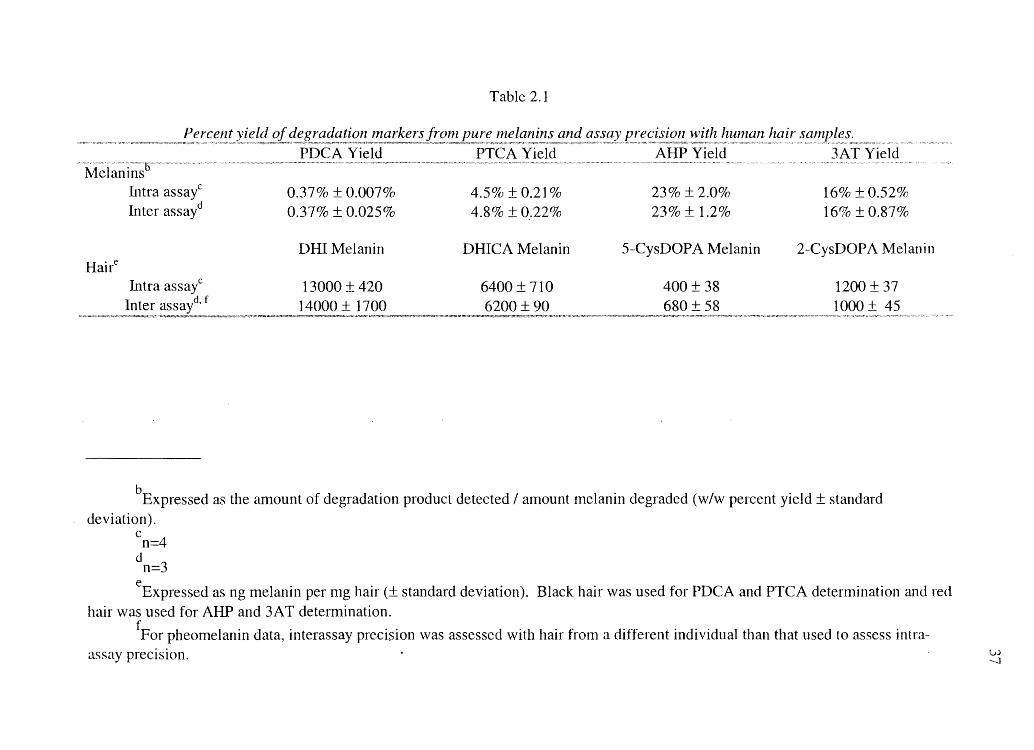
Table 2.1
Percent Ine lanins and with hUl1lan hair
PDCA Yield PTCA Yield AHP Yield 3AT Yield M,','w, "'~""'''''''''''''~'l)'''''''W~'''''_N' '."
Melanins Intra assayC 0.37% ± 0.0070/0 4.5% ± 0.2]% 23% ±2.0% 16% ± 0.52% Inter assayd 0.37% ± 0.025% 4.8% ±0.22% 23% ± 1.2% 16% ±0.87%
DHI Melanin DHICA Melanin 5-CysDOP A Melanin 2-CysDOP A Melanin Haire
13000 ± 420 6400 ± 710 400 ± 38 1200 ± 37 Inter assavu
, f 14000 ± 1700 6200 ± 90 680 ± 58 1000 ± 45
bExpressed as the amount of degradation product detected / alTIOunt nlelanin degraded (w/w percent yield ± standard deviation).
c n=4
d
eExpressed as ng melanin per mg hair (± standard deviation). Black hair was used for PDCA and PTCA determination and hair was used for AHP and 3AT determination.
fFor pheomelanin data, interassay precision was assessed with hair from a different individual than that used to assess intraassay precision. vol
-J
38
Figure 2.3 Plot of the amount of eumelanin degradation marker produced vs. the amount
of eumelanin analyzed. This plot demonstrates the melanin assay linearity found when
increasing amounts of melanin or human hair are subjected to analysis. See Table 2.2 for
complete data set and statistical analysis.
o ".,_~.,,~. ________ ~_w ____ ~. ________ ., _______ ~____ 0
0 C\l
c::(c::( U(.) 01-c..c.. • •
0') 0') 0')
o II
C\J
a:
0 ,.....
~ 0) 0) . o II
C\J
a:
(6n) pa~npoJd Ja>lJBW UO!IBpBJ6ap U!UBlaWna 10 IUnOWV
~
0 0 C\J
0
0
39
..--.... C') ::J ~
-c G) N ---C -->< 0 c: .-c: m -G)
E ::J G)
"I-0 .. c: ::J 0 E <t
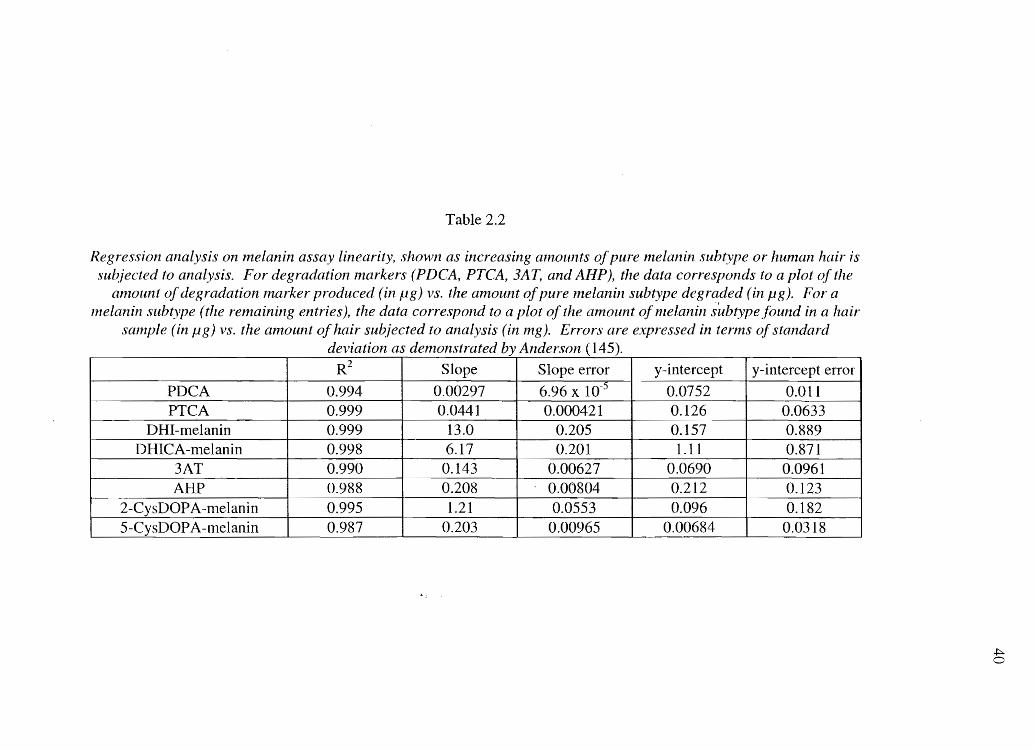
Table 2.2
Regression analysis on melanin assay linearity, shown as increasing all10unts of pure melanin subtype or human hair is subjected to analysis. For degradation markers (PDCA, PTCA, 3A1: and AIIP), the data corresponds to a plot of the
anlount of degradation lnarker produced (in fig) vs. the alnount of pure lnelanin subtype degraded (in pg). For a melanin subtype (the remaining entries), the data correspond to a plot of the amount of melanin sllbtype found in a
sample (in fig) vs. the anlount of hair subjected to analysis (in mg). Errors are expressed in terms of standard deviation as denlonstrated by Anderson (145).
R2 Slope Slope error y-intercept y-intercept error
PDCA 0.994 0.00297 6.96 x 10⁻⁵ 0.0752 0.011 PTCA 0.999 0.0441 0.000421 0.126 0.0633
DHI -melanin 0.999 13.0 0.205 0.157 0.889 DHICA-melanin 0.998 6.17 0.201 1.11 0.871
3AT 0.990 0.143 0.00627 0.0690 0.0961 AHP 0.988 0.208 0.00804 0.212 0.123
2-CysDOPA-melanin 0.995 1.21 0.0553 0.096 0.182 5-CysDOPA-melanin 0.987 0.203 0.00965 0.00684 0.0318
-- ---
41
VS. the amount of hair subjected to analysis. The limits of quantitation and (limits of
detection) were as follows: DHI-melanin 10 Jlg (10 J.lg); DHICA-melanin 1 Jlg (0.50 Jlg);
2-CysDOPA-melanin 240 ng (120 ng); and 5-CysDOPA-melanin 170 ng (85 ng).
(Occasionally, larger injection volumes were used to increase signal to noise up past
limits of quantitation.)
Degradation Product Cross-reactivity
To assess melanin degradation product cross-reactivity, that is, production of
degradation markers from melanins other than the primary producer of a specific
degradation marker, eumelanins were subjected to pheomelanin analysis and vice versa.
Results (shown in Table 2.3) demonstrate that PTCA is produced from DHI melanin and
that PDCA and PTCA are produced from 5-CysDOPA and 2-CysDOPA pheomelanins.
However, based on their precision (Table 2.3), cross-reactivity results are consistent and
thus can be accounted for when calculating melanin composition.
Analysis of Heteropolymeric Melanins
To test the reliability of the chemical degradation assays in analyzing
heteropolymeric melanins, a series of mixed composition eumelanins, mixed composition
pheomelanins, and mixed eu-/pheomelanins were made and subjected to analysis. As an
outside verification that the mixed eumelanins were of expected monomer composition,
samples of each mixed eumelanin polymer were subjected to elemental analysis by
cOlnbustion (after being dehydrated overnight at room temperature under a vacuum),
Galbraith Laboratories, Inc., Knoxville, TN. As the number of DHI monomer units in the
melanin is increased, one expects the percent carbon and percent nitrogen content of
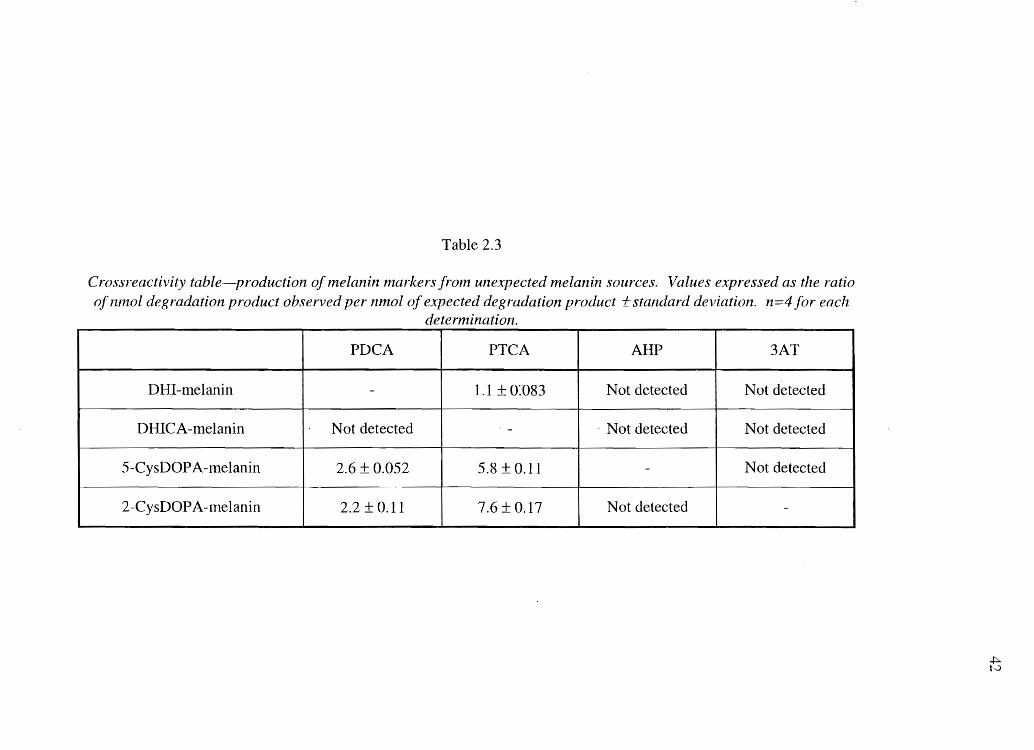
Table 2.3
Crossreactivity table-production of fnelanin nlarkers froln unexpected melanin sources. Values expressed as the ratio of nmol degradation product observed per nmol of expected degradation product 1:: standard deviation. n=4 for each
dete nnination.
PDCA PTCA AIIP 3AT
DHI-melanin - 1.1 ± 0:'083 Not detected Not detected
DHICA-melanin Not detected - . Not detected Not detected
5-CysDOPA-melanin 2.6 ± 0.052 5.8 ±O.ll - Not detected
2-CysDOPA-lnelanin 2.2 ± 0.11 7.6 ± 0.17 Not detected
+:.. t...)
43
that melanin to increase. Shifts in elemental analysis results agree with the monomer
composition results (as determined by chemical degradation analysis) as eumelanin
monomer composition is shifted from DHI to DHICA: 75% DHICA /25% DHI melanin
was 53.43% C and 7.72% N; 50% DHICA / 500/0 DEI melanin was 54.10% C and 7.740/0
N; 250/0 DHICA I 750/0 DHI melanin was 56.090/0 C and 7.83% N. Because the
pheomelanin monomers are structural isomers of each other, one cannot tell via changes
in elemental composition what the changes in pheomelanin polymer composition are.
However, because the monomers are structural isomers, their relative incorporation into
the polymer is expected to be approximately equal. Thus, due to lack of an available
second verification procedure, an outside verification of pheomelanin subtype
composition was not carried out. More eumelanin and less pheomelanin were found in
the mixed eu-/pheomelanin polymer than was expected from the starting monomer
composition. This was verified by elemental analysis results, which confirm that the
sulfur content of the mixed eu-/pheomelanin heteropolymer mixture is less than 3.90/0.
The theoretical dehydrated value is 5.4%. The presence of more eumelanin and less
pheomelanin in this polymer mixture than was expected from starting monomer
composition is thought to be due to the fact that pheomelanin is slightly soluble in the
condi60ns under which the polymer was isolated once it had been formed. Overall, the
fact that chemical degradation results agree with the actual synthetic melanin
compositions (as verified by elemental analysis) (see Figure 2.4 for chemical degradation
assay results) indicates that the assays can reliably assess the composition of
heteropolymeric melanins. Figure 2.4A demonstrates that when eumelanins are
synthesized from different monomer compositions, the alkaline hydrogen peroxide
44
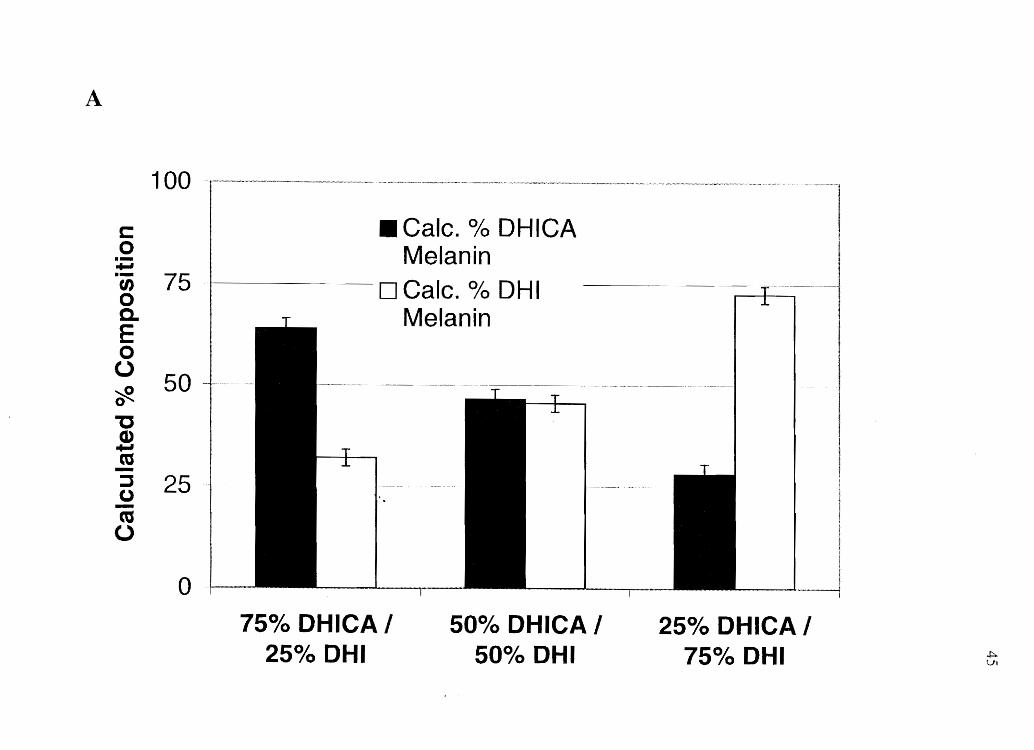
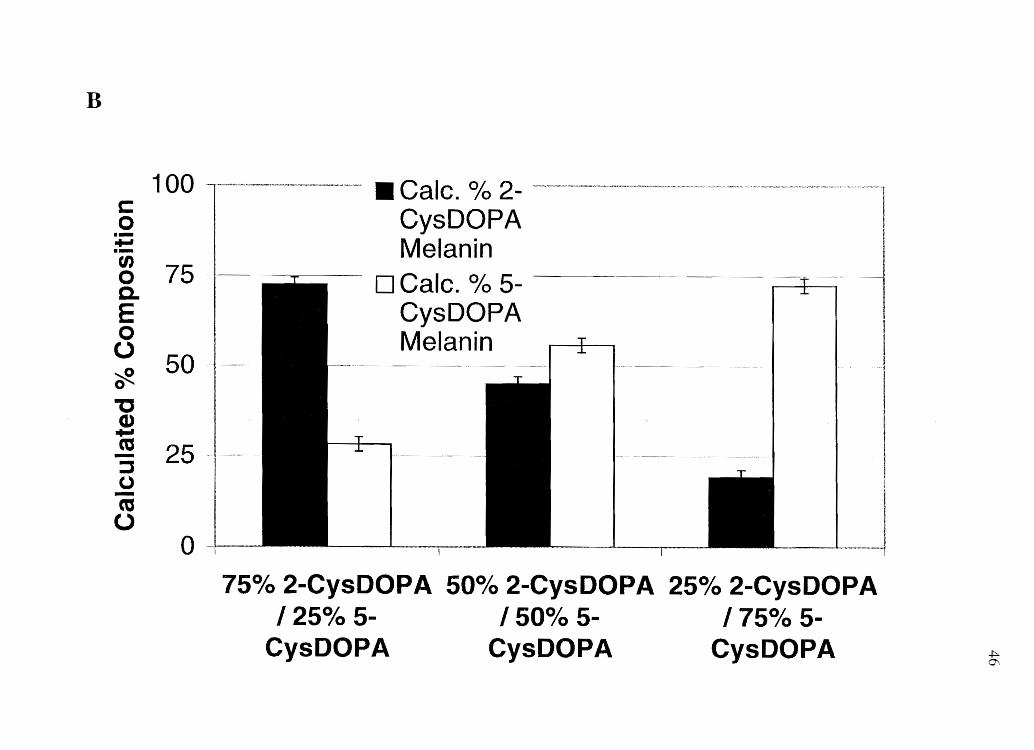
Figure 2.4 Analysis of- A) Mixed eumelanin series, B) Mixed pheomelanin series, and C)
Melanin made from 25% (w/w) of all four melanin subtypes. Results agree with
elemental analyses and are expressed as calculated percent composition based on the
mass of degradation product found, divided by the mass/mass % yield of that degradation
product (expressed as a fraction) from a melanin made solely from the monomer that
produces that degradation product, divided by the total mass of melanin degraded, and
multiplying by 100 to obtain a percent value. n=4 for each mixed melanin. Error bars
indicate standard deviation.
A
c: 0 --+II --f/) 0 c. E 0 0 ~ 0
-c G) +II cu -::J (.) -cu 0
100
II Calc. % DHICA Melanin
75 D Calc. % DHI T Melanin
50
25
o -+----1 -
7S% DHICA I 2So/0 DHI
SOO/o DHICA I So% DHI
2So/0 DHICA I 7So/0 DHI ..J:::..
Vl
B
c: 0 --..... --tn 0 c. E 0 0 # 1J CD ..... co -:::J 0 -co 0
100
75 -
50
25
o -
II Calc. % 2-CysDOPA Melanin
- D Calc. % 5-
II CysDOPA Melanin
75% 2-CysDOPA 500/02-CysDOPA 250/02-CysDOPA I 250/0 5- I 50% 5- I 75% 5-
CysDOPA CysDOPA CysDOPA ..J:::.. 0',

c
100-T-~<~--~-'~"~-----=~-~~----'-----"---~--'-~~------__ ' __ "_'_'~"_n,._~
II Calc. % DHICA Melanin
75 0 Calc. % DHI Melanin
II Calc. % 2-CysDOPA Melanin
50 II Calc. 5-CysDOPA Melanin
25
o -11-----
48
oxidation assay will provide accurate information regarding the composition of the
heteropolymeric eumelanins. Likewise, Figure 2.4 B shows that when pheomelanins are
synthesized from different monomer compositions, the reductive HI hydrolysis assay will
provide accurate information regarding the composition of the heteropolymeric
pheomelanins. And finally, Figure 2.4C shows that even when mixed eu-/pheomelanin
copolymers are made, the eumelanin and pheomelanin assays can determine the relative
composition of each melanin subtype.
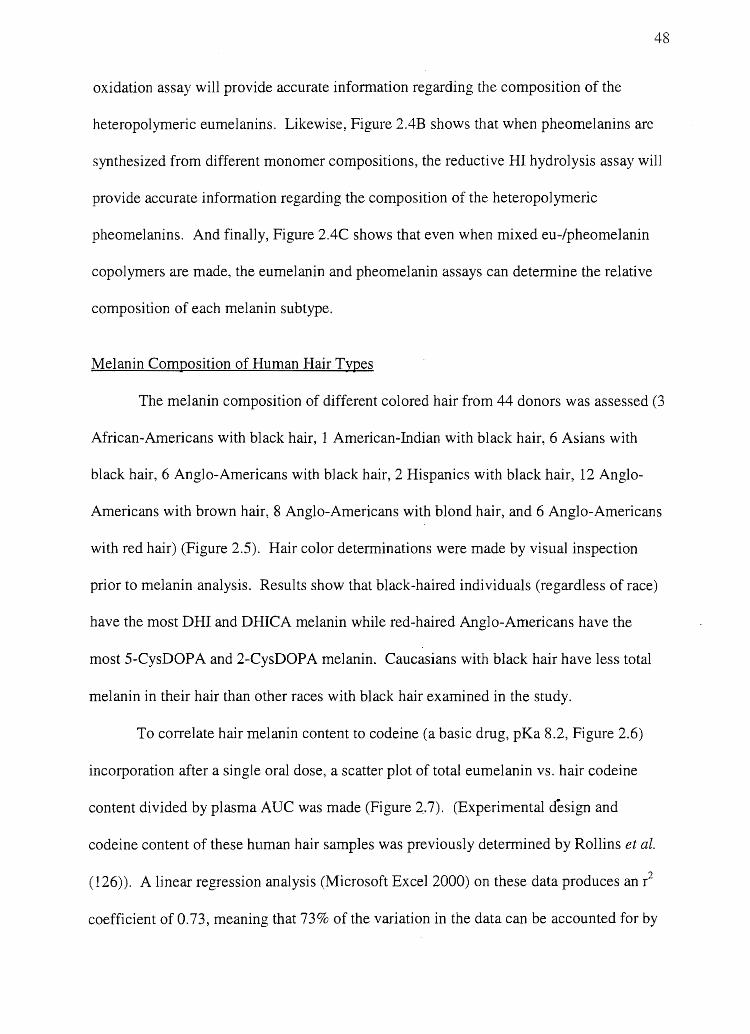
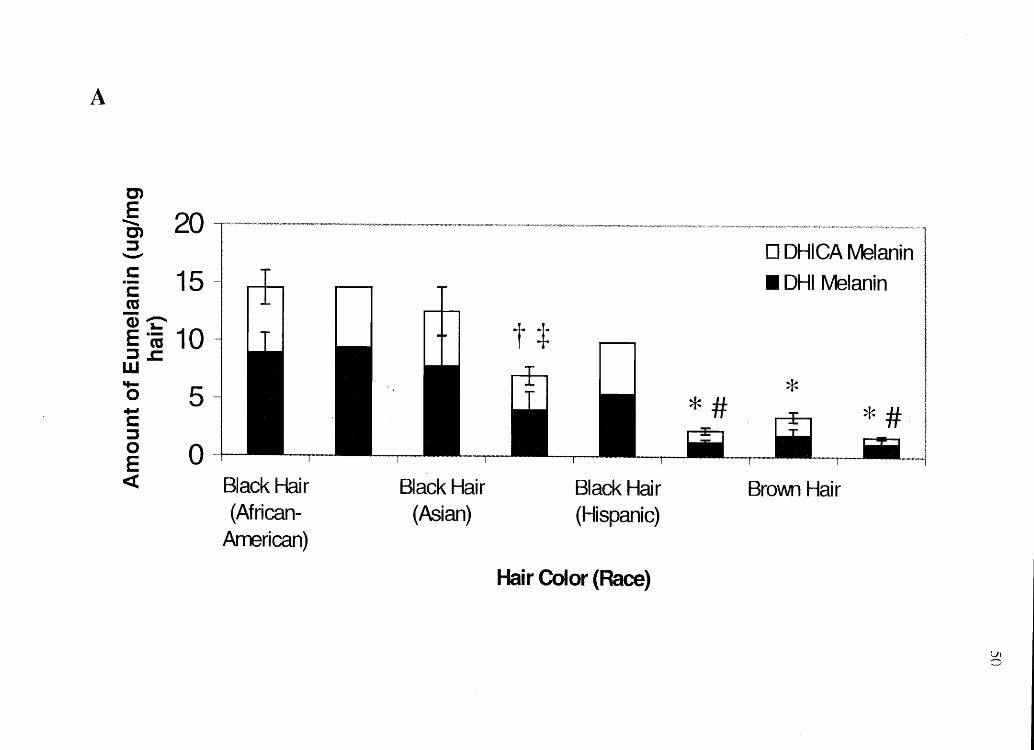
Melanin Composition of Human Hair Types
The melanin composition of different colored hair from 44 donors was assessed (3
African-Americans with black hair, 1 American-Indian with black hair, 6 Asians with
black hair, 6 Anglo-Americans with black hair, 2 Hispanics with black hair, 12 Anglo
Americans with brown hair, 8 Anglo-Americans with blond hair, and 6 Anglo-Americans
with red hair) (Figure 2.5). Hair color determinations were made by visual inspection
prior to melanin analysis. Results show that black-haired individuals (regardless of race)
have the most DHI and DHICA melanin while red-haired Anglo-Americans have the
most 5-CysDOPA and 2-CysDOPA melanin. Caucasians with black hair have less total
melanin in their hair than other races with black hair examined in the study.
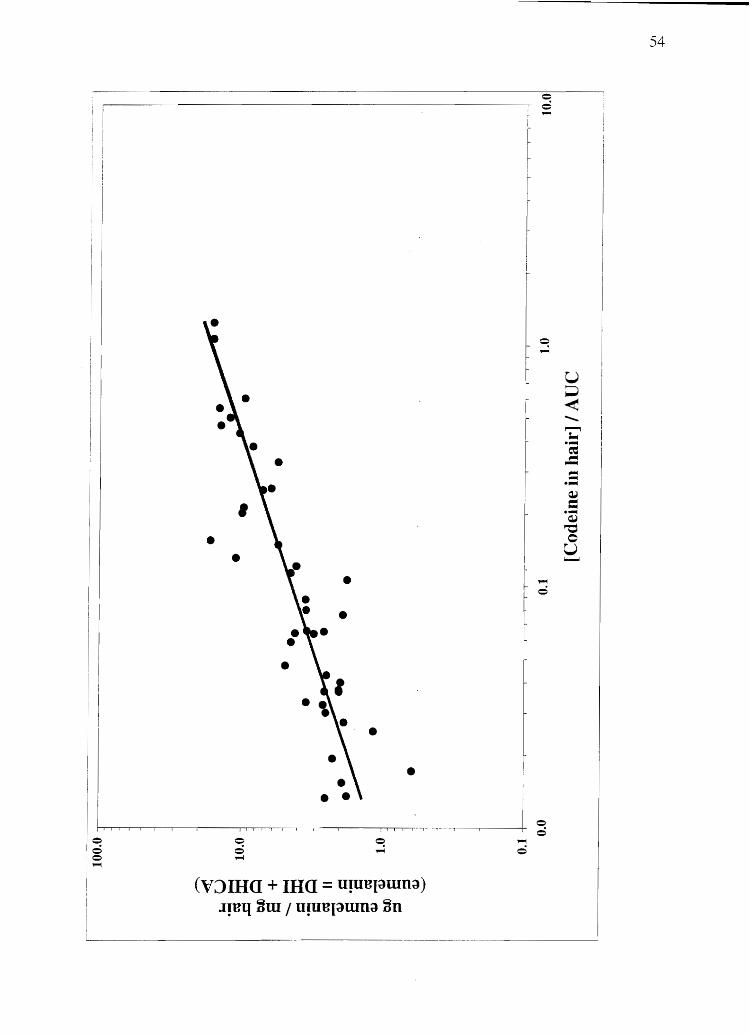
To correlate hair melanin content to codeine (a basic drug, pKa 8.2, Figure 2.6)
incorporation after a single oral dose, a scatter plot of total eumelanin vs. hair codeine
content divided by plasma AVC was made (Figure 2 .. 7). (Experimental design and
codeine content of these human hair samples was previously determined by Rollins et al.
(126». A linear regression analysis (Microsoft Excel 2000) on these data produces an r2
coefficient of 0.73, meaning that 73% of the variation in the data can be accounted for by
49
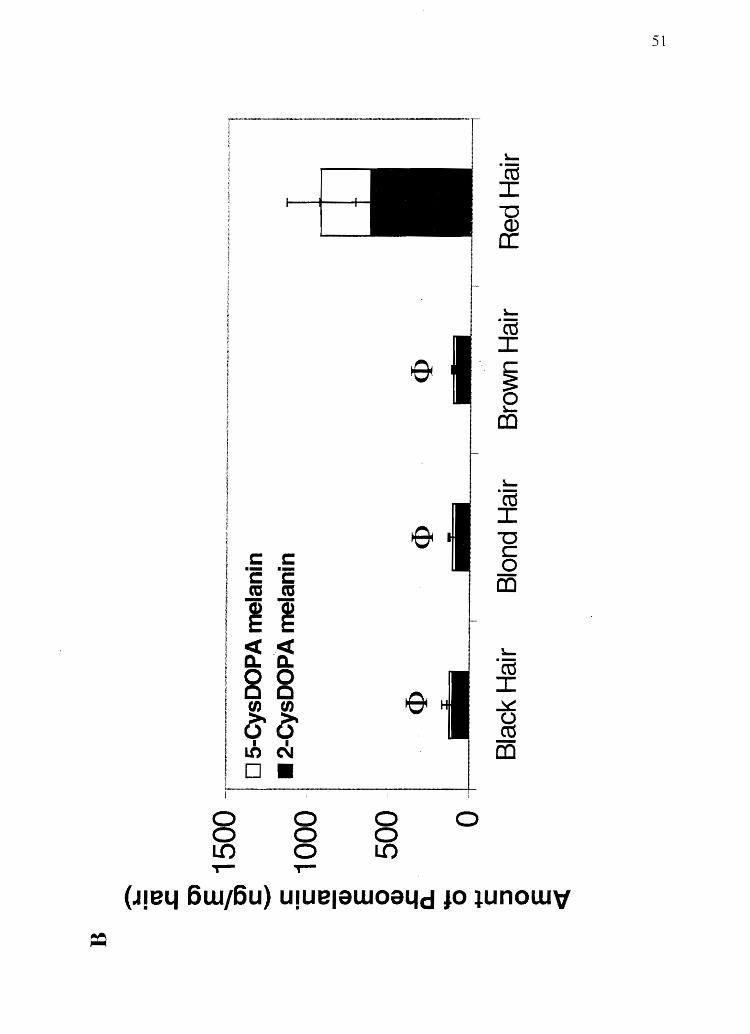
Figure 2.5 Analysis of human hair for melanin subtypes: A) Eumelanin. *Significantly
different from all black hair (p < 0.0001). tSignificantly different from African
American black hair (p < 0.01). tSignificantly different from Asian black hair (total and
DHI melanin only) (p < 0.05). #Significantly different from brown hair (p < 0.05). B)
Pheomelanin. <l>Significantly different from red hair' (total pheomelanin and both
subtypes) (p < 0.01). See results section for the number of saInples from each group.
Error bars indicate standard deviation.
A
Cl
~ 20 ::l
""-'"
-= 15 c: co - ...-... (J) J.. 0 E-cu 1 ::JJ: W 'fa-o ..... c: ::l o E «
5 --
o Black Hair (African
Arrerican)
Black Hair (Asian)
t:}:
Black Hair (Hispanic)
Hair Color (Race)
D DHICA Melanin
• DHI Melanin
*
Brovvn Hair
VI o
51
c: c: -- .-c: c: CO CO - -~ ~ <C.<C c..c.. 88 ~~
I I LnN o •
0 0 0 0 0 0 0 L.() 0 L.() or- ~
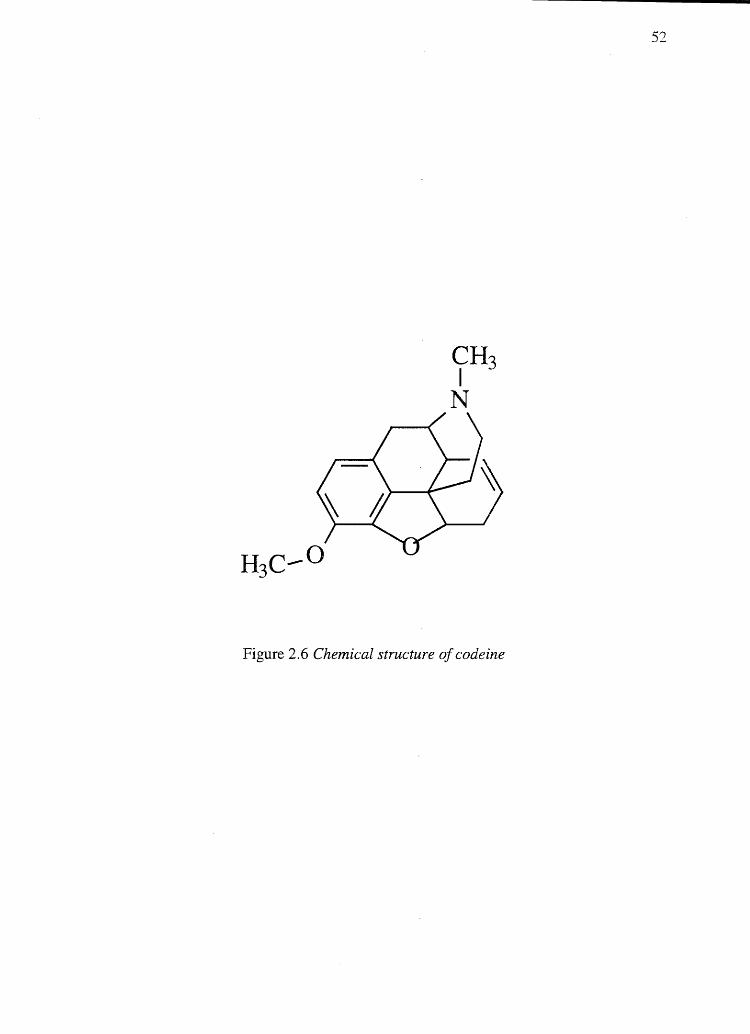
52
Figure 2.6 Chemical structure of codeine
53
Figure 2.7 The relationship between codeine incorporation into human hair and
eumelanin content. Codeine concentration is expressed in ng codeine / mg hair. AUC
stands for the area under the plasma concentration vs. time pharmacokinetic curve.
Dividing the codeine concentration in hair data by plasma AUC normalizes the codeine
content of the hair for the amount of drug present in the blood. This procedure makes use
of the assumption of a direct linear relationship between blood levels and hair
concentrations of codeine, as demonstrated in rats by Gygi et al. (146).
• •
(VJIRa + IRa = U!uBI;;Jwn;;J) .lIBQ ~w / U!uBI;;Jwn;;J ~n
=: -
-=>
54
u p < ........ ~ ;. .-= ,. -,. -.-Q.i
= --Q.i
'"CS 0
U I...-'
eunlelanin content alone. Pheomelanin content of human hair demonstrates no
relationship with codeine content.
Discussion
55
Several methods have been developed for quantitating the amount of total
melanin, eumelanin, and pheomelanin in biological samples (130,132,141,144). The
data presented in this study correlated amounts of melanin subtype-specific degradation
markers to actual amounts of melanin subtypes in a sample. This was done by
determining percent yield values for a given degradation marker from its parent melanin
(homopolymer) SUbtype and using these values on melanin from hair samples to back
calculate how much of each melanin subtype was in the hair. Possible difficulties
concerning the validity of the assays such as assay linearity, melanin SUbtype cross
reactivity, and assay reliability when assessing heteropolymeric melanins were addressed.
It must be kept in mind, however, that DRI and DRICA are the major precursors to
eumelanin, but eumelanin polymers do not necessarily consist solely of these monomers,
even when these are the only monomers used in the synthesis of the polymer. This is due
to the fact that hydrogen peroxide, produced in the vicinity of developing melanin
polymers during the monomer oxidation process, can partially alter the structure of the
forming polymer by oxidatively degrading some of the DRI and DRICA units into
carboxylic acid substituted pyrrole units (95, 96). Nevertheless, eumelanins consisting
mostly of DRICA units would be expected to have a greater carboxylic acid content than
eumelanins consisting mostly of DRI units. (This hypothesis has been confirmed by
Novellino et al. (95)). In addition, the procedure used to synthesize a melanin can affect
the carboxyl content of the resulting melanin (95) which, in turn, may affect yields of
PDCA and PTCA from the resulting polymers. Because of this concern, the melanins
used in this study were synthesized via a method that best models the in vivo situation.
That is, tyrosinase was used as the catalytic enzyme while the reaction was carried out
under oxygen in the absence of catalase.
56
Using the assays and degradation product yield information as described above, it
was determined that average black human hair contains approximately 99% eumelanin
(600/0 DRI and 40% DHICA-derived eumelanin) and 1 % pheomelanin (80% 2-CysDOPA
and 20% 5-CysDOPA-derived pheomelanin); brown and blond hair contain 95%
eumelanin and 5% pheomelanin; and red hair contains 670/0 eumelanin and 33%
pheomelanin (Figure 2.5). These data suggest that color determination for black, brown,
or blond hair depends more on melanin quantity than eu-/pheomelanin composition,
while red hair may arise through an alteration in the melanin synthesis pathway that leads
to a greater relative production of pheome1anin. This knowledge must be considered
when relating drug-eumelanin or drug-pheomelanin binding data to drug incorporation
into hair.
It has been found that yields of degradation markers are different for each sUbtype
of melanin, but that yields are highly reproducible (Table 2.1) and thus can be used to
assess the amount of melanin sUbtypes in a given sample. However, as shown in Table
2.3, some degradation markers are not always produced solely from their primary
melanin sUbtype source, e.g., PTCA is not produced solely from DRICA melanin.
Because of consistent yields, and the fact that DHICA-melanin is not cross-reactive, this
phenomenon can be accounted for in calculating amounts of melanin sUbtypes in a
sample. This phenomenon is disconcerting given the postulated structures (Figure 2.1)
57
for melanin sUbtype precursors, polymers of which have been shown to produce
unexpected degradation products. Studies by Napolitano et al. (147, 148) have shown
that DHI dimers linked at the 2- position can produce both PDCA and PTCA. It is quite
interesting to note the 1: 1 PDCA:PTCA molar ratio produced from DHI melanin in light
of the degradation pathway proposed by Napolitano et al. (147) whereby there is a 500/0
chance of producing either PDCA or PTCA from a 2-4 linked DIll dimer.
Production of PDCA and PTCA from both 5-CysDOPA and 2-CysDOPA
pheomelanins is more difficult to explain mechanistically. The production of PDCA and
PTCA from pure pheotnelanins suggests the presence of indole units in the polymer.
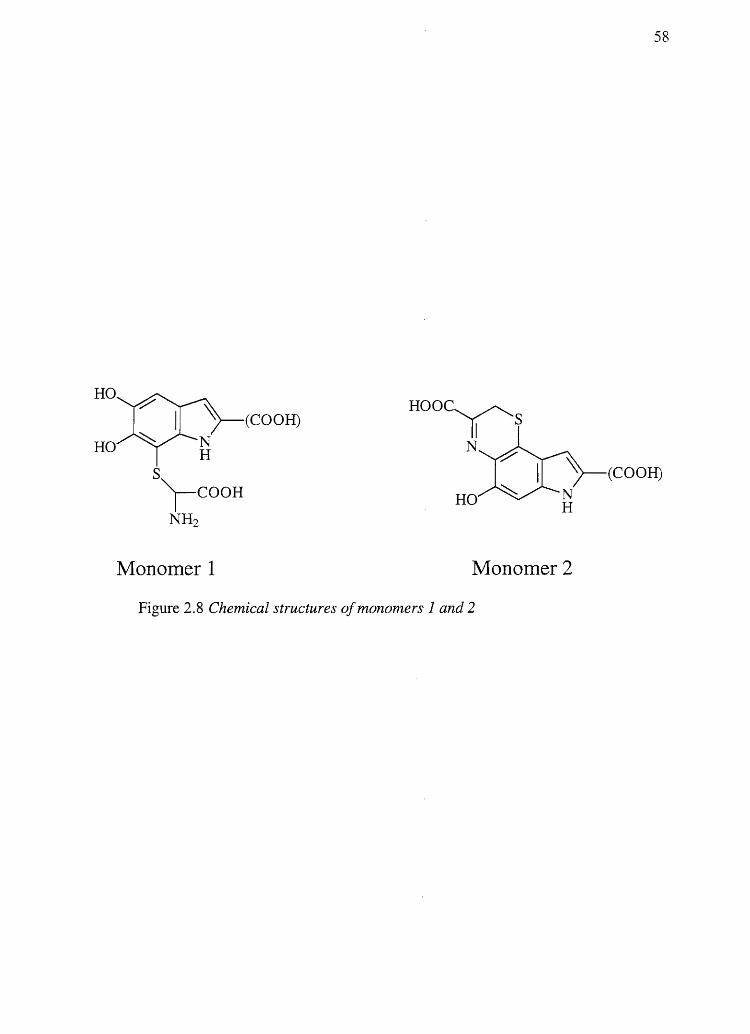
This could mean that monomers 1 and/or 2 shown in Figure 2.8 may exist as part of the
pheomelanin polymer. Considering the nucleophilic nature of the phenylalanine side
chain amino group and the fact that monomers 1 and 2 have not been ruled out as part of
the make up of 5-CysDOP A and 2-CysDOP A pheomelanin, the presence of such
monomers may explain the production of PDCA and PTCA from pheomelanins.
According to Ito et al. (149), the existence of monomer 1 in the pheomelanin polymer
should be verified by the production of cysteine in hydriodic acid hydrolysates of 5-
CysDOPA and 2-CysDOPA pheomelanin. Using HPLC coupled to mass spectrometry
(LCIMS) it was demonstrated that no cysteine is produced from 5-CysDOPA and 2-
CysDOPA pheomelanin hydriodic acid hydrolysates (data not shown) thus likely ruling
out the presence of monomer 1. Monomer 2, however, remains a possibility because it
should produce 3AT or AHP upon hydriodic acid hydrolysis and PDCA and PTCA upon
alkaline hydrogen peroxide degradation. d' Ischia et al. (150) identified monomer 2
(saturated at the 2- position) when cysteine was added to oxidized DOPA. They reported
HO
HO
S
N H
r-COOH
NH2
Monomer 1
(COOH) HOOC~
II S N
HO
Monomer 2
Figure 2.8 Chemical structures of monomers 1 and 2
58
(COOH)
59
that this material rapidly autooxidizes to give complex mixtures of yellowish-brown
oligomeric materials. The existence of monomer 2 in pheomelanin~ however, remains to
be proven.
In conclusion~ the data presented in this paper provide the means to calculate the
amount of each melanin sUbtype present in a hair sample. As demonstrated in Figure 2.7,
a strong relationship exists between codeine incbrporation into human hair and eumelanin
content. A similar relationship may exist for other basic drugs as well-perhaps
providing a means to normalize drug concentrations in hair to eumelanin concentrations
so as to eliminate any potential color bias. As testing for drugs in hair becomes a more
commonplace procedure, the role of specific melanin sUbtypes may become more
pronounced. Quantitation of melanin subtypes therefore may become critically important
in interpreting quantitative drug testing results.
CHAPTER 3
AMPHETAMINE AND N-ACETYLAMPHETAMINE INCORPORATION INTO
HAIR: AN INVESTIGATION OF THE POTENTIAL ROLE OF
DRUG BASICITY IN HAIR COLOR BIASg
Forensic testing for drugs of abuse in hair has become a popular alternative to
traditional urinalysis. Hair color bias, however, presents a problem to fair hair testing. A
number of basic drugs including cocaine (66,151), phencyclidine (69), codeine (65,152),
stanozolol (68), and nicotine (40) have been found to incorporate to a greater extent into
dark hair over light colored hair. To develop nonbiased testing procedures, the roles of
drug chemistry and hair pigmentation in determining drug concentrations in hair must be
understood.
Hair pigment, or melanin, is a polyanionic indolequinone-based polymer that has
the potential to interact with positively charged molecules. A number of researchers have
suggested that drug-melanin binding through ionic and/or van der Waals interactions
between drug molecules and melanin polymers maybe responsible for the preferential
incorporation of some drugs into pigmented vs. nonpigmented hair (30,64,69,75, 153).
Basic drugs are positively charged at physiologic pH. If such drugs are incorporated into
gReproduced, with slight modification, from C.R. Borges, D.O. Wilkins, and D.E. Rollins. 1.
Anal. Taxieol. 25: 221-227 (2001), (the Journal of AnalytiealToxieology) by permission of Preston Publications. A Division of Preston Industries, Inc.
61
hair they may bind to melanin and show a preference for incorporation into pigmented vs.
non-pigmented hair. Neutral or acidic drugs may only be able to interact with melanin
through weak van der Waals forces, thus they are less likely to show a preference for
incorporation into pigmented vs. nonpigmented hair. In agreement with this idea,
phenobarbital, an acidic drug, does not incorporate preferentially into pigmented vs. non
pigmented rat hair (65). In addition, other evidence indicates that carbamazepine (pKa
-7) does not exhibit a hair color bias in humans (74). Although characterized as a basic
drug, a relatively low pKa leaves most of the drug uncharged as it circulates throughout
the body.
Ionic interactions with melanin do not provide the only means for a drug to get
into hair. In addition to N-AcAp (41) (data shown below), other nonionic compounds
such as ~9-tetrahydrocannabinol (THC) (33-35, 154), and a large number of steroids such
as testosterone (155-157), dehydroepiandosterone (158, 159), 17-p-estradiol (160), and
nandrolone (161-163) have been found in hair indicating that melanin may not be the
only drug binding site in hair (46, 49,63).
Amphetamine and N-AcAp have been shown to incorporate into hair (3, 41).
This paper describes the use of amphetamine (pKa 9.8) and its nonbasic analog N-AcAp
(Figure 3.1) to investigate the role of drug basicity in the hair color bias that is sometimes
observed in drug incorporation into hair.
Materials and Methods
Chemicals and Reagents
d-Amphetamine sulfate and d-amphetamine sulfate-d3 were obtained from Sigma
(St. Louis, MO). N-AcAp and N-AcAp-d3 were synthesized with acetic anhydride
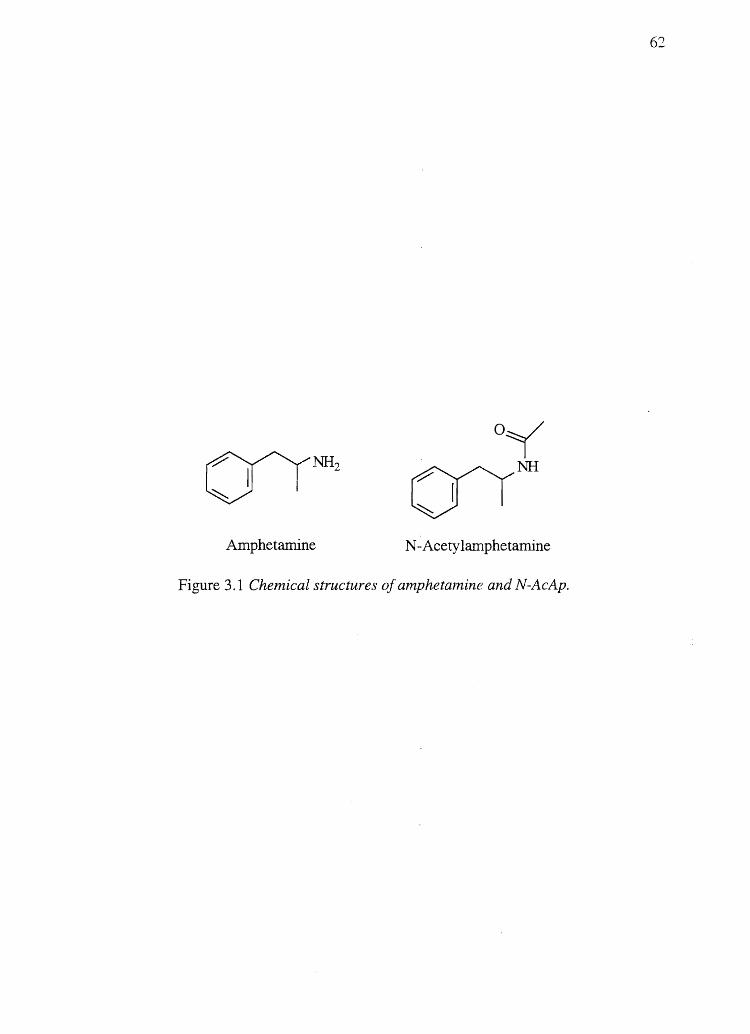
OINH2 I I
~
Amphetamine
o~
OINH
N -Acety lamphetamine
Figure 3.1 Chemical structures of amphetamine and N-AcAp.
62
and acetic anhydride-d6 obtained from Sigma, according to the method of Halmekoski
and Saarinen (164). Identities and purity of the crystalline products were verified by
mass spectrometry and IH-NMR eH-NMR for dO N-AcAp only) (see Appendix). The
melting point of d-N-acetylamphetamine and d-N-acetylamphetamine-d3 was 123-124
°C. N-butyl chloride, chloroform, and methanol (HPLC grade) were obtained from
Burdick and Jackson (Muskegon, Mn. All other reagent grade chemicals were obtained
from Mallinckrodt (St. Louis, MO).
Stock Solutions and Preparation of Standard Curves
Separate stock solutions of amphetamine sulfate and N-AcAp (5 mg/mL) in
deionized water and methanol, respectively, were made. (Only the mass of amphetamine
from the amphetamine sulfate was accounted for when calculating dilutions.) From stock
solutions, working solutions of 0.1, 1, and 10 ng/IlL drug in water were made. Daily
standard curves were obtained by analyzing hair samples (20 mg) fortified with
amphetamine or N-AcAp at 0,0.1,0.2,0.3,0.5, 1,2,3,5,10,25, and 50 ng/mg hair.
Quality control (QC) samples (0.3, 3, and 25 ng/mg hair) were prepared daily from
working solutions of stock sources different from those used to prepare standard curves.
Animal Protocols
Male LE rats (--150 g) were obtained from Harlan Sprague-Dawley (Indianapolis,
IN) and maintained in an environmentally controlled room with a 12-h light-dark cycle
and free access to food and water. Animals were housed individually in hanging wire
cages to prevent contamination from urine, saliva, bedding, or other rats. Drug free rat
hair was obtained by shaving nondosed LE rats. Prior to dosing, the entire dorsal area of
64
each rat was shaved. d-Amphetamine sulfate or N-AcAp dissolved in normal saline or
corn oil, respectively, was administered by intraperitoneal injection once daily at a dose
of 10 mg/kg (n=8 for each drug) for 5 days. Regrown hair was shaved and separated into
white and black samples 14 days after dosing was started. Hair samples were again
collected 28 days after the initial drug administration. Hair was stored at -20°C before
digestion and extraction. Each hair sample was carefully analyzed under a large
magnifying glass and any skin flakes present were removed.
Sample Digestion and Extraction
Hair samples were mulched with scissors and then weighed (-20 mg) into
separate 16 x 100 silanized glass test tubes. After the addition of 2 ng/mg d3 internal
standard, samples were completely solubilized in 2 mL 1 M NaOH overnight at 37°C.
To each sample was added 200 JlL concentrated ammonium hydroxide, followed by 4
mL n-butyl chloride: chloroform (4: 1), Samples were then mixed for 30 min on a test
tube rocker, followed by centrifugation for 10 min at 1800 rpm in an IEe International
(Needham Heights, MA) swing bucket centrifuge. The organic layer was transferred to a
separate test tube and dried under a gentle stream of air at room temperature. Recoveries
of amphetamine and N-AcAp were approximately 800/0, thus no significant loss of
analyte occurred during evaporation. The dried extracts were reconstituted in 100 J.LL LC
mobile phase for injection.
LCIMSIMS Analvsis
HPLC coupled to tandem mass spectrometry (LC/MS/MS) analysis was selected
as the analytical technique due to its excellent selectivity and sensitivity as well as its
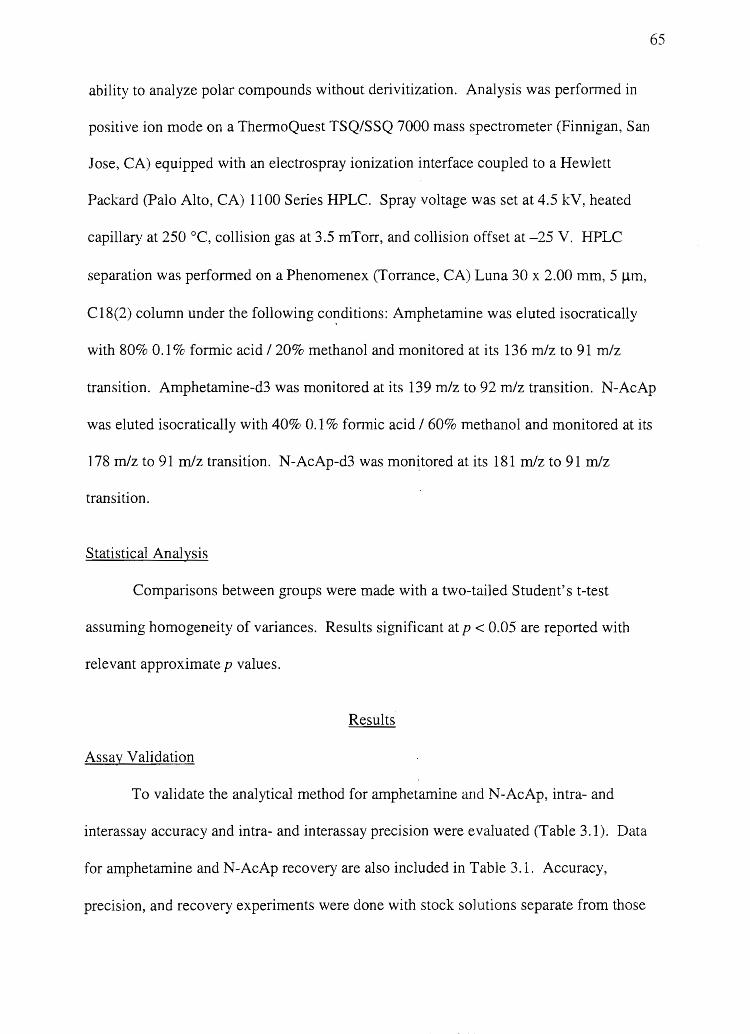
65
ability to analyze polar compounds without derivitization. Analysis was performed in
positive ion mode on a ThermoQuest TSQ/SSQ 7000 mass spectrometer (Finnigan, San
Jose, CA) equipped with an electrospray ionization interface coupled to a Hewlett
Packard (Palo Alto, CA) 1100 Series HPLC. Spray voltage was set at 4.5 kV, heated
capillary at 250°C, collision gas at 3.5 mTorr, and collision offset at -25 V. HPLC
separation was performed on a Phenomenex (Torrance, CA) Luna 30 x 2.00 mm, 5 J..Lm,
C18(2) column under the following co~ditions: Amphetamine was eluted isocratically
with 80% 0.1 % formic acid I 20% methanol and monitored at its 136 mlz to 91 mlz
transition. Amphetamine-d3 was monitored at its 139 mlz to 92 mlz transition. N-AcAp
was eluted isocratically with 40% 0.1 % fonnic acid I 60% methanol and monitored at its
178 mlz to 91 mlz transition. N -AcAp-d3 was monitored at its 181 mlz to 91 rnJz
transition.
Statistical Analysis
Comparisons between groups were made with a two-tailed Student's t-test
assuming homogeneity of variances. Results significant at p < 0.05 are reported with
relevant approximate p values.
Results
Assay Validation
To validate the analytical method for amphetamine and N-AcAp, intra- and
interassay accuracy and intra- and interassay precision were evaluated (Table 3.1). Data
for amphetamine and N-AcAp recovery are also included in Table 3.1. Accuracy,
precision, and recovery experiments were done with stock solutions separate from those
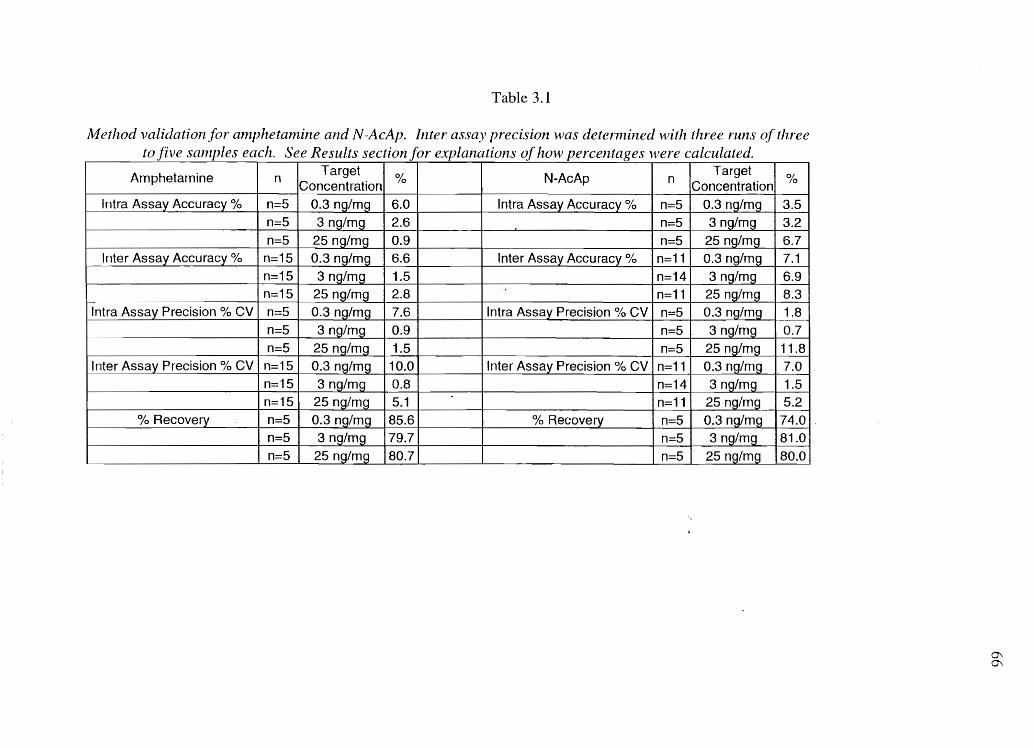
Table 3.1
Method validation for amphetamine and N-AcAp. Inter assay precision was detennined with three runs three to five samples each. See Results section for explanations of how percentages were calculated.
Amphetamine n Target 0/0 N-AcAp n Target 0/0 Concentration Concentration
Intra Assay Accuracy 0/0 n=5 0.3 ng/mg 6.0 Intra Assay Accuracy 0/0 n=5 0.3 ng/mg 3.5 n=5 3 ng/mg 2.6 n=5 3 ng/mg 3.2 n=5 25 ng/mg 0.9 n=5 25 ng/mg 6.7
Inter Assay Accuracy 0/0 n=15 0.3 ng/mg 6.6 Inter Assay Accuracy % n=11 0.3 ng/mg 7.1 n=15 3 ng/mg 1.5 n=14 3 ng/mg 6.9 n=15 25 ng/mg 2.8 n=11 25 ng/mg 8.3
Intra Assay Precision % CV n=5 0.3 ng/mg 7.6 Intra Assay Precision % CV n=5 0.3 ng/rTl9 1.8 n=5 3 ng/mg 0.9 n=5 3 ng/mg 0.7 n=5 25 ng/mg 1.5 n=5 25ng/mg 11.8
Inter Assay Precision % CV n=15 0.3 ng/mg 10.0 Inter Assay Precision % CV n=11 0.3 ng/mg 7.0 I
n=15 3 ng/mg 0.8 n=14 3 ng/mg 1.5 I
n=15 25 ng/mg 5.1 n=11 25 ng/mg 5.2 0/0 Recovery n=5 0.3 ng/mg 85.6 . % Recovery n=5 0.3 ng/mg 74.0
n=5 3 ng/mg 79.7 n=5 3 ng/mg 81.0 n=5 2§Qg/rl}g 80.7 n=5 25 ng/mg 80.0
-~-
0\ 0\
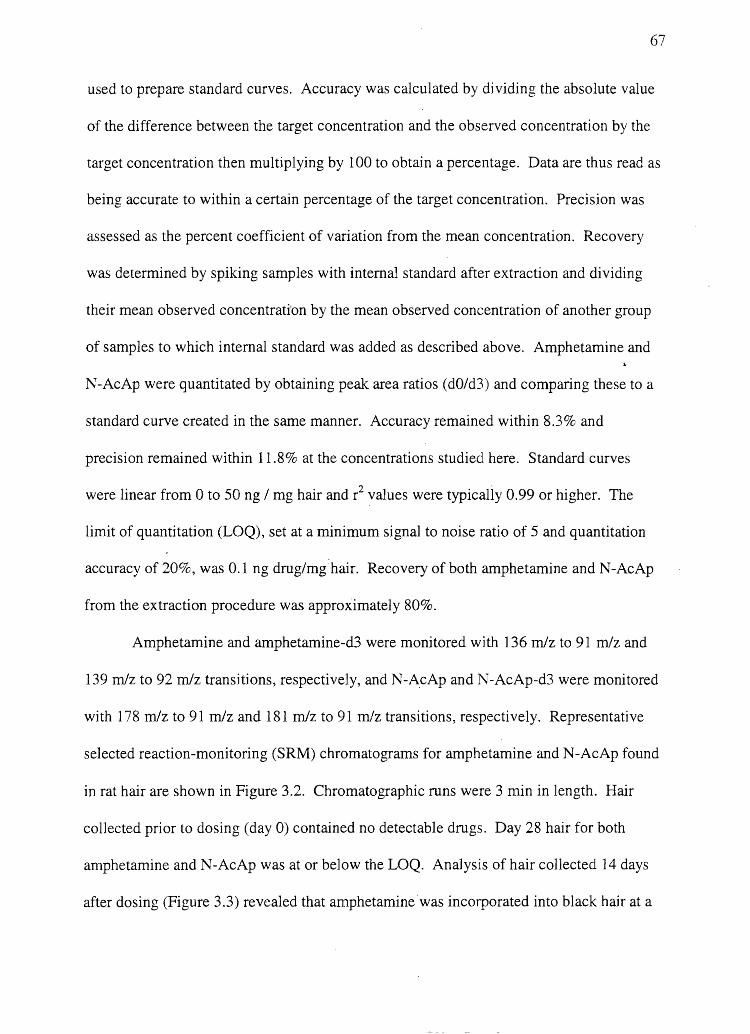
67
used to prepare standard curves. Accuracy was calculated by dividing the absolute value
of the difference between the target concentration and the observed concentration by the
target concentration then multiplying by 100 to obtain a percentage. Data are thus read as
being accurate to within a certain percentage of the target concentration. Precision was
assessed as the percent coefficient of variation from the mean concentration. Recovery
was determined by spiking samples with internal standard after extraction and dividing
their mean observed concentrati'on by the mean observed concentration of another group
of samples to which internal standard was added as described above. Amphetamine and
N-AcAp were quantitated by obtaining peak area ratios (dO/d3) and comparing these to a
standard curve created in the same manner. Accuracy remained within 8.3% and
precision remained within 11.8% at the concentrations studied here. Standard curves
were linear from 0 to 50 ng / mg hair and l values were typicaliy 0.99 or higher. The
limit of quantitation (LOQ), set at a minimum signal to noise ratio of 5 and quantitation
accuracy of 20%, was 0.1 ng drug/mghair. Recovery of both amphetamine and N-AcAp
from the extraction procedure was approximately 80%.
Amphetamine and amphetamine-d3 were monitored with 136 m1z to 91 m1z and
139 m1z to 92 m1z transitions, respectively, and N-AcAp and N-AcAp-d3 were monitored
with 178 m1z to 91 m1z and 181 m1z to 91 m1z transitions, respectively. Representative
selected reaction-monitoring (SRM) chromatograms for amphetamine and N-AcAp found
in rat hair are shown in Figure 3.2. Chromatographic runs were 3 min in length. Hair
collected prior to dosing (day 0) contained no detectable drugs. Day 28 hair for both
amphetamine and N-AcAp was at or below the LOQ. Analysis of hair collected 14 days
after dosing (Figure 3.3) revealed that amphetamine"was incorporated into black hair at a

68
Figure 3.2 Representative SRM chromatograms for A) amphetamine found in rat hair and
B) N-AcAp found in rat hair
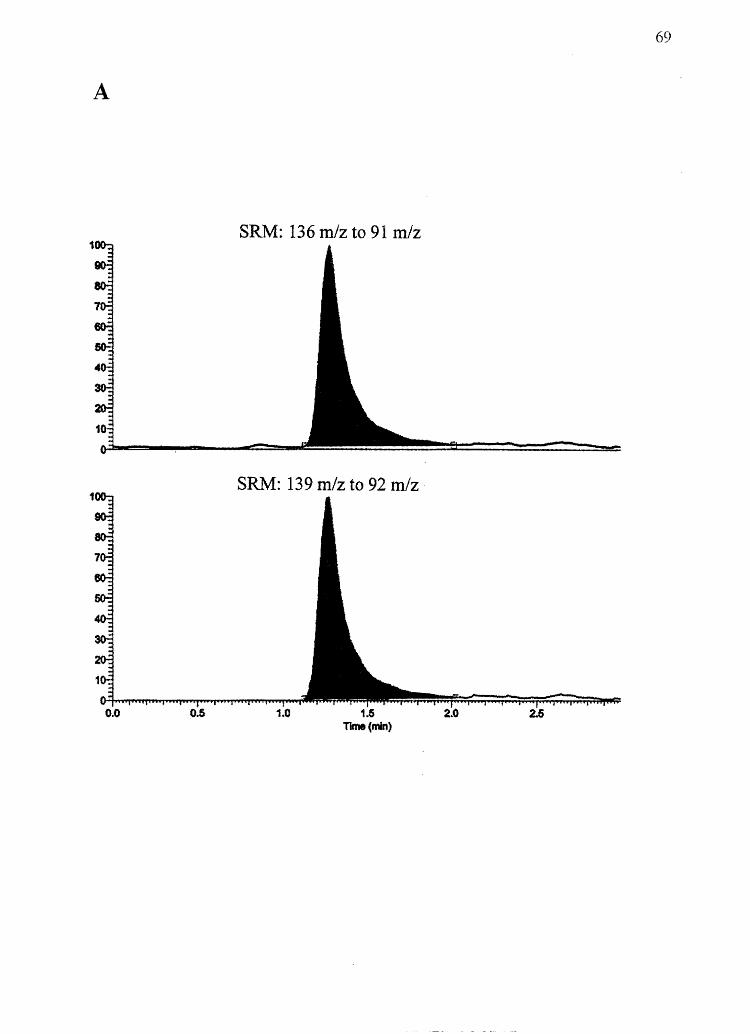
A
1
0.0 0.5
SRM: 136 m/z to 91 mJz
SRM: 139 m/z to 92 mJz
1.0 1.5 Time (min)
69
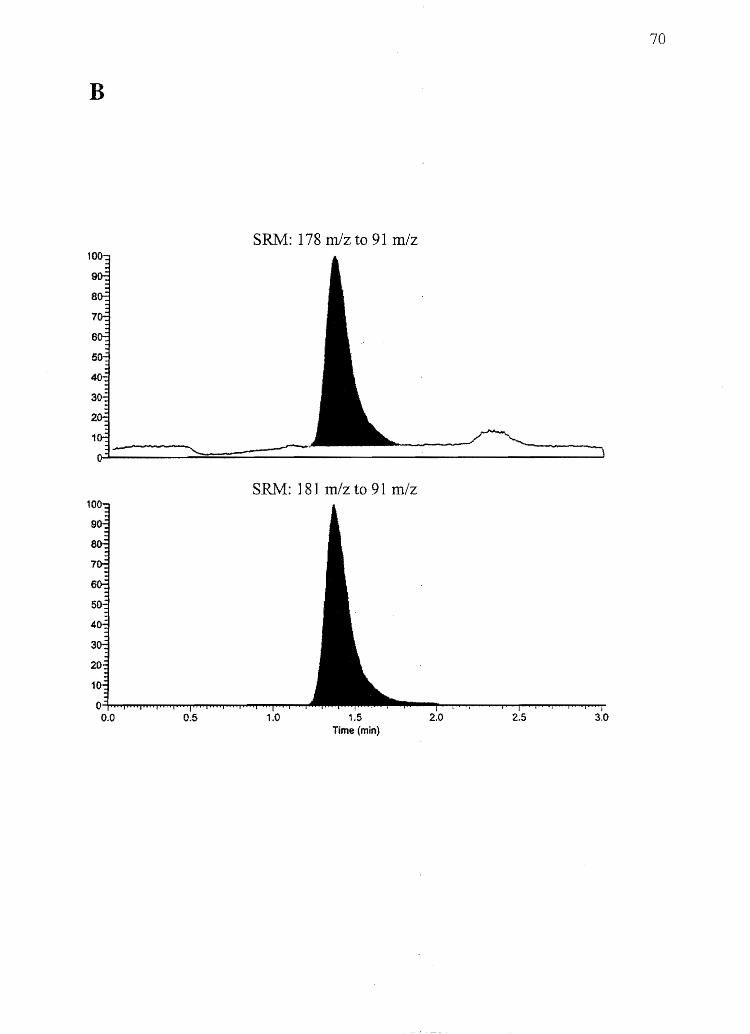
B
0.0 0.5
SRM: 178 nllz to 91 m/z
SRM: 181 In/z to 91 nl/z
1.0 1.5 Time (min)
70
2.0 2.5 3.0

Figure 3.3 Concentrations of A) amphetamine found in white and black rat hair and B)
N-AcAp found in white and black rat hair. Error bars represent standard deviation. n=8
for each drug. *Significant at p < 0.00 1.
71
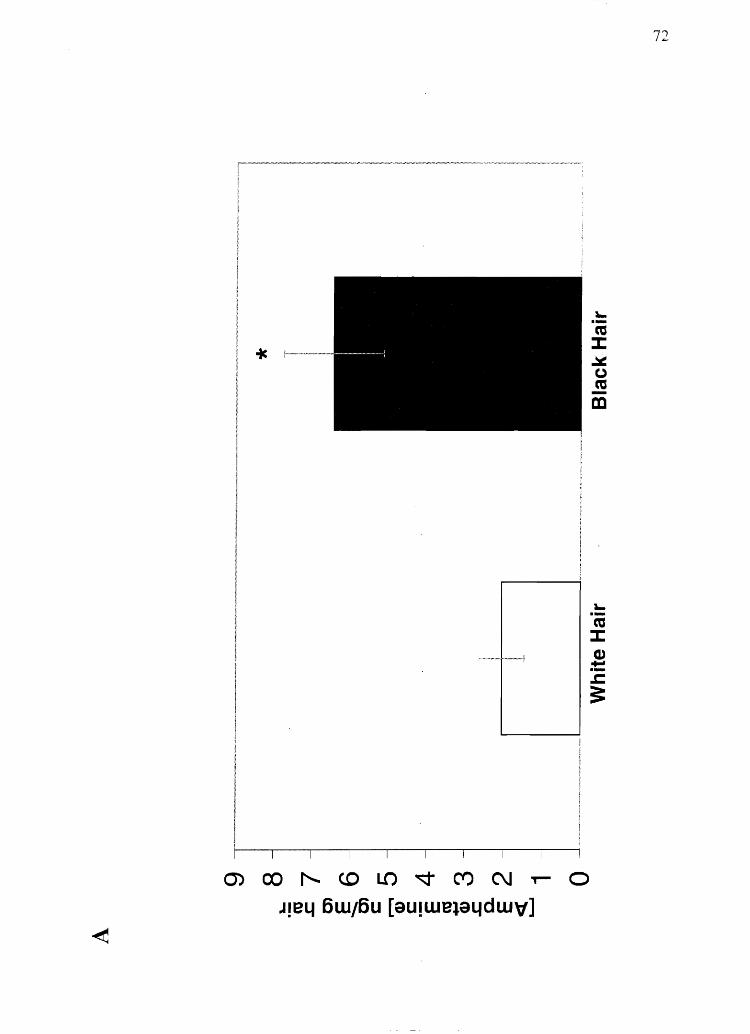
(j)C:Of'....C'OL()~Cf)C\J-r-O
J!ell 6w/6u [aU!We~alldw,,]
72
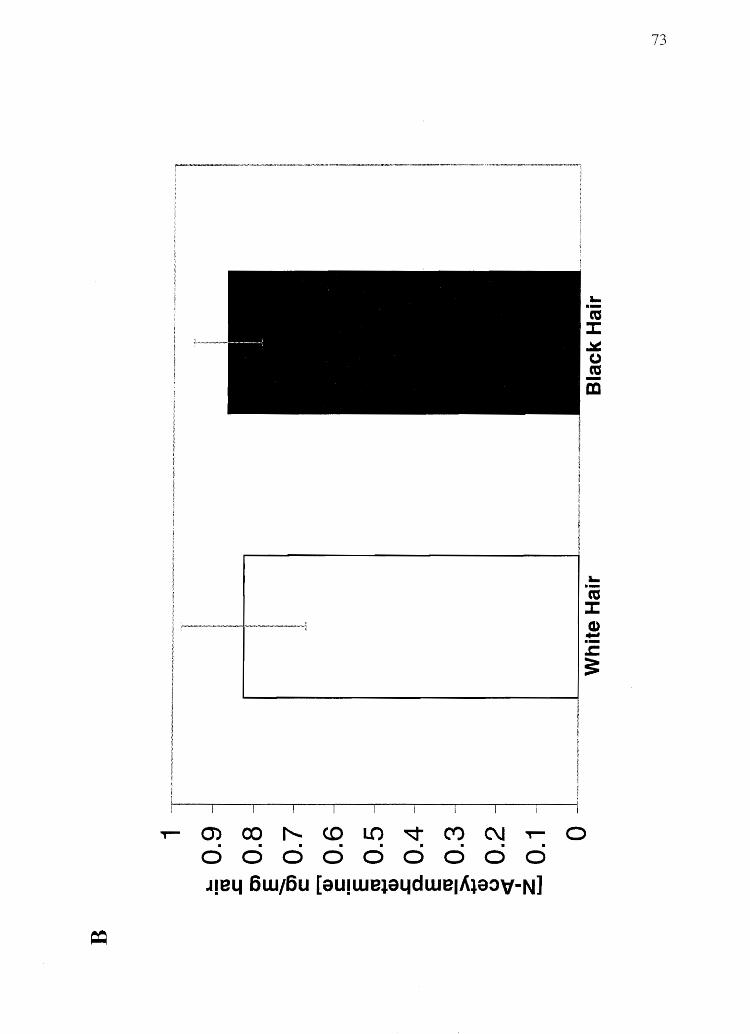
73
or- Q) ex:> f'.. CD L!) ~ (1) C\I or- 0 . . . . . . . . . 000000000 J!ell 6w/6u [9U!WeJ9I1dweIAI9:>V-N1
mean concentration of 6.44 ± 1.31 (SD) ng amphetamine / mg hair, an amount
significantly different (p < 0.001) from that found in white hair (2.04 ± 0.58 ng
amphetamine/mg hair) (n=8). In contrast, no difference in N-AcAp content was found
between black hair (0.87 ± 0.08 ng N-AcAp/mg hair) and white hair (0.83 ± 0.15 ng N
AcAp/mg hair) from rats dosed with N-AcAp (n=8).
Discussion
74
Nakahara et al. (41,43,67, 75) have suggested that drug basicity, which, in
theory, leads to drug-melanin binding, is an important characteristic governing the
incorporation of a drug into hair. Additional studies have indicated that although drugs
do not have to be basic (e.g., phenobarbital) to be highly incorporated into hair (65), drug
basicity may playa strong role in the preferential incorporation of a given drug into
pigmented vs. nonpigmented hair (65, 66,68, 69, 127, 153). To directly evaluate the role
of drug basicity in potential hair color bias, this study employed amphetamine and N
AcAp (a basic drug and its nonbasic analog) to test the hypothesis that a basic drug will
show a hair color bias, but that a nonbasic drug will not show a hair color bias. LE rats
were chosen for this study because the presence of black and white hair on the same
animal helps eliminate black hair vs. white hair drug concentration differences due to
additional factors such as species differences and interanimal variability. (Also, by
simpJe visual inspection, no differences were noted between black hair and white hair
growth rates on the same anima1.) The results of this study clearly demonstrate that drug
basicity can lead to a hair color bias, but a lack of basicity appears to eliminate hair color
bias. Melanin likely plays the dominant role in the demonstrated hair color bias, but we
did not attempt to normalize hair concentrations for melanin content due to the fact that
while there certainly is melanin in black LE rat hair, there are negligible amounts of
melanin in white LE rat hair (as detennined by the HPLC method of Borges et al. (165),
chromatograms not shown). Mathematically, nonnalizing the data in this study to hair
melanin content would produce meaningless data. futerestingly, the fact that drugs were
incorporated into white LE rat hair demonstrates that melanin is not the only binding
location for drugs in hair.
The difference in basicity between amphetamine and N-AcAp represents the most
striking contrast between these two drugs, but there is also a difference in lipophilicity, a
feature that may be partly responsible for the differences in hair incorporation noted in
these studies. However, the greater lipophilicity of N-AcAp is probably not responsible
for its lack of a hair color bias or its lesser incorporation into hair regardless of hair color.
This is because lipophilicity neither increases melanin binding (see Chapter 4) or overall
incorporation into hair, as might be expected according to classical hair incorporation
theories.
Evidence for hair color bias also exists for cocaine (66), phencyclidine (69, 128),
nicotine (40), cotinine (40), stanozolol (68), and codeine (64, 65) but not for the acidic
drug phenobarbital, which shows no hair pigmentation bias whatsoever (65). Melanin
consists of polyanionic indolequinonone-based polymers (96) that have been partially
degraded into carboxylic acid substituted pyrrole units (95). In theory, the hair color bias
demonstrated for basic drugs may be caused by the ionic binding of positively charged,
basic drug molecules to negatively charged melanin pigment polymers. In vitro drug
melanin binding studies with amphetamine and N-AcAp were also conducted to further
test this theory (see Chapter 4).
76
Some epidemiological evidence, (72, 73, 166) has suggested that there is no hair
color bias for amphetamines and cocaine. These authors suggest that differences in hair
drug concentrations between races are due to differences in drug preferences among the
various societal groups rather than due to a hair color bias (defined as the situation where
more drug is deposited into darker hair vs. lighter hair, given equal dosing). One primary
conclusion is that, " ... there is no significant relationship between [hair] color category
and likelihood to test positive for cocaine. (166)" Unfortunately, information on exactly
which individuals from different races actually ingested the drugs in question is not
available in these studies. Hair analysis simply says whether or not there is drug in hair
above a certain concentration. As such, there may not be an effective hair color bias.
Such epidemiological evidence is derived from a dichotomous hair test outcome, the
results of which depend on an established cutoff concentration above whi.ch a test result
is considered positive. It may be the case that the cutoff concentration is set
appropriately so that all (or nearly all) of the individuals taking the drugs in question are
found positive regardless of hair color. That is, for (nearly) all users, sufficient drug is
incorporated into their hair to produce a positive test outcome regardless of hair color.
There may have been no or too few users exposed to a small enough dose for light-haired
individuals to test negative and dark-haired individuals to be shown positive for drug use.
Importantly, while there may be more drug in dark colored hair, there may still be enough
drug in light colored hair to produce a positive result. A recent study by Rollins et ai.
(126) helps to elucidate this matter. Their study demonstrated clear differences between
light and dark colored hair concentrations of ofloxacin and codeine for a group of human
subjects given the same low therapeutic dose of ofloxacin or codeine. Thus, they
77
demonstrated hair color biases for both ofloxacin and codeine testing in hair at
therapeutic doses. As clearly shown by their results, however, for a given dose, an unfair
testing situation only exists if the cutoff concentration is set too high. That is, if the
cutoff concentration is set above the mean drug concentration in light hair but below the
mean drug concentration in dark hair. While it is necessary to set high enough cutoff
concentrations to clearly distinguish from background noise, setting cutoff concentrations
as close to background levels as possible will help to make any possible unfair hair color
effects as minimal as possible (Le., there will be fewer individuals in the dose range
where a negative test will be produced for light colored hair and a positive test produced
for dark colored hair). The likelihood of eliminating an unfair hair-testing situation,
however, would have to be determined for each individual drug.
In comparing the overall incorporation of amphetamine vs. N-AcAp in hair,
Nakahara et at. have demonstrated using dark agouti rats that even though plasma
concentrations of N-AcAp are much higher than those of amphetamin.e (41) (given equal
doses), amphetamine is incorporated into hair to a far greater extent than is N-AcAp (41).
Their findings regarding amphetamine and N-AcAp in hair were substantiated by this
study in LE rats (in both black and white hair). Thus while drug-melanin binding
certainly plays a strong role in drug incorporation into hair and determining hair color
bias, additional processes such as hair cell drug transport may be important determinants
of the amount of a given drug incorporated into hair-pigmentation differences aside. As
hair testing for drugs of abuse becomes more commonplace, the relationships between
drug and hair cell biochemistry must become better understood to allow for fair and
accurate interpretation of drug testing results.

CHAPTER 4
COCAINE, BENZOYLECGONINE, AMPHETAMINE, AND
N-ACETYLAMPHETAMINE BINDING TO
MELANIN SUBTYPES
Melanin is an indolequinone based polymer that is polyanionic in nature and
thought to be capable of binding drugs through both'ionic and possibly van der Waals
interactions (51, 53). In vivo, melanin is formed linked to proteins in organelles known
as melanosomes (pigment granules), which are produced in melanocytes. Melanocytes
ultimately transfer their melanosomes to keratinocytes where the pigment can be evenly
displayed on the body surface or in hair (96, 167). The binding of a wide variety of drugs
to melanin both in vitro and in vivo is well documented (51-53, 55, 79, 168), Because
melanin is found throughout the body in areas as diverse as the inner ears, eyes, skin,
hair, and brain, the pharmacological and toxicological consequences of drug-melanin
binding range from reduction in antibacterial activity (169), induction of drug toxicity
(87), and protection from drug toxicity (85, 86), to implications for the origin of
Parkinson's disease (77, 78, 80, 88, 89, 170-172).
Our laboratory is primarily interested in drug-melanin binding from the
perspective of how it affects drug incorporation into hair. A number of studies have
shown that hair pigmentation plays a major role in the concentration of drug incorporated
into hair (63, 68, 69, 127). These data suggest that a hair color bias may exist when
79
testing for drugs of abuse in hair. That is, because more drug is incorporated into the hair
of a dark-haired individual, their hair is more likely to be found positive for a drug that
binds melanin than is the hair of an individual with light colored hair. While there is
some debate as to whether or not melanin can produce an effective "hair color bias" in
actual drug testing (72, 73), the fact that drugs can bind to melanin remains uncontested.
To date, the only drugs definitively shown to incorporate to a greater extent in
dark hair over light hair have been basic drugs-i.e., drugs that have a positive charge at
physiological pH. Negatively charged and neutral drugs such as phenobarbital and N
AcAp specifically investigated for a hair color bias have been shown to lack this
phenomenon (42, 65). Such findings suggest that it is the ionic binding between
positively charged drug molecules and negatively charged melanin polymers that leads to
a greater incorporation of a drug into pigmented vs. nonpigmented hair. In fact, this
suspicion is supported by mechanistic studies on the nature of drug-melanin interactions
(51,53).
Melanin, which is ultimately derived fron1 the amino acid tyrosine (Figures 2.lA
and 2.lB), can be divided into two types: the black eumelanins and the reddish-brown
pheomelanins. These types can be further divided into SUbtypes: Eumelanins are made
up of primarily DHI and DHICA monomers, (Figure 2.lA) and pheomelanins consist of
primarily 5-CysDOPA and 2-CysDOPA-derived monomer units (Figure 2.lB). DHI and
DHICA are the major precursors of eumelanin, but the polymer does not necessarily
consist solely of these monomers. This is due to the fact that hydrogen peroxide,
produced in the vicinity of developing melanin polyn1ers, can partially alter the forming
polymer by oxidatively degrading some of the DHI and DHICA units into carboxylic

80
acid substituted pyrrole units (95, 96). Nevertheless, eumelanins consisting mostly of
DHICA units would be expected to have a greater carboxylic acid content than
eumelanins consisting mostly of DHI units. (This hypothesis has been confirmed by
Novellino et al. (95)). Because of the significant chemical differences between DHI and
DHICA eumelanins and the fact that pheomelanins are substantially chemically different
from eumelanins, the binding properties'of different melanin subtypes may differ for a
given drug.
The purpose of the work presented here was to assess the roles of individual
melanin sUbtypes in binding amphetamine, N-AcAp, cocaine, and BE (Figures 3.1 and
4.1). These drugs were chosen because cocaine (pKa 8.5) exhibits a hair color bias (63,
66) while its zwitterionic chemical congener, BE, has not been shown to exhibit this bias.
Similarly, while amphetamine exhibits a hair color bias (42), its nonbasic analog N-AcAp
has been shown not to exhibit a hair color bias (42). In addition to the drug-melanin
binding studies, attempts were made to begin to elucidate the chemical functional groups
on melanin responsible for drug binding. Several model molecules containing one
melanin functional group each were analyzed via tandem mass spectrometry for adduct
formation with amphetamine and cocaine. The information gleaned from these studies
helps to elucidate the important chemical properties of both drugs and melanins that are
important for drug-melanin binding and thus for producing a potential hair color bias.
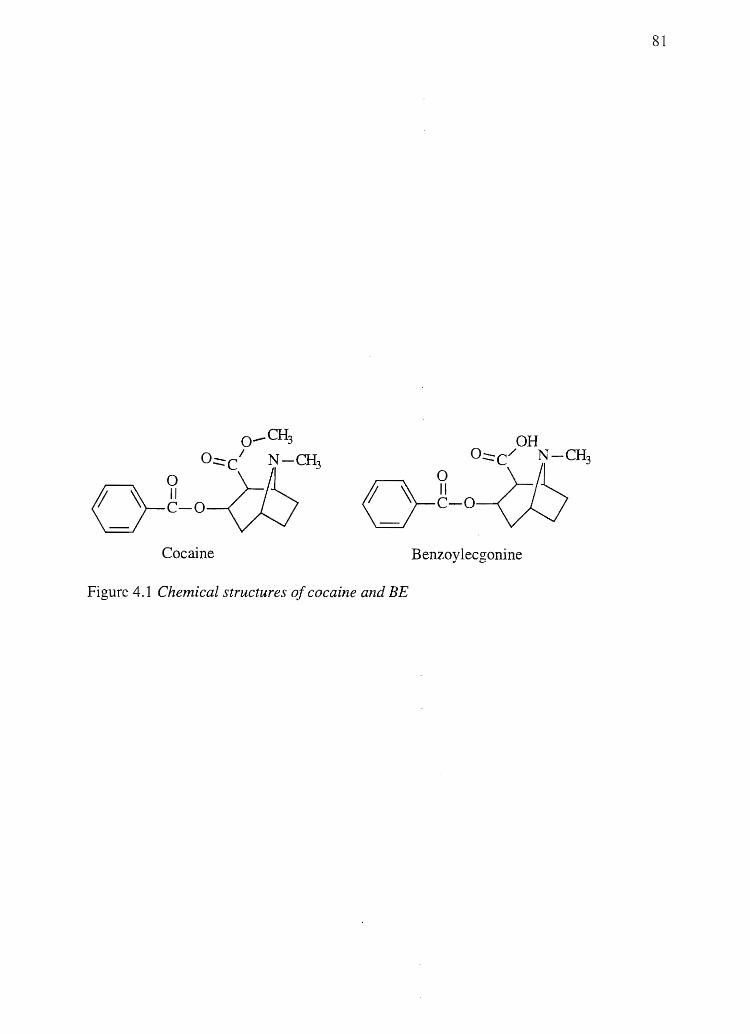
81
Cocaine Benzoy lecgonine
Figure 4.1 Chemical structures of cocaine and BE
82
Materials and Methods
Materials
DRI and DRICA were synthesized as described by Wakamatsu and Ito (142).
DHI-me1anin and DRICA-me1anin were prepared according to the method of Ito et al.
(144). 5-CysDOPA and 2-CysDOPA were made via the method of Ito et al. (143).
CysDOPA-me1anin and 2-CysDOPA-me1anin were prepared as described by Ito and
Fujita (141). Mixed eu-/pheomelanin copolymers from DRI and 5-CysDOPA or 2-
CysDOPA were also made by the method of Ito and Fujita (141) omitting the acetone
wash step. The initial reaction mixture contained 40% DRI and 60% CysDOPA (by
mass). Melanin analysis by the method of Borges et. al. (165) revealed that the
copolymers consisted of 80% DHI-me1anin and 20% 5-CysDOPA-melanin or 2Q% 2-
CysDOPA-melanin (by mass), 3R-1-(-)-Cocaine was obtained from NEN Life Science
Products, Inc. (Boston, MA). 3R-1-( -)-Benzoylecgonine was obtained from Moravek
Biochemicals (Brea, CA). Tyrosinase, 1-(-)-cocaine hydrochloride, benzoyl ecgonine
tetrahydrate, d-amphetamine sulfate, d-amphetamine-d3 sulfate, and acetic anhydride-d6
were obtained from Sigma (St. Louis, MO). N-AcAp and N-AcAp-d3 were synthesized
according to the method of Ra1mekoski and Saarinen (164), using acetic anhydride-d6 for
N-AcAp-d3. Aminopropy1si1ica (APS) solid phase sorbent was purchased from
International Sorbent Technology (Mid Glamorgan, UK). Cytoscint ES liquid
scintillation fluid was obtained from ICN Biomedica1s, Inc. (Costa Mesa, CA). Buffer
salts were obtained from Mallinckrodt (Paris, KY). The structure and purity of all
synthetic compounds (except melanins) were confirmed by NMR and mass spectrometry
(See Appendix). Matrix assisted laser desorption ionization mass spectrometry (MALDI-
MS) on pure pheomelanin was performed on a PerSeptive Bioscience Voyager-Elite
mass spectrometer equipped with a time-of-flight mass analyzer in positive ionization
mode using as trans-4-hydroxy-3-methoxycinnamic acid as the sample matrix, by Dr.
Vajira Nanayakkara. All other chemicals used are readily available and were of the
highest purity available.
Melanin Preparation
83
Five different melanins were used in these experiments. They included: DHI
melanin, DHICA-melanin, 80% DHI/ 20% 5-CysDOPA-melanin (DHIJ5-CysDOPA
melanin), 800/0 DHI / 20% 2-CysDOPA-melanin (DHIJ2-CysDOPA-melanin) and 100%
5-CysDOPA-melanin covalently linked to an aminopropylsilica (APS) solid phase
sorbent, hereafter referred to as APS-pheomelanin. 5-CysDOP A was covalently attached
to the APS sorbent using the same technique that Ibrahim and Aubry (173) used to link
tyrosine-deri ved melanin to APS. Melanins were prepared for binding experiments by
repeated homogenizing and washing in 0.066 M potassium phosphate buffer, pH 7.4 (for
cocaine and BE binding experiments) or 0.15 M ammonium acetate buffer, pH 7.4 (for
amphetamine and N-AcAp binding experiments) until a clear supernatant was obtained.
Buffer concentrations were chosen to match the ionic strength of a normal saline solution.
Ammonium acetate buffer was used for amphetamine and N-AcAp samples because a
volatile buffer was required for LCIMSIMS analysis.
Binding Experiments
For each drug with each melanin, a time course (5, 15, 30, 60, and 90 min) was
run to determine the amount of time required for binding equilibrium to be reached.
Time course samples were run at a concentration of 500 pM for cocaine, 2 nM for BE,
and 30 nM for amphetamine and N-AcAp. Binding equilibrium was always established
by 45 or 60 min. To obtain the binding parameters Bmax and Ka for each drug-melanin
combination, a range of drug concentrations was incubated with each melanin. For
cocaine and BE this range included 12 points between 300 pM and 75 ~M. For
amphetamine and N-AcAp this range included 12 points between 1 nM and 300 /lM.
84
Binding experiments were conducted in silariized 16 x 100 mm glass test tubes by
adding the specified amount of drug (dissolved in buffer) to a buffer solution into which
had been added 100 flg melanin (from a 1 mg/ml melanin suspension in buffer). The
preparatory procedure was the same for all melanins except APS-pheomelanin for which
it was necessary to add 3 mg APS-pheomelanin to equal 0.1 mg actual pheomelanin.
Incubation was then performed at 37 °C in a vigorously shaking water bath, keeping
melanin gran,ules in suspension (325 rpm) for the specified time. For each sample, an
analogous sample was incubated in the absence of melanin to serve as a control for any
possible background binding. (F9r APS-pheomelanin samples, blank, or unreacted APS,
was used as the background.) Total incubation volumes were 1 mL. At the end of the
incubation time, samples were immediately transferred to 1.7 rnL microcentrifuge tubes
and spun at 14,000 rpm for 90 min at 4 °C. Immediately after centrifugation, 0.6 rnL of
supernatant was removed and mixed with either 14 inL scintillation fluid (cocaine and
BE) or an aliquot of internal standard (amphetamine-d3 or N-AcAp-d3) at approximately
one-third the amount of drug used in the incubation. Cocaine and BE samples were then
mixed, left to settle overnight, and counted in a Packard 1900CA Tri-carb liquid
scintillation counter. Amphetamine and N-AcAp samples were evaporated in a Savant
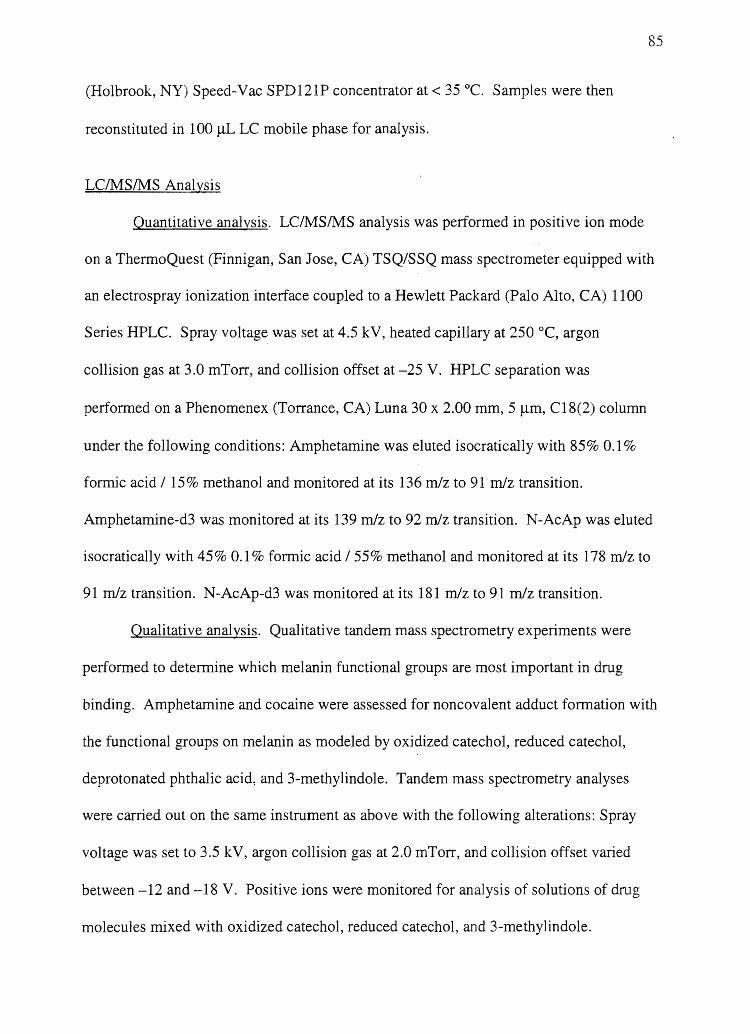
(Holbrook, NY) Speed-Vac SPD121P concentrator at < 35°C. Samples were then
reconstituted in 100 JlL LC mobile phase for analysis.
LC/MS/MS Analysis
85
Quantitative analysis. LC/MS/MS analysis was performed in positive ion mode
on a ThermoQuest (Finnigan, San Jose, CA) TSQ/SSQ mass spectrometer equipped with
an electrospray ionization interface coupled to a Hewlett Packard (Palo Alto, CA) 1100
Series HPLC. Spray voltage was set at 4.5 kV, heated capillary at 250°C, argon
collision gas at 3.0 mToIT, and collision offset at -25 V. HPLC separation was
performed on a Phenomenex (Torrance, CA) Luna 30 x 2.00 mm, 5 Jlm, C 18(2) column
under the following conditions: Amphetamine was eluted isocratically with 85% 0.1 %
formic acid I 15% methanol and monitored at its 136 mlz to 91 mlz transition.
Amphetamine-d3 was monitored at its 139 mlz to 92 mlz transition. N-AcAp was eluted
isocratically with 45% 0.1 % formic acid I 55% methanol and monitored at its 178 mlz to
91 mlz transition. N-AcAp-d3 was monitored at its 181 mlz to 91 mlz transition.
Qualitative analysis. Qualitative tandem mass spectrometry experiments were
performed to determine which melanin functional groups are most important in drug
binding. Amphetamine and cocaine were assessed for noncovalent adduct formation with
the functional groups on melanin as modeled by oxidized catechol, reduced catechol,
deprotonated phthalic acid, and 3-methylindole. Tandem mass spectrometry analyses
were carried out on the same instrument as above with the following alterations: Spray
voltage was set to 3.5 kV, argon collision gas at 2.0 mToIT, and collision offset varied
between -12 and -18 V. Positive ions were monitored for analysis of solutions of drug
molecules mixed with oxidized catechol, reduced catechol, and 3-methylindole.
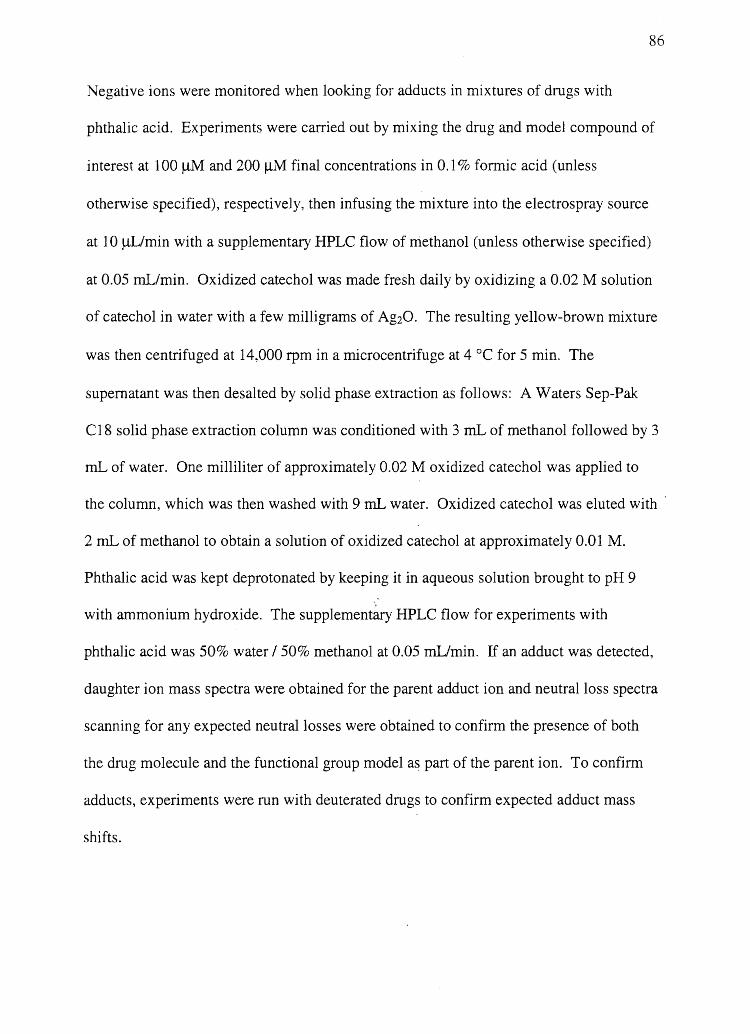
86
Negative ions were monitored when looking for adducts in mixtures of drugs with
phthalic acid. Experiments were carried out by mixing the drug and model compound of
interest at 1 00 ~ and 200 ~M final concentrations in 0.1 % formic acid (unless
otherwise specified), respectively, then infusing the mixture into the electrospray source
at 1 0 ~min with a supplementary HPLC flow of methanol (unless otherwise specified)
at 0.05 rnUmin. Oxidized catechol was made fresh daily by oxidizing a 0.02 M solution
of catechol in water with a few milligrams of Ag20. The resulting yellow-brown mixture
was then centrifuged at 14,000 rpm in a microcentrifuge at 4 °C for 5 min. The
supernatant was then desalted by solid phase extraction as follows: A Waters Sep-Pak
C18 solid phase extraction column was conditioned with 3 mL of methanol followed by 3
rnL of water. One milliliter of approximately 0.02 M oxidized catechol was applied to
the column, which was then washed with 9 mL water. Oxidized catechol was eluted with
2 rnL of methanol to obtain a solution of oxidized catechol at approximately 0.01 M.
Phthalic acid was kept deprotonated by keeping it in aqueous solution brought to pH 9
with ammonium hydroxide. The supplementary HPLC flow for experiments with
phthalic acid was 50% water 150% methanol at 0.05 mL/min. If an adduct was detected,
daughter ion mass spectra were obtained for the parent adduct ion and neutral loss spectra
scanning for any expected neutral losses were obtained to confirm the presence of both
the drug molecule and the functional group model as part of the parent ion. To confirm
adducts, experiments were run with deuterated drugs to confirm expected adduct mass
shifts.
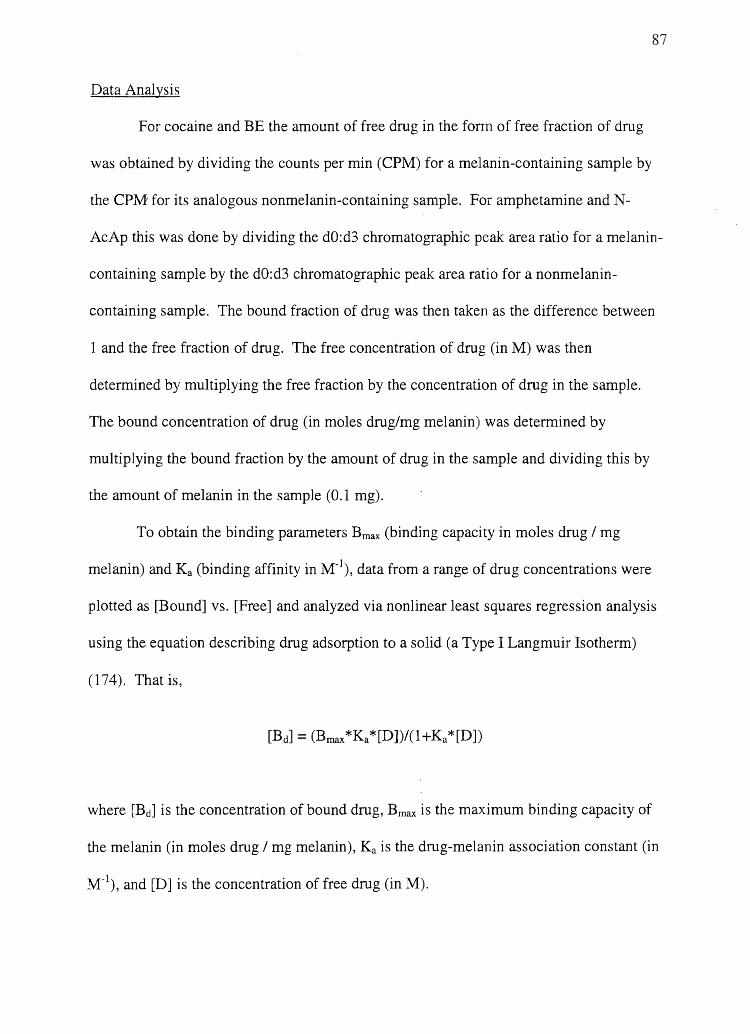
87
Data Analysis
For cocaine and BE the amount of free drug in the form of free fraction of drug
was obtained by dividing the counts per min (CPM) for a melanin-containing sample by
the CPM for its analogous nonmelanin-containing san1ple. For amphetamine and N
AcAp this was done by dividing the dO:d3 chromatographic peak area ratio for a melanin
containing sample by the dO:d3 chromatographic peak area ratio for a nonmelanin
containing sample. The bound fraction of drug was then taken as the difference between
1 and the free fraction of drug. The free concentration of drug (in M) was then
determined by multiplying the free fraction by the concentration of drug in the sample.
The bound concentration of drug (in moles drug/mg melanin) was determined by
multiplying the bound fraction by the amount of drug in the sample and dividing this by
the amount of melanin in the sample (0.1 mg).
To obtain the binding parameters Bmax (binding capacity in moles drug / mg
melanin) and Ka (binding affinity in M-1), data from a range of drug concentrations were
plotted as [Bound] vs. [Free] and analyzed via nonlinear least squares regression analysis
using the equation describing drug adsorption to a solid (a Type I Langmuir Isotherm)
(174), That is,
where [Bd] is the concentration of bound drug, Bmax is the maximum binding capacity of
the melanin (in moles drug / mg melanin), Ka is the drug-melanin association constant (in
M-1), and [D] is the concentration of free drug (in M).
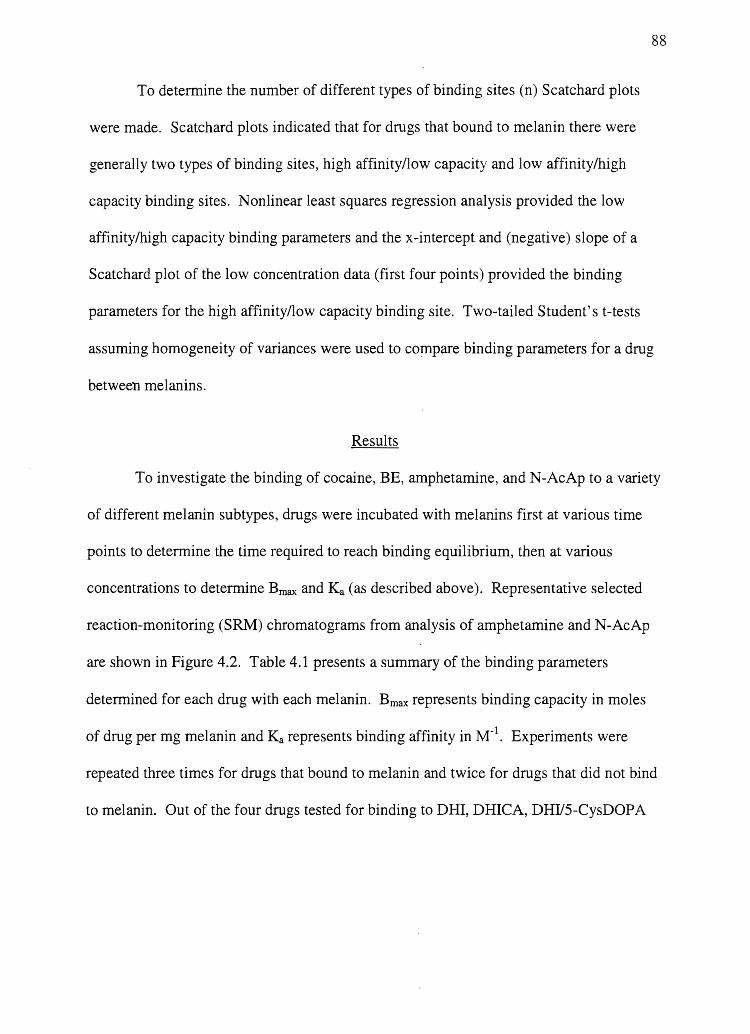
88
To determine the number of different types of binding sites (n) Scatchard plots
were made. Scatchard plots indicated that for drugs that bound to melanin there were
generally two types of binding sites, high affinity/low capacity and low affinitylhigh
capacity binding sites. Nonlinear least squares regression analysis provided the low
affinitylhigh capacity binding parameters and the x-intercept and (negative) slope of a
Scatchard plot of the low concentration data (first four points) provided the binding
parameters for the high affinity/low capacity binding site. Two-tailed Student's t-tests
assuming homogeneity of variances were used to compare binding parameters for a drug
between melanins.
Results
To investigate the binding of cocaine, BE, amphetamine, and N-AcAp to a variety
of different melanin subtypes, drugs were incubated with melanins first at various time
points to determine the time required to reach binding equilibrium, then at various
concentrations to determine Bmax and Ka (as described above). Representative selected
reaction-monitoring (SRM) chromatograms from analysis of amphetamine and N-AcAp
are shown in Figure 4.2. Table 4.1 presents a summary of the binding parameters
determined for each drug with each melanin. Bmax represents binding capacity in moles
of drug per mg melanin and Ka represents binding affinity in M- I. Experiments were
repeated three times for drugs that bound to melanin and twice for drugs that did not bind
to melanin. Out of the four drugs tested for binding to DHI, DHICA, DHII5-CysDOPA
Figure 4.2 Representative SRM chromatograms from LCIMSIMS analysis of (AJ
amphetamine and (BJ N-AcAp
89
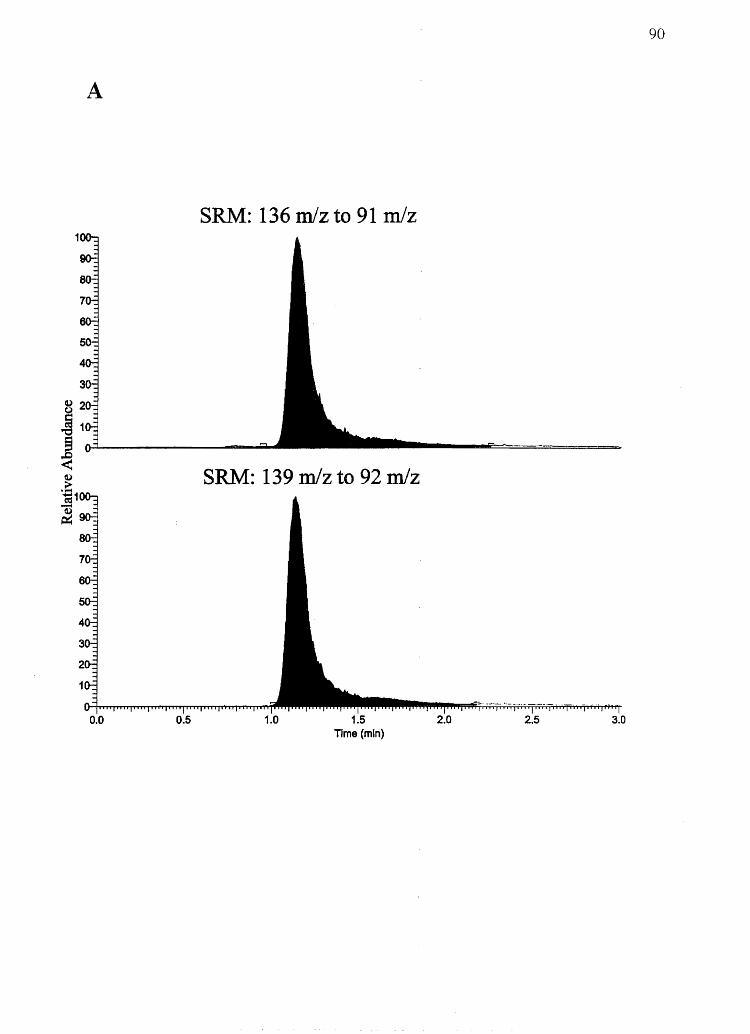
A
0.0 0.5
SRM: 136 mlz to 91 mlz
SRM: 139 mlz to 92 mlz
1.0 1.5 nme (min)
90
2.0 2.5 3.0
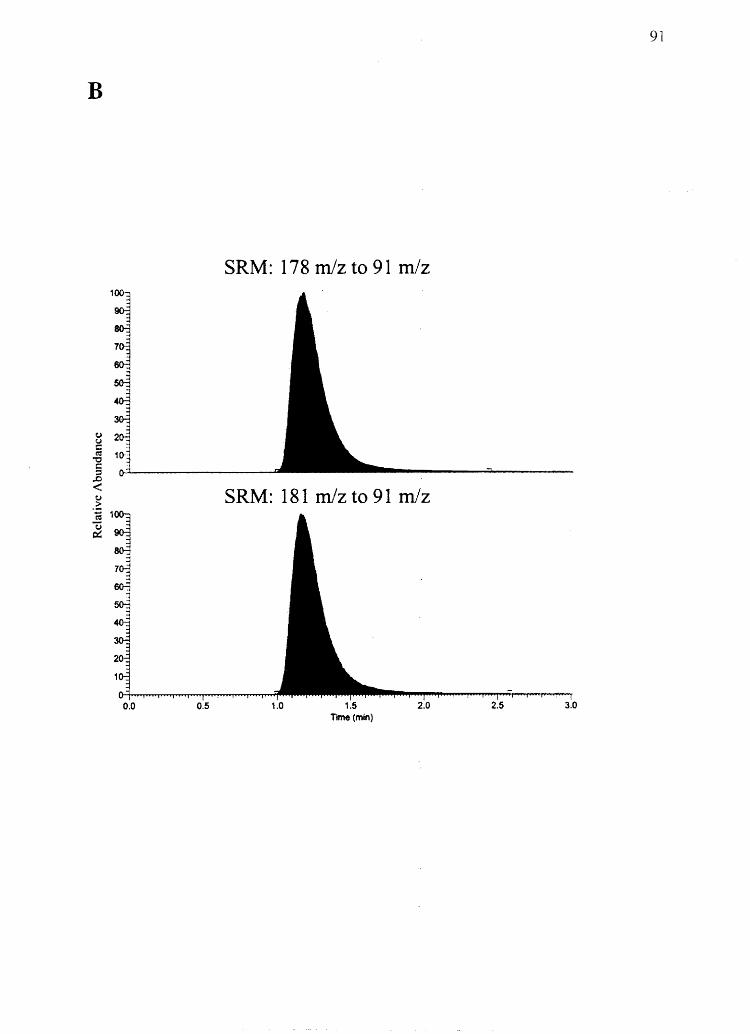
B
t) t)
a 1 "'0 §
.0
< t)
>
~ '3
0.0 0.5
SRM: 178 rnJz to 91 rnJz
SRM: 181 m/zto91 rnJz
1.0 1.5 Time (min)
2.0
91
2.5 3.0
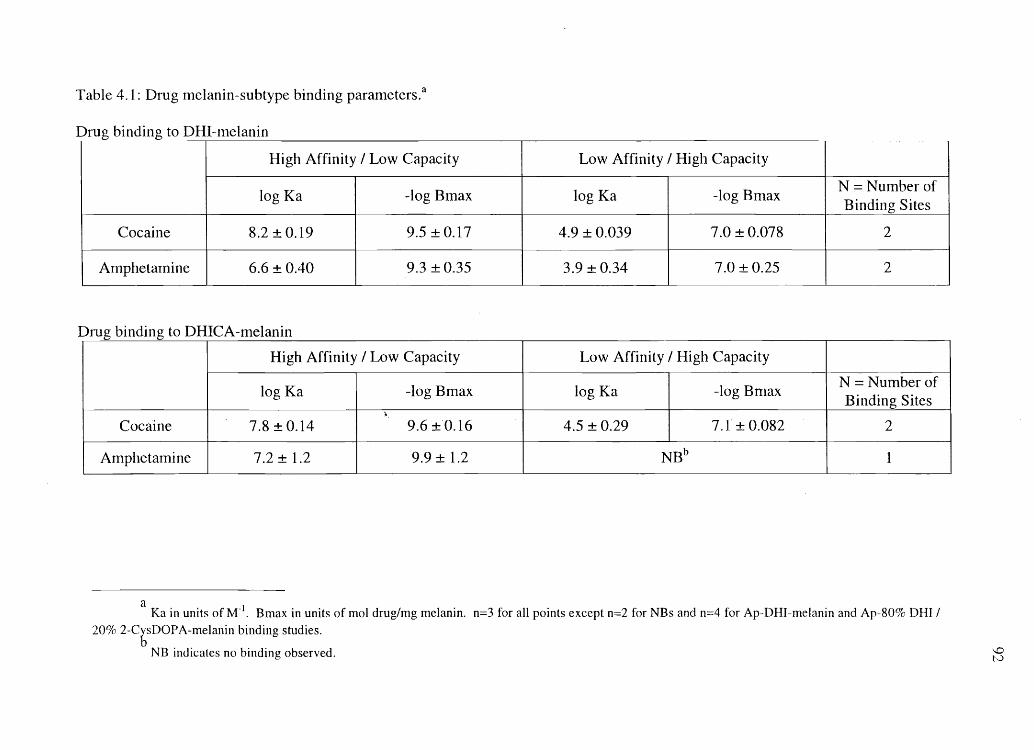
Table 4.1: Drug melanin-subtype binding parameters.a
Drug binding to DHI-melanin
High Affinity / Low Capacity Low Affinity / High Capacity
log Ka -log Blnax log Ka -log Brnax N = Number of Binding Sites
Cocaine 8.2±0.19 9.5 ± 0.17 4.9 ± 0.039 7.0 ± 0.078 2
Amphetamine 6.6 ± 0.40 9.3 ± 0.35 3.9 ± 0.34 7.0 ± 0.25 2
Drug binding to DHICA-melanin
High Affinity / Low Capacity Low Affinity / High Capacity
log Ka -log Bmax log Ka -log Bnlax N = Number of Binding Sites
.. Cocaine 7.8 ± 0.14 9.6 ±"0.16 4.5 ± 0.29 7.1 ± 0.082 2
Amphetamine 7.2 ± 1.2 9.9 ± 1.2 NBb 1
a Ka in units of M- 1
. Bmax in units of mol drug/mg melanin. n=3 for all points except n=2 for NBs and n=4 for Ap-DHI-melanin and Ap-80% DIU /
20% 2-CbsDOP A-melanin binding studies.
NB indicates no binding observed.
!
\0 N
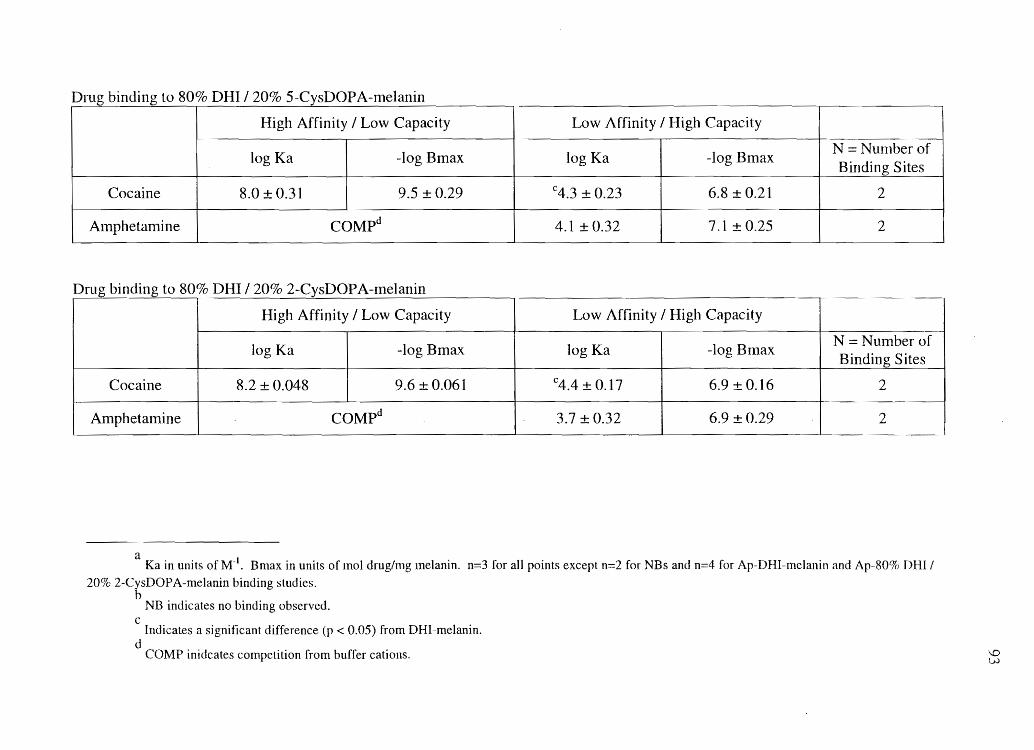
Drug binding to 80% DHI/ 200/0 5-CvsDOPA ~ '"
High Affinity / Low Capacity Low Affinity / High Capacity
logKa -log Bmax logKa -log Bmax N = Nurnber of BindtnQ" Sites
Cocaine 8.0 ± 0.31 9.5 ± 0.29 c4.3 ± 0.23 6.8 ± 0.21 2
Amphetamine COMpd 4.1 ± 0.32 7.1 ± 0.25 2
Drug binding to 80% DB! /20% 2-CysDOPA-rnelanin
High Affinity / Low Capacity Low Affinity / High Capacity
log Ka -log Bmax log Ka -log Brnax N = Number of Binding Sites
Cocaine 8.2 ± 0.048 9.6 ± 0.061 c4.4 ± 0.17 6.9 ± 0.16 2
Amphetamine COMpd 3.7 ± 0.32 6.9 ±0.29 2
a Ka in units of M-1
• Bmax in units of mol drug/mg melanin. n=3 for all points except n=2 for NBs and n=4 for Ap-DHI-melanin and Ap-80% DRI I
20% 2-CbsDOPA-melanin binding studies.
NB indicates no binding observed. c
Indicates a significant difference (p < 0.05) from DHI-melanin. d
COMP inidcates competition from buffer cations.
I
\0 w
94
DHIJ2-CysDOPA, and 5-CysDOPA melanins, only cocaine and amphetamine were
found to bind to melanins. BE and N-AcAp did not-bind to any of the melanins in this
study. In addition, cocaine and amphetamine were found not to bind to the 5-CysDOPA
melanin (when APS was used as a measure of background binding, data not shown). As
a positive control for the APS-linked 5-CysDOPA pheomelanin binding studies,
DOPA-derived melanin was linked to the APS solid phase and found to bind cocaine
with similar characteristics as "free" L-DOPA melanin.
For most of the (tested) drug-melanin binding interactions, there appeared to be
two different binding sites; a high affinityllow capacity binding site and a low
affinity/high capacity binding site. The concave nature of Scatchard plots derived from
binding data demonstrated this to be the case. A representative Scatchard plot for
cocaine binding to DHI-melanin is provided in Figure 4.3. Note that a group of data
points appears to run along the y-axis and another group appears to run more parallel
with the x-axis. The former section represents the high affinityllow capacity binding site
(Bmax and Ka values were determined by the x-intercept and (negative) slope of the
section, respectively), while the latter section represents the low affinity/high capacity
binding site. Because linearized (double reciprocal) equations and their associated plots
tend to skew the relative error of the smallest plot values by disproportionately relying
upon them as the major determinants of plot slope and intercept values, Bmax and Ka
values for the low affinity/high capacity binding sites (a region defined by higher
concentration data points) were determined through nonlinear least squares regression
analysis as discussed above and demonstrated in Figure 4.4.
Figure 4.3 Scatchard plot for cocaine binding to DHI-melanin. Two linear sections are
present, indicating two different types of binding sites. Error bars indicate standard
deviation. N = 3.
95
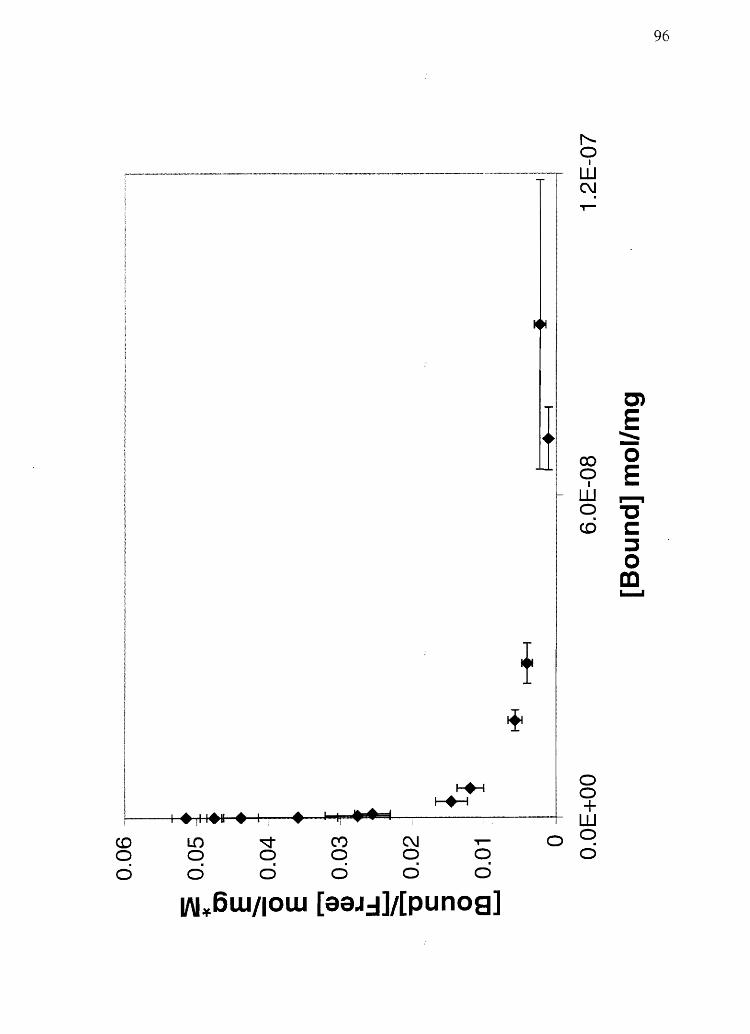
t-+-1 I-+-f
CD LO ~ ('t) C\J .,.... 0 0 0 0 0 0 . 0 0 0 0 0 0
1I\I.6w/IOW [aaJ.:I]/[pu n08]
I
0
""" o I
W C\J .,....
a:> 0
I
ill 0 CD
0 0 + W 0 0
96
en E .......... -0 E ,...... -c c ::J 0 rn ......
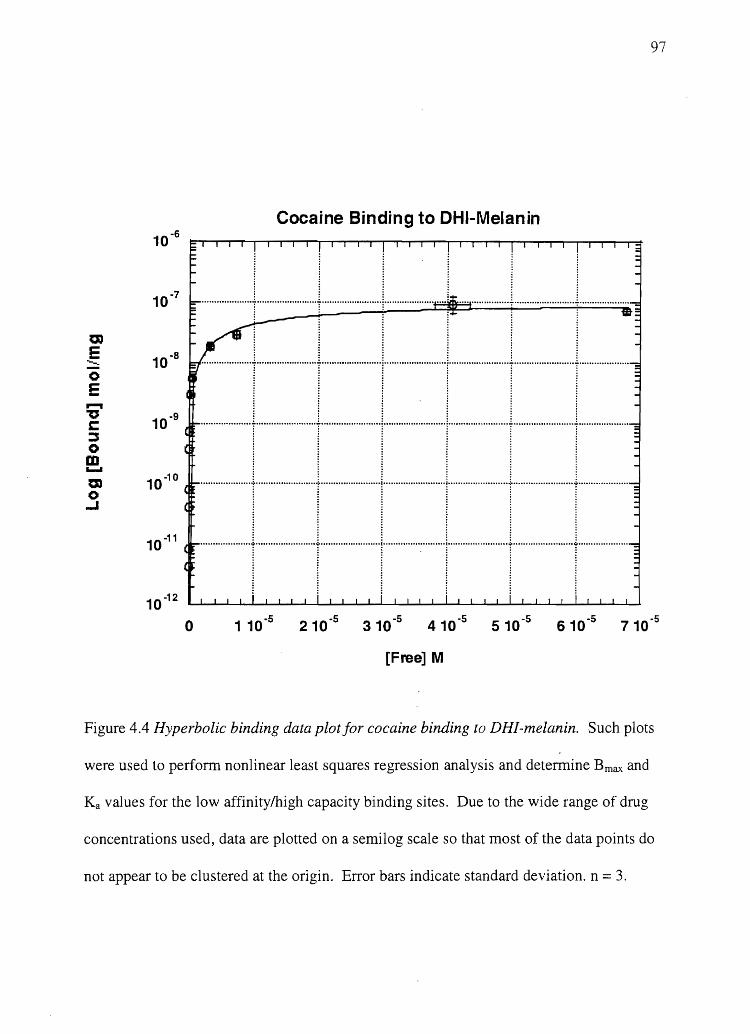
m E
::::;;; o E ...... "0 £: ::s o at ..... m o ..J
10-10
10.12
o
97
Cocaine Binding to DHI-Melanin
. . .................... "':' .............. '"' ........... ':" ..................... .
····················t···· .. ···················t········ ················~ .. ·"················'····f········"···············t············· .. · .. ····· ... ··t······ .... ····· .. · ...... l l 1 1 1 1
.................. ..l. ..................... ..1. ..................... ..1. ...................... ..1 ..................... ..1. ....................... L ............... . I I ! I ! !
···················r·····················r······················I························r···················r .. ················· .. r··················
···················r·····················r·····················T······················r .. ··················r······················r·················
iii ! 1 ! 1 10.5
[Free] M
Figure 4.4 Hyperbolic binding data plot for cocaine binding to DHI-melanin. Such plots
were used to perform nonlinear least squares regression analysis and determine Bmax and
Ka values for the low affinity/high capacity binding sites. Due to the wide range of drug
concentrations used, data are plotted on a semilog scale so that most of the data points do
not appear to be clustered at the origin. Error bars indicate standard deviation. n = 3.
98
As shown in Table 4.1, there were relatively few significant differences in the
binding parameters for a given drug to the different melanin sUbtypes. The major
difference was that none of the drugs that bound to eumelanins and mixed eu
Ipheomelanins bound to pure (APS linked) pheomelanin. A direct comparison of Ka
values between drugs is not legitimate due to the fact that different buffer systems were
used. Ka data are not directly comparable because different buffer cations may compete
differently for melanin binding sites and thus alter the Ka values that may have been
observed if the binding studies had been conducted in identical buffer systems.
Comparison of binding parameters between cocaine .and amphetamine analogs, however,
was not a goal of this study-as this was done previously for cocaine and amphetamine
(55). Except in cases where binding data could not be assessed for amphetamine, Bmax
values for cocaine and amphetamine were similar (Table 4.1). This is in agreement with
Shimada and co-worker's data (55).
Competition for melanin binding from buffer cations, as indicated by a convex
Scatchard plot (51) (Figure 4.5), was found to occur for amphetamine binding to mixed
eu-/pheomelanins, but not to pure eumelanins. When binding experiments were
conducted in the absence of buffer, the apparent competition from buffer cations was
eliminated and a concave Scatchard plot was demonstrated. The only other significant
difference between melanins was the lower binding affinity of cocaine to the low
affinity/high capacity binding site of the mixed eu-/pheomelanins compared to the
analogous site on pure eumelanins (Student's t-test, p < 0.05).
Noncovalent amphetamine and cocaine adducts with oxidized catechol, reduced
catechol, deprotonated phthalic acid, and 3-methylindole were searched for by tandem
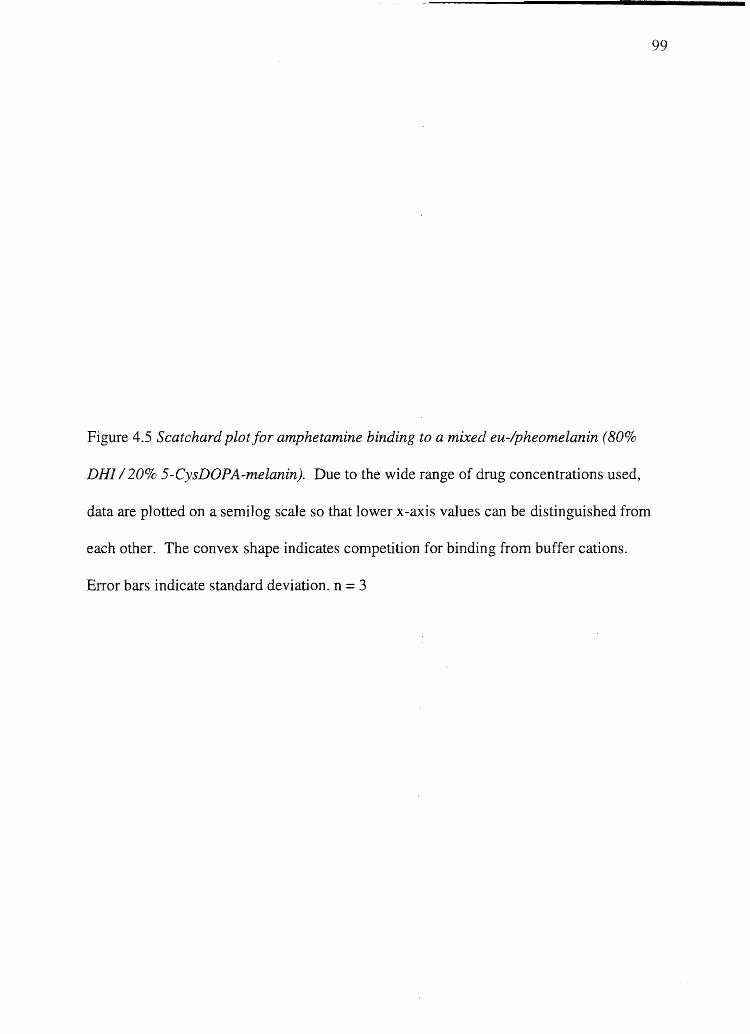
Figure 4.5 Scatchard plot for amphetamine binding to a mixed eu-Ipheomelanin (80%
DHI I 20% 5-CysDOPA-melanin). Due to the wide range of drug concentrations used,
data are plotted on a semilog scale so that lower x-axis values can be distinguished from
each other. The convex shape indicates competition for binding from buffer cations.
Error bars indicate standard deviation. n = 3
99
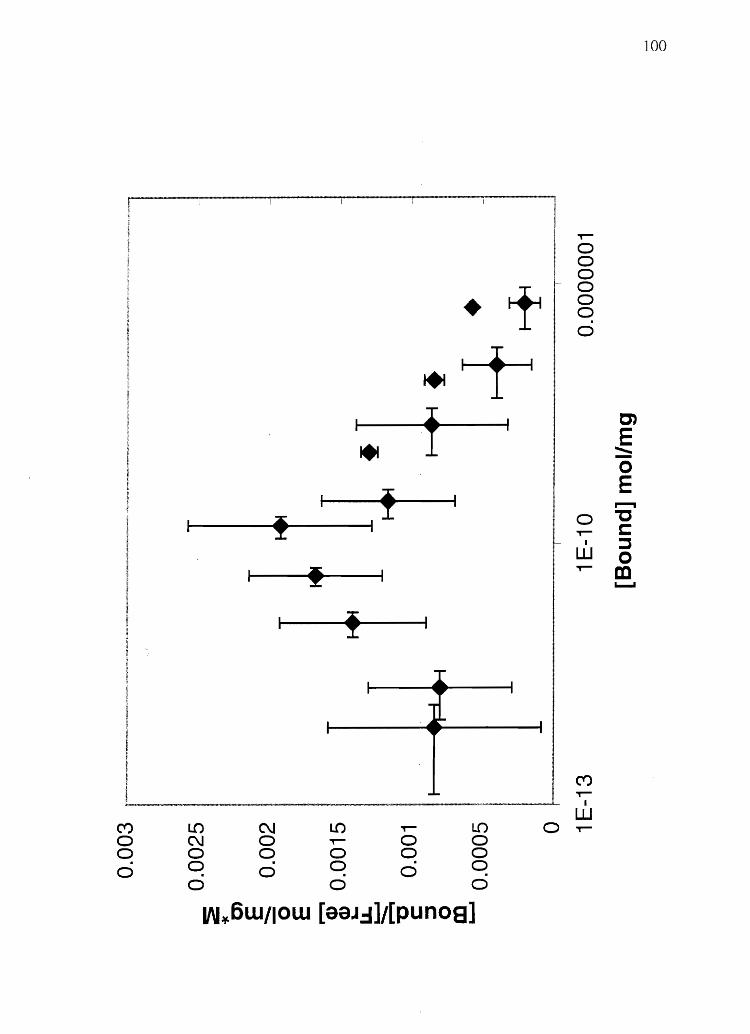
100
i I I i
,.-0 0 0
t !-- 0
+ 0 0 . 0
I+t ~ f C)
ttl E ::::: 0
I' E r-"I
! 0 "'C ,.- t:
~ I ::J W 0
t ,.-CD ........
! .. ~
I .41 ... I I "'llllJI"'" I
--I I I I
(V)
-- ,.-I
W Ct) LO C\J LO ,.- L.() 0 ,.-0 C\J 0 ,.- 0 0 0 0 0 0 0 0
0 0 . 0 0 0 0 0 0 0
WJf.6w/IOW [aaJ.:I]/[punos]
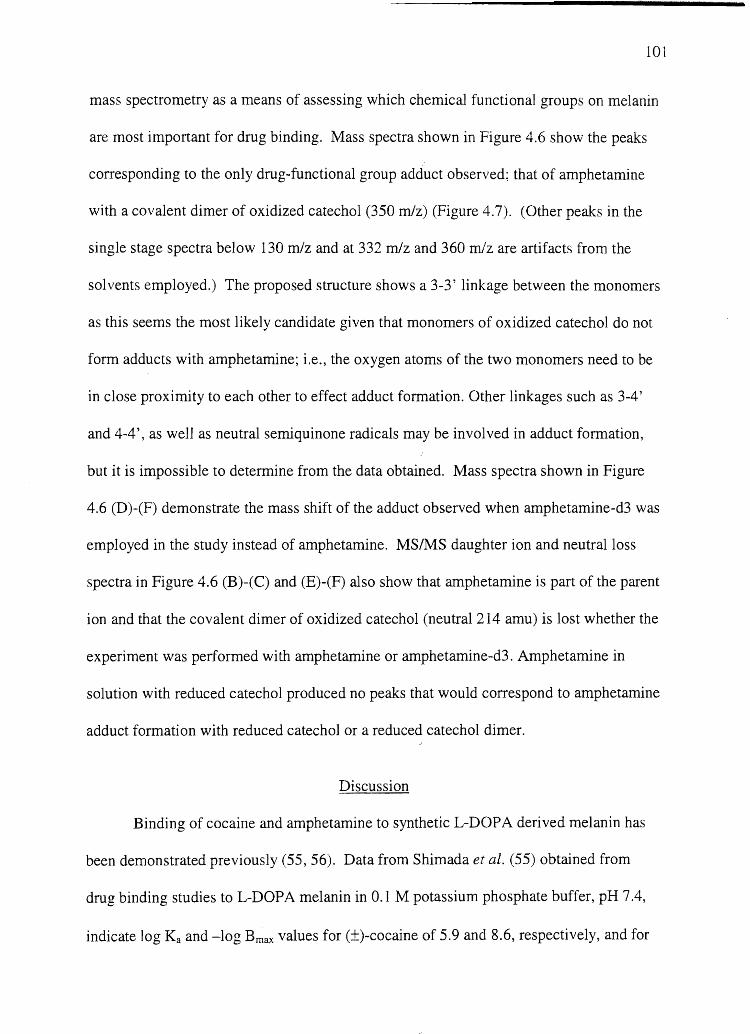
101
mass spectrometry as a means of assessing which chemical functional groups on melanin
are most important for drug binding. Mass spectra shown in Figure 4.6 show the peaks
corresponding to the only drug-functional group adduct observed; that of amphetamine
with a covalent dimer of oxidized catechol (350 mlz) (Figure 4.7). (Other peaks in the
single stage spectra below 130 mlz and at 332 mlz and 360 mlz are artifacts from the
solvents employed.) The proposed structure shows a 3-3' linkage between the monomers
as this seems the most likely candidate given that monon1ers of oxidized catechol do not
form adducts with amphetamine; i.e., the oxygen atoms of the two monomers need to be
in close proximity to each other to effect adduct formation. Other linkages such as 3-4'
and 4-4', as well as neutral semiquinone radicals may be involved in adduct formation,
but it is impossible to determine from the data obtained. Mass spectra shown in Figure
4.6 (D)-(F) demonstrate the mass shift of the adduct observed when amphetamine-d3 was
employed in the study instead of amphetamine. MS/MS daughter ion and neutral loss
spectra in Figure 4.6 (B)-(C) and (E)-(F) also show that amphetamine is part of the parent
ion and that the covalent dimer of oxidized catechol (neutral 214 amu) is lost whether the
experiment was performed with amphetamine or amphetamine-d3. Amphetamine in
solution with reduced catechol produced no peaks that would correspond to amphetamine
adduct formation with reduced catechol or a reduced catechol dimer.
Discussion
Binding of cocaine and amphetamine to synthetic L-DOPA derived melanin has
been demonstrated previously (55, 56). Data from Shimada et at. (55) obtained from
drug binding studies to L-DOPA melanin in 0.1 M potassium phosphate buffer, pH 7.4,
indicate log Ka and -log Bmax values for (±)-cocaine of 5.9 and 8.6, respectively, and for
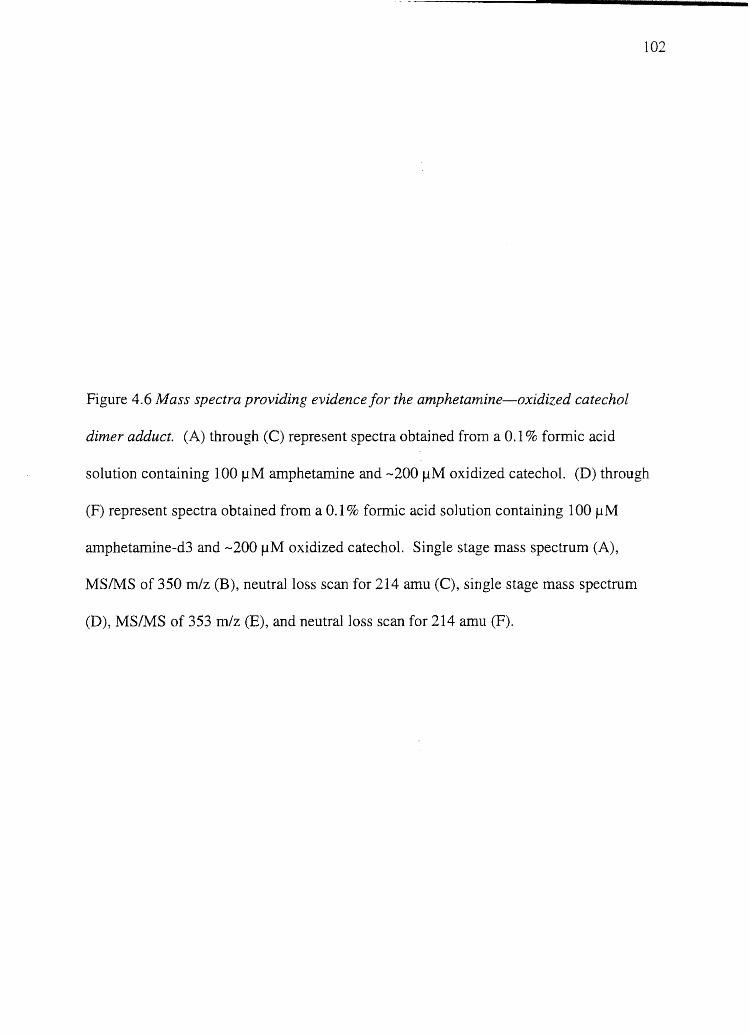
102
Figure 4.6 Mass spectra providing evidence for the amphetamine-oxidized catechol
dimer adduct. (A) through (C) represent spectra obtained from a 0.1 % formic acid
solution containing 100 flM amphetamine and -200 flM oxidized catechol. (D) through
(F) represent spectra obtained from a 0.1 % formic acid solution containing 100 JlM
amphetamine-d3 and -200 flM oxidized catechol. Single stage mass spectrum (A),
MSIMS of 350 rnJz (B), neutral loss scan for 214 amu (C), single stage mass spectrum
(D), MSIMS of 353 rnJz (E), and neutral loss scan for 214 amu (F).
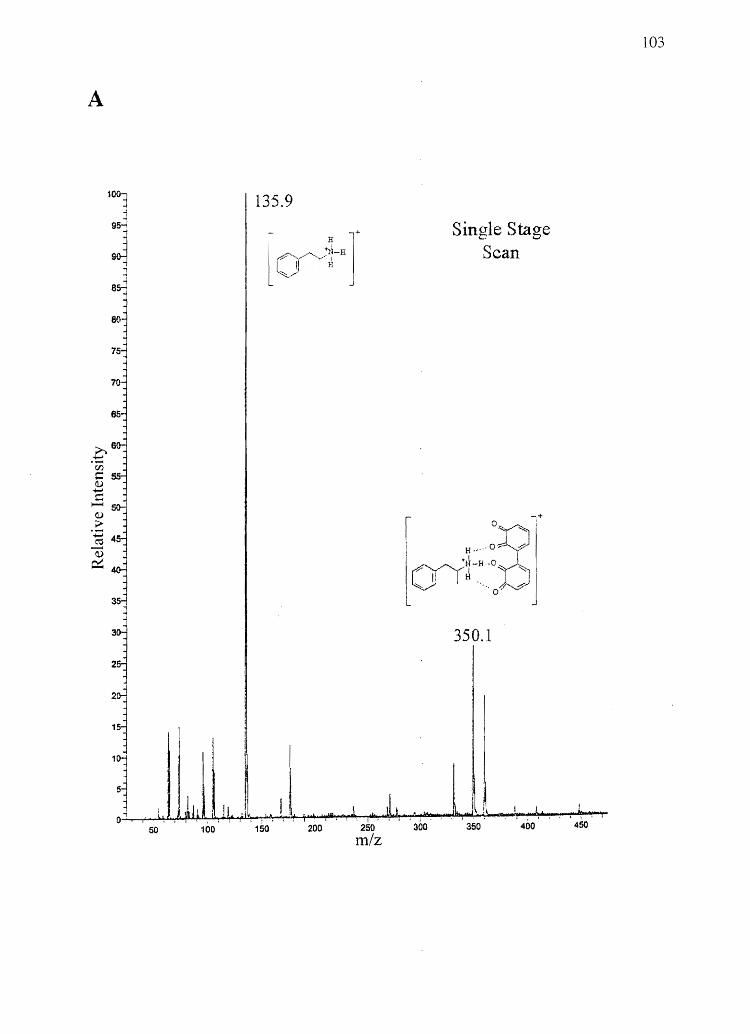
A
135.9
150 200 250
nl/Z
Single Stage Scan
+
350.1
350
103
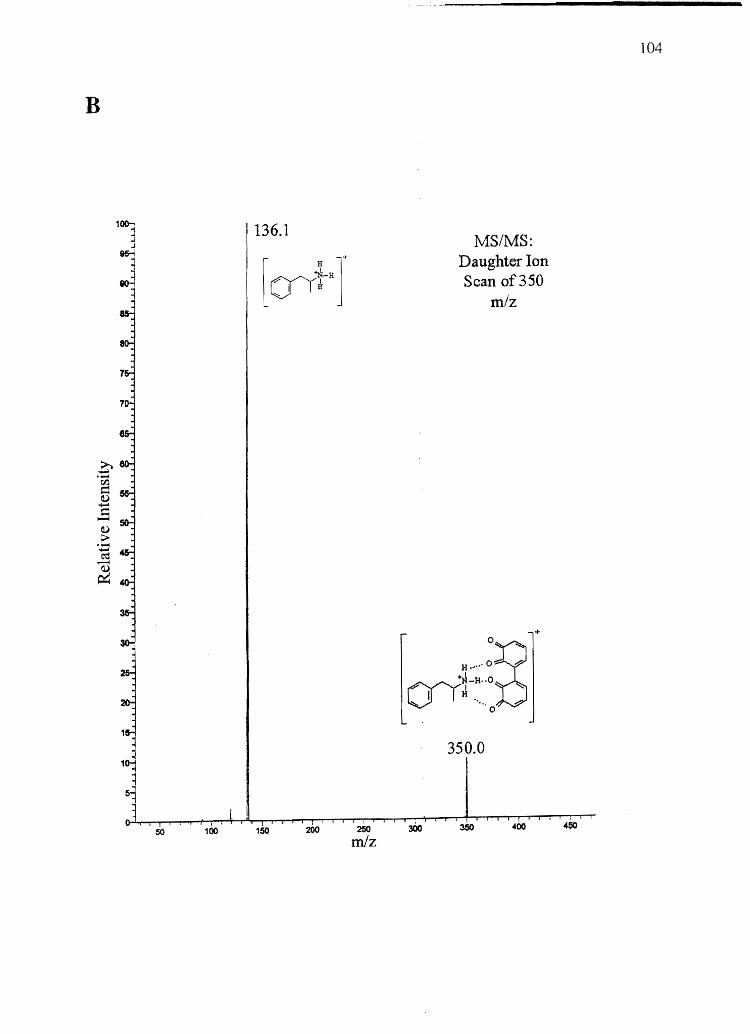
B
1~ .l
136.1 J
as...; '1
[ ()Ii-or "'I
J ~
50 200 250
m/z
MSIMS: Daughter Ion Scan of350
m/z
+
350.0
104
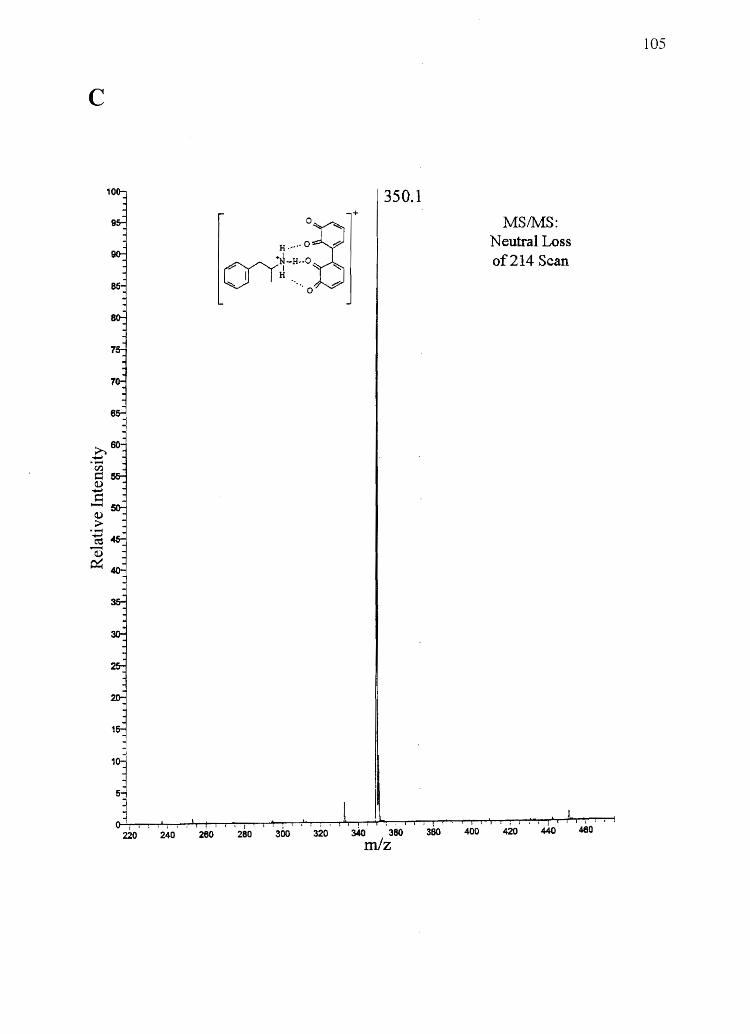
c
350.1 +
220 240 21JO . 300 320 340 380 380 . 400
mlz
MSI1vfS: Neutral Loss of214 Scan
I ' •
420 440 460
105
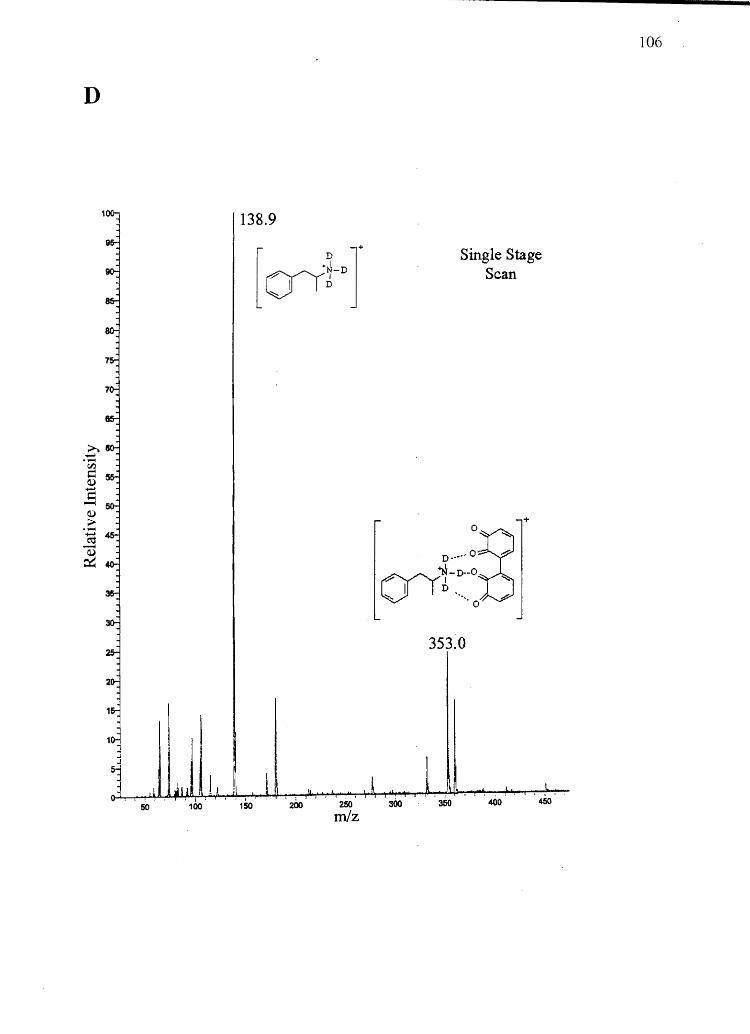
D
138.9
[ ()Y~-DJ
250 mJZ
Single Stage Scan
353.0
106

E
139.1
! ...
50
! I i 100
I i i ~ 1 i { i
150 i I
250 mJZ
300
MSIMS: Daughter Ion Scan of353
mJz
353.1
!, 350
I ' 400
107
• I
450
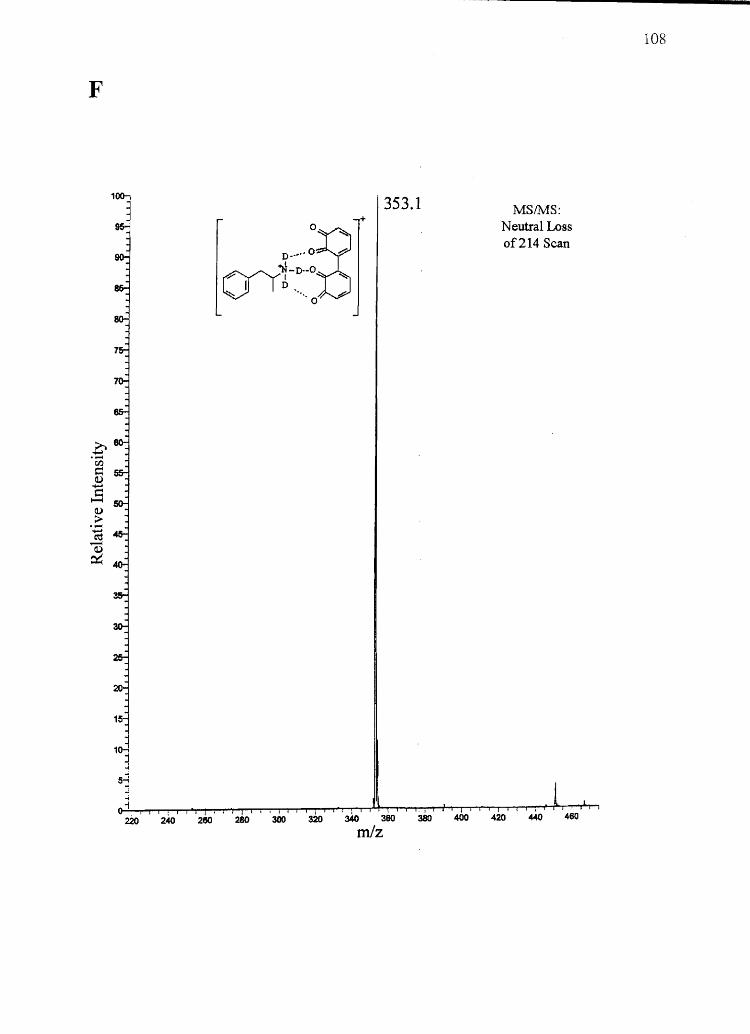
F
100,
280 280
353.1 +
, , 380
. , 340 360
mlz
MS/M:S: Neutral Loss of214 Scan
108
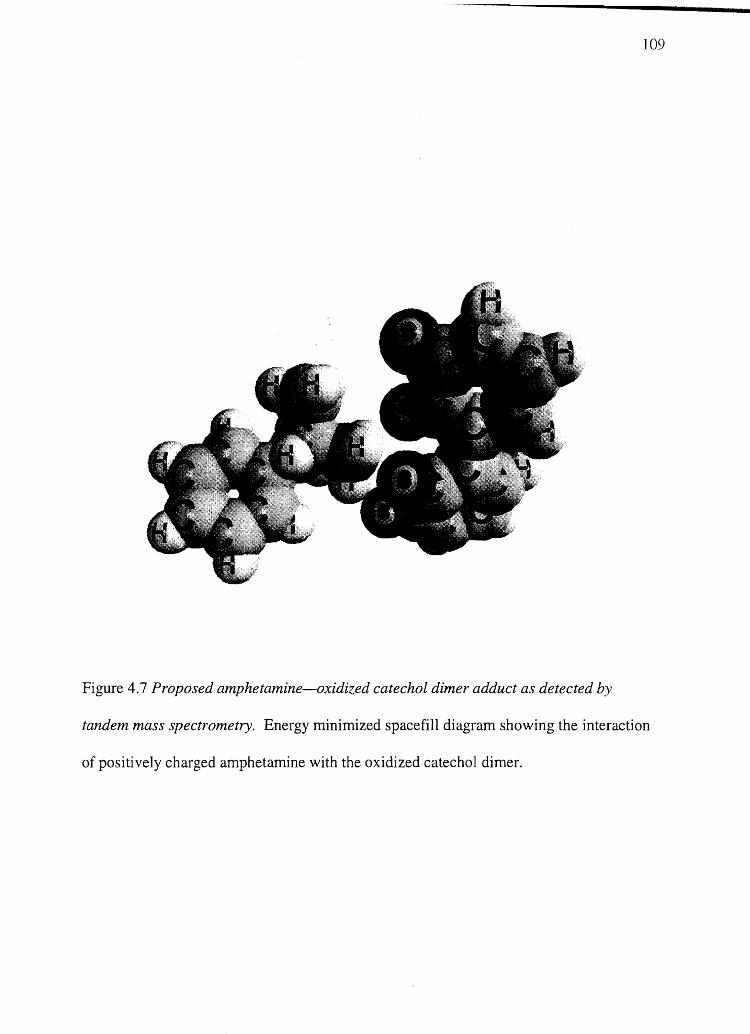
109
Figure 4.7 Proposed amphetamine-oxidized catechol dimer adduct as detected by
tandem mass spectrometry. Energy minimized spacefill diagram showing the interaction
of positively charged amphetamine with the oxidized catechol dimer.
110
(+)-amphetamine of 5.4 and 8.7, respectively. The data of Shimada et al. were obtained
through the use of double reciprocal plots, which only reveal binding data for the high
affinity/low capacity binding site. A direct comparison between their Ka data and ours is
not legitimate due to the fact that different buffer systems were used, but it can be seen
from Table 4.1 that their Bmax values are reasonably close to the values obtained in this
study. The greater ionic strength of their buffer system relative to ours, however,
suggests that they should observe lower apparent Ka values-which they did.
Because cocaine and amphetamine have previously been found to bind to
melanin, it was not surprising to find that these drugs bind to most of the melanin
SUbtypes in this study. The chemical congeners of cocaine and amphetamine, BE and N
AcAp, respectively, however, were found not to bind to any type of melanin at all. This
information provides clues as to what chemical features are important for drug-melanin
binding. The structural difference between cocaine and BE is a methyl ester vs. a
carboxylic acid. Based on suspected mechanisms of drug-melanin binding (51, 53), the
. electronic properties of a methyl ester are unlikely to be important for drug-melanin
binding. Rather, the positive charge on the nitrogen of cocaine (pKa 8.5) is most likely to
be responsible for the drug's binding to melanin. For BE, the introduction of a negative
charge in the same molecule could render the positively charged nitrogen much less
available for ionic binding with the negatively charged melanin polymer. In a similar
scenario, the acetyl group of N-AcAp makes the amphetamine molecule nonbasic and
thus not charged at physiologic pH. Again, it can be seen that the effective removal of a
positive charge renders the drug molecule unable to bind to melanin.
111
Assuming the importance of a positively charged drug molecule for binding to
melanin it is expected that the greater number of negatively charged atoms in the melanin
polymer, the more positively charged drug molecules would bind to it (i.e., Brnax should
increase). As stated in the introduction, a comparison of DHI and DHICA monomers
suggests that DHICA melanin should have a greatercarboxylic acid content (and thus
stronger anionic nature) than DHI melanin. This idea was confirmed by Novellino et al.
(95) when it was demonstrated that DHICA melanin produces twice as much CO2 as DHI
melanin upon acid catalyzed thermal decarboxylation of the melanin pigments. Thus it
was expected that DHICA melanin would have a larger capacity (Brnax) for binding a
given positively charged drug than DHI melanin. This was found not to be the case.
Reasons for this are not certain, but there are a several possibilities. First, it may be
possible that the carboxylic acid group is not responsible for cocaine or amphetamine
binding, which seems unlikely given the mechanistic evidence for ionic binding
interactions (51, 53). Second, a simple visual inspection (as well as visible wavelength
optical absorbance-data not shown) of the homogenized DHI and DHICA melanin
suspensions revealed that for a given mass/volume concentration of melanin in aqueous
suspension, DHI melanin has more surface area (is finer and less grainy) than DHICA
melanin. This may render a relatively significant portion of the carboxylic acid groups in
DHICA melanin unable to interact with solvent molecules and thus unable to bind to drug
present in solution.
Drug molecules seem to bind best if they are positively charged, regardless of
whether or not they have a hydrophobic region such as a phenyl group (compare
amphetamine and N-AcAp binding). In addition, a simple nickel (II) cation can display
112
the same complex (multi-site) binding characteristics as a structurally more complex drug
molecule (51). This study and those of others (51, 53) suggest that there must be two
separate sites on melanin that are capable of binding a positively charged ion or
molecule. It has been previously suggested that the ortho-semiquinone free radical
centers in melanin can bind doubly and triply charged cations forming chelate complexes
(83). This could account for one of the binding sites for N?+, but due to the fact that
nitrogen atoms within organic molecules cannot act as the guest of a ohelation complex,
it cannot account for the binding of drug molecules.
Tandem mass spectral analysis of a solution of amphetamine mixed with oxidized
catechol (Figure 4.6) strongly suggests that amphetamine can interact with the
orthoquinone groups on oxidized indolequinone units of melanin. Interestingly,
amphetamine was not found to complex with oxidized catechol monomers. This suggests
that melanin secondary structure may play an important role in drug-melanin binding.
This hypothesis is supported by the fact that cocaine did not form any adducts with
oxidized catechol as amphetamine did, even though cocaine also demonstrates biphasic
(two-site) binding to melanin. Molecular dynamics energy minimization experiments
using the ChemSite ChemDemo program with a bath temperature of 300 K, an
integration time step of 1 fs, total time of lOps, 100 equilibration steps, and non-bonded
interaction cutoff distance of loA show that the hydrogens attached to the primary amine
of amphetamine intercalate between the oxygens of the dimerized oxidized catechol
molecule and likely form three separate hydrogen bonds as depicted in Figure 4.7. The
fact that cocaine did not form adducts with oxidized catechol is consistent with this
model, because the positively charged tertiary amine of cocaine could not intimately
113
interact with the oxidized catechol dimer in the same manner as amphetamine due to
steric hindrance. Based on the data obtained in these studies in conjunction with the
investigations of others, it seems that the high affinity/low capacity binding site for basic
drugs with melanin arises from an interaction of the positively charged drug molecule
with appropriately shaped, electron dense, secondary structures of the melanin polymer.
Evidence that this may be the high affinity/low capacity binding site also comes from
Stepien and Wilczok (53) who demonstrated that adding a substantial am9unt of ethanol
(20-500/0) to a binding experiment selectively eliminates the high affinity/low capacity
binding site. The presence of an organic solvent capable of forming hydrogen bonds
could disrupt melanin secondary structure and compete with drug mokcules for hydrogen
bonding interactions with melanin. Evidence that a positive ionic charge on the drug
molecule is an important facet of the high affinity/low capacity binding site was
presented by Stepien and Wilczok (53) when it was shown that the binding affinity of this
site decreases in the presence of high concentrations' of sodium cations. In addition,
Larsson et al. (50) demonstrated the complete elimination of paraquat binding under very
acidic conditions. Extreme acidity could alter both the chemical nature and secondary
structure of melanin in addition to providing binding competition, completely obliterating
any significant drug-melanin interactions. In agreement with their observations, we were
able to completely eliminate amphetamine binding toDHI melanin in 1 M Hel (data not
shown). Thus, appropriately shaped, electron dense, melanin secondary structures within
the melanin polymer could account for the high affinity/low capacity drug-melanin
binding site.

114
Other evidence (51, 53) suggests that the other binding site can be accounted for
by an ionic interaction-an interaction between the numerous carboxylic acid groups on
melanin and positively charged drug molecules. Again, buffer cation competition for
binding (51, 53) shows that both binding sites are sensitive to the ionic charge state of the
drug molecule. Furthermore, using theoretical linear solvation energy relationships,
Lowrey et al. (61) derived an equation for drug-melanin interactions that supports a
charge transfer model. The fact that we were unable to observe drug-phthalic acid non
covalent adducts via mass spectrometry does not refute the carboxylic acid functional
groups of melanin as pp.rticipants in drug binding. Such interactions may be too weak to
observe using this technique.
Finally, the participation of van der Waals interaction in some drug-melanin
binding, however, cannot be discounted. Larsson and Tjalve (51) showed that the
binding of chlorpromazine and chloroquine could not be completely depressed even in 2
M Hel. Under these acidic conditions, all negative charges on melanin would be
eliminated. Interestingly, Larsson and Tjalve demonstrated two binding sites for nickel
(IT) and paraquat, and their evidence suggested the presence of three binding sites for
chlorpromazine and chloroquine. Thus, for certain (possibly more planar and
hydrophobic) compounds, van der Waals binding interactions with melanin may occur.
Based on structural studies, there are far more carboxylic acid groups present on
melanin than there are orthoquinone or special secondary structure sites available for
interacting with drug molecules (95, 96). This fact supports our assertion that the high
affinity/low capacity binding site is probably derived from appropriately shaped, electron
dense, mel~nin secondary structures within the melanin polymer, and the low
115
affinitylhigh capacity binding site consists of an ionic interaction between negatively
charged carboxylic acid groups on melanin and positively charged drug molecules. In
theory, it is possible for multiple hydrogen bonds to be stronger than single ionic bonds,
given that hydrogen bonds range in energy from 10-40 kllmol and ionic bonds range in
energy from 100-1000 kllmol (175). It must be kept in mind, however, that the sites
discussed above for the binding of basic drugs to melanin have not been absolutely
proven. They still remain speculative based on the binding observations of these and
other studies.
The complete lack of cocaine and amphetamine binding to pure (APS linked)
pheomelanin was an unexpected result, especially given the findings of Mars and Larsson
(57) showing that synthetic pheomelanin is capable of binding a number of drugs. The
apparent contradiction between their study and ours may be mostly resolved by two
pieces of information. First, their pheomelanin may have contained a significant number
of eumelanic monomer units due to the fact that L-DOPA in the presence of cysteine was
used as the starting material for pheomelanin synthesis, and they did not obtain
pheomelanin with a 38% w/w concentration of cysteine (the theoretical maximum for a
1:1 molar cysteine to L-DOPA incorporation ratio). The 1:1 cysteine to L-DOPA molar
ratio was built-in to our pheomelanin due to the fact that the polymerization reaction was
started with 5-CysDOPA. The former pheomelanin is probably a more biologically
relevant pheomelanin, but we were interested in defining the drug binding properties of a
theoretically "pure" pheomelanin, for which we believe our melanin is a more accurate
model. Second, at least one carboxylic acid group from each purely pheomelanin
polymer was converted to an amide for the sake of linking the pheomelanin polymer to
116
the APS solid phase. The elimination of carboxylic acid group(s) from the pheomelanin
polymer is expected to decrease the ability of the polymer to bind basic drugs. If the
pheomelanin polymer was excessively large and was known to be linked to the APS solid
phase by only one amide bond, then the binding of drugs to pheomelanin may not have
been inhibited by the attachment of pheomelanin to APS solid phase. The pheomelanin
polymers synthesized for this study, however, are suspected to be no bigger than trimers
of benzothiazine units. This suspicion comes from the fact that the pure pheomelanin is
soluble in slightly basic aqueous medium and n1atrix assisted laser desorption ionization
mass spectrometry (MALDI-MS) analysis of the pheomelanin indicates molecular
weights no bigger than would be formed by trimers (data not shown).
With respect to drug incorporation into hair, it is intriguing to note that cocaine
and amphetamine bind to melanins, but BE and N-AcAp do not. Cocaine and
amphetamine have both been shown to have a hair color bias (42, 66), that is, in a black
and white animal model more of both of these drugs were found in black hair than in
white hair on the same animal. BE and N-AcAp both minimally incorporate into hair,
regardless of their high plasma area under the concentration vs. time curves (AVCs) (41,
66) and N-AcAp has been shown not to exhibit a hair color bias (42). If drug-melanin
binding is responsible for observed hair color biases, which appears to be the case since
the only difference between black and white hair on -the same animal is the presence of
pigment in some hairs and the lack of it in others, then it may be possible to correct for
this bias by normalizing drug concentrations found in hair by the eumelanin content of
that hair. Evidence that this may be an appropriate correction comes from a study by
Rollins et al. (126) where interindividual differences in codeine concentrations in hair
could be mostly accounted for by the eumelanin content of the hair.
117
CHAPTERS
INFLUX AND EFFLUX OF AMPHETAMINE, N-ACETYLAMPHETAMINE,
COCAINE, AND BENZOYLECGONINE IN KERATINOCYTES,
PIGMENTED MELANOCYTES, AND NONPIGMENTED
MELANOCYTES
Testing for drugs of abuse in hair has become a widely accepted alternative to
traditional urinalysis (112, 176). Unfortunately, there are still a few potentially
confounding variables involved in hair testing. Such variables include the role of
environmental contamination in hair testing and adequacy of laboratory wash procedures
designed to remove externally deposited drug, the role(s) of bleaching and/or other
chemical treatments on the outcome of a hair test, and the role of hair pigment in drug
incorporation into hair. The studies described here focus on two major aspects of the
latter variable; the role of hair pigmentation in producing a hair color bias in drug
incorporation into hair (which has been observed for many basic drugs including cocaine
(66, 151), codeine (65, 152), amphetamine (42), phencyclidine (69), stanozolol (68), and
nicotine (40)) and the fundamental physiological issue of cellular selectivity in hair cell
drug uptake.
Despite the widespread utilization of hair as a matrix for drug detection, hair color
bias (defined as the greater incorporation of a drug into darker hair over lighter hair,
given equal blood plasma pharmacokinetics) still presents a major obstacle to fair hair

119
testing. In theory, given the same dose and route of administration, a dark haired
individual may produce a positive drug test and a light haired individual may produce a
negative drug test, if the cutoff concentration used to define a positive test happens to be
established between the concentrations observed in the two specimens. Black hair
pigment, or eumelanin, is a polyanionic indolequinone based polymer that has the
capacity to bind positively charged (usually basic) drug molecules through what are
thought to be both ionic and non-ionic interactions (30, 51-53, 55, 64-66, 69, 75, 76, 79,
153). This binding, and thus accumulation of the drug on melanin, is thought to produce
the hair color bias. According to this theory, neutral or acidic drugs that do not bind
melanin should not exhibit a hair color bias. This has been documented in vivo for the
neutral drug N-AcAp (42, 76). Additional support for this theory is provided by
phenobarbital, an acidic drug that does not show a hair color bias (65). Further evidence
from carbamazepine, a basic drug with a low pKa (7.0; predominately uncharged at
physiologic pH), also helps bolster this theory (74). ·The studies presented below
employed the basic drug amphetamine and its nonbasic analog N-AcAp to examine the
phenomenon of hair color bias at the cellular level by studying uptake and efflux into and
out of pigmented melanocytes (PM) and nonpigmented melanocytes (NPM).
Amphetamine and cocaine are more highly incorporated into rat hair than BE and
N-AcAp, respectively (41, 42, 66) regardless of whether hair is pigmented or non
pigmented. From the traditional pharmacologic point of view, based on the idea that
passive diffusion plays a large role in the cellular uptake of small molecule xenobiotics
and that nonpolar, uncharged molecules can diffuse into cells much more readily than
their polar, charged counterparts, these data are counterintuitive and unexpected.
120
Bewilderment increases when drug plasma concentrations are taken into account: Given
equal dosing in dark agouti rats, the plasma area under the concentration vs. time curve
(AUC) is about four times greater for N-AcAp than it is for amphetamine (41) and that of
BE is about twice as large as cocaine (66}. There are at least two possible explanations
for this seemingly conflicting data. First, N -AcAp and BE are highly protein bound and
essentially unable to be taken into hair cells, or second, the hair cells have a transport
system in place that permits the selective uptake of amphetamine and cocaine, but the
relative exclusion of N-AcAp and BE. The former possibility was investigated and
excluded in these studies-see Discussion for further details on this matter.
Amphetamine and N-AcAp, and cocaine and BE (Figures 3.1 and 4.1) were
employed as model basic (and extensively incorporating) and nonbasich
(and low-level
incorporating) pairs of drugs, respectively, to further document the roles of drug basicity
in hair color bias and cellular selectivity in hair cell drug transport. Influx and efflux of
amphetamine and N-AcAp were examined in kerati~ocytes, pigmented melanocytes
(PM), and nonpigmented melanocytes (NPM) and influx and efflux of cocaine and BE
were examined in PM and NPM. By sheer number, keratinocytes are the major cell type
that makes up hair. In fact, under normal circumstances melanocytes merely transfer
their melanin granules to keratinocytes prior to the movement of keratinocytes up into the
growing hair shaft (93, 98-102). Thus, because of their major role in hair construction,
keratinocytes were initially included in these studies along with the PM and NPM.
h BE is, technically, a basic drug. However, it also contains an acidic functional group and thus is a
zwitterion and neutral at physiologic pH. With regard to hair incorporation and melanin binding, BE behaves relative to cocaine much as N-AcAp does to amphetamine. This may be due to formation of an intramolecular five-membered-ring ionic bond which could decrease BE's capacity to behave as a typical basic drug.
Materials and Methods
Chemicals and Reagents
N-AcAp and N-AcAp-d3 were synthesized from d-amphetamine sulfate
according to the method of Halmekoski and Saarinen (164) using acetic anhydride and
deuterated acetic anhydride, respectively. Purity was verified by mass spectrometry
and/or NMR. d-Amphetamine sulfate, d-amphetamine-d3,
1-( -)-cocaine hydrochloride, benzoylecgonine tetrahydrate sulfate, phorbol 12-myristate
I3-acetate (TPA), glutamine, phenol red, phenylthiocarbamide were purchased from
Sigma (St. Louis, MO). Cocaine-d8 (100 J.Lg/mL) was obtained from High Standard
Products (Inglewood, CA), and BE-d3 (100 J.Lg/mL) was obtained from Cerriliant
(Austin, TX). Keratinocyte Growth Media (KGM) was purchased from Clonetics, a
division of Cambrex (East Rutherford, NJ). RPMI 1640 cell culture media,
penicillin/streptomycin, and fetal calf serum were purchased from Life
TechnologieslInvitrogen (New York, NY). A bicinchoninic acid protein assay kit was
purchased from Pierce (Rockford, IL). Centrifree ultrafiltration devices with Ultracel
YMT membranes for performing plasma protein binding studies were purchased from
Millipore (Bedford, MA). Bond Elute Certify solid phase extraction cartridges were
obtained from Varian (Harbor City, CA). All other reagents were purchased in the
highest purity form available.
Cell Lines and Culture
121
Cynthia Jorgensen and Dr. Gerald Krueger from the Department of Dermatology
at the University of Utah kindly provided keratinocytes. The keratinocytes had been
isolated from neonatal foreskins and immortalized as described previously (177).
Keratinocytes were routinely cultured in KGM. Melan-a melanocytes, isolated from
C57BL/6 melanoblasts as described elsewhere (178), were generously donated by Simon
Hill and Dr. Dorothy Bennett of the Department of Anatomy, St. George's Hospital
Medical School, London. Melan-a melanocytes were cultured in supplemented RPMI
1640 media containing penicillin (100,000 UIL), streptomycin (100 mglL), glutamine (2
mM), TPA (200 nM), extra phenol red (5 Jlg/mL), 10 mM HCI, and 10% fetal bovine
serum in a humidified 5% CO2 atmosphere at 37DC.·· Melan-a cells were made nearly
amelanotic by culturing the cells in 200 JlM phenylthiocarbamide, a tyrosinase inhibitor,
for two to three passages before experimentation. Melanocytes were tested for
mycoplasn1a contamination through submission to Bionique Testing Laboratories, Inc.
(Saranac Lake, NY) and found to be negati ve for mycoplasma.
Influx Experiments
Drug influx experiments were carried out in standard 25 cm2 "T25" cell culture
flasks. Drugs were diluted into prewarmed cell culture media lacking serum. Culture
media was removed from the cells and 5 mL drug containing media was introduced and
kept on the cells for the desired time period at the desired temperature (usually in the
incubator at 37 DC). After the desired time had elapsed the media was quickly removed
by aspiration, and the cells were washed very rapidly three consecutive times with 5 mL
(per rinse) of ice-cold phosphate buffered saline (PBS). Cells were then dissolved in 2.5
mL of 0.1 M NaOH (for amphetamine and N-AcAp) or in 0.1 M potassium phosphate
buffer, pH 5.0 containing 1 % Triton X-100 (for cocaine and BE). Thirty microliters of
10 JlM deuterated drug was then added to the solution to serve as an internal standard for
quantitation. To ensure complete dissolution of the cells, flasks were scraped with a cell

scraper prior to transfer of the cell lysate to a silanized glass test tube for protein assay
1')", .. .J
and extraction (see Sample Preparation below). Cell viability was assessed for each drug
treatment via the trypan blue dye exclusion and cell counting assay. Viability was greater
than 90% for all treatments.
Efflux Experiments
The time required to establish equilibrium uptake was first determined with influx
experiments. For amphetamine and cocaine, equilibrium uptake was determined to be
well established by 30 min. Thus, to begin an efflux experiment, cells were pre-loaded
with drug for 30 min in the same manner as an influx experiment At 30 min elapsed
influx time, drug-containing media was removed and the cells were rinsed three times
with 5 mL of ice-cold PBS. Five n1illiliters of prewarmed serum free and drug free
media was then added to the cells and the cells were incubated at 37°C for a set efflux
time. When the set efflux time had elapsed, the media was collected and temporarily
placed in a plastic beaker. Cells were then rinsed three times with 5 mL ice-cold PBS
and set aside to be analyzed for the amount of drug remaining in the cells in the same
manner as the influx experiments as described above. At a convenient time within 2 hrs,
4.25 rnL of media collected from the efflux experiment was quantitatively transferred to a
silanized glass test tube to which was added 30 ~ of 10 JlM deuterated analog to serve
as an internal standard for quantitation.
Sample Preparation
Influx experiments. To normalize the amount of drug taken up by the cells in a
given flask for the number of cells in the flask, a bicinchoninic acid protein assay was
124
performed on 25 JlL of cell lysate to determine the amount of protein contained in the
flask. Protein assays were performed in duplicate. For keratinocytes, the protein assay
was performed directly on the celllysates. For melanocytes, melanin was first
precipitated by bringing 60 JlL of cell lysate to pH -5 (if necessary) with 10 JlL of 0.5 M
HCI, then spinning samples in a microcentrifuge at 4 °C for 15 min. Supernatant was
then directly analyzed for protein content.
For amphetamine and N-AcAp samples, 300 JlL of 2 M HCI was added to each
lysate to bring the pH to between 1 and 2 to completely denature any intact proteins.
Then 200 JlL of 3.1 M NaOH was added to bring the pH to 12-13. This was followed by
the addition of 200 JlL concentrated NH40H. Samples were then extracted by addition
of 5 mL of n-butyl chloride:chloroform (4: 1) to the lysate, mixing for 30 min,
centrifuging at 2000 rpm for 10 nlin, then removing the organic layer to a separate test
tube. Organic extracts were then dried under a gentle stream of air at < 30°C and
reconstituted in 100 JlL of 0.1 % formic acid for injection onto the LCIMS/MS
instrument.
Cocaine and BE samples were extracted with Bond Elute Certify solid phase
extraction cartridges as follows: Columns were preconditioned with 2 mL methanol
followed by 2 mL 0.1 M potassium phosphate buffer, pH 6.0. Following sample
application, columns were rinsed with 6 mL water, 3 mL 0.1 M HCI, and 9 mL methanol
after which columns were dried for 5 min. Cocaine and BE were eluted from the
columns with 2 mL of fresh methylene chloride: isopropanol (80:20) containing 2%
concentrated ammonium hydroxide. Samples were evaporated under a gentle stream of
air at less than 40°C then reconstituted in 100 JlL 0.1 % formic acid for LCIMSIMS
125
analysis. Daily standard curve and quality control samples for all drugs were extracted in
the appropriate analogous manner.
Efflux experiments. Serum free cell culture media samples from efflux
experiments were extracted in the same manner as influx cell lysate samples, but 300 JlL
of 3.1 M NaOH was required to raise the pH to 12-13 prior to liquid-liquid extraction.
The pH of cocaine and BE containing cell culture media efflux samples was adjusted to
-5 with HCI prior to solid phase extraction.
Plasma protein binding experiments. Fresh human serum (BE) or plasma (N
AcAp) was obtained from healthy, drug-free volunteers after an overnight fast. To 485
JlL serum or plasma was added 15 JlL drug solution containing 3H-BE (36 nCi) or N
AcAp to make final serum concentrations of 6 nM to 600 Jl,M. Samples were incubated
at room temperature for 30 min. One hundred microliters of the sample were then set
aside for analysis to obtain a quantitative value for total drug in solution. (In the case of
N-AcAp, 200 JlL N-AcAp-d3, concentrated to give 113 the total amount of N-AcAp used
in the original sample, was then added to the 100 IlL whole plasma sample as an internal
standard.) With the other half of the sample, free drug was then separated from protein
bound drug through the use of Centrifree ultrafiltration devices with lTitracel YMT
membranes (30,000 Da cut-off) spun at an average g-force of 1447 x g for 15 min to
separate serum from ultrafiltrate. (The molecular weight cutoff of these devices is low
enough to exclude albumin and alpha-1-acid glycoprotein, the two most significant drug
binding plasma proteins.) One hundred microliters of ultrafiltrate were then collected
(and in the case of N-AcAp internal standard added, as above, for quantitation) for
analysis. BE samples were then analyzed as described below. N-AcAp samples were
126
extracted with Bond Elute Certify solid phase extraction cartridges as follows: To a 300
JlL sample (including 'internal standard) was added 700 Jl.L 0.1 M potassium phosphate
buffer, pH 6.0. A column was preconditioned with 2 mL methanol, followed by 3 mL of
the potassium phosphate buffer. Samples were then applied and columns were rinsed
with 1 mL water, 1 mL of 0.1 M acetic acid, and again with 1 mL water then dried for 5
min. Samples were then eluted with 3 mL of methanol: 5 M HCI (20: 1), dried in a
Savant Speed-Vac sample concentrator, and reconstituted in LC mobile phase for
analysis. As positive binding controls, cocaine and amphetamine were analyzed in
analogous manners as BE and N-AcAp, respectively. Positive control data were
comparable to literature values (179, 180).
Sample Analysis
Quantitative drug analysis was carried out on influx and efflux samples using a
ThermoQuest TSQISSQ triple stage quadrupole tandem mass spectrometer in selected
reaction monitoring (SRM) mode coupled to a Hewlett Packard (Palo Alto, CA) 1100
series HPLC. LCIMS/MS was selected as the analytical technique because of its
excellent selectivity, sensitivity, and quantitative ability as well as its ability to analyze
polar compounds without derivitization. (In addition, analysis by this technique as
compared to the use of radiolabeled drugs allows determination and quantitation of the
drug itself within cells, not accumulation of data that is ambiguous with respect to the
actual identity of the influxed (or effluxed) molecule.) Samples were injected onto a
Metachem Metasil Basic 3 Jl.m particle size 30 x 2.0 mm HPLC column. For optimal
chromatography, the following gradient was run for amphetamine samples: From 0-2.2
min. composition was held at 98% 0.1 % formic acid 12% methanol at a flow rate of 0.2

127
mL/min. Composition was then ramped to 400/0 aqueous I 60% organic over 0.1 min and
held until 6.4 total min when composition was ramped back to 98% aqueous I 2% organic
and flow rate to 0.4 mL/min over 0.1 min and held until 12.5 min at which time the flow
rate was ramped to 0.2 mL/min over 0.1 min and held until 14.5 min at which time the
next sample was injected. Using the same mobile phases, N-AcAp was analyzed with the
following gradient: From 0.1 to 5.0 min composition was ramped from 980/0 aqueous I
20/0 organic to 10% aqueous I 90% organic and held until 8.9 min at which time the
composition and flow rate were changed to 98% aqueous 12% organic and 0.4 rnL/min,
respectively, over 0.1 min. These conditions were held until 14.0 min when initial
condition were re-established over 0.1 min and held until 15.5 min when the next sample
was injected. Cocaine and BE were eluted from the 'same column under the following
conditions: From 0 to 1.0 min composition was held at 98% 0.1 % formic acid 12%
acetonitrile (at a 0.2 mL/min flow rate) at which time it was quickly ramped to 90%
organic over 0.1 min and held until 6.9 min. Over 0.1 min composition was shifted back
to original conditions and flow rate to 0.4 mLlmin. At 11.4 min flow rate was changed
back to 0.2 mL/min over a 0.1 min time range. These conditions were held for another
min until the next sample was injected. Ionization was effected with an electro spray
ionization source in positive ion mode with the spray voltage set at 4.5 kV. The heated
capillary was set at 250°C, collision gas at 3.0 mToIT, and collision offset at -20 V (for
amphetamine and N-AcAp) and -24 V for cocaine and BE. SRM m1z transitions
monitored were as follows: Amphetamine (136 m1z to 91 m1z), amphetamine-d3 (139
m1z to 92 m/z), N-AcAp (178 m1z to 91 m/z), N-AcAp-d3 (181 m/z to 91 m/z), cocaine
(304 mJz to 182 mJz), cocaine-d8 (312 mJz to 185 mJz), BE (290 mJz to 168 mJz), and
BE-d3 (293 mJz to 171 mJz).
128
Prepared serum or plasma and ultrafiltrate samples were either analyzed via
scintillation counting (BE, with correction for protein quenching of signal) or LC/MS/MS
as described above.
Eumelanin assays were performed as previously described in Chapter 2 on one
sample from each cell category (i.e., pigmented or nonpigmented) from each experiment
and normalized for protein content so that approximate melanin quantities in the rest of
the flasks containing that cell category in that experiment could be calculated. The use of
phenylthiocarbamide as a tyrosinase inhibitor produced NPM that contained as little as
160 ~g eumelaninlmg protein compared to cells cultured in the absence of
phenylthiocarbamide which contained as much as 6400 ~g eumelanin/mg protein.
Data Analysis
Quantitative analysis was performed by calculating drug to internal standard SRM
chromatogram peak area ratios and comparing them to a standard curve generated in the
same way using known amounts of drug. For each influx time point, an analogous
negative control sample was run in which no cells had been cultured in the flask. This
was done to determine the background level of drug adhered to the flask alone and
removed by the collection procedure. The amount of drug adhered to the flask was
subtracted out of the value determined for the cellular uptake sample. Generally this had
very little to no effect on the data produced as the amount of drug taken up by cells
greatly exceeded (» 1 0 fold) the amount of drug adhered to the flask alone. For influx
experiments the amount of drug taken up by a flask of cells was divided by the amount of
129
protein in that flask of cells and plotted against time. For efflux experiments, the amount
of drug effluxed out of the cells and the amount of drug remaining in the cells were added
together to obtain the total amount of drug originally taken up (after 30 min of influx) by
the cells. This sum was then divided by the amount of drug remaining in the cells to
obtain the fraction of influxed drug remaining in the cells and plotted against time.
Results
Time courses of influx and efflux were carried out so that both initial rates and
uptake amounts at equilibrium could be approximated. Initial influx or efflux was always
established very quickly, i.e., in a matter of a few min or less. Typical SRM
chromatograms obtained from cell uptake/efflux experiments for the purpose of drug
quantitation are shown in Figure 5.lA-D. No smoothing algorithms or special
chromatographic processing was performed. Drug to internal standard peak area ratios
were used for quantitation. In the figures that follow, each data point is determined from
a separate flask of cells. No two data points were obtained from one flask of cells.
Figures 5 .2A -B depict time courses for influx of 1 JlM amphetamine or cocaine into
keratinocytes, PM, and NPM. Each time course was repeated twice. Initial influx was
completed in nonpigmented cells by 60 s, but in pigmented cells it was completed and
influx equilibrium was established by 15 min. Eumelanin content had a dramatic effect
on the equilibrium influx amount of amphetamine and cocaine taken up into pigmented
vs. NPM. Keratinocytes take up the least amount of amphetamine on a per mg of protein
basis. However, it is important to realize that per flask, keratinocytes produce about five
times as much protein as melanocytes, thus decreasing their apparent relative uptake
amounts by a factor of 5. An expanded plot of the keratinocyte influx data is seen in
130
Figure 5.1 SRM chromatograms of (A) amphetamine, (B)N-AcAp, (C) cocaine, and (D)
BEfrom celllysates.
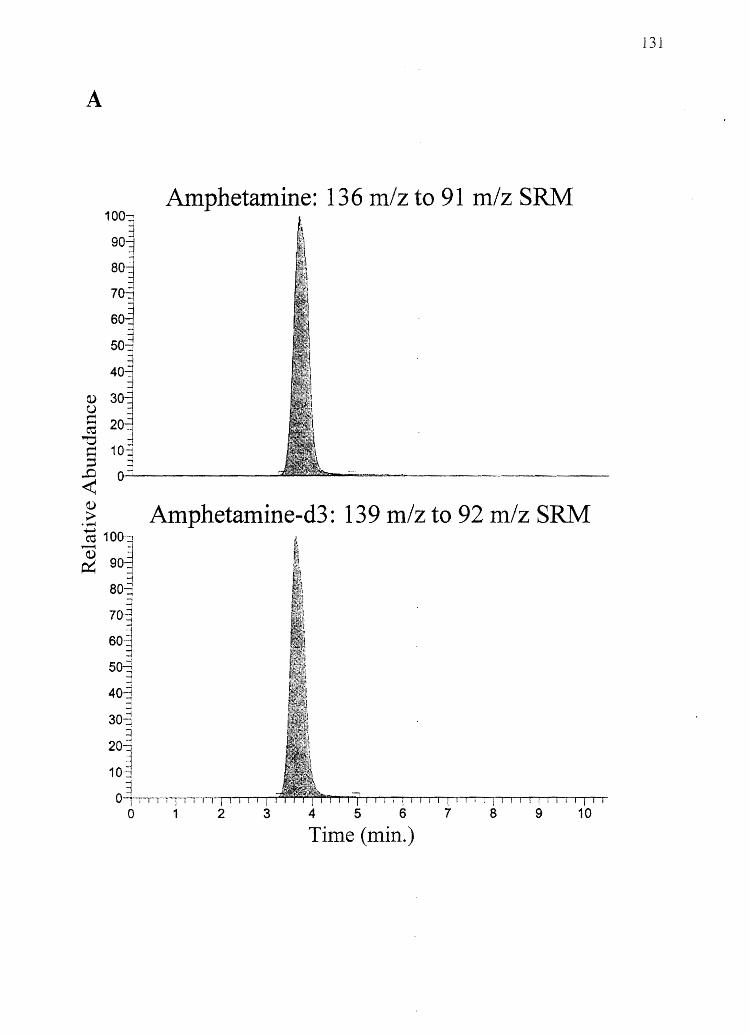
A
100~
90~
80i 70~
6~
:J~ OJ 30 U J § 20~
] 10,:1 ::s ...;
Amphetamine: 136 m/z to 91 m/z SRM
~ l~-----------~ OJ > .... ~ 100.::1
~ 9~ ..., 80-3
60-=1 3
50-j -f
o
Amphetamine-d3: 139 m/z to 92 m/z SRM
2 3 456 7 8 9 10
Time (min.)
131
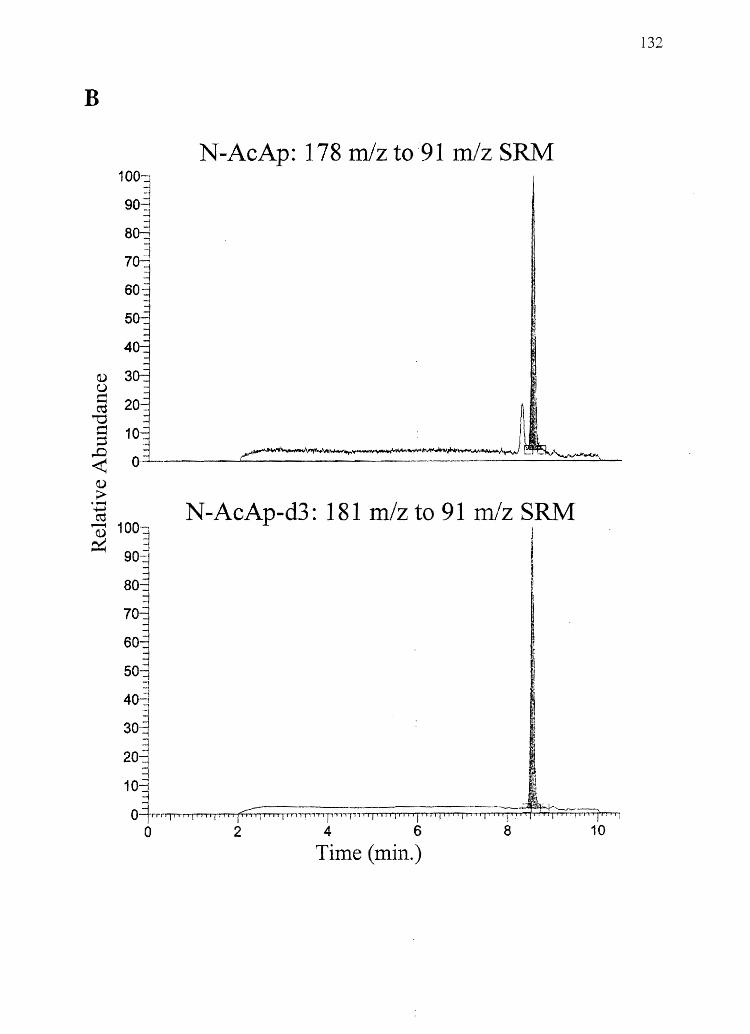
B
Q) ;> .~
~
100~ =j
90~ -l -i
80~ ""'l
70B 60
3 50
40
10~ 0-' -
~ 100-
~ 90·--
80
70
60
50-=! 3
40-:1
30~ -;
:1 20-:i
::{
N-AcAp: 178 mlzto:91 mlz SRM
~ ,
~,~ ... ""-,-\.,,,., ... \It~-'-'~k~'~~ '_ ,_ ~.....,. ...... _ .. ! _ ..... __ • ..,. ....
N-AcAp-d3: 181 m/z to 91 mlz SRM
I
10-=1
04", 'I" "I'''' I' " , ri ' '" I" "! "~T~";;':;:;;'T':;;::;:;:;;::;;:;:;;~:;;:;;;:~~\ ,~~::;::;::;:;;:~ 02468 10
Time (min.)
132
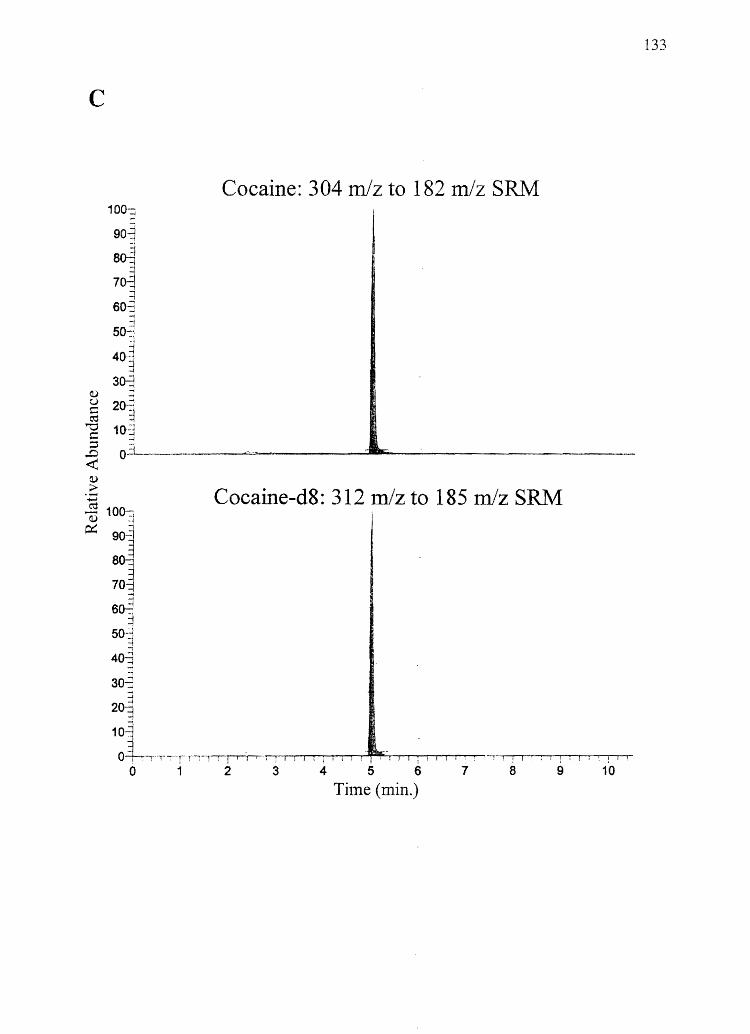
c
100-::
90..:1
8~ -1
70~ =l
6(8 .., -, 5O-:~
-!
401 ~
30~ -i
o-:L
-,
30-::
201 '"1
Cocaine: 304 m/z to 182 m/z SRM
Cocaine-d8: 312 m/z to 185 m/z SRM
1:l"r-TT-n'-r: ....... / ...... , ":""'j -,-, -"--"-"-""-'''-''''-'''~-'--'-''''''''''''''''''-'-'''i-'''i-.--r-~''''-'"'>r, : i ' : I : ' ! , ! ! ! 'T"
o 1 2 3 4 5 6 7 8 9 10
Time (min.)
133
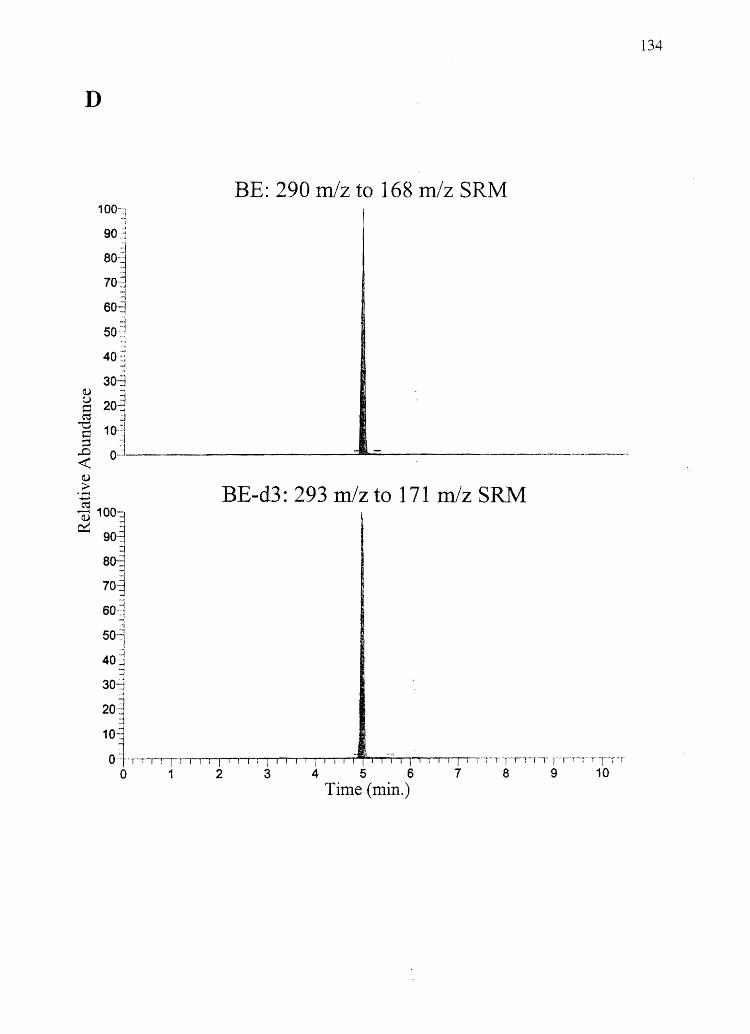
D
1 OO·~~~
90::
80~ 70-J
6°1 50.,
40:1 -' ,~
8 3~""'. \: 20 ~ \: 10-~j
BE: 290 mlz to 168 m/z SRM
:::s ··1 .r;; O.]----------~~-------------.-... -.. - ... - ... -<
(1) ;> ........ BE-d3: 293 mlz to 171 mlz SRM Cd
~ 100]
90"1 :J
80-:1 70~ ... 60-:1
...j I
501 40j
-i
:~~ 10~
0·1-1-~-T-~rr-r~1 1~I~i~i~1 -~, ~~~I~I ~~~~~~T·T-r~-T~-r'-I··r-T-r-rl-T-r o 1 2 4 5 6 9 10
Time (min.)
134

135
Figure 5.2 Influx of (A) 1 pM amphetamine and (B) 1 pM cocaine into keratinocytes,
pigmented melanocytes (PM) and nonpigmented melanocytes (NPM) over time. #1 and
#2 designate the first and second repetitions of an experiment. For ease of reference,
eumelanin content in J.lg eumelanin / mg protein is expressed in the legend. Initial data
points were at 15, 30, 45, and 60 seconds. Keratinocyte data points represent the average
of two determinations while the error bars represent the actual data points. Each
experiment with melanocytes is displayed as an individual series.

A
Influx of Amphetamine into Keratinocytes, Pigmented Melanocytes, and NonPigmented Melanocytes
6000
CO
~ c.. 5000
en ~ o E Co 4000 --g >< ::s
:;:::
.: 3000 CD C
E • ~ J: 2000 Co E « -o -C ::s 1000 o E «
•
x
0" ....
o
• • •
•
X X
X
X
iI A •
50 100 150 200 250
Time (min.)
• Keratinocytes: 0
.PM #1: 2700
ANPM #1: 500
XPM #2: 700
ONPM #2: 160
l--" U)
0\

B
40000 1
:5 35000 I CD -0
~ 300001
~ 0 E 25000 a. -a.
~ 20000 j ~ a:s I-
~ 15000· '; u 0 0 1: 10000 l • :::J 0 E
<C 50001
o
• •
•
A A
A
50
Influx of Cocaine into Pigmented and Nonpigmented Melanocytes
•
A
100 150
Time (min.)
•
A
200 250
~ Pigmented: 4100---1
A Nonpigmented: 1400 j ~-------.----- --- .. --------.- -
300
UJ -.]
138
Figure 5.3. The initial influx phase for amphetamine uptake into keratinocytes (and non
pigmented melanocytes) is very difficult to assess visually from a graphical
representation when experiments are run at 37 DC. To determine if initial uptake of
amphetamine into keratinocytes is linear, the experiment was performed with media at 4
DC. At this temperature, uptake is linear for at least 5 min (Figure 5.4).
To evaluate the effect of melanin content on amphetamine and cocaine uptake, the
data for influx of amphetamine into PM and NPM were normalized for melanin content
(Figures 5.5A-B). This procedure shifts the amphetamine influx data such that most of
the data from the least pigmented cells (NPM #2, 160 Jlg eumelanin/mg protein) is
greater than that of most of the data from the deepest pigmented cells (PM#l, 2700 Jlg
eumelaninlmg protein). This demonstrates the strong effect that eumelanin has on
cellular amphetamine uptake. Similarly, once normalized for cellular eumelanin content,
cocaine influx data for PM and NPM move closer together.
Based on the influx data, it was determined that influx equilibrium of
amphetamine and cocaine was well established for all cell lines by 30 min. Thus, efflux
experiments were run by first preloading cells for 30 min with drug. Efflux of
amphetamine and cocaine from keratinocytes, PM, and NPM over time is shown in
Figure 5.6A-B. Keratinocytes and NPM quickly efflux the amphetamine, but PM are
slow to efflux and retain about 40% of influxed amphetamine, if efflux media is not
refreshed. If efflux media is refreshed with drug free media periodically, PM will
eventually redistribute essentially all amphetamine back into the media (Figure 5.7).
There is a difference in the efflux pattern for cocaine between PM and NPM, and in the
experiments conducted here NPM still retained about 40% of the influxed cocaine. This
139
Figure 5.3 Expanded view of amphetamine influx into keratinocytes. Data points
represent the average of two determinations while the error bars represent the actual data
points.
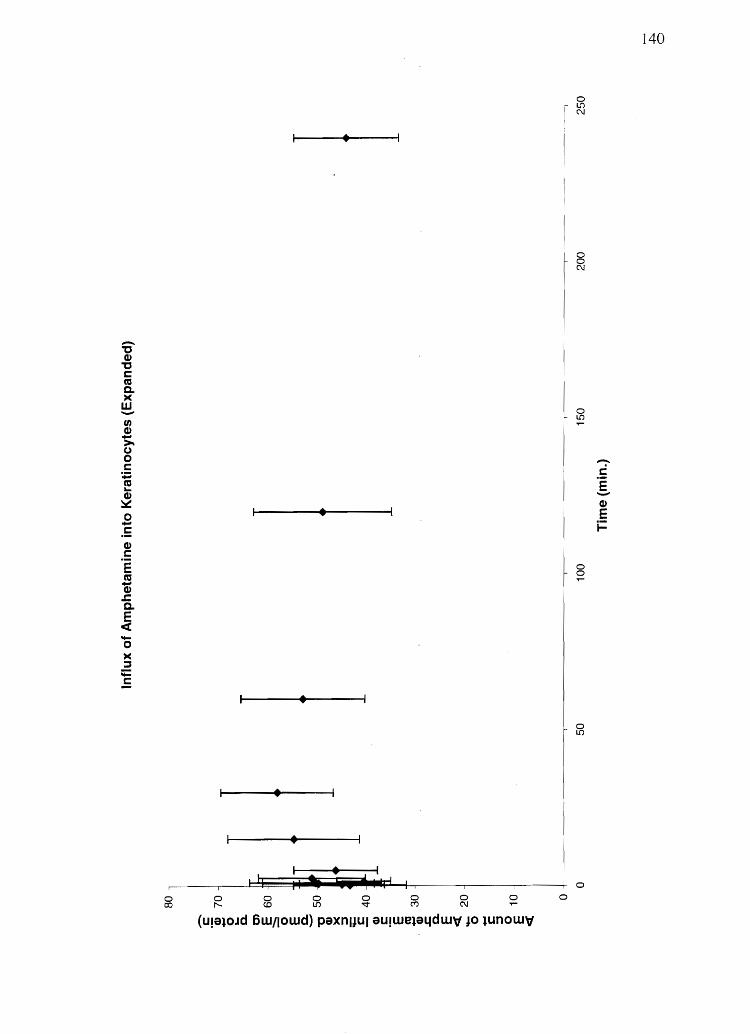
-" G)
" c as c.. >< w -tn G) ->-CJ 0 c
+= as a... G)
~ 0 -.5 G)
.5 E as -G) .c c.. E
<C -0 >< ::s ;: .5
o co 0 f'..
•
•
•
• • I 'I. II " 0 0
co LO
•
I
'0 11 Ii I 0 '<:t
I i
0 C"?
o C\I
o ,... o
o LO C\I
8 C\I
0 LO ,...
0 0 ,...
0 LO
140
-.~ E -G)
E t=
] 4]
Figure 5.4 Initial influx of amphetamine into keratinocytes at 4 °C
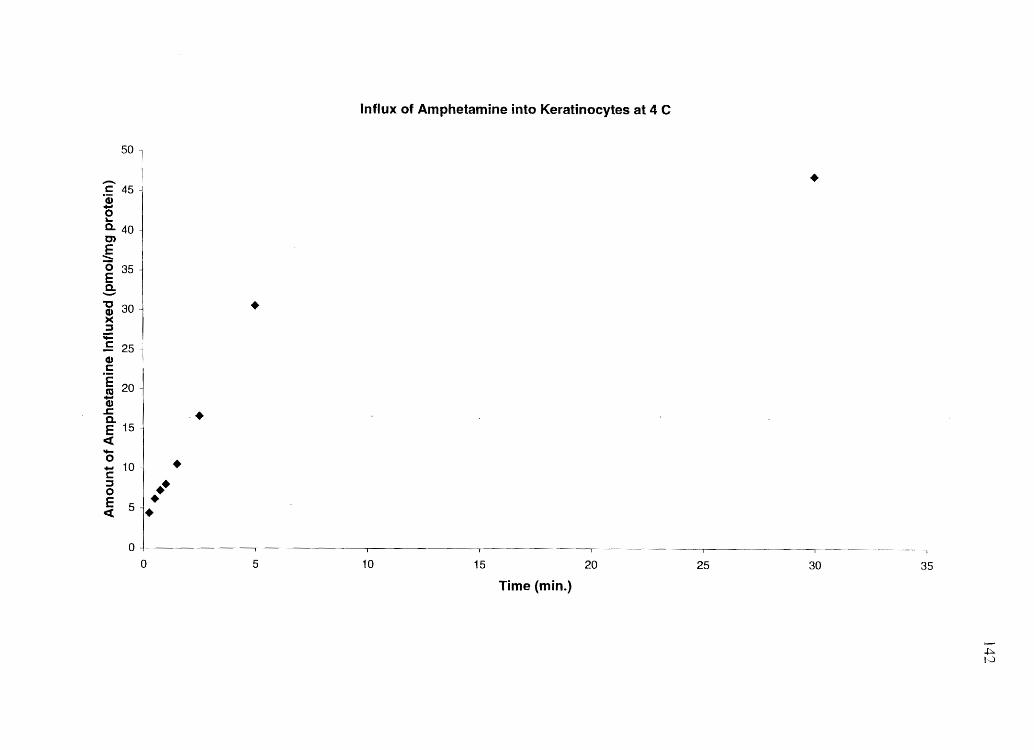
50
'2 45 ·Cii '0 "-e.. 40 0')
~ o 35 E e.. --g 30 >< ::::J ;: .E 25 Cb
.~ 20 j ! I • E 15
i 10 1 · J 5t···
0----
o
Influx of Amphetamine into Keratinocytes at 4 C
•
5 10 15 20
Time (min.)
•
25 30 35
..j::::.. I...)
]43
Figure 5.5 Influx o/(A) amphetamine and (B) cocaine into pigmented melanocytes (PM)
and nonpigmented melanocytes (NPM) normalized/or eumelanin content. (Eumelanin
content is also expressed in the legend in units of J,lg eumelanin / mg protein.)
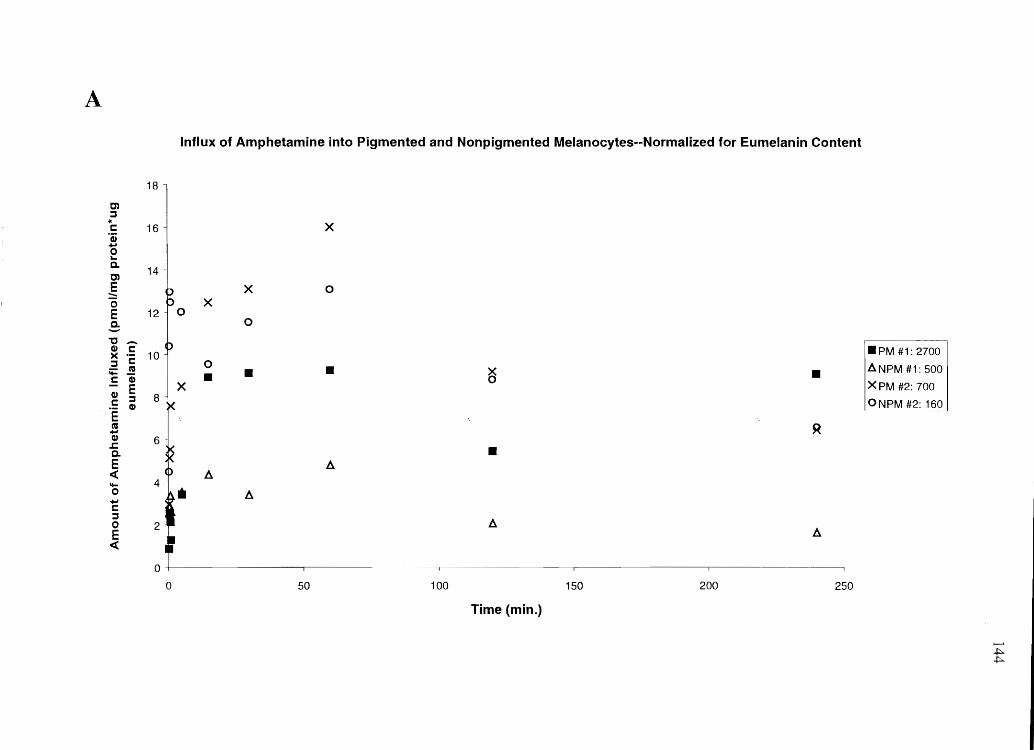
A
Influx of Amphetamine into Pigmented and Nonpigmented Melanocytes--Normalized for Eumelanin Content
18
Cl :s '" X c 16 'i .... 0 ... a.
14 Cl E
12 fo X 0 -'0 X
E 0 .e:
"0_ CI) c
10 I X )( .-:s c 0 laNPM #1: 500 - l'G • • ~ • t+- _ • c CI)
- E ~ :s 8 ._ CI)
E l'G
:t ~ ....
CI) .c • a. E A « A
t+-o A .... c :s 2! A 0 E A «
0
0 50 100 150 200 250
Time (min.)
..J::..
..f::::.
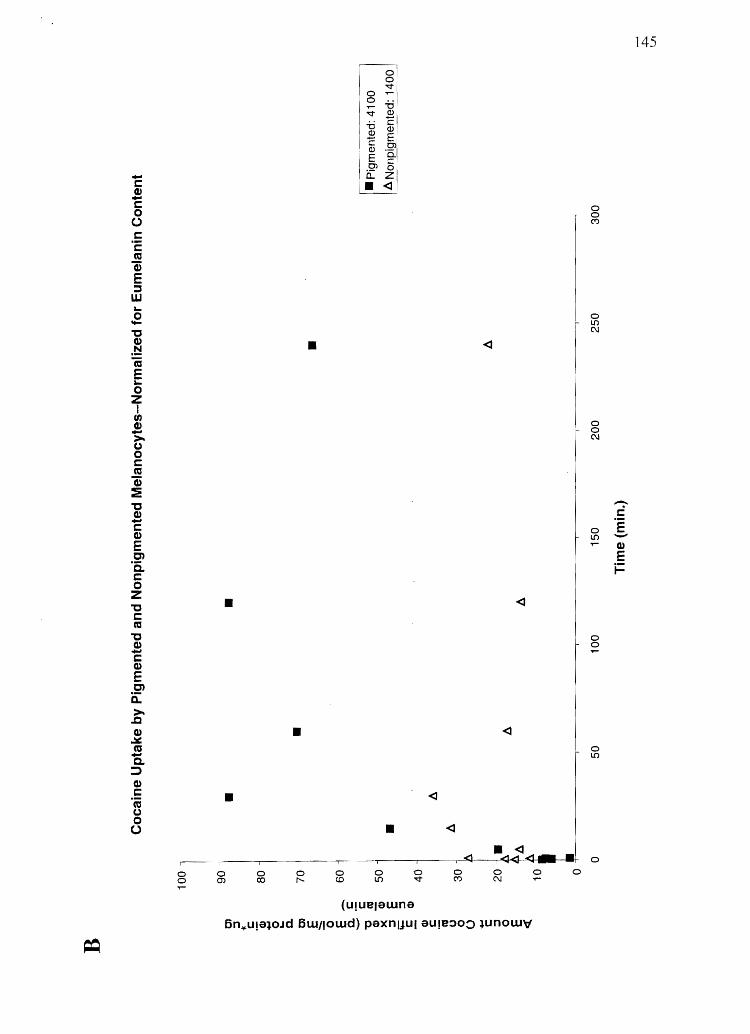
-r:: CI) -r:: o
(.)
r:: 'c CO 'ii E ::::s w -. o .... "C CI)
,~ m E -. o Z
I I
UJ CI)
>. u o r:: CO 'ii :i "C CI) ... r:: CI)
E Cl '0. s::: o Z "C s::: CO
"C CI) ... s::: CI)
E Cl a: ~ CI) ~ CO ... Co :> CI) s::: 'm u o (.)
o o
•
•
o m
o co
•
•
<I
• <I
.~---r--.~-.------r-- , <l o r--
o CD
o LO
o '<:t
(U!UelaWna
o C')
<I
I
o o C')
o LO C\I
o o C\I
0 LO
0 0
o l!)
.<3<3<1<1,. .1 0
o C\I
o o
6n.ulalOJd 6Wllowd) paxnl:.Jul au!e:>o!) lunow'V
145
-c 'E -CI)
E i=
146
Figure 5.6 Efflux of (A) amphetamine and (B) cocainefrom keratinocytes, pigmented
melanocytes (PM), and nonpigmented melanocytes (NPM) over time. #1 and #2
designate the first and second repetitions of an experiment. For ease of reference,
eumelanin content in I-Lg eumelanin / mg protein is expressed in the legend. Initial data
points were at 15, 30,45, and 60 seconds. Keratinocyte data points represent the average
of two determinations while the error bars represent the actual data points. Each
experiment with melanocytes is displayed as an individual series.
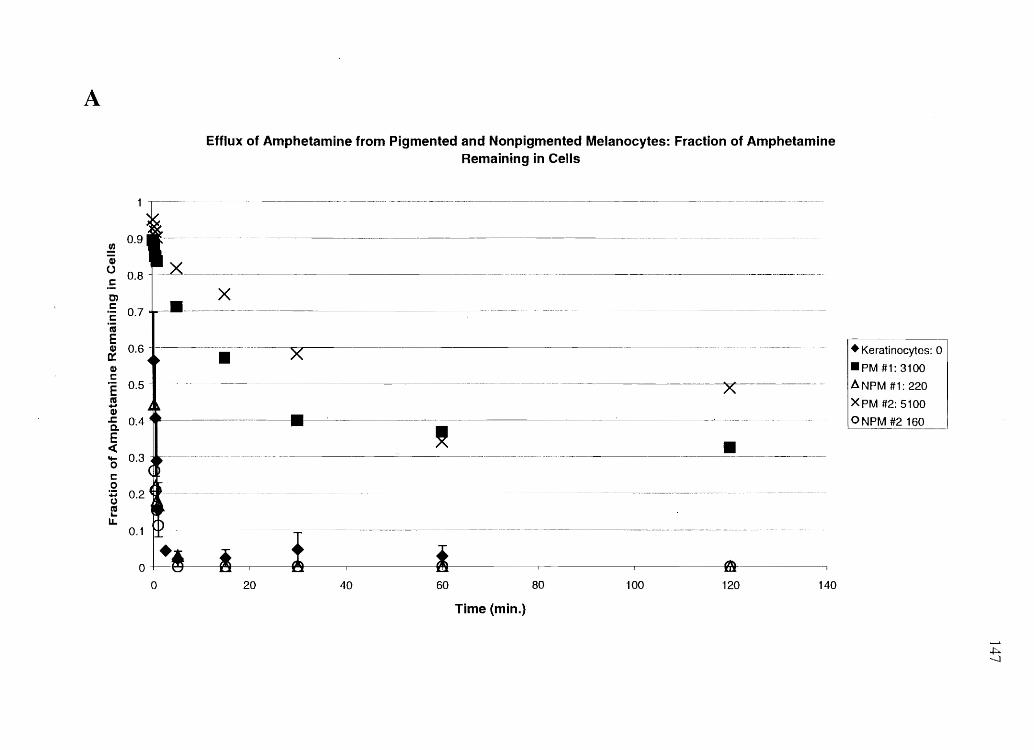
A
.! 0.9
a; 0
: 0.8
tn .: 0.7 r::: '; E Q) 0.6 0:: Q) r::: 'E tIS ..... Q)
f 004 E
oc( .... 0.3 0 r::: 0 :;:; 0.2 (,) tIS ... u.
0.1
0 0
Efflux of Amphetamine from Pigmented and Nonpigmented Melanocytes: Fraction of Amphetamine Remaining in Cells
x
• ------------x---~--·----
~ •
··········,---------~---·--------·······a
20 40 60 80 100 120 140
Time (min.)
I(cr!;ltinr"·,,,ttoc· 0
.......... ~ ---l
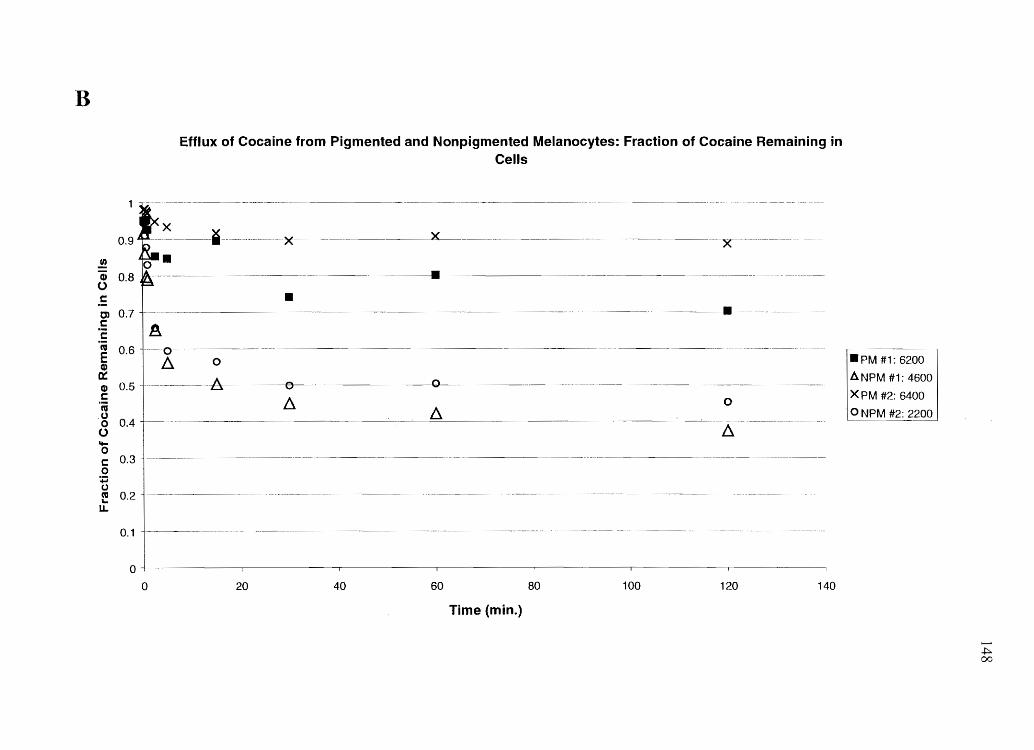
B
Efflux of Cocaine from Pigmented and Nonpigmented Melanocytes: Fraction of Cocaine Remaining in Cells
0.9 ~~----~---- --x
.!!l • ~ 0.8
,E OJ O. 7 +~~~~---~---.--~--
c: '2 A E 0.6 r--o---~'
~ 0.5 ~--~ ---b--o
c: 'n; g 0.4 o """ o c: 0.3 o +i (.)
~ 0.2 LL
•
--e--Il.
--.
0.1 ~--------~-~- ~-------- ---------------------------.--------~-----
--x
.----
o ------
Il.
o ---------, o 20 40 60 80 100 120 140
Time (min.)
--~--.PM #1: 6200
ANPM #1: 4600
XPM #2: 6400
o NPM #2: 2200 --------~----
.J:::;.. 00
Figure 5.7 Efflux of amphetamine from pigmented melanocytes when efflux media is
refreshed every 30 min. Data are shown fit to a natural logarithmic decay curve.
149
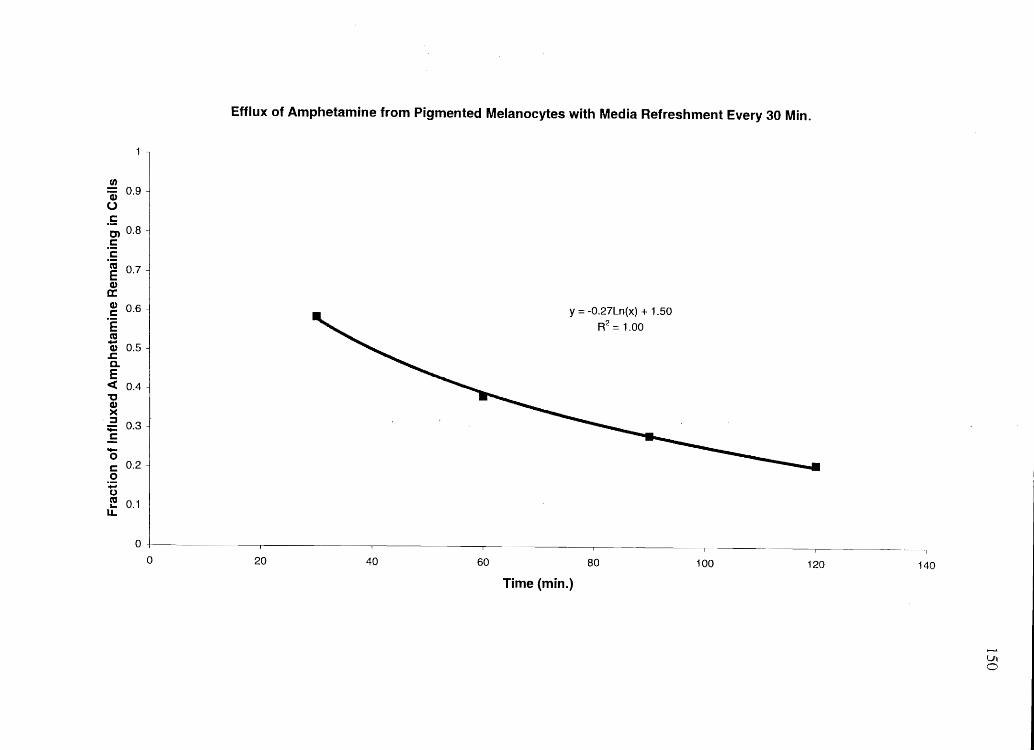
tn =ai 0.9 0 .5 m 0.8 5 c: 'i E 0.7 (I.)
0::
~ 0.6
'E ca -~ 0.5 D-E <t: 0.4 "t:J (I.) )( ::I ~ 0.3
-0 c:: 0.2 0
:;:: (J ca at 0.1
0
0
Efflux of Amphetamine from Pigmented Melanocytes with Media Refreshment Every 30 Min.
20 40 60
y = -0.27Ln(x) + 1.50 R2 1.00
80
Time (min,)
100 120 140
Ul o
may be due to the fact that the "nonpigmented" cells used in this particular experiment
displayed some pigmentation (4600 J.lg eumelanin/mg protein), even though they were
less pign1ented than their "pigmented" counterparts (6200 J.lg eumelanin/mg protein)
from the same experiment.
151
In contrast to amphetamine, N-AcAp is not readily incorporated into
keratinocytes, PM, or NPM--even at 10 times the concentration. Figure 5.8A-B shows
the total (nonbackground subtracted) uptake of 10 J.lM N-AcAp and net (background
subtracted) 10 J.lM BE uptake into the cells. None of the N-AcAp data points are greater
than five times the background uptake of an empty flask and thus cannot be attributed
unequivocally to actual cellular uptake. Melanocyte uptake of N-AcAp appears greater
than that of keratinocytes. due to normalization of the data for p~otein content. (As stated
above, a flask of keratinocytes contains about five times as much protein as a flask of
melanocytes. )
BE influx data is inconsistent relative to the patterns of other influx data, but it
does suggest that there is no effect of cellular pigmentation on the amount of BE taken up
into melanocytes. To confirm this finding, experiments were conducted to assess the
efflux of BE from PM and NPM. Results (Figure 5.9) indicate that BE is effluxed from
NPM a little faster than from PM, and BE is totally removed from both PM and NPM by
60 min. Thus no pigmentation bias was observed for BE.
Serum or plasma protein binding of BE and N-AcAp was found to be relatively
minor (Figures 5.10A and B). BE did not bind to serum proteins at all, and N-AcAp was
at most only 40% bound to plasma proteins. The peculiar concave nature of the N-AcAp
plasma protein binding curve produces a convex Scatchard plot-a feature suggestive of
152
Figure 5.8 Influx of (A) 10 pM N-AcAp and (B) 10 pM BE into keratinocytes, pigmented
melanocytes (PM), and nonpigmented melanocytes (NPM). For (A) N-AcAp, none of the
data points are greater than five times the background uptake of an empty flask and thus
cannot be officially counted as actual cellular uptake. Keratinocyte data appear lower
due to the greater protein content of keratinocytes. For (B) BE, all data points are greater
than 10 times background uptake levels.
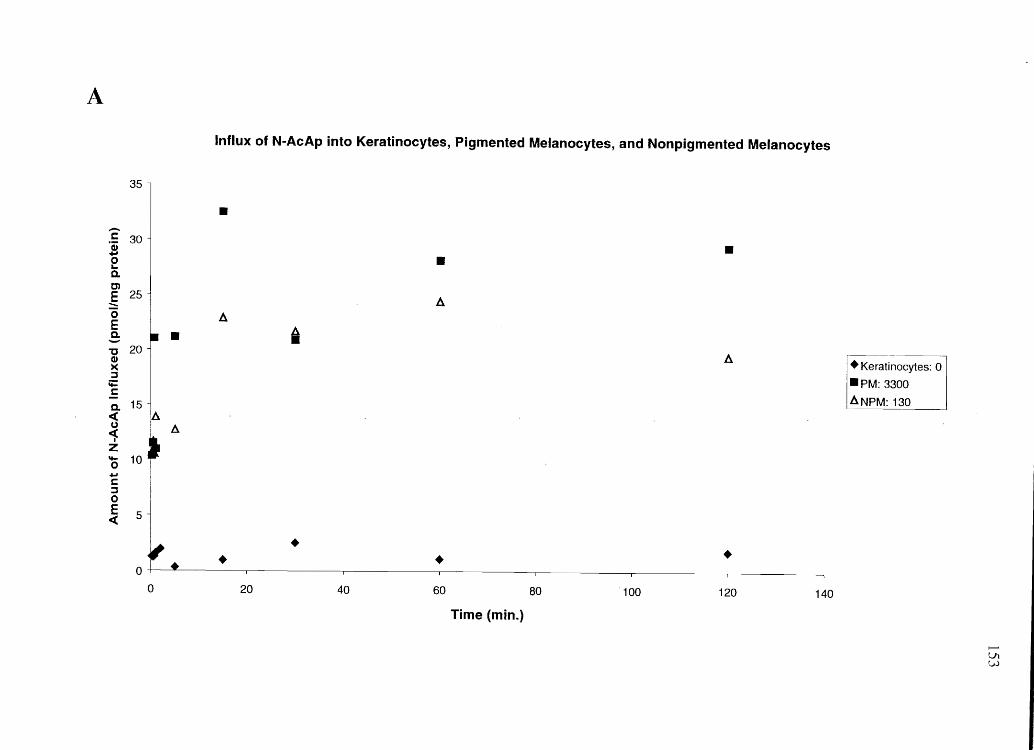
A
Influx of N-AcAp into Keratinocytes, Pigmented Melanocytes, and Nonpigmented Melanocytes
35
• -.= 30 • (I) ..., • 0 L-
a. t» E 25 A -0 A E i .e • "C 20 A • Keratinocytes: 0 (I)
>< :J .PM: 3300 'i: c ANPM: 130 -;, 15 ~ u A ~ Z 't- 10 0 .., C :J 0 E 5 ~
• • • 0
0 20 40 60 80 100 120 140
Time (min.)
.......... Vl. W
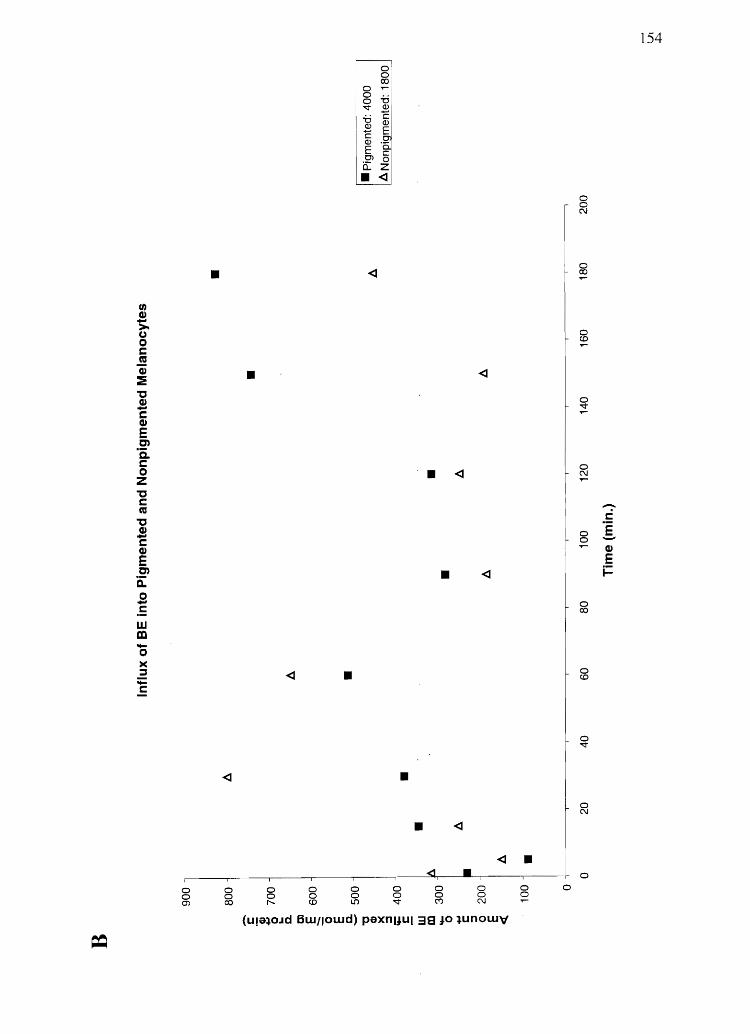
• UJ CD ->-(J 0 c m 'i == "C CD -C CD E m .is.. s::: 0 Z "C s::: m
"C CD -c CD E m ii: 0 -s::: w m -0 >< :s ;: s:::
0 0 0 0 0') co
•
<I
0 0 0 0 r--. CD
•
0 0 L()
o o co
•
0 0 -.::t
<I
• <I
•
• <I
~I • 0 0 0 0 C') C\I
(u!alOJd BWllowd) paxnl.lul 38.10 lunowv
I L
• I 0 0 0 ,....
o o C\I
0 co
0 CD
0 -.::t
0 C\I
0 0
0 co
0 CD
0 -.::t
0 C\I
0
154
-s:: Os -CD E i=
155
Figure 5.9 Efflux of BE from pigmented melanocytes (PM) and nonpigmented
melanocytes (NPM) over time. For ease of reference, eumelanin content in Jlg eumelanin
/ mg protein is expressed in the legend.
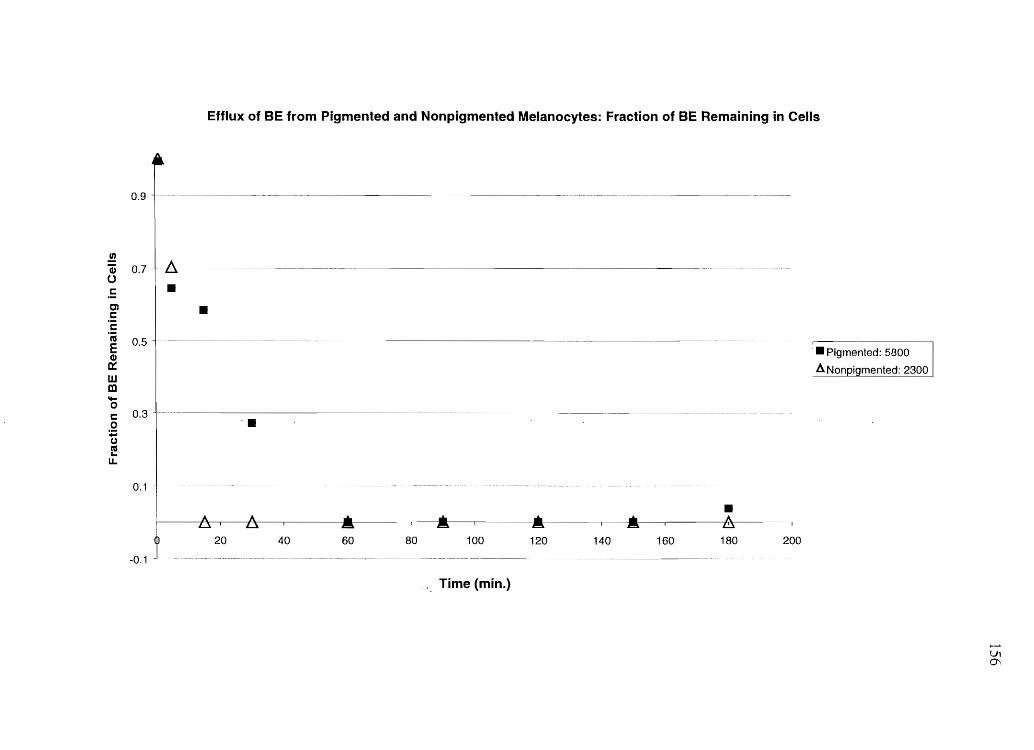
0.9
.!! (ij 071! 0 ,5 c:n c c 'i 0.5 E G)
a::: w III !t-o c 0.3 0 ;:; u C'IS '-U.
0.1
-0.1
Efflux of BE from Pigmented and Nonpigmented Melanocytes: Fraction of BE Remaining in Cells
•
••
.AI • A
~ Zll.
20 40 60 80 100 120 140 160 180 200
.. Time (min.)
I--'
VI 0\
157
Figure 5.10 Serum and plasma protein binding o/(A) BE and (B) N-AcAp, respectively.
Data points represent the average of two determinations while the error bars represent the
actual data points.
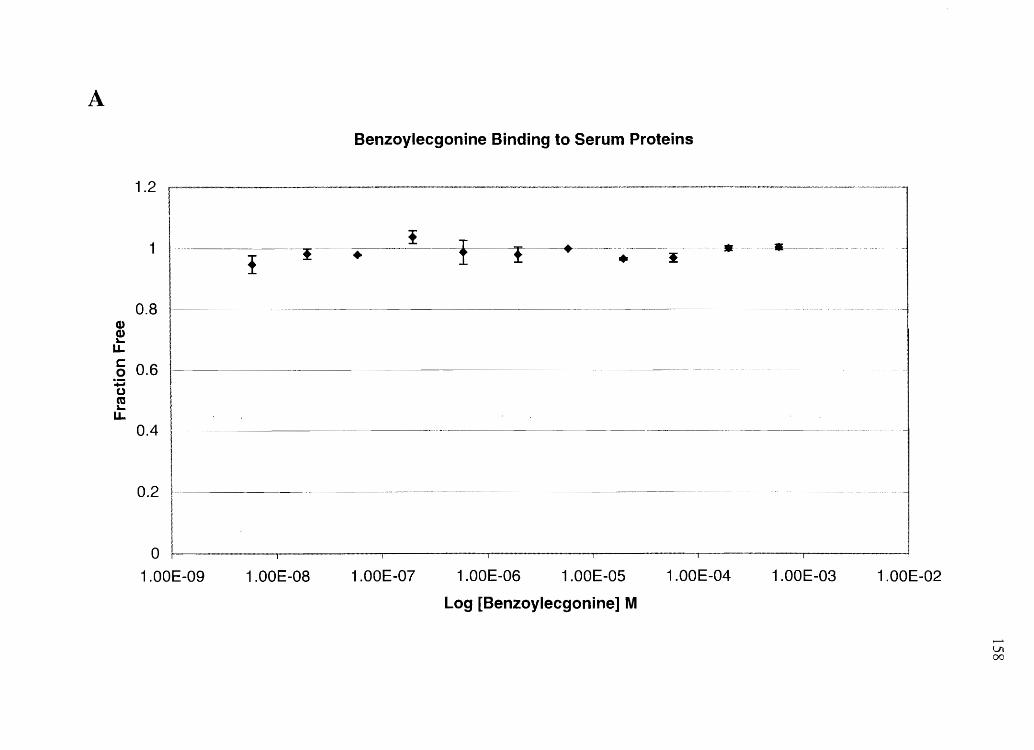
A
Benzoylecgonine Binding to Serum Proteins
1.2
t T 1 . ~~--.--~--• I • ! ~
O.B CJ) CJ) "-u. c: o 0.6
+:i 0 m "-u.
0.4 r
I 0.2
o 1.00E-09 1.00E-OB 1.00E-07 1.00E-06 1.00E-05 1.00E-04 1.00E-03 1.00E-02
Log [Benzoyl ecgonine ] M
>---'
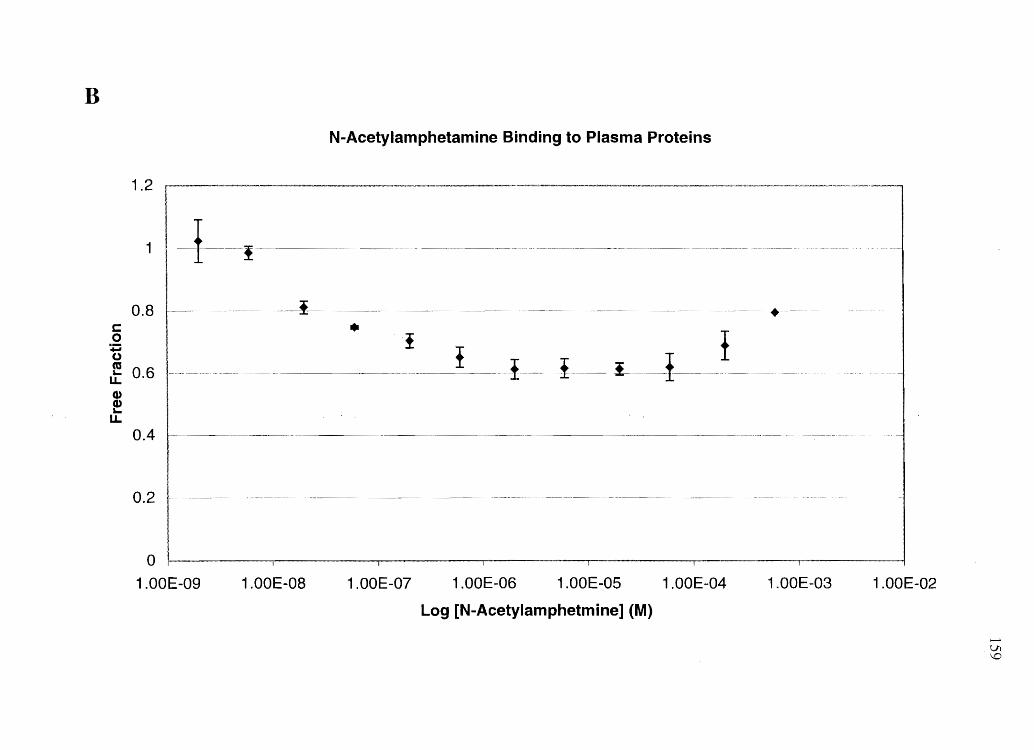
B
N-Acetylamphetamine Binding to Plasma Proteins
1.2 r--
1 l-~I----! --------c o ;::; (,)
O.B
CO at 0.6 Q) Q) lo-U.
0.4
0.2 1--
o 1.00E-09
I- -------• !
1.00E-OB 1.00E-07
!-- -I~~I-- -i---t- !
1.00E-06 1.00E-05 1.00E-04
Log [N-Acetylamphetmine] (M)
•
1.00E-03 1.00E-02
Vl \0
160
cooperative binding.
Discussion
Various models have been used that assess the potential hair color bias of specific
drugs. These include drug-melanin binding studies (50-53, 55, 76, 78, 79, 168), animal
in vivo incorporation studies (specifically with black and white Long-Evans rats) (40, 42,
65,66,69, 181), and human in vivo incorporation studies (126, 152, 182). Taken
together, these data suggest that basic drugs with pKa values greater than physiologic pH
will exhibit a hair color bias, while net neutral or acidic drugs will not. The studies
presented here were designed to further test this hypothesis with yet another model of
drug incorporation into hair-specifically, hair cell drug transport.
The initial influx and efflux of amphetamine and cocaine into or out of the
keratinocytes, PM, and NPM is very rapid, ending within a matter of a min or two for
nonpigmented cells, and within a matter of about 15 .. min for PM. However, the data
acquired in these studies do not make an absolute distinction as to whether drug is
transported into cells or simply adheres to the outside of cells in the flask. (Keratinocyte
data, e.g., are ambiguous in this matter.) Differences between PM and NPM, however,
suggest that amphetamine and cocaine are actually entering melanocytes since melanin is
contained on the inside of cells and appears to have a strong effect on the uptake and
efflux of amphetamine and cocaine from melanocytes. These data suggest a model of
quick initial transport into or out of cells with an extended time period required for
accumulation of drug onto or removal of drug from melanin. Equilibrium rate constants
for cellular transport and drug-melanin binding thus determine the time frame for the
whole process.
161
Perhaps the most striking aspect of these studies is the influence of melanin on
amphetamine and cocaine influx and efflux. As evidenced in Figure 5.2, PM accumulate
much greater amounts of amphetamine or cocaine at equilibrium than do NPM. In
addition to the fact that the only difference between these two cell lines is inhibition of
tyrosinase and thus a dramatic reduction of eumelanin content in one line; normalization
of these data for cellular eumelanin content-i.e., dividing drug uptake (pmollmg protein)
by the eumelanin content of the cells (J.Lg eumelanin) (Figure 5.5) also strongly supports
the notion that drug-melanin binding and accumulation of drug on melanin is the reason
for greater uptake of the basic drugs by PM than NPM. There may still appear to be
some difference between PM and NPM influx of amphetamine and cocaine after the data
is normalized for eumelanin content, but these differences can be attributed to
experimental variability, as the differences between PM and NPM are much less on both
an absolute and relative scale once uptake data are normalized for eumelanin content. In
addition, once data are normalized for eumelanin content, NPM data points are not
distinguishable from PM data points. Likewise, these same reasons explain the rapid and
complete efflux of amphetamine and cocaine from nonpigmented cells, and the slow and
incomplete efflux of the drugs from pigmented cells. The fact that efflux of amphetamine
from PM is a slow, but equilibrium-mediated process is demonstrated by the evidence in
Figure 5.7, which shows that if cells are continuously exposed to an amphetamine free
extracellular environment, amphetamine will eventually be exported into the extracellular
fluid.
Interestingly, with respect to the cellular melanin content and melanin binding
constants of eumelanin for amphetamine, the average amount of amphetamine taken up
162
into PM is approximately 2.0x 10⁻⁹ mol / mg eumelanin. This value falls between the low
capacity (1.3xl0-10 mol / mg eumelanin) and high capacity (1x10⁻⁷ mol / mg eumelanin)
maximal binding parameters for amphetamine to eumelanin (see Chapter 4). Likewise,
the average amount of cocaine taken up by PM at equilibrium is 7.3x10⁻⁹ mol / mg
eumelanin, which also fits between the low and high capacity maximal binding
parameters for cocaine to eumelanin (see Chapter 4). These observations reinforce the
idea that the level of influx of amphetamine into pigmented cells is directly related to
cellular eumelanin content due to amphetamine binding to the eumelanin polymers.
In addition to the capability to address issues of hair color bias, these cellular
models also allow an investigation into hair cell selectiveness in drug transport. A
previous study by Nakahara and Kikura (41) showed that when Dark Agouti rats are
given amphetamine or N-AcAp at the same dose, the plasma area under the concentration
vs. time curve (AVC) for N-AcAp is about four times greater than that of amphetamine.
Analogously, Hubbard et al. (66) found that the AVC for BE is about twice that of
cocaine after systemic administration of cocaine. A unique finding of these two studies
was that the amount of amphetamine or cocaine found in hair is much greater than the
amount of N-AcAp or BE found in hair; both in the above studies and in one of our
previous studies (42). This is inconsistent with predictions based on a classical diffusion
model of cellular uptake. At least two possibilities can account for this apparent
discrepancy: Either N-AcAp and BE are highly protein bound and essentially unable to
be taken into hair cells, or the hair cells have a transport systen1 in place that permits the
selective uptake of amphetamine and cocaine, but the relative exclusion of N-AcAp and
BE. To test the former possibility, drug-plasma protein binding studies were conducted
163
with N-AcAp and BE prior to conducting the cell tr~nsport studies. The binding studies
conducted across the complete range of physiologically relevant BE and N-AcAp plasma
concentrations excluded the fonner possibility by demonstrating that BE is not bound to
serum proteins (compared to 80-55% binding for cocaine across physiologically relevant
serum concentrations(179)) and N-AcAp is at maximum only 400/0 bound to plasma
protein (compared to amphetamine's binding of about 20% across physiologically
relevant plasma concentrations (180)). Thus thefree-drug-in-plasma AUe (free AUe)
ratios between cocaine and BE and amphetamine and N-AcAp remain substantially less
than one. Specifically, based on a assimilation of the plasma AUe data of Hubbard et al.
(66) and the cocaine serum protein binding data of Parker et aI. (179) with the data
presented here, the cocaine: BE free AUe ratio was, approximately 0.06-0.21. Also,
based on a comparison Nakahara and Kikura's data (41) and the data presented here, the
amphetan1ine : N-AcAp free Aue ratio reached a maximum of only 0.33.
These studies examining the influx of amphetamine, cocaine, N-AcAp, and BE
into hair-related cells finnly support the hypothesis that hair cells do not simply take up
drugs available in the plasma following a simple diffusion n10del. Even at a 10-fold
greater concentration than amphetamine, N-AcAp still is not transported into
keratinocytes or melanocytes. Likewise, also at a 10-fold greater concentration, BE is
still influxed to a much lesser extent than cocaine. Inconsistencies in BE influx data may
indicate that BE is simply adhering to the outside of the cells. As mentioned previously,
unless a pigment bias is observed, these experiments cannot distinguish between uptake
and simple adherence to the outside of cells. If BE is simply associating with the outside
of the cells, quantitative levels of BE may be quite sensitive to minor inconsistencies
164
during the PBS wash phase of the experiment. If simple diffusion were responsible for
uptake of these drugs into hair cells, then even given the same AUe (or cellular
exposure) one would still expect greater amounts ofN-AcAp to be incorporated into the
hair cells because it is the more nonpolar, uncharged compound. However, although N
AcAp was found in the hair of systemically dosed rats (42), our current study did not
demonstrate cellular transport of N-AcAp into keratinocytes or melanocytes. As stated
above, while absolute signals from N-AcAp in our influx samples were far above
quantitation lin1its, they were low relative to background noise from drug adherence to
the flask. Background signal of N-AcAp from drug ·adhered to the flasks was not high; at
10 ~, the background was just slightly lower than that of amphetamine at 1 JlM. Thus
the nuances of the experimental conditions themselves may preclude an assessment of the
precise extent of cellular uptake of N-AcAp. One could make the argument that because
the N-AcAp influx data for melanocytes fit hyperbolic regression curves, modeling
simple facilitated transport (KaleidaGraph, Synergy Software) with R 2 values between
0.80 and 0.85, that there may be some actual cellular transport. However, again, because
of the low signal to background ratio of the data, we prefer not to draw such conclusions
with certainty.
Specific cellular transport processes appear to be operational for amphetamine
and cocaine. However, no mechanistic studies were conducted here to determine the
exact mode of transport. Linear initial transport regions are vital to such studies, thus in
an effort to observe them, an amphetamine influx experiment into keratinocytes was run
at 4 °e (Figure 5.4), This technique slowed the initial transport process sufficiently for
linear rates to be observed for a significant time period. Thus, such a cooling technique
165
may be of value in future mechanistic studies on the mode of amphetamine (and possibly
cocaine) transport into hair forming cells.
Cellular transport models, such as those employed in this study, may be valuable
tools to help predict hair incorporation properties and potential color biases, but they are
not without their limitations. For example, the model is not a whole animal system and
does not contain the complex variety of cellular interactions between different cell types,
as would be the case in a living animal. Thus data obtained may not reflect in vivo reality
in all cases. In addition, the cells used in these studies were not hair follicle-derived due
to viability and pigmentation limitations involved with such specialized cells. As such,
data obtained from such cells cannot reliably be used as an absolute predictor of the hair
incorporation properties of any given drug, but must be used in conjunction with
supporting data from other models of drug incorporation into hair.
In conclusion, the data presented in this chapter demonstrate the dramatic effects
of cellular pigmentation and transport selectivity on the uptake and retention of basic and
highly (hair) incorporating drugs in comparison to their nonbasic and low-level
incorporating congeners.
CHAPTER 6
SUMMARY AND SIGNIFICANCE
Summary
The results presented in this dissertation are summarized with the following
statements:
1. PDCA and PTCA, markers for DHI and DHICA eumelanin units, respectively,
are produced in 0.37% and 4.8% yields, respectively, when melanins are
subjected to alkaline hydrogen peroxide degradation.
2. 3AT and AHP, markers for 2-CysDOPA and 5-CysDOPA, respectively, are
produced in 16% and 23% yield, respectively, when subjected to hydriodic acid
hydrolysis.
3. Indole based monomer units are present in pheomelanin, not just eumelanin.
4. On a mass basis, black human hair contains approximately 99% eumelanin and
1 % pheomelanin, brown and blond hair contain 95% eumelanin and 5%
pheomelanin; and red hair contains 67% eumelanin and 33% pheomelanin.
5. Codeine incorporation into human hair after oral administration is directly
proportional to the amount of eumelanin, but not pheomelanin, in the hair.
6. Amphetamine (a basic, positively charged drug at physiologic pH) shows a hair
color bias and is more highly incorporated into hair than is N-AcAp
(amphetamine's nonbasic, neutral analog) which lacks a hair color bias. This
167
occurs despite the fact that the free plasma AUC for N-AcAp is about 3-fold that
of amphetamine.
7. Amphetamine and cocaine, two basic, positively charged drugs that show a hair
color bias, bind to eumelanins and mixed eu-/pheomelanins to varying degrees,
but not to pure pheomelanin. BE and N-AcAp, net neutral drugs that do not show
a hair color bias, do not to bind to any type of melanin.
8. Melanin subtypes (beyond the eu-/pheomelanin distinction) do not appear to be
important predictors of drug-melanin binding.
9. Multiple hydrogen bonding interactions between basic drug molecules and
melanin, made possible by eumelanin secondary structure, likely comprise the
high affinityllow capacity melanin binding site, while ionic interactions between
positively charged, basic drug molecules and negatively charged melanin likely
comprise the low affinitylhigh capacity melanin binding site.
10. Cultured melanocytes, when pigmented, show an influx bias for amphetamine and
cocaine, but this was shown not to be the case for N-AcAp and BE.
11. PM are much slower to efflux amphetamine and cocaine, and do so less
completely than NPM.
12. Based on amphetamine and cocaine data, cultured melanocytes appear to be an
appropriate model for predicting hair color biases and relati ve hair incorporation
between drugs.
13. Classic passive diffusion models are not predictive of the relative levels of
incorporation of amphetamine, N-AcAp, cocaine, or BE into hair.
168
Significance
Determination of percent yields of melanin subtype degradation markers permit
the direct assessment of the mass amount of each melanin subtype in a hair sample. Such
information allows data (Le., on drug incorporation into hair) to be normalized for actual
melanin content-normalization for marker content or a nonspecific melanin content
based on one type of natural melanin (e.g., sepia melanin) is no longer necessary.
Unexpected findings in the course of these investigations provided evidence of indole
units from pure pheomelanin polymers. These data call for a revision of the classic
structure of pure pheomelanin as a solely benzothiazine-based polymer. Application of
the data derived from the study of synthetic model melanins suggests that the total
amount of melanin in hair is a more important predictor of hair color than is the mass
ratio between eumelanin and pheomelanin in hair. In addition, the data show that hair
eumelanin content is more important than pheomelanin content in regulating the
incorporation of codeine into hair. The drug-melanin binding data with amphetamine and
cocaine presented in Chapter 4 demonstrate that this is true for other basic drugs as well.
In addition, mass spectral studies presented in Chapter 4 shed new light on the
confounding nature of the chemical binding interaction between drugs and melanin.
Hair incorporation data (presented in Chapter 3) for amphetamine and N-AcAp
emphasize the importance of basicity in hair color bias and, coupled with the plasma
pharmacokinetic data of Nakahara and Kikura (41), suggest that passive diffusion is not
an appropriate mechanism for incorporation of these drugs into hair. These conclusions
are strongly bolstered by the cellular transport data in Chapter 5 that demonstrates
plentiful uptake (and a hair color bias) for amphetamine, but negligible uptake for N-
169
AcAp, even at 10 times the concentration of amphetamine. Efflux data, if an appropriate
model for part of the drug-incorporation-into-hair process, illustrate how drugs that show
a hair color bias by binding to melanin are retained in hair forming cells to a much
greater extent and for a much longer time than their chemical congeners that lack a hair
color bias. The implications gleaned from cellular transport data on amphetamine and N
AcAp are further supported by cocaine and BE, two additional drugs that have analogous
hair incorporation characteristics to amphetamine and N-AcAp.
Drug pairs with chemical properties similar to the ones used in these studies
would be expected to incorporate into hair, bind to melanin, and undergo cellular
transport in analogous manners. Further studies on basic, but uncharged molecules such
as diazepam, pKa 3.3, would further elucidate the role of charge state in hair color bias.
In conclusion, the data presented in this dissertation demonstrate that
amphetamine and cocaine exhibit hair color biases, and do so through non-diffusion
mediated cellular uptake and subsequent retention via a mechanism of eumelanin
binding.
APPENDIX
The data presented in this appendix are nuclear magnetic resonance (NMR), mass
spectral (MS), and ultraviolet (UV) spectral data that support the identities of chemicals
synthesized as they were needed for the work presented in this dissertation.
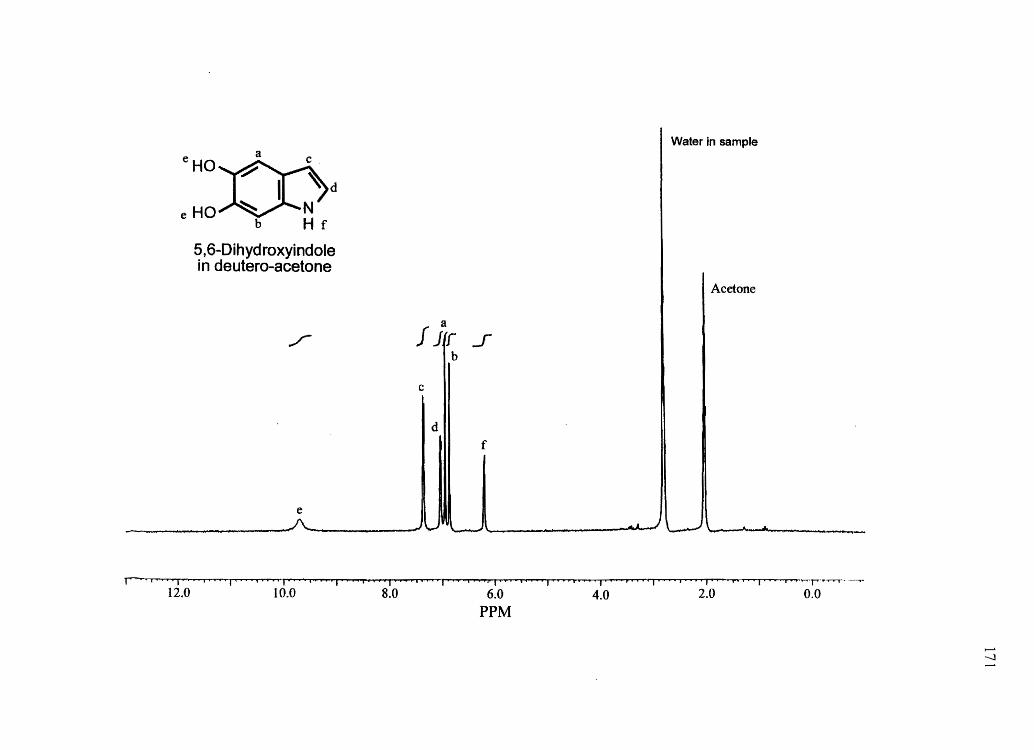
a eHoO)c. I 'd
~ N e HO b H f
5,6-Dihydroxyindole in deutero-acetone
../
e
Water in sample
Acetone
a
f ifr J b
c
d f
___________ ", _ " '-' ',-___ .Il ....... ..I \..---J \1..,.._-.1\0.,._-.. _____ _
I I "', I Ii I I r· .. ·......,.-.... 12.0 10.0 8.0 6.0 4.0 2.0 0.0
PPM
....... -.J
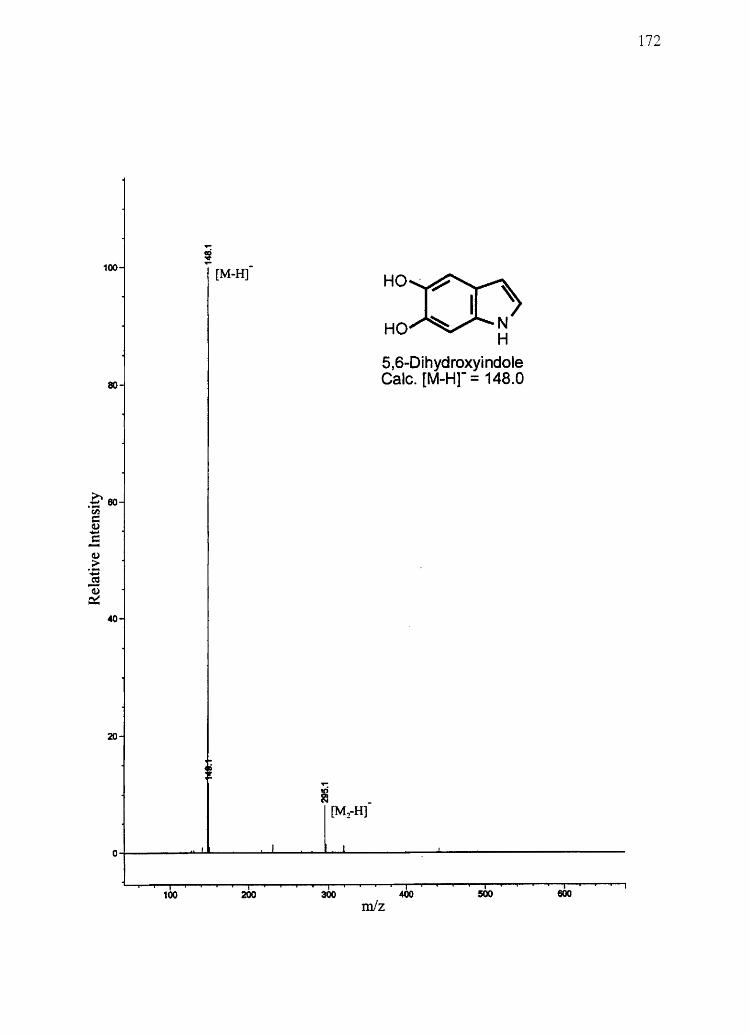
100 !
80
40
20
[M-Hf HO
HO
5,6-Dihydroxyindole Calc. [M-Hr = 148.0
o+-------U---~~----~--------~-----------------
100 200 300 400 600 mJz
172
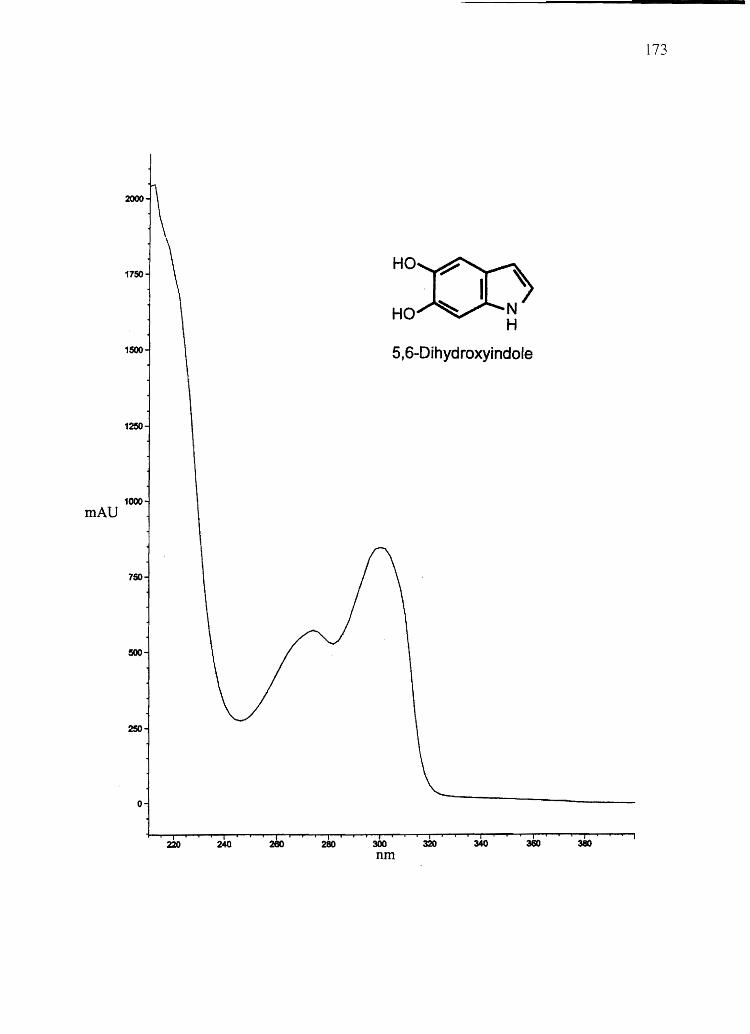
2000
1750
1500
1250
1000 mAD
750
500
250
o
220 240
173
HO
5,6-Dihydroxyindole
280 280 300 320 340 360 380 nm
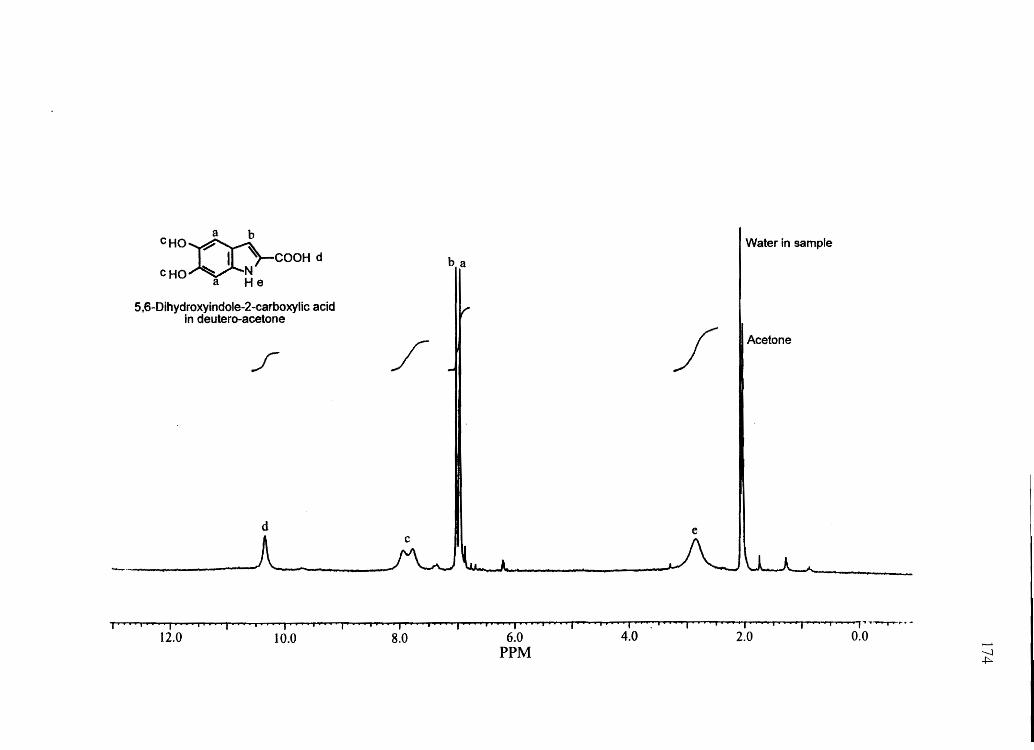
CH0m-a b ~I ~ COOHd
cHO ~ N a He
5,6-Dihydroxyindole-2-carboxylic acid in deutero-acetone
f
d
Water in sample
ba
/" / Acetone
e c
r~ I I I , I :--, I '"' ... ......,....... ....
12.0 10.0 8.0 6.0 4.0 2.0 0.0 PPM
...... -.J ~
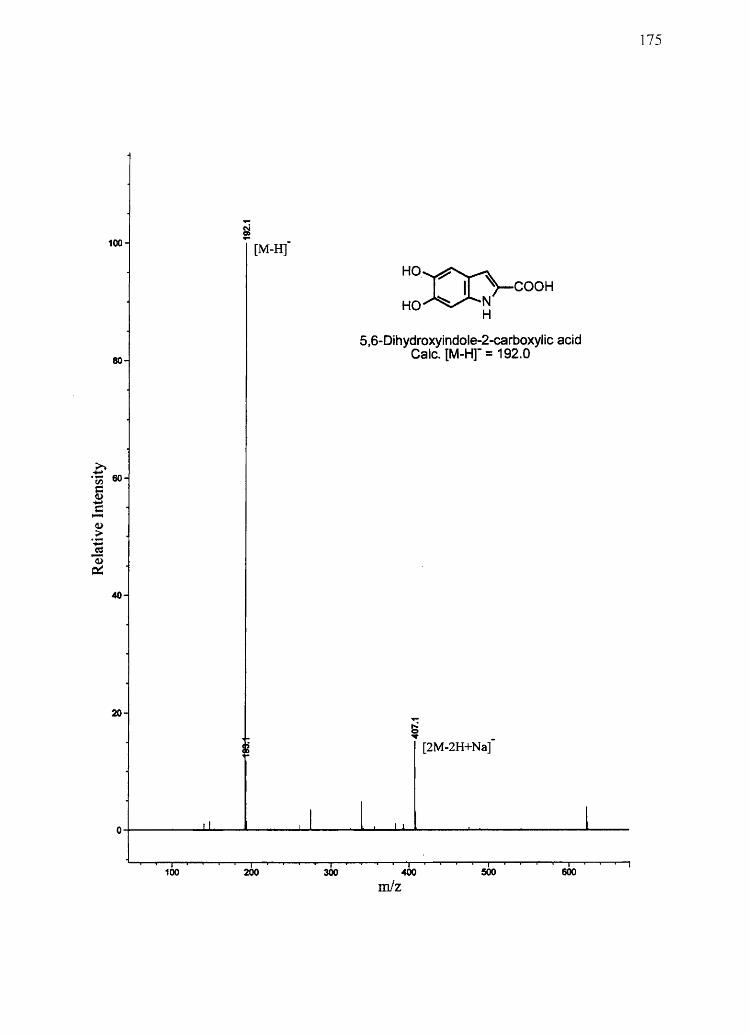
~ [M-H] 100-
eo-
40
20
HO~COOH HO~N'-
H
5,6-Dihydroxyindole-2-carboxylic acid Calc. IM-Hf = 192.0
..... S ....
[2M-2H+Naf
O+-____ ~,~,~ __ ~~I __ ~t~~,~l~ ____________ ~l __ _
400
mJz 600
I
175
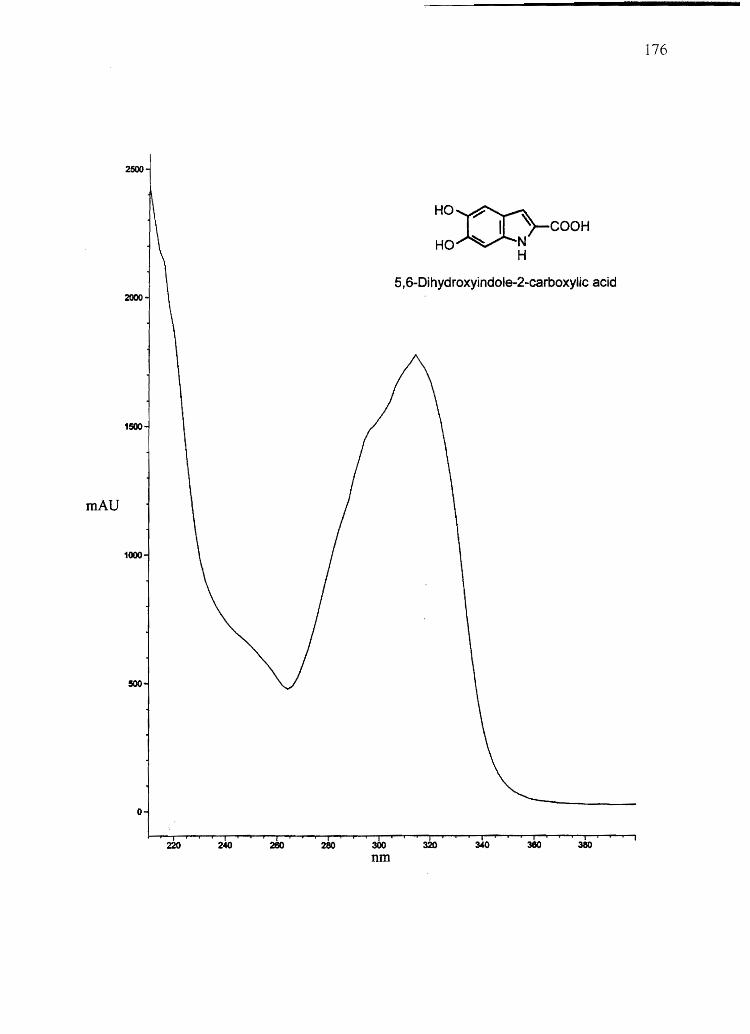
176
2500
HOm-I ' COOH HO ~ N
H
5,6-Dihydroxyindole-2-carboxylic acid 2000
1500
mAU
1000
500
o
220 240 280 380
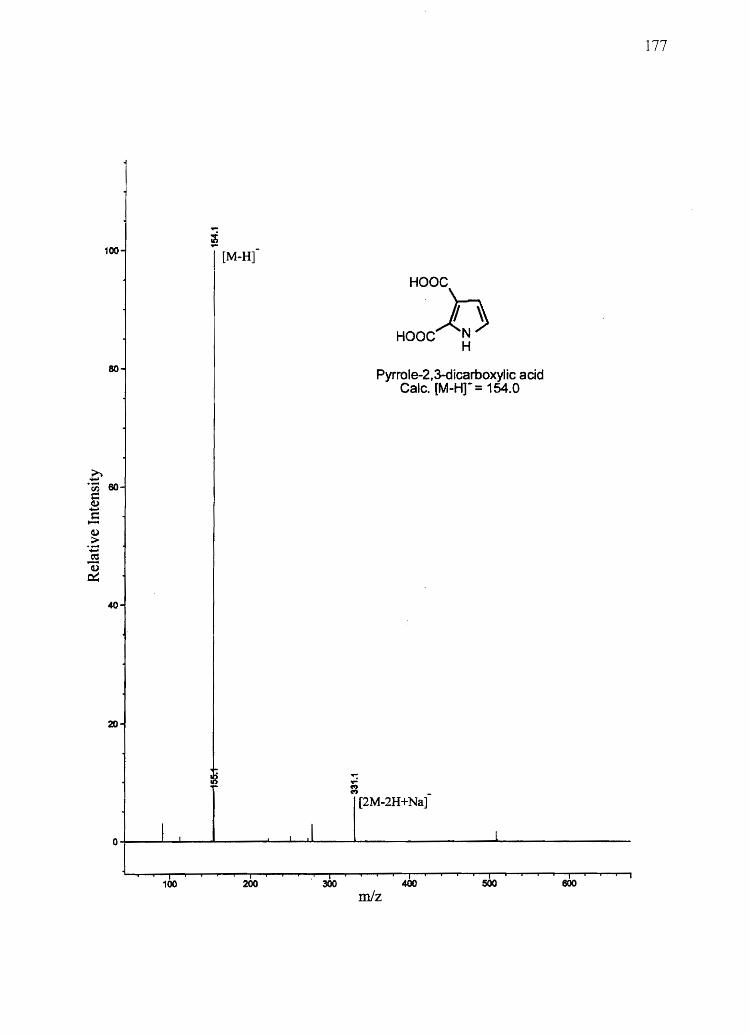
-~ I [M-Hf 100-
so-
20-
~i
0 I I I
I I I
100 200 300
...-
i
Haae
13 Haac N H
Pyrrole-2.3-<1icarboxylic acid Calc. [M-Hr= 154.0
-[2M-2H+Na]
l
460 500
mJz
177
eOo I
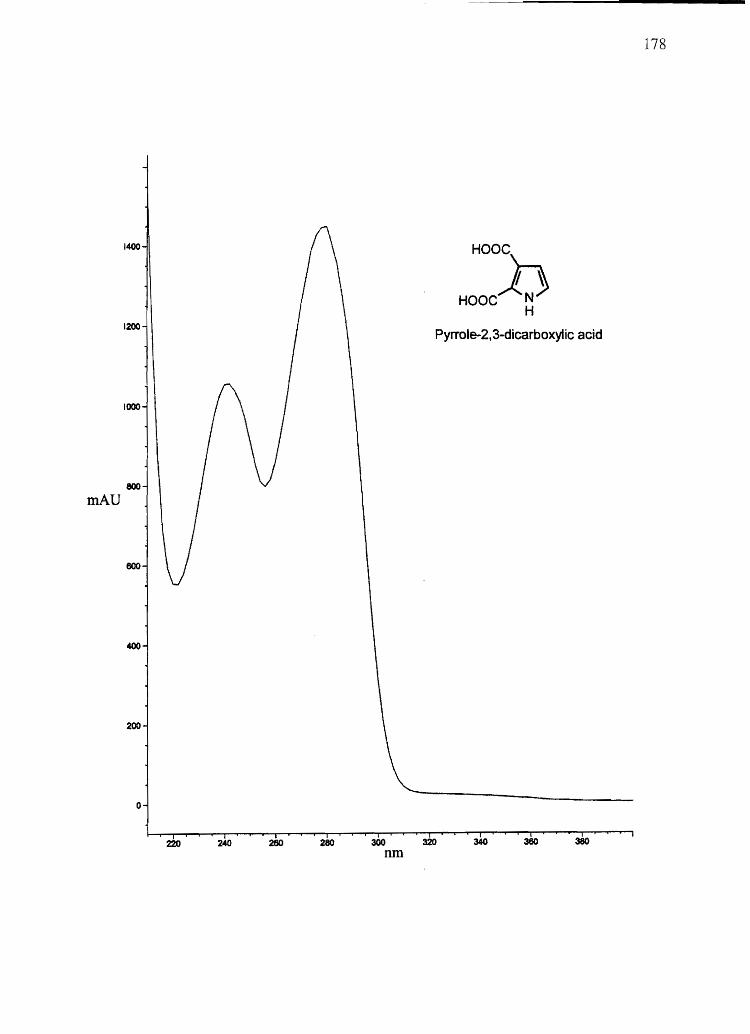
1400
1200
1000
800
mAU
600
400
200
o
220 280
178
Hooe
b HOOe N H
Pyrrole-2,3-dicarboxylic acid
300 320 340 360 380 nm

179
{ r 0
o
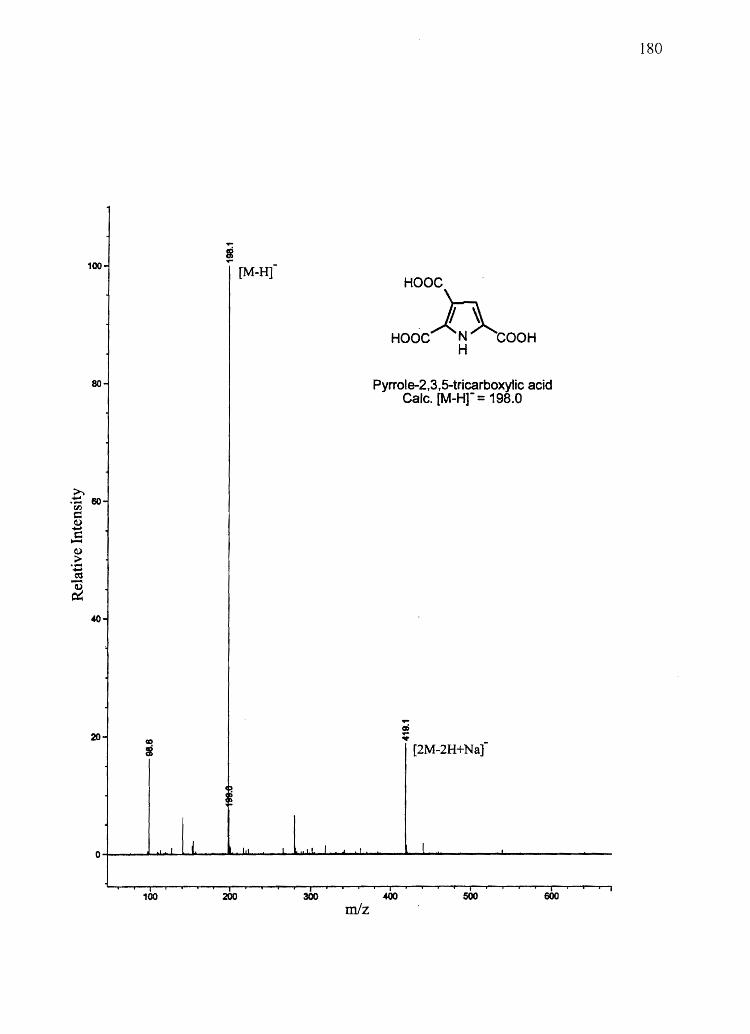
100-
80-
~ .- 60-
00 c:: Q)
~ Q)
> .~
~ 40-
20-
0
i [M-Hf
CD
i
; !
' I j 1.1
100 200
l .Ll I _L
I
300
mlz
Haac
h Haac N eOOH H
Pyrrole-2,3,5-tricarboxylic acid Calc. [M-Hr= 198.0
; ....
[2M-2H+Naf
I
400 500 600
180
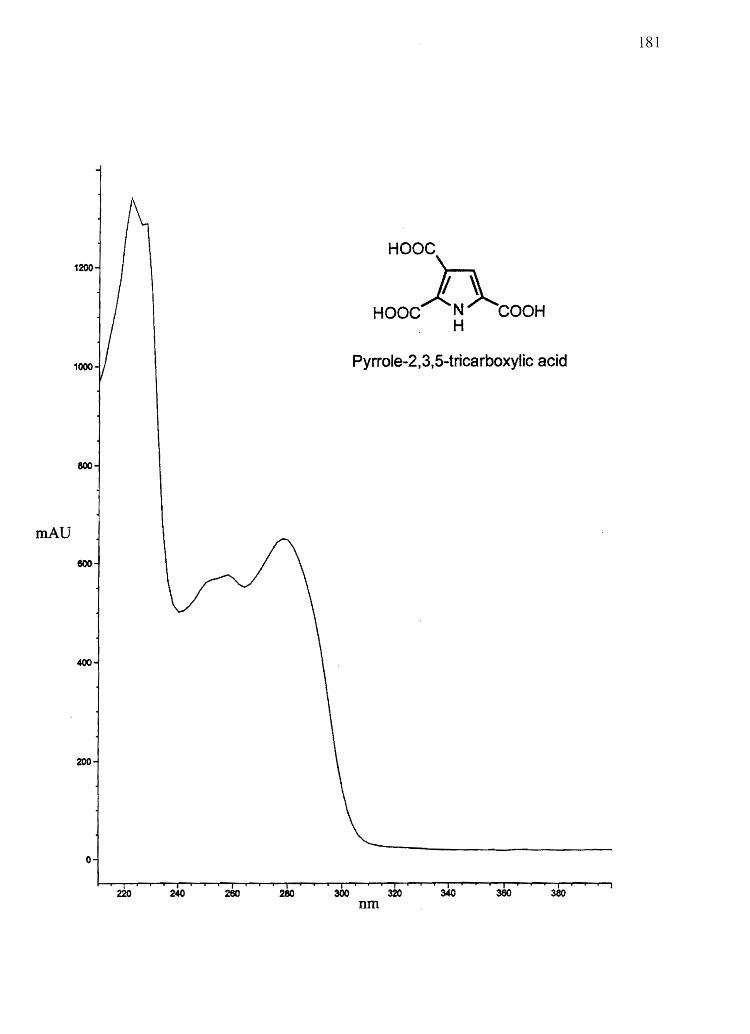
181
1200
HOOC
h Hooe N eaOH H
1000 Pyrrole-2,3,5-tricarboxylic acid
800
mAU
400
200
o
run
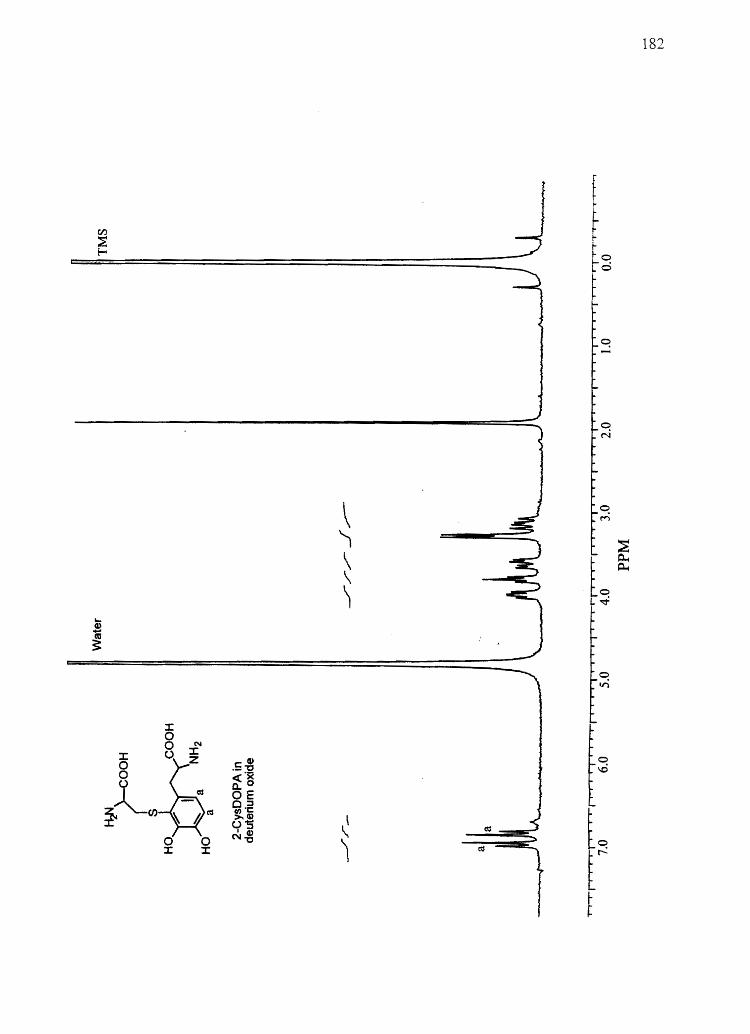
182
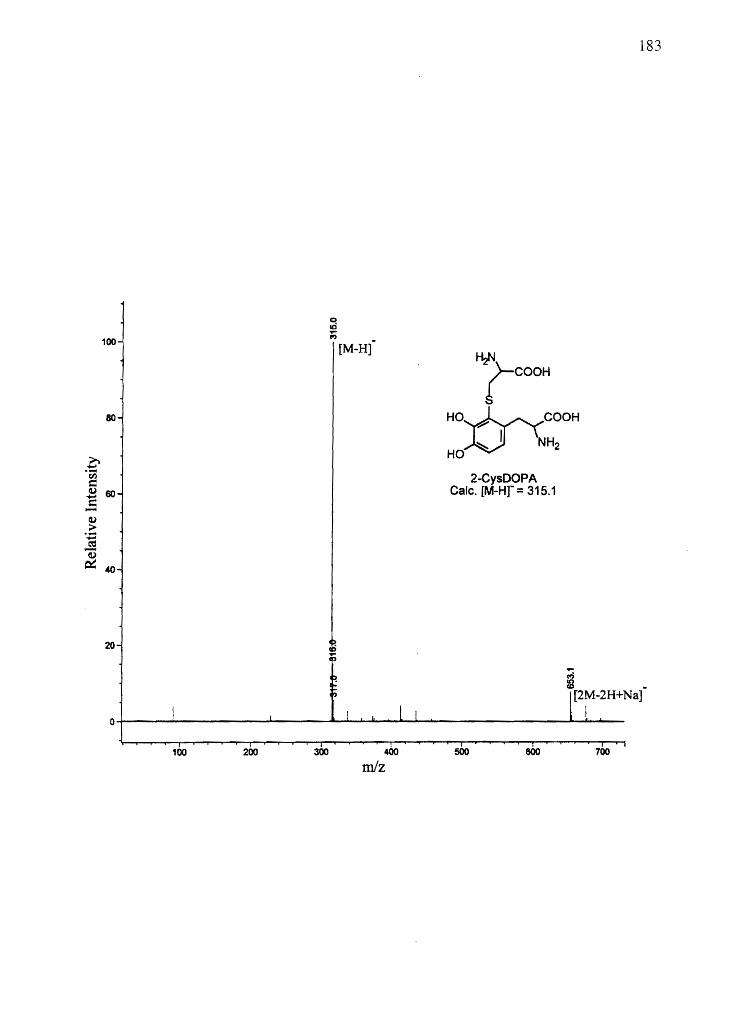
0 .;; 5 ..... c: -Q)
> .-1d 1) ~
183
~ 100 l'? -[M-H]
H1'J
t eOOH
80 Ho~eOOH ~, NH
HO 2
2-CysDOPA 60 Calc. [M-Hr= 315.1
40
20
.... ('P) :B _
[2M-2H+Na]
o+-----~--------~--------~~--~~~------------~~~--
100 200 300 400
mlz 500 600 700
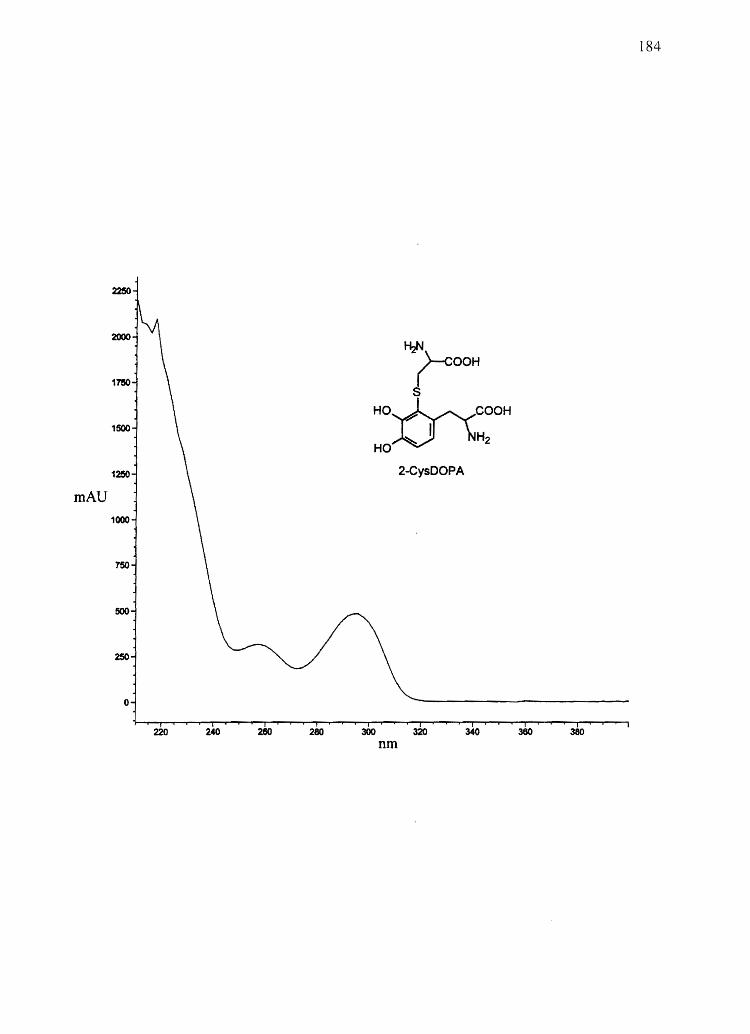
184
HI-J
1750 r OOH
S
HO~COOH 1500 I H
HO ~ 2
12!50 2-CysDOPA
mAU 1000
150
500
250
0
220 240 260 280 300 320 340 360 380 nm
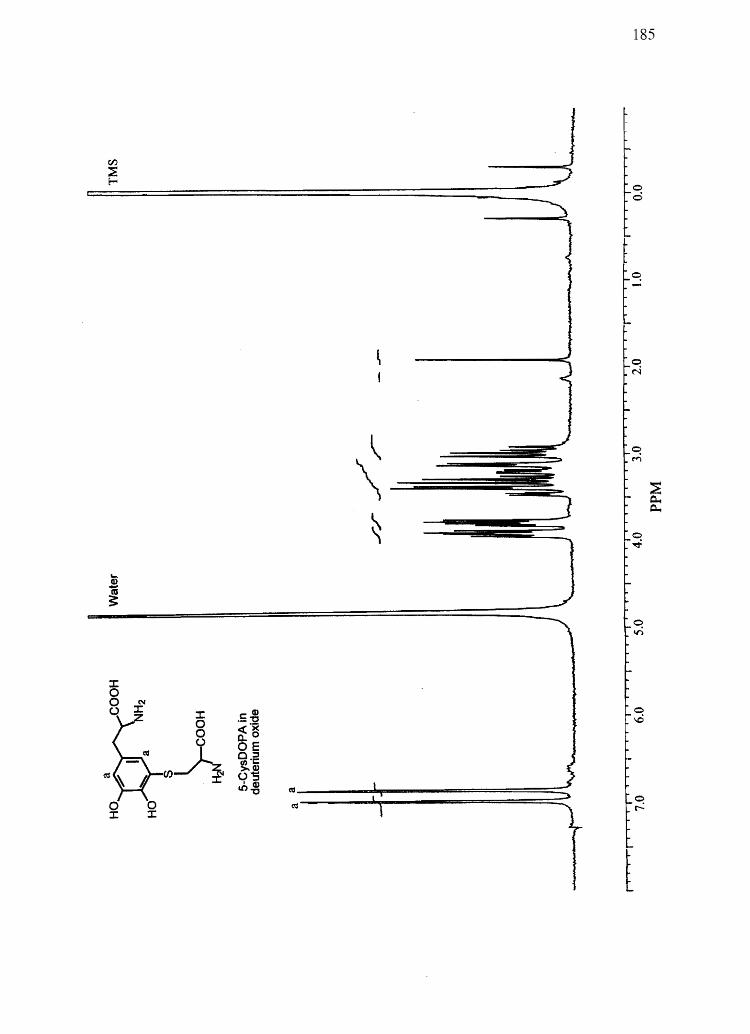
185
o d
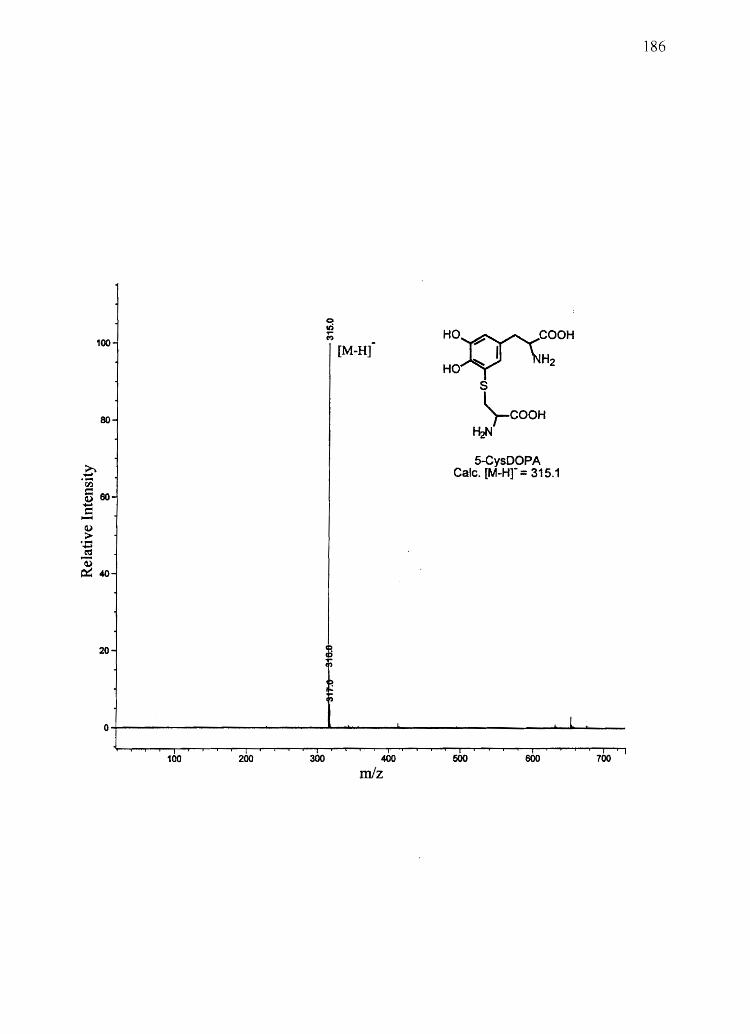
100
80
20
HO~COOH I H2
HO S
~COOH HzN
5-CysDOPA Calc. [M-Hr = 315.1
O+-----------------------~------~------------------~6------
100 200 300 400
mlz 500 600 100
186
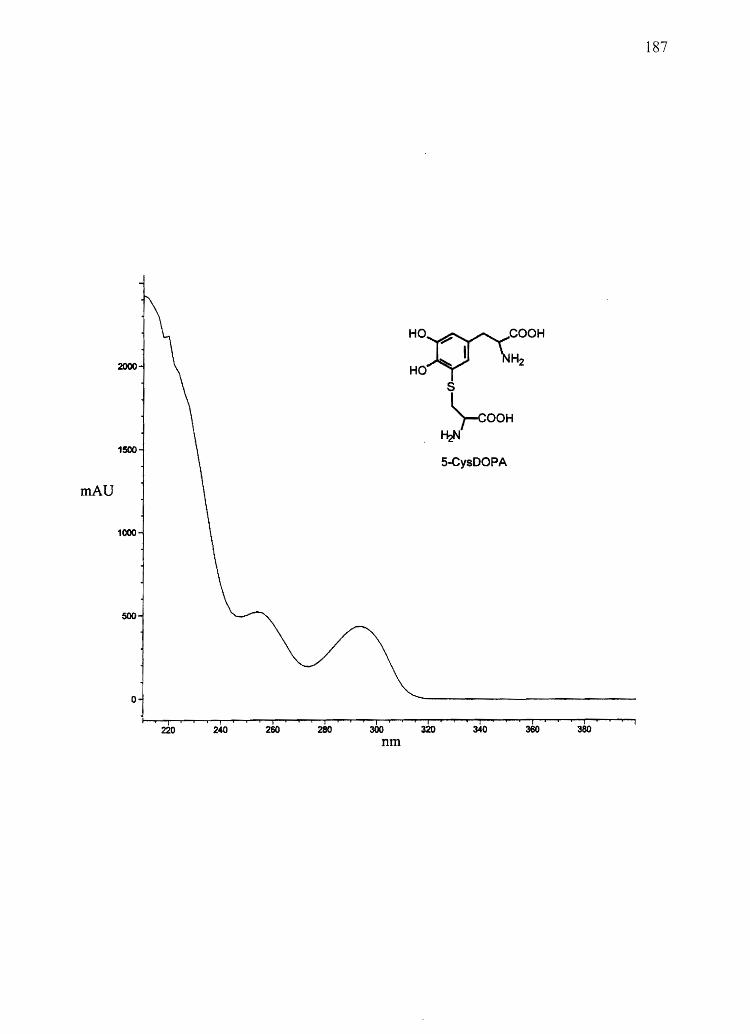
2000
1500
mAU
1000
500
o
220 240 260 280 300 nm
HO~COOH I H
HO 2
S
)..cOOH ~
5-CysDOPA
340 360
187
380
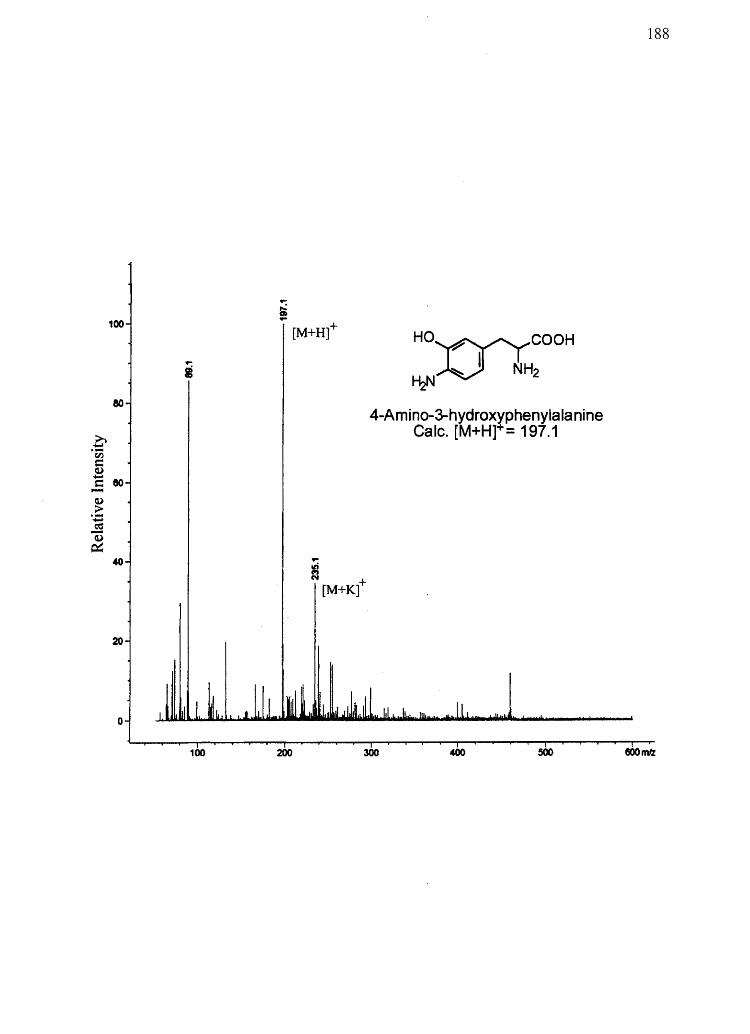
100
80
40
20
o
100 200
HO~COOH
~ NH2 ~
4-Amino-3-hydrox¥phenylalanine Calc. [M+H] = 197.1
300 400 500
188
800m
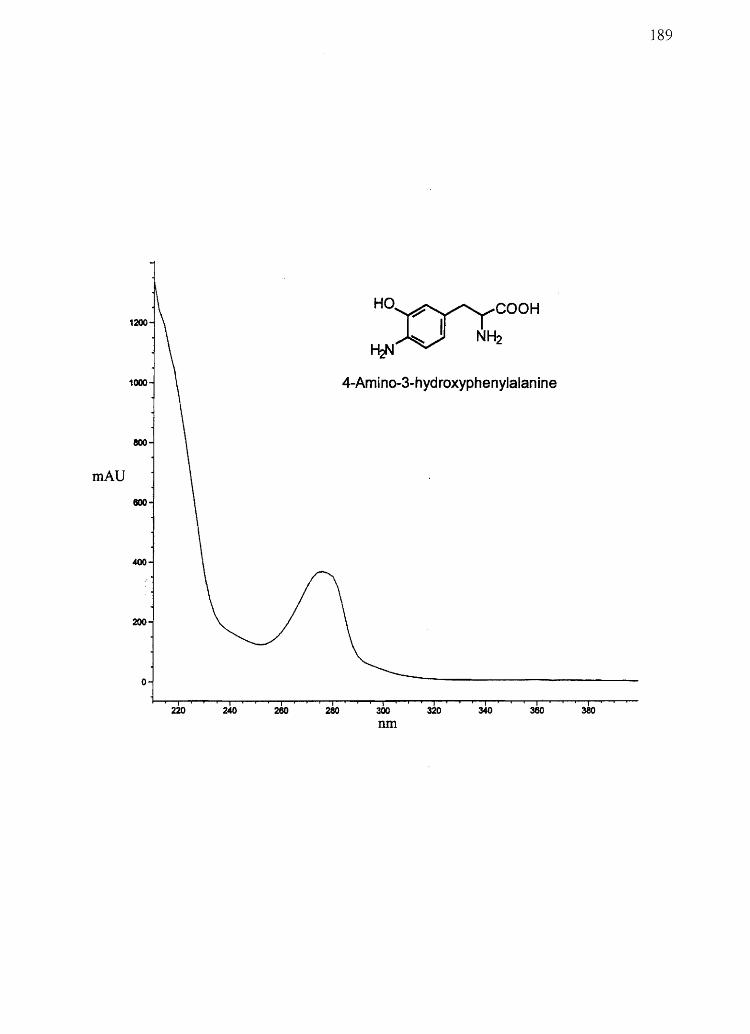
1200
1000
eoo
mAD
eoo
400
200
o
220 240 280
HO~COOH
..v NH2 HtJ
4-Amino-3-hydroxyphenylalanine
300
run 320 340 360
189
380
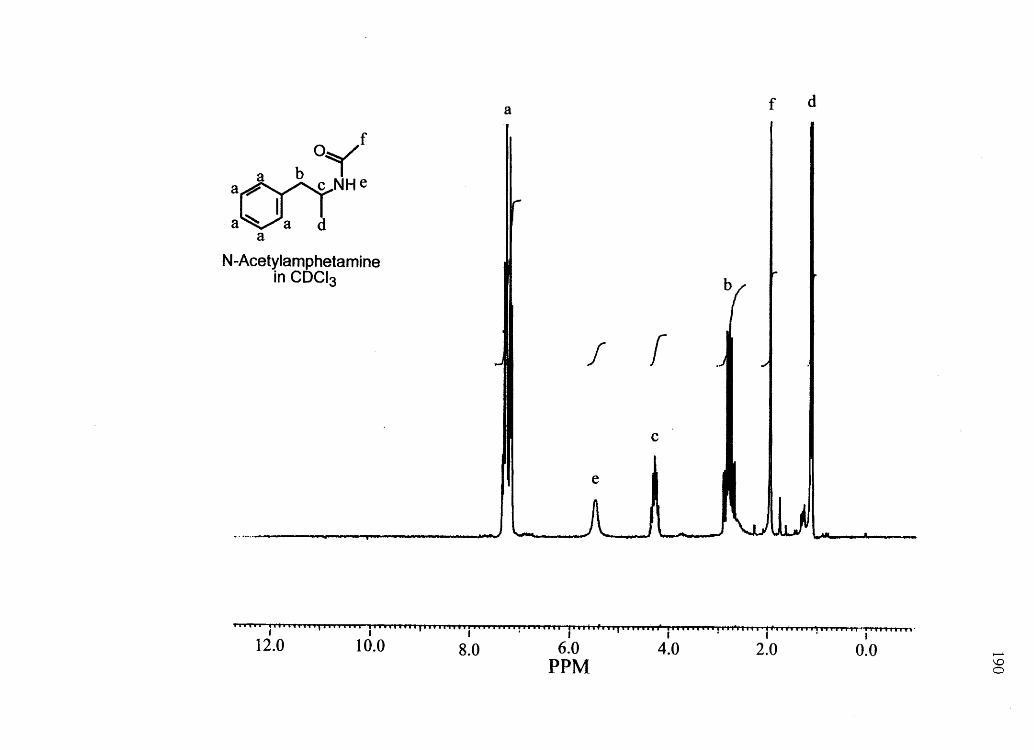
b oyf a~NHe aVa a
a
N-Acetylamphetamine in CDCI3
a f d
f r c
e
~i"·"j""i"""i i,·e"."e", •• ii"tj",.iU"':iiUi".i""., •• Ia"",i,e,"" iii"'i"'!"t"'I';"""t",t""'t. iii. It"."
12.0 10.0 8.0 6.0 4.0 2.0 0.0 PPM
......... \0 o
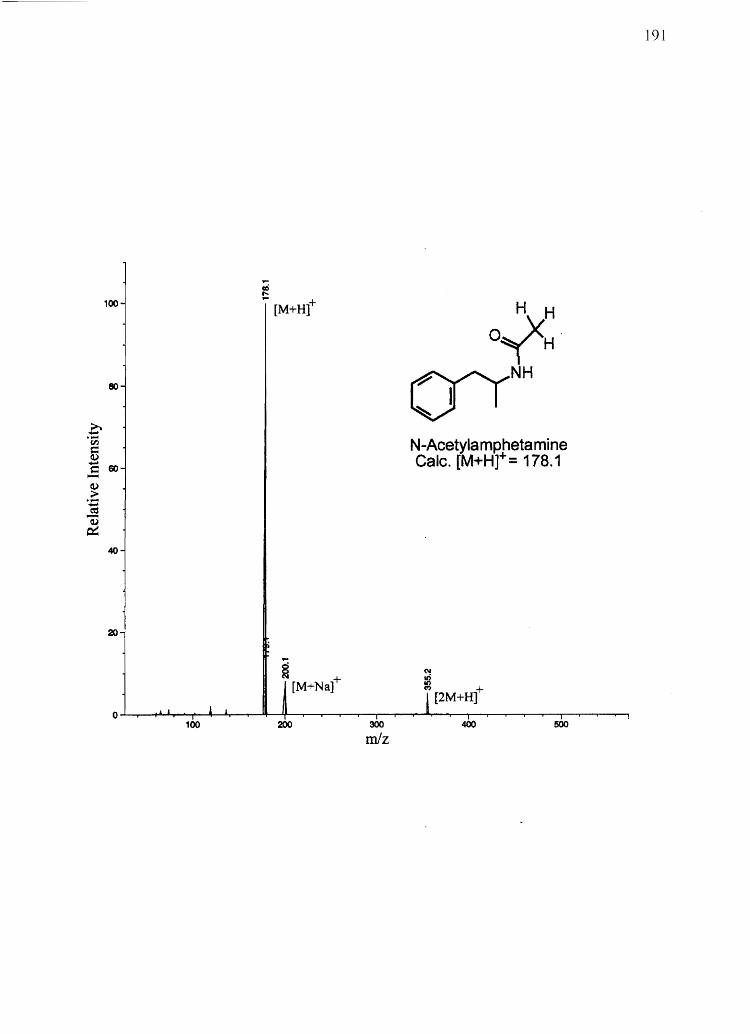
100
80
40
20
i [M+Nat
100 200 300
mlz
o~: OI
NH
N-Acetylamphetamine Calc. [M+H]+ = 178.1
400 500
191
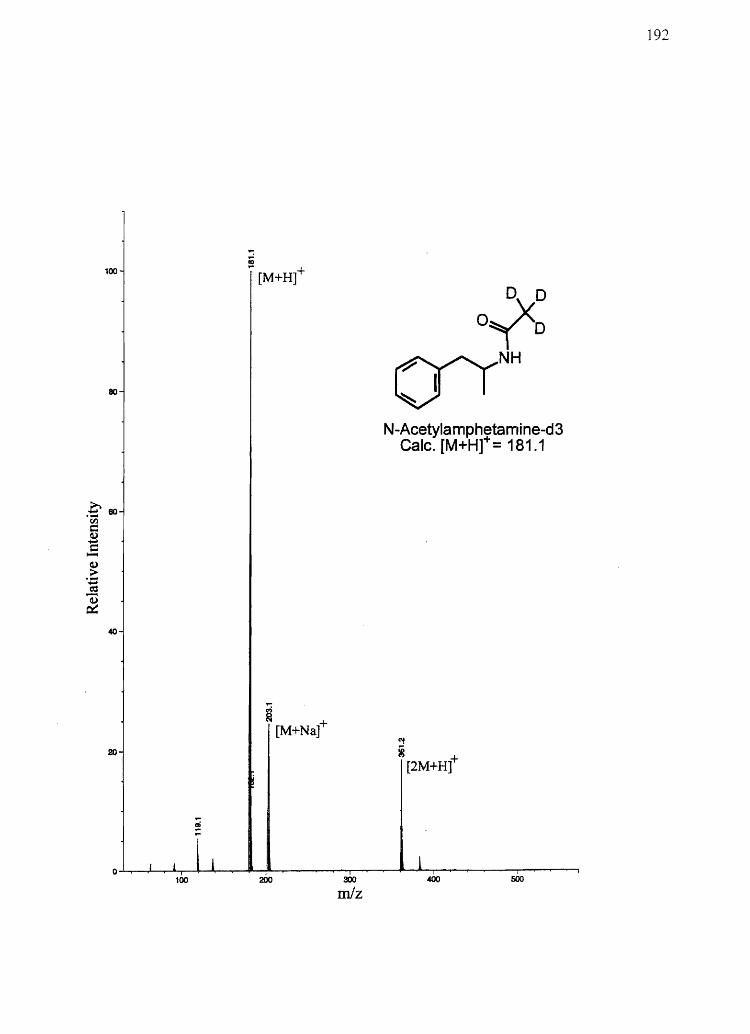
iiO 100- - [M+H]+
80-
40
~ DXD 0, °
OINH
N-Acetylarrlphetamine-d3 Calc. [M+H]+ = 181.1
192
REFERENCES
1. Casper, J. Praktisches Handbuch der Gerichtlichen Medizin., VoL 2, pp. 1857-1858. Berlin: A. Hirschwald, 1858.
2. Goldblum, R. W., Goldbaum, L. R., and Piper, W. N. Barbiturate concentrations in the skin and hair of guinea pigs. J. Invest. DermatoL 22: 121-128, 1954.
3. Harrison, W. H., Gray, R. M., and Solomon, L. M. Incorporation of Damphetamine into pigmented guinea-pig hair. Br J Dermatol. 91: 415-418, 1974.
4. Maugh, T. H. Hair: a diagnostic tool to complement blood serum and urine. Science. 202: 1271-1273, 1978.
5. Fletcher, D. J. Hair analysis. Proven and problematic applications. Postgrad Med. 72: 79-81, 84, 87-78,1982.
6. Hambidge, K. M. Hair analyses: worthless for vitamins, limited for minerals. Am J Clin Nutr. 36: 943-949, 1982.
7. Sky-Peck, H. H. Distribution of trace elements in human hair. Clin Physiol Biochem. 8: 70-80, 1990.
8. Contiero, E. and Folin, M. Trace elements nutritional status. Use of hair as a diagnostic tool. BioI Trace Elem Res. 40: 151-160, 1994.
9. Seidel, S., Kreutzer, R., Smith, D., McNeel, S., and Gilliss, D. Assessment of commercial laboratories performing hair mineral analysis. JAMA. 285: 67-72, 2001. .
10. Baumgartner, A. M., Jones, P. F., Baumgartner, W. A., and Black, C. T. Radioimmunoassay of hair for determining opiate-abuse histories. J Nuc1 Med. 20: 748-752, 1979.
11. Baumgartner, A. M., Jones, P. F., and Black, C. T. Detection of phencyclidine in hair. J Forensic Sci. 26: 576-581, 1981.
12. Baumgartner, W. A., Black, C. T., Jones, P. F., and Blahd, W. H. Radioimmunoassay of cocaine in hair: concise communication. J Nuc1 Med. 23: 790-792, 1982.
13. Smith, F. P. and Pomposini, D. A. Detection of phenobarbital in bloodstains, semen, seminal stains, saliva, saliva stains, perspiration stains, and hair. J Forensic Sci. 26: 582-586, 1981.
194
14. Valente, D., Cassini, M., Pigliapochi, M., and Vansetti, G. Hair as the sample in assessing morphine and cocaine addiction. Clin Chern. 27: 1952-1953., 1981.
15. Klug, E. Zur morphinbestimmung in kopfhaaren. Zeitschrift Rechtsmedizin. 84: 189-193, 1980.
16. Suzuki, O. Detection of trace amounts of methamphetamine in biological materials by mass fragmentometry. Koenshu-Iyo Masu Kenkyukai. 6: 123-132, 1981.
17. Ishiyama, 1., Nagai, T., and Toshida, S. Detection of basic drugs (methamphetamine, antidepressants, and nicotine) from human hair. J Forensic Sci. 28: 380-385, 1983.
18. Viala, A., Deturrneny, E., Aubert, C., Estadieu, M., Durand, A., Cano, 1. P., and Delmont, 1. Determination of chloroquine and monodesethylchloroquine in hair. 1 Forensic Sci. 28: 922-928, 1983.
19. Suzuki, 0., Hattori, H., and Asano, M. Detection of methamphetamine and amphetamine in a single human hair by gas chromatography/chemical ionization mass spectrometry. J Forensic Sci. 29: 611-617, 1984.
20. Holbrook, K. A. and Minami, S. I. Hair follicle embryogenesis in the human: Characterization of events in vivo and in vitro. Ann N Y Acad Sci. 642: 167-196, 1991.
21. Chase, H. B. Growth of the hair. Physiol Revs. 34: 113-126, 1954.
22. Millar, S. E., Willert, K., Salinas, P. C., Roelink, H., Nusse, R., Sussman, D. 1., and Barsh, G. S. WNT signaling in the control of hair growth and structure. Dev BioI. 207: 133-149, 1999.
23. Epstein, W. L. and Maibach, H. 1. Cell proliferation and movement in human hair bulbs. In: W. Montagna and R. L. Dobson (eds.), Advances in Biology of Skin, Vol. IX, pp. 83-97. Oxford: Pergamon Press, 1967.
24. Parakkal, P. F. The fine structure of anagen hair follicle of the mouse. In: W. Montagna and R. L. Dobson (eds.), Advances in Biology of Skin, Vol. IX, pp. 441-469. Oxford: Pergamon Press, 1967.
195
25. Robbins, C. R. Chemical and physical behavior of human hair, 3rd edition. New York: Springer-Verlag, 1994.
26. Harkey, M. R. Anatomy and physiology of hair. Forensic Sci Int. 63: 9-18.,1993.
27. Rusting, R. L. Hair: Why it grows, why it stops. Scientific Anlerican. 284: 70-79, 2001.
28. Paus, R. and Cotsarelis, G. The biology of hair follicles. N Engl J Med. 341: 491 497, 1999.
29. Henderson, G. L. Mechanisms of drug incorporation into hair. Forensic Sci Int. 63: 19-29,1993.
30. Cone, E. J. Mechanisms of drug incorporation into hair. Ther Drug Monit. 18: 438-443, 1996.
31. Baumgartner, W. A., Hill, V. A., and Blahd, W. H. Hair analysis for drugs of abuse. J Forensic Sci. 34: 1433-1453,1989.
32. Huestis, M. A., Henningfield, J. E., and Cone, E. J. Blood cannabinoids. I. Absorption of THC and formation of 11-0H-THC and THCCOOH during and after smoking marijuana. J Anal Toxicol. 16: 276-282., 1992.
33. Cirimele, V., Kintz, P., and Mangin, P. Testing human hair for cannabis. Forensic SciInt. 70: 175-182, 1995.
34. Jurado, C., Gimenez, M. P., Menendez, M., and Repetto, M. Simultaneous quantification of opiates, cocaine and cannabinoids in hair. Forensic Sci Int. 70:
,. 165-174,1995.
35. Wilkins, D., Haughey, H., Cone, E., Huestis, M., Foltz, R., and Rollins, D. Quantitative analysis of THC, 11-0H-THC, and THCCOOH in human hair by negative ion chemical ionization mass spectrometry. J. Anal. Toxicol. 19: 483-491,1995.
36. Nakahara, Y., Ochiai, T., and Kikura, R. Hair analysis for drugs of abuse. V. The facility in incorporation of cocaine into hair over its major metabolites, benzoylecgonine and ecgonine methyl ester. Arch Toxicol. 66: 446-449, 1992.
37. Harkey, M. R., Henderson, G. L., and Zhou, ·C. Simultaneous quantitation of cocaine and its major metabolites in human hair by gas chromatography/chemical ionization mass spectrometry. J Anal Toxicol. 15: 260-265, 1991.
38. Cone, E. J., Yousefnejad, D., Darwin, W. D.; and Maguire, T. Testing human hair for drugs of abuse. II. Identification of unique cocaine metabolites in hair of drug
196
abusers and evaluation of decontamination procedures. J Anal Toxico!. 15: 250-255, 1991.
39. Moller, M. R., Fey, P., and Rimbach, S. Identification and quantitation of cocaine and its metabolites, benzoylecgonine and ecgonine methyl ester, in hair of Bolivian coca chewers by gas chromatography/mass spectrometry. J Anal Toxico!. 16: 291-296, 1992.
40. Gerstenberg, B., Schepers, G., Voncken, P., and Volkel, H. Nicotine and cotinine accumulation in pigmented and unpigmented rat hair. Drug Metab Dispos. 23: 143-148,1995.
41. Nakahara, Y. and Kikura, R. Hair analysis for drugs of abuse. XIII. Effect of structural factors on incorporation of drugs into hair: the incorporation rates of amphetamine analogs. Arch Toxico!. 70: 841-849, 1996.
42. Borges, C. R., Wilkins, D. G., and Rollins, D. E. Amphetamine and N-acetyl amphetamine incorporation into hair: An investigation of the potential role of drug basicity in hair color bias. J Anal Toxicol. 25: 221-227, 2001.
43. Nakahara, Y., Takahashi, K., and Kikura, R. Hair analysis for drugs of abuse. X. Effect of physicochemical properties of drugs on the incorporation rates into hair. BioI Pharm Bull. 18: 1223-1227, 1995. -
44. Kidwell,D. A. and Blank, D. L. Hair analysis: techniques and potential problems. In: L Sunshine (ed.) Recent Developments in Therapeutic Drug Monitoring and Clinical Toxicology, pp. 555. New York: Marcel Dekker, 1992.
45. Cone, E. J. and Joseph, R. E. J. The potential for bias in hair testing for drugs of abuse. In: P. Kintz (ed.) Drug testing in hair, pp. 69-93. Boca Raton, Forida: CRC Press, 1996.
46. Joseph, R. E., Jr., Tsai, W. J., Tsao, L. 1., Su, T. P., and Cone, E. J. In vitro characterization of cocaine binding sites in human hair. J Pharmacol Exp Ther. 282: 1228-1241, 1997.
47. Bolt, A. G. Interactions between human melanoprotein and chlorpromazine derivatives. 1. Isolation and purification of hllman melanoprotein from hair and melanoma tissue. Life Sci. 6: 1277-1283., 1967.
48. Bolt, A. G. and Forrest, I. S. Interaction between human melanoprotein and chlorpromazine derivatives. n. Spectrophotometric studies. Life Sci. 6: 1285-1292, 1967.
49. Stout, P. R. and Ruth, J. A. Comparison of in vivo and in vitro deposition of rhodamine and fluorescein in hair. Drug Metab Dispos. 26: 943-948, 1998.
50. Larsson, B., Oskarsson, A., and Tjalve, H. Binding of paraquat and diquat on melanin. Exp Eye Res. 25: 353-359, 1977.
197
51. Larsson, B. and Tjalve, H. Studies on the mechanism of drug-binding to melanin. Biochem Pharmacol. 28: 1181-1187, 1979.
52. Larsson, B. S. Interaction between chemicals and melanin. Pigment Cell Res. 6: 127-133,1993.
53. Stepien, K. B. and Wilczok, T. Studies of the mechanism of chloroquine binding to synthetic DOPA- melanin. Biochem Pharmacol. 31: 3359-3365, 1982.
54. Howells, L., Godfrey, M., and Sauer, M. J. Melanin as an adsorbent for drug residues. Analyst. 119: 2691-2693, 1994.
55. Shimada, K., Baweja, R., Sokoloski, T., and Patil, P. N. Binding characteristics of drugs to synthetic levodopa melanin. J Pharm Sci. 65: 1057-1060, 1976.
56. Baweja, R., Sokoloski, T. D., and Patil, P. N. Competitive binding between cocaine and various drugs to synthetic levodopa melanin. J Pharm Sci. 66: 1544-1547, 1977.
57. Mars, U. and Larsson, B. S. Pheomelanin as a binding site for drugs and chemicals. Pigment Cell Res. 12: 266-274, 1999.
58. Ings, R. M. J. The melanin binding of drugs and its implications. Drug Metab Rev. 15: 1183-1212, 1984.
59. Debing, I., Ijzerman, A. P., and Vauquelin, G. Melanosome binding and oxidation-reduction properties of synthetic L- dopa-melanin as in vitro tests for drug toxicity. Mol Pharmacol. 33: 470-476, 1988.
60. Carr, C. J., Forrest, I. S., Potts, A. M., Woert, M. H. V., VanderWende, C., and Forrest, F. M. Melanin affinity and psychopharmacologic effects of drugs. Psychopharmacology Bulletin. 10: 38-47, 1974.
61. Lowrey, A. H., Famini, G. R., Loumbev, V., Wilson, L. Y., and Tosk, J. M. Modeling drug-melanin interaction with theoretical linear solvation energy relationships. Pigment Cell Res. 10: 251-256, 1997.
62. Raghavan, P. R., Zane, P. A., and Tripp, S. L. Calculation of drug-melanin binding energy using molecular modeling. Experientia. 46: 77-80, 1990.

63. Joseph, R. E., Jr., Su, T. P., and Cone, E. J. In vitro binding studies of drugs to hair: influence of melanin and lipids on cocaine binding to Caucasoid and Africoid hair. J Anal Toxicol. 20: 338-344, 1996.
198
64. Potsch, L., Skopp, G., and Moeller, M. R. Influence of pigmentation on the codeine content of hair fibers in guinea pigs. J Forensic Sci. 42: 1095-1098, 1997.
65. Gygi, S. P., Wilkins, D. G., and Rollins, D. E. A comparison of phenobarbital and codeine incorporation into pigmented and nonpigmented rat hair. J Pharm Sci. 86: 209-214,1997.
66. Hubbard, D. L., Wilkins, D. G., and Rollins, D. E. The incorporation of cocaine and metabolites into hair: effects of dose and hair pigmentation. Drug Metab Dispos. 28: 1464-1469, 2000.
67. Nakahara, Y., Kikura, R., and Takahashi, K. Hair analysis for drugs of abuse XX. Incorporation and behaviors of seven methamphetamine homologs in the rat hair root. Life Sci. 63: 883-893, 1998.
68. Hold, K., Wilkins, D., Crouch, D., Rollins, D., and Maes, R. Detection of stanozolol in hair by negative ion chemical ionization mass spectrometry. J Anal Toxicol. 20: 345-349, 1996.
69. Slawson, M. H., Wilkins, D. G., and Rollins, D. E. The incorporation of drugs into hair: relationship of hair color and melanin concentration to phencyclidine incorporation. J Anal Toxicol. 22: 406-413, 1998.
70. Uematsu, T., Sato, R., Fujimori, 0., and Nakashima, M. Human scalp hair as evidence of individual dosage history of haloperidol: a possible linkage of haloperidol excretion into hair with hair pigment. Arch Dermatol Res. 282: 120-125,1990.
71. Uematsu, T., Miyazawa, N., Okazaki, 0., and Nakashima, M. Possible effect of pigment on the pharmacokinetics of ofloxacin and its excretion in hair. J Pharm Sci. 81: 45-48, 1992.
72. Mieczkowski, T. and Newel, R. Statistical examination of hair color as a potential biasing factor in hair analysis. Forensic Sci Int. 107: 13-38, 2000.
73. Kelly, C. K., Mieczkowski, T., Sweeney, S. A., and Bourland, J. A. Hair analysis for drugs of abuse. Hair color and race differentials or systematic differences in drug preferences? Forensic Sci Int. 107: 63-86, 2000.
74. Mieczkowski, T. Is a Itcolor effect" demonstrated for hair analysis of carbamazepine? Life Sci. 67: 39-43, 2000.
199
75. Nakahara, Y. The effects of physiochemical factors on incorporation of drugs into hair and behavior of drugs in hair root. In: T. Mieczkowski (ed.) Drug Testing Technology, pp. 49-72. Boca Raton, FL: CRC Press LLC, 1999.
76. Borges, C. R., Roberts, J. C., Wilkins, D. G., and Rollins, D. E. Cocaine, benzoylecgonine, amphetamine, and N-acetylamphetamine binding to melanin subtypes., Submitted.
77. D'Amato, R. J., Lipman, Z. P., and Snyder, S. H. Selectivity of the parkinsonian neurotoxin MPTP: toxic metabolite MPP+ binds to neuromelanin. Science. 231: 987 -989, 1986.
78. D'Amato, R. J., Benham, D. F., and Snyder, S. H. Characterization of the binding of N-methyl-4-phenylpyridine, the toxic metabolite of the parkinsonian neurotoxin N-methyl-4-phenyl-1 ,2,3,6- tetrahydropyridine, to neuromelanin. J Neurochem. 48: 653-658, 1987.
79. Lindquist, N. G. Accumulation of drugs on melanin. Acta Radiol [Diagn]. 325: 1-92,1973.
80. Ben-Shachar, D. and Youdim, M. B. Iron, melanin and dopamine interaction: relevance to Parkinson's disease. Prog Neuropsychopharmacol BioI Psychiatry. 17: 139-150, 1993.
81. Bruenger, F. W., Stover, B. J., and Atherton, D. R. The incorporation of various metal ions into in vivo- and in vitro- produced melanin. Radiat Res. 32: 1-12, 1967.
82. Potts, A. M. and Au, P. C. The affinity of melanin for inorganic ions. Exp Eye Res. 22: 487-491, 1976.
83. Felix, C. C., Hyde, J. S., Sarna, T., and Sealy, R. C. Interactions of melanin with metal ions: Electron spin resonance evidence for chelate complexes of metal ions with free radicals. J Am Chern Soc. 100: 3922-3926, 1978.
84. Mason, C. G. Ocular accumulation and toxicity of certain systemically administered drugs. J Toxicol Environ Health. 2: 977-995, 1977.
85. Zemel, E., Loewenstein, A., Lei, B., Lazar, M., and Perlman, 1. Ocular pigmentation protects the rabbit retina from gentamicin-induced toxicity. Invest Ophthalmol Vis Sci. 36: 1875-1884, 1995.
86. Conlee, J. W., Bennett, M. L., and Creel, D. J. Differential effects of gentamicin on the distribution of cochlear function in albino and pigmented guinea pigs. Acta Otolaryngol. 115: 367-374, 1995.
87. Barr-Hamilton, R. M., Matheson, L. M., and Keay, D. G. Ototoxicity of cisplatinum and its relationship to eye colour. J Laryngol Otol. 105: 7-11, 1991.
200
88. D'Amato, R. J., Alexander, G. M., Schwartzman, R. J., Kitt, C. A., Price, D. L., and Snyder, S. H. Evidence for neuromelanin involvement in MPTP-induced neurotoxicity. Nature. 327: 324-326, 1987.
89. D'Amato, R. J., Alexander, G. M., Schwartzman, R. J., Kitt, C. A., Price, D. L., and Snyder, S. H. Neuromelanin: a role in MPTP-induced neurotoxicity. Life Sci. 40: 705-712,1987.
90. Kaliszan, R., Kaliszan, A., and Wainer, 1. W. Prediction of drug binding to melanin using a melanin-based high- performance liquid chromatographic stationary phase and chemometric analysis of the chromatographic data. J Chromatogr. 615: 281-288, 1993.
91. Wilkerson, V. A. The chemistry of human epidermis. II. The isoelectric points of the stratum corneum, hair and nails as determined by electrophoresis. J BioI Chern. 112: 329, 1935.
92. Dehn, D. L., Claffey, D. J., Duncan, M. W., and Ruth, J. A. Nicotine and cotinine adducts of a melanin intermediate demonstrated by matrix-assisted laser desorption/ionization time-of-flight mass spectrometry. Chern Res Toxicol. 14: 275-279,2001.
93. Scott, G. and Zhao, Q. Rab3a and SNARE proteins: potential regulators of melanosome movement. J Invest Dermatol. 116: 296-304, 2001.
94. Prota, G. Melanins and Melanogenesis, p. 290. San Diego: Academic Press, 1992.
95. Novellino, L., Napolitano, A., and Prota, G. Isolation and characterization of mammalian eumelanins from hair and irides. Biochim Biophys Acta. 1475: 295-306,2000.
96. Prota, G. Melanin-producing cells. Melanins and Melanogenesis, pp. 14-33. San Diego: Academic Press, 1992.
97. Seiberg, M., Paine, C., Sharlow, Andrade-Gordon, P., Costanzo, M., Eisinger, M., and Shapiro, S. S. Inhibition of melanosome transfer results in skin lightening. J Invest Dermatol. 115: 162-167, 2000.
98. McGuire, J. Three sites for hormonal control of the pigment cell. In: W. Montagna, E. J. Van Scott, and R. B. Stoughton (eds.), Advances in Biology of Skin--Pharmacology and the Skin, Vol. XII, pp. 421-445. New York: Meredith Corporation, 1972.
99. Mottaz, J. H. and Zelickson, A. S. Melanin transfer: a possible phagocytic process. J Invest Dennatol. 49: 605-610, 1967.
201
100. Wolff, K., Jimbow, K., and Fitzpatrick, T. B. Experimental pigment donation in vivo. J Dltrastruct Res. 47: 400-419, 1974.
101. Okazaki, K., Dzuka, M., Morikawa, F., Toda, K., and Seiji, M. Transfer mechanism of melanosomes in epidermal cell culture. J Invest Dermatol. 67: 541-547, 1976.
102. Bamicott, N. A. and Birbeck, M. S. Electron microscope studies on pigment formation in human hair follicles. In: M. Gordon (ed.) Pigment Cell Biology, pp. 549-561. New York: Academic Press, 1959.
103. Prota, G. Genetic and honnonal regulation of melanogenesis. Melanins and Melanogenesis, pp. 185-207. San Diego: Academic Press, 1992.
104. Schallreuter, K., Slominski, A., Pawelek, J. M., Jimbow, K., and Gilchrest, B. A. What controls melanogenesis? Exp Dermatol. 7: 143-150, 1998.
105. Park, H. Y., Perez, J. M., Laursen, R., Hara, M., and Gilchrest, B. A. Protein kinase C-beta activates tyrosinase by phosphorylating serine residues in its cytoplasmic domain. J BioI Chern. 274: 16470-16478, 1999.
106. Park, H. Y., Russakovsky, V., Ohno, S., and Gilchrest, B. A. The beta isoform of protein kinase C stimulates human melanogenesis by activating tyrosinase in pigment cells. J BioI Chern. 268: 11742-11749, 1993.
107. Prota, G. Photobiology and photochemistry of melanogenesis. Melanins and Melanogenesis, pp. 208-224. San Diego: Academic Press, 1992.
108. Wood, J. M., Schallreuter-Wood, K. D., Lindsey, N. J., Callaghan, S., and Gardner, M. L. A specific tetrahydrobiopterin binding domain on tyrosinase controls melanogenesis. Biochem Biophys Res Commun. 206: 480-485, 1995.
109. Schallreuter, K. D., Wood, J. M., Korner, C., Harle, K. M., Schulz-Douglas, V., and Werner, E. R. 6-Tetrahydrobiopterin functions as a DVB-light switch for de novo melanogenesis. Biochim Biophys Acta. 1382: 339-344, 1998.
110. Palumbo, A., d'Ischia, M., Misuraca, G., Carratu, L., and Prota, G. Activation of mammalian tyrosinase by ferrous ions. Biochim Biophys Acta. 1033: 256-260, 1990.
111. Eller, M. S., Ostrom, K., and Gilchrest, B. A. DNA damage enhances melanogenesis. Proc Natl Acad Sci D S A. 93: 1087-1092, 1996.
112. Psychemedics www.psychemedics.com. Psychemedics Web Site, 2001.
113. Tsatsakis, A. M., Psillakis, and Paritsis, N. Phenytoin concentration in head hair sections: a method to evaluate the history of drug use. J Clin Psychopharmacol. 20: 560-573, 2000.
114. Nakahara, Y. Hair analysis for abused and therapeutic drugs. J Chromatogr B Biomed Sci Appl. 733: 161-180, 1999.
202
115. Tsatsakis, A. !vI., Psillakis, T., Stefis, A., Assithianakis, P., Vlahonikolis, 1. G., Michalodimitrakis, M. N., and Helidonis, E. Determination of phenytoin in sections of head hair: a prelin1inary study to evaluate the history of drug use. Boll Chim Farm. 137: 459-466, 1998.
116. Psillakis, T., Tsatsakis, A. M., Christodoulou, P., Michalodimitrakis, M., Paritsis, N., and Helidonis, E. Carbamazepine levels in head hair of patients under longterm treatment: a method to evaluate the history of drug use. J Clin Pharmacol. 39: 55-67, 1999.
117. Goldberger, B. A., Darraj, A. G., Caplan, Y. H., and Cone, E. J. Detection of methadone, methadone metabolites, and other illicit drugs of abuse in hair of methadone-treatment subjects. J Anal Toxico!. 22: 526-530, 1998.
118. Goulle, J. P. and Kintz, P. [A new tool for biological study: hair analysis. Value in medical practice]. Rev Med Interne. 17: 826-835, 1996.
119. Miyazawa, N., Uematsu, T., Mizuno, A., Nagashima, S., and Nakashima, M. Ofloxacin in human hair determined by high performance liquid chromatography. Forensic Sci Int. 51: 65-77, 1991.
120. Uematsu, T., Miyazawa, N., and Nakashima, M. The measurement of ofloxacin in hair as an index of exposure. Eur J Clin Pharmacol. 40: 581-584, 1991.
121. Paulsen, R. B., Wilkins, D. G., Slawson, M. H., Shaw, K., and Rollins, D. E. Effect of four laboratory decontamination procedures on the quantitative determination of cocaine and metabolites in hair., Submitted.
122. Joseph, R. E., Jr., Hold, K. M., Wilkins, D. G., Rollins, D. E., and Cone, E. J. Drug testing with alternative matrices II. Mechanisms of cocaine and codeine deposition in hair. J Anal Toxico!. 23: 396-408, 1999.
123. Joseph, R. E., Jr., Oyler, J. M., Wstadik, A. T., Ohuoha, C., and Cone, E. J. Drug testing with alternative matrices I. Pharmacological effects and disposition of cocaine and codeine in plasma, sebum, and stratum corneum. J Anal Toxico!. 22: 6-17, 1998.

203
124. Kidwell, D. A., Lee, H., and DeLauder, S. F. Evidence for bias in hair testing and procedures to correct bias. Forensic Sci Int. 107: 39-61, 2000.
125. DeLauder, S. F. and Kidwell, D. A. The incorporation of dyes into hair as a model for drug binding. Forensic Sci Int. 107: 93-104, 2000.
126. Rollins, D. E., Wilkins, D. G., Mizuno, A., Slawson, M. H., and Borges, C. R. The role of pigmentation in the disposition of drugs of abuse in human hair. Clin Pharm Exp Ther. 67: 113,2000.
127. Gygi, S. P., Joseph, R~ E., Jr., Cone, E. J., Wilkins, D. G., and Rollins, D. E. Incorporation of codeine and metabolites into hair. Role of pigmentation. Drug Metab Dispos. 24: 495-501, 1996.
128. Slawson, M. H., Wilkins, D. G., Foltz, R. L., and Rollins, D. E. Quantitative determination of phencyclidine in pigmented and nonpigmented hair by ion-trap mass spectrometry. J Anal Toxicol. 20: 350-354, 1996.
129. Ito, S. Reexamination of the structure of eumelanin. Biochim Biophys Acta. 883: 155-161,1986.
130. Ito, S. and Wakamatsu, K. Chemical degradation of melanins: application to identification of dopamine-melanin. Pigment Cell Res. 11.' 120-126, 1998.
131. Ozeki, H., Wakamatsu, K., Ito, S., and Ishiguro, 1. Chemical characterization of eumelanins with special emphasis on 5,6-dihydroxyindole-2-carboxylic acid content and molecular size. Anal Biochem. 248: 149-157, 1997.
132. Kolb, A. M., Lentjes, E. G., Smit, N. P., Schothorst, A., Vermeer, B. J., and Pavel, S. Determination of pheomelanin by measurement of aminohydroxyphenylalanine isomers with high-performance liquid chromatography. Anal Biochem. 252: 293-298, 1997.
133. Sealy, R. C., Puzyna, W., Kalyanaraman, B., and Felix, C. C. Identification by electron spin resonance spectroscopy of free radicals produced during autoxidative melanogenesis. Biochim Biophys Acta. 800: 269-276, 1984.
134. Kalyanaraman, B., Felix, C. C., and Sealy, R. C. Electron spin resonance-spin stabilization of semiquinones produced during oxidation of epinephrine and its analogues. J BioI Chern. 259: 354-358, 1984.
135. al-Kazwini, A. T., O'Neill, P., Adams, G. E., Cundall, R. B., Maignan, 1., and Junino, A. One-electron oxidation of C(2) and C(3) methyl substituted 5,6-dihydroxyindoles: model pathways of melanogenesis. Melanoma Res. 4: 343-350, 1994.
204
136. Bertolino, N. L., Klein, L. M., and Freedberg, I. M. Biology of hair follicles. In: T. E. Fitzpatrick, A. Z. Eisen, K. Wolff, 1. M. Freedberg, and F. K. Austen (eds.), Dermatology in General Medicine, pp. 289. New York: McGraw-Hill, 1994.
137. Gallagher, R. P., Hill, G. B., Bajdik, C. D., Coldman, A. J., Fincham, S., McLean, D. 1., and Threlfall, W. J. Sunlight exposure, pigmentation factors, and risk of nonmelanocytic skin cancer. n. Squamous cell carcinoma. Arch Dermatol. 131: 164-169, 1995.
138. Gallagher, R. P., Hill, G. B., Bajdik, C. D., Fincham, S., Coldman, A. J., McLean, D. 1., and Threlfall, W. J. Sunlight exposure, pigmentary factors, and risk of nonmelanocytic skin cancer. 1. Basal cell carcinoma. Arch Dermatol. 131: 157-163,1995.
139. Bliss, J. M., Ford, D., Swerdlow, A. J., Armstrong, B. K., Cristofolini, M., Elwood, J. M., Green, A., Holly, E. A., Mack, T., and MacKie, R. M. Risk of cutaneous melanoma associated with pigmentation characteristics and freckling: systematic overview of 10 case-control studies. The International Melanoma Analysis Group (IMAGE). Int J Cancer. 62: 367-376, 1995.
140. Fenselau, C. Tandem mass spectrometry: the competitive edge for pharmacology. Annu Rev Pharmacol Toxicol. 32: 555-578, 1992.
141. Ito, S. and Fujita, K. Microanalysis of eumelanin and pheomelanin in hair and melanomas by chemical degradation and liquid chromatography. Anal Biochem. 144: 527-536, 1985.
142. Wakamatsu, K. and Ito, S. Preparation of eumelanin-related metabolites 5,6-dihydroxyindole, 5,6-dihyroxyindole-2-carboxylic acid, and their O-methyl derivatives. Anal Biochem. 170: 335-340, 1988.
143. Ito, S., Inoue, S., Yamamoto, Y., and Fujite, K. Synthesis and antitumor activity of cysteinyl-3,4-dihydroxyphenylalanines and related compounds. J Med Chern. 24: 673-677,1981.
144. Ito, S., Wakamatsu, K., and Ozeki, H. Spectrophotometric assay of eumelanin in tissue samples. Anal Biochem. 215: 273-277,1993.
145. Anderson, R. L. Practical Statistics for Analytical Chemistry. Practical Statistics for Analytical Chemistry, pp. 89-121. New York: Van Nostrand-Reinhold, 1987.
146. Gygi, S. P., Colon, F., Raftogianis, R. B., Galinsky, R. E., Wilkins, D. G., and Rollins, D. E. Dose-related distribution of codeine and its metabolites into rat hair. Drug Metab Dispos. 24: 282-287, 1996.
205
]47. Napolitano, A., Pezzella, A., Vincensi, M. R., and Prota, G. Oxidative degradation of melanins to pyrrole acids: a model study. Tetrahedron. 51: 5913-5920, 1995.
148. Napolitano, A., Pezzella, A., d'Ischia, M., and Prota, G. New pyrrole acids by oxidative degradation of eumelanins with hydrogen peroxide. Further hints to the mechanism of pigment breakdown. Tetrahedron. 52: 8775-8780, ] 996.
149. Ito, S., Imai, Y., Jimbow, K., and Fujita, K. Incorporation of sulfhydryl compounds into melanins in vitro. Biochim Biophys Acta. 964: 1-7, 1988.
150. d'Ischia, M., Napolitano, A., and Prota, G. Sulphydryl compounds in melanogenesis. Part n. Reactions of cysteine and glutathione with dopachrome. Tetrahedron. 43: 5357-5362, 1987.
151. Reid, R. W., O'Connor, F. L., Deakin, A. G., Ivery, D. M., and Crayton, J. W. Cocaine and metabolites in human graying hair: pigmentary relationship. J Toxicol Clin Toxieol. 34: 685-690, 1996.
152. Kronstrand, R., Forstberg-Peterson, S., Kagedal, B., Ahlner, J., and Larson, G. Codeine concentration in hair after oral administration is dependent on melanin content. Clin Chern. 45: 1485-1494, 1999.
153. Rollins, D., Wilkins, D., Gygi, S., Slawson, M., and Nagasawa, P. Testing for drugs of abuse in hair-experimental observations and indications for future research. Forensic Sci. Rev. 9: 23-36, 1996.
154. Jurado, C., Menendez, M., Repetto, M., Kintz, P., Cirimele, V., and Mangin, P. Hair testing for cannabis in Spain and France: is there a difference in consumption? J Anal Toxieol. 20: 111-115, 1996.
155. Choi, M. H. and Chung, B. C. GC-MS determination of steroids related to androgen biosynthesis in human hair with pentafluorophenyldimethylsilyltrimethylsilyl derivatisation. Analyst. 124: 1297-1300, 1999.
156. Kintz, P., Cirimele, V., Jeanneau, T., and Ludes, B. Identification of testosterone and testosterone esters in human hair. J Anal Toxicol. 23: 352-356, 1999.
157. Hold, K. M., Borges, C. R., Wilkins, D. G., Rollins, D. E., and Joseph, R. E., Jf. Detection of nandrolone, testosterone, and their esters in rat and human hair samples. J Anal Toxieol. 23: 416-423, 1999.
158. Kintz, P., Cirimele, V., and Ludes, B. Physiological concentrations of DHEA in human hair. J Anal Toxicol. 23: 424-428, 1999.
159. Kintz, P., Cirimel, V., Devaux, M., and Ludes, B. Dehydroepiandrosterone (DHEA) and testosterone concentrations in human hair after chronic DHEA supplementation. Clin Chern. 46: 414-415, 2000.
206
160. Choi, M. H., Kim, K. R., and Chung, B. C. Determination of estrone and 17 betaestradiol in human hair by gas chromatography-mass spectrometry. Analyst. 125: 711-714,2000.
161. Deng, X. S., Kurosu, A., and Pounder, D. J. Detection of anabolic steroids in head hair. J Forensic Sci. 44: 343-346, 1999.
162. Kintz, P., Cirimele, V., Sachs, H., Jeanneau, T., and Ludes, B. Testing for anabolic steroids in hair from two bodybuilders. Forensic Sci Int. 101: 209-216, 1999.
163. Segura, J., Pichini, S., Peng, S. H., and de la Torre, X. Hair analysis and detectability of single dose administration of androgenic steroid esters. Forensic Sci Int. 107: 347-359, 2000.
164. Halmekoski, J. and Saarinen, P. Synthesis of acetyl derivatives of some sympathomimetic amines. Farmaseuttinen Aikakauslehti. 75: 335-353, 1966.
165. Borges, C. R., Roberts, J. C., Wilkins, D. G., and Rollins, D. E. Relationship of melanin degradation products to actual melanin content: Application to human hair. Anal Biochem. 290: 116-125,2001.
166. Mieczkowski, T. and Kruger, M. Assessing the effect of hair color on cocaine positive outcomes in a large sample: A logistic regression on 56,445 cases using hair analysis. TIAFT Bulletin. 31: 9-11, 200 1.
167. Limat, A., Salomon, D., Carraux, P., Saurat, J. H., and Hunziker, T. Human melanocytes grown in epidermal equivalents transfer their melanin to follicular outer root sheath keratinocytes. Arch Dermatol Res. 291,' 325-332, 1999.
168. Lindquist, N. G. and Ullberg, S. The melanin affinity of chloroquine and chlorpromazine studied by whole body autoradiography. Acta Pharmacol Toxicol (Copenh).2: 1-32, 1972.
169. Fukuda, M. and Sasaki, K. Changes in the antibacterial activity of melanin-bound drugs. Ophthalmic Res. 22: 123-127, 1990.
170. Wu, E. Y., Chiba, K., Trevor, A. J., and Castagnoli, N., Jr. Interactions of the 1-methyl-4-phenyl-2,3-dihydropyridinium species with synthetic dopaminemelanin. Life Sci. 39: 1695-1700, 1986.
207
171. d'Ischia, M. and Prota, G. Biosynthesis, structure, and function of neuromelanin and its relation to Parkinson's disease: a critical update. Pigment Cell Res. 10: 370-376, 1997.
172. Prota, G. and d'Ischia, M. Neuromelanin: a key to Parkinson's disease. Pigment Cell Res. 6: 333-335, 1993.
173. Ibrahim, H. and Aubry, A. F. Development of a melanin-based high-performance liquid chromatography stationary phase and its use in the study of drug-melanin binding interactions. Anal Biochem. 229: 272-277, 1995.
174. Martin, A. N., Swarbrick, J., and Camarata, A. Physical Pharmacy, p. 434. Philadelpha, PA: Lea & Febiger, 1969.
175. Ebbing, D. D. General Chemistry, 4th edition. Boston, MA: Houghton Mifflin Company, 1993.
176. Mieczkowski Drug Testing Technology. Boca Raton, FL: CRC Press LLC, 1999.
177. Krueger, G. G., Jorgensen, C. M., Matsunami, N., Morgan, J. R., Liimatta, A., Meloni-Ehrig, A., Shepard, R., and Petersen, M. J. Persistent transgene expression and normal differentiation of immortalized human keratinocytes in vivo. J Invest Dermatol. 112: 233-239, 1999.
178. Bennett, D. C., Cooper, P. J., and Hart, 1. R. A line of non-tumorigenic mouse melanocytes, syngeneic with the B 16 melanoma and requiring a tumour promoter for growth. Int J Cancer. 39: 414-418, 1987.
179. Parker, R. B., Williams, C. L., Laizure, S. C., and Lima, J. J. Factors affecting serum protein binding of cocaine in humans. J Pharmacol Exp Ther. 275: 605-610, 1995.
180. Franksson, G. and Anggard, E. The plasma protein binding of amphetamine, catecholamines and related compounds. Acta Pharmacol Toxicol. 28: 209-214, 1970.
181. Wilkins, D. G., Valdez, A. S., Nagasawa, P. R., Gygi, S. P., and Rollins, D. E. Incorporation of drugs for the treatment of substance abuse into pigmented and nonpigmented hair. J Pharm Sci. 87: 435-440, 1998.
182. Wilkins, D. G., Mizuno, A., Borges, C. R., Slawson, M. H., Rollins, D. E., and Mizuno, A. Ofloxacin as a reference marker for hair analysis., Submitted.


![Melanin Translation[1]](https://img.pdfslide.net/doc/110x75/577d22411a28ab4e1e96f1ae/melanin-translation1.jpg)