Embed Size (px)
Citation preview
MINISTRY OF JUSTICETHE NATIONAL TRADE REGISTER OFFICE
Bucureşti, Bd. Unirii nr. 74, Bl. J3b, tronson II+III, sector 3; Telefon: +40 21 316.08.04, 316.08.10; Fax: +40 21 316.08.03; Cod poştal: 030837
Website: www.onrc.ro; E-mail: [email protected]; Cod identificare Fiscală: 14942091
COMPANIES BY FOREIGN DIRECTINVESTMENT
STATISTICAL SYNTHESYSOF THE NATIONAL TRADE REGISTER'S DATA
-31 May 2013-
- No. 180 -
MINISTRY OF JUSTICETHE NATIONAL TRADE REGISTER OFFICE
Operations such as incorporation of companies, submission of changes,
and strike-off are carried out based on Law No.26/1990, as republished,
Law No.31/1990, as republished and on the Methodological Norms no.
P/608/1998.
This work reflects the evolution of the operations regarding trading
companies with foreign participation in the share capital with the Trade
Register Office attatched to Bucharest Law Court and the Trade Register
Offices attatched to County Law Courts.
The data contained in the Central Trade Register refer to operations for
which law sets out the obligation of being registered in the trade registers
kept by the 42 trade register offices attatched to law courts.
The content of this publication shall not be reproduced, partly or entirely , in original or modified form, and shall not be stored in a recovery system and shall not be transmitted in any form or by any means without prior written authorization of the Ministry of Justice - The National Trade Register Office.
The content of this publication may be used in articles, studies, books, as supporting or explanatory data only by clearly and accurately indicating the source.
2
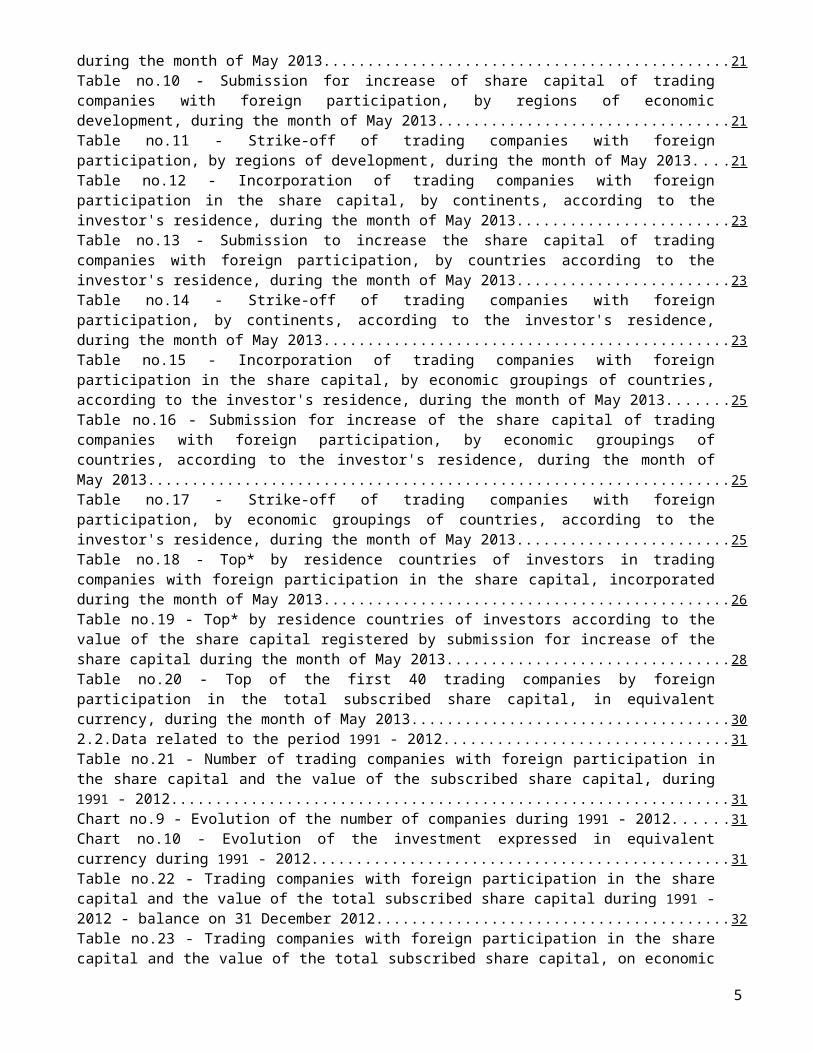
CONTENTS1.Definitions.............................................................................................................................................................52.1.Tables and statistical charts - data related to May 2013....................................................................................7Table no.1 - Number of trading companies with foreign participation in the share capital and the subscribed share capital - balance on 31 May 2013.................................................................................................7Chart no.1 - Structure of the number of trading companies with foreign participation in the share capital............7Chart no.2 - Investment structure in equivalent currency........................................................................................7Table no.2 - Top of companies by residence countries of investors in trading companies with foreign participation in the share capital - balance on 31 May 2013....................................................................................8Chart no.3 - Structure by domains of activity of the number of trading companies with foreign participation in share during May 2013.........................................................................................................................................9Chart no.4 - Structure by domains of activity of the value of share capital subscribed by trading companies with foreign participation during May 2013.............................................................................................................9Table no.3 - Number of trading companies with foreign participation in the share capital, and the value of the subscribed share capital - balance at the end of each month of 2013.............................................................10Chart no.5 - Evolution of the number of trading companies with foreign participation in the share capital - data at the end of the period in 2013.....................................................................................................................10Chart no.6 - Evolution of the investment balance expressed in equivalent currency (thousand USD) - data at the end of the period in 2013.................................................................................................................................10Table no.4 - New trading companies with foreign participation in the subscribed share capital during January - May 2013 and 2012.................................................................................................................................11Chart no.7 - Dynamics of the number of new companies with foreign participation in the share capital during January - May 2013 and 2012, out of which:...............................................................................................11Chart no.8 - Dynamics of the value of share capital subscribed in new companies during January –May 2013 and 2012, out of which: - thousand USD –............................................................................................................11Table no.5 - Incorporation of trading companies with foreign participation in the share capital during the month of May 2013................................................................................................................................................12Table no.6 - Submission to increase the share capital in trading companies with foreign participation during the month of May 2013..........................................................................................................................................13Table no.7 - Strike-off of trading companies with foreign participation in the share capital from the trade register during the month of May 2013.................................................................................................................14Table no.8 - Submission for share capital assignment in trading companies with foreign participation during the month of May 2013..........................................................................................................................................15Table no.9 - Incorporation of trading companies with foreign participation in the share capital, by regions of economic development, during the month of May 2013...................................................................................16Table no.10 - Submission for increase of share capital of trading companies with foreign participation, by regions of economic development, during the month of May 2013......................................................................16Table no.11 - Strike-off of trading companies with foreign participation, by regions of development, during the month of May 2013..........................................................................................................................................16Table no.12 - Incorporation of trading companies with foreign participation in the share capital, by continents, according to the investor's residence, during the month of May 2013...............................................17Table no.13 - Submission to increase the share capital of trading companies with foreign participation, by countries according to the investor's residence, during the month of May 2013..................................................17Table no.14 - Strike-off of trading companies with foreign participation, by continents, according to the investor's residence, during the month of May 2013.............................................................................................17Table no.15 - Incorporation of trading companies with foreign participation in the share capital, by economic groupings of countries, according to the investor's residence, during the month of May 2013............18Table no.16 - Submission for increase of the share capital of trading companies with foreign participation, by economic groupings of countries, according to the investor's residence, during the month of May 2013.......18
3
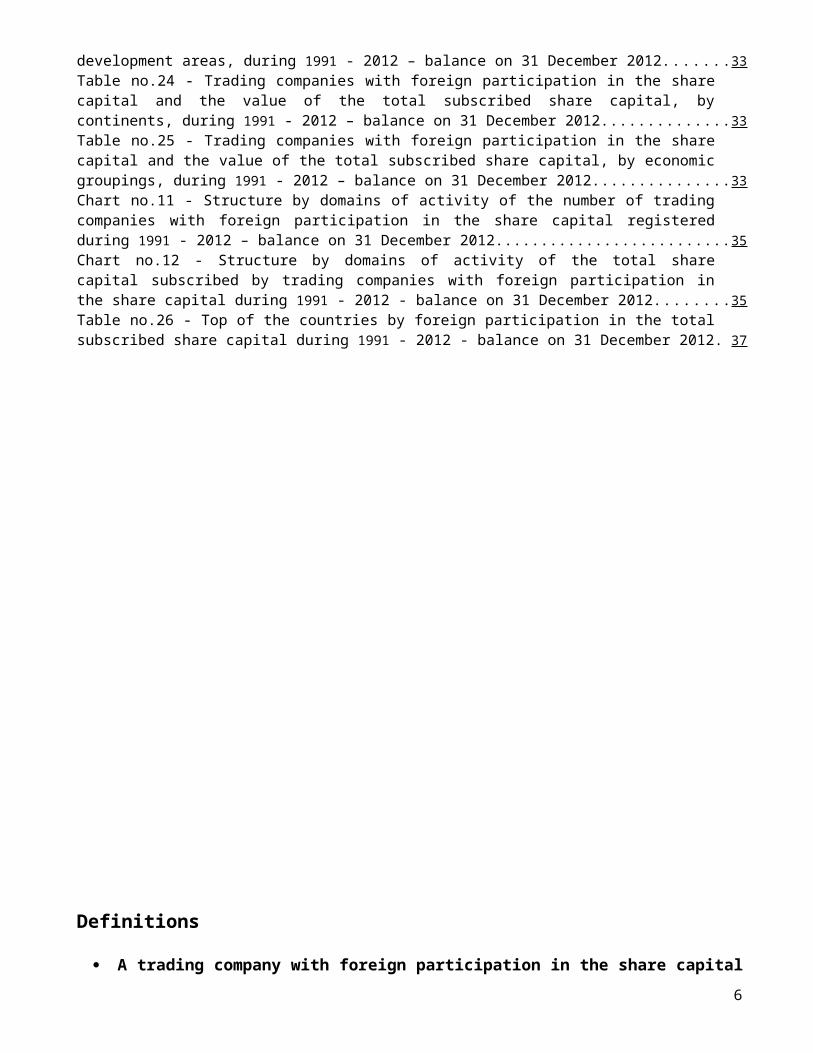
Table no.17 - Strike-off of trading companies with foreign participation, by economic groupings of countries, according to the investor's residence, during the month of May 2013.................................................18Table no.18 - Top* by residence countries of investors in trading companies with foreign participation in the share capital, incorporated during the month of May 2013............................................................................19Table no.19 - Top* by residence countries of investors according to the value of the share capital registered by submission for increase of the share capital during the month of May 2013....................................................20Table no.20 - Top of the first 40 trading companies by foreign participation in the total subscribed share capital, in equivalent currency, during the month of May 2013.............................................................................212.2.Data related to the period 1991 - 2012............................................................................................................22Table no.21 - Number of trading companies with foreign participation in the share capital and the value of the subscribed share capital, during 1991 - 2012...................................................................................................22Chart no.9 - Evolution of the number of companies during 1991 - 2012................................................................22Chart no.10 - Evolution of the investment expressed in equivalent currency during 1991 - 2012.........................22Table no.22 - Trading companies with foreign participation in the share capital and the value of the total subscribed share capital during 1991 - 2012 - balance on 31 December 2012.......................................................23Table no.23 - Trading companies with foreign participation in the share capital and the value of the total subscribed share capital, on economic development areas, during 1991 - 2012 – balance on 31 December 2012........................................................................................................................................................................24Table no.24 - Trading companies with foreign participation in the share capital and the value of the total subscribed share capital, by continents, during 1991 - 2012 – balance on 31 December 2012.............................24Table no.25 - Trading companies with foreign participation in the share capital and the value of the total subscribed share capital, by economic groupings, during 1991 - 2012 – balance on 31 December 2012..............24Chart no.11 - Structure by domains of activity of the number of trading companies with foreign participation in the share capital registered during 1991 - 2012 – balance on 31 December 2012........................25Chart no.12 - Structure by domains of activity of the total share capital subscribed by trading companies with foreign participation in the share capital during 1991 - 2012 - balance on 31 December 2012.....................25Table no.26 - Top of the countries by foreign participation in the total subscribed share capital during 1991 - 2012 - balance on 31 December 2012..................................................................................................................27
4
Definitions
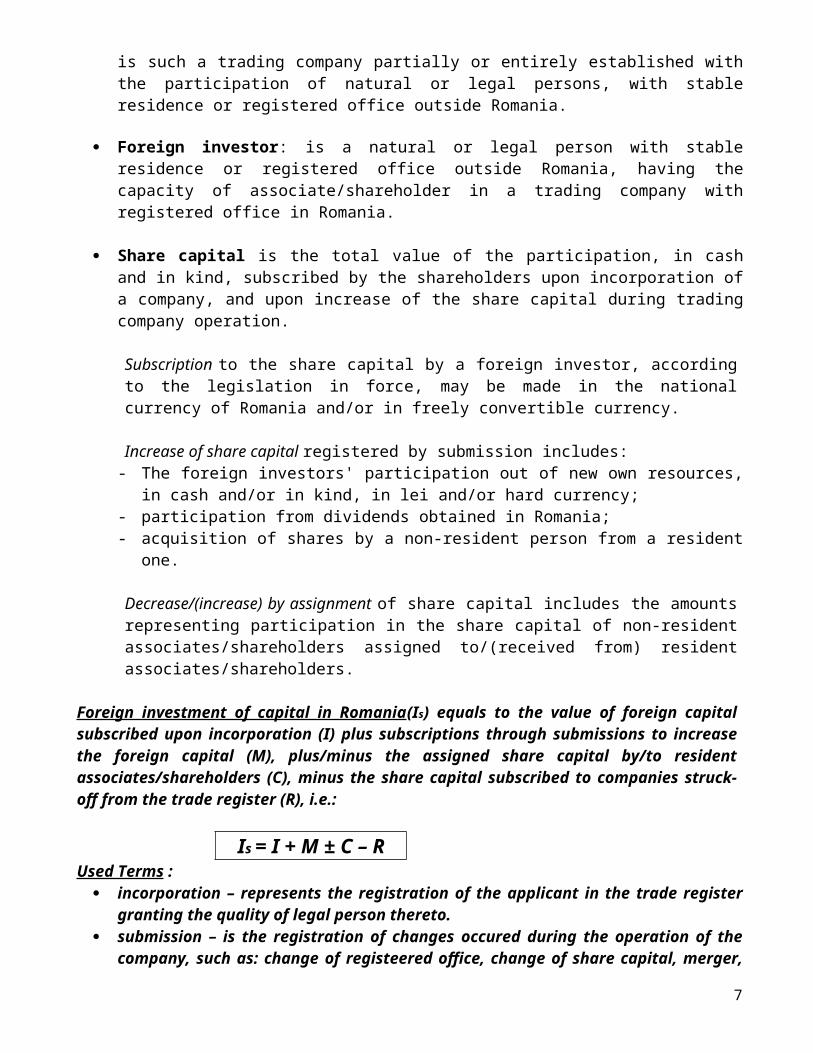
A trading company with foreign participation in the share capital is such a trading company partially or entirely established with the participation of natural or legal persons, with stable residence or registered office outside Romania.
Foreign investor: is a natural or legal person with stable residence or registered office outside Romania, having the capacity of associate/shareholder in a trading company with registered office in Romania.
Share capital is the total value of the participation, in cash and in kind, subscribed by the shareholders upon incorporation of a company, and upon increase of the share capital during trading company operation.
Subscription to the share capital by a foreign investor, according to the legislation in force, may be made in the national currency of Romania and/or in freely convertible currency.
Increase of share capital registered by submission includes:- The foreign investors' participation out of new own resources, in cash and/or in kind,
in lei and/or hard currency;- participation from dividends obtained in Romania;- acquisition of shares by a non-resident person from a resident one.
Decrease/(increase) by assignment of share capital includes the amounts representing participation in the share capital of non-resident associates/shareholders assigned to/(received from) resident associates/shareholders.
Foreign investment of capital in Romania(Is) equals to the value of foreign capital subscribed upon incorporation (I) plus subscriptions through submissions to increase the foreign capital (M), plus/minus the assigned share capital by/to resident associates/shareholders (C), minus the share capital subscribed to companies struck-off from the trade register (R), i.e.:
Is = I + M ± C – RUsed Terms :
incorporation – represents the registration of the applicant in the trade register granting the quality of legal person thereto.
submission – is the registration of changes occured during the operation of the company, such as: change of registeered office, change of share capital, merger, winding-up, dissolution, etc.
strike-off – is the operation of removing a company with foreign investor from the trade register, setting out the date a company loses its quality of legal person as a result of dissolution or winding-up thereof. The data regarding strike-offs also include trading companies under the provisions of Law No. 314/2001.
operations performed in the trade register represent all the registrations including incorporations, submissions and strike-offs of trading companies with foreign
5
participation in the share capital, irrespective of the nature of activity and type of trading company.
Terms used in tables and charts:
Number of trading companies: depending on the table, it represents the number of trading companies incorporated during the reference period, the number of companies having registered increases/decreases of share capital, the number of trading companies struck-off from the trade register.
The value of the subscribed share capital:- a total, expressed in national currency: the value of the subscribed share
capital resulted from adding up the values subscribed in national currency (lei) with the value in freely convertible currency exchanged in lei, at the exchange rate, notified by the National Bank of Romania, of the date of the deed of incorporation/modifier document;
- a total, expressed in currency equivalent:USD : the value of the subscribed share capital obtained by adding up and exchanging into USD the freely convertible currency, and the national currency (lei), at the exchange rate, notified by the National Bank of Romania, of the date of the deed of incorporation/modifier document.Euro : the balance existing at the end of each month, calculated in equivalent USD, are exchanged into Euro at EURO/USD exchange rate, notified by the National Bank of Romania, of the last working day of the respective month.
Regions of economic development:- North-East: Suceava, Botoşani, Neamţ, Iaşi, Bacău, Vaslui.- South-East: Vrancea, Galaţi, Buzău, Brăila, Tulcea, Constanţa.- South-Muntenia: Argeş, Dâmboviţa, Prahova, Teleorman, Giurgiu, Călăraşi,
Ialomiţa.- South-West Oltenia: Gorj, Vâlcea, Dolj, Mehedinţi, Olt.- West: Arad, Caraş-Severin, Hunedoara, Timiş.- North-West: Bihor, Bistriţa, Cluj, Satu Mare, Sălaj, Maramureş.- Center: Alba, Braşov, Covasna, Harghita, Mureş, Sibiu.- Bucharest-Ilfov: Bucureşti, Ilfov.
Sources of information:The integrated IT system of the trade register is designed by The National Trade Register Office in compliance with the provisions of the related legislation in force. The source of information consists of the trade registers organized in a computerized system, kept by the trade register offices attatched to law courts.
6
Tables and statistical charts - data related to May 2013Table no. 1
Number of companies by foreign direct investmentand the amount of subscribed capital, -
balance on 31 May 2013
Balance account by end of period
Number of companies Amount of subscribed capitalTotal in ROL Total in currency Total in currency
No. % thousand Lei % thousand USD % thousand
EURO %
0 1 2 3 431 May 2013, out of which: 188,858 101.7 122,293,535.6 102.7 48,365,211.7 102.0 36,076,224.3 102.131 December 2012 185,792 100.0 119,055,965.0 100.0 47,398,370.7 100.0 35,336,541.0 100.0
Note: column No.1 shows the number of companies incorporated in the due period. The data concerning the amount of the subscribed capital include the records on the issued capital in companies incorporated in the related period plus the records of increase in capital and minus the subscribed capital in companies being struck-off from the trade register in the same period.The percentage inserted in column No. 1, 2, 3 and 4 shows the trend compared to the records of 31 December 2012
Diagram no. 1 Diagram no. 2The structure of the number of companies The structure of investment, in equivalent of currency
(USD)
7
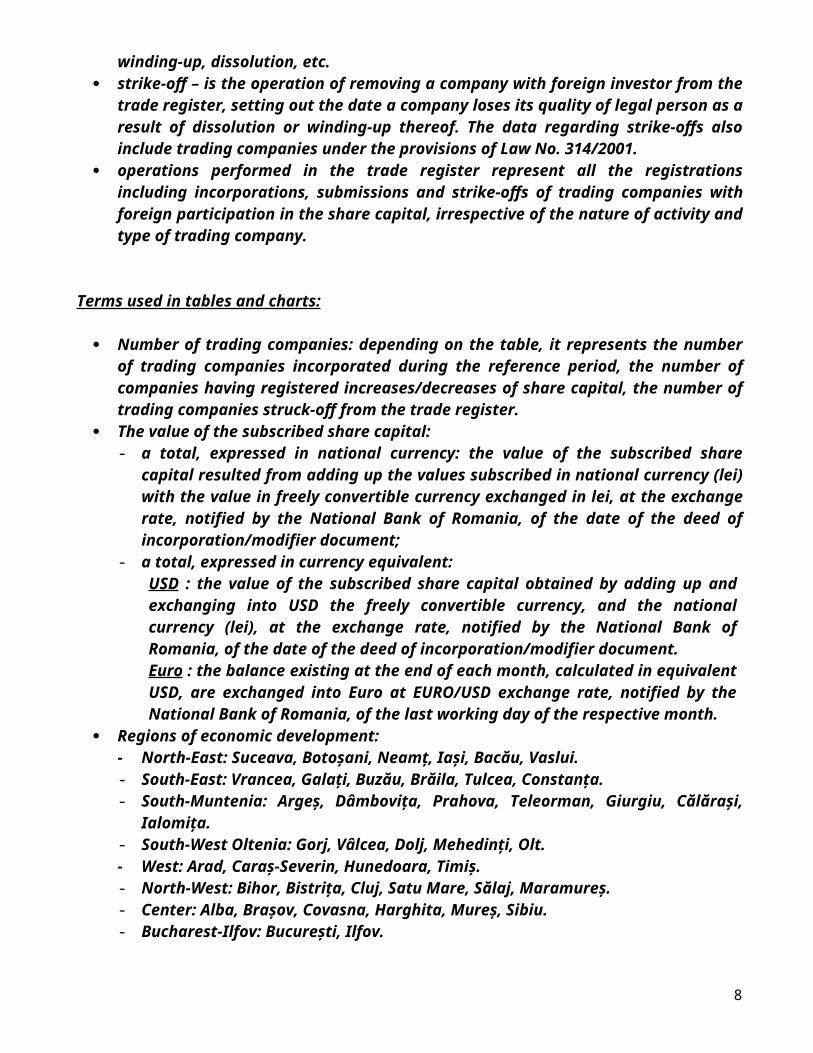
Table no. 2Classification* of companies by foreign direct investment
by the investors' countries of origin, balance account at 31 May 2013
No.crt.
Countries
Companies by foreign investment
Amount of subscribed capitalTotal in local currency Total in equivalent of
currencyTotal in equivalent of
currency
No. % thousand RON % thousand
USD % thousand EURO %
0 1 2 3 4 5Total ROMANIA 188,858 50.41 122,293,535.6 50.67 48,365,211.7 50.50 36,076,224.3 50.52
1 NETHERLAND 4,326 2.33 26,415,848.8 21.72 9,922,300.0 20.62 7,022,628.2 20.742 AUSTRIA 6,554 3.53 15,516,419.0 12.76 6,631,089.0 13.78 4,656,483.4 13.753 GERMANY 19,819 10.67 12,627,502.0 10.38 5,876,060.0 12.21 4,107,069.7 12.134 CYPRUS 5,296 2.85 8,938,089.2 7.35 3,271,485.9 6.80 2,327,962.1 6.885 FRANCE 7,351 3.96 7,963,212.5 6.55 2,950,224.0 6.13 2,059,073.7 6.086 GREECE 5,654 3.04 6,255,933.8 5.14 2,483,266.0 5.16 1,727,317.5 5.107 ITALY 35,526 19.13 5,820,509.2 4.79 2,189,123.8 4.55 1,553,692.6 4.598 SPAIN 4,964 2.67 4,203,500.7 3.46 1,566,338.9 3.26 1,107,100.1 3.279 SWITZERLAND 2,425 1.31 3,246,971.0 2.67 1,384,808.6 2.88 970,155.2 2.87
10 PANAMA 223 0.12 234,328.1 0.19 1,365,322.5 2.84 949,054.8 2.8011 LUXEMBOURG 748 0.40 3,706,358.9 3.05 1,345,308.3 2.80 954,549.0 2.8212 U.S.A. 6,647 3.58 2,762,245.6 2.27 1,122,791.5 2.33 795,710.9 2.3513 GREAT BRITAIN 4,725 2.54 2,538,585.0 2.09 1,028,546.2 2.14 712,464.8 2.1014 HUNGARY 12,033 6.48 2,272,418.9 1.87 959,155.0 1.99 672,498.2 1.9915 ANTILELE OLANDEZE 15 *** 2,048,521.0 1.68 726,226.4 1.51 504,817.2 1.4916 TURKEY 13,188 7.10 1,422,339.7 1.17 598,799.0 1.24 419,674.6 1.2417 CZECH REPUBLIC 799 0.43 1,414,642.6 1.16 538,669.5 1.12 379,046.0 1.1218 BELGIUM 2,923 1.57 984,434.1 0.81 430,539.5 0.89 302,852.5 0.8919 CHINA 10,746 5.79 1,021,906.6 0.84 401,918.3 0.84 279,485.5 0.8320 SWEDEN 1,291 0.70 925,913.1 0.76 346,903.7 0.72 243,756.5 0.7221 PORTUGAL 475 0.26 927,557.2 0.76 324,474.6 0.67 230,027.9 0.6822 DENMARK 746 0.40 768,535.8 0.63 286,474.9 0.60 200,469.9 0.5923 POLAND 687 0.37 722,732.8 0.59 216,247.8 0.45 153,598.2 0.4524 JAPAN 250 0.13 585,887.0 0.48 213,435.5 0.44 149,930.0 0.4425 FINLAND 153 0.08 522,238.5 0.43 192,890.2 0.40 135,682.9 0.4026 SOUTH KOREA 210 0.11 345,305.3 0.28 156,821.2 0.33 117,129.7 0.3527 LEBANON 3,831 2.06 360,975.0 0.30 151,324.8 0.31 106,309.4 0.3128 I.VIRGINE BRIT. 372 0.20 355,705.0 0.29 145,632.7 0.30 101,073.9 0.3029 CANADA 1,698 0.91 361,338.3 0.30 128,497.3 0.27 92,881.1 0.2730 GIBRALTAR 65 0.03 276,200.9 0.23 100,892.9 0.21 71,120.9 0.2131 AUSTRALIA 699 0.38 266,197.3 0.22 87,398.7 0.18 65,164.8 0.1932 ISRAEL 6,502 3.50 429,657.5 0.35 78,780.6 0.16 55,561.9 0.1633 WITH OUT CITIZENSHIP 25 0.01 1,095.5 *** 76,861.6 0.16 53,406.6 0.1634 SINGAPORE 59 0.03 200,931.1 0.17 72,311.6 0.15 50,931.6 0.1535 NORWEY 321 0.17 197,258.4 0.16 71,794.1 0.15 51,125.9 0.1536 BULGARIA 1,697 0.91 185,264.9 0.15 68,832.9 0.14 48,927.3 0.1437 BERMUDE ISLANDS 200 0.11 206,045.9 0.17 67,649.4 0.14 51,638.0 0.1538 IRELAND 808 0.43 150,666.7 0.12 56,220.3 0.12 40,972.8 0.1239 BELIZE 40 0.02 153,035.6 0.13 50,091.8 0.10 37,941.4 0.1140 MARSHALL ISLANDS 24 0.01 138,811.1 0.11 48,941.1 0.10 34,004.2 0.1041 LIECHTENSTEIN 208 0.11 3,331,868.9 2.74 47,973.9 0.10 33,461.1 0.1042 A.R. OF SYRIA 5,703 3.07 96,356.4 0.08 46,654.3 0.10 32,678.8 0.1043 IRAQ 5,810 3.13 76,980.4 0.06 39,563.3 0.08 27,547.6 0.0844 SLOVENIA 187 0.10 99,424.1 0.08 39,035.4 0.08 27,212.2 0.0845 SLOVAKIA 502 0.27 110,238.9 0.09 38,947.8 0.08 27,927.7 0.0846 EGYPT 1,571 0.85 94,445.8 0.08 38,246.4 0.08 26,713.9 0.0847 MOLDAVIA 4,170 2.24 84,828.1 0.07 36,439.5 0.08 25,252.0 0.0748 INS. VIRGINE AMR. 187 0.10 117,445.5 0.10 35,413.3 0.07 26,415.3 0.0849 JORDAN 3,238 1.74 64,364.9 0.05 30,309.5 0.06 21,084.2 0.0650 ICELAND 64 0.03 86,741.3 0.07 27,637.1 0.06 14,950.0 0.04
*) contains a selection of countries, based on the value of the invested capital in equivalent USD, in decreasing order (col. 4)
*** Less than 0.01%
8
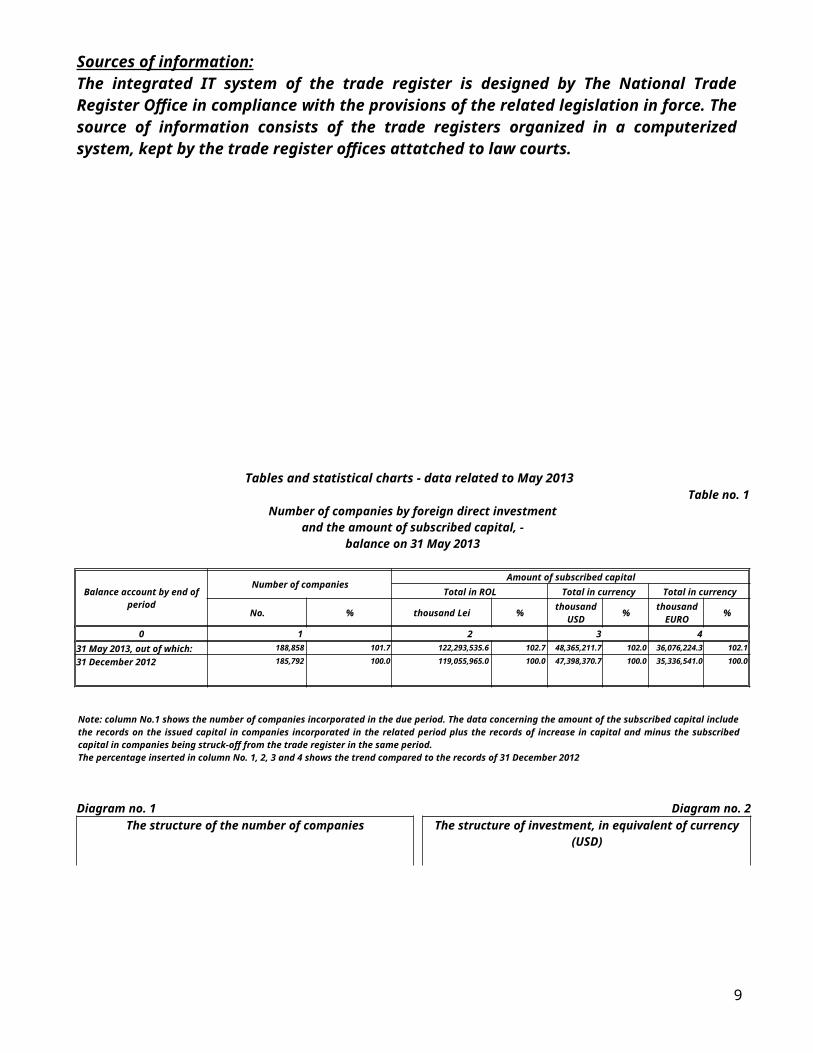
Diagram no. 3The structure upon sector of activity* of companies by foreign direct investment,
during May 2013
Diagram no. 4The structure upon sector of activity in the amount of subscribed capital** in companies
by foreign direct investment, during May 2013
*) Calculated upon the main sector of activity declared**) Calculated upon the value of total investment, in equivalent currency (USD)
9
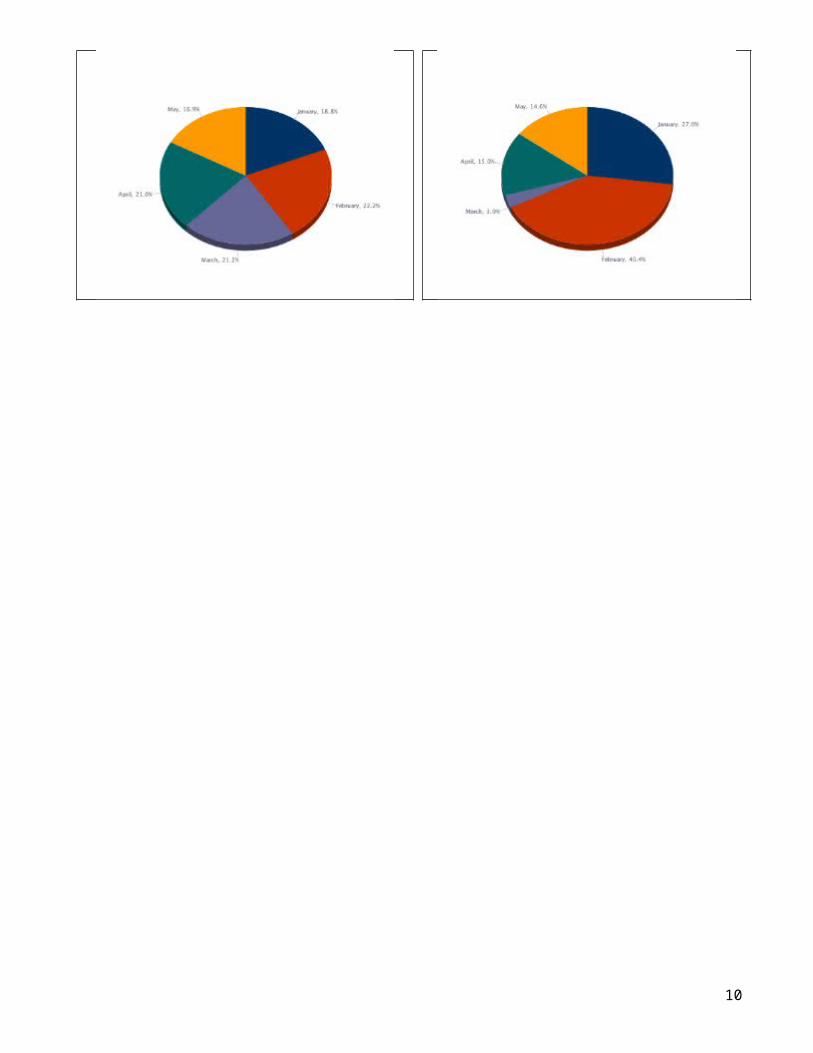
Table no. 3The number of companies by foreign direct investment
and the amount of subscribed capital,balance account in the end of each month of 2013
Balance account atthe end of
Number of companiesAmount of subscribed capital
Total in local currency Total in equivalent of currency
Total in equivalent of currency
No. % thousand RON % thousand USD % thousand EURO %
0 1 2 3 4DECEMBER 2012 185,792 100.0 119,055,965.0 100.00 47,398,370.7 100.00 35,336,541.0 100.00
JANUARY 2013 186,367 100.3 119,503,344.8 100.4 47,531,818.0 100.3 35,438,631.4 100.3FEBRUARY 2013 187,047 100.7 120,249,109.0 101.0 47,757,846.1 100.8 35,608,736.8 100.8MARCH 2013 187,697 101.0 121,125,937.7 101.7 48,015,175.0 101.3 35,807,864.9 101.3APRIL 2013 188,340 101.4 121,775,289.5 102.3 48,210,217.7 101.7 35,956,909.5 101.8MAY 2013 188,858 101.7 122,293,535.6 102.7 48,365,211.7 102.0 36,076,224.3 102.1
Note: column no. 1 shows the number of companies incorporated in the due period. The data concerning the amount of the subscribed capital include the records on the issued capital in companies incorporated in the related period plus the records of increase in capital and minus the subscribed capital in companies being struck-off from the trade register in the same period. The percentage inserted in column no. 1, 2, 3 and 4 shows the trend compared to the records of 31 December 2012
Diagram no. 5 Diagram no. 6Trend in the number of companies, balance account - end of
period 2013 Trend of foreign investment balance account, in
equivalent of currency (millions USD) - end of period 2013
10
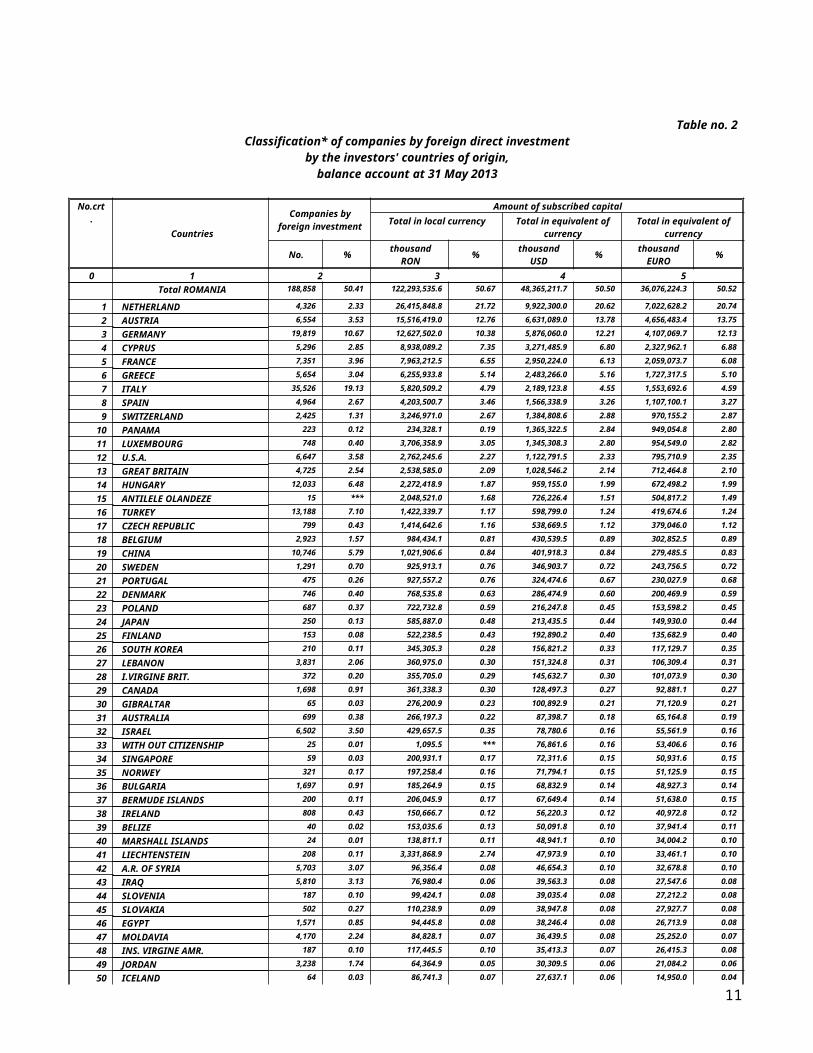
Table no. 4Comparative data on new companies by foreign direct investment and the subscribed capital, between January -
May 2013 and 2012
Month
2012 2013
New companiesSubscribed capital, in equivalent of currency New companies
Trend related to 2012 (5/1)
Subscribed capital, in equivalent of
currencyTrend
related to 2012 (8/3)
No. % thousand USD
% No. % % thousand USD
% %
0 1 2 3 4 5 6 7 8 9 10January – December,
out of which:2,470 100.0 14,839.9 100.0 3,066 100.0 100.0 17,067.1 100.0 115.0
January 401 16.2 4,103.3 27.7 575 18.8 143.4 4,615.1 27.0 112.5February 411 16.6 531.9 3.6 680 22.2 165.5 6,893.7 40.4 1,296.1March 609 24.7 3,161.6 21.3 650 21.2 106.7 509.4 3.0 16.1April 474 19.2 4,789.2 32.3 643 21.0 135.7 2,558.5 15.0 53.4May 575 23.3 2,253.9 15.2 518 16.9 90.1 2,490.4 14.6 110.5
Note: columns no.1 and no.5 show the number of new companies incorporated in the due period. The data on the subscribed capital include the initial capital subscribed in the related period. Columns no. 2, 4, 6 and 9 show the weight of each month in total period.
Diagram no. 7 Diagram no. 8Dynamics of the number of new companies by foreign
direct investment between January – May 2013 and 2012, out of which:
Dynamics of the amount of foreign direct investment between January –May 2013 and 2012, out of which:
- millions USD –
2012
2013
11
Table no. 5Incorporation of companiesby foreign direct investment,
during May 2013
County
Number of companies
Amount of subscribed capital
Rankingby:
Total in local currency Total in equivalent of currency Total in equivalent of currency
No. % thousand RON % USD % EURO %
0 1 2 3 4 5Total ROMANIA 518 100.00 8,355.7 100.00 2,490,406.2 100.00 1,919,047.0 100.00 * **
ALBA 8 1.54 801.1 9.59 237,457.0 9.53 182,927.3 9.53 13 4ARAD 19 3.67 4.1 0.05 1,213.4 0.05 939.0 0.05 8 19ARGES 7 1.35 23.9 0.29 7,170.6 0.29 5,519.6 0.29 14 12BACAU 3 0.58 4.3 0.05 1,271.8 0.05 979.9 0.05 24 17BIHOR 38 7.34 186.7 2.23 55,188.2 2.22 42,822.0 2.23 2 7BISTRITA-NASAUD 3 0.58 2.8 0.03 829.9 0.03 643.5 0.03 24 20BOTOSANI 4 0.77 0.7 *** 220.2 *** 170.4 *** 20 28BRASOV 16 3.09 2.7 0.03 798.1 0.03 615.7 0.03 9 21BRAILA 2 0.39 0.4 *** 119.0 *** 92.0 *** 30 33BUZAU 1 0.19 0.2 *** 59.1 *** 45.9 *** 36 39CARAS-SEVERIN 5 0.97 1.9 0.02 567.2 0.02 436.9 0.02 18 24CALARASI 4 0.77 1.2 0.01 353.8 0.01 272.6 0.01 20 27CLUJ 29 5.60 29.0 0.35 8,644.5 0.35 6,677.4 0.35 5 10CONSTANTA 23 4.44 112.8 1.35 33,844.4 1.36 26,092.1 1.36 6 8COVASNA 3 0.58 0.6 *** 178.3 *** 138.1 *** 24 30DAMBOVITA 4 0.77 2.3 0.03 684.0 0.03 530.1 0.03 20 22DOLJ 11 2.12 4.1 0.05 1,232.4 0.05 947.3 0.05 12 18GALATI 6 1.16 10.9 0.13 3,267.0 0.13 2,519.4 0.13 17 14GIURGIU 2 0.39 1.2 0.01 356.7 0.01 275.2 0.01 30 26GORJ 2 0.39 0.3 *** 90.4 *** 69.4 *** 30 34HARGHITA 2 0.39 42.2 0.51 12,595.8 0.51 9,746.7 0.51 30 9HUNEDOARA 3 0.58 1.5 0.02 445.7 0.02 344.5 0.02 24 25IALOMITA 2 0.39 0.4 *** 119.5 *** 92.4 *** 30 32IASI 13 2.51 4.8 0.06 1,452.8 0.06 1,118.8 0.06 11 16MARAMURES 5 0.97 2.1 0.02 621.3 0.02 478.2 0.02 18 23MEHEDINTI 1 0.19 0.2 *** 60.0 *** 46.2 *** 36 37MURES 7 1.35 21.1 0.25 6,347.6 0.25 4,879.0 0.25 14 13NEAMT 3 0.58 0.4 *** 125.5 *** 96.7 *** 24 31OLT 1 0.19 0.2 *** 62.2 *** 48.0 *** 36 36PRAHOVA 20 3.86 7.1 0.08 2,117.5 0.09 1,634.5 0.09 7 15SALAJ 1 0.19 0.2 *** 59.4 *** 45.8 *** 36 38SATU MARE 7 1.35 223.8 2.68 66,355.6 2.66 51,465.5 2.68 14 6SIBIU 14 2.70 1,409.5 16.87 421,053.7 16.91 325,063.1 16.94 10 3SUCEAVA 4 0.77 26.5 0.32 7,971.8 0.32 6,128.1 0.32 20 11TELEORMAN 1 0.19 0.2 *** 57.0 *** 43.9 *** 36 40TIMIS 36 6.95 3,161.0 37.83 937,700.8 37.65 722,986.9 37.67 4 1TULCEA 0.0 *** 0.0 *** 0.0 ***
VASLUI 0.0 *** 0.0 *** 0.0 ***
VALCEA 3 0.58 0.7 *** 208.7 *** 161.6 *** 24 29VRANCEA 2 0.39 0.3 *** 77.4 *** 59.8 *** 30 35MUN. BUCURESTI 165 31.85 2,023.2 24.21 608,381.5 24.43 466,914.0 24.33 1 2ILFOV 38 7.34 239.0 2.86 71,046.1 2.85 54,979.8 2.86 2 5
*) number of companies (column 1)**) capital in equivalent currency (column 3)
*** Less than 0.01%
Note: Empty rows reveal that there are no operations in the current month
12
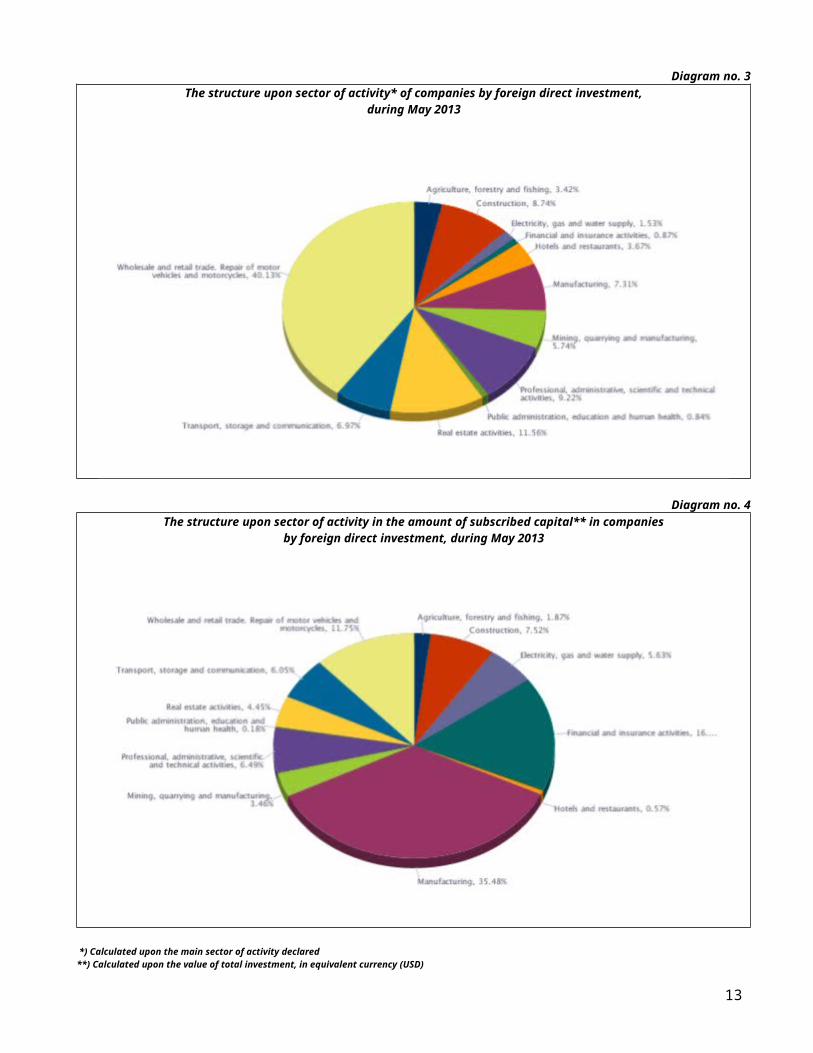
Table no. 6Statuatory increases of the issued capital,in companies by foreign direct investment
during May 2013
CountyNumber of companies
Amount of subscribed capitalRanking
by:Total in local currency Total in equivalent of
currencyTotal in equivalent of
currencyNo. % thousand RON % USD % EURO %
0 1 2 3 4 5Total ROMANIA 682 100.00 663,776.4 100.00 198,284,564.7 100.00 152,823,743.2 100.00 * **
ALBA 2 0.33 0.1 *** 36.7 *** 28.2 *** 30 38ARAD 23 3.80 1,827.5 0.22 548,496.9 0.23 422,399.7 0.22 5 13ARGES 11 1.82 377.9 0.05 113,366.6 0.05 87,241.2 0.05 11 18BACAU 7 1.16 1.5 *** 455.7 *** 352.6 *** 13 30BIHOR 26 4.29 273.7 0.03 83,164.5 0.03 63,298.7 0.03 4 19BISTRITA-NASAUD 4 0.66 2.1 *** 629.5 *** 485.6 *** 22 29BOTOSANI 2 0.33 0.3 *** 89.0 *** 69.1 *** 30 36BRASOV 19 3.14 1,626.5 0.20 484,699.5 0.20 374,246.2 0.20 6 14BUZAU 3 0.50 2,528.8 0.31 764,907.1 0.31 584,371.8 0.31 25 11CARAS-SEVERIN 5 0.83 4.4 *** 1,300.8 *** 1,009.9 *** 18 27CALARASI 4 0.66 2.5 *** 748.2 *** 580.1 *** 22 28CLUJ 38 6.27 758.1 0.09 226,752.3 0.09 174,782.9 0.09 3 16CONSTANTA 17 2.81 20,350.4 2.50 6,119,425.7 2.51 4,702,844.5 2.50 7 6COVASNA 2 0.33 31,827.7 3.91 9,432,432.4 3.87 7,315,845.2 3.90 30 5DAMBOVITA 2 0.33 149,076.3 18.29 44,187,766.6 18.14 34,040,357.6 18.13 30 2DOLJ 5 0.83 127.1 0.02 37,653.4 0.02 29,271.4 0.02 18 21GALATI 6 0.99 1,234.0 0.15 366,126.0 0.15 284,349.4 0.15 16 15GIURGIU 6 0.99 473.3 0.06 140,709.2 0.06 108,597.4 0.06 16 17GORJ 1 0.17 1.0 *** 302.2 *** 234.9 *** 37 31HUNEDOARA 1 0.17 0.2 *** 60.6 *** 46.3 *** 37 37IALOMITA 7 1.16 5,142.6 0.63 1,562,716.3 0.64 1,189,071.0 0.63 13 10IASI 12 1.98 87.2 0.01 25,917.1 0.01 20,105.6 0.01 10 23MARAMURES 5 0.83 10.2 *** 3,033.9 *** 2,343.0 *** 18 25MEHEDINTI 2 0.33 0.6 *** 187.3 *** 144.2 *** 30 34MURES 10 1.65 8,888.8 1.09 2,701,084.8 1.11 2,055,251.6 1.09 12 7NEAMT 3 0.50 2,045.5 0.25 622,037.7 0.26 474,409.1 0.25 25 12OLT 2 0.33 0.6 *** 193.1 *** 149.2 *** 30 33PRAHOVA 13 2.15 11.6 *** 3,419.9 *** 2,650.7 *** 9 24SALAJ 3 0.50 5.5 *** 1,626.9 *** 1,259.3 *** 25 26SATU MARE 7 1.16 198.0 0.02 58,800.4 0.02 45,368.8 0.02 13 20SIBIU 16 2.64 34,018.7 4.17 10,315,299.9 4.24 7,881,857.2 4.20 8 4SUCEAVA 5 0.83 8,627.7 1.06 2,588,199.9 1.06 1,991,610.3 1.06 18 8TELEORMAN 3 0.50 0.8 *** 240.9 *** 185.1 *** 25 32TULCEA 2 0.33 0.4 *** 133.6 *** 103.6 *** 30 35VASLUI 0.0 *** 0.0 *** 0.0 ***
VALCEA 4 0.66 8,062.3 0.99 2,392,921.3 0.98 1,857,748.4 0.99 22 9VRANCEA 3 0.50 100.6 0.01 29,915.3 0.01 23,110.3 0.01 25 22MUN. BUCURESTI 265 43.73 493,896.9 60.61 147,762,353.1 60.67 114,059,351.6 60.74 1 1ILFOV 60 9.90 43,295.4 5.31 12,962,470.6 5.32 9,981,335.2 5.32 2 3
*) number of companies (column 1)**) capital in equivalent currency (column 3)
*** Less than 0.01%
Note: Empty rows reveal that there are no operations in the current month
13

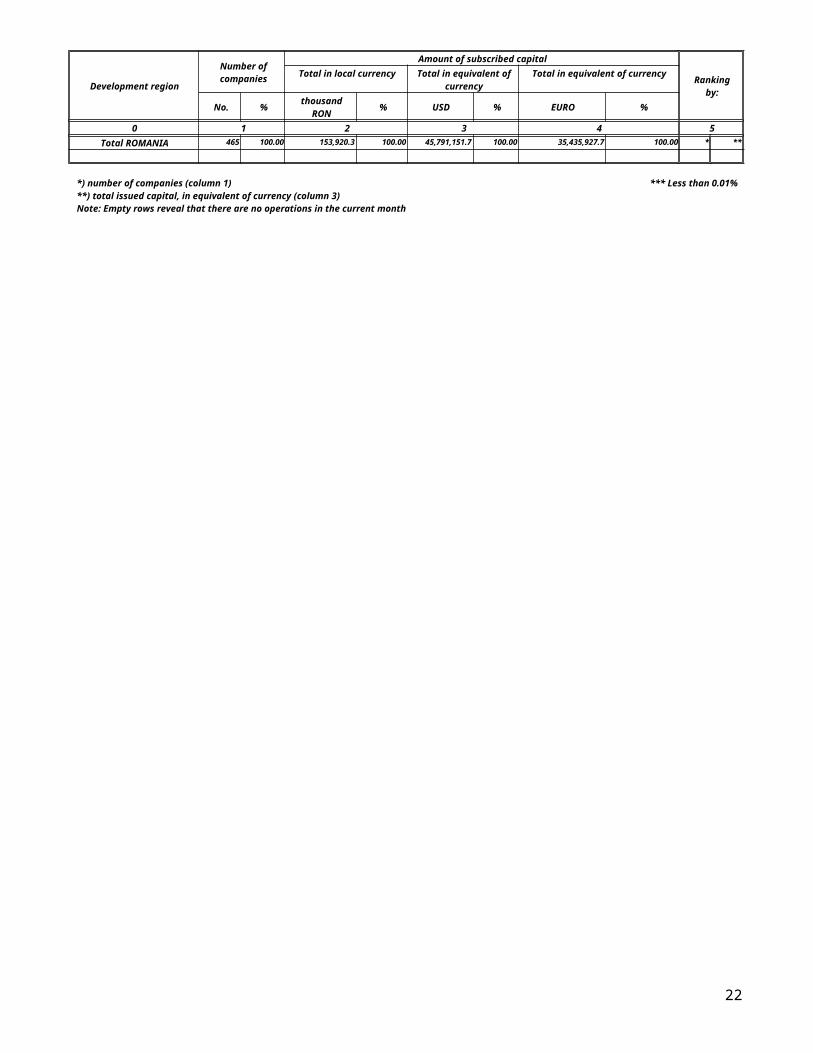
Table no. 7Strike-off of companies by foreign direct investment,
from the trade register, during May 2013
CountyNumber of companies
Amount of subscribed capitalRanking
by:Total in local currency Total in equivalent of
currencyTotal in equivalent of
currencyNo. % thousand RON % USD % EURO %
0 1 2 3 4 5Total ROMANIA 465 100.00 153,920.3 100.00 45,791,151.7 100.00 35,435,927.7 100.00 * **
ALBA 2 0.43 0.2 *** 75.8 *** 57.8 *** 5 5ARAD 16 3.44 31,170.6 20.25 9,354,032.2 20.43 7,196,912.8 20.31 41 41ARGES 4 0.86 54.0 0.04 16,055.9 0.04 12,409.8 0.04 26 26BACAU 3 0.65 0.5 *** 143.7 *** 110.9 *** 8 8BIHOR 10 2.15 13.4 *** 3,965.5 *** 3,059.3 *** 20 20BISTRITA-NASAUD 6 1.29 4.8 *** 1,426.4 *** 1,105.9 *** 19 19BOTOSANI 0.0 *** 0.0 *** 0.0 *** 1 1
BRASOV 21 4.52 146.8 0.10 43,729.2 0.10 33,775.9 0.10 30 30BRAILA 5 1.08 319.5 0.21 95,954.0 0.21 73,812.9 0.21 32 32BUZAU 5 1.08 91,809.2 59.65 27,208,363.1 59.42 21,107,013.2 59.56 42 42CARAS-SEVERIN 4 0.86 0.7 *** 209.1 *** 161.4 *** 13 13CALARASI 3 0.65 0.7 *** 214.3 *** 165.7 *** 14 14CLUJ 24 5.16 17.9 0.01 5,337.0 0.01 4,118.6 0.01 22 22CONSTANTA 20 4.30 58.6 0.04 17,732.3 0.04 13,573.8 0.04 27 27COVASNA 6 1.29 27.2 0.02 8,132.2 0.02 6,292.4 0.02 23 23DAMBOVITA 3 0.65 134.5 0.09 40,470.5 0.09 31,107.0 0.09 29 29DOLJ 3 0.65 0.6 *** 178.0 *** 137.8 *** 12 12GALATI 10 2.15 29.7 0.02 8,899.8 0.02 6,867.1 0.02 24 24GIURGIU 2 0.43 0.5 *** 146.3 *** 112.8 *** 9 9GORJ 1 0.22 0.5 *** 148.4 *** 115.3 *** 10 10HARGHITA 1 0.22 0.2 *** 60.0 *** 46.2 *** 4 4HUNEDOARA 11 2.37 13.6 *** 4,034.6 *** 3,108.6 *** 21 21IALOMITA 4 0.86 1,183.6 0.77 359,935.9 0.79 274,515.0 0.77 35 35IASI 11 2.37 34.4 0.02 10,202.2 0.02 7,911.8 0.02 25 25MARAMURES 9 1.94 3,067.6 1.99 912,614.8 1.99 704,987.2 1.99 38 38MEHEDINTI 3 0.65 1.4 *** 409.3 *** 315.7 *** 15 15MURES 18 3.87 253.1 0.16 75,368.9 0.16 58,249.3 0.16 31 31NEAMT 4 0.86 3.2 *** 965.5 *** 746.5 *** 18 18OLT 3 0.65 0.6 *** 175.8 *** 136.1 *** 11 11PRAHOVA 7 1.51 2.1 *** 614.6 *** 475.0 *** 17 17SALAJ 9 1.94 65.7 0.04 19,952.6 0.04 15,224.8 0.04 28 28SATU MARE 5 1.08 763.4 0.50 226,664.1 0.49 176,024.9 0.50 34 34SIBIU 13 2.80 2,051.8 1.33 610,777.0 1.33 471,708.1 1.33 36 36SUCEAVA 9 1.94 2.0 *** 612.1 *** 472.4 *** 16 16TELEORMAN 1 0.22 0.2 *** 59.5 *** 46.0 *** 3 3TIMIS 24 5.16 2,613.4 1.70 777,555.3 1.70 602,982.5 1.70 37 37TULCEA 4 0.86 511.1 0.33 151,983.6 0.33 117,921.4 0.33 33 33VASLUI 2 0.43 0.4 *** 121.6 *** 92.5 *** 7 7VALCEA 0.0 *** 0.0 *** 0.0 *** 1 1
VRANCEA 2 0.43 0.3 *** 89.4 *** 69.1 *** 6 6MUN. BUCURESTI 139 29.89 15,368.2 9.98 4,585,909.3 10.01 3,542,974.4 10.00 40 40ILFOV 38 8.17 4,194.1 2.72 1,247,832.3 2.73 967,009.8 2.73 39 39
*) number of companies (column 1)**) capital in equivalent currency (column 3)
*** Less than 0.01%
Note: Empty rows reveal that there are no operations in the current month
14
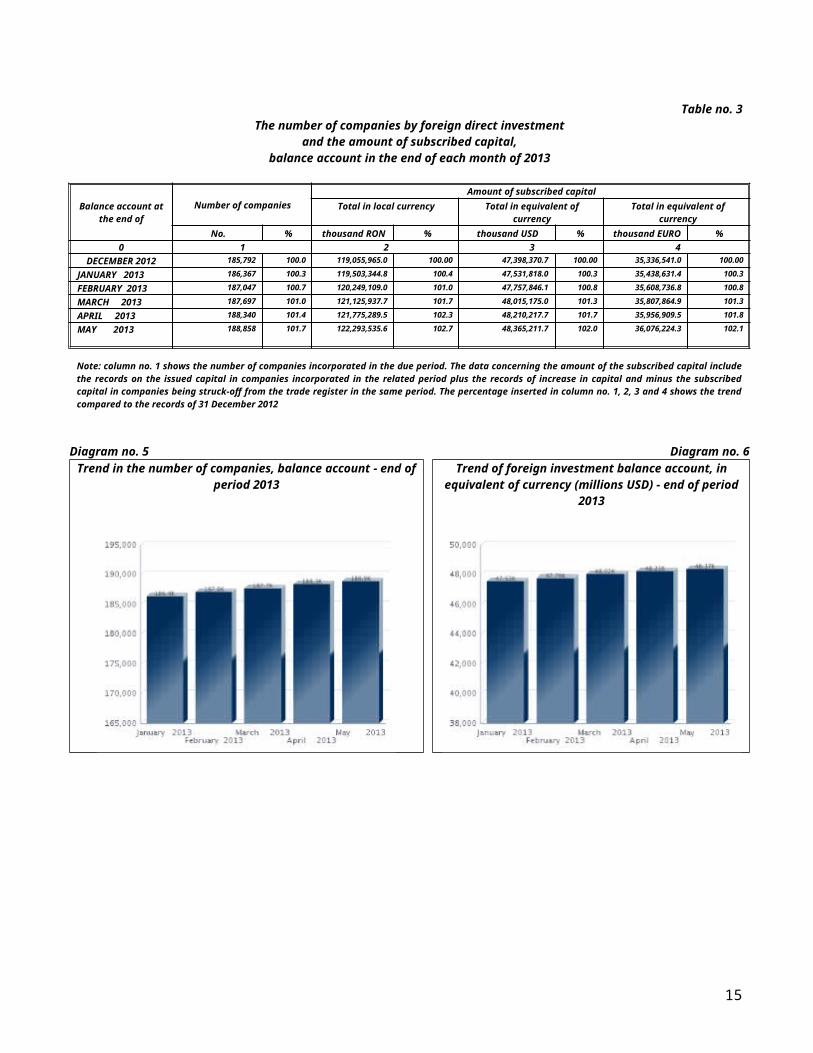
Table no. 8Changes by cession in the issued capital
of the companies by foreign direct investment,during May 2013
CountyNumber of companies
Amount of subscribed capitalRanking
by:Total in local currency Total in equivalent of
currencyTotal in equivalent of
currencyNo. % thousand RON % USD % EURO %
0 1 2 3 4 5Total ROMANIA 95 100.00 -35.4 100.00 -10,450.9 100.00 -8,110.3 100.00 * **
ALBA 0.0 *** 0.0 *** 0.0 ***
ARAD 6 3.19 31,149.3 -88,066.98 9,351,610.1 -89,481.47 7,209,315.4 -88,890.58 6 41ARGES 0.0 *** 0.0 *** 0.0 ***
BACAU 3 1.60 -10.0 28.22 -2,958.7 28.31 -2,294.4 28.29 12 9BIHOR 3 1.60 -0.9 2.54 -272.1 2.60 -207.9 2.56 12 11BISTRITA-NASAUD 1 0.53 0.5 -1.41 148.0 -1.42 115.0 -1.42 21 30BOTOSANI 0.0 *** 0.0 *** 0.0 ***
BRASOV 3 1.60 9.7 -27.42 2,876.9 -27.53 2,235.1 -27.56 12 35BRAILA 3 1.60 -551.0 1,557.79 -163,226.0 1,561.84 -126,879.2 1,564.42 12 5BUZAU 1 0.53 91,804.3 -259,554.06 27,399,352.4 -262,172.43 21,203,379.0 -261,436.83 21 42CARAS-SEVERIN 1 0.53 0.2 -0.57 59.4 -0.57 46.1 -0.57 21 29CALARASI 4 2.13 0.5 -1.47 154.0 -1.47 120.1 -1.48 9 31CLUJ 7 3.72 1.0 -2.80 296.1 -2.83 228.0 -2.81 4 32CONSTANTA 1 0.53 -0.3 0.85 -89.0 0.85 -69.1 0.85 21 12COVASNA 1 0.53 -1.0 2.83 -304.1 2.91 -231.9 2.86 21 10DAMBOVITA 2 1.06 133.3 -376.87 40,110.0 -383.80 30,828.0 -380.11 18 38DOLJ 4 2.13 -2,180.9 6,165.90 -646,436.8 6,185.47 -497,986.8 6,140.16 9 3GALATI 4 2.13 9.3 -26.24 2,788.6 -26.68 2,146.2 -26.46 9 34GIURGIU 7 3.72 -1,180.3 3,337.03 -350,278.3 3,351.66 -272,112.6 3,355.14 4 4GORJ 0.0 *** 0.0 *** 0.0 ***
HARGHITA 1 0.53 -0.2 0.57 -59.2 0.57 -46.0 0.57 21 14HUNEDOARA 0.0 *** 0.0 *** 0.0 ***
IALOMITA 1 0.53 1.0 -2.83 300.9 -2.88 231.3 -2.85 21 33IASI 3 1.60 13.1 -37.07 3,850.1 -36.84 2,995.6 -36.94 12 36MARAMURES 1 0.53 -0.2 0.57 -60.8 0.58 -46.4 0.57 21 13MEHEDINTI 0.0 *** 0.0 *** 0.0 ***
MURES 6 3.19 0.1 -0.31 40.0 -0.38 26.6 -0.33 6 28NEAMT 0.0 *** 0.0 *** 0.0 ***
OLT 2 1.06 2,180.6 -6,165.06 646,348.2 -6,184.62 497,918.1 -6,139.31 18 40PRAHOVA 5 2.66 -309.9 876.14 -92,034.0 880.63 -71,411.7 880.50 8 6SALAJ 0.0 *** 0.0 *** 0.0 ***
SATU MARE 3 1.60 33.8 -95.65 10,178.9 -97.40 7,823.8 -96.47 12 37SIBIU 1 0.53 -21.8 61.63 -6,544.8 62.62 -5,045.5 62.21 21 7SUCEAVA 0.0 *** 0.0 *** 0.0 ***
TELEORMAN 0.0 *** 0.0 *** 0.0 ***
TIMIS 9 4.79 -17.1 48.32 -5,046.4 48.29 -3,917.7 48.31 3 8TULCEA 2 1.06 510.2 -1,442.52 153,112.7 -1,465.07 117,803.7 -1,452.51 18 39VASLUI 0.0 *** 0.0 *** 0.0 ***
VALCEA 0.0 *** 0.0 *** 0.0 ***
VRANCEA 0.0 *** 0.0 *** 0.0 ***
MUN. BUCURESTI 66 35.11 -24,326.5 68,777.12 -7,305,919.6 69,907.15 -5,636,446.4 69,497.16 1 2ILFOV 37 19.68 -97,282.3 275,041.74 -29,048,447.4 277,951.90 -22,466,626.6 277,012.62 2 1
*) number of companies (column 1)**) capital in equivalent currency (column 3)
*** Less than 0.01%
Note: Empty rows reveal that there are no operations in the current month
15
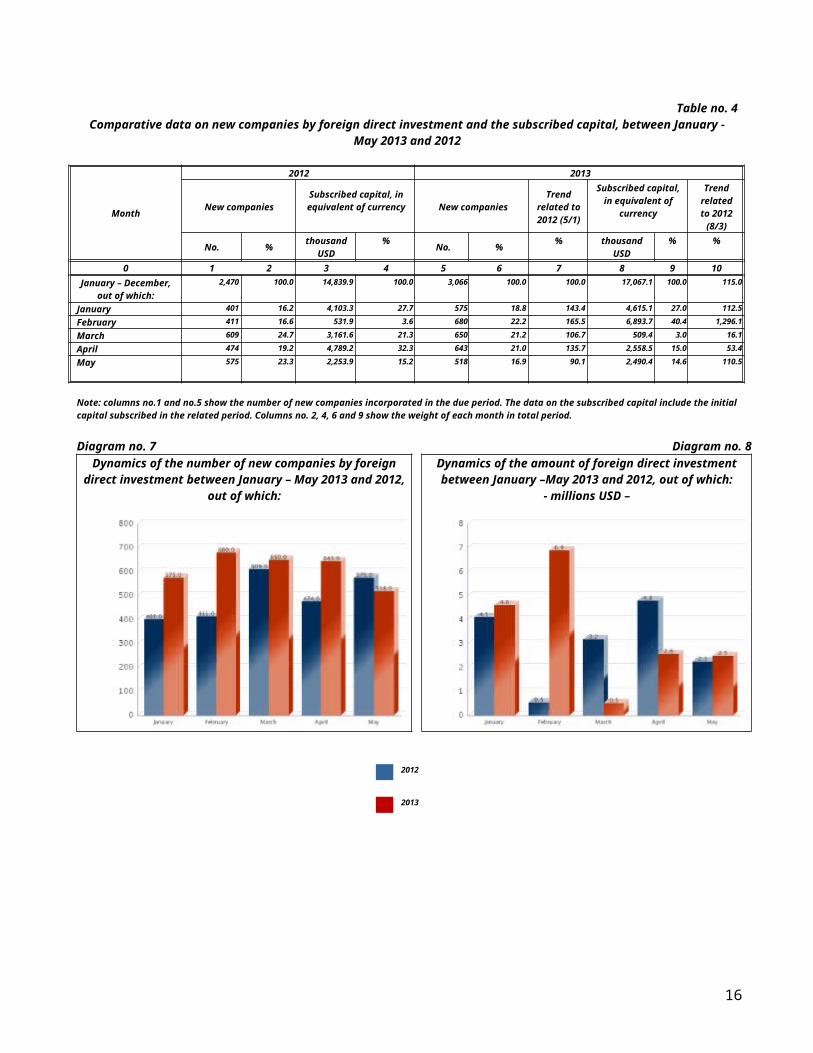
Table no. 9Incorporation of companies by foreign direct investment,
according to the development regions,during May 2013
Development region
Number of companies
Amount of subscribed capital
Rankingby:
Total in currency Total in equivalent of currency
Total in equivalent of currency
No. % thousand RON % USD % EURO %
0 1 2 3 4 5Total ROMANIA 518 100.00 8,355.7 100.00 2,490,406.2 100.00 1,919,047.0 100.00 * **
NORTH-EAST 27 5.21 36.8 0.44 11,042.1 0.44 8,493.9 0.44 7 6SOUTH-EAST 34 6.56 124.5 1.49 37,366.9 1.50 28,809.1 1.50 6 5SOUTH-MUNTENIA 40 7.72 36.3 0.43 10,859.0 0.44 8,368.3 0.44 5 7SOUTH-WEST OLTENIA 18 3.47 5.5 0.07 1,653.8 0.07 1,272.4 0.07 8 8WEST 63 12.16 3,168.5 37.92 939,927.2 37.74 724,707.3 37.76 3 1NORTH-WEST 83 16.02 444.7 5.32 131,699.0 5.29 102,132.3 5.32 2 4CENTER 50 9.65 2,277.2 27.25 678,430.6 27.24 523,369.8 27.27 4 3BUCHAREST-ILFOV 203 39.19 2,262.2 27.07 679,427.7 27.28 521,893.8 27.20 1 2
Table no. 10Statuatory increase in the issued capital of companies by
foreign direct investment, according to the development regions,during May 2013
Development region
Number of companies
Amount of subscribed capital
Rankingby:
Total in local currency Total in equivalent of currency
Total in equivalent of currency
No. % thousand RON % USD % EURO %
0 1 2 3 4 5Total ROMANIA 682 100.00 663,776.4 100.00 198,284,564.7 100.00 152,823,743.2 100.00 * **
NORTH-EAST 29 4.25 10,762,212.0 1.62 3,236,699.5 1.63 2,486,546.7 1.63 7 4SOUTH-EAST 39 5.72 -56,041,330.7 -8.44 -16,671,595.3 -8.41 -12,941,209.4 -8.47 6 7SOUTH-MUNTENIA 46 6.74 155,085,029.8 23.36 46,008,967.7 23.20 35,428,683.0 23.18 5 2SOUTH-WEST OLTENIA 14 2.05 8,191,705.6 1.23 2,431,257.2 1.23 1,887,548.0 1.24 8 5WEST 86 12.61 -68,570,771.4 -10.33 -20,619,327.0 -10.40 -15,889,281.7 -10.40 2 8NORTH-WEST 83 12.17 1,247,595.0 0.19 374,007.6 0.19 287,538.4 0.19 3 6CENTER 60 8.80 75,909,692.0 11.44 22,799,731.3 11.50 17,523,231.3 11.47 4 3BUCHAREST-ILFOV 325 47.65 537,192,273.5 80.93 160,724,823.7 81.06 124,040,686.9 81.17 1 1
Table no. 11Strike-off of companies by foreign direct investment and the amount of their issued capital,
according to the development regions, during May 2013
Development region
Number of companies
Amount of subscribed capital
Rankingby:
Total in local currency Total in equivalent of currency
Total in equivalent of currency
No. % thousand RON % USD % EURO %
0 1 2 3 4 5Total ROMANIA 465 100.00 153,920.3 100.00 45,791,151.7 100.00 35,435,927.7 100.00 * **
NORTH-EAST 29 6.24 40,581.9 0.03 12,045.0 0.03 9,334.1 0.03 6 2SOUTH-EAST 46 9.89 92,728,411.8 60.24 27,483,022.1 60.02 21,319,257.4 60.16 5 8SOUTH-MUNTENIA 24 5.16 1,375,602.0 0.89 417,496.9 0.91 318,831.4 0.90 7 3SOUTH-WEST OLTENIA 10 2.15 3,060.0 *** 911.5 *** 704.9 *** 8 1WEST 55 11.83 33,798,258.0 21.96 10,135,831.2 22.13 7,803,165.3 22.02 4 7NORTH-WEST 63 13.55 3,932,710.0 2.56 1,169,960.4 2.55 904,520.8 2.55 2 5CENTER 61 13.12 2,479,475.0 1.61 738,143.0 1.61 570,129.6 1.61 3 4BUCHAREST-ILFOV 177 38.06 19,562,229.6 12.71 5,833,741.7 12.74 4,509,984.2 12.73 1 6
*) number of companies (column 1)**) total issued capital, in equivalent of currency (column 3)
*** Less than 0.01%
Note: Empty rows reveal that there are no operations in the current month
16
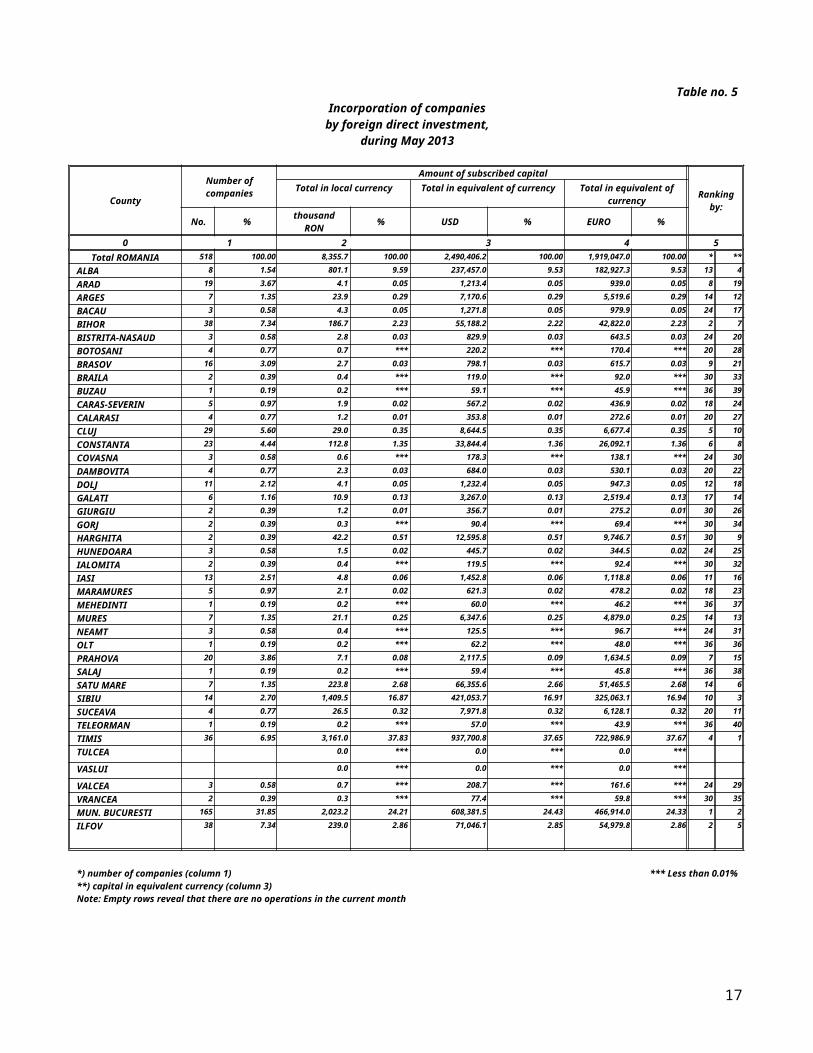
Table no. 12Incorporation of companies by foreign direct investment, by continents
according to the investors' country of origin,during May 2013
Continent
Number of companies
Amount of subscribed capital
Rankingby:
Total in local currency Total in equivalent of currency
Total in equivalent of currency
No. % thousand RON % USD % EURO %
0 1 2 3 4 5Total ROMANIA 518 8,355.7 2,490,406.2 1,919,047.0 * **
EUROPE 422 81.47 7,203.6 86.21 2,142,055.8 86.01 1,653,004.0 86.14 1 1AFRICA 14 2.70 52.6 0.63 15,561.1 0.62 12,080.5 0.63 4 3NORTH AMERICA 18 3.47 7.7 0.09 2,295.5 0.09 1,770.1 0.09 3 4SOUTH AMERICA 5 0.97 0.8 *** 237.9 *** 183.5 *** 5 5ASIA 64 12.36 1,091.0 13.06 330,255.9 13.26 252,008.8 13.13 2 2
Table no. 13Increase in the issued capital of companies by foreign direct investment,
by countries according to the investors' country of origin,during May 2013
Continent
Number of companies
Amount of subscribed capital
Rankingby:
Total in local currency Total in equivalent of currency
Total in equivalent of currency
No. % thousand RON % USD % EURO %
0 1 2 3 4 5Total ROMANIA 682 663,776.4 198,284,564.7 152,823,743.2 * **
EUROPE 553 81.09 659,642.1 99.38 197,062,435.6 99.38 151,876,251.4 99.38 1 1AFRICA 25 3.67 -186.6 -0.03 -63,082.2 -0.03 -44,251.6 -0.03 3 5NORTH AMERICA 17 2.49 2,986.0 0.45 887,839.8 0.45 686,319.8 0.45 4 3SOUTH AMERICA 5 0.73 128.4 0.02 38,613.8 0.02 29,687.0 0.02 5 4ASIA 97 14.22 4,317.3 0.65 1,292,131.5 0.65 993,892.8 0.65 2 2OCEANIA 5 0.73 -3,110.8 -0.47 -933,373.9 -0.47 -718,156.2 -0.47 5 6
Table no. 14Strike-off of companies by foreign direct investment and their issued capital,
by continents according to the investors' country of origin,during May 2013
Continent
Number of companies
Amount of subscribed capital
Rankingby:
Total in local currency Total in equivalent of currency
Total in equivalent of currency
No. % thousand RON % USD % EURO %
0 1 2 3 4 5Total ROMANIA 465 100.00 153,920.3 100.00 45,791,151.7 100.00 35,435,927.7 100.00 * **
EUROPE 374 80.43 55,544.7 36.09 16,624,268.5 36.30 12,814,571.0 36.16 1 5AFRICA 16 3.44 2,425.5 1.58 719,728.8 1.57 558,933.8 1.58 4 4NORTH AMERICA 18 3.87 32.9 0.02 9,830.3 0.02 7,581.8 0.02 3 3SOUTH AMERICA 3 0.65 0.6 *** 164.0 *** 126.9 *** 5 2ASIA 64 13.76 95,916.2 62.32 28,437,037.8 62.10 22,054,619.8 62.24 2 6OCEANIA 2 0.43 0.4 *** 122.3 *** 94.5 *** 6 1
*) number of companies (column 1)**) total issued capital, in equivalent currency (column 3)
*** Less than 0.01%
Note: Empty rows reveal that there are no operations in the current month
17
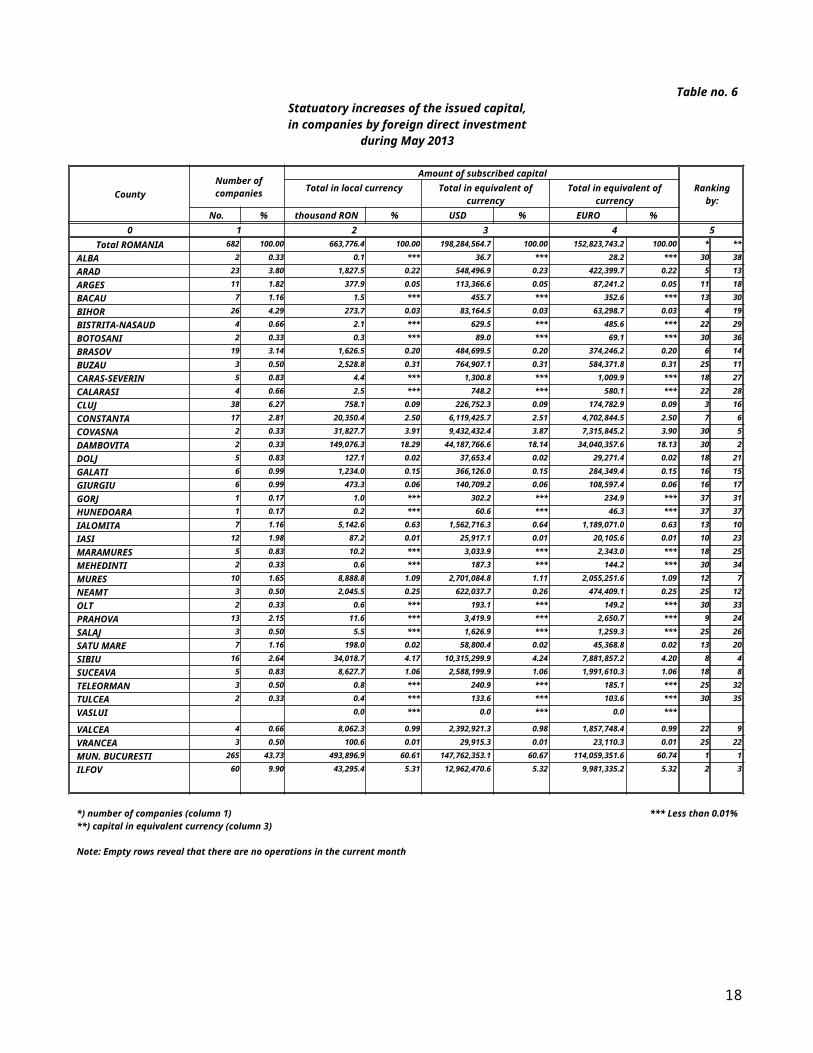
Table no. 15Incorporation of companies by foreign direct investment, by economical groups
of countries according to the investors' country of origin,during May 2013
Economical groups
Number of companies
Amount of subscribed capital
Rankingby:
Total in local currency Total in equivalent of currency
Total in equivalent of currency
No. % thousand RON % USD % EURO %
0 1 2 3 4 5Total ROMANIA 518 8,355.7 2,490,406.2 1,919,047.0 * **
U.E. 370 71.43 6,309.2 44.66 1,876,589.2 44.68 1,447,068.0 44.64 2 2A.E.L.S 8 1.54 764.9 5.41 226,638.0 5.40 176,000.1 5.43 4 3O.E.C.D 409 78.96 7,049.5 49.90 2,096,109.2 49.90 1,617,470.3 49.90 1 1C.E.F.T.A. 11 2.12 3.6 0.03 1,069.9 0.03 825.1 0.03 3 4
Table no. 16Increase in the issued capital of companies by foreign direct investment,
by economical groups of countries according to the investors' country of origin,during May 2013
Economical groups
Number of companies
Amount of subscribed capital
Rankingby:
Total in local currency Total in equivalent of currency
Total in equivalent of currency
No. % thousand RON % USD % EURO %
0 1 2 3 4 5Total ROMANIA 682 663,776.4 198,284,564.7 152,823,743.2 * **
U.E. 437 64.08 635,335.2 76.77 189,718,576.3 76.69 146,251,027.0 76.73 1 1A.E.L.S 18 2.64 3,400.6 0.41 1,032,743.7 0.42 788,111.3 0.41 4 3O.E.C.D 433 63.49 188,695.2 22.80 56,595,976.6 22.88 43,536,308.2 22.84 2 2C.E.F.T.A. 43 6.30 142.0 0.02 43,173.2 0.02 32,914.8 0.02 3 4
Table no. 17Strike-off of companies by foreign direct investment and their issued capital,
by economical groups of countries according to the investors' country of origin,during May 2013
Economical groups
Number of companies
Amount of subscribed capital
Rankingby:
Total in local currency Total in equivalent of currency
Total in equivalent of currency
No. % thousand RON % USD % EURO %
0 1 2 3 4 5Total ROMANIA 465 100.00 153,920.3 100.00 45,791,151.7 100.00 35,435,927.7 100.00 * **
U.E. 299 64.30 50,339.3 48.27 15,075,912.6 48.29 11,616,254.7 48.28 2 3A.E.L.S 10 2.15 662.9 0.64 196,874.9 0.63 152,388.0 0.63 4 2O.E.C.D 335 72.04 53,255.0 51.07 15,938,842.6 51.06 12,286,090.2 51.07 1 4C.E.F.T.A. 22 4.73 20.2 0.02 6,003.2 0.02 4,645.6 0.02 3 1
*) number of companies (column 1)**) total issued capital, in equivalent of currency (column 3)
*** Less than 0.01%
Note: Each economic group's weight is calculated related to the total Romania. The weights' sum is different from 100% due to the fact that one country might be part of more than one economical group. Empty rows reveal that there are no operations recorded in the current month.
18
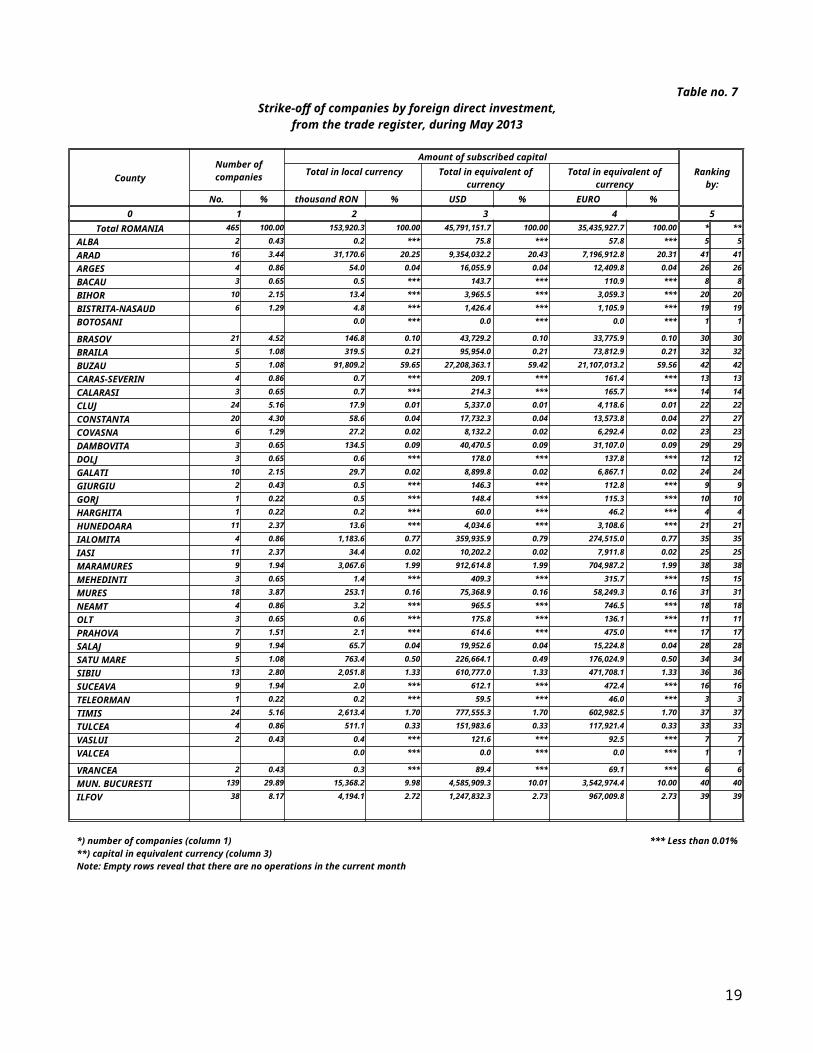
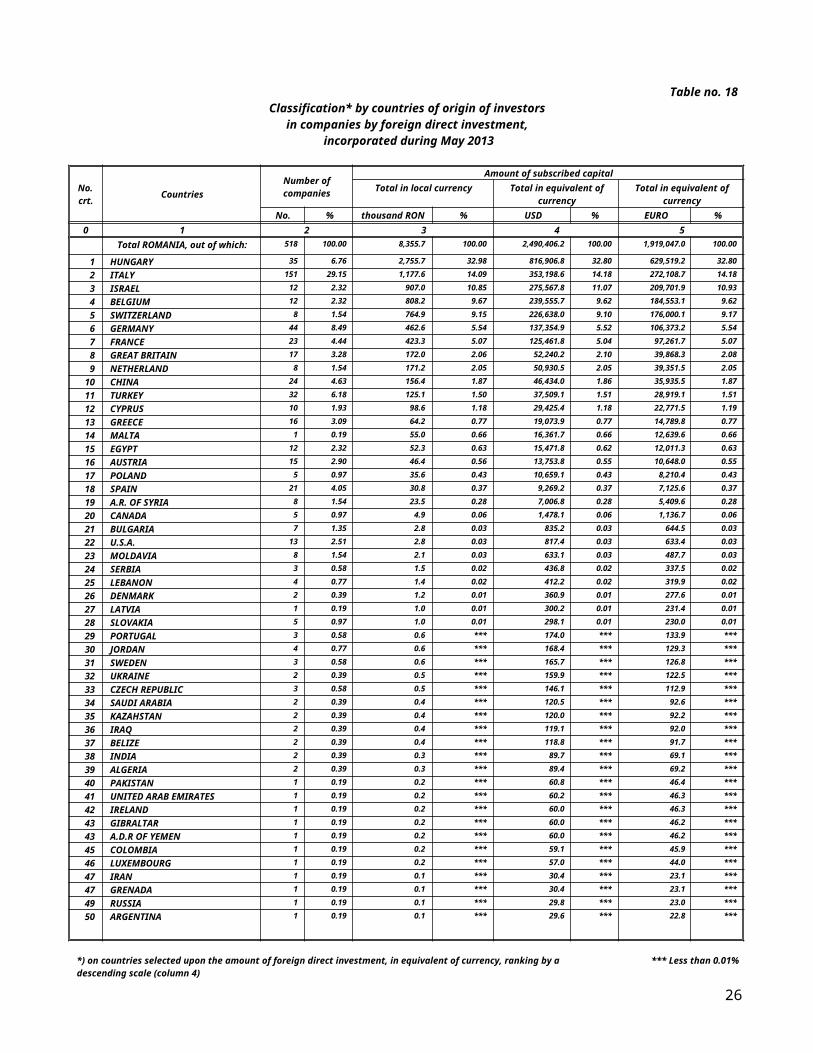
Table no. 18Classification* by countries of origin of investors
in companies by foreign direct investment, incorporated during May 2013
No.crt. Countries
Number of companies
Amount of subscribed capitalTotal in local currency Total in equivalent of
currencyTotal in equivalent of
currency
No. % thousand RON % USD % EURO %
0 1 2 3 4 5Total ROMANIA, out of which: 518 100.00 8,355.7 100.00 2,490,406.2 100.00 1,919,047.0 100.00
1 HUNGARY 35 6.76 2,755.7 32.98 816,906.8 32.80 629,519.2 32.802 ITALY 151 29.15 1,177.6 14.09 353,198.6 14.18 272,108.7 14.183 ISRAEL 12 2.32 907.0 10.85 275,567.8 11.07 209,701.9 10.934 BELGIUM 12 2.32 808.2 9.67 239,555.7 9.62 184,553.1 9.625 SWITZERLAND 8 1.54 764.9 9.15 226,638.0 9.10 176,000.1 9.176 GERMANY 44 8.49 462.6 5.54 137,354.9 5.52 106,373.2 5.547 FRANCE 23 4.44 423.3 5.07 125,461.8 5.04 97,261.7 5.078 GREAT BRITAIN 17 3.28 172.0 2.06 52,240.2 2.10 39,868.3 2.089 NETHERLAND 8 1.54 171.2 2.05 50,930.5 2.05 39,351.5 2.05
10 CHINA 24 4.63 156.4 1.87 46,434.0 1.86 35,935.5 1.8711 TURKEY 32 6.18 125.1 1.50 37,509.1 1.51 28,919.1 1.5112 CYPRUS 10 1.93 98.6 1.18 29,425.4 1.18 22,771.5 1.1913 GREECE 16 3.09 64.2 0.77 19,073.9 0.77 14,789.8 0.7714 MALTA 1 0.19 55.0 0.66 16,361.7 0.66 12,639.6 0.6615 EGYPT 12 2.32 52.3 0.63 15,471.8 0.62 12,011.3 0.6316 AUSTRIA 15 2.90 46.4 0.56 13,753.8 0.55 10,648.0 0.5517 POLAND 5 0.97 35.6 0.43 10,659.1 0.43 8,210.4 0.4318 SPAIN 21 4.05 30.8 0.37 9,269.2 0.37 7,125.6 0.3719 A.R. OF SYRIA 8 1.54 23.5 0.28 7,006.8 0.28 5,409.6 0.2820 CANADA 5 0.97 4.9 0.06 1,478.1 0.06 1,136.7 0.0621 BULGARIA 7 1.35 2.8 0.03 835.2 0.03 644.5 0.0322 U.S.A. 13 2.51 2.8 0.03 817.4 0.03 633.4 0.0323 MOLDAVIA 8 1.54 2.1 0.03 633.1 0.03 487.7 0.0324 SERBIA 3 0.58 1.5 0.02 436.8 0.02 337.5 0.0225 LEBANON 4 0.77 1.4 0.02 412.2 0.02 319.9 0.0226 DENMARK 2 0.39 1.2 0.01 360.9 0.01 277.6 0.0127 LATVIA 1 0.19 1.0 0.01 300.2 0.01 231.4 0.0128 SLOVAKIA 5 0.97 1.0 0.01 298.1 0.01 230.0 0.0129 PORTUGAL 3 0.58 0.6 *** 174.0 *** 133.9 ***30 JORDAN 4 0.77 0.6 *** 168.4 *** 129.3 ***31 SWEDEN 3 0.58 0.6 *** 165.7 *** 126.8 ***32 UKRAINE 2 0.39 0.5 *** 159.9 *** 122.5 ***33 CZECH REPUBLIC 3 0.58 0.5 *** 146.1 *** 112.9 ***34 SAUDI ARABIA 2 0.39 0.4 *** 120.5 *** 92.6 ***35 KAZAHSTAN 2 0.39 0.4 *** 120.0 *** 92.2 ***36 IRAQ 2 0.39 0.4 *** 119.1 *** 92.0 ***37 BELIZE 2 0.39 0.4 *** 118.8 *** 91.7 ***38 INDIA 2 0.39 0.3 *** 89.7 *** 69.1 ***39 ALGERIA 2 0.39 0.3 *** 89.4 *** 69.2 ***40 PAKISTAN 1 0.19 0.2 *** 60.8 *** 46.4 ***41 UNITED ARAB EMIRATES 1 0.19 0.2 *** 60.2 *** 46.3 ***42 IRELAND 1 0.19 0.2 *** 60.0 *** 46.3 ***43 GIBRALTAR 1 0.19 0.2 *** 60.0 *** 46.2 ***43 A.D.R OF YEMEN 1 0.19 0.2 *** 60.0 *** 46.2 ***45 COLOMBIA 1 0.19 0.2 *** 59.1 *** 45.9 ***46 LUXEMBOURG 1 0.19 0.2 *** 57.0 *** 44.0 ***47 IRAN 1 0.19 0.1 *** 30.4 *** 23.1 ***47 GRENADA 1 0.19 0.1 *** 30.4 *** 23.1 ***49 RUSSIA 1 0.19 0.1 *** 29.8 *** 23.0 ***50 ARGENTINA 1 0.19 0.1 *** 29.6 *** 22.8 ***
*) on countries selected upon the amount of foreign direct investment, in equivalent of currency, ranking by a descending scale (column 4)
*** Less than 0.01%
19
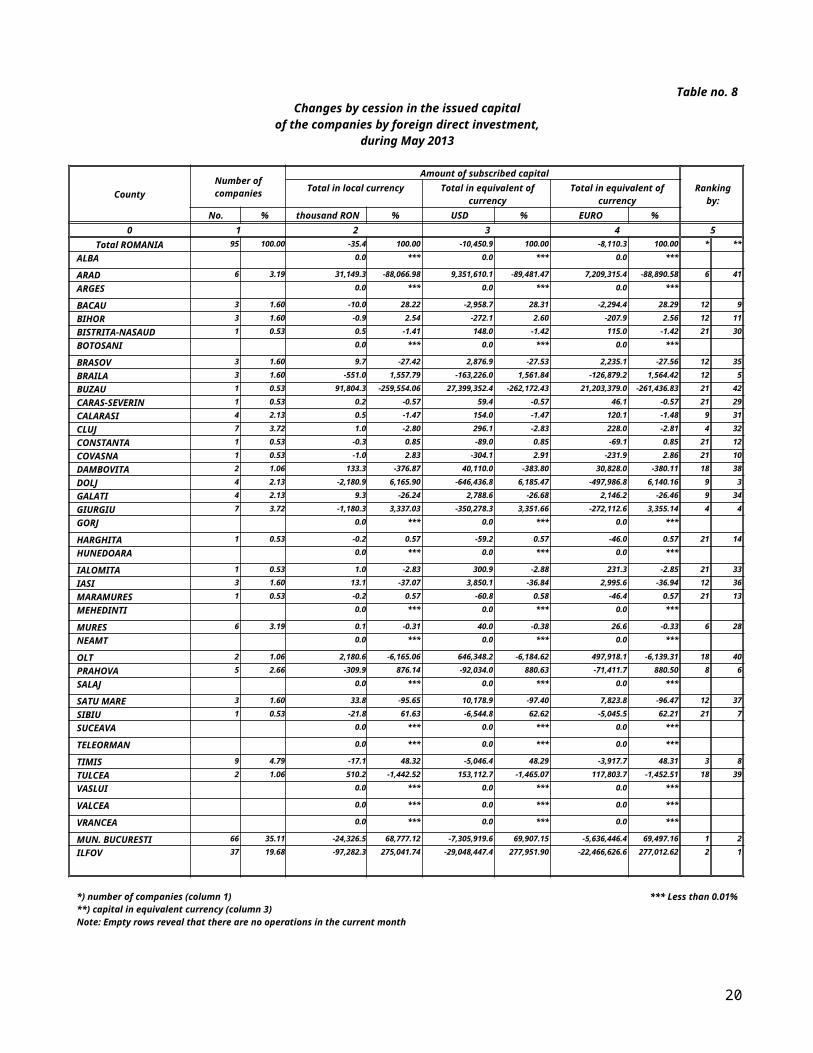
Table no. 19Classification* by investors' countries of origin according to the amount
of the increase in the issued capital, during May 2013
No.crt. Countries
Number of companies
Amount of subscribed capitalTotal in local currency Total in equivalent of
currencyTotal in equivalent of
currency
No. % thousand RON % USD % EURO %
0 1 2 3 4 5Total ROMANIA 682 100.00 663,776.4 100.00 198,284,564.7 100.00 152,823,743.2 100.00
1 CYPRUS 46 6.74 454,951.6 63.11 135,603,092.0 62.97 104,630,680.9 63.022 FRANCE 15 2.20 69,250.5 9.61 20,689,706.8 9.61 15,977,340.3 9.623 GREAT BRITAIN 11 1.61 49,520.3 6.87 14,837,848.6 6.89 11,432,567.4 6.894 ITALY 126 18.48 43,619.4 6.05 13,187,545.0 6.12 10,096,884.2 6.085 AUSTRIA 30 4.40 40,826.1 5.66 12,217,749.0 5.67 9,409,092.4 5.676 GIBRALTAR 1 0.15 13,521.5 1.88 4,111,887.2 1.91 3,136,009.0 1.897 HUNGARY 45 6.60 9,951.6 1.38 3,016,454.0 1.40 2,300,135.0 1.398 CZECH REPUBLIC 6 0.88 9,589.4 1.33 2,845,855.7 1.32 2,210,816.5 1.339 TURKEY 48 7.04 6,337.6 0.88 1,888,471.4 0.88 1,460,569.8 0.88
10 SWITZERLAND 14 2.05 3,484.2 0.48 1,057,649.0 0.49 807,289.0 0.4911 U.S.A. 14 2.05 2,858.8 0.40 850,174.4 0.39 657,039.4 0.4012 POLAND 4 0.59 2,349.0 0.33 712,341.5 0.33 544,159.4 0.3313 SPAIN 33 4.84 2,158.0 0.30 586,629.7 0.27 483,767.7 0.2914 GERMANY 38 5.57 1,806.5 0.25 540,299.0 0.25 416,621.9 0.2515 BELGIUM 7 1.03 1,541.8 0.21 460,140.3 0.21 355,995.8 0.2116 JORDAN 14 2.05 1,349.9 0.19 400,133.4 0.19 308,245.6 0.1917 BULGARIA 41 6.01 1,305.2 0.18 395,808.5 0.18 301,488.4 0.1818 BAHAMAS 1 0.15 1,318.0 0.18 393,362.4 0.18 304,409.1 0.1819 CHINA 22 3.23 1,240.1 0.17 372,351.3 0.17 286,101.6 0.1720 ISRAEL 12 1.76 765.6 0.11 232,721.2 0.11 177,535.4 0.1121 UNITED ARAB EMIRATES 2 0.29 752.7 0.10 224,645.9 0.10 173,845.2 0.1022 UKRAINE 8 1.17 588.6 0.08 173,911.8 0.08 134,966.0 0.0823 LEBANON 15 2.20 545.0 0.08 162,718.2 0.08 125,472.6 0.0824 A.R. OF SYRIA 22 3.23 377.8 0.05 112,920.5 0.05 87,311.0 0.0525 ARMENIA 1 0.15 266.6 0.04 78,770.9 0.04 61,131.4 0.0426 I.VIRGINE BRIT. 4 0.59 140.9 0.02 42,415.2 0.02 32,586.1 0.0227 MOLDAVIA 33 4.84 137.1 0.02 41,715.8 0.02 31,783.7 0.0228 CANADA 3 0.44 127.2 0.02 37,665.4 0.02 29,280.5 0.0229 KENYA 4 0.59 100.4 0.01 29,668.1 0.01 23,024.0 0.0130 MONACO 2 0.29 52.6 *** 15,669.0 *** 12,113.2 ***31 SLOVAKIA 7 1.03 15.3 *** 4,609.8 *** 3,546.0 ***32 NIGERIA 3 0.44 11.1 *** 3,334.0 *** 2,567.2 ***33 INDIA 4 0.59 7.2 *** 2,168.3 *** 1,667.1 ***34 ALBANIA 6 0.88 4.3 *** 1,273.6 *** 990.1 ***35 TAIWAN 2 0.29 3.5 *** 1,040.8 *** 805.2 ***36 EGYPT 8 1.17 2.2 *** 653.8 *** 507.0 ***37 IRELAND 2 0.29 1.8 *** 536.4 *** 416.1 ***38 SEYCHELLES 2 0.29 1.7 *** 503.0 *** 389.3 ***39 LITHUANIA 1 0.15 1.0 *** 300.9 *** 231.3 ***40 KUWEIT 2 0.29 0.8 *** 238.0 *** 184.4 ***41 TUNISIA 4 0.59 0.6 *** 179.7 *** 138.3 ***42 IRAQ 3 0.44 0.4 *** 133.6 *** 103.7 ***43 SERBIA 3 0.44 0.4 *** 123.0 *** 94.7 ***44 IRAN 2 0.29 0.4 *** 104.5 *** 80.7 ***45 CAMEROON 1 0.15 0.3 *** 77.1 *** 59.8 ***46 BOSNIA HERZEGOVINA 1 0.15 0.2 *** 60.8 *** 46.4 ***47 SWEDEN 2 0.29 0.2 *** 60.3 *** 46.2 ***48 RUSSIA 1 0.15 0.2 *** 60.0 *** 46.2 ***49 MARSHALL ISLANDS 1 0.15 0.2 *** 59.4 *** 45.8 ***50 VIETNAM 2 0.29 0.1 *** 30.4 *** 23.1 ***
*) on countries selected uppon the amount of the foreign direct investment, in equivalent of currency, ranking by a descending scale (column 4)
*** Less than 0.01%
20
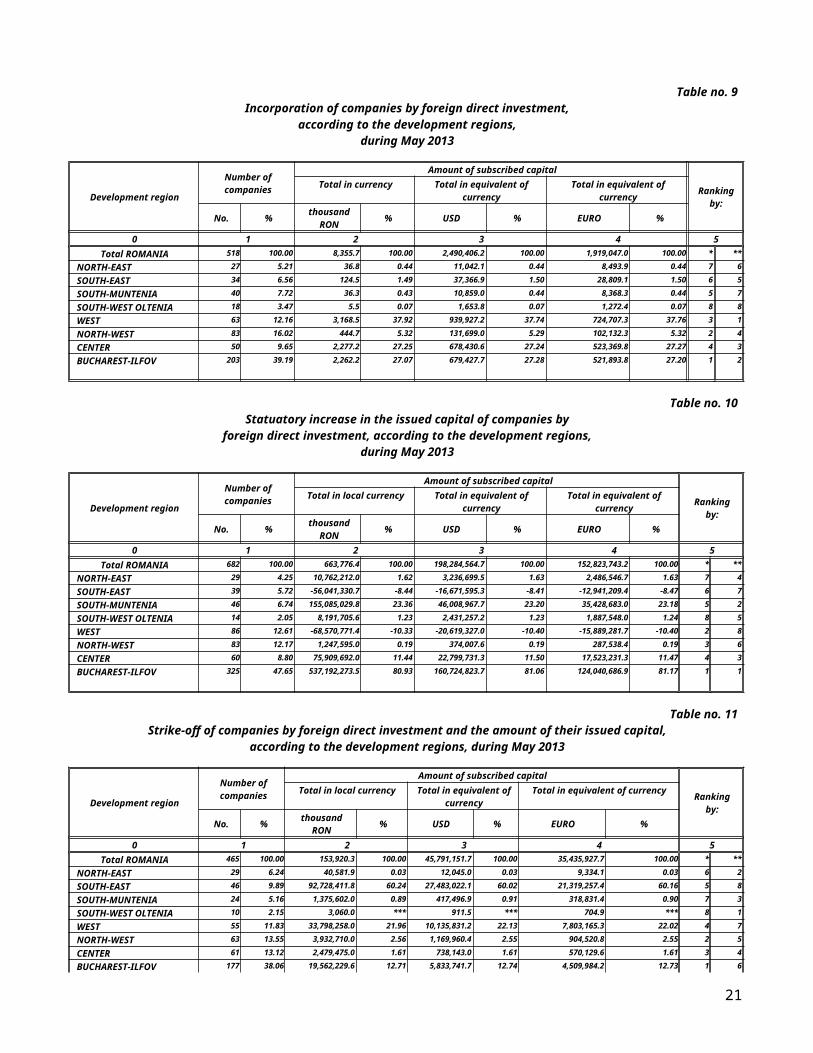
Table no. 20Classification of the top 40 companies by foreign direct investment
in the total subscribed capital, in equivalent of currency during May 2013
No.crt. Companies County
Country of origin of the majority
investor
Amount of subscribed capitalTotal in
local currency
Total in equivalent of currency
Total in equivalen
t of currency
thousand RON
thousand USD
thousand EURO
0 1 2 3 4 5 61 MARFIN LEASING IFN (ROMANIA) SA MUN. BUCURESTI CYPRUS 214,787.1 63,742.6 49,518.62 COS TÂRGOVIŞTE S.A. DAMBOVITA CYPRUS 149,066.3 44,184.8 34,038.13 GALAXY TOBACCO SA MUN. BUCURESTI CYPRUS 122,387.7 37,064.7 28,342.34 GROUPAMA ASIGURARI SA MUN. BUCURESTI FRANCE 48,714.6 14,457.1 11,231.05 MANINVEST CONS SRL MUN. BUCURESTI ITALY 36,845.8 11,158.6 8,532.76 DOMO RETAIL SA COVASNA CYPRUS 30,947.7 9,171.6 7,114.97 FORTE ASIGURARI - REASIGURARI SA MUN. BUCURESTI GREAT BRITAIN 26,778.9 7,961.4 6,177.68 EUROPAPIER ROMANIA SRL ILFOV AUSTRIA 22,239.3 6,618.6 5,116.69 BRICO DEVELOPMENT S.A. MUN. BUCURESTI FRANCE 19,710.0 5,989.4 4,557.3
10 ROMCONSTRUCT TOP SRL CONSTANTA LUXEMBOURG 18,451.0 5,551.3 4,267.011 CHEVRON ROMANIA EXPLORATION AND
PRODUCTION SRLMUN. BUCURESTI NETHERLAND 16,654.0 5,064.5 3,862.5
12 DF ACQUISITION SUB LIMITED SRL MUN. BUCURESTI GREAT BRITAIN 14,000.0 4,254.3 3,237.113 KARPATEN MEAT SRL SIBIU GIBRALTAR 13,521.5 4,111.9 3,136.014 KARPATEN MEAT SRL SIBIU NETHERLAND 9,400.0 2,858.5 2,180.115 KENVELO ROMANIA SRL MUN. BUCURESTI CZECH
REPUBLIC9,582.1 2,843.7 2,209.1
16 AS TOURISM SRL MURES HUNGARY 8,883.0 2,699.3 2,053.917 HERVIS SPORTS AND FASHION SRL ILFOV AUSTRIA 8,732.6 2,655.6 2,025.318 SOIMII (FERME) SRL SUCEAVA GREAT BRITAIN 8,740.0 2,621.7 2,017.519 PĂDURE - INVEST SRL TIMIS AUSTRIA 5,168.6 1,535.9 1,184.820 O LUME DE LAPTE SRL IALOMITA NETHERLAND 4,999.0 1,519.1 1,155.921 WELLKEPT IMOBILIARE SRL MUN. BUCURESTI CYPRUS 4,428.0 1,341.0 1,025.422 STAR IMOB CONSTRUCT SRL MUN. BUCURESTI CYPRUS 4,354.2 1,294.7 1,004.623 GeCAD ePayment International SA MUN. BUCURESTI NETHERLAND 4,210.6 1,280.5 976.624 FIVE CONTINENT SRL VALCEA SPAIN 4,072.6 1,208.6 938.925 BVB REAL ESTATE S.A. MUN. BUCURESTI NETHERLAND 3,603.9 1,071.6 831.526 BALAJI HOLDINGS REAL ESTATE SRL ILFOV CYPRUS 3,435.7 1,021.0 787.527 KARPATEN MEAT SRL SIBIU SWITZERLAND 3,227.2 981.4 748.528 BOGNER EDELSTAHL SRL SIBIU NETHERLAND 3,168.8 950.9 731.628 BOGNER EDELSTAHL SRL SIBIU AUSTRIA 3,168.8 950.9 731.630 VENUS DISTRIBUTION SRL ILFOV TURKEY 3,077.4 912.0 707.531 SQUARE PARKING SRL MUN. BUCURESTI SPAIN 2,829.1 841.2 652.732 OLTGROUP PVC SRL VALCEA CYPRUS 2,653.9 785.6 610.333 BKS TIMIŞ AGRO SRL TIMIS HUNGARY 2,607.4 772.9 595.434 AZUR SA TIMIS U.S.A. 2,570.3 764.6 590.735 SNIEZKA ROMANIA SRL NEAMT POLAND 2,045.5 622.0 474.436 EDP RENEWABLES ROMÂNIA SRL MUN. BUCURESTI SPAIN 1,700.0 504.4 391.837 DIGITAL CABLE SYSTEMS SA MUN. BUCURESTI NETHERLAND 1,630.0 495.7 378.038 BORGO ITALIANO SRL TIMIS ITALY 1,447.3 434.5 335.039 PROPRIETATI IMOBILIARE LAR SRL MUN. BUCURESTI SPAIN 1,465.1 434.3 334.540 SAFTICA NEW DEVELOPMENT SRL MUN. BUCURESTI CYPRUS 1,442.3 426.2 330.7
21
Date aferente perioadei 1991 - 2012Table no. 21
Number of registered companies with foreign investment capitaland amount of subscribed capital,
between 1991 and 2012
Year
Number of companies
Amount of subscribed capitalTotal in local currency Total in equivalent of
currencyTotal in equivalent of currency
No. % thousand RON % thousand USD % thousand EURO %
0 1 2 3 41991 - 2012, din care: 185,792 100.00 119,055,965.0 100.00 47,398,370.7 100.00 35,336,541.0 100.00
1991 5,499 2.96 258,165.5 0.22 1,058,260.8 2.23 817,975.6 2.311992 11,765 6.33 65,153.0 0.05 573,271.2 1.21 443,106.2 1.251993 10,583 5.70 92,793.2 0.08 417,844.8 0.88 322,970.3 0.911994 11,053 5.95 230,535.9 0.19 881,673.3 1.86 681,483.5 1.931995 3,400 1.83 67,893.9 0.06 237,717.0 0.50 183,741.8 0.521996 3,630 1.95 229,256.3 0.19 573,594.2 1.21 443,355.8 1.251997 5,251 2.83 232,229.8 0.20 359,912.8 0.76 278,192.2 0.791998 8,801 4.74 728,612.4 0.61 755,475.3 1.59 583,939.6 1.651999 7,383 3.97 1,214,843.7 1.02 944,365.3 1.99 729,940.9 2.072000 8,567 4.61 1,870,247.9 1.57 839,143.8 1.77 648,610.6 1.842001 7,175 3.86 4,820,820.8 4.05 1,540,810.8 3.25 1,190,959.4 3.372002 7,518 4.05 3,541,822.9 2.97 1,078,746.2 2.28 833,809.6 2.362003 6,609 3.56 4,441,402.8 3.73 1,288,885.0 2.72 996,235.1 2.822004 10,167 5.47 9,040,577.5 7.59 3,032,218.4 6.40 2,343,732.9 6.632005 11,719 6.31 7,173,157.1 6.03 3,149,681.6 6.65 2,434,525.4 6.892006 12,823 6.90 6,646,972.2 5.58 3,127,314.6 6.60 2,417,237.0 6.842007 15,720 8.46 7,737,574.2 6.50 3,314,201.6 6.99 2,389,392.2 6.762008 12,264 6.60 15,034,925.8 12.63 5,924,852.8 12.50 3,984,432.8 11.282009 6,801 3.66 15,303,310.6 12.85 4,817,293.2 10.16 3,512,610.5 9.942010 6,302 3.39 17,430,494.7 14.64 5,144,560.8 10.85 3,914,440.6 11.082011 6,377 3.43 10,190,486.1 8.56 4,659,785.0 9.83 3,329,432.4 9.422012 6,385 3.44 12,704,688.6 10.67 3,678,762.1 7.76 2,856,416.6 8.08
Note: column no. 1 shows the number of companies incorporated in the due period. The data concerning the amount of the subscribed capital include the records on the issued capital in companies incorporated in the related period plus the records of increase in capital and minus the subscribed capital in companies being struck-off from the trade register in the same period.
Diagram no. 9 Diagram no. 10Evolution of the number of companies
between 1991 and 2012Evolution of foreign investment in currency
(millions USD) during 1991 - 2012
22
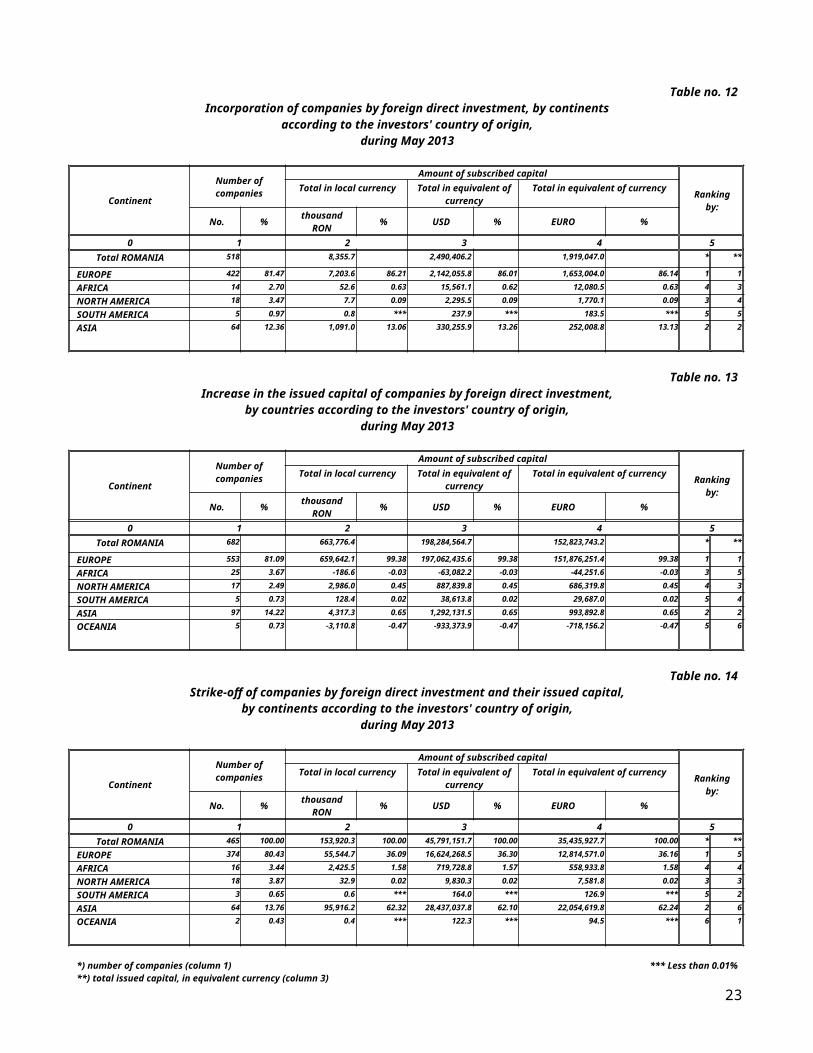
Table no. 22Number of registered companies, with foreign capital investment
and the value of the invested capital, during 1991 – 2012 balance account at 31 December 2012
County
Number of companies
Amount of subscribed capital
Orderby:
Total in local currency Total in equivalent of currency
Total in equivalent of currency
No. % thousand RON % thousand
USD % thousand EURO %
0 1 2 3 4 5Total ROMANIA 185,792 100.00 119,055,965.0 100.00 47,398,370.7 100.00 35,336,541.0 100.00 * **
ALBA 1,773 0.96 632,754.2 0.56 286,457.3 0.65 209,925.2 0.64 19 21ARAD 5,605 3.05 2,387,414.7 2.11 815,084.7 1.85 611,456.8 1.86 7 11ARGES 1,995 1.08 3,423,158.9 3.03 887,509.8 2.02 658,665.8 2.00 17 9BACAU 1,671 0.91 2,725,953.0 2.41 932,621.3 2.12 696,058.4 2.11 20 8BIHOR 6,911 3.76 1,543,737.5 1.37 1,362,442.8 3.10 1,018,808.3 3.09 4 4BISTRITA-NASAUD 1,181 0.64 470,909.6 0.42 151,036.2 0.34 112,869.9 0.34 25 28BOTOSANI 565 0.31 126,062.8 0.11 45,740.0 0.10 34,281.8 0.10 36 39BRASOV 5,499 2.99 3,363,738.3 2.98 1,131,123.7 2.57 848,116.4 2.57 8 6BRAILA 902 0.49 276,825.5 0.25 109,630.1 0.25 82,178.5 0.25 29 31BUZAU 1,075 0.58 1,197,222.6 1.06 360,328.5 0.82 271,310.1 0.82 28 19CARAS-SEVERIN 1,508 0.82 591,592.3 0.52 205,695.3 0.47 154,213.9 0.47 22 26CALARASI 503 0.27 1,356,982.4 1.20 529,583.5 1.20 398,961.5 1.21 39 16CLUJ 7,521 4.09 1,791,875.8 1.59 774,204.4 1.76 578,169.6 1.76 3 13CONSTANTA 6,086 3.31 3,081,101.2 2.73 1,026,075.5 2.33 768,071.0 2.33 6 7COVASNA 1,096 0.60 259,797.2 0.23 105,824.9 0.24 77,863.4 0.24 27 32DAMBOVITA 1,154 0.63 696,768.8 0.62 247,223.2 0.56 185,852.6 0.56 26 24DOLJ 2,209 1.20 2,209,759.0 1.96 667,916.5 1.52 502,002.2 1.52 16 14GALATI 1,493 0.81 2,536,981.2 2.25 800,501.1 1.82 597,726.1 1.81 23 12GIURGIU 758 0.41 643,217.5 0.57 240,430.4 0.55 182,852.3 0.56 33 25GORJ 511 0.28 78,636.9 0.07 24,809.1 0.06 18,558.1 0.06 37 41HARGHITA 2,791 1.52 335,286.2 0.30 124,027.0 0.28 92,887.4 0.28 12 30HUNEDOARA 1,951 1.06 878,729.1 0.78 283,770.7 0.65 211,973.7 0.64 18 22IALOMITA 506 0.28 157,885.2 0.14 56,861.4 0.13 42,504.6 0.13 38 38IASI 2,785 1.51 651,911.6 0.58 257,467.1 0.59 192,489.6 0.58 13 23MARAMURES 2,400 1.30 344,535.5 0.31 91,715.1 0.21 68,541.9 0.21 15 34MEHEDINTI 865 0.47 201,428.4 0.18 74,303.5 0.17 55,444.4 0.17 30 36MURES 3,665 1.99 3,130,569.6 2.77 1,184,861.8 2.69 886,320.6 2.69 10 5NEAMT 1,376 0.75 937,365.9 0.83 309,136.7 0.70 229,323.4 0.70 24 20OLT 667 0.36 1,884,707.9 1.67 646,340.8 1.47 486,726.5 1.48 35 15PRAHOVA 3,348 1.82 2,876,683.1 2.55 869,944.2 1.98 650,256.2 1.97 11 10SALAJ 829 0.45 463,968.2 0.41 153,022.7 0.35 114,218.0 0.35 31 27SATU MARE 2,406 1.31 205,188.8 0.18 99,859.3 0.23 73,641.3 0.22 14 33SIBIU 3,965 2.16 1,230,810.7 1.09 459,584.3 1.04 344,057.5 1.04 9 18SUCEAVA 1,537 0.84 1,395,786.5 1.24 487,696.1 1.11 366,766.2 1.11 21 17TELEORMAN 443 0.24 247,002.6 0.22 83,072.9 0.19 62,056.9 0.19 41 35TIMIS 12,530 6.81 4,402,862.6 3.90 1,629,586.5 3.70 1,221,160.6 3.71 2 3TULCEA 463 0.25 436,474.8 0.39 139,174.0 0.32 105,536.2 0.32 40 29VASLUI 367 0.20 129,775.3 0.11 45,026.3 0.10 33,616.5 0.10 42 40VALCEA 793 0.43 198,456.1 0.18 62,004.5 0.14 46,327.1 0.14 32 37VRANCEA 707 0.38 13,168.3 0.01 21,609.2 0.05 14,471.9 0.04 34 42MUN. BUCURESTI 83,080 45.16 55,097,340.3 48.80 23,202,458.8 52.75 17,385,857.2 52.78 1 1ILFOV 6,478 3.52 8,281,974.7 7.34 2,999,819.6 6.82 2,247,643.1 6.82 5 2
*) number of companies**) total issued capital, in equivalent currency
23

Table no. 23Number of registered companies, with foreign capital investment
and the value of the invested capital, on economic development areas, during 1991 - 2012– balance account at 31 December 2012
Economic development area
Number of companies
Amount of subscribed capital
Orderby:
Total in local currency Total in equivalent of currency
Total in equivalent of currency
No. % thousand RON % thousand
USD % thousand EURO %
0 1 2 3 4 5Total ROMANIA 185,792 119,055,965.0 47,398,370.7 35,336,541.0 * **
NORTH-EAST 8,301 4.51 5,966,855.1 5.29 2,077,687.4 4.72 1,552,536.0 4.71 7 7SOUTH-EAST 10,726 5.83 7,541,773.5 6.68 2,457,318.3 5.59 1,839,293.8 5.58 5 6SOUTH-MUNTENIA 8,707 4.73 9,401,698.5 8.33 2,914,625.2 6.63 2,181,150.1 6.62 6 4SOUTH-WEST OLTENIA
5,045 2.74 4,572,988.3 4.05 1,475,374.4 3.35 1,109,058.2 3.37 8 8
WEST 21,594 11.74 8,260,598.7 7.32 2,934,137.2 6.67 2,198,805.1 6.68 2 3NORTH-WEST 21,248 11.55 4,820,215.3 4.27 2,632,280.5 5.98 1,966,249.0 5.97 3 5CENTER 18,789 10.21 8,952,956.2 7.93 3,291,879.0 7.48 2,459,170.5 7.47 4 2BUCHAREST-ILFOV 89,558 48.68 63,379,315.0 56.14 26,202,278.3 59.57 19,633,500.3 59.60 1 1
Table no.24Number of registered companies, with foreign capital investment
and the value of the invested capital, on continents during 1991 - 2012– balance account at 31 December 2012
Continent
Number of companies
Amount of subscribed capital
Orderby:
Total in local currency Total in equivalent of currency
Total in equivalent of currency
No. % thousand RON % thousand
USD % thousand EURO %
0 1 2 3 4 5Total ROMANIA 185,792 119,055,965.0 47,398,370.7 35,336,541.0 * **
EUROPE 135,371 72.18 108,782,437.2 0.09 42,242,020.1 89.22 29,665,920.9 89.20 1 1AFRICA 2,364 1.26 192,435.2 *** 70,124.2 0.15 49,014.4 0.15 4 6NORTH AMERICA 8,243 4.39 2,933,925.7 *** 1,196,080.5 2.53 845,617.8 2.54 3 4SOUTH AMERICA 706 0.38 881,165.2 *** 1,610,242.0 3.40 1,124,106.5 3.38 6 2ASIA 39,746 21.19 3,394,888.8 *** 1,273,425.8 2.69 897,575.8 2.70 2 3OCEANIA 1,129 0.60 2,742,313.5 *** 954,987.6 2.02 674,104.8 2.03 5 5
Table no. 25Number of registered companies, with foreign capital investment
and the value of the invested capital, on economic groups, during 1991 - 2012– balance account at 31 December 2012
Economic groups
Number of companies
Amount of subscribed capital
Orderby:
Total in local currency Total in equivalent of currency
Total in equivalent of currency
No. % thousand RON % thousand
USD % thousand EURO %
0 1 2 3 4 5Total ROMANIA 185,792 119,055,965.0 47,398,370.7 35,336,541.0 * **
U.E. 98,380 44.78 73,912,086.2 47.14 28,607,317.3 48.16 21,422,935.4 48.16 2 2A.E.L.S 2,606 1.19 6,432,796.3 4.10 1,138,992.4 1.92 852,948.2 1.92 4 3O.E.C.D 115,023 52.35 76,337,636.7 48.69 29,607,856.4 49.85 22,172,201.2 49.85 1 1C.E.F.T.A. 3,703 1.69 104,233.5 0.07 40,291.1 0.07 30,172.5 0.07 3 4
Note: Each economic group's weight is calculated in total Romania. The weights' sum is different from 100% because each country may be part of one or many economic groups.
*** Less than 0.01%
*) number of companies**) total issued capital, in equivalent currency
24
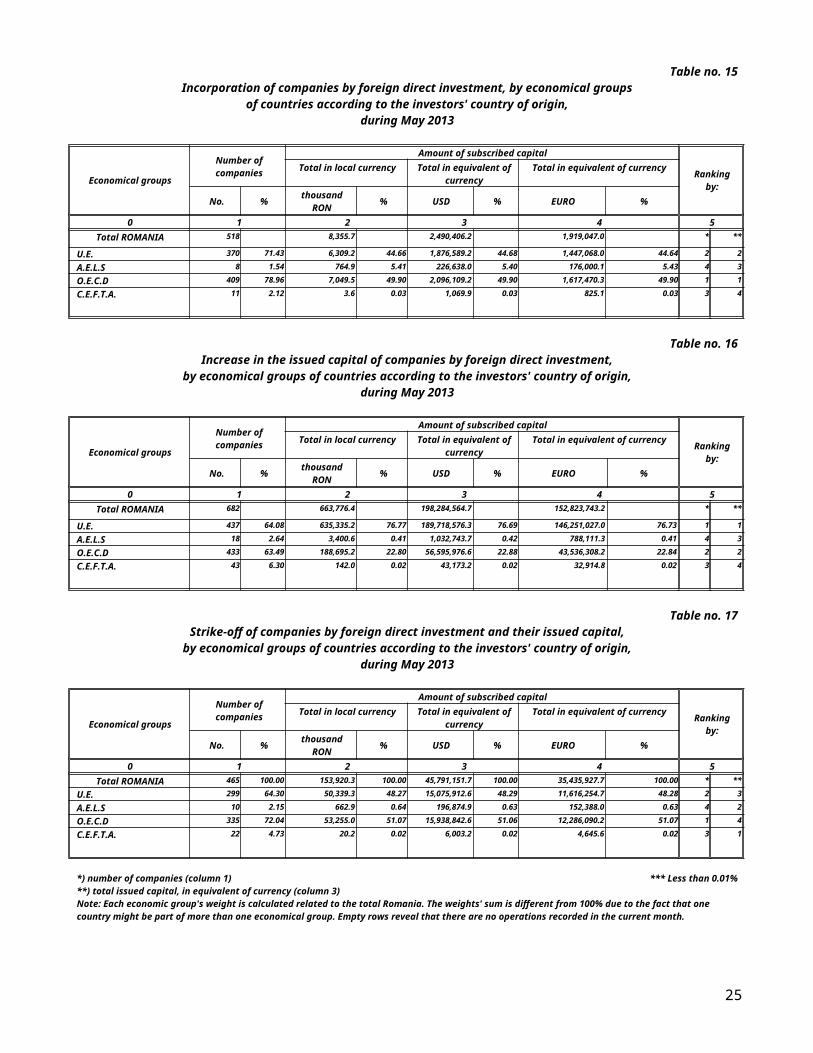
Diagram no. 11The structure upon sector of activity* of companies by foreign direct investment,
incorporated during 1991 - 2012 – balance account at 31 December 2012
Diagram no. 12The structure upon sector of activity in the amount of subscribed capital**
by foreign direct investment, during 1991 - 2012 - balance account at 31 December 2012
*) Calculated upon the main sector of activity declared**) Calculated upon the value of total investment, in equivalent currency (USD)
25
26

Table no. 26Top 50 countries classification on foreign
investment capital registered, during 1991 - 2012- balance account at 31 December 2012
No.crt. Countries
Number of companies
Amount of subscribed capitalTotal in local currency Total in equivalent
currencyTotal in equivalent
currency
No. % thousand RON % thousand USD % thousand
EURO %
0 1 2 3 4 5Total ROMANIA, out of
which:185,792 100.00 119,055,965.0 100.00 47,398,370.7 100.00 35,336,541.0 100.00
1 NETHERLAND 4,237 2.33 26,066,805.9 21.99 9,820,900.8 20.81 6,944,396.2 20.952 AUSTRIA 6,452 3.55 15,428,602.5 13.02 6,604,141.1 14.00 4,635,666.0 13.983 GERMANY 19,503 10.73 12,149,560.9 10.25 5,733,147.5 12.15 3,997,935.1 12.064 FRANCE 7,185 3.95 7,826,904.9 6.60 2,909,638.8 6.17 2,027,650.6 6.125 CYPRUS 5,205 2.86 7,667,963.4 6.47 2,894,362.4 6.13 2,038,240.4 6.156 GREECE 5,495 3.02 6,252,058.7 5.28 2,482,104.5 5.26 1,726,433.6 5.217 ITALY 34,185 18.80 6,237,648.3 5.26 2,311,416.6 4.90 1,647,444.4 4.978 SPAIN 4,818 2.65 3,853,303.4 3.25 1,460,741.2 3.10 1,027,384.1 3.109 SWITZERLAND 2,380 1.31 3,205,326.6 2.70 1,372,096.6 2.91 960,683.4 2.90
10 PANAMA 220 0.12 231,708.0 0.20 1,364,543.3 2.89 948,458.7 2.8611 LUXEMBOURG 735 0.40 3,542,651.7 2.99 1,295,247.5 2.74 917,196.9 2.7712 U.S.A. 6,573 3.62 2,573,182.7 2.17 1,067,761.1 2.26 752,873.4 2.2713 HUNGARY 11,795 6.49 2,247,735.6 1.90 951,216.7 2.02 666,634.9 2.0114 GREAT BRITAIN 4,617 2.54 2,274,976.9 1.92 948,298.9 2.01 651,864.8 1.9715 ANTILELE OLANDEZE 15 *** 2,048,521.2 1.73 726,226.4 1.54 504,817.2 1.5216 TURKEY 12,987 7.14 1,407,613.5 1.19 594,487.2 1.26 416,318.0 1.2617 CZECH REPUBLIC 751 0.41 1,404,917.6 1.19 535,813.5 1.14 376,836.9 1.1418 CHINA 10,583 5.82 1,116,508.6 0.94 429,992.1 0.91 301,236.7 0.9119 BELGIUM 2,845 1.56 963,155.8 0.81 424,165.3 0.90 297,992.4 0.9020 PORTUGAL 463 0.25 926,008.5 0.78 323,998.8 0.69 229,674.9 0.6921 SWEDEN 1,278 0.70 816,142.1 0.69 314,030.0 0.67 218,648.6 0.6622 DENMARK 728 0.40 745,077.8 0.63 279,524.8 0.59 195,138.5 0.5923 JAPAN 248 0.14 586,048.8 0.49 213,484.5 0.45 149,967.5 0.4524 POLAND 662 0.36 707,441.0 0.60 212,016.7 0.45 150,179.0 0.4525 FINLAND 150 0.08 522,237.3 0.44 192,889.8 0.41 135,682.6 0.4126 SOUTH KOREA 204 0.11 382,809.5 0.32 168,023.8 0.36 125,729.2 0.3827 LEBANON 3,795 2.09 354,303.2 0.30 149,309.5 0.32 104,771.9 0.3228 I.VIRGINE BRIT. 363 0.20 353,948.5 0.30 145,075.6 0.31 100,670.8 0.3029 CANADA 1,670 0.92 360,743.0 0.30 128,319.4 0.27 92,744.4 0.2830 GIBRALTAR 63 0.03 262,679.6 0.22 96,781.1 0.21 67,985.0 0.2131 BELIZE 38 0.02 279,309.7 0.24 88,974.1 0.19 67,061.4 0.2032 NORWEY 319 0.18 220,047.1 0.19 78,800.9 0.17 56,391.4 0.1733 WITH OUT CITIZENSHIP 25 0.01 1,095.5 *** 76,861.6 0.16 53,406.6 0.1634 AUSTRALIA 698 0.38 230,299.4 0.19 76,415.0 0.16 56,965.7 0.1735 BULGARIA 1,612 0.89 190,682.7 0.16 70,514.5 0.15 50,161.4 0.1536 ISRAEL 6,414 3.53 401,768.2 0.34 70,433.3 0.15 49,151.8 0.1537 BERMUDE ISLANDS 200 0.11 206,129.5 0.17 67,674.7 0.14 51,657.4 0.1638 SINGAPORE 57 0.03 169,941.3 0.14 63,028.1 0.13 43,815.9 0.1339 MARSHALL ISLANDS 24 0.01 138,972.0 0.12 48,987.8 0.10 34,040.6 0.1040 A.R. OF SYRIA 5,654 3.11 91,054.8 0.08 45,049.8 0.10 31,465.7 0.0941 LIECHTENSTEIN 207 0.11 3,319,164.4 2.80 44,087.3 0.09 30,560.7 0.0942 IRAQ 5,800 3.19 76,397.6 0.06 39,386.7 0.08 27,413.8 0.0843 SLOVENIA 185 0.10 99,407.2 0.08 39,030.3 0.08 27,208.4 0.0844 EGYPT 1,525 0.84 95,117.0 0.08 38,441.9 0.08 26,868.5 0.0845 INS. VIRGINE AMR. 187 0.10 117,446.5 0.10 35,413.6 0.08 26,415.5 0.0846 MOLDAVIA 4,103 2.26 79,631.8 0.07 34,846.1 0.07 24,065.2 0.0747 IRELAND 799 0.44 70,862.9 0.06 32,247.1 0.07 22,572.6 0.0748 SLOVAKIA 444 0.24 84,292.8 0.07 31,324.7 0.07 22,030.0 0.0749 JORDAN 3,220 1.77 60,916.1 0.05 29,260.2 0.06 20,293.6 0.0650 MALTA 98 0.05 73,009.7 0.06 26,614.2 0.06 18,781.1 0.06
*** Less than 0.01%
27