Embed Size (px)
Citation preview
on January 13, 2016http://rspb.royalsocietypublishing.org/Downloaded from
rspb.royalsocietypublishing.org
ResearchCite this article: Pfaender J, Hadiaty RK,
Schliewen UK, Herder F. 2016 Rugged adaptive
landscapes shape a complex, sympatric
radiation. Proc. R. Soc. B 283: 20152342.
http://dx.doi.org/10.1098/rspb.2015.2342
Received: 30 September 2015
Accepted: 27 November 2015
Subject Areas:evolution
Keywords:adaptive radiation, sympatric speciation,
ecological speciation, adaptive landscapes,
disruptive selection, Telmatherina
Author for correspondence:Jobst Pfaender
e-mail: [email protected]
Electronic supplementary material is available
at http://dx.doi.org/10.1098/rspb.2015.2342 or
via http://rspb.royalsocietypublishing.org.
& 2016 The Author(s) Published by the Royal Society. All rights reserved.
Rugged adaptive landscapes shapea complex, sympatric radiation
Jobst Pfaender1,2, Renny K. Hadiaty3, Ulrich K. Schliewen4 and Fabian Herder1
1Sektion Ichthyologie, Zoologisches Forschungsmuseum Alexander Koenig, Adenauerallee 160, Bonn 53113, Germany2Museum fur Naturkunde Berlin, Leibniz-Institut fur Evolutions- und Biodiversitatsforschung, Invalidenstraße 43,Berlin 10115, Germany3Ichthyology Laboratory, Division of Zoology, Research Center for Biology, Indonesian Institute of Sciences (LIPI),Jl. Raya Bogor Km 46, Cibinong 16911, Indonesia4Department of Ichthyology, SNSB - Bavarian State Collection of Zoology (ZSM), Munchhausenstr. 21,Munchen 81247, Germany
Strong disruptive ecological selection can initiate speciation, even in the
absence of physical isolation of diverging populations. Species evolving
under disruptive ecological selection are expected to be ecologically distinct
but, at least initially, genetically weakly differentiated. Strong selection and
the associated fitness advantages of narrowly adapted individuals, coupled
with assortative mating, are predicted to overcome the homogenizing effects
of gene flow. Theoretical plausibility is, however, contrasted by limited evi-
dence for the existence of rugged adaptive landscapes in nature. We found
evidence for multiple, disruptive ecological selection regimes that have
promoted divergence in the sympatric, incipient radiation of ‘sharpfin’ sailfin
silverside fishes in ancient Lake Matano (Sulawesi, Indonesia). Various modes
of ecological specialization have led to adaptive morphological differences
between the species, and differently adapted morphs display significant but
incomplete reproductive isolation. Individual fitness and variation in morpho-
logical key characters show that disruptive selection shapes a rugged adaptive
landscape in this small but complex incipient lake fish radiation.
1. IntroductionDisruptive ecological selection favours adaptation to distinct environments
[1,2], and may promote speciation, even in the absence of physical isolation
[2–6]. Fitness advantages of well-adapted phenotypes arise by local adaptation,
a phenomenon that is common in both plants and animal taxa (reviewed in [7]),
including case studies of ecological speciation, such as sticklebacks, Darwin’s
finches and Heliconius butterflies [8–10].
The fitness consequences of phenotypic variation in a given environment
can be conceptualized with adaptive landscapes [1,11,12]. Phenotypes that are
well adapted with respect to key evolutionary traits tend to occupy peaks in
the adaptive landscape, whereas poorly adapted individuals occur in lower
regions of the landscape [1,2,11–13]. Adaptive landscape topologies may range
from uniform (lack of selection) or unimodal (stabilizing selection) to bi- or multi-
modal (disruptive selection) distributions [2,12,13]. In the simplest case, such a
landscape is based on fitness estimation over variation in one single phenotypic
trait, such as the beak in birds [14,15]. However, it is likely that selection fre-
quently affects more than a single structure, and adaptive landscapes can also
be used to explore more complex, multivariate axes of phenotypic trait variation
[1,11,13,16].
Adaptive radiations provide examples for the rapid evolution of conspicu-
ous adaptations to alternative food resources and habitats [1]. Disruptive
ecological selection may affect variation in multiple key traits, and gain
additional momentum with the evolution of increasing species diversity [11].
The adaptive landscape of an adaptive radiation can therefore be expected to
be complex and rugged, sensu Nosil [2, p. 58] (i.e. with multiple distinct
peaks and deep valleys) [1,11–13].
rspb.royalsocietypublishing.orgProc.R.Soc.B
283:20152342
2
on January 13, 2016http://rspb.royalsocietypublishing.org/Downloaded from
Empirical evidence for the theoretical prediction that rugged
adaptive landscapes facilitate the evolution of species flocks
remains still limited, certainly for adaptive radiations in which
taxa evolved in sympatry. A notable exception is a study [17]
of the small Cyprinodon pupfishes radiation on San Salvador
islands, for which a direct link between phenotype and fitness
is established, and which supports the role of rugged adaptive
landscapes in adaptive radiation. However, this example is
based on hybrids that were bred in cages or the laboratories,
and from species that rarely interbreed in nature [18]. Therefore,
evidence that rugged adaptive landscapes promote adaptive
radiation in nature remains largely lacking.
Here we study a radiation of sailfin silversides that consti-
tutes a promising system to examine the relation between the
shape of adaptive landscapes and adaptive radiation. More
precisely, we test whether ecologically based disruptive selec-
tion can drive the evolution of rugged adaptive landscapes
under sympatric conditions.
The small, but morphologically complex fish radiation of
‘sharpfins’ (Telmatherinidae: Telmatherina) from ancient graben-
Lake Matano (Central Sulawesi, Indonesia) is the most diverse
lineage of sailfin silversides in the Malili Lakes System [19]. The
species flock is endemic to Lake Matano [20] and consists of sev-
eral ecological specialists with conspicuous morphological and
behavioural adaptations to various ecological niches [21–23].
However, specific morphotypes do not form well-sorted clades
in phylogenetic analyses based on mitochondrial markers [24].
High levels of interspecific gene flow [25] and direct evidence
for hybridization [24,26] have been observed, but morphotypes
nevertheless mate largely assortatively [25,27]. As such, repro-
ductive isolation among Lake Matano’s Telmatherina can be
considered to be substantial but incomplete. The onset of sharpfin
diversifications commenced approximately 0.9 Ma [28].
Using a random sample of sharpfins, we perform integrated
analyses of an estimator for individual fitness, an array of mor-
phological traits that influence ecological specialization, the
habitat context and stomach contents. We estimate the adaptive
landscape underlying the sharpfin radiation and present signa-
tures of ecologically based disruptive selection in the light of
population structure, habitat use and trophic ecology.
2. Material and methods(a) SamplingWe pre-defined a total of 160 sampling locations, distributed
equally (approx. every 500 m) all around Lake Matano’s shoreline
(electronic supplementary material, figure S1a). Sampling
locations were fished in a random order between May and
August 2010, by placing multimesh gillnets at depths of 0.75,
1.5, 3, 4.5 and 6 m. Gillnets were placed consistently for 20 min;
fishes were euthanized in MS222, and the gutted body and liver
were weighed with a precision of 0.001 g. Subsequently, a
muscle tissue sample was stored in RNAlater (Qiagen), whereas
specimens were transferred to 80% ethanol. Only mature individ-
uals (determined by fin shape and colour in males, and gonad
state in females) were included in the analyses (n ¼ 1060).
(b) Ecomorphological traitsWe analysed variation in overall body shape and head shape with
geometric morphometrics from digital X-ray images [29]. Homolo-
gous landmarks (15 and 13 for the body and head, respectively;
electronic supplementary material, figure S1b) were digitized in
TPSDIG2 [30]. GLS procrustes superimposition coordinates [29]
were calculated for each dataset in PAST [31] to reduce effects of
size and position. The first right gill arches were dissected and
measured with IMAGEJ [32] (electronic supplementary material,
figure S1b). Principal component analyses (PCA) were carried out
independently for each geometric morphometric dataset and the
relative lengths of the measured gill traits (residuals of a linear
regression of measured distances by the length of upper arch).
(c) Phenotypic structurePrincipal components (PCs) of the shape analyses and the gill trait
measurements were scored to their true rank, which is defined
here as the number of PCs, explaining together 99% of the total
variance in each dataset. The datasets were then scored by multi-
plying each PC’s residual by the square root of the rank divided
by the variance of the dataset [33]. We combined the PCs of the
shape analyses and the gill trait measurements in a k-mean cluster-
ing approach, and in a discriminant principal component analysis
(DAPC; R package adegenet [34,35]), to examine how the various
morphotypes in the radiation are structured in morphospace.
Overfitting during the DAPC was avoided by retaining less than
one-third of the original number of PCs (18 of 56) [34].
Identifying the actual number of clusters with a statistical pro-
cedure (e.g. BIC support values for various scenarios) is difficult
[34]. Here, the BIC values indicate that 5–11 clusters can appropri-
ately summarize the data. To estimate the actual number of
clusters within the obtained range we applied the NbClust func-
tion [36,37] to the dataset. This function uses 22 criteria to
determining the number of clusters and indicated that five clusters
(morphotypes) summarize the data most adequately (electronic
supplementary material, table S1).
(d) Stomach content analysisIndividual stomach contents were analysed following Pfaender et al.[23,38]. Food items of the gastrointestinal tract between oesophagus
and pylorus were determined to the most accurate taxonomic level
feasible and their relative volumetric proportions (in %) were esti-
mated. The 933 individuals containing food items in their stomach
were included in the stomach content analysis. Strong negative cor-
relations between some types of content were observed, especially
between molluscs, terrestrial insects, copepods and fish eggs. There-
fore, a PCA was applied to the correlation matrix of the proportional
stomach contents to reduce multicollinearity. We applied statistical
tests (ANOVAs and Tukey’s post hoc tests when variances were
equal; Welch tests with Dunnet T3 post hoc tests when they were
unequal) on individual PCs to test for pairwise differentiation
between morphotypes in feeding ecology.
(e) Habitat differentiationWe examined the habitats where fish were caught to identify habitat
parameters that may explain differences in the abundance of sharp-
fin morphotypes. Four habitat parameters were included in the
canonical correspondence analysis (CCA; R package vegan [39]):
dominant substrate at the general sampling location (rock, gravel,
sand); substrate directly at the gillnet (soft to hard in %); bathy-
metric slope where the gillnet was positioned (58 steps); and
sedimentation, which is related to surrounding canopy coverage
(low, medium, high). Significance of the habitat–morphotype
associations and individual canonical axes were calculated using
the anova.cca function [39] with 11 000 permutations per step.
Each placed gillnet was treated as a single catch event.
( f ) Amplified fragment length polymorphism procedureDNA was extracted from muscle tissue (NucleoSpin 96; Machery
and Nagel) of the 1060 individuals, following the manufacturer’s
rspb.royalsocietypublishing.orgProc.R.Soc.B
283:20152342
3
on January 13, 2016http://rspb.royalsocietypublishing.org/Downloaded from
protocol. Quality of DNA was checked on 1% agarose gels; DNA
concentrations were measured with a NanoDrop 200 (Thermo
Scientific) and adjusted to 25 ng ml21. We applied a slightly
modified AFLP method described by Vos [40] (see the electronic
supplementary material, notes and [25,24] for details). In total,
1218 polymorphic AFLP markers were retained.
(g) Genetic differentiation and population structureTo test how the identified phenotypic clusters relate to genetic
population structure, a DAPC and reassignment test (see detailed
description above) were applied to the retained AFLP markers.
Analysis of molecular variance (AMOVA [41]), implemented in
ARLEQUIN v. 3.5.1.2 [42], was used to investigate the structure of
the genetic variation among phenotypic clusters.
(h) Loci under selectionAllele distribution models are a powerful method to identify
alleles under selection from AFLP datasets [43,44]. They use mul-
tiple univariate logistic regressions to test the relation between the
frequency of AFLP loci and phenotypic variables. We applied
ADMs in MATSAM [43,44] on all retained loci and the PC
residuals from the ecomorphological trait analyses, centroid size,
sex and sample location to test for correlation. p-values resulting
from multiple tests have been adjusted with the sequential good-
ness-of-fit correction (SGoF [45]). The correction controls for the
family-wise error rate, which is suitable given that a large
number of tests are performed [45].
(i) Geographical differentiationPairwise least-cost paths between the sampling locations were cal-
culated from a resistance map with CIRCUITSCAPE [46]. As sharpfins
inhabit the littoral zones of Lake Matano [19,24], we clipped out
areas deeper than 50 m to avoid misleading interpretations of
the shortest possible way across the lake for these fishes. We
examined correlations between geographical distance (pairwise
least-cost paths) and genetic (Euclidean) distance with Mantel
tests (R package ade4 [47]) within morphotypes.
( j) Fitness proxiesEstimating fitness is challenging, especially in large natural
populations. For fishes, various proxies have been applied to
quantify lifetime reproduction and survivorship [48] (see also
[8,48,49]). Here, we use the relative liver weight as proxy for indi-
vidual fitness, because the liver is an important fat-storage organ
in fishes [50] and is frequently used as an estimator for individ-
ual condition in fishes (e.g. [51,52]). Moreover, individual
condition is tightly correlated with reproductive capacity in
other fish species (e.g. [53–56]). Hence, it is reasonable to
assume that relative liver mass is indicative for the individual
energy status in sailfin silversides, and that an enhanced
energy status enables an individual to produce larger numbers
of viable offspring, thus leading to greater individual fitness.
Relative liver weight was calculated as the residuals of a general-
ized linear model constructed with data on sex, body size and
the ratio between log-transformed liver weight and gutted
body weight. We tested the reliability of our fitness proxy by
investigating the correlation between relative liver mass and
reproductive capacity (the ratio between log-transformed
gonad weight and gutted body weight) with a subset of
127 female sharpfins. Because female sharpfins spawn promiscu-
ous numerous times per day (J.P. & F.H. 2012–2014, personal
observation), without distinct spawning season female gonad
mass appears a reliable estimator of reproductive capacity [27].
The use of relative liver mass as a general proxy for individ-
ual fitness does not imply that all potential fitness components
are adequately covered by it. Absolute size and phenotypic
proportions such as body depth vary strongly among the
morphotypes (see results below and [23]). To test for potential
differences in how our proxy represents fitness for various mor-
photypes, we applied an ANOVA to the residuals of log liver
weight versus log body weight; the test result did not show
significant differences (F4,1032 ¼ 1.902, p ¼ 0.108).
(k) Adaptive landscapesTo test for a signal of disruptive selection along major axes of
morphological variation, we applied non-parametric regressions
without an a priori assumption about the shape of the fitness sur-
face. Therefore, we used the generalized additive models (GAM)
routine of R package mgcv [34,57], with the fitness proxy as
dependent variable and the linear discriminant axes (LDs)
obtained from the linear discriminant analysis (implemented in
the DAPC) of the ecomorphological PCs as predictor variables.
The GAM models were calculated without splines, with cubic
splines, and with thin plate splines. The final model was
chosen based on the lowest Akaike information criterion
values (electronic supplementary material, table S3f ). Splines
were smoothed via generalized cross-validation and an approxi-
mation of the significance of smoothing terms was calculated
following Wood [58]. Trait axes with significant smoothing
according to the GAM analyses were visualized as pairwise com-
binations of two axes using the Tps function and its incorporated
plot function (R package fields [59]). The smoothing parameter
for the plot function minimizes the generalized cross-validation
score, and incorporates the estimated degrees of freedom from
the GAM analyses. To test whether sharpfin population means
plot in regions of higher fitness than expected by chance, we
compared the observed fitness with random simulations of
mean fitness. Using the runif function in R [34], 1000 population
means and 10 000 individuals were drawn from the adaptive
landscape. Individual fitness values were obtained from the
landscape, using the raster and extract functions (R package
raster) [60]. A pairwise comparison of each population and ran-
domly generated means was carried out, with an ANOVA and
Tukey’s post hoc test with individuals falling in a range of a stan-
dard error of 0.75 around random means. To adjust p-values
given the large number of post hoc tests SGoF [45] was applied.
To test whether a morphotype’s mean fitness differed signifi-
cantly from the population of random fitness means, a bimodal
test was carried out in R [34]. Tests for which observed fitness
mean was significantly greater than the pool of random fitness
means were treated as positives and others as negatives. To
identify whether morphotype means occupy an average peaks
in the adaptive landscape, we compared (using methods
described above) fitness values from the regions in the landscape
that are occupied by two morphotypes with the values obtained
in intermediate regions.
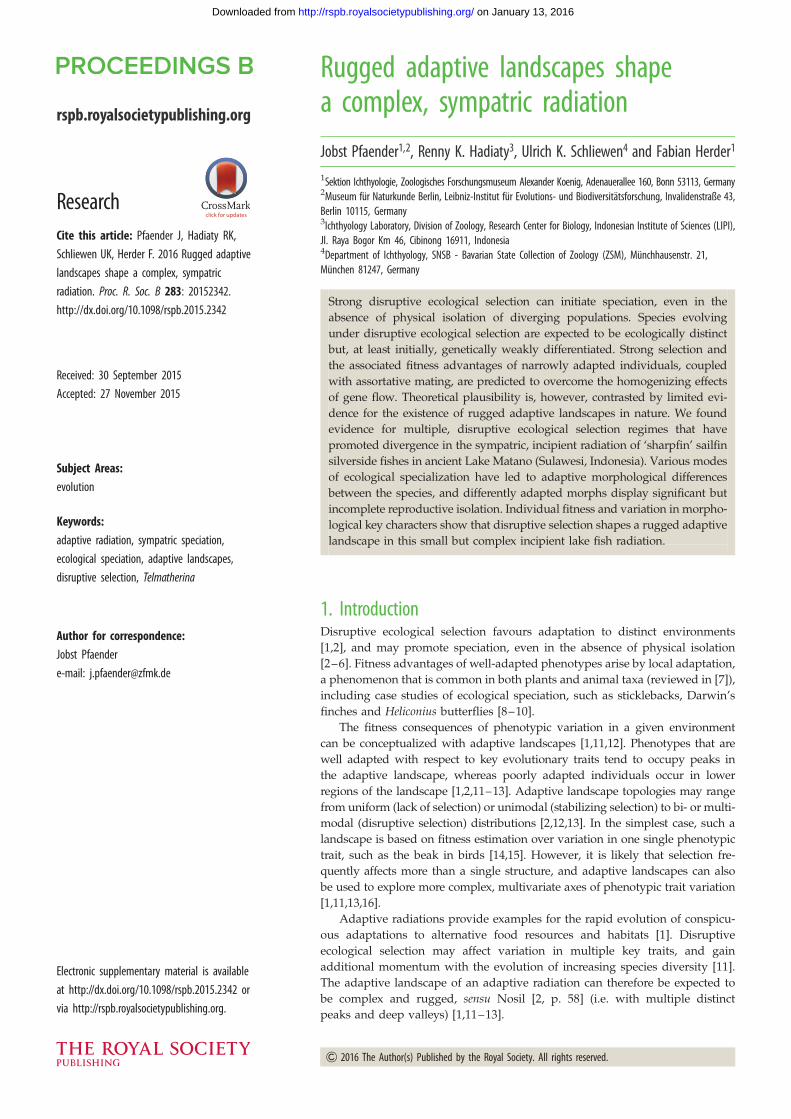
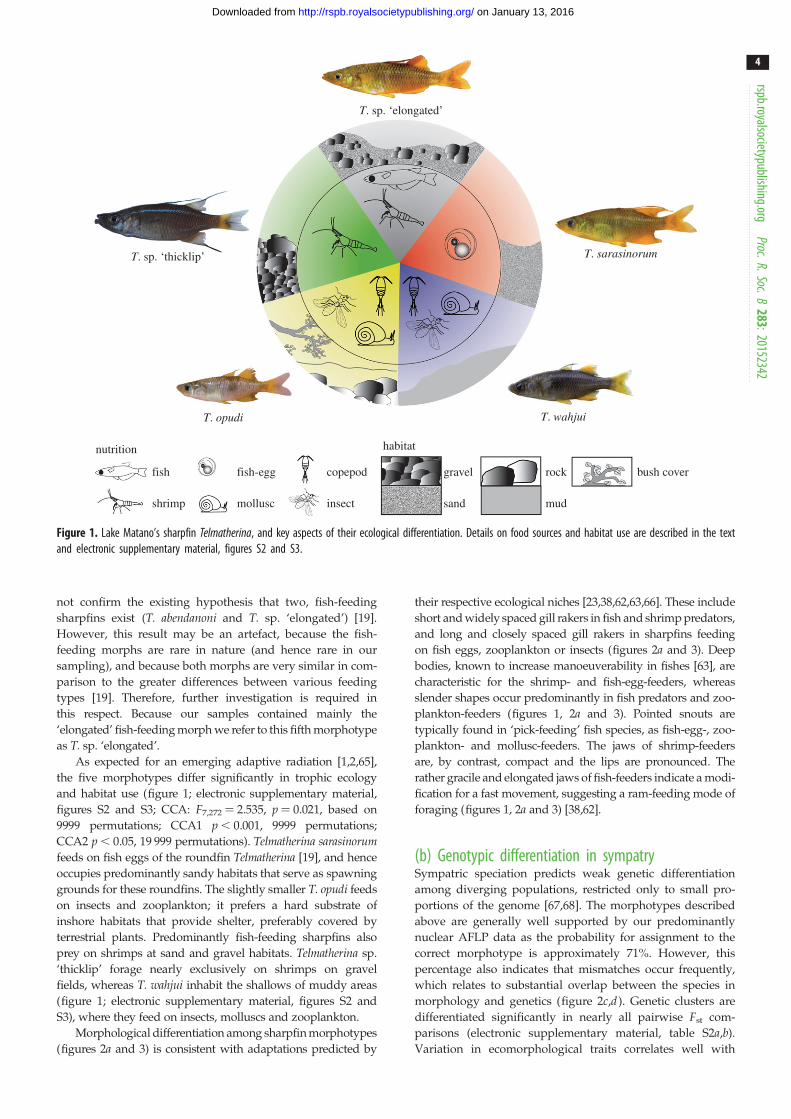
3. Results(a) Phenotypic diversity and ecologyCluster analyses of the observed morphological variation in
ecomorphological candidate traits (electronic supplementary
material, figure S1b) [23,61–63] support five morpho-
type groups (figure 1; electronic supplementary material,
table S1; total assignment probability: 83.28%), which largely
match the nominal sharpfin species [19,64]. The morphotype
Telmatherina sp. ‘thicklip’ (figures 1 and 2a) is very distinct,
whereas the other four morphotypes (i.e. the nominal taxa
T. opudi, T. sarasinorum, T. wahjui and T. sp. ‘elongated’) par-
tially overlap in morphospace (figure 2a). Our analysis does
T. sp. ‘elongated’
T. sarasinorum
T. wahjuiT. opudi
T. sp. ‘thicklip’
nutrition
fish
shrimp
fish-egg
mollusc
copepod
insect
habitat
gravel
sand
rock
mud
bush cover
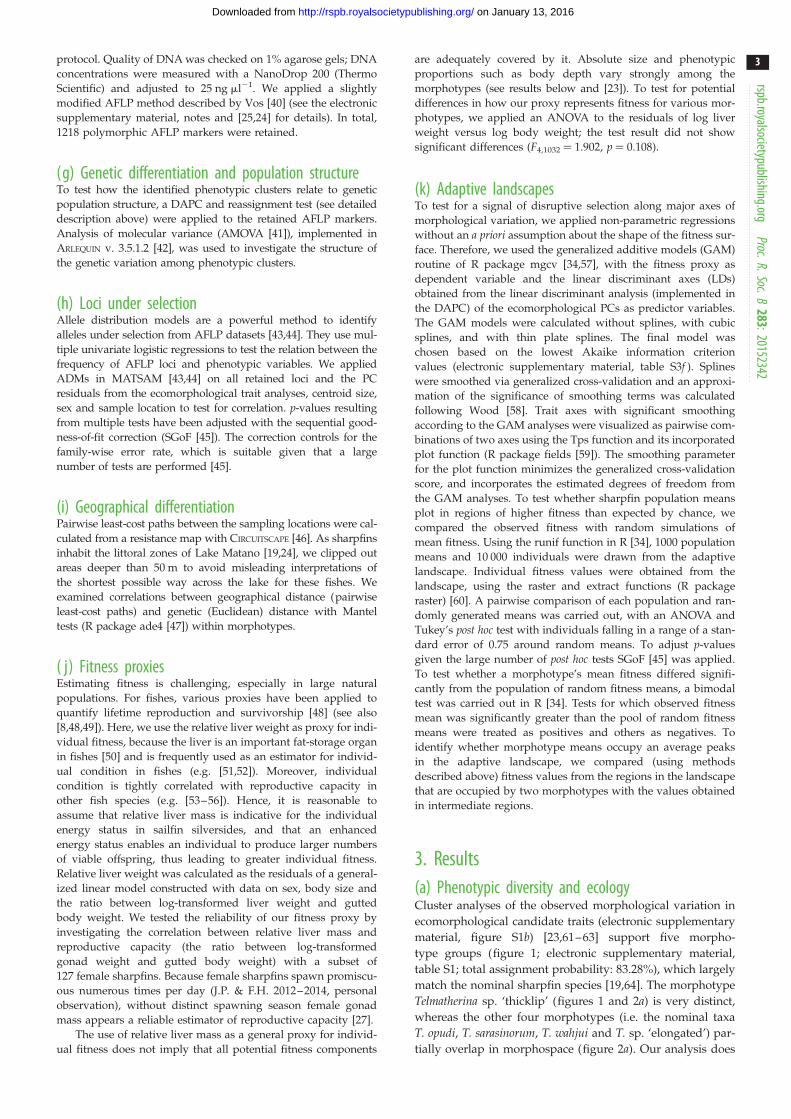
Figure 1. Lake Matano’s sharpfin Telmatherina, and key aspects of their ecological differentiation. Details on food sources and habitat use are described in the textand electronic supplementary material, figures S2 and S3.
rspb.royalsocietypublishing.orgProc.R.Soc.B
283:20152342
4
on January 13, 2016http://rspb.royalsocietypublishing.org/Downloaded from
not confirm the existing hypothesis that two, fish-feeding
sharpfins exist (T. abendanoni and T. sp. ‘elongated’) [19].
However, this result may be an artefact, because the fish-
feeding morphs are rare in nature (and hence rare in our
sampling), and because both morphs are very similar in com-
parison to the greater differences between various feeding
types [19]. Therefore, further investigation is required in
this respect. Because our samples contained mainly the
‘elongated’ fish-feeding morph we refer to this fifth morphotype
as T. sp. ‘elongated’.
As expected for an emerging adaptive radiation [1,2,65],
the five morphotypes differ significantly in trophic ecology
and habitat use (figure 1; electronic supplementary material,
figures S2 and S3; CCA: F7,272 ¼ 2.535, p ¼ 0.021, based on
9999 permutations; CCA1 p , 0.001, 9999 permutations;
CCA2 p , 0.05, 19 999 permutations). Telmatherina sarasinorumfeeds on fish eggs of the roundfin Telmatherina [19], and hence
occupies predominantly sandy habitats that serve as spawning
grounds for these roundfins. The slightly smaller T. opudi feeds
on insects and zooplankton; it prefers a hard substrate of
inshore habitats that provide shelter, preferably covered by
terrestrial plants. Predominantly fish-feeding sharpfins also
prey on shrimps at sand and gravel habitats. Telmatherina sp.
‘thicklip’ forage nearly exclusively on shrimps on gravel
fields, whereas T. wahjui inhabit the shallows of muddy areas
(figure 1; electronic supplementary material, figures S2 and
S3), where they feed on insects, molluscs and zooplankton.
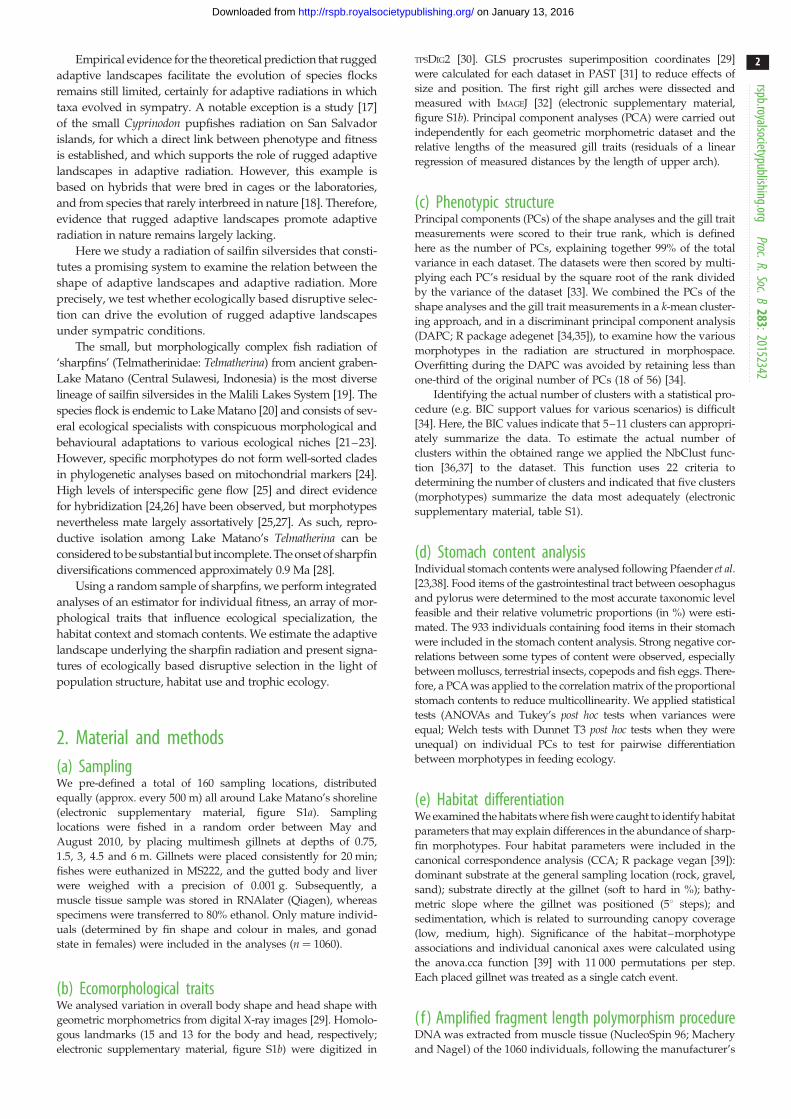
Morphological differentiation among sharpfin morphotypes
(figures 2a and 3) is consistent with adaptations predicted by
their respective ecological niches [23,38,62,63,66]. These include
short and widely spaced gill rakers in fish and shrimp predators,
and long and closely spaced gill rakers in sharpfins feeding
on fish eggs, zooplankton or insects (figures 2a and 3). Deep
bodies, known to increase manoeuverability in fishes [63], are
characteristic for the shrimp- and fish-egg-feeders, whereas
slender shapes occur predominantly in fish predators and zoo-
plankton-feeders (figures 1, 2a and 3). Pointed snouts are
typically found in ‘pick-feeding’ fish species, as fish-egg-, zoo-
plankton- and mollusc-feeders. The jaws of shrimp-feeders
are, by contrast, compact and the lips are pronounced. The
rather gracile and elongated jaws of fish-feeders indicate a modi-
fication for a fast movement, suggesting a ram-feeding mode of
foraging (figures 1, 2a and 3) [38,62].
(b) Genotypic differentiation in sympatrySympatric speciation predicts weak genetic differentiation
among diverging populations, restricted only to small pro-
portions of the genome [67,68]. The morphotypes described
above are generally well supported by our predominantly
nuclear AFLP data as the probability for assignment to the
correct morphotype is approximately 71%. However, this
percentage also indicates that mismatches occur frequently,
which relates to substantial overlap between the species in
morphology and genetics (figure 2c,d ). Genetic clusters are
differentiated significantly in nearly all pairwise Fst com-
parisons (electronic supplementary material, table S2a,b).
Variation in ecomorphological traits correlates well with
‘morphospace’ ‘genospace’
–10
–5
5
0LD1
–4
–2
0
2
4
–2
0
2
LD3
LD3
LD2
2
–2
–6
–2
0
4
50
–5
LD2
LD1
100 80 60 40 20 0
assignment probability (%)
(a) (b)
(c) (d)
Figure 2. (a) Morphological and (b) genetic differentiation between sharpfins with (c,d) assignment probabilities of individuals to their respective clusters.Scatterplots show the first three linear discriminant axes of the discriminant principal component analyses. Convex hulls in (a) and (b) represent 95% confidenceellipses. Heat maps display the individual assignment probability to the respective (c) phenotypic and (d ) genotypic cluster on the y-axis as vertical thin lines foreach individual. Assignment probabilities to a given group are displayed in greyscale from white (0%) to black (100%). Clusters are colour-coded in all panelsaccording to the scheme displayed in figure 1.
rspb.royalsocietypublishing.orgProc.R.Soc.B
283:20152342
5
on January 13, 2016http://rspb.royalsocietypublishing.org/Downloaded from
variation in 13% of the analysed nuclear markers (electronic
supplementary material, table S2c). Removal of these puta-
tively selective loci decreases the success of assignment to
the correct morphotype markedly (52.29%). This finding
suggests that sharpfin genetic population structure is main-
tained by comparatively small proportions of nuclear loci.
We did not detect any spatial effects in population structure
(electronic supplementary material, table S2d ) and all
morphotypes except for T. sp. ‘thicklip’ were found evenly
distributed around Lake Matano’s shoreline (electronic
supplementary material, figure S1a).
(c) Adaptive landscapesDisruptive selection is predicted to shape rugged adaptive land-
scapes during speciation in the face of gene flow [1,2,69].
As expected, relative liver weight is correlated with female
gonad mass, and thus reproductive capacity in sharpfins (n¼127C; t 9.42; R2 41.5%; p , 0.001). The finding indicates that
our earlier assumption that relative liver weight is a good
proxy for individual fitness in sharpfins much as in other fishes
[53–56] is justified. Upon comparing relative liver weight with
variation in the size-independent morphological dataset in
the GAM (R2 5.85%; effective degrees of freedom: 11.57; general-
ized cross-validation: 0.191; electronic supplementary material,
table S3), three LDs (LD1, LD2 and LD4) revealed a significant
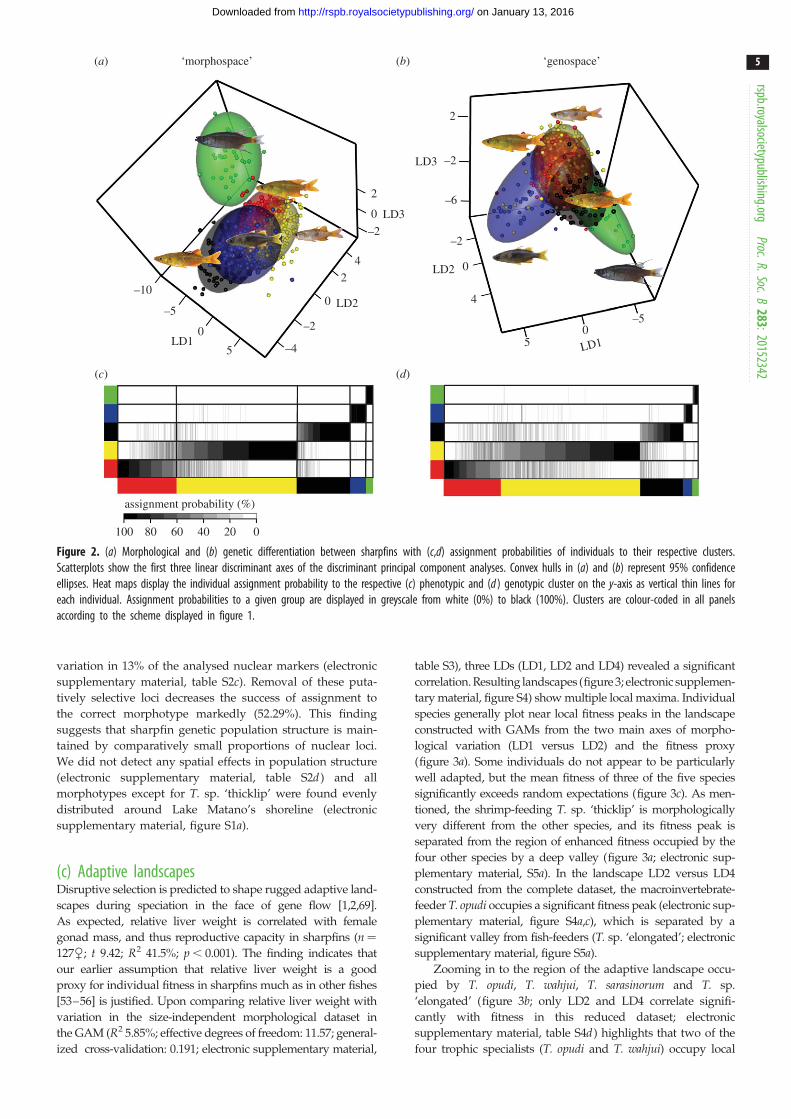
correlation. Resulting landscapes (figure 3; electronic supplemen-
tary material, figure S4) show multiple local maxima. Individual
species generally plot near local fitness peaks in the landscape
constructed with GAMs from the two main axes of morpho-
logical variation (LD1 versus LD2) and the fitness proxy
(figure 3a). Some individuals do not appear to be particularly
well adapted, but the mean fitness of three of the five species
significantly exceeds random expectations (figure 3c). As men-
tioned, the shrimp-feeding T. sp. ‘thicklip’ is morphologically
very different from the other species, and its fitness peak is
separated from the region of enhanced fitness occupied by the
four other species by a deep valley (figure 3a; electronic sup-
plementary material, S5a). In the landscape LD2 versus LD4
constructed from the complete dataset, the macroinvertebrate-
feeder T. opudi occupies a significant fitness peak (electronic sup-
plementary material, figure S4a,c), which is separated by a
significant valley from fish-feeders (T. sp. ‘elongated’; electronic
supplementary material, figure S5a).
Zooming in to the region of the adaptive landscape occu-
pied by T. opudi, T. wahjui, T. sarasinorum and T. sp.
‘elongated’ (figure 3b; only LD2 and LD4 correlate signifi-
cantly with fitness in this reduced dataset; electronic
supplementary material, table S4d) highlights that two of the
four trophic specialists (T. opudi and T. wahjui) occupy local
100
60
200
581 95 80
prop
ortio
n (%
)
***
100
60
200
408 217 131
prop
ortio
n (%
)
*
100
60
200 454 93 209
prop
ortio
n (%
)
***
100
60
200
318 150 288
prop
ortio
n (%
)
n.s.
100
60
200
165 91 500
prop
ortio
n (%
) n.s.
100
60
200
295 445 181
prop
ortio
n (%
) n.s.
100
60
200
839 80 2pr
opor
tion
(%) ***
100
60
200
524 232 165
prop
ortio
n (%
) ***
100
60
200
393 262 266
prop
ortio
n (%
) n.s.
1 2 3 4 5gill raker length
1 2 3 4 5gill raker length
1 2 3 4 5gill raker length
1 2 3 4 5gill raker length
1 2 3 4 5gill raker length
1 2 3 4 5gill raker length
1 2 3 4 5gill raker length
1 2 3 4 5gill raker length
1 2 3 4 5gill raker length
–6
–8
–10
–2
0
–2LD2
2
0
–2
LD4
fitne
ss p
roxy
fitn
ess
prox
y
3
2
0LD1
1
–1
–3
–2
–4
–6
–4
–2
LD2
(a)
(b) (d)
(c)
Figure 3. Adaptive landscapes of sharpfins (a,b) and significance of the occupied peaks versus random sampling (c,d ). Two axes (LD1 and LD2 in a; LD2 and LD4 inb) represent ecomorphological differentiation, whereas the third represents the fitness proxy, (a) for the entire radiation (five morphotypes) and (b) excluding T. sp.‘thicklip’. Plots (a,b) show thin plate splines, with smoothing parameters obtained from minimizing the general cross-validation scores. Positions of individuals areplotted as grey dots on the contour map, whereas species means are colour-coded as in figure 1. Species means and standard deviations were calculated fromindividuals with an assignment probability of greater than 95% to the respective morphotype. Statistical details are provided in the electronic supplementarymaterial, table S3. Comparative representations of studied ecomorphological traits (shape of body, head and gills) for the mean of each species are providedin insets. Direction and length of arrows in these insets indicate how each species differs from the center of the morphospace occupation. Variation in gillraker length is displayed as a colour gradient from red (short) to blue (long and gracile). Barplots (c,d ) show the proportion of tests (number on the x-axis)with a significantly higher (black bars), not significantly different (white bars) or significantly lower (grey bar) fitness of sharpfins than random means. Significantlyenhanced fitness of sharpfin species is indicated by lines above barplots.
rspb.royalsocietypublishing.orgProc.R.Soc.B
283:20152342
6
on January 13, 2016http://rspb.royalsocietypublishing.org/Downloaded from
rspb.royalsocietypublishing.orgProc.R.Soc.B
283:20152342
7
on January 13, 2016http://rspb.royalsocietypublishing.org/Downloaded from
fitness peaks with significantly enhanced fitness (figure 3d),
although higher fitness peaks occur nearby in the landscape.
In contrast with the complete dataset, the conspicuously
wide-headed T. wahjui is situated in a region of significantly
enhanced fitness (figure 3b,d). However, T. opudi inhabits the
most distinct fitness peak in that landscape, separated by sig-
nificant valleys from T. wahjui and T. sp. ‘elongated’ (figure 3b;
electronic supplementary material, figure S5b).
Additional valleys appear plausible from visual impression
(figure 3; electronic supplementary material, figure S4), and in
several cases (LD1 versus LD2: T. wahjui; figure 3c; LD2 versus
LD4: T. wahjui, T. sp. ‘elongated’, T. sp. ‘thicklip’; electronic sup-
plementary material, figure S4c; reduced data: T. sarasinorum,
T. sp. ‘elongated’; figure 3b; LD1 versus LD4: T. opudi, T. sp.
‘thicklip’), the number of individuals with fitness proxies
exceeding neutral expectations is higher than that of sharpfins
with below-average fitness; these cases are, however, not
supported in rigorous binomial tests.
Differences in gill raker length dominate the morphological
variance, explained by LD1, whereas changes in body and
head shape are summarized in the following axes (LD2 and
LD4; figure 3a,b; electronic supplementary material, figure
S4a,b). Therefore, disruptive selection is significant in gill traits,
where species means tend to peak in the adaptive landscape
with either short and wide-spaced or long and narrow-spaced
gill rakers (figure 3a,b). Signal for disruptive selection in head
shape is especially prominent along axes of variation in snout
proportions (figure 3a,b). Finally, different kinds of body
shapes are associated to high fitness proxy values: deep-bodied
fishes with a short caudal peduncle, individuals with conspicu-
ously oval body shapes and conspicuously slender sailfins
with either an elongated or a short caudal peduncle (figure 3a,b).
4. DiscussionAlthough ecological speciation is considered a major driver of
diversification [2,65], our knowledge on how ecological factors
have contributed to lineage divergence and speciation in com-
plex radiations remains limited [2,70]. Here, we document that
ecological opportunities (such as different food sources in
sharpfin silversides) promote radiation by creating complex,
rugged adaptive landscapes to which populations adapt.
Adaptation to ecological opportunities is driven by selection,
which can be disruptive in rugged adaptive landscapes.
Our sampling of Lake Matano’s sharpfins reveals the
presence of five, mainly sympatric morphotypes (figure 2;
electronic supplementary material, figure S1). Variation in
morphological key traits, including the shape of the head,
body and gill rakers, is directly related to different feeding
strategies, behaviour and habitat use (figures 1 and 2; elec-
tronic supplementary material, figures S2 and S3). All
morphotypes relate to ecologically and genetically largely
differentiated species, from deep-bodied shrimp-feeders,
inhabiting gravel fields, to smaller near-shore insectivores
and slender fish-feeders dwelling with shoaling juveniles
(figure 1). Genome-wide surveys of polymorphism demon-
strate that the variation in ecomorphological traits is
correlated with variation in a restricted number of genetic
markers (electronic supplementary material, table S2c).
These findings clearly meet predictions for an ongoing radi-
ation, evolving sympatrically under ecological selection
pressure [68,70]. The incipient nature of this adaptive
radiation, however, also results in overlaps in morphology
and genetic variability between four of the five morphotypes,
and intermediate, usually less fit individuals remain rela-
tively common (figures 2 and 3; electronic supplementary
material, figure S5).
A central aspect of this study is the significant signal of
disruptive selection along major axes of morphological vari-
ation (electronic supplementary material, table S3; figure 3),
resulting in complex adaptive landscapes with multiple
peaks (figure 3; electronic supplementary material, figure
S4). As predicted [2,12], the five morphotype means occupy
several regions of high fitness (figure 3). Interestingly, valleys
between these fitness peaks are, with exception of T. sp.
‘thicklip’, not very deep, but frequently reflect regions of sig-
nificant lower fitness (figure 3; electronic supplementary
material, figure S5). This suggests a general lower fitness of
individuals intermediate to the population means (i.e.
hybrids) compared with the population means. Incomplete
speciation, possibly in combination with adaptation that
arises from combined divergence in several traits, or traits
that are not quantified here, provides a possible explana-
tion for a lack of significant valleys between some of the
phenotypic less distinct sharpfins. Nevertheless, sharpfins
clearly fulfil predictions for ‘rugged’ adaptive landscapes
in an emerging adaptive radiation, driven by disruptive
ecological selection.
Selective regimes may vary over time, as reported, for
example, from postglacial stickleback systems [71]. We also
cannot exclude that the adaptive landscapes reconstructed
here, and the selective regimes that shape divergence of the
sharpfin flock, may change through time. However, there
are no apparent hints for this assumption. The environment
of Lake Matano is considered long-term stable [20]. Further-
more, correlations among traits and sources of nutrition
remained consistent across studies that are based on material
from different years (cf. [23]). Finally, the present samples
originate from a total of 160 locations, sampled over a
period of four months, a design that largely prevents domi-
nance of local or single effects. All this suggests that the
snapshot view of the present study is not an exception.
Disruptive ecological selection has been identified as a
causal root of population divergence also in other lake
fishes, including, for example, species pairs of sticklebacks
or coregonids, diverging in ecomorphological traits along
the benthic–limnetic axis [8,49,72,73]. In contrast with the
comparatively frequent examples for bimodal population
divergence, the importance of disruptive ecological selection
in complex species flock formation has only rarely been
demonstrated [17,68]. Among the available examples are
two bird radiations, Geospiza finches and Loxia crossbills,
where disruptive selection acts on beak size [14,15]. In
fishes, the adaptive landscapes of the Cyprinodon pupfish
radiation [17] show patterns similar to those detected in the
sharpfin radiation, though landscape topographies are more
complex in sharpfins. This complexity largely fits the pres-
ence of five phenotypic groups in sharpfins, compared with
only two ecological specialists and one generalist in the
pupfish example [17,18].
The natural occurrence of interbreeding between sailfin
morphospecies, largely separated by divergent ecologi-
cal selection, provides a plausible explanation for both the
complex adaptive landscapes and the porous popula-
tion boundaries observed. Substantial but incomplete
rspb.royalsocietypublishing.orgProc.R.Soc.B
283:20152342
8
on January 13, 2016http://rspb.royalsocietypublishing.org/Downloaded from
reproductive isolation in the sharpfin flock is apparent from
the weak, but significant population genetic structure (elec-
tronic supplementary material, table S2). Assortative mating
has been reported from most of Lake Matano’s Telmatherinaspecies, including three of the five sharpfins (T. sarasinorum,
T. wahjui, T. sp. ‘thicklip’; see [21,22,27,24]). Together with
significant differences in habitat use (figure 1; electronic
supplementary material, figure S3), genetic population
structure and assortative mating provide strong arguments
to reject the hypothesis of only one hypervariable species,
and are in agreement with very similar patterns reported
from its sister clade, Lake Matano’s ‘roundfins’ [25]. In both
Telmatherina clades, roundfins and sharpfins [24], divergence
apparently follows ecological selection pressure under
sympatric conditions, leading to the consensus view that
the ‘Matano flock’ probably represents an early stage of
adaptive radiation [1,2,5].
However, evidence for early stages of species flock for-
mation appears surprising in the light of recent estimations
for the age of divergence in sailfin silversides. Stelbrink
et al. [28] applied different molecular clock approaches, and
argued that the initial divergence of Telmatherina within
Lake Matano, leading to the formation of sharpfins and
roundfins, dates back approx. 1.9 Myr. This is in general
agreement with the estimated geological age of the lake
[20], and implies ages of approx. 1 Myr for the onset of
divergence within both sharpfins and roundfins [28].
Three potential explanations for resolving this conflict
appear moderately plausible. First, environmental instabil-
ities may repeatedly shift the balance between disruptive
selection and homogenizing gene flow, and may even lead
to a breakdown of the barriers to gene flow and the reamal-
gamation of incipient species (e.g. [74,75]). However, we
consider a ‘speciation reversal’ scenario rather unlikely in
the case of extraordinarily deep Lake Matano, which is con-
sidered long-term stable [20,76]. There are so far no
indications for significant earlier disturbances, or increased
turbidity or other changes that might plausibly trigger the
breakdown of reproductive barriers, despite the lake
nowadays being clearly affected by human activities [77].
Second, intralake divergence may have proceeded, for
unknown reasons, generally at rather low speed. This would
be surprising in a species flock characterized by pronounced
sexual and ecological selection pressure [78], and rates of spe-
ciation reported from other fish radiations [79]. As a third
alternative, speciation processes might remain incomplete in
Telmatherina of this lake. This would imply that sharpfins
and roundfins remain in a stage of the speciation continuum
[2,5] where disruptive ecological selection is strong enough
to maintain a stable phenotypic diversity, but fails to complete
the speciation process. Superficially similar cases have been
reported from walking-stick insects or haplochromine cichlids
(reviewed in [67]), but we are not aware of other adaptive radi-
ations where speciation likewise remained incomplete about a
million years after the onset of speciation processes.
Ethics. The study was carried out under research permits from theKementerian Negara Riset dan Teknology (RISTEK), Indonesia(permit no. 992/FRP/SM/V/2010) and in cooperation with theIndonesian Institute of Sciences (LIPI). No endangered or protectedspecies were involved. Fishes were sacrificed with MS-222. All pro-cedures followed the Guidelines for the Use of Fishes in Researchfrom the American Fisheries Society and the legal requirements ofIndonesia and Germany.
Authors’ contributions. J.P. contributed to conception and design of thestudy, performed fieldwork, generated the morphometric andAFLP data, and carried out most of the analyses. U.K.S. contributedto the development of the research idea, and to final stages of manu-script preparation. R.K.H. participated in fieldwork and contributedto the discussion of the results. F.H. conceived, designed and super-vised this project, and contributed to data analyses. J.P. and F.H.wrote the paper.
Competing interests. We declare we have no competing interests.
Funding. This research and fieldwork was funded by a research grantof the DFG (to F.H.: HE 5707/2-1) and strongly benefitted fromprevious fieldwork funded by the DFG (to U.K.S.: DFG SCHL567/2).
Acknowledgements. We thank the Indonesian Institute of Sciences (LIPI)and the Kementerian Negara Riset dan Teknology (RISTEK) for thepermit to conduct research in Indonesia. PT VALE Indonesia Tbkprovided logistic support in Sulawesi. We thank S. Chapuis andM. Milanovic for assistance in the field, and M. Proest, R. Bach andJ. Schmidt for assistance in the laboratory. For valuable discussionsabout previous versions of the manuscript, we thank Bert vanBocxlaer and Leon Hilgers.
References
1. Schluter D. 2000 The ecology of adaptive radiation.Oxford, UK: Oxford University Press.
2. Nosil P. 2012 Ecological speciation. Oxford, UK:Oxford University Press.
3. Dieckmann U, Doebeli M. 1999 On the origin ofspecies by sympatric speciation. Nature 400,354 – 357. (doi:10.1038/22521)
4. Nosil P. 2008 Speciation with gene flow could becommon. Mol. Ecol. 17, 2103 – 2106. (doi:10.1111/j.1365-294X.2008.03715.x)
5. Via S. 2009 Natural selection in actionduring speciation. Proc. Natl Acad. Sci.USA 106, 9939 – 9946. (doi:10.1073/pnas.0901397106)
6. Via S. 2012 Divergence hitchhiking and the spreadof genomic isolation during ecological speciation-with-gene-flow. Phil. Trans. R. Soc. B 367,451 – 460. (doi:10.1098/rstb.2011.0260)
7. Hereford J. 2009 A quantitative survey of localadaptation and fitness trade-offs. Am. Nat. 173,579 – 588. (doi:10.1086/597611)
8. Bolnick DI, Lau OL. 2008 Predictable patterns ofdisruptive selection in stickleback in postglaciallakes. Am. Nat. 172, 1 – 11. (doi:10.1086/587805)
9. Merrill RM, Wallbank RW, Bull V, Salazar PC, MalletJ, Stevens M, Jiggins CD. 2012 Disruptive ecologicalselection on a mating cue. Proc. R. Soc. B 279,4907 – 4913. (doi:10.1098/rspb.2012.1968)
10. Hendry AP, Huber SK, De Leon LF, Herrel A, Podos J.2009 Disruptive selection in a bimodal populationof Darwin’s finches. Proc. R. Soc. B 276, 753 – 759.(doi:10.1098/rspb.2008.1321)
11. Arnold SJ, Pfrender ME, Jones AG. 2001 Theadaptive landscape as a conceptual bridge betweenmicro-and macroevolution. Genetica 112, 9 – 32.(doi:10.1023/A:1013373907708)
12. Simpson GG. 1944 Tempo and mode in evolution.New York, NY: ColumbiaUniversity Press.
13. Svensson E, Calsbeek R. 2012 The adaptivelandscape in evolutionary biology. Oxford, UK:Oxford University Press.
14. Schluter D, Grant PR. 1984 Determinants ofmorphological patterns in communities of Darwin’sfinches. Am. Nat. 123, 175 – 196. (doi:10.1086/284196)
15. Benkman CW. 2003 Divergent selection drives theadaptive radiation of crossbills. Evolution 57, 1176 –1181. (doi:10.1111/j.0014-3820.2003.tb00326.x)
16. Phillips PC, Arnold SJ. 1989 Visualizing multivariateselection. Evolution 43, 1209 – 1222. (doi:10.2307/2409357)
17. Martin CH, Wainwright PC. 2013 Multiple fitnesspeaks on the adaptive landscape drive adaptiveradiation in the wild. Science 339, 208 – 211.(doi:10.1126/science.1227710)
rspb.royalsocietypublishing.orgProc.R.Soc.B
283:20152342
9
on January 13, 2016http://rspb.royalsocietypublishing.org/Downloaded from
18. Turner BJ, Duvernell DD, Bunt TH, Barton MG. 2008Reproductive isolation among endemicpupfishes (Cyprinodon) on San Salvador Island,Bahamas: microsatellite evidence. Biol. J. Linn. Soc.95, 566 – 582. (doi:10.1111/j.1095-8312.2008.01079.x)
19. Herder F, Schwarzer J, Pfaender J, Hadiaty RK,Schliewen UK. 2006 Preliminary checklist of sailfinsilversides (Pisces: Telmatherinidae) in the MaliliLakes of Sulawesi (Indonesia), with a synopsis ofsystematics and threats. Verh. Ges. Ichthyol. 5,139 – 163.
20. Vaillant JJ, Haffner GD, Cristescu ME. 2011 Theancient lakes of Indonesia: towards integratedresearch on speciation. Integr. Comp. Biol. 51,634 – 643. (doi:10.1093/icb/icr101)
21. Cerwenka AF, Wedekind JD, Hadiaty RK, SchliewenUK, Herder F. 2012 Alternative egg-feeding tacticsin Telmatherina sarasinorum, a trophic specialist ofLake Matano’s evolving sailfin silversides fishradiation. Hydrobiologia 693, 131 – 139. (doi:10.1007/s10750-012-1099-8)
22. Gray SM, McKinnon JS, Tantu FY, Dill LM. 2008Sneaky egg-eating in Telmatherina sarasinorum,an endemic fish from Sulawesi. J. Fish. Biol. 73,728 – 731. (doi:10.1111/j.1095-8649.2008.01949.x)
23. Pfaender J, Schliewen UK, Herder F. 2010Phenotypic traits meet patterns of resource use inthe radiation of ‘sharpfin’ sailfin silverside fish inLake Matano. Evol. Ecol. 24, 957 – 974. (doi:10.1007/s10682-009-9332-2)
24. Herder F, Nolte AW, Pfaender J, Schwarzer J,Hadiaty RK, Schliewen UK. 2006 Adaptive radiationand hybridization in Wallace’s Dreamponds:evidence from sailfin silversides in the Malili Lakesof Sulawesi. Proc. R. Soc. B 275, 2178 – 2195.(doi:10.1098/rspb.2006.3558)
25. Herder F, Pfaender J, Schliewen UK. 2008 Adaptivesympatric speciation of polychromatic ‘roundfin’sailfin silverside fish in Lake Matano (Sulawesi).Evolution 62, 2178 – 2195. (doi:10.1111/j.1558-5646.2008.00447.x)
26. Schwarzer J, Herder F, Misof B, Hadiaty RK, SchliewenUK. 2008 Gene flow at the margin of Lake Matano’sadaptive sailfin silverside radiation: Telmatherinidae ofRiver Petea in Sulawesi. Hydrobiologia 615, 201– 213.(doi:10.1007/s10750-008-9561-3)
27. Gray SM, McKinnon JS. 2006 A comparativedescription of mating behaviour in the endemictelmatherinid fishes of Sulawesi’s Malili Lakes.Environ. Biol. Fishes 75, 471 – 482. (doi:10.1007/s10641-006-0037-x)
28. Stelbrink B, Stoger I, Hadiaty RK, Schliewen UK,Herder F. 2014 Age estimates for an adaptive lakefish radiation, its mitochondrial introgression, andan unexpected sister group: Sailfin silversides of theMalili Lakes system in Sulawesi. BMC Evol. Biol. 14,94. (doi:10.1186/1471-2148-14-94)
29. Zelditch M, Swiderski D, Sheets DH, Fink W. 2004Geometric morphometrics for biologists: a primer.London, UK: Academic Press.
30. Rohlf FJ. 2006 tpsDig2. See http://tpsdig2.software.informer.com.
31. Hammer Ø, Harper DAT, Ryan PD. 2001 PAST:paleontological statistics software package foreducation and data analysis. Palaeontol. Electron. 4, 9.
32. Rasband WS. 1997 – 2009 ImageJ. See http://rsb.info.nih.gov/ij/.
33. Ginter CC, DeWitt TJ, Fish FE, Marshall CD. 2012Fused traditional and geometric morphometricsdemonstrate pinniped whisker diversity. PLoS ONE7, 1 – 10. (doi:10.1371/journal.pone.0034481)
34. Jombart T. 2008 adegenet: a R package forthe multivariate analysis of genetic markers.Bioinformatics 24, 1403 – 1405. (doi:10.1093/bioinformatics/btn129)
35. R Development Core Team. 2012 A language andenvironment for statistical computing. Vienna,Austria: R Foundation for Statistical Computing.
36. Charrad M, Ghazzali N, Boiteau V, Niknafs A. 2014NbClust: an R package for determining the relevantnumber of clusters in a data set. J. Stat. Softw.61, 6.
37. Charrad M, Ghazzali N, Boiteau V, Niknafs A. 2014Package ‘NbClust’. J. Stat. Soft 61, 1 – 36.
38. Pfaender J, Miesen FW, Hadiaty RK, Herder F. 2011Adaptive speciation and sexual dimorphismcontribute to diversity in form and function in theadaptive radiation of Lake Matanos’s sympatricroundfin sailfin silversides. J. Evol. Biol. 24, 2329 –2345. (doi:10.1111/j.1420-9101.2011.02357.x)
39. Dixon P. 2003 VEGAN, a package of R functions forcommunity ecology. J. Veg. Sci. 14, 927 – 930.(doi:10.1111/j.1654-1103.2003.tb02228.x)
40. Vos P et al. 1995 AFLP: a new technique for DNAfingerprinting. Nucleic Acids Res. 23, 4407 – 4414.(doi:10.1093/nar/23.21.4407)
41. Excoffier L, Smouse PE, Quattro JM. 1992 Analysis ofmolecular variance inferred from metric distancesamong DNA haplotypes: application to humanmitochondrial DNA restriction data. Genetics 131,479 – 491.
42. Excoffier LAUR, Lischer HEL. 2010 Arlequin suite ver3.5: a new series of programs to perform populationgenetics analyses under Linux and Windows. Mol.Ecol. Res. 10, 564 – 567. (doi:10.1111/j.1755-0998.2010.02847.x)
43. Joost S, Kalbermatten M, Bonin A. 2008 Spatialanalysis method (SAM): a software tool combiningmolecular and environmental data to identifycandidate loci for selection. Mol. Ecol. Res. 8,957 – 960. (doi:10.1111/j.1755-0998.2008.02162.x)
44. Joost S, Kalbermatten M, Bezault E, Seehausen O.2012 Use of qualitative environmental andphenotypic variables in the context of alleledistribution models: detecting signatures ofselection in the genome of Lake Victoria Cichlids.Methods Mol. Biol. 888, 295 – 314. (doi:10.1007/978-1-61779-870-2_17)
45. Carvajal-Rodriguez A, de Una-Alvarez J, Rolan-Alvarez E. 2009 A new multitest correction (SGoF)that increases its statistical power when increasingthe number of tests. BMC Bioinf. 10, 209. (doi:10.1186/1471-2105-10-209)
46. Shah VB, McRae BH. 2008 Circuitscape: a tool forlandscape ecology. In Proc. of the 7th Python in
Science Conference, pp. 62 – 66. See http://conference.scipy.org/proceedings/scipy2008.
47. Thioulouse J, Chessel D, Doledec S, Olivier JM. 1997ADE-4: a multivariate analysis and graphical displaysoftware. Stat. Comput. 7, 75 – 83. (doi:10.1023/A:1018513530268)
48. Bolger T, Connolly PL. 1989 The selection of suitableindices for the measurement and analysis of fishcondition. J. Fish Biol. 34, 171 – 182. (doi:10.1111/j.1095-8649.1989.tb03300.x)
49. Bolnick DI. 2004 Can intraspecific competition drivedisruptive selection? An experimental test in naturalpopulations of sticklebacks. Evolution 58, 608 – 618.(doi:10.1111/j.0014-3820.2004.tb01683.x)
50. Sheridan MA. 1988 Lipid dynamics in fish: aspectsof absorption, transportation, deposition andmobilization. Comp. Biochem. Physiol. B 90,679 – 690. (doi:10.1016/0305-0491(88)90322-7)
51. Chellappa S, Huntingford FA, Strang RHC, ThomsonRY. 1995 Condition factor and hepatosomatic indexas estimates of energy status in male three-spinedstickleback. J. Fish. Biol. 47, 775 – 787. (doi:10.1111/j.1095-8649.1995.tb06002.x)
52. Koops MA, Hutchings JA, McIntyre TM. 2004 Testinghypotheses about fecundity, body size and maternalcondition in fishes. Fish Fish. 5, 120 – 130. (doi:10.1111/j.1467-2979.2004.00149.x)
53. Marshall CT, Yaragina NA, Lambert Y, Kjesbu OS.1999 Total lipid energy as a proxy for total eggproduction by fish stocks. Nature 402, 288 – 290.(doi:10.1038/46272)
54. Blukacz EA et al. 2010 Linking lake whitefish(Coregonus clupeaformis) condition with malegamete quality and quantity. J. Gt Lakes Res. 36,78 – 83. (doi:10.1016/j.jglr.2009.12.014)
55. Burness G, Schulte-Hostedde AI, Montgomerie R.2008 Body condition influences sperm energeticsin lake whitefish (Coregonus clupeaformis).Can. J. Fish. Aquat. Sci. 65, 615 – 620. (doi:10.1139/f07-188)
56. Ratz HJ, Lloret J. 2003 Variation in fish conditionbetween Atlantic cod (Gadus morhua) stocks, theeffect on their productivity and managementimplications. Fish. Res. 60, 369 – 380. (doi:10.1016/S0165-7836(02)00132-7)
57. Wood S. 2006 Generalized additive models: anintroduction with R. Boca Raton, FL: Chapman &Hall/CRC.
58. Wood SN. 2004 Stable and efficient multiplesmoothing parameter estimation for generalizedadditive models. J. Am. Stat. Assoc. 99, 673 – 686.(doi:10.1198/016214504000000980)
59. Fields development team. 2006 Fields: tools forspatial data. Boulder, CO: National Center forAtmospheric Research.
60. Hijmans RJ, Etten J. 2011 raster: geographic analysisand modeling with raster data. R package v. 1.8-39.See https://cran.r-rpoject.org/web/packages/raster/raster.pdf.
61. Albertson RC. 2008 Morphological divergencepredicts habitat partitioning in a Lake Malawicichlid species complex. Copeia 3, 689 – 698.(doi:10.1643/CG-07-217)
rspb.royalsocietypublishing.orgProc.R.Soc.B
283:20152342
10
on January 13, 2016http://rspb.royalsocietypublishing.org/Downloaded from
62. Wainwright PC, Richard BA. 1995 Predictingpatterns of prey use from morphology of fishes.Environ. Biol. Fishes 44, 97 – 113. (doi:10.1007/BF00005909)
63. Webb PW. 1984 Body form, locomotion andforaging in aquatic vertebrates. Am. Zool. 24,107 – 120. (doi:10.1093/icb/24.1.107)
64. Kottelat M. 1991 Sailfin silversides (Pisces:Telmatherinidae) of Lake Matano, Sulawesi,Indonesia, with descriptions of six new species.Ichthyol. Explor. Freshw. 1, 321 – 344.
65. Schluter D. 2009 Evidence for ecological speciationand its alternative. Science 323, 737 – 741. (doi:10.1126/science.1160006)
66. Amundsen P-A, Bøhn T, Vaga G. 2004 Gill rakermorphology and feeding ecology of two sympatricmorphs of European whitefish (Coregonuslavaretus). Ann. Zool. Fenn. 41, 291 – 300.
67. Nosil P, Harmon LJ, Seehausen O. 2009 Ecologicalexplanations for (incomplete) speciation. Trends Ecol.Evol. 24, 145 – 156. (doi:10.1016/j.tree.2008.10.011)
68. Wu CI. 2001 The genetic view of the process ofspeciation. J. Evol. Biol. 14, 851 – 865. (doi:10.1046/j.1420-9101.2001.00335.x)
69. Seehausen O. 2004 Hybridization and adaptiveradiation. Trends Ecol. Evol. 19, 198 – 207. (doi:10.1016/j.tree.2004.01.003)
70. Feder JL, Egan SP, Nosil P. 2012 The genomicsof speciation-with-gene-flow. Trends Genet. 28,342 – 350. (doi:10.1016/j.tig.2012.03.009)
71. Bolnick DI, Araujo MS. 2011 Partitioning therelative fitness effects of diet and trophicmorphology in the threespine stickleback. Evol.Ecol. Res. 13, 439 – 459.
72. Roesch C, Lundsgaard-Hansen B, Vonlanthen P,Taverna A, Seehausen O. 2013 Experimentalevidence for trait utility of gill raker numberin adaptive radiation of a north temperate fish.J. Evol. Biol. 26, 1578 – 1587. (doi:10.1111/jeb.12166)
73. Ohlberger J, Brannstrom A, Dieckmann U. 2013Adaptive phenotypic diversification along atemperature-depth gradient. Am. Nat. 182,359 – 373. (doi:10.1086/671169)
74. Bhat S et al. 2014 Speciation reversal in Europeanwhitefish (Coregonus lavaretus (L.)) caused bycompetitor invasion. PLoS ONE 9, e91208. (doi:10.1371/journal.pone.0091208)
75. Hudson AG, Vonlanthen P, Bezault E, Seehausen O.2013 Genomic signatures of relaxed disruptiveselection associated with speciation reversal inwhitefish. BMC Evol. Biol. 13, 108. (doi:10.1186/1471-2148-13-108)
76. Hamilton WB. 1979 Tectonics of the Indonesianregion. Washington, DC: US Govt. Print. Off.
77. Herder F, Schliewen UK, Geiger MF, Hadiaty RK, GraySM, McKinnon JS, Walter RP, Pfaender J. 2012 Alieninvasion in Wallace’s dreamponds: records of thehybridogenic ‘flowerhorn’ cichlid in Lake Matano,with an annotated checklist of fish speciesintroduced to the Malili Lakes system in Sulawesi.Aquat. Invasions 7, 521 – 535. (doi:10.3391/ai.2012.7.4.009)
78. Herder F, Schliewen UK. 2010 Beyond sympatricspeciation: radiation of sailfin silverside fishes in theMalili Lakes (Sulawesi). In Evolution in action (ed. MGlaubrecht), pp. 465 – 483. Berlin, Germany:Springer.
79. Day JJ, Cotton JA, Barraclough TG. 2008 Tempo andmode of diversification of Lake Tanganyika cichlidfishes. PLoS ONE 3, e1730. (doi:10.1371/journal.pone.0001730)