Embed Size (px)
Citation preview
Rupee Prices in India, 1898-1901Author(s): Fred J. AtkinsonSource: Journal of the Royal Statistical Society, Vol. 66, No. 1 (Mar., 1903), pp. 103-118Published by: Wiley for the Royal Statistical SocietyStable URL: http://www.jstor.org/stable/2339482 .
Accessed: 24/06/2014 23:39
Your use of the JSTOR archive indicates your acceptance of the Terms & Conditions of Use, available at .http://www.jstor.org/page/info/about/policies/terms.jsp
.JSTOR is a not-for-profit service that helps scholars, researchers, and students discover, use, and build upon a wide range ofcontent in a trusted digital archive. We use information technology and tools to increase productivity and facilitate new formsof scholarship. For more information about JSTOR, please contact [email protected].
.
Wiley and Royal Statistical Society are collaborating with JSTOR to digitize, preserve and extend access toJournal of the Royal Statistical Society.
http://www.jstor.org
This content downloaded from 195.34.79.192 on Tue, 24 Jun 2014 23:39:06 PMAll use subject to JSTOR Terms and Conditions
1903.] f 103
III.-Rupee Prices in India, 1898-1901. By FRED. J. ATKINSON.
CONTENTS: PAGE I PAGB
1. Introductory ................ , 103 TABLES. 2. Method of Construction of 1. Rupee Prices in India. 1871
Tables .103 = IOO ............. ......... 104 3. Remarks on Method of Con- 2. Rupee Prices in India. 1868 76
struction of Table 1 ............ 104 = IO .105 4. Basis on which Revised Rupee 3. Monthly Rupee Prices
Prices Prepared . 104 1891.1901 .6...... 10 5. The Monthly Course of Rupee 4. Rainfall in India. 1861-95
Prices .106 = I OO ...................... 107 6. The Rainfall in India ............ 106
5. Rupee Circalation, 1876-92 .... 110 7. The Course of Rupee Prices, 1898.1901 .107 6. Rupee Circulation, 1893-1900 112
8. TheRupee Circulation of India 109 7. Absorption of Gold and Silver 9. The Absorption of Gold and by India, 1801-1900 ............ 116
Silver by India ......... 115 8. Value and Volume of Exports 10. Value nind Volume of Exports and Imports of Mlerchandise,
and Imports of Merchandise 118 1871-1900 ...1.... 17
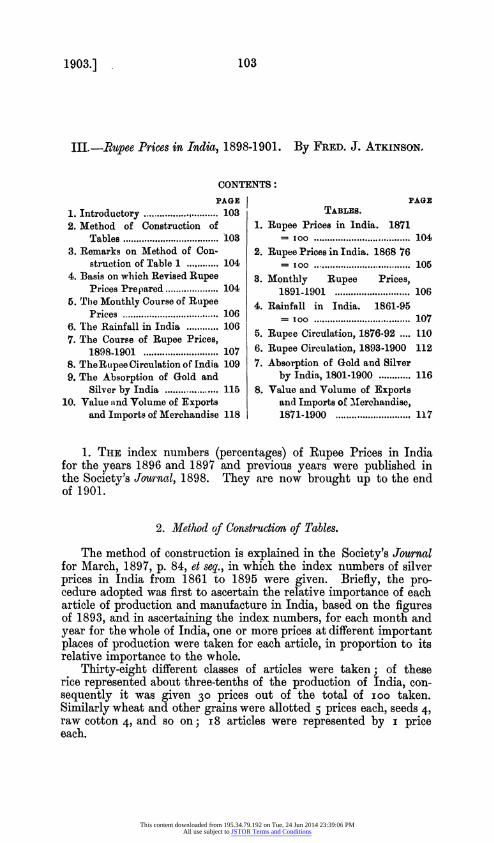
1. THE index numbers (percentages) of Rupee Prices in India for the years 1896 and 1897 and previous years were published in the Society's Journal, 1898. They are now brought up to the end of 1901.
2. Method of Construction of Tables.
The method of construction is explained in the Society's Journal for March, 1897, p. 84, et seq., in which the index numbers of silver prices in India from 1861 to 1895 were given. Briefly, the pro- cedure adopted was first to ascertain the relative importance of each article of production and manufacture in India, based on the figures of 1893, and in ascertaining the index numbers, for each month and year for the whole of India, one or more prices at different important places of production were taken for each article, in proportion to its relative importance to the whole.
Thirty-eight different classes of articles were taken; of these rice represented about three-tenths of the production of India, con- sequently it was given 30 prices out of the total of ioo taken. Similarly wheat and other grains were allotted 5 prices each, seeds 4, raw cotton 4, and so on; i8 articles were represented by i price each.
This content downloaded from 195.34.79.192 on Tue, 24 Jun 2014 23:39:06 PMAll use subject to JSTOR Terms and Conditions
104 Miscellanea. [Mar.
TABLE 1.-1871 = Joo.
1 2 3 4 5 6 7 8
Inidex Number (Pereentages) of Rupee Prices. Gold Price. _________ ~~~~~Scuerbeck's SilverGodPie
Year. lGold Price 6ie Gold. Pie Froodr Raw Manufactures, All Prices, Goldice per oz. Rupee. oo, Produce, Commodities.peoz
6o Items. 29 Iteills. II Articles. xoo Items. = 100.
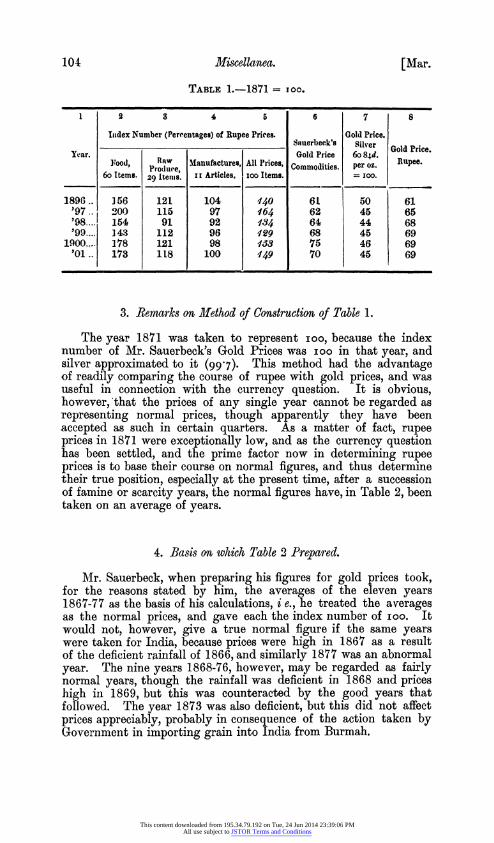
1896.. ]56 121 104 140 61 50 61 '97 .. "0') 115 97 164 62 45 65 '98.... 154 91 92 134 64 44 68 '99.... 143 112 96 129 68 45 69
1900.... 178 121 98 153 '75 46 69 '01.. 173 118 100 149 70 45 69
3. Remxtrks on illethod of Construction of Table 1.
The year 1871 was taken to represent IOO, because the index number of Mr. Sauerbeck's Gold Prices was IOO in that year, and silver approximated to it (99 7). This method had the advantage of readily comparing the course of rupee with gold prices, and was useful in connection with the currency question. It is obvious, however, that the prices of any single year cannot be regarded as representing normal prices, though apparently they have been accepted as such in certain quarters. As a matter of fact, rupee prices in 1871 were exceptionally low, and as the currency question has been settled, and the prime factor now in determining rupee prices is to base their course on normal figures, and thus determine their true position, especially at the present time, after a succession of famine or scarcity years, the normal figures have, in Table 2, been taken on an average of years.
4. Basis on which Table 2 Prepared.
AMr. Sauerbeck, when preparing his figures for gold prices took, for the reasons stated by him, the averages of the eleven years 1867-77 as the basis of his calculations, i e., he treated the averages as the normal prices, and gave each the index number of ioo. It would not, however, give a true normal figure if the same years were taken for India, because prices were high in 1867 as a result of the deficient rainfall of 1866, and similarly 1877 was an abnormal year. The nine years 1868-76, however, may be regarded as fairly normal years, though the rainfall was deficient in 1868 and prices high in 1869, but this was counteracted by the good years that followed. The year 1873 was also deficient, but this did not affect prices appreciably, probably in consequence of the action taken by Government in importing grain into India from Burmah.
This content downloaded from 195.34.79.192 on Tue, 24 Jun 2014 23:39:06 PMAll use subject to JSTOR Terms and Conditions
1903.] Ptupee Prices in India, 1898-1901. 105
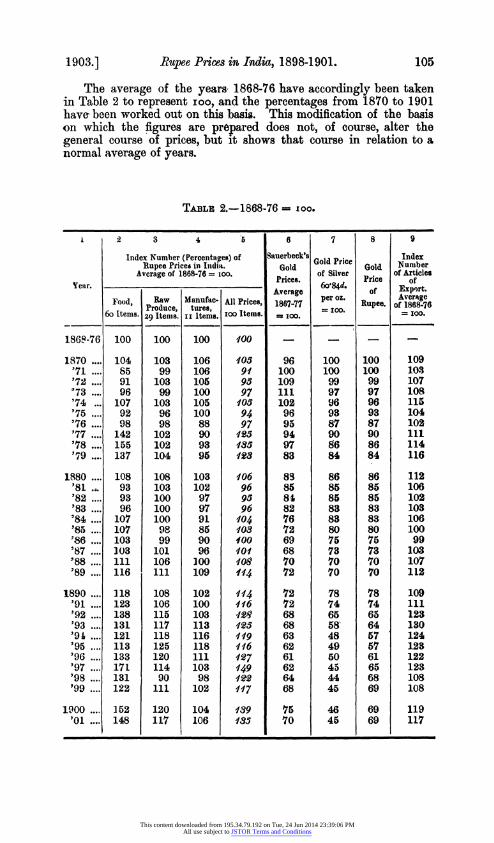
The average of the years 1868-76 have accordingly been taken in Table 2 to represent IOO, and the percentages from 1870 to 1901 have been worked out on this basis. This modification of the basis on which the figures are prepared does not, of course, alter the general course of prices, but it shows that course in relation to a normal average of years.
TABLE 2.-1868-76 = ioo.
l 2 3 4 '5 6 7 8 9
Index Number (Percentages) of Sauerbeck's Gold Price Index Rupee Prices in India. Gold Gold Number
Average of 1868-76 = ioo. of Silver of Articles Yeitr. ~ ~~~~~~~Prices. 684. Price of
Yealr. -Average 6084d. of Export. Food, Raw Manufac- All Prices, 1867-77 eRupee. of 186876
6o ItemIs. r ieItems. Ioo Items. -IO. = I@0.
186S-76 100 100 100 100 - _
1870 .... 104 103 106 105 96 100 100 109 '71 .... 85 99 106 91 100 100 100 103 '72 .... 91 103 105 95 109 99 99 107 973 .... 96 99 100 97 111 97 97 108 '74 ... 107 103 105 105 102 96 96 115 '75.... 92 96 100 94 96 93 93 104 '76.... 98 98 88 97 90 87 87 102 '77.... 142 102 90 12.5 94 90 90 111 '78 ... 155 102 93 135 97 86 86 114 '79 ... 137 104 95 123 83 84 84 116
1880 .... 108 108 103 106 83 86 86 112 '81 . 93 103 102 96 85 85 85 106 '82 .... 93 100 97 95 81 85 85 102 '83 .... 96 100 97 96 82 83 83 103 '84 .... 107 100 91 104 76 83 83 106 '85 .... 107 98 85 103 72 80 80 100 86 .... 103 99 90 0OO 69 75 75 99 '87 .... 103 101 96 101 68 73 73 103 '88 .... 111 106 100 108 70 70 70 107 '89 .... 116 111 109 114 72 70 70 112
1890 .... 118 108 102 114 72 78 78 109 '91 .... 123 106 100 1 16 72 74 74 111 '92 .... 138 115 103 128 68 65 63 123 '93 .... 131 117 113 125 68 58' 64 130 91 .... 121 118 116 119 63 48 67 124 '95 .... 113 125 118 116 62 49 57 123 '96 .... 133 120 111 127 61 50 61 122 '97 .... 171 114 103 149 62 45 65 123 '98 .... 131 90 98 122 64 44 68 108 '99 .... 122 111 102 117 68 45 69 108
1900 ... 152 120 104 139 75 46 69 119 '01 ... 148 117 106 135 70 45 69 117
This content downloaded from 195.34.79.192 on Tue, 24 Jun 2014 23:39:06 PMAll use subject to JSTOR Terms and Conditions
106 Miscellanea. LMar.
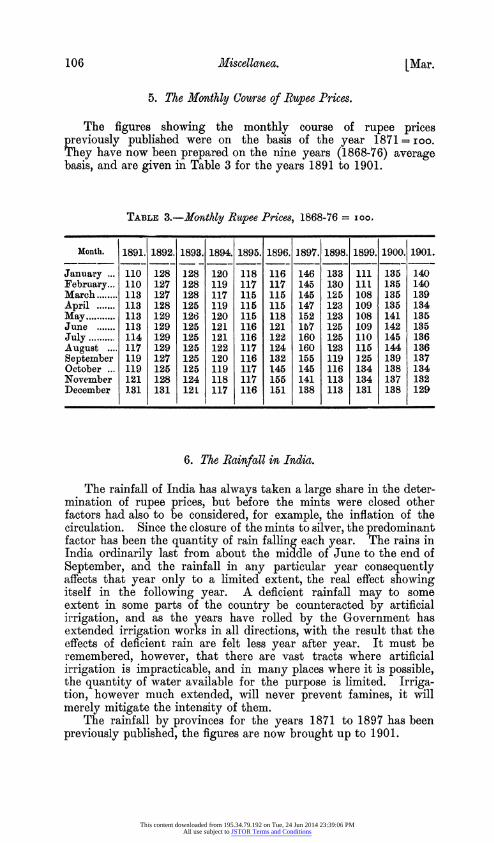
5. The Monthly Course of Ru.pee Prices.
The figures showing the monthly course of rupee prices previously published were on the basis of the year 1871=ioo. They have now been prepared on the nine years (1868-76) average basis, and are given in Table 3 for the years 1891 to 1901.
TABLE 3.-Yonthly Rupee Prices, 1868-76 = Ioo.
Month. 1891. 1892. 1893. 1894. 1895. 1896. 1897. 1898. 1899. 1900. 1901.
January ... 110 128 128 120 118 116 146 133 111 135 140 February ... 110 127 128 119 117 117 145 130 111 135 140 March ........ 113 127 128 117 115 115 145 125 108 135 139 April ....... 113 128 125 119 115 115 147 123 109 135 134 May ........ 113 129 126 120 115 118 152 123 108 141 135 June ....... 113 129 125 121 116 121 1b7 125 109 142 135 July ........ 114 129 125 121 116 122 160 125 110 145 136 August .... 117 129 125 122 117 124 160 123 115 144 136 September 119 127 125 120 116 132 155 119 125 139 137 October ... 119 125 125 119 117 145 145 116 134 138 134 November 121 128 124 118 117 155 141 113 134 137 132 December 131 131 12L 117 116 151 138 113 131 138 129
6. The Rainfall in India.
The rainfall of India has always taken a large share in the deter- mination of rupee prices, but before the mints were closed other factors had also to be considered, for example, the inflation of the circulation. Since the closure of the mints to silver, the predominant factor has been the quantity of rain falling each year. The rains in India ordinarily last from about the middle of June to the end of September, and the rainfall in any particular year consequently affects that year only to a limited extent, the real effect showing itself in the following year. A deficient rainfall may to some extent in some parts of the country be counteracted by artificial irrigation, and as the years have rolled by the Government has extended irrigation works in all directions, with the result that the effects of deficient rain are felt less year after year. It must be remembered, however, that there are vast tracts where artificial irrigation is impracticable, and in many places where it is possible, the quantity of water available for the purpose is limited. Irriga- tion, however much extended, will never prevent famines, it will merely mitigate the intensity of them.
The rainfall by provinces for the years 1871 to 1897 has been previously published, the figures are now brought up to 1901.
This content downloaded from 195.34.79.192 on Tue, 24 Jun 2014 23:39:06 PMAll use subject to JSTOR Terms and Conditions
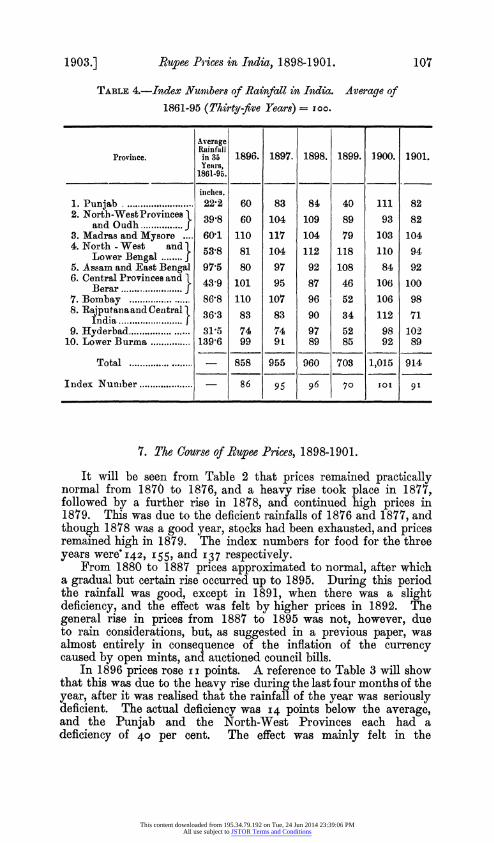
1903.] Rupee Prices in India., 1898-1901. 107
TABLE 4.-Index Numbers of Rainfall in Inidia. Average of 1861-95 (Thirty-five Years) zoo.
Average Rainfall
Provinice. in 35 1896. 1897. 1898. 1899. 1900. 1901. Years, 1861-95.
indiehs. ._... 1. Punjab .................. 22-2 60 83 84 40 111 82 2. North-WestProvinces l 39,8 60 104 109 89 93 82
ancd Oudh ...... j 3. Madras and Mysore .... 60'1 110 117 104 79 103 104 4. ITorth - West and }53 -8 81 104 112 118 110 94
Lower Bengal ..... 5. Assam and East Bengal 97 5 80 97 92 108 84 92
Berar n
43 9 101 95 87 46 106 100 7. Bombay .................. 86'8 110 107 96 52 106 98 8. RajputanaandCenitral } 36 3 83 83 90 34 112 71
Inclia............ 1 9. Hyderbad ................... 31-5 74 74 97 52 98 102
10. Lower Burma ............... 139 6 99 91 89 85 92 89
Total ................... 858 955 960 703 1,015 914
Index Nunmber ...................- 86 95 96 70 101 91
7. The Course of Rupee Prices, 1898-1901.
It will be seen from Table 2 that prices remained practically normal from 1870 to 1876, and a heavy rise took place in 1877, followed by a further rise in 1878, and continued high prices in 1879. This was due to the deficient rainfalls of 1876 and 1877, and though 1878 was a good year, stocks had been exhausted, and prices remained high in 1879. The index numbers for food for the three years were" 142, 155, and 137 respectively.
From 1880 to 1887 prices approximated to normal, after which a gradual but certain rise occurred up to 1895. During this period the rainfall was good, except in 1891, when there was a slight deficiency, and the effect was felt by higher prices in 1892. The general rise in prices from 1887 to 1895 was not, however, due to rain considerations, but, as suggested in a previous paper, was almost entirely in consequence of the inflation of the currency caused by open mints, and auctioned council bills.
In 1896 prices rose i i points. A reference to Table 3 will show that this was due to the heavy rise during the last four months of the year, after it was realised that the rainfall of the year was seriously deficient. The actual deficiency was I4 points below the average, and the Punjab and the North-West Provinces each had a deficiency of 40 per cent. The effect was mainly felt in the
This content downloaded from 195.34.79.192 on Tue, 24 Jun 2014 23:39:06 PMAll use subject to JSTOR Terms and Conditions
108 M1iscellanea. [Mar.
following year, 1897, when the index number for all prices rose 49 points in excess of normal, probably the largest on record, and the rise was in food only, which rosc 7I points, whilst raw produce and manufactures both fell. The year commenced with an index number of I46 and rose to i6o in August and September, after which the average rainfall of the year lowered the figure gradually to I38 in December. The year 1897 was provided with a fair amount of rain, 5 points short, and prices fell to I22 in 1898, only slightly in excess of the average of the years of plenty from 1889 to 1895, though food prices at I31 were considerably in excess. Table 3 shows a gradual monthly decline during the year.
The year 1898 similarly gave an average rainfall 4 points below normal, though the Punjab, as in the previous year, had a serious deficiency. Prices in 1899 fell to II 7, a fall of 5 points as compared with 1898, but it will be noticed from Table 3 that they were lower up to August, 1899, when a considerable rise took place in conse- quence of a short rainfall in the year, the first effect showing itself in August.
The year 1899 experienced the most serious deficiency in rain during the whole period from 1861 to 1901. It was 30 points short of normal, and as Bengal and Assam were both considerably above, the remainder of India suffered heavily. Prices were high through- out 1900, falling somewhat for the last -four months of the year, after good rain had fallen. The index number for 1900 was I39, which is higher than any year since 1861, except 1897, when it was I0 points higher. Food stood at I52, or I9 points lower than in 1897. The deficiency in rain in 1899 largely exceeded that of 1896, and the area affected by actual famine was greater, but whilst the important provinces of Bengal and Assam were considerably affected by short rainfall in 1896, they had ample in 1899, and yielded excellent crops for 1900. In addition to this, Government relief and famine arrangements generally were, probably, improved by the experiences of 1897, and this, no doubt, materially assisted in preventing prices from rising higher.
The year 1900 experienced a normal rainfall, but there were deficiencies in Assam and Eastern Bengal, and in the North-West Provinces and Lower Burmah. Stocks had become exhausted by the famine and scarcity years, and this, assisted by the short rainfall in Assam and Eastern Bengal, caused prices to remain high in 1901, in which the average was I35, being only 4 points lower than the previous year of actual famine. Table 3 shows that prices ranged high during the first months of the year, but gradually fell to I29
by December. A review of the rupee prices ruling each year, combined with
the rainfall of India, would seem to indicate that the normal level of prices is higher now than it was before 1889. Between 1888. and 1893, the year the mints were closed, the active circulation of India increased by 22 crores, equal to an average of 41 crores a year; this inflated the currency, and prices rose, the average of the years 1889 to 1893 being I I9, or I9 points in excess of the average of the years 1868-76. The question therefore arises whether normality has now
This content downloaded from 195.34.79.192 on Tue, 24 Jun 2014 23:39:06 PMAll use subject to JSTOR Terms and Conditions
1903.] Rutpee Prices in India, 1898-1901. 109
adjusted itself to the average of 1868-76 or to that of 1889-93. The years since 1893 have been affected by seriously deficient rain- falls in 1895,1896, and 1899, and small deficiencies in 1897 and 1898, whilst the year 1901, though provided with an average rainfall in 1900, felt the effects of the previous five years of famine or scarcity, and it is not therefore possible to take this period, 1896 to 1901, as. an absolute guide to determine what may now be considered as normal prices. The years 1894 and 1895, however, show the index numbers of II9 and i i6 respectively; in 1894 the circulation was sensibly reduced, from I76 to I69 crores; in 1895 it increased by 3 crores, in which year the exchange rate of the rupee rose slightly, and very considerably in the following year, which would seem to, indicate that the inflation of the currency was disappearing, and normal prices ruling. The years 1898 and 1899 (i.e., the rainfalls of 1897 and 1898) experienced only slight deficiencies in rain, and the index numbers of prices were I22 and II7 respectively, but prices were probably somewhat in excess, as a result of the famine of 1897. Altogether, however, an examination of all the factors in the case leads to the view that the level of normality at the present. time is nearer the average of the seven years 1889 to 1895 = iig than to that of 1868-76 = IOO. If this is the case, the prices of the great famine year of 1900 were only I7 per cent. above normal, and those of 1901, I4 per cent., though in both years food prices. were considerably higher.
8. Thte Rupee Circulation of Indita.
An estimate of the rupee circulation of. India from 1835 to 1895 was prepared and published in the paper on " Silver Prices in India " in the Journal of March, 1897, and the detailed working was given in Tables E and F. The circulation from 1876-77 to 1900-01 has, now been worked out on somewhat different and simpler lines, and with the further information since obtained, the results are probably more accurate. The course of the circulation, in so far as the almost continual increase is shown, does not differ materially from the earlier estimate, but the increase from the year 1885 is niow shown to have been considerably greater than in the former calculation, which further accentuates the theory of a redundant circulation, and consequent fall in the gold value of the rupee. The details are given in Tables 5 and 6, the first dealing with the circulation from 1876-77 to the closing of the Indian mints to silver, and the second from 1893-94 to 1900-01.
This content downloaded from 195.34.79.192 on Tue, 24 Jun 2014 23:39:06 PMAll use subject to JSTOR Terms and Conditions
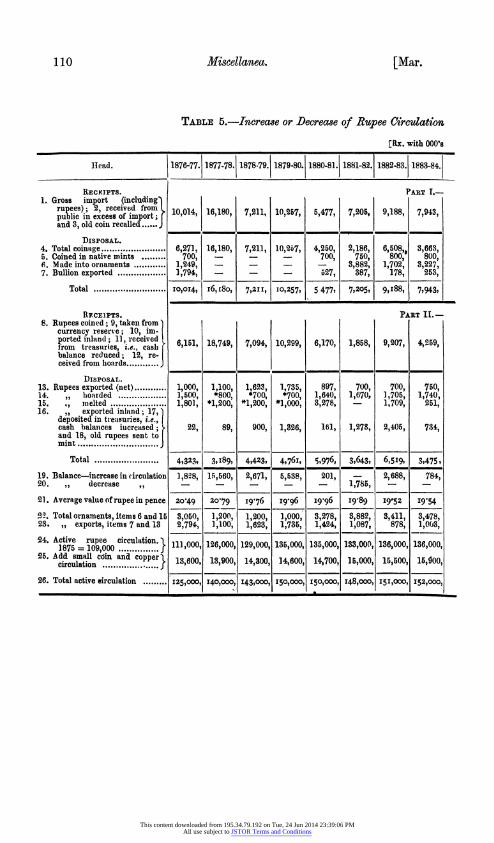
110 Miscellanea. [Mar.
TABLE 5.-Increse or Decrecse of Rupee Circulation
[Rx. with 000's
Ilead. 1876-77. 1877-78. 1878-79. 1879-80. 1880-81.| 1881-82. 1882-83. 1883-84.
RECIeIPTS. PART I.- 1. Gross import (including
rupees); 2, received from - 10,014, 16,180, 7,211, 10,257, 5,477, 7,205, 9,188, 7,943, pubi~c in excess of import; and 3, old coin recalled ......J
DISPOSAL. 4. Total coinage ........................ 6,271, 16,180, 7,211, 10,287, 4,250, 2,186, 6,508,. 3,663, 5. Coined in native mints ......... 700, - - - 700, 70, 800, 800, 6. Made into ornaments ......... ::: 1,249, - - - - 3,882, 1,702, 3,227, 7. Bullion exported ............... 1794, - - - 527, 387, 178, 253,
Total .........................10,014, | x6,180, 7,211, 10,257, 5 477, 7,2O5, 9,188, 7,943,
RF.cEiPTS. PART Il.- 8. Rupees coined; 9, taken from
currency reserve; 10, ini-
prom treasilrie1, i e caslc 6,161, 18,749, 7,094, 10,299, 6,170, 1,858, 9,207, 4,259, balance reduced; 12, re- ceived from lhoards ............
DiSPOSAL. 13. Rupees exported (net) ............ 1,000, 1,100, 1,623, 1,735, 897, 700 700, 750, 14. ,, hoarded .1 500..... 1,500, *800, *700, *700, 1,640, 1,670, 1,705, 1,740, 15. ., melted .1801, ..... *1,200, *1,200, *1,000, 3,278, - 1,709, 251, 16. ,, exported inland; 17,
deposited in treasuries, t.e., cash balanices increased; 22, 89, 900, 1,326, 161, 1,273, 2,405, 734, and 18, old rupees sent to I mint ............ .
Total ............ ... 4,323, 3, I89, 4,423, 4,76I, 5,976, 3,643, 6,519, 3,475 ,
19. Balance-increase in circulation 1,8;28, 15,560, 2,671, 5,538, 201, - 2,688, 784, 20. ,, decrease ,, - - - - - 1,785, - -
21. Average value of rupee in pence ZOA49 20-79 19-76 I9-96 19-96 19 89 19'5Z 19'54
Sa. Total ornaments, items 6 and 15 3,050, 1,200, 1,200, 1,000, 3,278, 3,882, 3,411, 3,478, 23. ,, exports, items 7 and 13 2,794, 1,100, 1,623, 1,735, 1,424, 1,087, 878, 1,003,
1875 = 109,000A...re iu
o. 111,000, 126,000, 129,000, 135,000, 135,000, 133,000, 136,000, 136,000, 25. Add small coin and copperl 13,600, 13,900, 14,300, 14,600, 14,700, 1,o000, 15,500, 15, 00, circulation . ...........
26. Total active sirculation......I25,000, 140,000, 143,000, 150,000, 150,000, 148,000, 151,000, 152,000,
This content downloaded from 195.34.79.192 on Tue, 24 Jun 2014 23:39:06 PMAll use subject to JSTOR Terms and Conditions
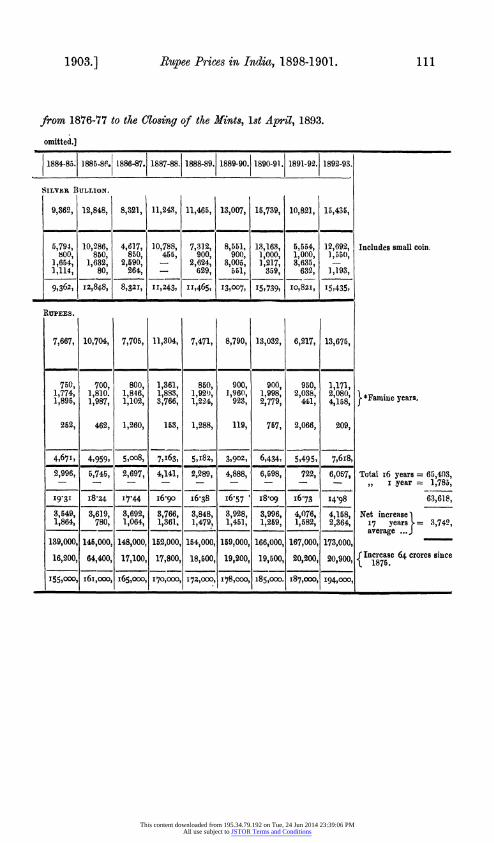
1903.] Rupee Prices in India, 1898-1901. 111
from 1876-77 to the Closing of the Mints, 1st April, 1893.
omitted.]
1881-85; 1885-8F.1 1886-87. 1887-88. 1888-89. 1889-90. 1890-91. 1891-92. 1892-93.
SiLVER BULLION.
9,362, 12,848, 8,323, 11,243, 11,465, 13,007, 15,739, 10,821, 15,435,
5,794, 10,286, 4,617, 10,788, 7,312, 8,551, 13,163, 5,554, 12,692, Includes small coin. 0oo, 850, 850, 455, 900, 900, 3,000, 1,000, 1,55(,
1,654, 1,632, 2,590, - 2,624, 3,005, 1,217, 3,635, - 1,114, 80, 264, - 629, 581, 359, 632, 1,193,
9,362, IZ,848, 8,321, I 1,243, 11,465, 13,007, 15,739, Io,821, I5,435,
RUPEES.
7,667, 10,704, 7,705, 11,304, 7,471, 8,790, 13,032, 6,217, 13,675,
750, 700, 800, 1,361, 850, 900, 900, 950, 1,171, 1,774, 1,810. 1,846, 1,883, 1,920), 1,960, 1,998, 2,038, 2,080, ] 1,895, 1,987, 1,102, 3,766, 1,224, 923, 2,779, 441, 4,158, *Famine years.
252, 462, 1,260, 153, 1,288, 119, 757, 2,066, 209,
4,67I, 4,959, 5,008, 7,I63, 5,182, 3,902, 6,434, 5,495, 7,6I8,
2,996, 5,745, 2,697, 4,141, 2,289, 4,888, 6,598, 722, 6,057, Total 16 years = 65,403, _ - _ - ,, - -I year = 3,785,
19.31 18-Z4 17.44 I6-90 I6 38 I6.57 I8-o9 I6.73 I4.98 63,618,
3,549, 3,619, 3,692, 3 766, 3,848, 3,928, 3,996, 4,076, 4,158, Net increase 1,864, 780. 1,064, 1,361, 1,479, 1,451, 1,259, 1,582, 2,364, 17 years = 3,742,
-- _____ average ...J 139,000, 145,000, 148,000, 152,000, 154,000, 159,000, 166,000, 167,000, 173,000,
16,200, 64,400, 17,100, 17,800, 18,500, 19,200, 19,500, 20,200 20,900, {Increase 64 crores since
155,000, 6i,ooo, 7,000, 178,co0, 185,000. 187,000, 194,000,
This content downloaded from 195.34.79.192 on Tue, 24 Jun 2014 23:39:06 PMAll use subject to JSTOR Terms and Conditions
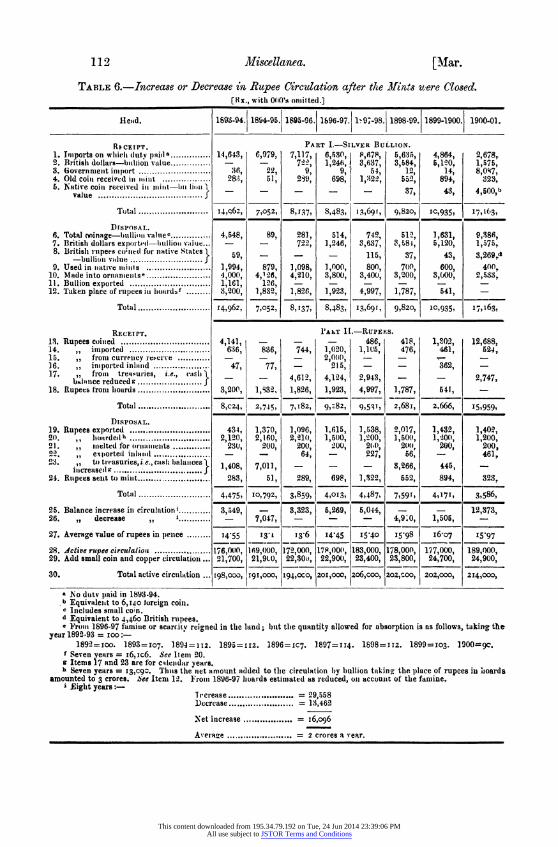
112 Maiscellanea. [Mar.
TABLE 6.-Increase or Decrease ini Rupee Circulation after the Mlints were Closed. [IKx., witli O11's oniittedl.]
Head. 1893-94. 18.4-95. 1895-96. 1896-97. 1-97-98. 1898-99. 1899-1900. 1900-01.
RI cFrr. PART I.-SILVER BULLION. 1. Imports on wlii d(lUtV pai,1a ...............id 14,643, 6,979, 7,117, 6,530, F,678, 5,6:35, 4,864, 2,678, 2. Britiah dollais-h ilfion value -............... _ 722, 1,246, 3,637, 3,584, 5,120. 1,575, 3. Governmenit inmPort ......................... 36, 22, 9, 9 54, 12, 14, 8,047, 4. Old coiin received iii mint.28:3, 51, 229, 698, 1,322, 552, 894, 32a, 5. Native coiil received in immint-him limi I - - - - 37, 43, 4,500,b
value.................... f Total .. . .. 14,q62, 7,052, 8, 137, 8,483, 13,691, 9,820, IC,935, 17,1(3,
DrSPOSAL. 6. Total mYinage-ulflimi valitec ............... 4,548, 89, 281, 514, 742, 512, 1,631, 9,386, 7. British dollais exportvdl-biiillioai value... - - 722, 1,246, 3,637, 3,581, 5,120, 1,575, 8. British rolpees co;ned for niative Statest t 9, _ _ 115, 37l 43, 3,269 d
-bullioni value...........1.5,.37,.43,.3,269," 9. Used in iiative iiiiis . . 1,994, 879, 1,098, 1,000, 800, 7(10, 600, 400,
10. Made into ornanneiltse . ...................... 4,000, 4,126, 4,210, 3,800, 3,400, 3,200, 3,000, 2,533, 11. Bullion exported .........1.............. I161, 126, - - - - - 12. Taken place of rupees in liourdadf ......... 3,200, 1,832, 1,826, 1,923, 4,997, 1,787, 541, -
Total ....................... 14,962, 7,052, 8,137, 8,483, 13,691, 9,820, 10,935, 1 7,163,
RECEIPT. PA6T I1.-RUPEI:S. 13. Rupees coinied ....................... 4,141 - - - 486, 418, 1,302, 12,688, 14. ,, inported .................. ..636, 836, 744, 1,020, 1,1v5, 476, 461, 524, 15. ,, frons currency reVe,rve _ -.. 2,0(.(., - _ -
16. ,, inported inland .................... 47, 77, - 215, - - 362, -
lice reducede } _ _ 4,612, 4,124, 2,943, - - 2,747, bhn c re ucd. ........................ 18. Rupees from loards ....................... 3,2,00 1, 32, 1,826, 1,923, 4,997, 1,787, 641, -
Total ....................... 8,C24, 2,745, 7,182, 9,:82, 9,531T 2,681, 2,666, I5,959,
DISPOSAL. 19. Rupees exported ............ . ............ 434. 1,370, 1,096, 1,615, 1,538, 2,017, 1,432, 1,402, 2(0. ,, lhoarded h ...... . 2,120, 2,160, 2,2111, 1,5(10, 1,200, 1,50(1, 1,20(1, 1,200, 21 ,, inielted for ornaments ..... 230, 200, 200, 2;00, 21,(> 20(1, 200, 200, 22. ,, exorted inlaid, , - 64, - 227, 56, - 461, 23. ,, to teasuries, i.e.,;lash I alaices 1,408, 7,011, - - - 3,266, 445, -
iuereatse . 24. Rnpees sent to nlillt ....................... 83, 51, 289, 698, 1,322, 552, 894, 323,
Totail ... ........... 4,475, IO,792, 3,859, 4,013, 4,487, 7,59T, 4,171, 3,586,
25. Balance increase in circu!ation ............ 3,549, - 3,323, 6,269, 5,044, - 12,373, 26. ,, decrease I............ - 7,047, - - - 4,9;0, 1,506, -
27. Average Talue of rupees in penlce . 1455 .3-1 ..6 14-4 540 15.98 I607 I5-97
28. dctive rupee circulatioat .....................176,0110, 169,000, 172,000, 171P,000, 183,000, 178,000, 177,000, 189,000, 29. Add small coin anid copper circulation ... 21,700, 21,9(0, 22,30uJ, 22,900, 23,400, 23,800, 24,700, 24,900,
30. Total active circulattion ... I98,000, 191,000, 194,0co, 201,000, 206,COO, 202,o00, 202,000, 214,000,
a No duttv paid in 1893.94. b Equivalent to 6,140 loreign coini. I Includes small coin. D d Equivalent to 4,460 British ruipees. e 18ro29 1896-97 fanii.e or scarcity reigned in the land; 1)1ut tIme quantity allowed for absorption is as follows, taking the
year 1892-93 = IOO: 1892=IOO. 1893=IO7. 1894=112. 1895=112. 1896=1C7. 1897=114. 1898=II2. 1899=IO3. 1900=90.
f Seven years = i6,ic6. See Itenm 20. g Items 17 and 23 are for calelindar years. h Seven years = I3,C92. Thuls the iiet ilnloint 7ldded to tlie circulation by bmullion taking the place of rupees iu nioards
amounted to 3 crores. See Item 12. F'roimi 1896-97 lhoards estimiiated as r educed, oni accounit of the famiiine. i ight years:-
Trcrease ....... = 29,558 Decrease ....... = 13,462
Net inicrease .... ... = 16,o96
Avernaie ... .... = 2 crores a v-ear.
This content downloaded from 195.34.79.192 on Tue, 24 Jun 2014 23:39:06 PMAll use subject to JSTOR Terms and Conditions
1903.] 1X lpe. Pr ic3s in India, 1898-1901. 113
Both tabl3s are dividedl into two parts (1) silver bullion, and (2) Tup3s. The following explains th- method adopt3d in working them out.
Table 5.
Bullion.-The thre3 receipt heads are taken from the official sthtistics.
Under disposal the coinag,3 is takan from the official statistics. The amount coined in Native States is estimated up to 1890, but the figures entered are probably in excess of the actuals. The figures for 1891 and 1892 are actuals.
The balance of the bullion received not disposed of under heads 4 and 5 has to be accounted for under ornaments and bullion exported. It is not verv material against which head this balance is adjusted, because a certain figure has to be worked up to for each, annually, made up of bullion and rupees, and if a larger amount of bullion is taken against either head the fewer the rupees that will be r.equired, whilst less bullion and more rupees will be required for the other.
Taking the head of ornaments first, it is a self-evident fact that as the population and wealth of India increase, so the amount used in the arts must necessarily similarly increase. It does not follow that this increase was in exact arithmetic progression, or that it was in exact accordance with the increase in the. wealth of the country, but the safest and only guide is to base the increase on these lines. The population of India increased at this period at the rate of about i per cent. a year, so it may be assumed that the amount used in the arts increased in the same proportion at the lowest estimate. But it is necessary to consider also the increase in the wealth of the country. In the paper "A Statistical Review of the Income and Wealth of British India, 1875 and 1895," published in the Society's Joarnal for March, 1902, a balance sheet of British India showed that the wealth of the country increased between the two years at an average rate of about 2 per cent. a year; it may therefore be accepted that the average increase in the demand for silver for the arts approximated that percentage. On this basis Item 22 in the table has been prepared, the first year commencing with the high figure of 3 crores. The years 1877, 1878 and 1879 were years of famine, and quantities of ornaments were melted down, as proved by the fact that between 2 and 3 crores of rupees value ,of silver were takeni to the mint in excess of the net imports, the figure allotted for new ornaments has accordingly been reduced. In the remaining years of the period 2 per cent. increase has been .allowed annuially, and the totals of Items 6 and 15, bullion and rupees, respectively, converted into ornaments are shown hs Item 22.
The total of bullion and rupees exported each year is recorded in the official statistics and is given in Item 23, the details being given in Items 7 and 13.
It will be noticed that no bullion is shown as having been coined in the native mints, coiivered into ornamenits, or exported in the
VOL. LXYI. PART I. I
This content downloaded from 195.34.79.192 on Tue, 24 Jun 2014 23:39:06 PMAll use subject to JSTOR Terms and Conditions
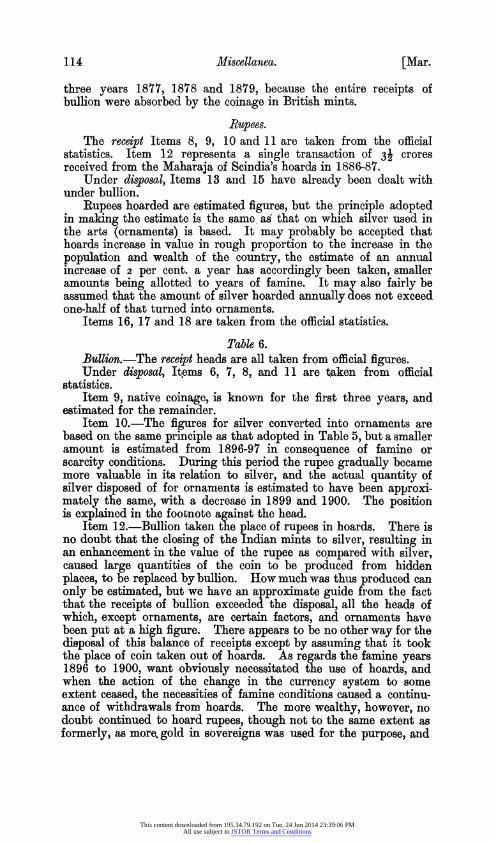
114 Miscellanea. [Mar.
three years 1877, 1878 and 1879, because the enitire receipts of bullion were absorbed by the coinage in British mints.
Rupees. The receipt Items 8, 9, 10 and 11 are taken from the official
statistics. Item 12 represents a single transaction of 3i crores received from the Maharaja of Scindia's hoards in 1886-87.
Under disposal, Items 13 aind 15 have already been dealt with under bullion.
Rupees hoarded are estimated figures, but the principle adopted in making the estimate is the same as that on which silver used in the arts (ornaments) is based. It may -probably be accepted that hoards increase in value in rough proportion to the increase in the population and wealth of the country, the estimate of an annual increase of 2 per cent. a year has accordingly been taken, smaller amounts being allotted to years of famine. It may also fairly be assumed that the amount of silver hoarded annually does not exceed one-half of that turned into ornaments.
Items 16, 17 and 18 are taken from the official statistics.
Table 6. Bullion.-The receipt heads are all taken from official figures. Under disposal, Items 6, 7, 8, and 11 are taken from official
statistics. Item 9, native coinage, is known for the first three years, and
estimated for the remainder. Item 10.-The figures for silver converted into ornaments are
based on the same principle as that adopted in Table 5, but a smaller amount is estimated from 1896-97 in consequence of famine or scarcity conditions. During this period the rupee gradually became more valuable in its relation to silver, and the actual quantity of silver disposed of for ornaments is estimated to have been approxi- mately the same, with a decrease in 1899 and 1900. The position is explained in the footnote against the head.
Item 12.-Bullion taken the place of rupees in hoards. There is no doubt that the closing of the Indian mints to silver, resulting in an enhancement in the value of the rupee as compared with silver, caused large quantities of the coin to be produced from hidden places, to be replaced by bullion. How much was thus produced can only be estimated, but we have an approximate guide from the fact that the receipts of bullion exceeded the disposal, all the heads of which, except ornaments, are certain factors, and ornaments have been put at a high figure. There appears to be no other way for the disposal of this balance of receipts except by assuming that it took the place of coin taken out of hoards. As regards the famine years 1896 to 1900, want obvously necessitated the use of hoards, and when the action of the change in the currency system to some extent ceased, the necessities of famine conditions caused a continu- ance of withdrawals from hoards. The more wealthy, however, no doubt continued to hoard rupees, though not to the same extent as formerly, as more. gold in sovereigns was used for the purpose, and
This content downloaded from 195.34.79.192 on Tue, 24 Jun 2014 23:39:06 PMAll use subject to JSTOR Terms and Conditions
1903.] Rupee Prices in India, 1898-1901. 115
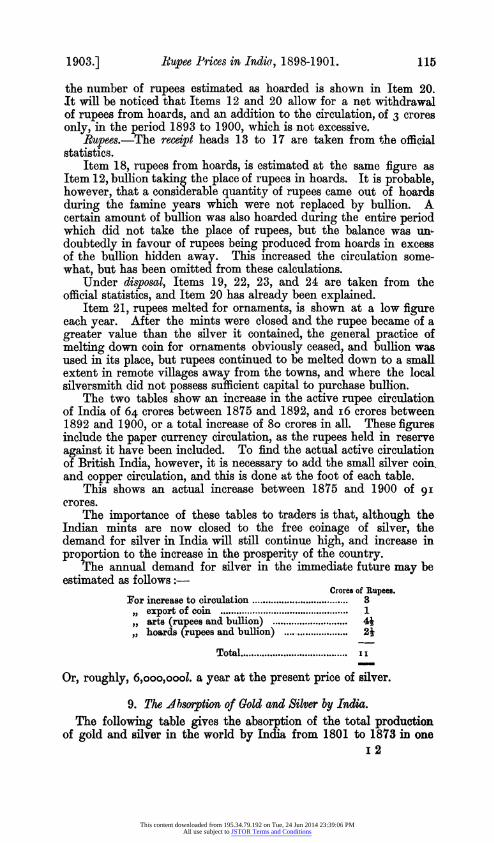
the number of rupees estimated as hoarded is shown in Item 20. It will be noticed that Items 12 and 20 allow for a net withdrawal of rupees from hoards, and an addition to the circulation, of 3 crores only, in the period 1893 to 1900, which is not excessive.
Rupees.-The rece?pt heads 13 to 17 are taken from the official statistics.
Item 18, rupees from hoards, is estimated at the same figure as Item 12, bullion taking the place of rupees in hoards. It is probable, however, that a considerable qiiantity of rupees came out of hoards during the famine years which were not replaced by bullion. A certain amount of bullion was also hoarded during the entire period which did not take the place of rupees, but the balance was un- doubtedly in favour of rupees being produced from hoards in excess of the bullion hidden away. This increased the circulation some- what, but has been omitted from these calculations.
Under disposal, Items 19, 22, 23, and 24 are taken from the official statistics, and Item 20 has already been explained.
Item 21, rupees melted for ornaments, is shown at a low figure each year. After the mints were closed and the rupee became of a greater value than the silver it contained, the general practice of melting down coin for ornaments obviously ceased, and bullion was used in its place, but rupees continued to be melted down to a small extent in remote villages away from the towns, and where the local silversmith did not possess sufficient capital to purchase bullion.
The two tables show an increase in the active rupee circulation of India of 64 crores between 1875 and 1892, and i6 crores between 1892 and 1900, or a total increase of 8o crores in all. These figures include the paper currency circulation, as the rupees held in reserve against it have been included. To find the actual active circulation of British India, however, it is necessary to add the small silver coin. and copper circulation, and this is done at the foot of each table.
This shows an actual increase between 1875 and 1900 of 9I crores.
The importance of these tables to traders is that, although the Indian mints are now closed to the free coinage of silver, the demand for silver in India will still continue high, and increase in proportion to the increase in the prosperity of the country.
The annual demand for silver in the immediate future may be estimated as follows:
Crores of Rupees. For increase to circulation .................................... 3
export of coin ........................ ............ 1 ,, arts (rupees and bullion) ............................ 4* ,, hoards (rupees and bullion) ........................ 2i
Total .................................... II
Or, roughly, 6,ooo,oool. a year at the present price of silver.
9. The Ahsorption of Gold and Silver by India. The following table gives the absortion of the total production
of gold and silver in the world by India from 1801 to 1873 in one I 2
This content downloaded from 195.34.79.192 on Tue, 24 Jun 2014 23:39:06 PMAll use subject to JSTOR Terms and Conditions
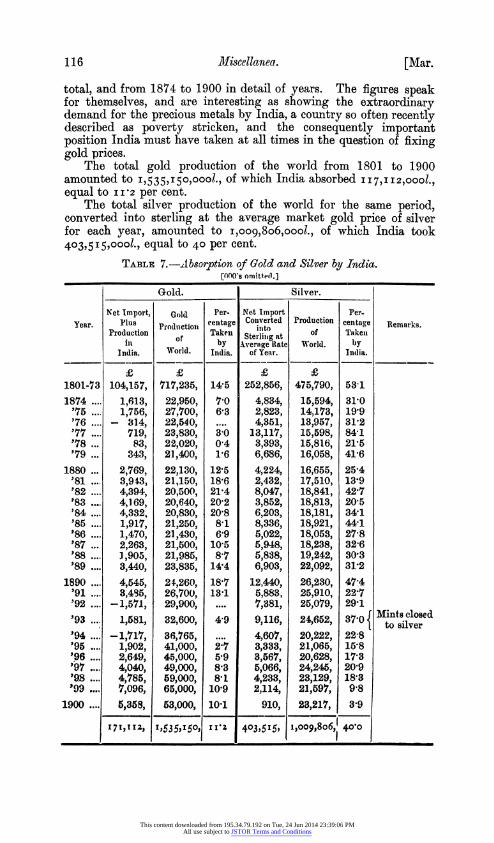
116 Mliscellanea. [Mar.
total, and from 1874 to 1900 in detail of years. The figures speak for themselves, and are interesting as showing the extraordinary demand for the precious metals by India, a country so often recently described as poverty stricken, and the consequently important position India must have taken at all times in the question of fixing gold prices.
The total gold production of the wolld from 1801 to 1900 amounted to 1,535,J50,0001., of which India absorbed II7,112,0001., equal to II2 per cent.
The total silver production of the world for the same period, converted into sterling at the average market gold price of silver for each year, amounted to i,oo9,806,0001., of which India took 403,515,0001., equal to 40 per cent.
TABLE 7.-Absorption of Gold and Silver by India. [COO's omitted.]
Gold. Silver.
Net Import, Gold Per- Net Import Per- Year. Plus Prodt,ctiosi eentage Colnverted Production centage Remarks.
Production of Takeni Sterlitig at of Taken ill by Average Rate World. by
India. World. India. of Year. India.
? ? ? ? 1801-73 104,157, 717,235, 14-5 252,856, 4750,790, 53-1 1874 l1,613, 22,950, 7.0 4,834, 15,594, 31-0 "75 1,756, 27,700, 6.3 2,823, 14,173, 19 9 '76 _ 314, 22,540, ... 4,351, 13,957, 31-2 '77 719, 23,830, 30 13,117, 15,598, 84-1 '78 83, 22,020, 0 4 3,393, 15,816, 21,5 '79 ... 343, 21,400, 1,6 6,686, 16,058, 41-6
1880 ... 2,769, 22,130, 12-5 4,224, 16,655, 25-4 '81 3,91.3, 21,150, 18'6 2,432, 17,510, 13-9 '82 4,394, 20,500, 21'4 8,047, 18,841, 42-7 '83 4,169, 20,640, 20-2 3,852, 18,813, 20-5 '84 4,332, 20,830, 20-8 6,203, 18,181, 34-1 '85 1,917, 21,250, 8-1 8,336, 18,921, 44-1 '86 1,470, 21,430, 6-9 5,022, 18,053, 27-8 '87 ... 2,263, 21,500, 10-5 5,948, 18,238, 32-6 '88 1,905, 21,985, 8-7 5,888, 19,242, 30'3 '89 3,440, 23,835, 14-4 6,903, 22,092, 31'2
1890 4,545, 21,260, 1817 12,440, 26,230, 47-4 '91 3,495, 26,700, 13-1 5,883, 25,910, 22-7 '92 -1,571, 29,900, 7,381, 25,079, 29-1
'93 1,581, 32,600, 4 9 9,116, 24,652, 37-0 Mints sloved '94 -1,717, 36,765, 4,607, 20,222, 22 8 '95 1,902, 41,000, 217 3,333, 21,065, 15'8 '96 .... 2,649, 45,000, 5-9 3,567, 20,628, 17-3 '97 4,040, 49,000, 8-3 5,066, 24,245, 20-9 '98 4,785, 59,000, 8 1 4,233, 23,129, 18-3 '99 7,096, 65,000, 10 9 2,114, 21,597, 9 8
1900 5,358, 53,000, 10 1 910, 23,217, 3 9
17)]z 15 5I5, I
' 0 ,1, YO 0,4 -
This content downloaded from 195.34.79.192 on Tue, 24 Jun 2014 23:39:06 PMAll use subject to JSTOR Terms and Conditions
1903.] Rupee Prices in India, 1898-1901. 117
00 ' 0 q c
0i d _ 0 v-Q C.) 0 0 cr 0 0o 00 CO 0 01 c. -c o0k:-. 1
,, ._ ,_ r n ci co c" i Q o o xo Flo o "If m xm t o ; 00 t_ ko
St0 -Z I
o 0 o I 0m CO 00 t - to 0 m 0 C 00 0 cc 00m 00 011 toCO
Q ;:
4 C o k- ? x t?O- *000 0 0) 0 D 0 m N *
_~~~~~~~~~~~~~~ -t cq M rO 0: O q 0 xP k- t b1I~~~~~~~~~~~~~~~~~~~~~~~~~~~~~~~~~~~~~~~~~~~~~~~~~~~~~~~~~~~~~~~~~1~~~~~~~~~~~~~~~~~~~~~~~~~~~~~~~~
r-- 'ol 00 CO r.' 01 C~ t-0 r--4 00 CO4 to1~0 00 4 05'
C I
O 000104 x, 'I = O t t 01 O G to O O O
w X4 - -, -s - {1 H_ -1 -s - -s -s - - - - - H-
105:- - L00-L- 005:o.00000 mM0000 0 0 M0 00
.C
~~0'0~~ 0k10C Ok- O 00 00 000 0'.) -00 00IZk- 0C'.M00
0 o
O~ X 00000 -C) C)I l C . C OtO tO C 00 00 9 00 UO 0CO , O OC=
0 0*z 000 _ _ _ H O Ct U t- C b 00 C0 00 M 00 "
% D_ J| 0\+ )CDO0' OC 00' C\ v40 , -.4COLo10 O 0 _
O 0 a CQO C CO 0 0 e C00,-. 5 '1 : 00 5:'-0 C 0 00 'o4 '- CO _ <. a~j 0O000v - 0 o v.40 _ 0 CO 5.4 005:- 00 0 c O 01 O C'
0000
000000 m0 o " t 00 140~0 000r. l
P.'o ,0,,- ,100, '00 o v-. 00 v-. 01 C 1 0 0 01 C CD 0 v-W - %.O 0 tN0O 4 05 M - 01005:o1 M 0 'o07 X- to 0 It0 - t ~' ~$1000- I -- - - --C- - -- - -
00A 4-I 10 0 -- -1t .t r -x
-1 0110C OO -OC t'- co5:t.o Co coJ
*~~~~~~~~~~~~~c toK ?-~ *t
.~~~ >~~~~~~~~~~" O- cq c o o ut tDo t- r0 m d C) ca cO l :1 w - 00 m
0 5 0 00 00 0 00 00 0000
0 C,
00000000000 6'o v Q 0000 . . . . 00 .
v-.4v-.4 v-II
This content downloaded from 195.34.79.192 on Tue, 24 Jun 2014 23:39:06 PMAll use subject to JSTOR Terms and Conditions
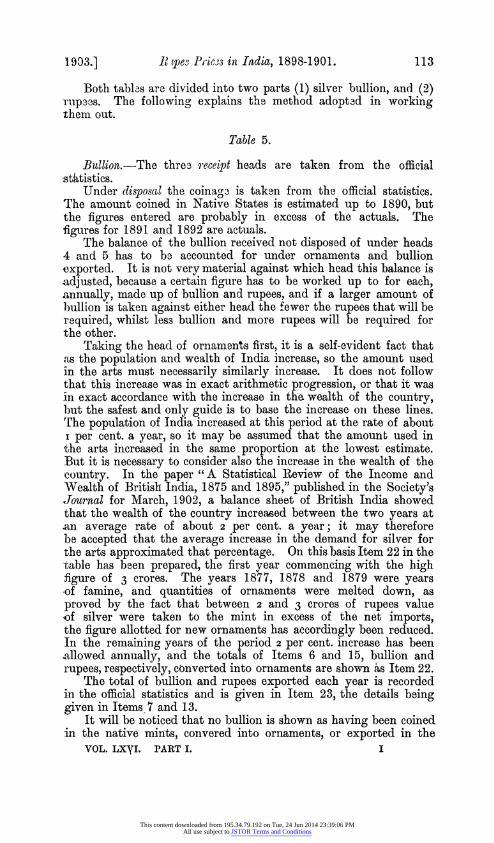
118 Miscellanea. [Mar.
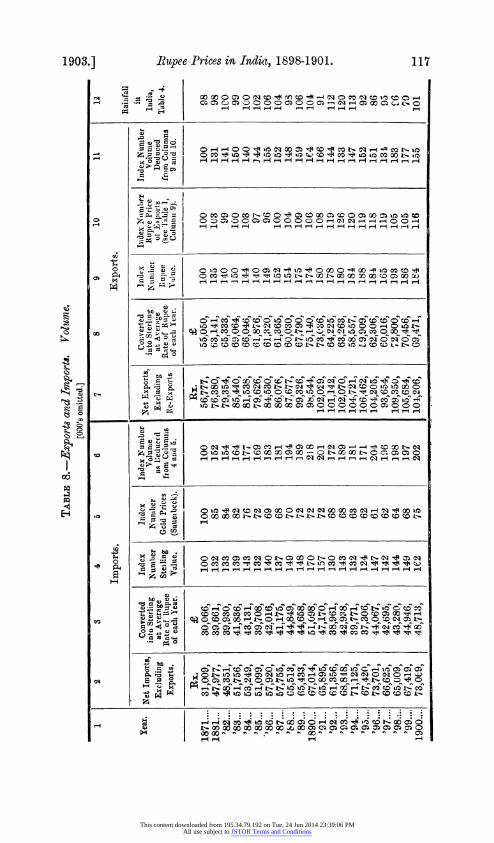
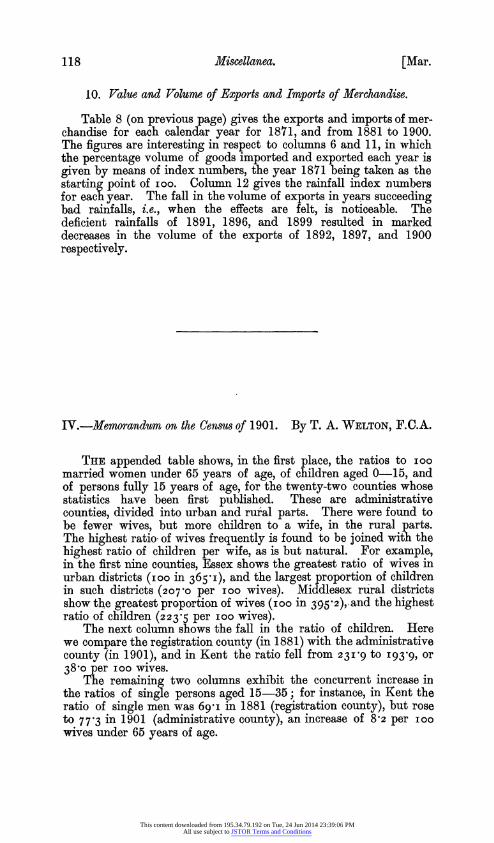
10. Value and Volume of Exports and Imports of Merchandise.
Table 8 (on previous page) gives the exports and imports of mer- chandise for each calendar year for 1871, and from 1881 to 1900. The figures are interesting in respect to columns 6 and 11, in which the percentage volume of goods imported and exported each year is given by means of index numbers, the year 1871 being taken as the starting point of IOO. Column 12 gives the rainfall index numbers for each year. The fall in the volume of exports in years succeeding bad rainfalls, i.e., when the effects are felt, is noticeable. The deficient rainfalls of 1891, 1896, and 1899 resulted in marked decreases in the volume of the exports of 1892, 1897, and 1900 respectively.
IV.-Memorandum on the Census of 1901. By T. A. WELTON, F.C.A.
THE appended table shows, in the first place, the ratios to IOO married women under 65 years of age, of children aged 0-15, and of persons fully 15 years of age, for the twenty-two counties whose statistics have been first published. These are administrative counties, divided into urban and rural parts. There were found to be fewer wives, but more children to a wife, in the rural parts. The highest ratio of wives frequently is found to be joined with the highest ratio of children per wife, as is but natural. For example, in the first nine counties, Essex shows the greatest ratio of wives in urban districts (ioo in 365'I), and the largest proportion of children in such districts (207-0 per ioo wives). Middlesex rural districts show the greatest proportion of wives (ioo in 395'2), and the highest ratio of children (223'5 per IOO wives).
The next column shows the fall in the ratio of children. Here we compare the registration county (in 1881) with the administrative county (in 1901), and in Kent the ratio fell from 23I'9 to I93'9, or 38'o per IOO wives.
The remaining two columns exhibit the concurrent increase in the ratios of single persons aged 15-35; for instance, in Rent the ratio of single men was 69-1 in 1881 (registration county), but rose to 77 3 in 1901 (administrative county), an increase of 8-2 per IOO wives under 65 years of age.
This content downloaded from 195.34.79.192 on Tue, 24 Jun 2014 23:39:06 PMAll use subject to JSTOR Terms and Conditions