Embed Size (px)
Citation preview
By Steve G. Parsons and James Stegeman
COSTQUEST ASSOCIATES | POLICY SUPPORT
Rural Broadband Economics: A Review of Rural Subsidies
2018
2 | P a g e RURAL BROADBAND ECONOMICS| A Review of Rural Subsidies
Authored By:
Steve G. Parsons, President, Parsons Applied Economics 1
James Stegeman, President, CostQuest Associates (CQA) 2
Publication Date: July 11, 2018 (revised July 13, 2018)
This document is confidential to and property of CostQuest Associates, Inc. Any use without permission in any form is strictly prohibited. This document may contain trademarks of other companies. These trademarks are the property of their respective owners. Document Version: V1R
1 President, Parsons Applied Economics; Ph.D. economics; adjunct professor at Washington University, St. Louis, teaching Telecommunications Regulation and Public Policy, and the Economics of Technology to graduate students in the Sever Institute School of Engineering and Applied Science.
2 President, CostQuest Associates (CQA). CQA developed the models relied upon to develop the National Broadband Plan as well as for the CAF and CAF II programs.
3 | P a g e RURAL BROADBAND ECONOMICS| A Review of Rural Subsidies
TABLE OF CONTENTS List of Figures ................................................................................................................................................ 3
List of Tables .................................................................................................................................................. 3
Introduction and Summary ........................................................................................................................... 5
The Economics of Rational Capital Investments ............................................................................................ 6
Costs in Economics ........................................................................................................................................ 7
Costs of Networks and Economies of Density ............................................................................................... 9
Subsidies – A Form of Market Intervention ................................................................................................. 14
Telecommunications Subsidies: A Brief History .......................................................................................... 16
U.S. Road Network Subsidies ....................................................................................................................... 17
Electric Power Distribution Subsidies .......................................................................................................... 17
Natural Gas Distribution .............................................................................................................................. 18
Water Distribution and Waste Disposal Subsidies ....................................................................................... 19
The Costs of Delivering Broadband in Rural Areas ...................................................................................... 20
Modern Subsidies for Low-Density Communications Networks ................................................................. 24
Economies of Scope .................................................................................................................................... 25
Conclusion ................................................................................................................................................... 26
LIST OF FIGURES Figure 1: Illustrative breakdown of typical costs for Broadband Service (Source: FCC) ............................... 9 Figure 2: Census Block Groups which have a linear density below 15 locations per mile. ......................... 11 Figure 3: Ultra Low Linear Density Illustrative Example ............................................................................. 12 Figure 4: Low Linear Density Illustrative Example (4xLow) ......................................................................... 13 Figure 5: Illustrative view of non-Economic Areas in the U.S. .................................................................... 21 Figure 6: Investment Requirements by Linear Density ............................................................................... 22 Figure 7: Household Counts with Monthly Cost Exceeding $75 ................................................................. 23
LIST OF TABLES Table 1: Federal Financing Bank Loans by Fiscal Year in $Billions .............................................................. 18

4 | P a g e RURAL BROADBAND ECONOMICS| A Review of Rural Subsidies
–blank page–
5 | P a g e RURAL BROADBAND ECONOMICS| A Review of Rural Subsidies
INTRODUCTION AND SUMMARY This paper, commissioned by NTCA – The Rural Broadband Association and USTelecom – The Broadband Association, examines communications networks, road networks, and electric power networks as three key network infrastructure industries; and the resulting vulnerability in low-density rural areas with the highest need for targeted subsidies.
In establishing sound public policy (and rules implementing that policy) regarding broadband deployment in high cost and rural areas, it is useful to first consider the economics of investments. In particular, the economics of network investment in rural areas is germane. Networks in general exhibit economies of density; that is, costs per user (or usage unit) are lower in high density areas. As one moves to more rural areas, with any network, the costs per user become increasingly high, eventually leading to unsustainable business models to provide network services.
In this respect, there are similarities between networks in communications, electric power, roads, natural gas distribution, water distribution, and sewer networks. By the very nature of network economics, each industry exhibits economies of density and each reaches a point at which un-subsidized provision of service in low-density areas is not viable. The causes of higher costs in low-density areas are discussed in this paper using communications examples. In addition, the scope of low-density areas in the United States are considered.
The importance of subsidies to networks in low-density areas is described for each of the major U.S. network industries. The importance of subsidies depends in large part on whether there are substitute methods of providing similar services (e.g., wells for water, propane tanks instead of nature gas networks, septic systems instead of sewer networks).
6 | P a g e RURAL BROADBAND ECONOMICS| A Review of Rural Subsidies
THE ECONOMICS OF RATIONAL CAPITAL INVESTMENTS Any entity contemplating a capital investment project must begin by comparing the benefits of the investment to the costs of that investment. For a government entity, the benefits from an investment may or may not translate into greater revenue from government-offered services or greater tax revenue.
In contrast, for a business the benefits from an investment must (eventually) be measured as the change in revenues that result from making that investment. The change in revenues could accrue by adding customers, increasing the volume of usage of existing services (if volume-sensitive prices exist) adding services to an existing customer base, or by changing the quality, functions and features of services that yield greater value to customers (generally at higher prices, or with lower customer turnover).
More specifically, any investment must produce a stream of benefits that are greater in present value than the stream of costs. 3 Since business benefits must eventually be translated into revenues, this is tantamount to a statement that the net present value (NPV) (i.e., revenues net of costs in present value) of any investment must be positive (to make that investment rational).
Many firms, facing limitations on capital acquisition (or with a limited capital budget in any given period), must choose between multiple possible positive NPV investments. Economically rational firms will tend to choose those investments with the highest internal rate of return (IRR) (among investment choices that are not mutually exclusive) until the IRR falls below the weighted average cost of capital (WACC, discussed in a section below), or until capital funds are exhausted.4 In some instances, these two primary investment criteria (positive NPV, and choosing of the highest IRR projects) are supplemented with other criteria, such as break-even time periods and other investment ratios.5
However, in addition to considering IRR, firms will also overlay an analysis of the risks of each investment vis-à-vis the risk of their existing portfolio of investment projects and, more importantly, vis-à-vis the risk of other possible projects that could be chosen (in lieu of the project being evaluated).
The managers of for-profit public corporations have fiduciary responsibilities to engage in such rational investment analysis. Models of profit maximizing behavior (and investment analysis) also provides a reasonable first approximation for assessing the behavior of not-for-profit firms. These firms must, of necessity, avoid making losses and rational project evaluation is an important part of avoiding losses. Indeed, cooperatives and other non-profit ventures must consider the sustainability of investments and IRR, even if their goal may be to reach a break-even state in lieu of necessarily realizing profits.
3 This principle is even applied to government decisions, at least in theory. E.g., Office of Management and Budget (OMB) Circular A-94, Guidelines and Discount Rates for Benefit-Cost Analysis of Federal Programs: available at https://www.wbdg.org/FFC/FED/OMB/OMB-Circular-A94.pdf “The standard criterion for deciding whether a government program can be justified on economic principles is net present value…” (Section 5.a, p. 4) 4 For investment opportunities that are mutually exclusive (e.g., two different ways in which to solve a single customer problem in a custom bid environment) the firm should rely upon NPV if both mutually exclusive choices have an IRR above the threshold value. 5 See, e.g., Allen et al. (2013). Managerial economics: Theory application and cases (8th ed.). New York, NY: W.W. Norton & Co; Ray H. Garrison, Managerial accounting: concepts for planning, control and decision making, (5th ed). Homewood IL, Business Publications Inc (1988).
7 | P a g e RURAL BROADBAND ECONOMICS| A Review of Rural Subsidies
COSTS IN ECONOMICS The fundamental cost concept in economics is that of opportunity cost: that is, costs are determined by the value of resources in their next best alternative use.6 To evaluate cost, one should first identify the resources that are used in providing a service, and then value those resources; the value of those resources in their best alternative use is generally reflected via the market price of the resources.7
One can consider the costs of any potential project (or business decision) as falling into three categories: 1) maintenance and customer-related operations costs; 2) capital costs; and 3) shared, common or joint costs (also referred to as general and administrative (G&A)). Consider the last category first. Truly shared, common or joint costs are caused by the operations of the provider in total; they are often labeled overhead costs. These costs are not directly caused by the contemplated project—they are caused by the existence of the firm and its operations in total. However, we know that firms must recover these costs or else eventually become insolvent. Moreover, some of the costs that are labeled overhead are likely to be, at least partially, caused by new projects; the path of this causation is simply less obvious.8 Such costs are often included in cost calculations and rate setting in the telecommunications industry.9
Maintenance and customer-related operations costs are generally easier to contemplate. These costs are dominated by short lived materials costs (those items that are not treated as a capital expenditure) and labor costs. For broadband services, these maintenance and operations costs include: customer acquisition and retention costs (including marketing in new geographic areas), labor and materials for maintenance of plant, network operations, and customer service.
For those activities and assets that are clearly caused by, and associated with, a new project (such as providing broadband service in a new geographic area) there will be directly attributable maintenance and customer-related operations and capital costs.
Capital costs should reflect the opportunity costs of the resources required to create long lived capital assets. Capital related costs are comprised of: i) depreciation; ii) the return on capital, and iii) associated taxes. Economic depreciation should reflect the change in the value of the asset over time. In the simple case, a new asset is purchased for a project and used exclusively for that project. If the asset is later sold or scrapped, depreciation reflects the difference between the purchase price and the later salvage or sale price. Even if the business uses an existing capital asset, there will be a change in the market value of the asset put to one use (rather than using the resources elsewhere) for some period. The loss of value of an asset can be due to simple wear and tear, or obsolescence. That is, part of the change of value of the asset
6 See virtually any text on the principle of economics, microeconomics, or managerial economics. See, e.g., PAUL HEYNE, THE ECONOMIC WAY OF THINKING 1987 (5th ed.), chapter 3, Opportunity Cost and the Supply of Goods. 7 As a technical matter, it is possible that the highest valued alternate use of the resource is by the same firm, and therefore the market value would represent a lower bound of the opportunity cost of the resource. 8 For example, a new project leads to the hiring of 100 new employees. While the salary, wage and benefits costs of those new employees would show up in the business case analysis – the cost of HR-related services and employee training (indirectly caused by the existence of the new employees) may not show up in the business case analysis. 9 World Bank, 2000, Telecommunications Regulation Handbook, Washington. Available at http://www.infodev.org/en/Publication.22.html , stating “by including capital, joint and common costs, a LRIC approach can approximate costs in a competitive market”.
8 | P a g e RURAL BROADBAND ECONOMICS| A Review of Rural Subsidies
is likely due to technical progress—the price of a replacement asset may decrease, which decreases the value of the existing asset or the asset is being replaced by newer technologies. This change in price and technology change is part of economic depreciation. By either cause (wear and tear, or obsolescence), the loss of the value of the asset—depreciation—is a real economic cost.
In addition to depreciation, there is the opportunity cost of having monies tied up in capital assets.10 This reflects the lost opportunity to have earned a return from another investment. Like depreciation, this a valid, and very real, opportunity cost. This opportunity cost is also referred to, and calculated as, the weighted average costs of capital (WACC). 11 For—profit organizations can obtain funding from two categories – debt and equity. WACC reflects the costs of each type of funding weighted by the proportion of funding that is derived from debt and equity. 12
The cost of debt is relatively straight-forward; it is the interest rate(s) for the relevant loanable funds.13 The cost of equity is caused by expectations of equity investors contemplating purchasing stock of comparable-risk companies; since the 1960s it is generally estimated using the capital asset pricing model (CAPM).14 No business, or potential business, will make an investment without an expectation that the revenues generated from the investment will be sufficient to provide the return of the investment (i.e., the recovery of depreciation expenses over time), and a return on the monies invested (i.e., WACC). In communications, capital costs are particularly important because the industry is relatively capital intensive. These principles are generally accepted world-wide. For example, The World Bank specifically states:15
Because the telecommunications industry is capital intensive, the cost of capital is a critical issue in determining telecommunications costs, regardless of the costing methodology used. The main point to recall is that the regulator has to incorporate the correct measure of the cost of capital in its costing methodology in order for the regulated operator to recover all of its efficient capital costs, including its equity and debt costs.
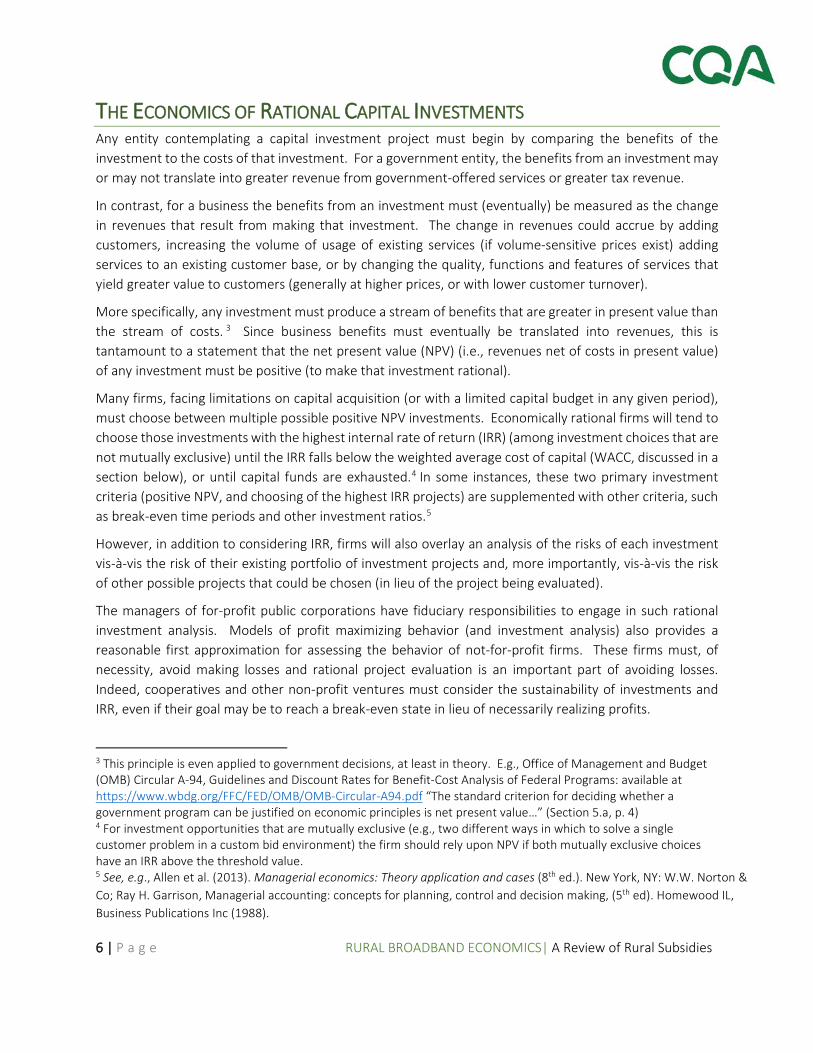
In Figure 1, the breakout of the network operation (i.e., maintenance), customer operations, G&A, and capital costs discussed above are shown for the average fiber to the home deployment across the United States. As is evident in this chart (sourced from the FCC) fiber deployment for broadband service is very capital intensive, as Capital Recovery (Depreciation), Cost of Money and Tax represent 45% of the expected monthly costs. In rural areas, this capital burden jumps to over 54% of expected monthly costs.
10 It is determined by the time value of money, as determined in the markets for debt and equity capital. 11 See virtually any textbook on finance. See also, Wikipedia, WACC, available at http://en.wikipedia.org/wiki/Weighted_average_cost_of_capital. It is noteworthy that the Wikipedia listing for WACC, has “opportunity cost” under the see-also category. 12 The firm may have multiple types of debt and multiple types of equity (e.g., preferred and common stock). The WACC calculation would reflect the cost of each and the proportion of each. 13 A company may finance via several types of debt instruments. One can calculate a weighted average cost of debt across those sources. 14 See e.g., Nobel lecture by Sharpe, available at https://www.nobelprize.org/nobel_prizes/economic-sciences/laureates/1990/sharpe-lecture.pdf 15 World Bank, 2000, Telecommunications Regulation Handbook, Washington. Available at http://www.infodev.org/en/Publication.22.html , p. B-11.
9 | P a g e RURAL BROADBAND ECONOMICS| A Review of Rural Subsidies
Figure 1: Illustrative breakdown of typical costs for Broadband Service (Source: FCC, CQA)
COSTS OF NETWORKS AND ECONOMIES OF DENSITY Networks are common in modern economies. Examples of networks include: roads, telecommunications; internet; natural gas distribution, electric power distribution, water distribution, and sewage networks. Each network exists as an interconnection of nodes (e.g., a switch or a customer location) and links connecting those nodes (e.g., fiber cable or a pipe). Networks are generally considered an important part of national infrastructure. These networks are often considered essential and provision of network services to the great majority of the population is a goal in many countries.
Networks have unique economic characteristics on both the demand side and the cost/supply side.16 While demand side characteristics make communications unique, we will focus here on the supply side
16 See generally Stanly Liebowitz & Stephen Margolis, Network Effects, in HANDBOOK OF TELECOMMUNICATIONS ECONOMICS: STRUCTURE, REGULATION, AND COMPETITION 50–52 (M. Cave et al. eds., 2002), at76; Jeffrey Rohlfs, Bandwagon Effects in Telecommunications, in HANDBOOK OF TELECOMMUNICATIONS ECONOMICS: TECHNOLOGY EVOLUTION AND THE INTERNET 81 (S.K. Majumdar et al. eds, 2005); JEFFREY ROHLFS, BANDWAGON EFFECTS IN HIGH TECHNOLOGY INDUSTRIES (MIT Press 2001); HAL VARIAN, JOSEPH FARRELL & CARL SHAPIRO, THE ECONOMICS OF INFORMATION TECHNOLOGY, (Cambridge U. Press 2004). See, e.g., Jeffrey Rohlfs, A Theory of Interdependent Demand for a Communications Service 5 BELL J. ECON. & MGMT. SCI. 16 (1974); INGO VOGELSANG & BRIDGER MITCHELL, TELECOMMUNICATIONS COMPETITION: THE LAST TEN MILES 51 (MIT Press 1997); HARALD GRUBER, THE ECONOMICS OF MOBILE TELECOMMUNICATIONS 191 (Cambridge U. Press 2005); LESTER TAYLOR, TELECOMMUNICATIONS DEMAND IN THEORY AND PRACTICE 9 (Kluwer Academic Publishers 1994) (“This is the first of two demand externalities associated with the telephone, and is usually referred to as the call (or use) externality.”); JOHN WENDERS, THE ECONOMICS OF TELECOMMUNICATIONS 29 (Ballinger 1987) (“Finally, back to telephones. There are two possible sources of externalities here – call externalities or network externalities. Call externalities may result from
10 | P a g e RURAL BROADBAND ECONOMICS| A Review of Rural Subsidies
conditions. One of the important supply-side characteristics of networks is economies of density. That is, the cost per location served falls as density rises; this is a geographic analogy to economies of scale.17 Or one can state the concept in reverse – the cost per location served is higher in low-density areas.
More specifically, land-based networks exhibit economies of linear density; costs per customer served is lower, the larger the number of customer locations per link distance (e.g., miles). This phenomenon arises in large part due to fixed (or partially fixed) costs per link distance (e.g., the costs of a fiber optic cable and the cost of placing that cable). It can also arise due to fixed costs (or partially fixed costs) for nodes (e.g., minimum costs of placing and maintaining a wireless tower regardless of the volume of use).
Often land-based networks follow road networks, in part due to rights-of-way generally existing adjacent to roads. This means that road distances, and measures of customers per road distance (e.g., three (3) customer locations per road mile) can serve as an excellent proxy for actual network link density.
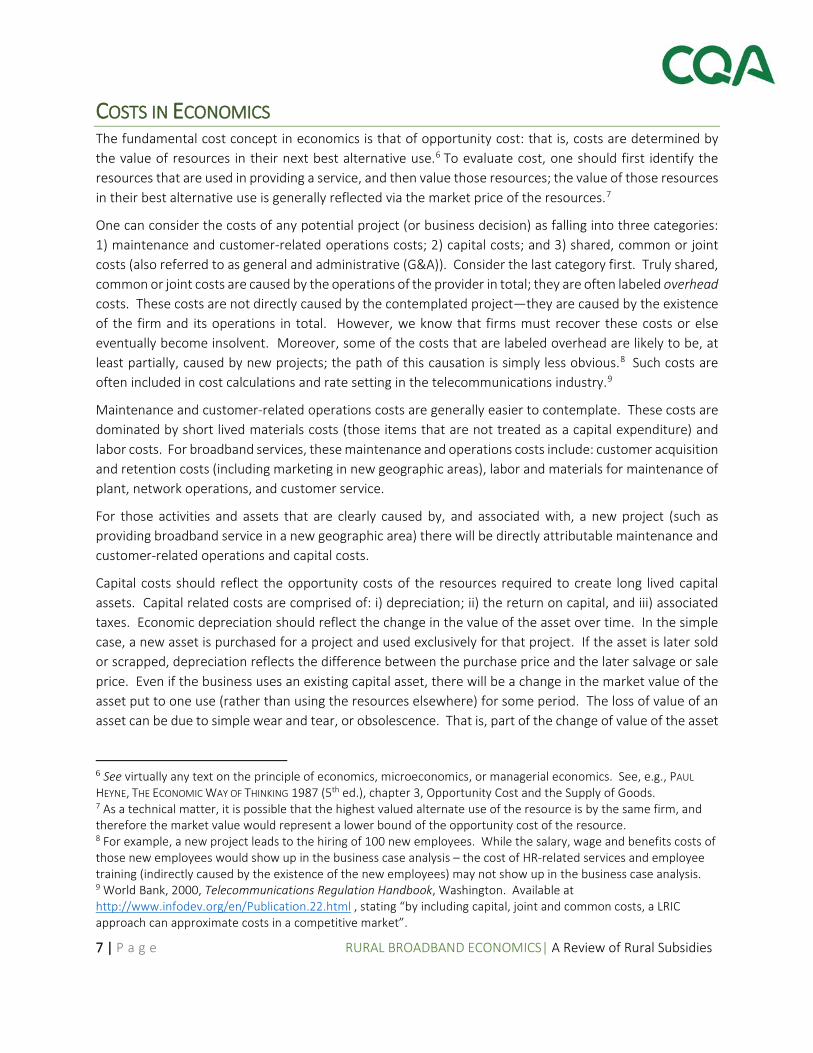
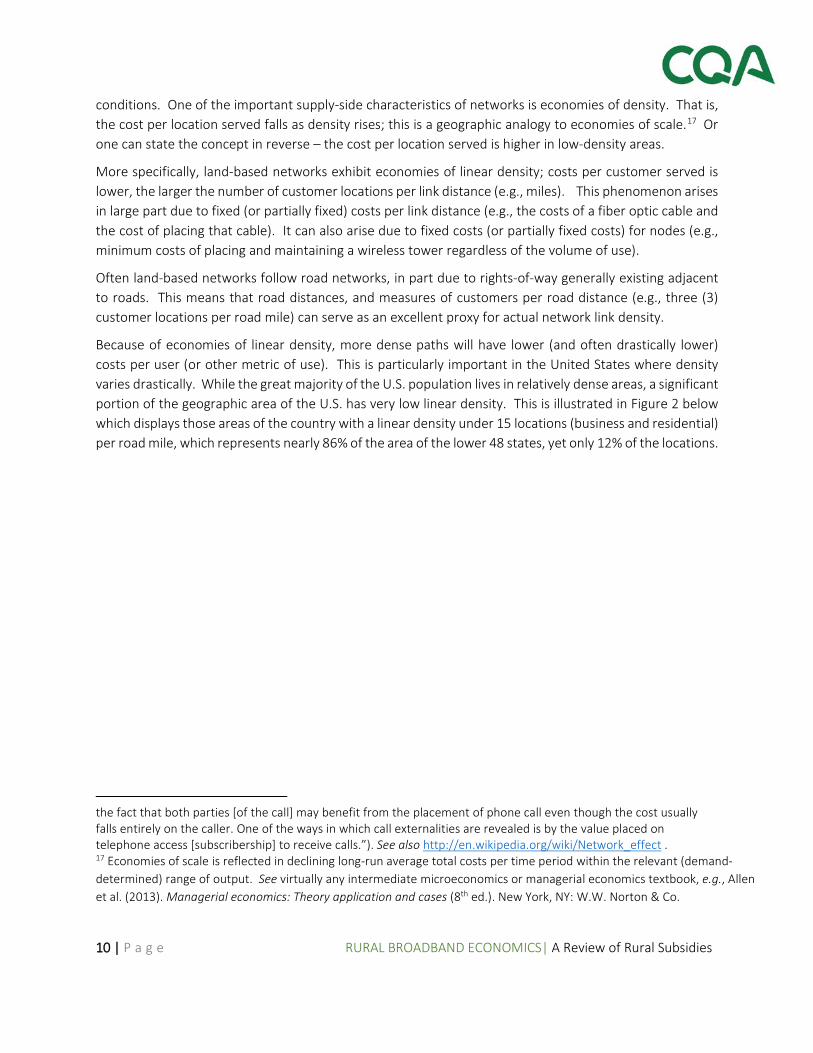
Because of economies of linear density, more dense paths will have lower (and often drastically lower) costs per user (or other metric of use). This is particularly important in the United States where density varies drastically. While the great majority of the U.S. population lives in relatively dense areas, a significant portion of the geographic area of the U.S. has very low linear density. This is illustrated in Figure 2 below which displays those areas of the country with a linear density under 15 locations (business and residential) per road mile, which represents nearly 86% of the area of the lower 48 states, yet only 12% of the locations.
the fact that both parties [of the call] may benefit from the placement of phone call even though the cost usually falls entirely on the caller. One of the ways in which call externalities are revealed is by the value placed on telephone access [subscribership] to receive calls.”). See also http://en.wikipedia.org/wiki/Network_effect . 17 Economies of scale is reflected in declining long-run average total costs per time period within the relevant (demand-determined) range of output. See virtually any intermediate microeconomics or managerial economics textbook, e.g., Allen et al. (2013). Managerial economics: Theory application and cases (8th ed.). New York, NY: W.W. Norton & Co.
11 | P a g e RURAL BROADBAND ECONOMICS| A Review of Rural Subsidies
Figure 2: Census Block Groups which have a linear density below 15 locations per road mile.
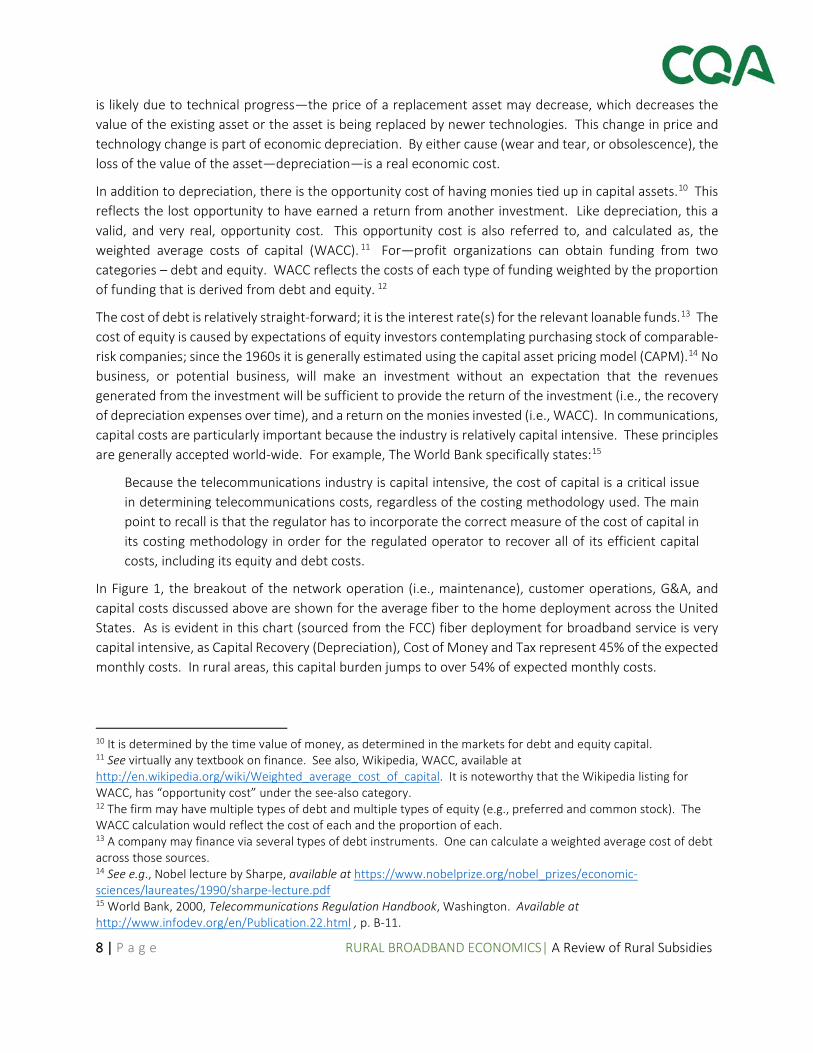
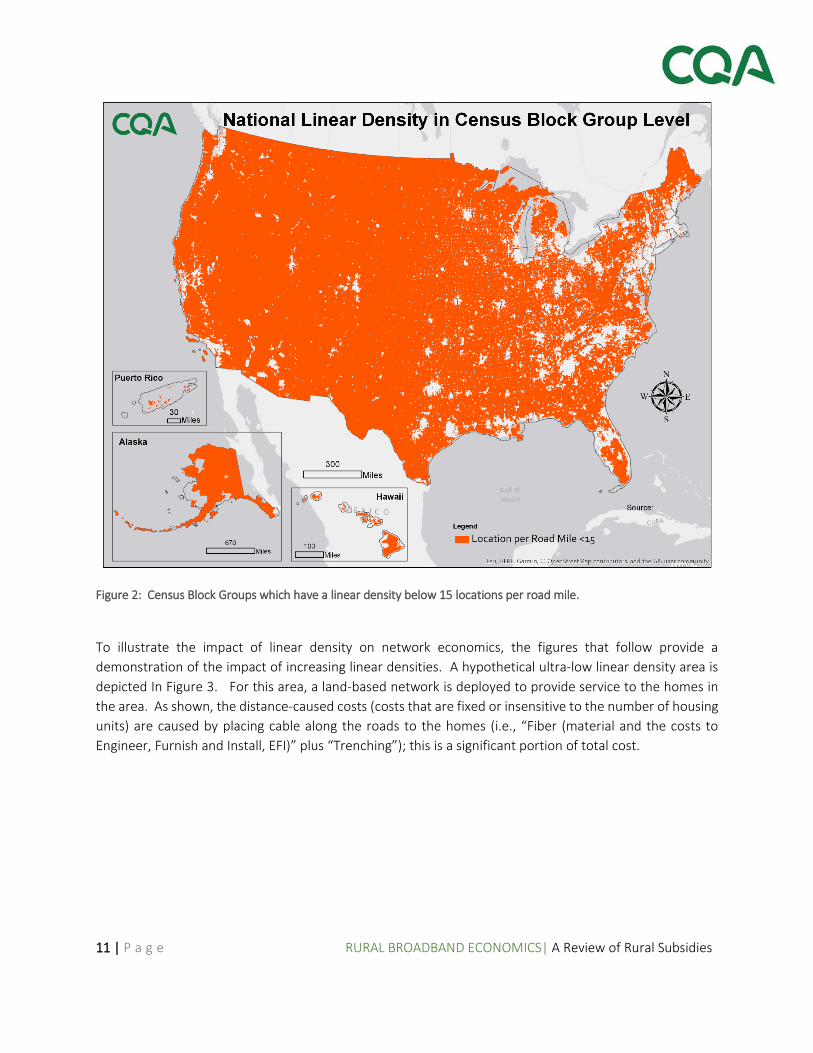
To illustrate the impact of linear density on network economics, the figures that follow provide a demonstration of the impact of increasing linear densities. A hypothetical ultra-low linear density area is depicted In Figure 3. For this area, a land-based network is deployed to provide service to the homes in the area. As shown, the distance-caused costs (costs that are fixed or insensitive to the number of housing units) are caused by placing cable along the roads to the homes (i.e., “Fiber (material and the costs to Engineer, Furnish and Install, EFI)” plus “Trenching”); this is a significant portion of total cost.
12 | P a g e RURAL BROADBAND ECONOMICS| A Review of Rural Subsidies
Figure 3: Ultra Low Linear Density Illustrative Example
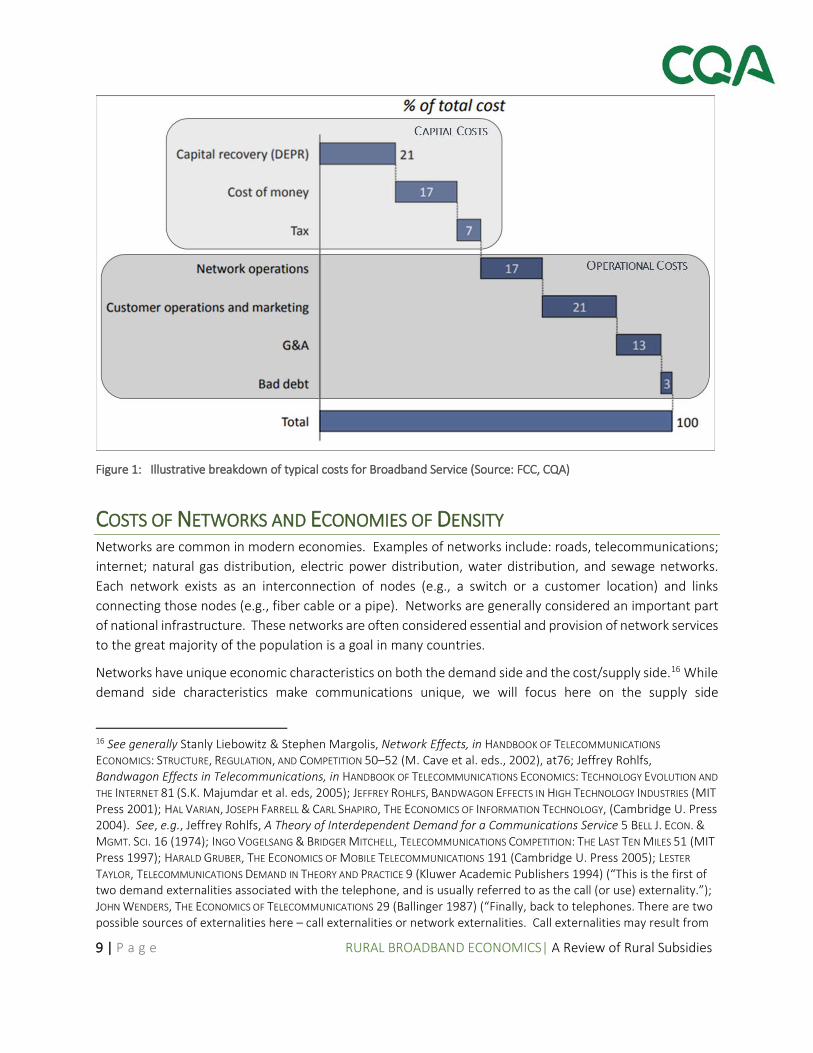
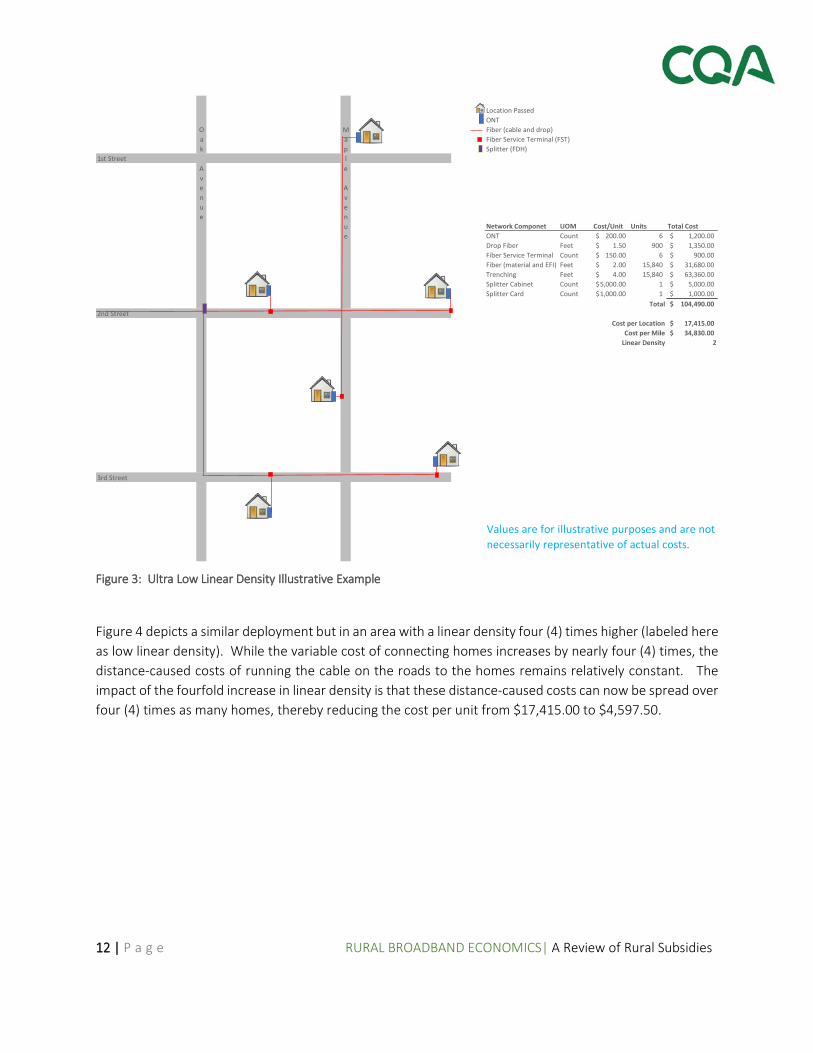
Figure 4 depicts a similar deployment but in an area with a linear density four (4) times higher (labeled here as low linear density). While the variable cost of connecting homes increases by nearly four (4) times, the distance-caused costs of running the cable on the roads to the homes remains relatively constant. The impact of the fourfold increase in linear density is that these distance-caused costs can now be spread over four (4) times as many homes, thereby reducing the cost per unit from $17,415.00 to $4,597.50.
Location PassedONTFiber (cable and drop)Fiber Service Terminal (FST)Splitter (FDH)
1st Street
Network Componet UOM Cost/Unit Units Total CostONT Count 200.00$ 6 1,200.00$ Drop Fiber Feet 1.50$ 900 1,350.00$ Fiber Service Terminal Count 150.00$ 6 900.00$ Fiber (material and EFI) Feet 2.00$ 15,840 31,680.00$ Trenching Feet 4.00$ 15,840 63,360.00$ Splitter Cabinet Count 5,000.00$ 1 5,000.00$ Splitter Card Count 1,000.00$ 1 1,000.00$
Total 104,490.00$ 2nd Street
Cost per Location 17,415.00$ Cost per Mile 34,830.00$
Linear Density 2
3rd Street
Values are for illustrative purposes and are notnecessarily representative of actual costs.
Oak Avenue
Maple Avenue
13 | P a g e RURAL BROADBAND ECONOMICS| A Review of Rural Subsidies
Figure 4: Low Linear Density Illustrative Example (4xUltraLow)
As a direct cause of economies of linear density, for any network service potentially offered in low density areas, three options (or some combination thereof) exist: 1) prices are higher in low density areas to reflect higher costs; 2) service is not offered in low density areas since demand is insufficient to cover the higher costs; and/or 3) the higher costs of providing service are subsidized (at least partially).
In the United States and many other countries in the world, network industries receive subsidies in low linear density areas. Consider some of the sources of subsidy for the more common networks: telecommunications; electric power, roads, natural gas distribution, water distribution, and sewage systems.
However, before examining subsidies to specific network industries, it will be useful to consider what constitutes a subsidy.
Location PassedONTFiber (cable and drop)Fiber Service Terminal (FST)Splitter (FDH)
1st Street
Network Componet UOM Cost/Unit Units Total CostONT Count 200.00$ 24 4,800.00$ Drop Fiber Feet 1.50$ 2,400 3,600.00$ Fiber Service Terminal Count 150.00$ 6 900.00$ Fiber (material and EFI) Feet 2.00$ 15,840 31,680.00$ Trenching Feet 4.00$ 15,840 63,360.00$ Splitter Cabinet Count 5,000.00$ 1 5,000.00$ Splitter Card Count 1,000.00$ 1 1,000.00$
Total 110,340.00$ 2nd Street
Cost per Location 4,597.50$ Cost per Mile 36,780.00$
Linear Density 8
3rd Street
Values are for illustrative purposes and are notnecessarily representative of actual costs.
Oak Avenue
Maple Avenue
14 | P a g e RURAL BROADBAND ECONOMICS| A Review of Rural Subsidies
SUBSIDIES – A FORM OF MARKET INTERVENTION Perhaps the most basic definition of a subsidy is an activity for which the revenue generated from the activity is less than the costs of the activity.18 More precisely, a subsidy as an activity for which the present value of the revenues generated from the activity (over time) is less than the present value of the costs of the activity—i.e., that the activity has a negative NPV. We have already established that businesses will only willingly and knowingly invest in NPV positive activities—i.e., they will avoid subsidization activities. Subsidies may be funded in four primary ways: 1) cross-subsidies by the same firm; 2) cross-subsidies between firms; 3) philanthropic donations; and 4) government subsidies.
The economics literature deals with cross-subsidies in detail. A cross-subsidy by the same firm involves pricing one service below cost while other services are priced above cost to a degree sufficient to cover the below-cost pricing. More precisely, the service receiving the subsidy is priced such that the present value of the revenues from that service are below the present value of the costs caused by that service – the shortfall being recovered from other services offered by that same firm. As noted above, any rational firm should avoid such a cross-subsidy since avoiding offering the subsidized service (or raising the price of the service to eliminate the subsidy) would yield a higher stream of present-value adjusted profits. In addition, the services priced above cost to provide the cross-subsidy will invite competition which then puts pressure on the source of funding for the cross-subsidy. Such cross-subsidies can exist however when prices are regulated or otherwise mandated by a government agency. This has occurred in price-regulated (rate-of-return) industries, as is described in the sections below (in telecommunications, for example, below-cost basic exchange service prices to residential customers were established for rate-of-return local telecommunications providers).19
A variant on this theme can occur when the firm offering the subsidized service also offers business-to-business services. When the subsidizing firm is price-regulated, the source of funding the cross-subsidy could be derived via high prices on business-to-business services (e.g., high switched access prices in telecommunications shortly after divestiture of AT&T.) Each of the first two types of subsidy forms (cross-subsidies by the same firm, and cross-subsidies between firms) rely on price (rate-of-return) regulation of at least one firm. Without rate of return regulation, the firm could have increased profits by raising the price of the subsidized service (or not offering the subsidized service).
18 The first rigorous published treatment of cross-subsidization is presented by Gerald Faulhaber (1975), who explicitly defines subsidy-free pricing, presents two tests for cross-subsidization, and defines a possible range of subsidy-free pricing. Faulhaber, Gerald R. 1975. Cross-Subsidization: Pricing in Public Enterprises AMERICAN
ECONOMIC REVIEW 65:966-77. The genesis of this literature arose due to issues in regulated industries, particularly the telecommunications industry. See Steve G. Parsons, Cross-Subsidization in Telecommunications, J. OF REG. ECON. (1998).
19 See Steve G. Parsons, Cross-Subsidization in Telecommunications, J. OF REG. ECON, (1998), and the sources cited therein.
15 | P a g e RURAL BROADBAND ECONOMICS| A Review of Rural Subsidies
As a technical matter, it is also possible to fund a subsidy through philanthropic donations. One of the authors of this paper, for example, made monthly donations for approximately fifteen years to Ameren Illinois’ “Energy Assistance Foundation”.20 As a practical matter, however, such donations will likely be insignificant in supporting low density networks.
Government funding is the fourth category of subsidy funding, and currently the most important. The importance of this source of funding is due in large part to the fact that cross-subsidies are inconsistent with competitive markets and competitive investment principles.
Before discussing subsidies in more detail, it is first useful to note that governments tend to intervene in markets when unsatisfied with the free-market result. In some instances, government intervention can take the form of government provision of services (e.g., the United States Postal Service, or the social security administration) in which the service largely (or completely) is funded by user fees (or taxes so specific as to approximate a user fee). In other instances, the provision of service, such as national defense, occurs largely without user fees. Other services are provided largely by private parties, but funded by government agencies (e.g., Medicare and Medicaid). In still other instances, intervention can take the form of payments to people based upon income, largely for the purposes of redistributing income (e.g., aid to families with dependent children, AFDC).21
Government intervention can take the form of antitrust intervention (e.g., proscribing certain mergers) for specific industries or firms. Often intervention is generic (across industry) such as rules for labeling, health and safety, providing information, or treatment of employees (e.g., required employee benefits for employees working over 32 hours per week). In some instances, government programs intervene directly to change the prices for certain services (e.g., price supports in agriculture, minimum wage laws, and rent control laws).
In many other circumstances, intervention takes the form of: explicitly subsidizing a service (e.g., basic residential telephone service in the United States through much of the twentieth century); subsidizing a segment of customers for a specific service (e.g., U.S. Link-up and Life-line services for low income telecommunications customers); 22 or subsidizing certain geographic areas (modern universal service policies for telecommunications or broadband networks).
In every instance, the free market result would lead to lower volumes of service, lower volumes of service for segments of customers (e.g., low income or rural) or the complete absence of service in some geographic areas; intervention is generally deemed appropriate by government policy in such circumstances.
20 This is the description on the voluntary line item on the monthly Ameren bill. See WarmNeighborsCoolFriends.org. 21 Replaced by other programs in 1996. See, e.g., https://en.wikipedia.org/wiki/Aid_to_Families_with_Dependent_Children 22 FCC 08-262, Order on Remand and Report and Order and Further Notice of Proposed Rulemaking, (Nov. 5, 2008), app A, paras. 64–91, available at http://www.fcc.gov/headlines.html.
16 | P a g e RURAL BROADBAND ECONOMICS| A Review of Rural Subsidies
TELECOMMUNICATIONS SUBSIDIES: A BRIEF HISTORY Telecommunications subsidies have a long history; this history is based in large part upon the market power of the primary vertically integrated incumbent (AT&T and the Bell System), the regulation of that incumbent, and the Communications Act of 1934 (and its modifications under the Telecommunications Act of 1996)23 which established principles for universal service that specifically focused on increasing access to consumers living in rural and insular areas, and for consumers with low-incomes. Over time certain services, and segments of services became cross-subsidized by other services (and segments of services). By the last half of the twentieth century the pattern of cross-subsidization in the United States (and indeed in much of the world) was: i) from business to residence; ii) from high usage (especially “long distance”) to low usage; and iii) from urban to rural.24 This occurred in part via a complex web of revenues “settlements” processes, where revenues were distributed back to local exchange companies, as well as allocations of a portion of the non-traffic sensitive costs of the local exchange to the interstate jurisdiction.25 These subsidies were possible due to the status of incumbents as franchised protected monopoly providers. Note that each of the cross-subsidy patterns tended to cross-subsidize rural areas since rural areas tend to be populated by low-usage residential customers. However, after the divestiture of AT&T (effective in 1984) and the expansion of competition in most segments of the industry – these patterns of cross-subsidy became increasingly difficult to manage and competitively unsustainable.
In implementing the Telecommunications Act of 199626 the FCC’s first universal service order27 stated:
The Act [The 1996 Telecommunications Act] also recognizes, however, that universal service cannot be maintained without reform of the current subsidy system. The current universal service system is a patchwork quilt of implicit and explicit subsidies. These subsidies are intended to promote telephone subscribership, yet they do so at the expense of deterring or distorting competition.
In order to maintain the public policy objectives in the communications industry (primarily universal service objectives to provide reasonable services everywhere at affordable prices) the traditional patterns of cross-subsidy have been in the process of being replaced with explicit subsidies as seen in the FCC’s universal
23 https://transition.fcc.gov/Reports/1934new.pdf 24 See Steve G. Parsons, Cross-Subsidization in Telecommunications, J. OF REG. ECON. (1998). See also, David L. Kaserman & John W. Mayo. Cross-subsidies in Telecommunications, 11 YALE J. ON REG. 119, 131 (1994); and BRIDGER MITCHELL & INGO VOGELSANG, TELECOMMUNICATIONS PRICING THEORY AND PRACTICE, 118-136 (1991). The 1996 Economic Report of the President (p. 177) states: “For many years regulators, with the support of Congress, used cross-subsidies between regulated monopolists to pursue universal service goals. Through a complicated nationwide pooling of telephone costs and revenues, local telephone companies especially in high-cost rural areas, received substantial subsidies to keep their rates low.” 25 See Smith v. Illinois Bell Telephone Co., 282 U.S. 133 (requiring state regulators to allocate local access charges to telephone companies based on interstate versus intrastate use of the exchange). Later, through complicated dealings and negotiations with the FCC and AT&T, state regulators began to shift more of the costs of intrastate service to interstate service. See CHRISTOPHER H. STERLING, PHYLLIS W. BERNT & MARTIN B. H. WEISS, SHAPING AMERICAN TELECOMMUNICATIONS 101–04 (2006). 26 Telecommunications Act of 1996, Pub. L. No. 104-104, 110 Stat. 56 (1996) (codified in scattered sections of 47 U.S.C.) 27 Federal-State Joint Board on Universal Service, 62 Fed. Reg. (May 8, 1997)
17 | P a g e RURAL BROADBAND ECONOMICS| A Review of Rural Subsidies
service support system with four types of mechanisms:28 1) High Cost Support;29 2) Low Income Support;30 3) Rural Health Care Support;31 and 4) Schools and Libraries Support Mechanism.32
U.S. ROAD NETWORK SUBSIDIES Economies of density apply to road networks as well. At first glance user fees for road networks would seem to only apply to toll roads. However, taxes on motor fuel create indirect user fees (or an approximation to user fees); one can think of these taxes as sources of revenue from road usage of $.394 per gallon (gasoline and gasohol).33 Federal motor fuel taxes were over $43.8 billion in 2015, 34 while we estimate state motor fuel taxes that year were over $65 billion.35 Low population density areas have a small number of drivers per road mile and therefore generate low revenue per road mile. Drivers in high linear density areas cross-subsidize drivers in low linear density areas via much higher gasoline taxes paid per road mile in high linear density areas.
Moreover, new road construction (or construction to repair existing roads and bridges) is financed in part through state, county, and local taxes (or borrowing by those government agencies). Because of economies of density, the subsidy per user mile (reflecting both road miles and the number of citizens driving over those road miles per time period) will be particularly high in rural areas. According to the Federal Highway Administration, the United States has approximately 4.12 million miles of roads, of which 2.94 million miles are in rural areas.36 However, the clear majority of user miles is on non-rural roads.
ELECTRIC POWER DISTRIBUTION SUBSIDIES Explicit subsidization of electric power service in rural areas has a long history in the United States. The Rural Electrification Act of 1936 (7. U.S.C. 901 et seq.) established the Rural Electrification Administration
28 FCC website: https://www.fcc.gov/general/universal-service-fund 29 Id., “provides support to certain qualifying telephone companies that serve high cost areas, thereby making phone service affordable for the residents of these regions.” 30 Id., “assists low-income customers by helping to pay for monthly telephone charges as well as connection charges to initiate telephone service.” 31 Id., “allows rural health care providers to pay rates for telecommunications services similar to those of their urban counterparts, making telehealth services affordable.” 32 Id., “popularly known as the "E-Rate," provides telecommunication services (e.g., local and long-distance calling, high-speed lines), Internet access, and internal connections (the equipment to deliver these services) to eligible schools and libraries.” 33 Federal gas and gasohol taxes are $.184/gallon and diesel taxes are $.244/gallon. Federal taxes also apply to heavy trailers and tires beyond a certain pressure. See https://www.fhwa.dot.gov/infrastructure/gastax.cfm . Weighted average state fuel taxes are approximately $.31/gallon. See https://en.wikipedia.org/wiki/Fuel_taxes_in_the_United_States See also, Federal Highway Administration https://www.fhwa.dot.gov/ and American Road and Transportation Builders Association ARTBA https://www.artba.org/about/faq/ 34 See http://www.taxpolicycenter.org/statistics/motor-fuel-tax-revenue 35 Estimated as a lower bound using the ratio of state and federal fuel taxes per gallon. 36 See also, Federal Highway Administration https://www.fhwa.dot.gov/ and American Road and Transportation Builders Association ARTBA https://www.artba.org/about/faq/
18 | P a g e RURAL BROADBAND ECONOMICS| A Review of Rural Subsidies
(REA) whose purpose it was to create jobs and boost rural economies by providing grants and loans to rural electric cooperatives. Through this effort, 99% of all rural homes had electricity by 1975.
Today, the USDA Rural Development’s Rural Utilities Service (RUS) oversees federal subsidy programs, loan, and loan guarantee programs for rural: water; waste disposal, electric power, telecommunications, distance learning, telemedicine and broadband, and high energy cost grants. According to the most recent USDA Rural Development progress report, RUS awarded a total of $38.34 billion to these programs in 2016.
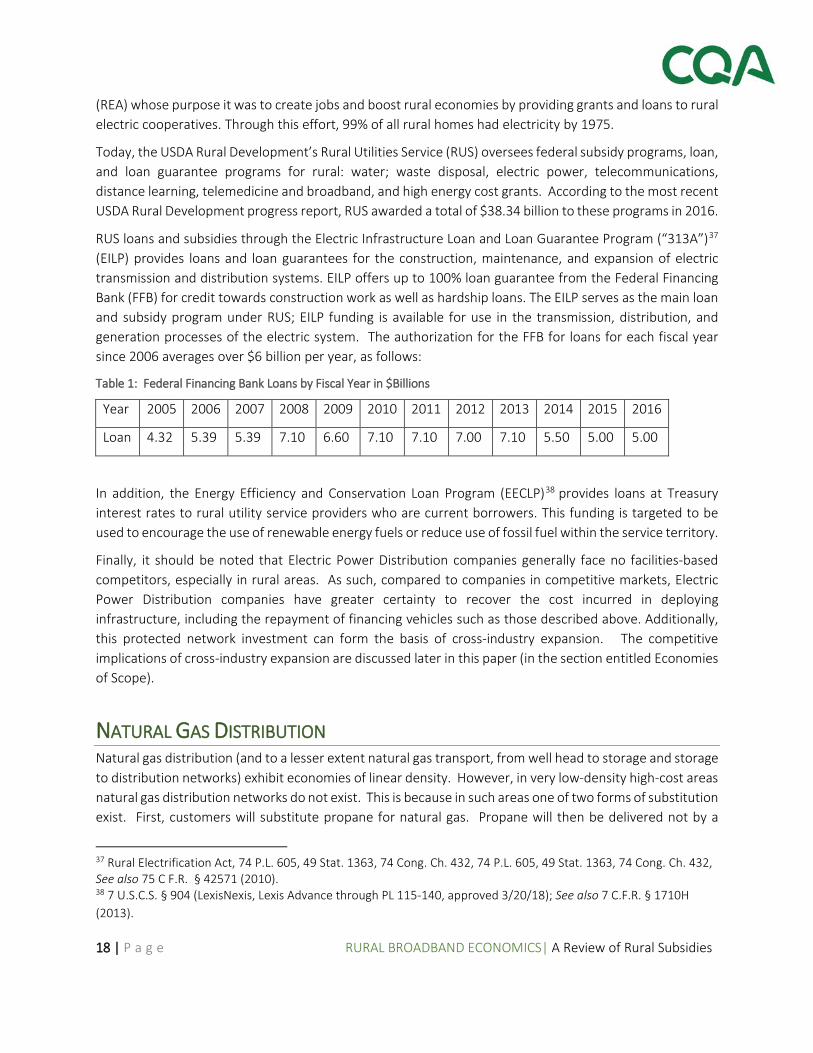
RUS loans and subsidies through the Electric Infrastructure Loan and Loan Guarantee Program (“313A”)37 (EILP) provides loans and loan guarantees for the construction, maintenance, and expansion of electric transmission and distribution systems. EILP offers up to 100% loan guarantee from the Federal Financing Bank (FFB) for credit towards construction work as well as hardship loans. The EILP serves as the main loan and subsidy program under RUS; EILP funding is available for use in the transmission, distribution, and generation processes of the electric system. The authorization for the FFB for loans for each fiscal year since 2006 averages over $6 billion per year, as follows:
Table 1: Federal Financing Bank Loans by Fiscal Year in $Billions
Year 2005 2006 2007 2008 2009 2010 2011 2012 2013 2014 2015 2016
Loan 4.32 5.39 5.39 7.10 6.60 7.10 7.10 7.00 7.10 5.50 5.00 5.00
In addition, the Energy Efficiency and Conservation Loan Program (EECLP)38 provides loans at Treasury interest rates to rural utility service providers who are current borrowers. This funding is targeted to be used to encourage the use of renewable energy fuels or reduce use of fossil fuel within the service territory.
Finally, it should be noted that Electric Power Distribution companies generally face no facilities-based competitors, especially in rural areas. As such, compared to companies in competitive markets, Electric Power Distribution companies have greater certainty to recover the cost incurred in deploying infrastructure, including the repayment of financing vehicles such as those described above. Additionally, this protected network investment can form the basis of cross-industry expansion. The competitive implications of cross-industry expansion are discussed later in this paper (in the section entitled Economies of Scope).
NATURAL GAS DISTRIBUTION Natural gas distribution (and to a lesser extent natural gas transport, from well head to storage and storage to distribution networks) exhibit economies of linear density. However, in very low-density high-cost areas natural gas distribution networks do not exist. This is because in such areas one of two forms of substitution exist. First, customers will substitute propane for natural gas. Propane will then be delivered not by a
37 Rural Electrification Act, 74 P.L. 605, 49 Stat. 1363, 74 Cong. Ch. 432, 74 P.L. 605, 49 Stat. 1363, 74 Cong. Ch. 432, See also 75 C F.R. § 42571 (2010). 38 7 U.S.C.S. § 904 (LexisNexis, Lexis Advance through PL 115-140, approved 3/20/18); See also 7 C.F.R. § 1710H (2013).
19 | P a g e RURAL BROADBAND ECONOMICS| A Review of Rural Subsidies
network of pipes, but by propane trucks (typically filling buried or underground propane storage tanks). Second, customers may choose to have their location rely solely on electric power and wood-burning space heating. Indeed, electric power subsidies reduce the price of electric power which reduces the demand for natural gas.
In the lowest density areas of the United States, there are virtually no natural gas distribution networks. Because of these alternatives, natural gas is not considered essential, and virtually no subsidies exist for natural gas distribution in low density areas.39 This factor increases the demand for electric power in more rural areas.
WATER DISTRIBUTION AND WASTE DISPOSAL SUBSIDIES Public water distribution systems are a form of a (one-way) network, with links (pipes) and nodes (interconnections, water sources, and terminal customer locations). Similarly, sewage collection and treatment systems are also composed of one-way networks. Economies of linear density exist in water distribution networks and sewage networks.
However, unlike communications networks, for both water supply and waste disposal, there are non-network alternatives. “Although the majority of people in the United States use water provided by public suppliers in 2010, about 44.5 million people, or 14 percent of the population, supplied their own water for domestic use.”40 Similarly, for sewage systems “[m]ore than 21 million households in the United States use septic systems—not a public sewer—to trap and filter their toilet waste.”41 With an average of 2.58 persons per household,42 this means more than 54 million Americans do not use network-based public sewer systems. Moreover, many regions of the U.S. still had a relatively high proportion of new housing not on network sewer systems.43
Therefore, in the most rural areas of the U.S., non-network alternatives (septic systems and wells)44 are frequently employed where linear density is simply too low to allow networks to be cost-effectively
39 This ignores any implied subsidies via favorable tax treatment for natural gas production. 40 USGS Water Science School, https://water.usgs.gov/edu/wudo.html citing Estimated Use of Water in the U.S. (2010) https://pubs.usgs.gov/circ/1405/ 41 North America Water News, October 16, 2015, available at http://www.circleofblue.org/2015/world/infographic-americas-septic-systems/ 42U.S. Bureau of the Census, 2010 Census Briefs, available at https://www.census.gov/prod/cen2010/briefs/c2010br-14.pdf 43 See www.circleofblue.org/2015/world/infographic-americas-septic-systems/. In 2013, New England – 51%; East South Central – 36%; East North Central – 28%; Mid Atlantic – 19%. 44 In the most rural areas, water distribution networks do not exist; rather these areas are generally supplied by local water supplies (e.g., springs or creeks) as well as small local wells. In some instances, two or more locations may share a single well or proximal water supply. Some low-density locations rely, at least in part, on water delivery trucks.
20 | P a g e RURAL BROADBAND ECONOMICS| A Review of Rural Subsidies
deployed. These alternative systems themselves can receive subsidies, primarily from the U.S. Department of Agriculture (USDA). These include subsidies for well water,45 and waste disposal.46
Despite the alternatives for non-network water and waste disposal (and the subsidies for such individual investments), subsidies are still significant for network-based water and waste disposal systems. USDA grants are available for network-based waste management for communities under 10,000 population.47 USDA programs for waste and water network systems offer grants, loans, and loan guarantees (up to 90%) are also available (areas with population under 10,000) based upon median household income and area served.48
The USDA’s rural development budget for 2018 “provides over $35 billion for financial and technical assistance for the benefit of rural residents”49 Note, this budget covers programs beyond those for water and waste treatment.
THE COSTS OF DELIVERING BROADBAND IN RURAL AREAS Above, in the section on costs, it was noted that costs can be placed into three categories: 1) common, 2) direct maintenance and customer-related operations, and 3) direct capital costs. In rural areas, while it was noted that the capital burden is higher, maintenance and operations costs are also higher on a per location basis since many maintenance operations are cause by the existence of physical assets, not the usage of those assets (e.g., clearing tree limbs from aerial cable for communications or electric power). In addition, since rural areas are often served by smaller companies, the common costs (averaged over customer locations or service counts) also tend to be higher.
The most important distinction between rural and non-rural areas occurs in the direct capital investments required to serve each area. For example, consider the results from CostQuest’s fiber-based broadband cost model, run for the entire nation using three density categories (urban, suburban, and rural). The two most important capital investment categories are: 1) conduit and poles (sometimes called structure); and 2) fiber optic cable. These two categories represent approximately two-thirds of the capital investment needed to provide broadband in rural areas. As one would expect, urban areas are the least costly in every dimension. However, even if one only compares suburban and rural areas, the capital investment per customer location, for conduit and poles, is approximately 5.6 times higher in rural areas as in suburban areas. For fiber optic cable, the capital investment is approximately 4.2 times higher in rural areas as in suburban areas. These cost differentials are critical since network industries tend to be very capital-intensive.
If the focus is maintained on the cost of delivering broadband in low linear density areas, the results from CostQuest’s fiber-based broadband cost model can be used to demonstrate, visually, the impact. In Figure 45 “… one percent fixed interest rate, 20-year maximum term, and an $11,000 maximum loan per household.” https://www.rd.usda.gov/programs-services/household-water-well-system-grants 46 USDA, https://www.rd.usda.gov/newsroom/news-release/usda-announces-funding-available-septic-system-repairs and https://www.rd.usda.gov/programs-services/individual-water-wastewater-grants 47 See https://www.rd.usda.gov/files/fact-sheet/RD-FactSheet-RUS-SolidWasteMgmtGrants.pdf 48 See https://www.rd.usda.gov/programs-services/water-waste-disposal-loan-grant-program 49 https://www.usda.gov/sites/default/files/documents/USDA-Budget-Summary-2018.pdf p. 3.
21 | P a g e RURAL BROADBAND ECONOMICS| A Review of Rural Subsidies
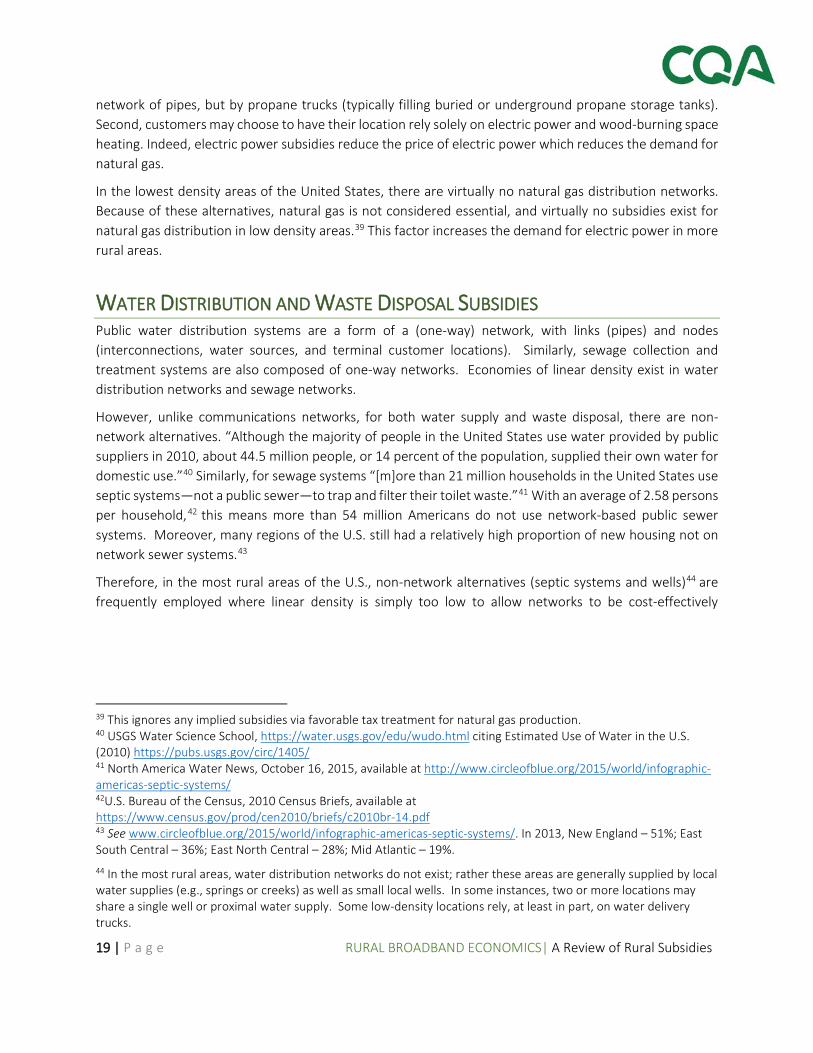
5, the uneconomic portions of the country can be seen50 as the yellow, orange and red shaded areas (where yellow is the least uneconomic, red is the most uneconomic, and orange is in between). Grey areas are unpopulated, dark green are the most likely to be economic, and light green could be economic with high customer subscribership. From a land mass viewpoint, the uneconomic area is quite large.
Figure 5: Illustrative View of Uneconomic Areas in the U.S.
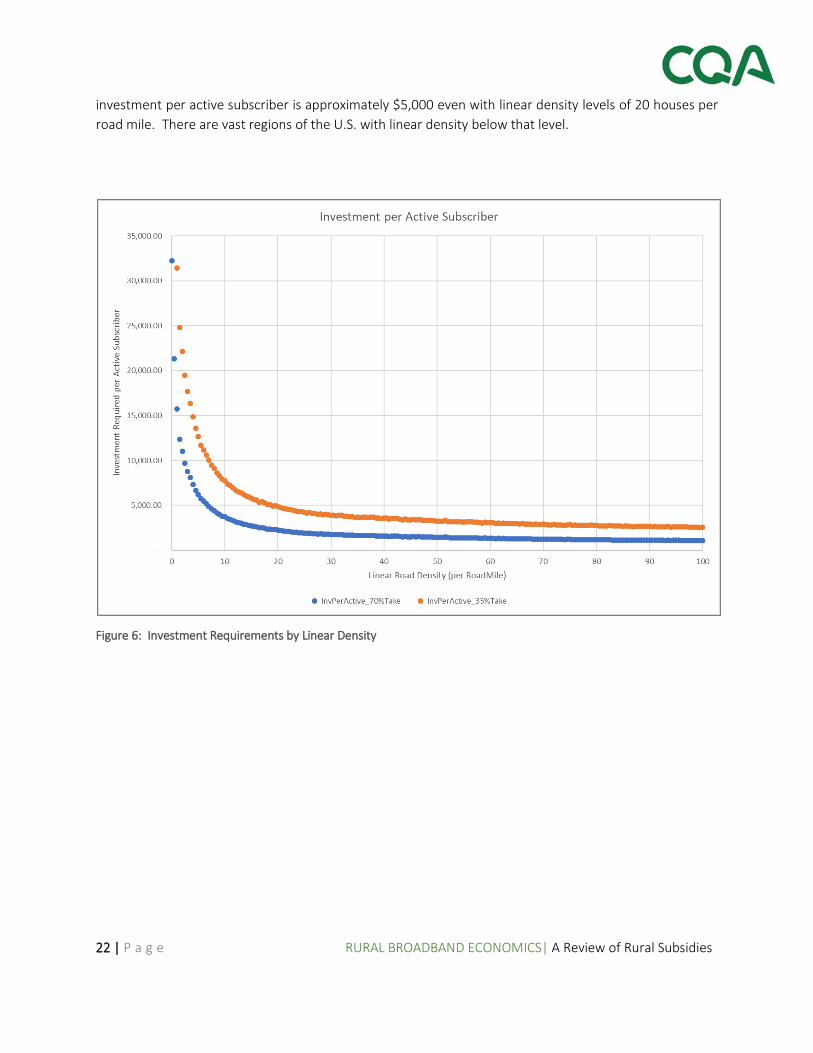
The economics of linear density are at the heart of the reason for vast regions of the U.S. being broadband uneconomic (in the absence of subsidies of some kind). In Figure 6, the average investment requirements to provide fiber based broadband service per active household are shown based on the linear density of the Census Block Group in which the household is located. The blue dots provide the value when the active count of households (per household passed) is at 70%. The orange dots show the escalation that occurs when the active service percentage drops in half. For example, with a household “take” rate of 35%, the
50 “Uneconomic” represents those areas where the typical monthly costs will exceed the expected revenue.
22 | P a g e RURAL BROADBAND ECONOMICS| A Review of Rural Subsidies
investment per active subscriber is approximately $5,000 even with linear density levels of 20 houses per road mile. There are vast regions of the U.S. with linear density below that level.
Figure 6: Investment Requirements by Linear Density
23 | P a g e RURAL BROADBAND ECONOMICS| A Review of Rural Subsidies
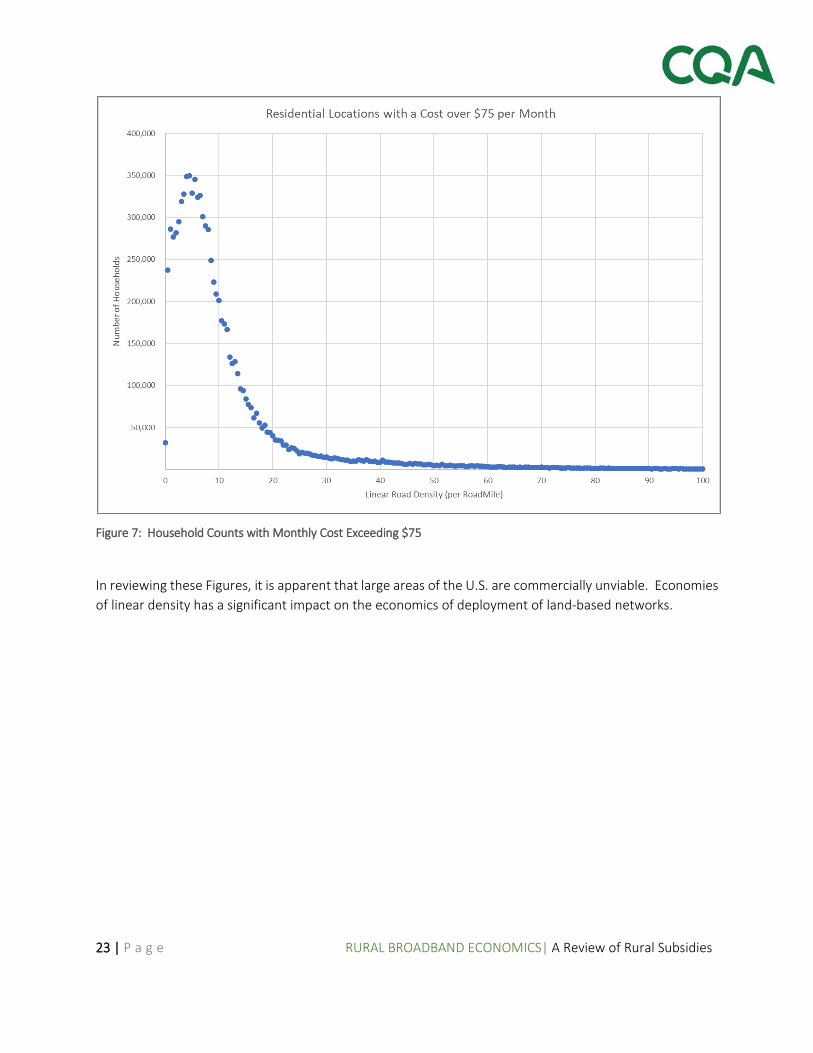
Figure 7: Household Counts with Monthly Cost Exceeding $75
In reviewing these Figures, it is apparent that large areas of the U.S. are commercially unviable. Economies of linear density has a significant impact on the economics of deployment of land-based networks.
24 | P a g e RURAL BROADBAND ECONOMICS| A Review of Rural Subsidies
MODERN SUBSIDIES FOR LOW-DENSITY COMMUNICATIONS NETWORKS As previously described, subsidy requirements in the communication marketplace historically had been addressed with numerous approaches including: cross subsidies from urban areas to rural areas, cross subsidies from business to residential, cross subsidies from long distance changes to local service, federal High Cost Support, RUS grants and low interest loans, and state USF programs. In recent years, the Federal Government provided grants for broadband buildout under the Broadband Technology and Opportunities Program (administered by NTIA)51 and the Broadband Initiatives Program (administered by RUS).52
Communications subsidy programs have changed over time and continue to evolve. This evolution is driven in part by the inability of carriers to maintain internal cross subsidies in a competitive marketplace and in a marketplace where long distance revenue (an important historical source of cross-subsidy) has become negligible. In 2011 the FCC announced the Connect America Fund (CAF), which was a recommendation of the National Broadband Plan. The Connect America Fund is a collection of subsidy efforts that overhaul the historical USF funding efforts.53 First the FCC instituted new funds for PriceCap and Rate of Return carrier programs. These funds were based on the forward-looking cost of a full-fiber network. The FCC has followed up on these landline-based funds with a CAFII support auction that is scheduled to occur in the summer of 2018.54 In addition to the landline programs, the CAF effort also includes the mobility infrastructure and auction programs.
Communications subsidies also exist via the U.S. Department of Agriculture, Rural Utilities Services (USDA, RUS). These programs include Distance Learning and Telemedicine grants; Farm Bill Broadband Loans and Loan Guarantee program; Telecommunications Infrastructure Loans and Loan Guarantees; Community Connect Grants.55 Even “Smart Grid” financing programs enable the deployment of fiber assets that can in turn be leveraged for the delivery of broadband services.56 And in the latest U.S. Omnibus Budget bill, Congress and the President have allocated $600M to USDA to fund programs to expand broadband coverage in Rural America.
51 National Telecommunications and Information Administration, available at https://www.ntia.doc.gov/category/broadband-technology-opportunities-program “The Broadband Technology Opportunities Program (BTOP) is an approximately $4 billion grant program administered by NTIA to help bridge the technological divide; create jobs; and improve education, health care, and public safety in communities across the country. Funded by the American Recovery and Reinvestment Act of 2009, BTOP projects are deploying broadband Internet infrastructure, enhancing and expanding public computer centers, and encouraging the sustainable adoption of broadband service.” 52 USDA, Rural Development, available at https://www.rd.usda.gov/programs-services/rural-broadband-access-loan-and-loan-guarantee “The Rural Broadband Access Loan and Loan Guarantee Program (Broadband Program) furnishes loans and loan guarantees to provide funds for the costs of construction, improvement, or acquisition of facilities and equipment needed to provide service at the broadband lending speed in eligible rural areas.” 53 In re Connect American Fund, FCC 11-161, released Nov. 18, 2011. 54 FCC public notice # 18-253, see, e.g., http://wireless.fcc.gov/auctions/default.htm?job=auctions_home 55 https://www.rd.usda.gov/programs-services/all-programs/telecom-programs 56 See RUS Electric Programs, “Leveraging Smart Grid Investments for Rural Broadband Deployment,” available at https://www.rd.usda.gov/files/UEP_RUSSmartGrid_BOC.pdf. See also https://www.rd.usda.gov/files/UEP_RUSSmartGrid_BOC.pdf
25 | P a g e RURAL BROADBAND ECONOMICS| A Review of Rural Subsidies
Beyond the actions of the federal government, some states implemented programs to encourage the deployment of high speed broadband within their states. New York, as an example, just completed a $500M broadband auction that provided up to 80% of the funds required to deploy high speed service.57 This program has allowed New York to claim that 99.0% of its residential structures will have access to broadband service with speeds in excess of 100Mbps for downloads and 99.9% will have access to broadband service with speeds in excess of 25Mbps for downloads. We are also aware that Pennsylvania, Ohio, Wisconsin, Georgia, and Missouri (to name a few) have developed, or are in the process of developing, broadband grant and/or auction programs.
Below the state level, a number of cities have entered into public-private partnership with providers to roll out broadband services within their cities. City contributions have ranged from access to city infrastructure and simplified permitting to sharing in the cost of deployment.
ECONOMIES OF SCOPE One last cost topic is worth noting. Economies of scope is the multiproduct analogy to economies of scale. It exists when the cost of jointly producing two or more products (or services) is less than the sum of the costs of producing them separately.58 It arises when a company faces shared, joint or common costs then leverages those costs (and the corresponding corporate structures and internal services) across multiple products. As with any cost advantage, it is generally good for the firm and its customers.
However, when the firm has significant market power in one market, it could be an issue when that firm expands into other markets. In particular, when a firm has a franchise protected monopoly in one market regulators and antitrust authorities have often constrained or precluded that firm’s activities outside the original rate-regulated market (with the franchise protected monopoly). Indeed, this was the rationale for the FCC’s computer inquiries I, II, and III for 30 years.59 The FCC wrestled with concerns of AT&T subsidizing competitive activities (particularly data processing and other forms of non-communications computing) with revenues from its regulated services. Similarly, in the modified final judgement60 (MFJ and decisions by Judge Green in its aftermath) involving the divestiture of AT&T and the Bell system, Regional Bell Companies were precluded from offering inter-LATA 61 long distance calling and from manufacturing telecommunications devises.
In each instance, it was AT&T/Bell System’s significant market power in local distribution (and originally long distance) and the franchise protected (at the time) monopoly that caused regulators and antitrust authorities to preclude certain activities in other markets – even when economies of scope would likely have given AT&T/Bell System cost advantages (via economies of scope) in those new markets/industries.
57 See, e.g., https://nysbroadband.ny.gov/sites/default/files/phase_2_bidders_ppt_0.pdf 58 See, e.g., Allen et al. (2013). Managerial economics: Theory application and cases (8th ed.). New York, NY: W.W. Norton & Co p. 189-191. 59 These inquiries began on November 9, 1966, Notice of Inquiry, In the Matter of Regulatory and Policy Problems Presented by the Interdependence of Computer and Communications Services and Facilities (Docket F.C.C. No. 16979). 60 See United States v. Western Electric Co., Inc., 569 Fed. Supp. 1057 (1983) (Modified Final Judgment, MFJ). 61 Local Access Transport Areas, geographic regions established in the aftermath of AT&T divestiture.
26 | P a g e RURAL BROADBAND ECONOMICS| A Review of Rural Subsidies
The telecommunications landscape changed drastically in 1996. The first sentence of The Telecommunications Act of 1996 (TA96) states “[a]n Act to promote competition …” and significant changes were made in the industry to promote competition.62 However, even in this new competitive environment, the Telecommunications Act still prohibits cross-subsidization of competitive services.63
In the modern intersection of related industries, when contemplating competitive fairness (for example in the distribution of subsidies for broadband): is it possible for other firms to enter the primary market of the firm seeking the subsidy? If the answer is “no” the traditional competitive concerns of the FCC are still germane.
CONCLUSION Like any investment project, delivering broadband to a rural area requires positive net present value (and higher IRR than competing projects); without an expectation of passing this financial hurdle, firms will be unable to undertake such a project. Broadband communications networks (like other networks) exhibit economies of linear density. As illustrated above, linear density varies dramatically in United States with vast regions of the country having very low density.
Only three options (or some combination thereof) are possible in such low-density areas: exist: 1) prices are higher in low density areas to reflect higher costs; 2) service is not offered in low density areas since demand is insufficient to cover the higher costs; and/or 3) the higher costs of providing service are subsidized (at least partially). The public and the FCC are disinclined to accept higher prices in rural areas (which often have lower incomes). The remaining choice is between subsidizing broadband, by some method, or leaving the most rural areas of the U.S. without broadband service.
The reality of the economics of linear density in rural areas is illustrated in other network industries: water distribution; sewer systems; natural gas distribution, roads, and electric power. Because of the closeness of substitute services, water distribution, sewer systems and natural gas distribution are virtually non-existent in the most rural regions of the U.S. (and subsidies exist for their alternatives - wells and septic systems). However, for roads, electric power and communications, no close substitutes exist. Therefore, these three network industries require subsidies in order for service to exist in the most rural regions of the U.S.
In telecommunications historically cross-subsidies (by a single firm, and later between firms) were employed to achieve public policy objectives (such as universal service). However, such implicit subsidies relied upon rate-of-return regulation and significant market power and are unsustainable in modern competitive communications markets. The form of the explicit subsidy could, at least in theory, vary. The
62 Telecommunications Act of 1996, Pub. L. No. 104-104, 110 Stat. 56 (1996) (codified in scattered sections of 47 U.S.C.). The term “competition” (or variations thereof) appears 68 time in the Act. For example, sec 101, Part II is entitled ` --DEVELOPMENT OF COMPETITIVE MARKETS”. This was accomplished in part via: 1) required physical interconnection; 2) forced unbundling of network components for sale to competitors; and 3) ability of competitors to purchase retail services of incumbents at a discount (to resell). 63 Sec 241, (k) SUBSIDY OF COMPETITIVE SERVICES PROHIBITED

27 | P a g e RURAL BROADBAND ECONOMICS| A Review of Rural Subsidies
explicit subsidy could take the form of access to low-cost infrastructure, low interest loans, loan guarantees, up-front payments, on-going payments and/or other mechanisms.
If a potential service provider claims to be able to offer broadband without a subsidy in such areas, it could only do so by leveraging economies of scope from subsidies to other services, or the provision of other services with significant market power (probably a rate of return regulated service). Such leveraging has been a concern to regulators, including the FCC, for decades.