Embed Size (px)
Citation preview
City of London Academy 1
S2 SAMPLING AND HYPOTHESIS TESTING PAST QUESTIONS
1. Explain what you understand by
(a) a population, (1)
(b) a statistic. (1)
A researcher took a sample of 100 voters from a certain town and asked them who they would
vote for in an election. The proportion who said they would vote for Dr Smith was 35%.
(c) State the population and the statistic in this case. (2)
(d) Explain what you understand by the sampling distribution of this statistic. (1)
(Total 5 marks)
2. A bag contains a large number of coins. It contains only 1p and 2p coins in the ratio 1:3
(a) Find the mean μ and the variance σ2 of the values of this population of coins.
(3)
A random sample of size 3 is taken from the bag.
(b) List all the possible samples. (2)
(c) Find the sampling distribution of the mean value of the samples. (6)
(Total 11 marks)
City of London Academy 2
3. A random sample X1, X2, ... Xn is taken from a population with unknown mean μ and unknown
variance σ2. A statistic Y is based on this sample.
(a) Explain what you understand by the statistic Y. (2)
(b) Explain what you understand by the sampling distribution of Y. (1)
(c) State, giving a reason which of the following is not a statistic based on this sample.
(i)
n
i
i
n
XX
1
2)–( (ii)
n
li
iX2
–
(iii)
n
li
iX 2
(2)
(Total 5 marks)
4. (a) Explain what you understand by a census. (1)
Each cooker produced at GT Engineering is stamped with a unique serial number. GT
Engineering produces cookers in batches of 2000. Before selling them, they test a random
sample of 5 to see what electric current overload they will take before breaking down.
(b) Give one reason, other than to save time and cost, why a sample is taken rather than a
census. (1)
(c) Suggest a suitable sampling frame from which to obtain this sample. (1)
(d) Identify the sampling units. (1)
(Total 4 marks)
City of London Academy 3
5. Before introducing a new rule the secretary of a golf club decided to find out how members
might react to this rule.
(a) Explain why the secretary decided to take a random sample of club members rather than
ask all the members. (1)
(b) Suggest a suitable sampling frame. (1)
(c) Identify the sampling units. (1)
(Total 3 marks)
6. A bag contains a large number of coins. Half of them are 1p coins, one third are 2p coins and
the remainder are 5p coins.
(a) Find the mean and variance of the value of the coins. (4)
A random sample of 2 coins is chosen from the bag.
(b) List all the possible samples that can be drawn. (3)
(c) Find the sampling distribution of the mean value of these samples. (6)
(Total 13 marks)
7. Explain what you understand by
(a) a sampling unit, (1)
(b) a sampling frame, (1)
City of London Academy 4
(c) a sampling distribution. (2)
(Total 4 marks)
8. (a) Explain what you understand by (i) a population and (ii) a sampling frame. (2)
The population and the sampling frame may not be the same.
(b) Explain why this might be the case. (1)
(c) Give an example, justifying your choices, to illustrate when you might use
(i) a census,
(ii) a sample. (4)
(Total 7 marks)
9. Explain briefly what you understand by
(a) a sampling frame, (1)
(b) a statistic. (2)
(Total 3 marks)
10. A large dental practice wishes to investigate the level of satisfaction of its patients.
(a) Suggest a suitable sampling frame for the investigation. (1)

City of London Academy 5
(b) Identify the sampling units. (1)
(c) State one advantage and one disadvantage of using a sample survey rather than a census. (2)
(d) Suggest a problem that might arise with the sampling frame when selecting patients. (1)
(Total 5 marks)
City of London Academy 6
11. A magazine has a large number of subscribers who each pay a membership fee that is due on
January 1st each year. Not all subscribers pay their fee by the due date. Based on
correspondence from the subscribers, the editor of the magazine believes that 40% of
subscribers wish to change the name of the magazine. Before making this change the editor
decides to carry out a sample survey to obtain the opinions of the subscribers. He uses only
those members who have paid their fee on time.
(a) Define the population associated with the magazine. (1)
(b) Suggest a suitable sampling frame for the survey. (1)
(c) Identify the sampling units. (1)
(d) Give one advantage and one disadvantage that would have resulted from the editor using
a census rather than a sample survey. (2)
As a pilot study the editor took a random sample of 25 subscribers.
(e) Assuming that the editor’s belief is correct, find the probability that exactly 10 of these
subscribers agreed with changing the name. (3)
In fact only 6 subscribers agreed to the name being changed.
(f) Stating your hypotheses clearly test, at the 5% level of significance, whether or not the
percentage agreeing to the change is less that the editor believes. (5)
The full survey is to be carried out using 200 randomly chosen subscribers.
(g) Again assuming the editor’s belief to be correct and using a suitable approximation, find
the probability that in this sample there will be least 71 but fewer than 83 subscribers who
agree to the name being changed. (7)
(Total 20 marks)
City of London Academy 7
12. An athletics teacher has kept careful records over the past 20 years of results from school sports
days. There are always 10 competitors in the javelin competition. Each competitor is allowed 3
attempts and the teacher has a record of the distances thrown by each competitor at each
attempt. The random variable D represents the greatest distance thrown by each competitor and
the random variable A represents the number of the attempt in which the competitor achieved
their greatest distance.
(a) State which of the two random variables D or A is continuous. (1)
A new athletics coach wishes to take a random sample of the records of 36 javelin competitors.
(b) Specify a suitable sampling frame and explain how such a sample could be taken. (2)
The coach assumes that P(A = 2) = 31 , and is therefore surprised to find that 20 of the 36
competitors in the sample achieved their greatest distance on their second attempt.
Using a suitable approximation, and assuming that P(A = 2) = 31 ,
(c) find the probability that at least 20 of the competitors achieved their greatest distance on
their second attempt. (6)
(d) Comment on the assumption that P(A = 2) = 31 .
(2)
(Total 11 marks)
13. A company has a large number of regular users logging onto its website. On average 4 users
every hour fail to connect to the company’s website at their first attempt.
(a) Explain why the Poisson distribution may be a suitable model in this case. (1)
Find the probability that, in a randomly chosen 2 hour period,
(b) (i) all users connect at their first attempt,
(ii) at least 4 users fail to connect at their first attempt. (5)
City of London Academy 8
The company suffered from a virus infecting its computer system. During this infection it was
found that the number of users failing to connect at their first attempt, over a 12 hour period,
was 60.
(c) Using a suitable approximation, test whether or not the mean number of users per hour
who failed to connect at their first attempt had increased. Use a 5% level of significance
and state your hypotheses clearly. (9)
(Total 15 marks)
14. A company claims that a quarter of the bolts sent to them are faulty. To test this claim the
number of faulty bolts in a random sample of 50 is recorded.
(a) Give two reasons why a binomial distribution may be a suitable model for the number of
faulty bolts in the sample. (2)
(b) Using a 5% significance level, find the critical region for a two-tailed test of the
hypothesis that the probability of a bolt being faulty is 4
1. The probability of rejection in
either tail should be as close as possible to 0.025 (3)
(c) Find the actual significance level of this test. (2)
In the sample of 50 the actual number of faulty bolts was 8.
(d) Comment on the company’s claim in the light of this value. Justify your answer. (2)
The machine making the bolts was reset and another sample of 50 bolts was taken. Only 5 were
found to be faulty.
(e) Test at the 1% level of significance whether or not the probability of a faulty bolt has
decreased. State your hypotheses clearly. (6)
(Total 15 marks)
City of London Academy 9
15. (a) Define the critical region of a test statistic. (2)
A discrete random variable x has a Binomial distribution B(30, p). A single observation is used
to test H0 : p = 0.3 against H1 : p ≠ 0.3
(b) Using a 1% level of significance find the critical region of this test. You should state the
probability of rejection in each tail which should be as close as possible to 0.005 (5)
(c) Write down the actual significance level of the test. (1)
The value of the observation was found to be 15.
(d) Comment on this finding in light of your critical region. (2)
(Total 10 marks)
16. An effect of a certain disease is that a small number of the red blood cells are deformed. Emily
has this disease and the deformed blood cells occur randomly at a rate of 2.5 per ml of her
blood. Following a course of treatment, a random sample of 2 ml of Emily’s blood is found to
contain only 1 deformed red blood cell.
Stating your hypotheses clearly and using a 5% level of significance, test whether or not there
has been a decrease in the number of deformed red blood cells in Emily’s blood. (Total 6 marks)
17. Past records suggest that 30% of customers who buy baked beans from a large supermarket buy
them in single tins. A new manager questions whether or not there has been a change in the
proportion of customers who buy baked beans in single tins. A random sample of 20 customers
who had bought baked beans was taken.
(a) Using a 10% level of significance, find the critical region for a two-tailed test to answer
the manager’s question. You should state the probability of rejection in each tail which
should be less than 0.05. (5)
City of London Academy 10
(b) Write down the actual significance level of a test based on your critical region from part
(a). (1)
The manager found that 11 customers from the sample of 20 had bought baked beans in single
tins.
(c) Comment on this finding in the light of your critical region found in part (a). (2)
(Total 8 marks)
18. A single observation x is to be taken from a Binomial distribution B(20, p).
This observation is used to test H0 : p = 0.3 against H1 : p ≠ 0.3
(a) Using a 5% level of significance, find the critical region for this test. The probability of
rejecting either tail should be as close as possible to 2.5%. (3)
(b) State the actual significance level of this test. (2)
The actual value of x obtained is 3.
(c) State a conclusion that can be drawn based on this value giving a reason for your answer. (2)
(Total 7 marks)
19. A web server is visited on weekdays, at a rate of 7 visits per minute. In a random one minute on
a Saturday the web server is visited 10 times.
(a) (i) Test, at the 10% level of significance, whether or not there is evidence that the rate
of visits is greater on a Saturday than on weekdays. State your hypotheses clearly.
(ii) State the minimum number of visits required to obtain a significant result. (7)
City of London Academy 11
(b) State an assumption that has been made about the visits to the server. (1)
In a random two minute period on a Saturday the web server is visited 20 times.
(c) Using a suitable approximation, test at the 10% level of significance, whether or not the
rate of visits is greater on a Saturday. (6)
(Total 14 marks)
20. A test statistic has a Poisson distribution with parameter λ.
Given that
H0 : λ = 9, H1 : λ ≠ 9
(a) find the critical region for the test statistic such that the probability in each tail is as close
as possible to 2.5%. (3)
(b) State the probability of incorrectly rejecting H0 using this critical region.
(2)
(Total 5 marks)
21. Dhriti grows tomatoes. Over a period of time, she has found that there is a probability 0.3 of a
ripe tomato having a diameter greater than 4 cm. She decides to try a new fertiliser. In a random
sample of 40 ripe tomatoes, 18 have a diameter greater than 4 cm. Dhriti claims that the new
fertiliser has increased the probability of a ripe tomato being greater than 4 cm in diameter.
Test Dhriti’s claim at the 5% level of significance. State your hypotheses clearly. (Total 7 marks)
22. (a) Explain what you understand by
(i) a hypothesis test,
(ii) a critical region. (3)
City of London Academy 12
During term time, incoming calls to a school are thought to occur at a rate of 0.45 per minute.
To test this, the number of calls during a random 20 minute interval, is recorded.
(b) Find the critical region for a two-tailed test of the hypothesis that the number of incoming
calls occurs at a rate of 0.45 per 1 minute interval. The probability in each tail should be
as close to 2.5% as possible. (5)
(c) Write down the actual significance level of the above test. (1)
In the school holidays, 1 call occurs in a 10 minute interval.
(d) Test, at the 5% level of significance, whether or not there is evidence that the rate of
incoming calls is less during the school holidays than in term time. (5)
(Total 14 marks)
23. Bacteria are randomly distributed in a river at a rate of 5 per litre of water. A new factory opens
and a scientist claims it is polluting the river with bacteria. He takes a sample of 0.5 litres of
water from the river near the factory and finds that it contains 7 bacteria. Stating your
hypotheses clearly test, at the 5% level of significance, the claim of the scientist. (Total 7 marks)
24. Linda regularly takes a taxi to work five times a week. Over a long period of time she finds the
taxi is late once a week. The taxi firm changes her driver and Linda thinks the taxi is late more
often. In the first week, with the new driver, the taxi is late 3 times.
You may assume that the number of times a taxi is late in a week has a Binomial distribution.
Test, at the 5% level of significance, whether or not there is evidence of an increase in the
proportion of times the taxi is late. State your hypotheses clearly. (Total 7 marks)
City of London Academy 13
25. Past records from a large supermarket show that 20% of people who buy chocolate bars buy the
family size bar. On one particular day a random sample of 30 people was taken from those that
had bought chocolate bars and 2 of them were found to have bought a family size bar.
(a) Test at the 5% significance level, whether or not the proportion p, of people who bought a
family size bar of chocolate that day had decreased. State your hypotheses clearly. (6)
The manager of the supermarket thinks that the probability of a person buying a gigantic
chocolate bar is only 0.02. To test whether this hypothesis is true the manager decides to take a
random sample of 200 people who bought chocolate bars.
(b) Find the critical region that would enable the manager to test whether or not there is
evidence that the probability is different from 0.02. The probability of each tail should be
as close to 2.5% as possible. (6)
(c) Write down the significance level of this test. (1)
(Total 13 marks)
26. Breakdowns occur on a particular machine at random at a mean rate of 1.25 per week.
(a) Find the probability that fewer than 3 breakdowns occurred in a randomly chosen week. (4)
Over a 4 week period the machine was monitored. During this time there were 11 breakdowns.
(b) Test, at the 5% level of significance, whether or not there is evidence that the rate of
breakdowns has changed over this period. State your hypotheses clearly. (7)
(Total 11 marks)
27. It is known from past records that 1 in 5 bowls produced in a pottery have minor defects. To
monitor production a random sample of 25 bowls was taken and the number of such bowls with
defects was recorded.
City of London Academy 14
(a) Using a 5% level of significance, find critical regions for a two-tailed test of the
hypothesis that 1 in 5 bowls have defects. The probability of rejecting, in either tail,
should be as close to 2.5% as possible. (6)
(b) State the actual significance level of the above test. (1)
At a later date, a random sample of 20 bowls was taken and 2 of them were found to have
defects.
(c) Test, at the 10% level of significance, whether or not there is evidence that the proportion
of bowls with defects has decreased. State your hypotheses clearly. (7)
(Total 14 marks)
28. A teacher thinks that 20% of the pupils in a school read the Deano comic regularly.
He chooses 20 pupils at random and finds 9 of them read Deano.
(a) (i) Test, at the 5% level of significance, whether or not there is evidence that the
percentage of pupils that read Deano is different from 20%. State your hypotheses
clearly.
(ii) State all the possible numbers of pupils that read Deano from a sample of size 20
that will make the test in part (a)(i) significant at the 5% level. (9)
The teacher takes another 4 random samples of size 20 and they contain 1, 3, 1 and 4 pupils that
read Deano.
(b) By combining all 5 samples and using a suitable approximation test, at the 5% level of
significance, whether or not this provides evidence that the percentage of pupils in the
school that read Deano is different from 20%. (8)
(c) Comment on your results for the tests in part (a) and part (b). (2)
(Total 19 marks)
City of London Academy 15
29. In an experiment, there are 250 trials and each trial results in a success or a failure.
(a) Write down two other conditions needed to make this into a binomial experiment. (2)
It is claimed that 10% of students can tell the difference between two brands of baked beans. In
a random sample of 250 students, 40 of them were able to distinguish the difference between the
two brands.
(b) Using a normal approximation, test at the 1% level of significance whether or not the
claim is justified. Use a one-tailed test. (6)
(c) Comment on the acceptability of the assumptions you needed to carry out the test. (2)
(Total 10 marks)
30. Over a long period of time, accidents happened on a stretch of road at random at a rate of 3 per
month.
Find the probability that
(a) in a randomly chosen month, more than 4 accidents occurred, (3)
(b) in a three-month period, more than 4 accidents occurred. (2)
At a later date, a speed restriction was introduced on this stretch of road. During a randomly
chosen month only one accident occurred.
(c) Test, at the 5% level of significance, whether or not there is evidence to support the claim
that this speed restriction reduced the mean number of road accidents occurring per
month. (4)
City of London Academy 16
The speed restriction was kept on this road. Over a two-year period, 55 accidents occurred.
(d) Test, at the 5% level of significance, whether or not there is now evidence that this speed
restriction reduced the mean number of road accidents occurring per month. (7)
(Total 16 marks)
31. Brad planted 25 seeds in his greenhouse. He has read in a gardening book that the probability of
one of these seeds germinating is 0.25. Ten of Brad’s seeds germinated. He claimed that the
gardening book had underestimated this probability. Test, at the 5% level of significance,
Brad’s claim. State your hypotheses clearly. (Total 7 marks)
32. (a) Explain what you understand by a critical region of a test statistic. (2)
The number of breakdowns per day in a large fleet of hire cars has a Poisson distribution with
mean 7
1.
(b) Find the probability that on a particular day there are fewer than 2 breakdowns. (3)
(c) Find the probability that during a 14-day period there are at most 4 breakdowns. (3)
The cars are maintained at a garage. The garage introduced a weekly check to try to decrease the
number of cars that break down. In a randomly selected 28-day period after the checks are
introduced, only 1 hire car broke down.
(d) Test, at the 5% level of significance, whether or not the mean number of breakdowns has
decreased. State your hypotheses clearly. (7)
(Total 15 marks)
City of London Academy 17
33. Vehicles pass a particular point on a road at a rate of 51 vehicles per hour.
(a) Give two reasons to support the use of the Poisson distribution as a suitable model for the
number of vehicles passing this point. (2)
Find the probability that in any randomly selected 10 minute interval
(b) exactly 6 cars pass this point, (3)
(c) at least 9 cars pass this point. (2)
After the introduction of a roundabout some distance away from this point it is suggested that
the number of vehicles passing it has decreased. During a randomly selected 10 minute interval
4 vehicles pass the point.
(d) Test, at the 5% level of significance, whether or not there is evidence to support the
suggestion that the number of vehicles has decreased. State your hypotheses clearly. (6)
(Total 13 marks)
34. From past records a manufacturer of ceramic plant pots knows that 20% of them will have
defects. To monitor the production process, a random sample of 25 pots is checked each day
and the number of pots with defects is recorded.
(a) Find the critical regions for a two-tailed test of the hypothesis that the probability that a
plant pot has defects is 0.20. The probability of rejection in either tail should be as close
as possible to 2.5%. (5)
(b) Write down the significance level of the above test. (1)
City of London Academy 18
A garden centre sells these plant pots at a rate of 10 per week. In an attempt to increase sales,
the price was reduced over a six-week period. During this period a total of 74 pots was sold.
(c) Using a 5% level of significance, test whether or not there is evidence that the rate of
sales per week has increased during this six-week period. (7)
(Total 13 marks)
35. A single observation x is to be taken from a Poisson distribution with parameter . This
observation is to be used to test H0 : = 7 against H1 : 7.
(a) Using a 5% significance level, find the critical region for this test assuming that the
probability of rejecting in either tail is as close as possible to 2.5%. (5)
(b) Write down the significance level of this test. (1)
The actual value of x obtained was 5.
(c) State a conclusion that can be drawn based on this value. (2)
(Total 8 marks)
36. From past records a manufacturer of glass vases knows that 15% of the production have slight
defects. To monitor the production, a random sample of 20 vases is checked each day and the
number of vases with slight defects is recorded.
(a) Using a 5% significance level, find the critical regions for a two-tailed test of the
hypothesis that the probability of a vase with slight defects is 0.15. The probability of
rejecting, in either tail, should be as close as possible to 2.5%. (5)
(b) State the actual significance level of the test described in part (a). (1)
A shop sells these vases at a rate of 2.5 per week. In the 4 weeks of December the shop sold 15
vases.
(c) Stating your hypotheses clearly test, at the 5% level of significance, whether or not
there is evidence that the rate of sales per week had increased in December. (6)
(Total 12 marks)
MARK SCHEME
1. (a) A population is collection of all items B1 1
Note
B1 – collection/group all items – need to have /imply all eg
entire/complete/every
(b) (A random variable) that is a function of the sample which contains B1 1
City of London Academy 19
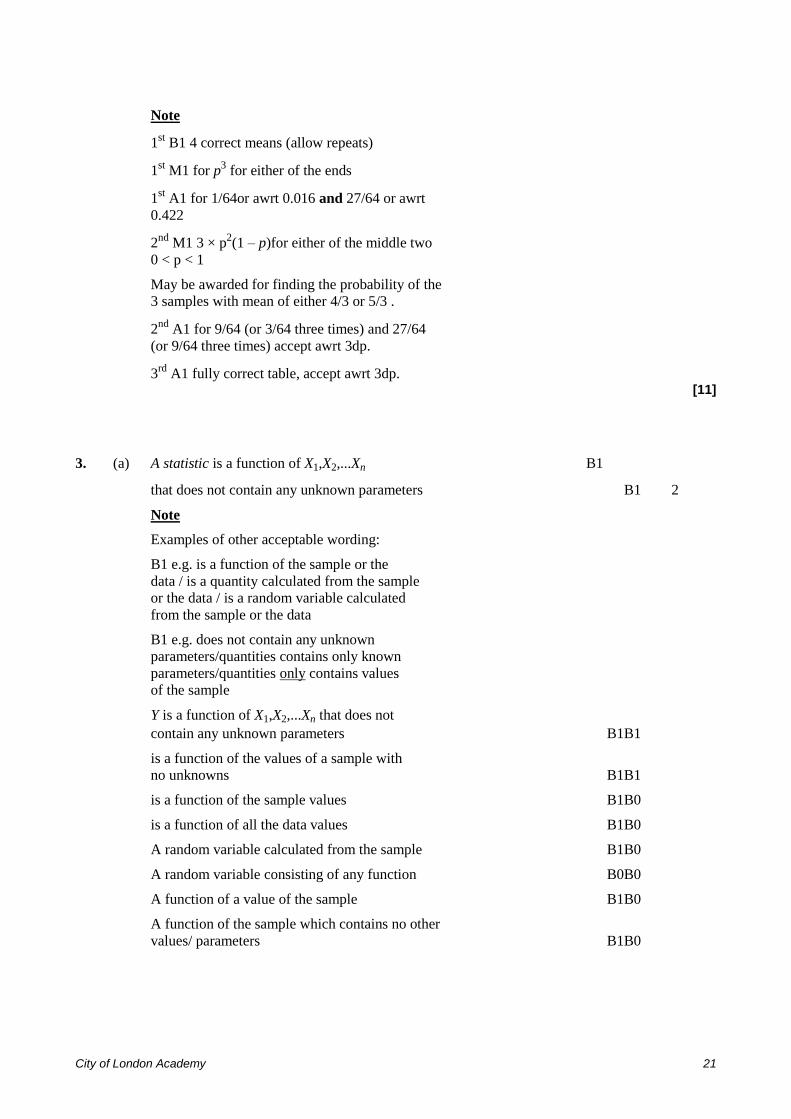
no unknown quantities/parameters.
Note
B1 – needs function/calculation(o.e.) of the sample/random
variables/observations and no unknown quantities/parameters(o.e.)
NB do not allow unknown variables
e.g. “A calculation based solely on observations from a given sample.” B1
“A calculation based only on known data from a sample” B1
“A calculation based on known observations from a sample” B0
Solely/only imply no unknown quantities
(c) The voters in the town B1
Percentage/proportion voting for Dr Smith B1 2
Note
B1 – Voters
Do not allow 100 voters.
B1 – percentage/ proportion voting (for Dr Smith)
the number of people voting (for Dr Smith)
Allow 35% of people voting (for Dr Smith)
Allow 35 people voting (for Dr Smith)
Do not allow 35% or 35 alone
(d) Probability Distribution of those voting for Dr Smith from all B1 1
possible samples (of size 100)
Note
B1 – answers must include all three of these features
(i) All possible samples,
(ii) their associated probabilities,
(iii) context of voting for Dr Smith.
e.g “It is all possible values of the percentage and their associated
probabilities.” B0 no context [5]
City of London Academy 20
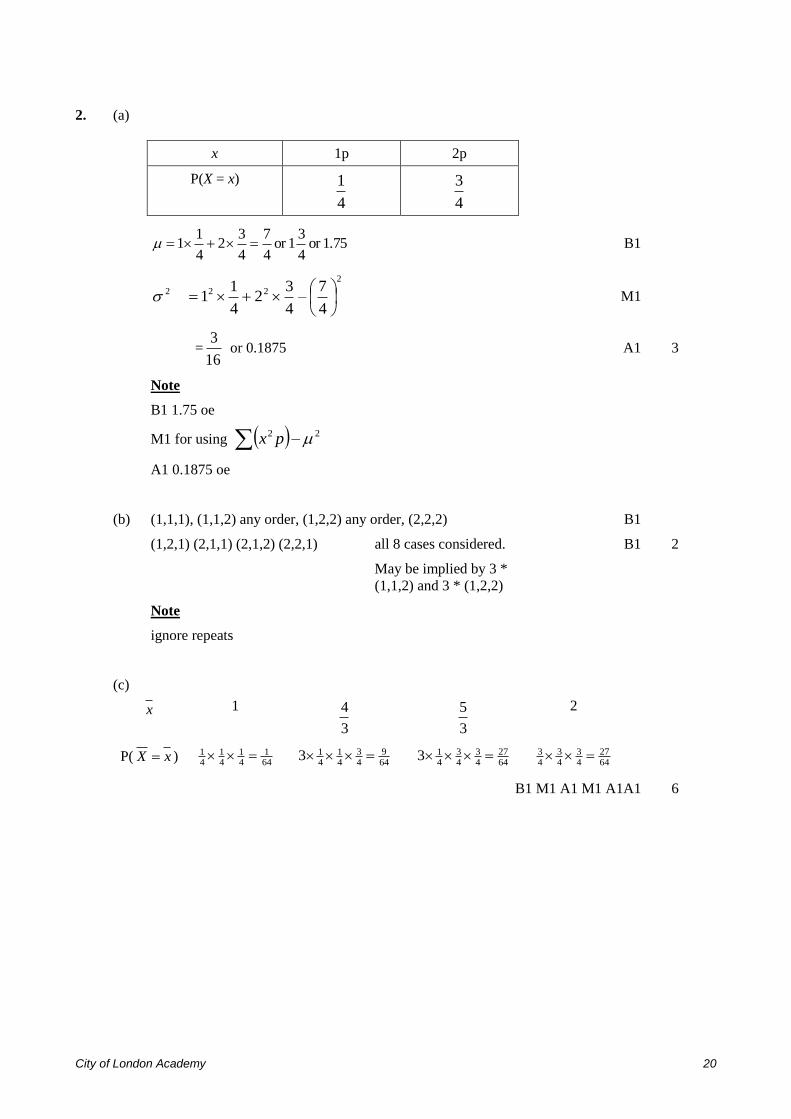
2. (a)
x 1p 2p
P(X = x)
4
1
4
3
1.75or 4
31or
4
7
4
32
4
11 B1
2
222
4
7–
4
32
4
11
M1
=16
3 or 0.1875 A1 3
Note
B1 1.75 oe
M1 for using 22 – px
A1 0.1875 oe
(b) (1,1,1), (1,1,2) any order, (1,2,2) any order, (2,2,2) B1
(1,2,1) (2,1,1) (2,1,2) (2,2,1) all 8 cases considered. B1 2
May be implied by 3 *
(1,1,2) and 3 * (1,2,2)
Note
ignore repeats
(c)
x 1
3
4
3
5
2
P( xX ) 641
41
41
41
64
9
4
3
41
413
64
27
4
3
4
3
413
64
27
4
3
4
3
4
3
B1 M1 A1 M1 A1A1 6
City of London Academy 21
Note
1st B1 4 correct means (allow repeats)
1st M1 for p
3 for either of the ends
1st A1 for 1/64or awrt 0.016 and 27/64 or awrt
0.422
2nd
M1 3 × p2(1 – p)for either of the middle two
0 < p < 1
May be awarded for finding the probability of the
3 samples with mean of either 4/3 or 5/3 .
2nd
A1 for 9/64 (or 3/64 three times) and 27/64
(or 9/64 three times) accept awrt 3dp.
3rd
A1 fully correct table, accept awrt 3dp. [11]
3. (a) A statistic is a function of X1,X2,...Xn B1
that does not contain any unknown parameters B1 2
Note
Examples of other acceptable wording:
B1 e.g. is a function of the sample or the
data / is a quantity calculated from the sample
or the data / is a random variable calculated
from the sample or the data
B1 e.g. does not contain any unknown
parameters/quantities contains only known
parameters/quantities only contains values
of the sample
Y is a function of X1,X2,...Xn that does not
contain any unknown parameters B1B1
is a function of the values of a sample with
no unknowns B1B1
is a function of the sample values B1B0
is a function of all the data values B1B0
A random variable calculated from the sample B1B0
A random variable consisting of any function B0B0
A function of a value of the sample B1B0
A function of the sample which contains no other
values/ parameters B1B0
City of London Academy 22
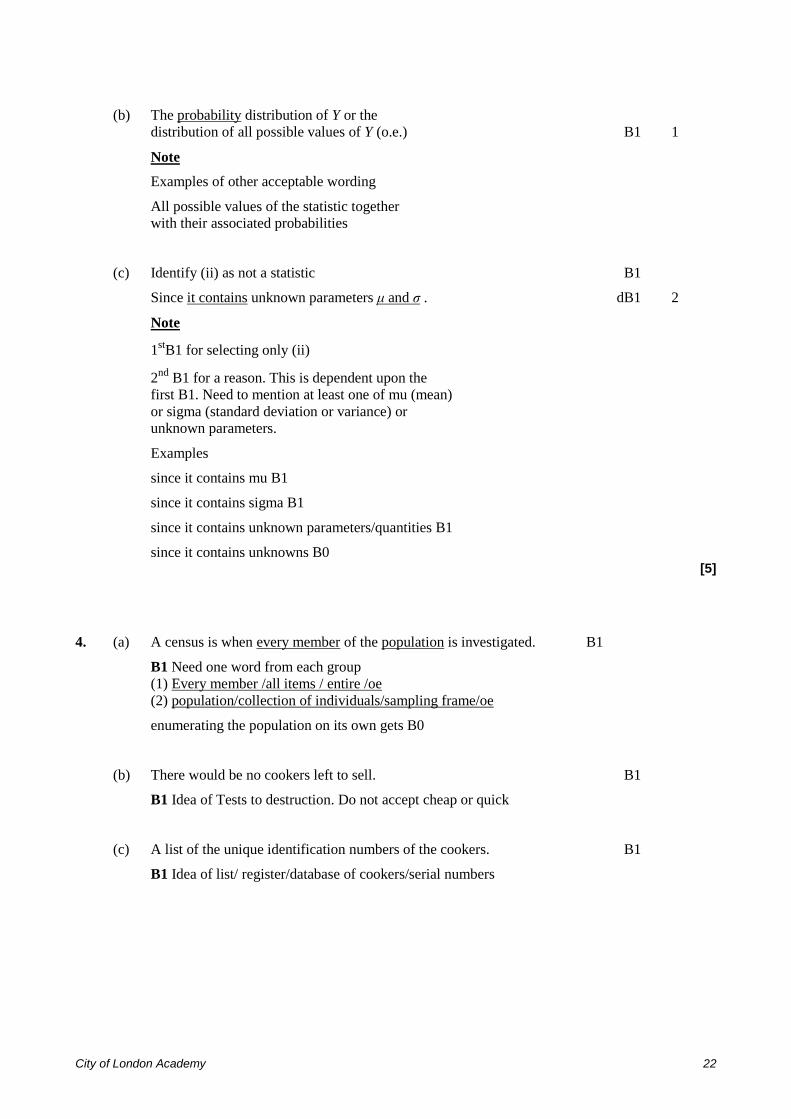
(b) The probability distribution of Y or the
distribution of all possible values of Y (o.e.) B1 1
Note
Examples of other acceptable wording
All possible values of the statistic together
with their associated probabilities
(c) Identify (ii) as not a statistic B1
Since it contains unknown parameters μ and σ . dB1 2
Note
1stB1 for selecting only (ii)
2nd
B1 for a reason. This is dependent upon the
first B1. Need to mention at least one of mu (mean)
or sigma (standard deviation or variance) or
unknown parameters.
Examples
since it contains mu B1
since it contains sigma B1
since it contains unknown parameters/quantities B1
since it contains unknowns B0 [5]
4. (a) A census is when every member of the population is investigated. B1
B1 Need one word from each group
(1) Every member /all items / entire /oe
(2) population/collection of individuals/sampling frame/oe
enumerating the population on its own gets B0
(b) There would be no cookers left to sell. B1
B1 Idea of Tests to destruction. Do not accept cheap or quick
(c) A list of the unique identification numbers of the cookers. B1
B1 Idea of list/ register/database of cookers/serial numbers
City of London Academy 23
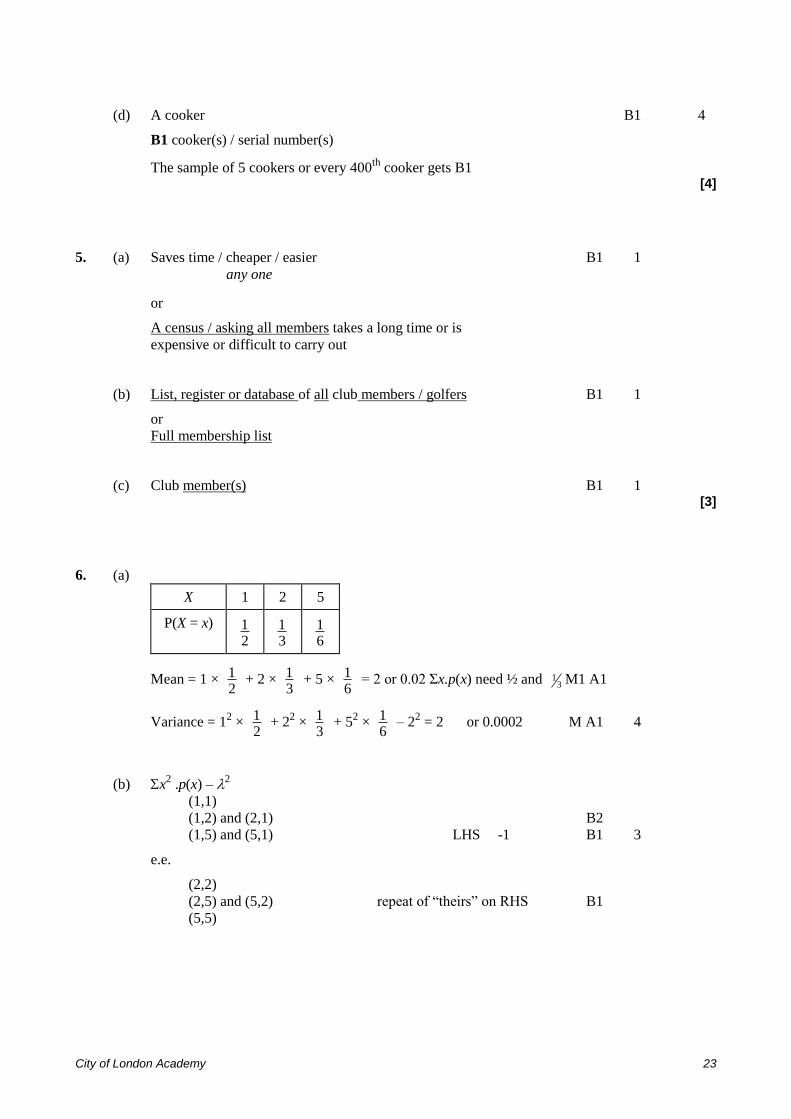
(d) A cooker B1 4
B1 cooker(s) / serial number(s)
The sample of 5 cookers or every 400th
cooker gets B1 [4]
5. (a) Saves time / cheaper / easier B1 1
any one
or
A census / asking all members takes a long time or is
expensive or difficult to carry out
(b) List, register or database of all club members / golfers B1 1
or
Full membership list
(c) Club member(s) B1 1 [3]
6. (a)
X 1 2 5
P(X = x)
21
31
61
Mean = 1 × 21 + 2 ×
31 + 5 ×
61 = 2 or 0.02 Σx.p(x) need ½ and 3
1 M1 A1
Variance = 12 ×
21 + 2
2 ×
31 + 5
2 ×
61 – 2
2 = 2 or 0.0002 M A1 4
(b) x2 .p(x) – 2
(1,1)
(1,2) and (2,1) B2
(1,5) and (5,1) LHS -1 B1 3
e.e.
(2,2)
(2,5) and (5,2) repeat of “theirs” on RHS B1
(5,5)
City of London Academy 24
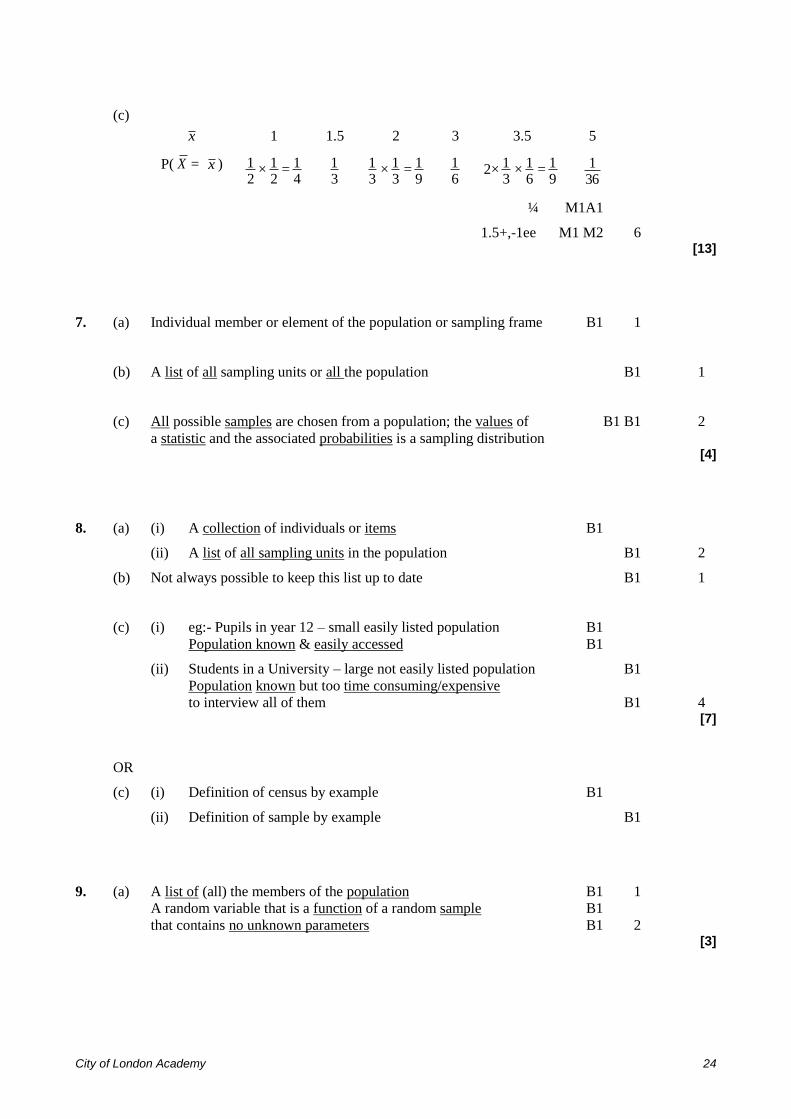
(c)
x 1 1.5 2 3 3.5 5
P( X = x ) 21 ×
21 =
41
31
31 ×
31 =
91
61 2×
31 ×
61 =
91
361
¼ M1A1
1.5+,-1ee M1 M2 6 [13]
7. (a) Individual member or element of the population or sampling frame B1 1
(b) A list of all sampling units or all the population B1 1
(c) All possible samples are chosen from a population; the values of B1 B1 2
a statistic and the associated probabilities is a sampling distribution [4]
8. (a) (i) A collection of individuals or items B1
(ii) A list of all sampling units in the population B1 2
(b) Not always possible to keep this list up to date B1 1
(c) (i) eg:- Pupils in year 12 – small easily listed population B1
Population known & easily accessed B1
(ii) Students in a University – large not easily listed population B1
Population known but too time consuming/expensive
to interview all of them B1 4 [7]
OR
(c) (i) Definition of census by example B1
(ii) Definition of sample by example B1
9. (a) A list of (all) the members of the population B1 1
A random variable that is a function of a random sample B1
that contains no unknown parameters B1 2 [3]
City of London Academy 25
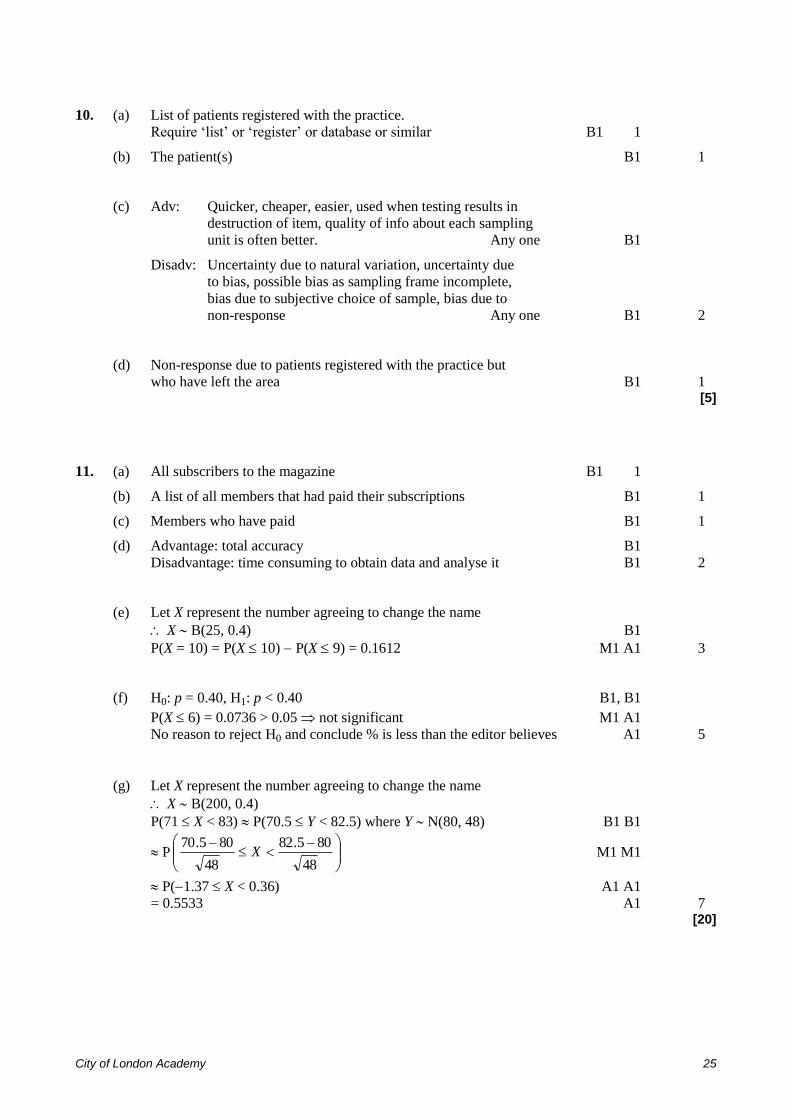
10. (a) List of patients registered with the practice.
Require ‘list’ or ‘register’ or database or similar B1 1
(b) The patient(s) B1 1
(c) Adv: Quicker, cheaper, easier, used when testing results in
destruction of item, quality of info about each sampling
unit is often better. Any one B1
Disadv: Uncertainty due to natural variation, uncertainty due
to bias, possible bias as sampling frame incomplete,
bias due to subjective choice of sample, bias due to
non-response Any one B1 2
(d) Non-response due to patients registered with the practice but
who have left the area B1 1 [5]
11. (a) All subscribers to the magazine B1 1
(b) A list of all members that had paid their subscriptions B1 1
(c) Members who have paid B1 1
(d) Advantage: total accuracy B1
Disadvantage: time consuming to obtain data and analyse it B1 2
(e) Let X represent the number agreeing to change the name
X B(25, 0.4) B1
P(X = 10) = P(X 10) P(X 9) = 0.1612 M1 A1 3
(f) H0: p = 0.40, H1: p < 0.40 B1, B1
P(X 6) = 0.0736 > 0.05 not significant M1 A1
No reason to reject H0 and conclude % is less than the editor believes A1 5
(g) Let X represent the number agreeing to change the name
X B(200, 0.4)
P(71 X < 83) P(70.5 Y < 82.5) where Y N(80, 48) B1 B1
P
48
805.82
48
805.70X M1 M1
P(1.37 X < 0.36) A1 A1
= 0.5533 A1 7 [20]
City of London Academy 26
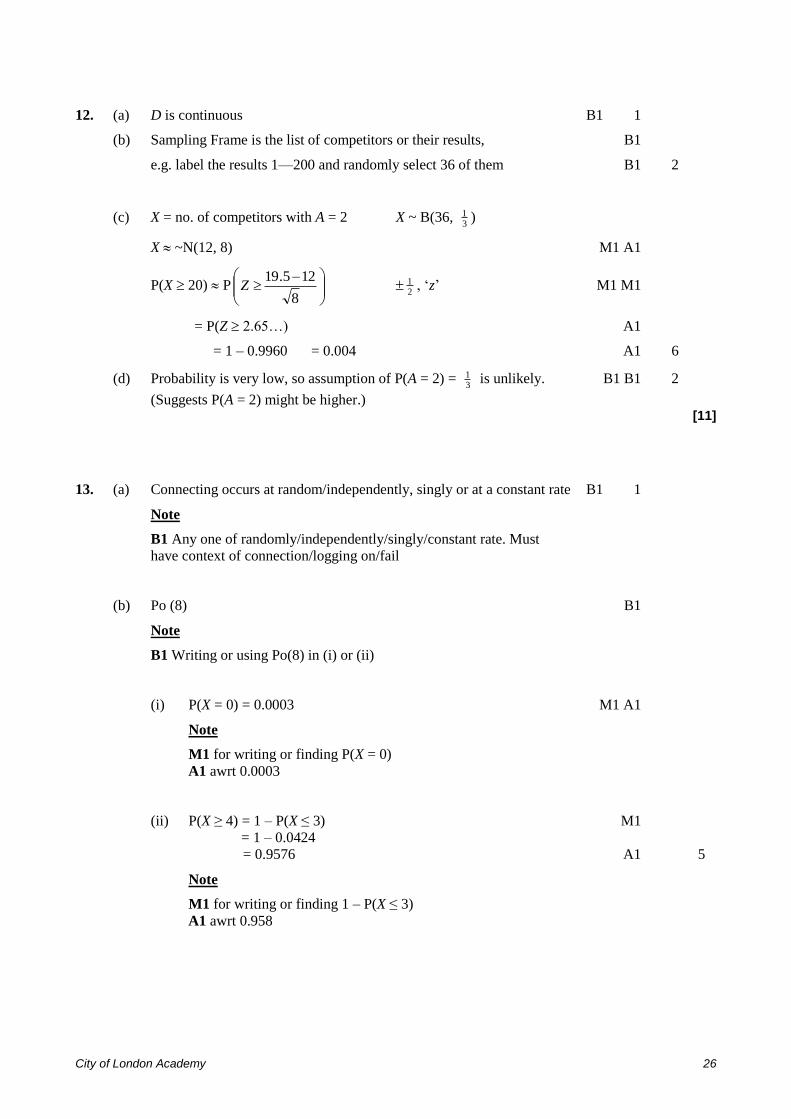
12. (a) D is continuous B1 1
(b) Sampling Frame is the list of competitors or their results, B1
e.g. label the results 1—200 and randomly select 36 of them B1 2
(c) X = no. of competitors with A = 2 X ~ B(36, 31 )
X ~N(12, 8) M1 A1
P(X 20) P
8
125.19Z
21 , ‘z’ M1 M1
= P(Z 2.65…) A1
= 1 – 0.9960 = 0.004 A1 6
(d) Probability is very low, so assumption of P(A = 2) = 31 is unlikely. B1 B1 2
(Suggests P(A = 2) might be higher.) [11]
13. (a) Connecting occurs at random/independently, singly or at a constant rate B1 1
Note
B1 Any one of randomly/independently/singly/constant rate. Must
have context of connection/logging on/fail
(b) Po (8) B1
Note
B1 Writing or using Po(8) in (i) or (ii)
(i) P(X = 0) = 0.0003 M1 A1
Note
M1 for writing or finding P(X = 0)
A1 awrt 0.0003
(ii) P(X ≥ 4) = 1 – P(X ≤ 3) M1
= 1 – 0.0424
= 0.9576 A1 5
Note
M1 for writing or finding 1 – P(X ≤ 3)
A1 awrt 0.958
City of London Academy 27
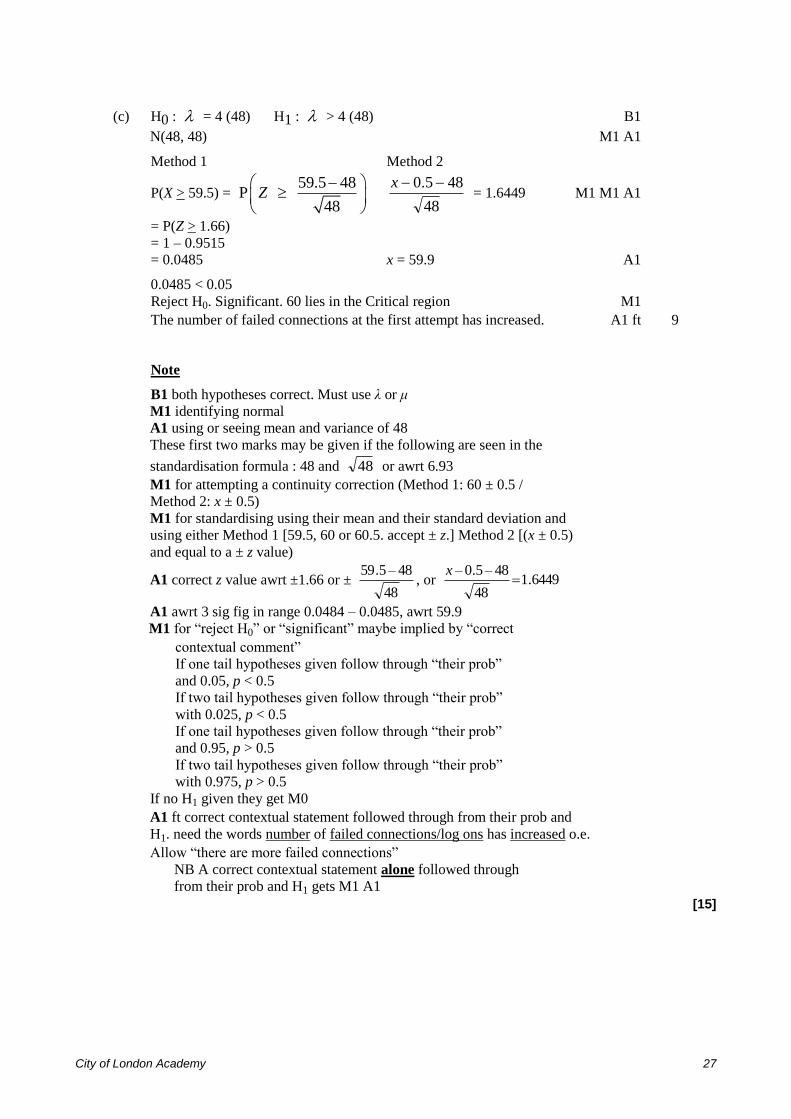
(c) H0 : = 4 (48) H1 : > 4 (48) B1
N(48, 48) M1 A1
Method 1 Method 2
P(X > 59.5) = 59.5 48
P 48
Z
48
485.0 x = 1.6449 M1 M1 A1
= P(Z > 1.66)
= 1 – 0.9515
= 0.0485 x = 59.9 A1
0.0485 < 0.05
Reject H0. Significant. 60 lies in the Critical region M1
The number of failed connections at the first attempt has increased. A1 ft 9
Note
B1 both hypotheses correct. Must use λ or μ
M1 identifying normal
A1 using or seeing mean and variance of 48
These first two marks may be given if the following are seen in the
standardisation formula : 48 and 48 or awrt 6.93
M1 for attempting a continuity correction (Method 1: 60 ± 0.5 /
Method 2: x ± 0.5)
M1 for standardising using their mean and their standard deviation and
using either Method 1 [59.5, 60 or 60.5. accept ± z.] Method 2 [(x ± 0.5)
and equal to a ± z value)
A1 correct z value awrt ±1.66 or ± 48
48–5.59, or 6449.1
48
48–5.0–
x
A1 awrt 3 sig fig in range 0.0484 – 0.0485, awrt 59.9
M1 for “reject H0” or “significant” maybe implied by “correct
contextual comment”
If one tail hypotheses given follow through “their prob”
and 0.05, p < 0.5
If two tail hypotheses given follow through “their prob”
with 0.025, p < 0.5
If one tail hypotheses given follow through “their prob”
and 0.95, p > 0.5
If two tail hypotheses given follow through “their prob”
with 0.975, p > 0.5
If no H1 given they get M0
A1 ft correct contextual statement followed through from their prob and
H1. need the words number of failed connections/log ons has increased o.e.
Allow “there are more failed connections”
NB A correct contextual statement alone followed through
from their prob and H1 gets M1 A1
[15]
City of London Academy 28
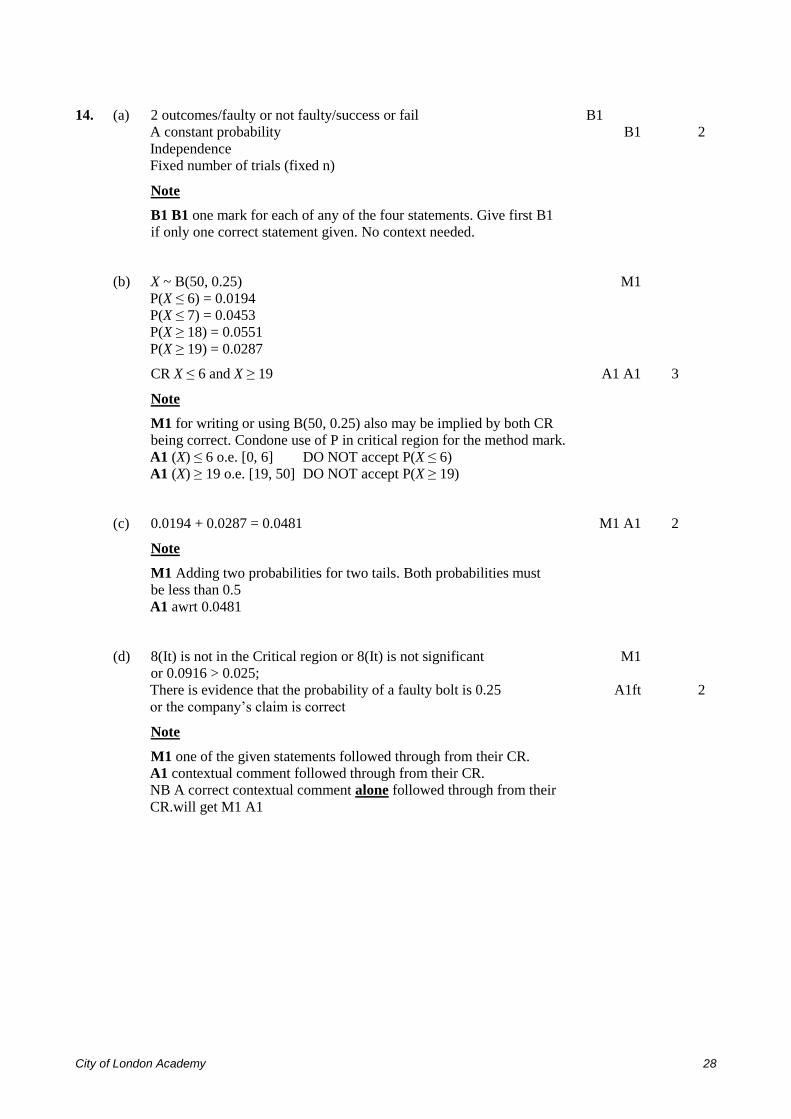
14. (a) 2 outcomes/faulty or not faulty/success or fail B1
A constant probability B1 2
Independence
Fixed number of trials (fixed n)
Note
B1 B1 one mark for each of any of the four statements. Give first B1
if only one correct statement given. No context needed.
(b) X ~ B(50, 0.25) M1
P(X ≤ 6) = 0.0194
P(X ≤ 7) = 0.0453
P(X ≥ 18) = 0.0551
P(X ≥ 19) = 0.0287
CR X ≤ 6 and X ≥ 19 A1 A1 3
Note
M1 for writing or using B(50, 0.25) also may be implied by both CR
being correct. Condone use of P in critical region for the method mark.
A1 (X) ≤ 6 o.e. [0, 6] DO NOT accept P(X ≤ 6)
A1 (X) ≥ 19 o.e. [19, 50] DO NOT accept P(X ≥ 19)
(c) 0.0194 + 0.0287 = 0.0481 M1 A1 2
Note
M1 Adding two probabilities for two tails. Both probabilities must
be less than 0.5
A1 awrt 0.0481
(d) 8(It) is not in the Critical region or 8(It) is not significant M1
or 0.0916 > 0.025;
There is evidence that the probability of a faulty bolt is 0.25 A1ft 2
or the company’s claim is correct
Note
M1 one of the given statements followed through from their CR.
A1 contextual comment followed through from their CR.
NB A correct contextual comment alone followed through from their
CR.will get M1 A1
City of London Academy 29
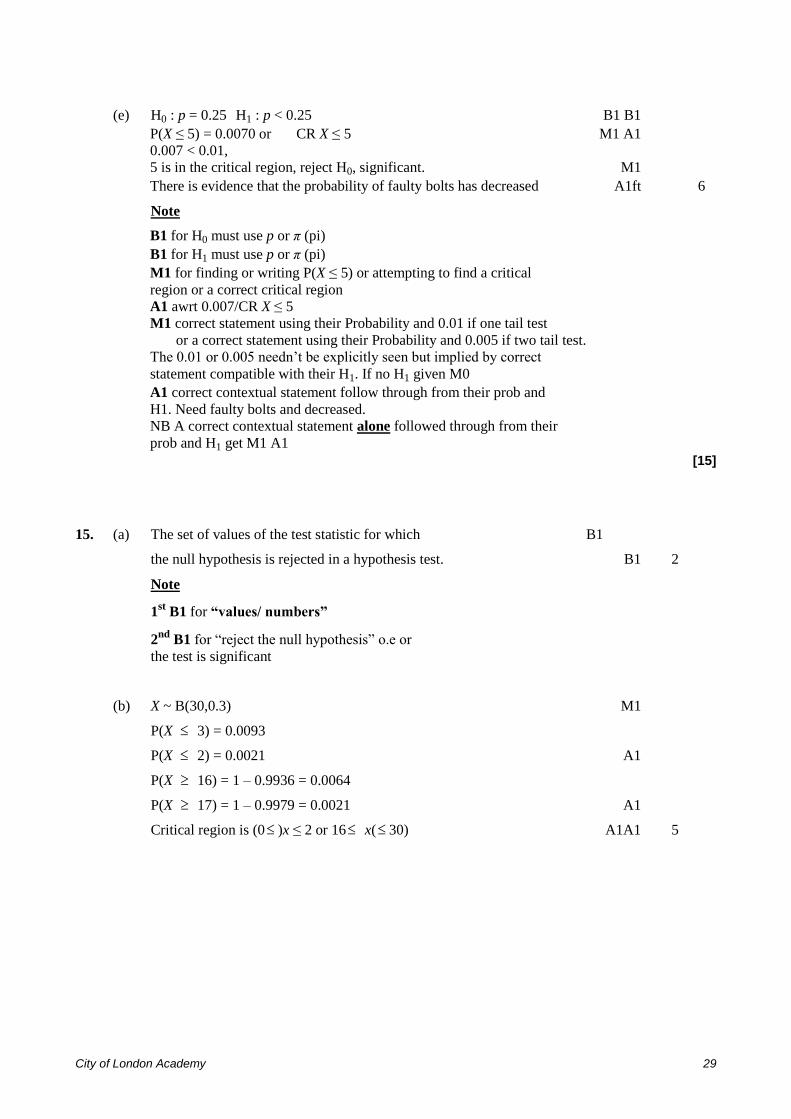
(e) H0 : p = 0.25 H1 : p < 0.25 B1 B1
P(X ≤ 5) = 0.0070 or CR X ≤ 5 M1 A1
0.007 < 0.01,
5 is in the critical region, reject H0, significant. M1
There is evidence that the probability of faulty bolts has decreased A1ft 6
Note
B1 for H0 must use p or π (pi)
B1 for H1 must use p or π (pi)
M1 for finding or writing P(X ≤ 5) or attempting to find a critical
region or a correct critical region
A1 awrt 0.007/CR X ≤ 5
M1 correct statement using their Probability and 0.01 if one tail test
or a correct statement using their Probability and 0.005 if two tail test.
The 0.01 or 0.005 needn’t be explicitly seen but implied by correct
statement compatible with their H1. If no H1 given M0
A1 correct contextual statement follow through from their prob and
H1. Need faulty bolts and decreased.
NB A correct contextual statement alone followed through from their
prob and H1 get M1 A1
[15]
15. (a) The set of values of the test statistic for which B1
the null hypothesis is rejected in a hypothesis test. B1 2
Note
1st
B1 for “values/ numbers”
2nd
B1 for “reject the null hypothesis” o.e or
the test is significant
(b) X ~ B(30,0.3) M1
P(X 3) = 0.0093
P(X 2) = 0.0021 A1
P(X 16) = 1 – 0.9936 = 0.0064
P(X 17) = 1 – 0.9979 = 0.0021 A1
Critical region is (0 )x ≤ 2 or 16 x( 30) A1A1 5
City of London Academy 30
Note
M1 for using B(30,0.3)
1st
A1 P(X 2) = 0.0021
2nd
A1 0.0064
3rd
A1 for (X) 2 or (X) < 3 They get A0 if they write
P(X 2/ X 3)
4th
A1 (X) 16 or (X) > 15 They get A0 if they write
P(X 16 X 15
NB these are B1 B1 but mark as A1 A1
16 X 2 etc is accepted
To describe the critical regions they can use any letter
or no letter at all. It does not have to be X.
(c) Actual significance level 0.0021+0.0064=0.0085 or 0.85% B1 1
Note
B1 correct answer only
(d) 15 (it) is not in the critical region Bft 2, 1, 0
not significant
No significant evidence of a change in P = 0.3
accept H0, (reject H1)
P(x 15) = 0.0169 2
Note
Follow through 15 and their critical region
B1 for any one of the 5 correct statements up
to a maximum of B2
– B1 for any incorrect statements [10]
City of London Academy 31
16. H0:λ = 2.5 (or λ = 5) H1: λ < 2.5 (or λ < 5) λ or μ B1B1
X ~ Po(5) M1
P(X 1) = 0.0404 or CR X 1 A1
[0.0404<0.05 ] this is significant or reject
H0 or it is in the critical region M1
There is evidence of a decrease in the (mean)
number/rate of deformed blood cells A1
Note
1st B1 for H0 must use lambda or mu; 5 or 2.5.
2nd
B1 for H1 must use lambda or mu; 5 or 2.5
1st M1 for use of Po(5) may be implied by
probability(must be used not just seen)
eg. P (X = 1) = 0.0404 – … would
score M1 A0
1st A1 for 0.0404 seen or correct CR
2nd
M1 for a correct statement (this may be
contextual) comparing their probability and 0.05
(or comparing 1 with their critical region).
Do not allow conflicting statements.
2nd
A1 is not a follow through. Need the word
decrease, number or rate and deformed blood
cells for contextual mark.
If they have used ≠ in H1 they could get B1 B0
M1 A1 M1A0 mark as above except they gain the
1stA1 for P(X 1) = 0.0404 or CR X 0
2nd
M1 for a correct statement (this may be contextual)
comparing their probability and 0.025 (or comparing 1
with their critical region)
They may compare with 0.95 (one tail method)
or 0.975 (one tail method) Probability is 0.9596. [6]
City of London Academy 32
17. (a) X ~ B(20, 0.3) M1
P(X 2) = 0.0355 A1
P(X 9) = 0.9520 so P(X 10) = 0.0480 A1
Therefore the critical region is
{X≤ 2}{X ≥10} A1A1 5
Note
M1 for B(20,0.3) seen or used
1st A1 for 0.0355
2nd
A1 for 0.048
3rd
A1 for (X) 2 or (X) < 3 or [0,2] They get A0 if they write
P(X 2/ X < 3)
4th
A1 (X) 10 or (X) > 9 or [10,20] They get A0 if they write
P(X ≥ 10/ X > 9) 10 ≤ X ≤ 2 etc is accepted
To describe the critical regions they can use any
letter or no letter at all. It does not have to be X.
(b) 0.0355 + 0.0480 = 0.0835 awrt (0.083 or 0.084) B1 1
Note
B1 correct answer only
(c) 11 is in the critical region B1ft
there is evidence of a change/ increase in
the proportion/number of customers buying
single tins B1ft 2
Note
1stB1 for a correct statement about 11 and
their critical region.
2nd
B1 for a correct comment in context
consistent with their CR and the value 11
Alternative
1st B0 P(X ≥ 11) = 1– 0.9829 = 0.0171 since
no comment about the critical region
2nd
B1 a correct contextual statement. [8]
City of London Academy 33
18. (a) X ~ B(20, 0.3) M1
P (X ≤ 2) = 0.0355
P(X ≥ 11) = 1 – 0.9829 = 0.0171
Critical region is (X ≤ 2) (X ≥ 11) A1 A1 3
(b) Significance level = 0.0355 + 0.0171, = 0.0526 or 5.26% M1 A1 2
(c) Insufficient evidence to reject H0 Or sufficient evidence to accept B1 ft
H0 /not significant
x = 3 (or the value) is not in the critical region or 0.1071> 0.025 B1 ft 2
Do not allow inconsistent comments [7]
19. (a) (i) H0 : λ = 7 H1 : λ > 7 B1
X = number of visits. X ~ Po(7) B1
P (X ≥ 10) = 1 – P(X ≤ 9) 1 – P(X ≤ 10) = 0.0985 M1
= 0.1695 1 – P(X ≤ 9) = 0.1695
CR X ≥ 11 A1
0.1695 > 0.10, CR X ≥ 11
Not significant or it is not in the critical region or
do not reject H0 M1
The rate of visits on a Saturday is not greater/ is unchanged A1 no ft
(ii) X = 11 B1 7
(b) (The visits occur) randomly/ independently or singly or constant rate B1 7
(c) [H0 : λ = 7 H1 : λ > 7 (or H0 : λ = 14 H1 : λ > 14)]
X ~N;(14,14) B1;B1
P (X ≥ 20) = P
14
14–19.5z +/– 0.5, stand M1 M1
= P (z ≥ 1.47)
= 0.0708 or z = 1.2816 A1dep both
M
0.0708 < 0.10 therefore significant. The rate of visits is greater A1dep 2nd
M 6
on a Saturday [14]
City of London Academy 34
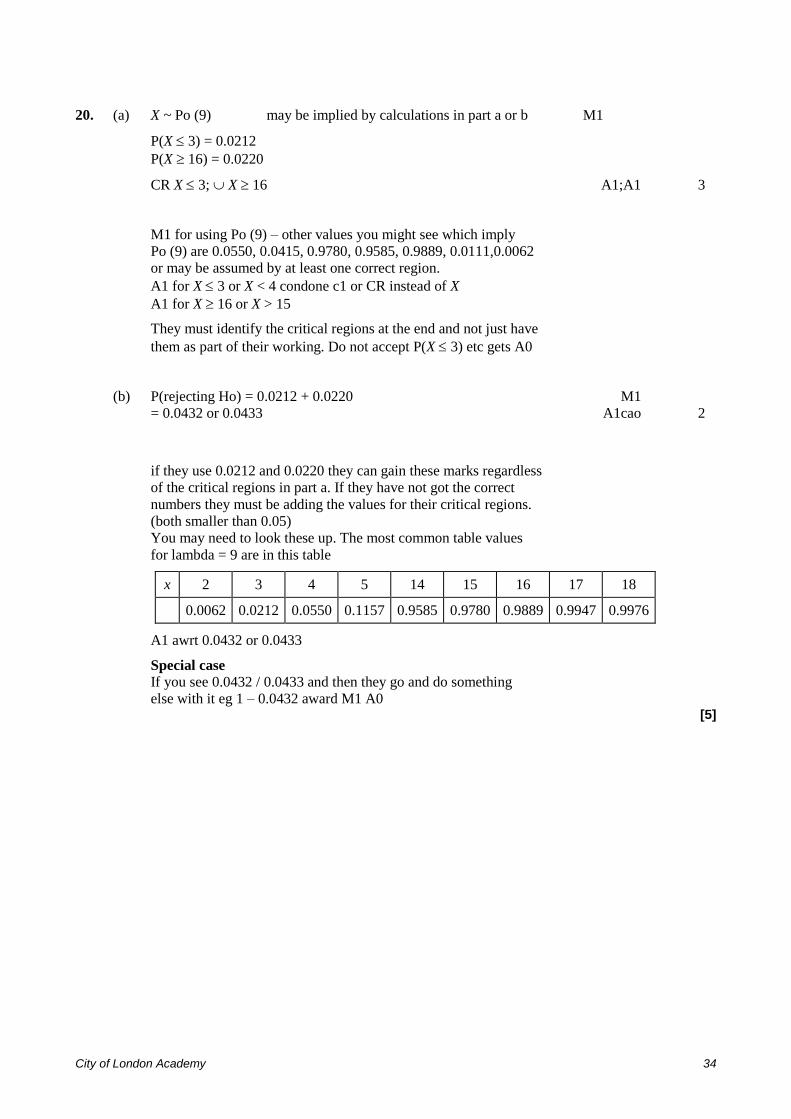
20. (a) X ~ Po (9) may be implied by calculations in part a or b M1
P(X 3) = 0.0212
P(X 16) = 0.0220
CR X 3; X 16 A1;A1 3
M1 for using Po (9) – other values you might see which imply
Po (9) are 0.0550, 0.0415, 0.9780, 0.9585, 0.9889, 0.0111,0.0062
or may be assumed by at least one correct region.
A1 for X 3 or X < 4 condone c1 or CR instead of X
A1 for X 16 or X > 15
They must identify the critical regions at the end and not just have
them as part of their working. Do not accept P(X 3) etc gets A0
(b) P(rejecting Ho) = 0.0212 + 0.0220 M1
= 0.0432 or 0.0433 A1cao 2
if they use 0.0212 and 0.0220 they can gain these marks regardless
of the critical regions in part a. If they have not got the correct
numbers they must be adding the values for their critical regions.
(both smaller than 0.05)
You may need to look these up. The most common table values
for lambda = 9 are in this table
x 2 3 4 5 14 15 16 17 18
0.0062 0.0212 0.0550 0.1157 0.9585 0.9780 0.9889 0.9947 0.9976
A1 awrt 0.0432 or 0.0433
Special case
If you see 0.0432 / 0.0433 and then they go and do something
else with it eg 1 – 0.0432 award M1 A0 [5]
City of London Academy 35
21. H0 : p = 0.3; H1 : p > 0.3 B1B1
Let X represent the number of tomatoes greater than 4 cm : X ~ B(40, 0.3) B1
P(X 18) = 1 – P(X 17) P(X 18) = 1 – P(X 17) = 0.0320 M1
P(X 17) = 1 – P(X 16) = 0.0633
= 0.0320 CR X 18 A1
0.0320 < 0.05 18 18 or 18 in the critical region
no evidence to Reject H0 or it is significant M1
New fertiliser has increased the probability of a tomato being greater B1d cao 7
than 4 cm
Or Dhriti’s claim is true
B1 for correct H0 . must use p or pi
B1 for correct H1 must use p and be one tail.
B1 using B(40, 0.3). This may be implied by their calculation
M1 attempt to find 1 – P(X ≤ 17) or get a correct probability.
For CR method must attempt to find P(X ≥ 18) or give the correct critical region
A1 awrt 0.032 or correct CR.
M1 correct statement based on their probability , H1 and 0.05
or a correct contextualised statement that implies that.
B1 this is not a follow through .conclusion in context. Must use the
words increased, tomato and some reference to size or diameter.
This is dependent on them getting the previous M1
If they do a two tail test they may get B1 B0 B1 M1 A1 M1 B0
For the second M1 they must have accept H0 or it is not significant or
a correct contextualised statement that implies that. [7]
22. (a) (i) A hypothesis test is a mathematical procedure to examine
a value of a population parameter proposed by the null
hypothesis compared with an alternative hypothesis. B1
B1 Method for deciding between 2 hypothesis.
(ii) The critical region is the range of values or a test statistic B1g
or region where the test is significant
that would lead to the rejection of H0. B1h 3
B1 range of values. This may be implied by other words.
Not region on its own
B1 which lead you to reject H0
Give the first B1 if only one mark awarded.
City of London Academy 36
(b) Let X represent the number of incoming calls : X ~ Po(9) B1
From table
P(X ≥ 16) = 0.0220 M1 A1
P(x < 3) = 0.0212 A1
Critical region (x ≤ 3 or x ≥ 16) B1 5
B1 using Po(9)
M1 attempting to find P(X 16) or P(X 3)
A1 0.0220 or P(X 16)
A1 0.0212 or P(X ≤ 3)
These 3 marks may be gained by seeing the numbers in part c
B1 correct critical region
A completely correct critical region will get all 5 marks.
Half of the correct critical region eg x ≤ 3 or x ≥ 17 say would
get B1 M1 A0 A1 B0 if the M1 A1 A1 not already awarded.
(c) Significance level = 0.0220 + 0.0212
= 0.0432 or 4.32% B1 1
B1 cao awrt 0.0432
(d) H0 : λ = 0.45; H1 : λ < 0.45 (accept : H0 : λ = 4.5; H1 : λ < 4.5) B1
Using X ~ Po(4.5) M1
P (X ≤ 1 ) = 0.0611 CR X < 0 awrt 0.0611 A1
0.0611 > 0.05. 1 ≥ 0 or 1not in the critical region M1
There is evidence to Accept H0 or it is not significant B1cao 5
There is no evidence that there are less calls during school holidays.
B1 may use λ or µ. Needs both H0 and H1
M1 using Po(4.5)
A1 correct probability or CR only
M1 correct statement based on their probability , H1 and 0.05
or a correct contextualised statement that implies that.
B1 this is not a follow through .Conclusion in context.
Must see the word calls in conclusion
If they get the correct CR with no evidence of using Po(4.5)
they will get M0 A0
SC If they get the critical region X ≤ 1 they score M1 for rejecting
H0 and B1 for concluding the rate of calls in the holiday is lower.
[14]
City of London Academy 37
23. One tail test
Method 1
H0: = 5 ( = 2.5) may use or B1
B1
H1: > 5 ( > 2.5) M1
X ~ Po (2.5) may be implied M1
P(X 7) = 1 – P(X 6)
= 1 – 0.9858
= 0.0142
0.0142 < 0.05
[P(X 5) = 1 – 0.8912 = 0.1088] att P(X 7)
P(X 6) = 1 – 0.9580 = 0.0420
CR X 6 awrt 0.0142
7 6 or 7 is in critical region or 7 is significant
P(X 6)
A1
M1
(Reject H0.) There is significant evidence at the 5% significance level that B1 7
the factory is polluting the river with bacteria.
or The scientists claim is justified
Method 2
H0: = 5 ( = 2.5) may use or B1
H1: > 5 ( > 2.5) B1
X ~ Po (2.5) may be implied M1
P(X < 7)
= 0.9858
0.9858 > 0.95
[P(X < 5) = 0.8912] att P(X < 7)
P(X < 6) = 0.9580
CR X 6 wrt 0.986
7 6 or 7 is in critical region or 7 is significant
P(X < 6)
M1A1
M1
(Reject H0.) There is significant evidence at the 5% significance level that B1
the factory is polluting the river with bacteria.
or The scientists claim is justified
City of London Academy 38
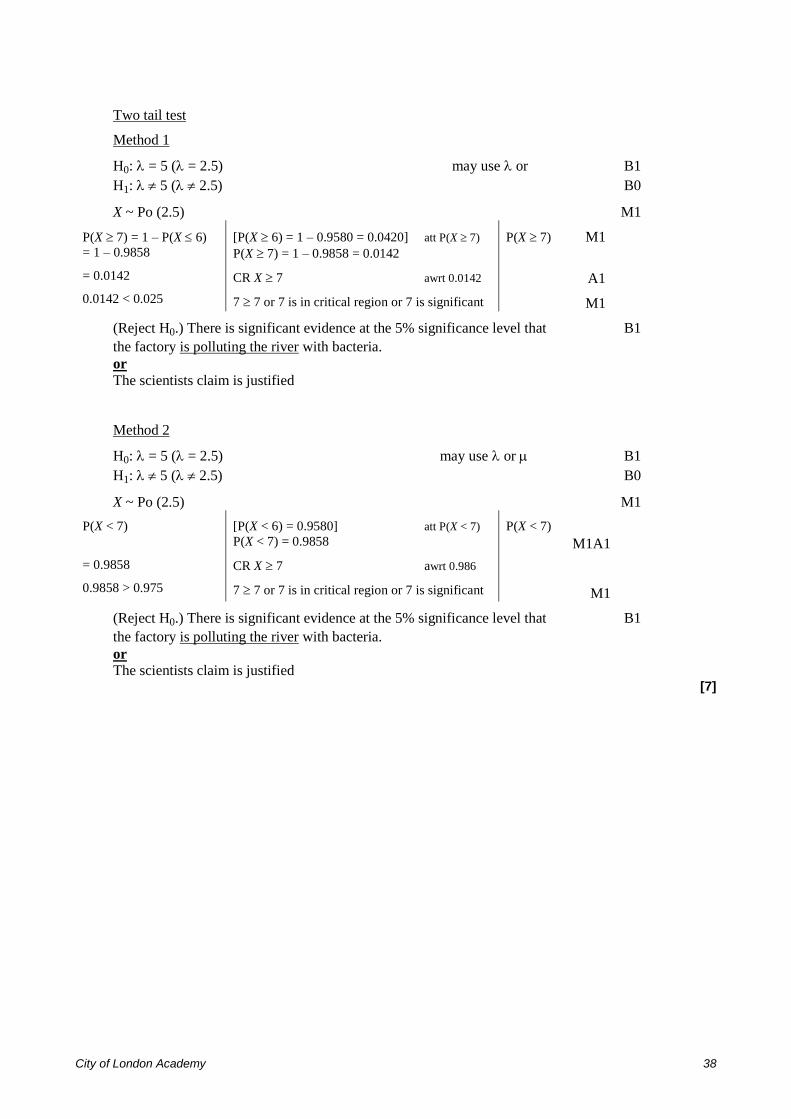
Two tail test
Method 1
H0: = 5 ( = 2.5) may use or B1
H1: 5 ( 2.5) B0
X ~ Po (2.5) M1
P(X 7) = 1 – P(X 6)
= 1 – 0.9858
= 0.0142
0.0142 < 0.025
[P(X 6) = 1 – 0.9580 = 0.0420] att P(X 7)
P(X 7) = 1 – 0.9858 = 0.0142
CR X 7 awrt 0.0142
7 7 or 7 is in critical region or 7 is significant
P(X 7) M1
A1
M1
(Reject H0.) There is significant evidence at the 5% significance level that B1
the factory is polluting the river with bacteria.
or The scientists claim is justified
Method 2
H0: = 5 ( = 2.5) may use or B1
H1: 5 ( 2.5) B0
X ~ Po (2.5) M1
P(X < 7)
= 0.9858
0.9858 > 0.975
[P(X < 6) = 0.9580] att P(X < 7)
P(X < 7) = 0.9858
CR X 7 awrt 0.986
7 7 or 7 is in critical region or 7 is significant
P(X < 7)
M1A1
M1
(Reject H0.) There is significant evidence at the 5% significance level that B1
the factory is polluting the river with bacteria.
or The scientists claim is justified
[7]
City of London Academy 39
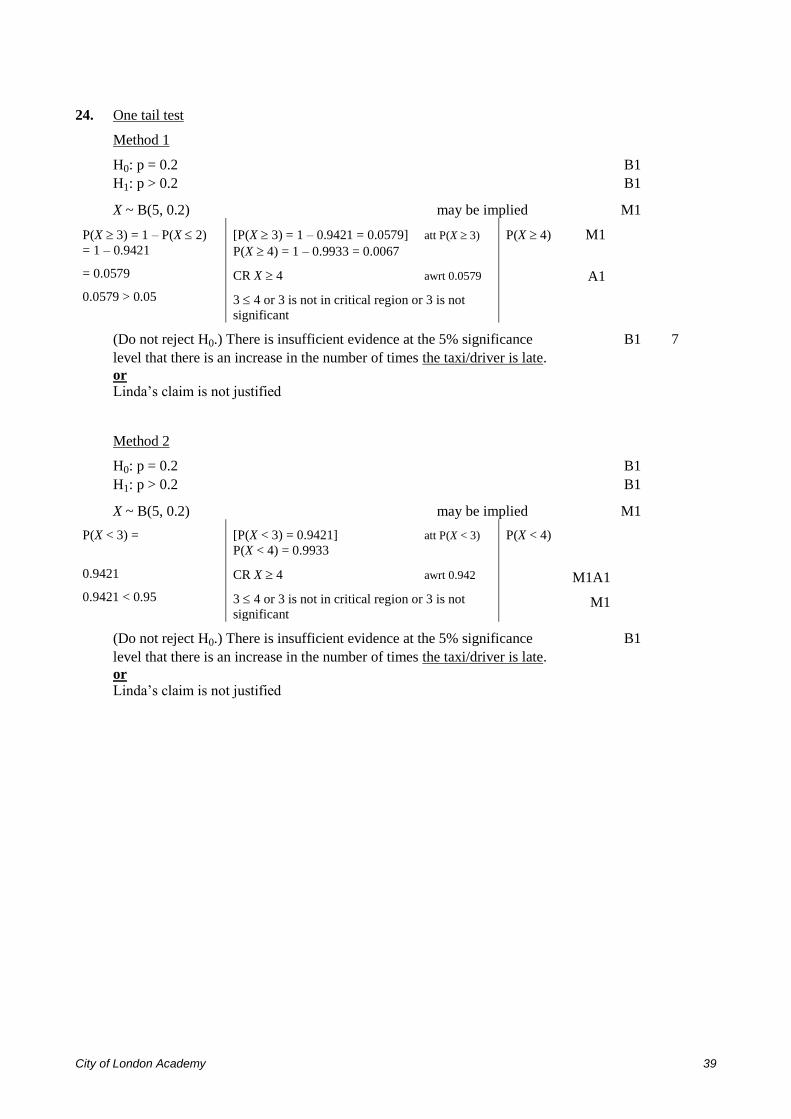
24. One tail test
Method 1
H0: p = 0.2 B1
H1: p > 0.2 B1
X ~ B(5, 0.2) may be implied M1
P(X 3) = 1 – P(X 2)
= 1 – 0.9421
= 0.0579
0.0579 > 0.05
[P(X 3) = 1 – 0.9421 = 0.0579] att P(X 3)
P(X 4) = 1 – 0.9933 = 0.0067
CR X 4 awrt 0.0579
3 4 or 3 is not in critical region or 3 is not
significant
P(X 4) M1
A1
(Do not reject H0.) There is insufficient evidence at the 5% significance B1 7
level that there is an increase in the number of times the taxi/driver is late.
or Linda’s claim is not justified
Method 2
H0: p = 0.2 B1
H1: p > 0.2 B1
X ~ B(5, 0.2) may be implied M1
P(X < 3) =
0.9421
0.9421 < 0.95
[P(X < 3) = 0.9421] att P(X < 3)
P(X < 4) = 0.9933
CR X 4 awrt 0.942
3 4 or 3 is not in critical region or 3 is not
significant
P(X < 4)
M1A1
M1
(Do not reject H0.) There is insufficient evidence at the 5% significance B1
level that there is an increase in the number of times the taxi/driver is late.
or Linda’s claim is not justified
City of London Academy 40
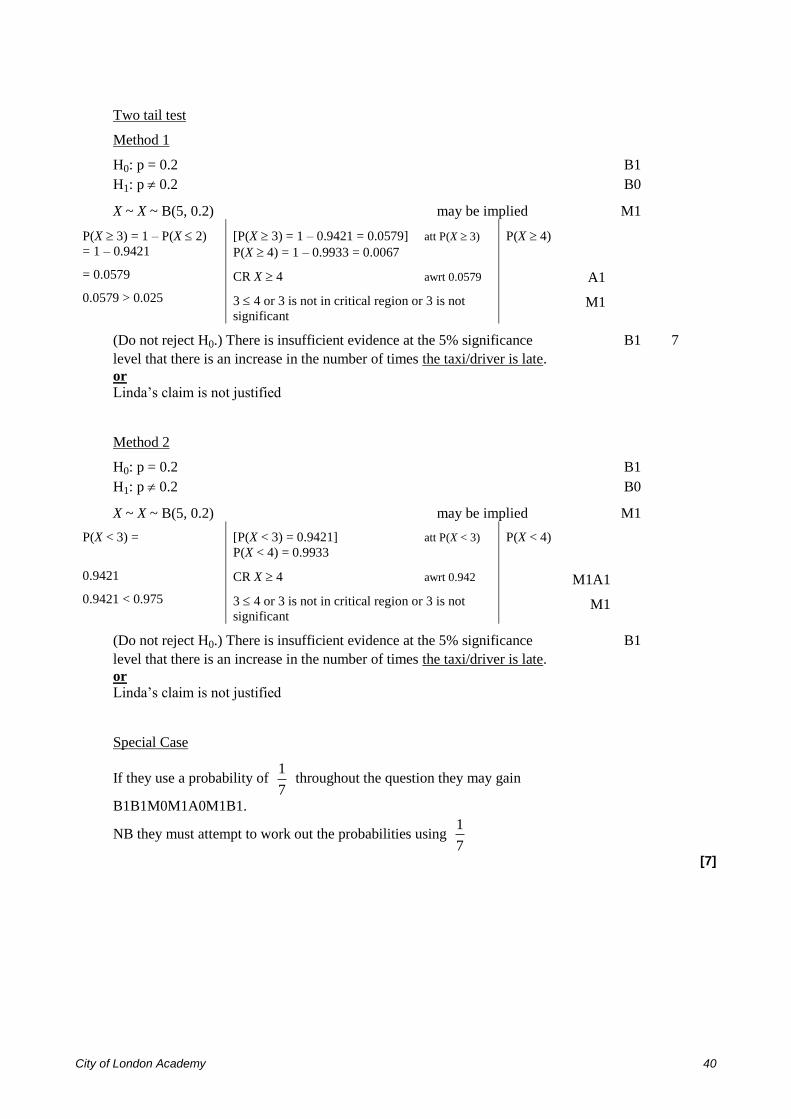
Two tail test
Method 1
H0: p = 0.2 B1
H1: p 0.2 B0
X ~ X ~ B(5, 0.2) may be implied M1
P(X 3) = 1 – P(X 2)
= 1 – 0.9421
= 0.0579
0.0579 > 0.025
[P(X 3) = 1 – 0.9421 = 0.0579] att P(X 3)
P(X 4) = 1 – 0.9933 = 0.0067
CR X 4 awrt 0.0579
3 4 or 3 is not in critical region or 3 is not
significant
P(X 4)
A1
M1
(Do not reject H0.) There is insufficient evidence at the 5% significance B1 7
level that there is an increase in the number of times the taxi/driver is late.
or Linda’s claim is not justified
Method 2
H0: p = 0.2 B1
H1: p 0.2 B0
X ~ X ~ B(5, 0.2) may be implied M1
P(X < 3) =
0.9421
0.9421 < 0.975
[P(X < 3) = 0.9421] att P(X < 3)
P(X < 4) = 0.9933
CR X 4 awrt 0.942
3 4 or 3 is not in critical region or 3 is not
significant
P(X < 4)
M1A1
M1
(Do not reject H0.) There is insufficient evidence at the 5% significance B1
level that there is an increase in the number of times the taxi/driver is late.
or Linda’s claim is not justified
Special Case
If they use a probability of 7
1 throughout the question they may gain
B1B1M0M1A0M1B1.
NB they must attempt to work out the probabilities using 7
1
[7]
City of London Academy 41
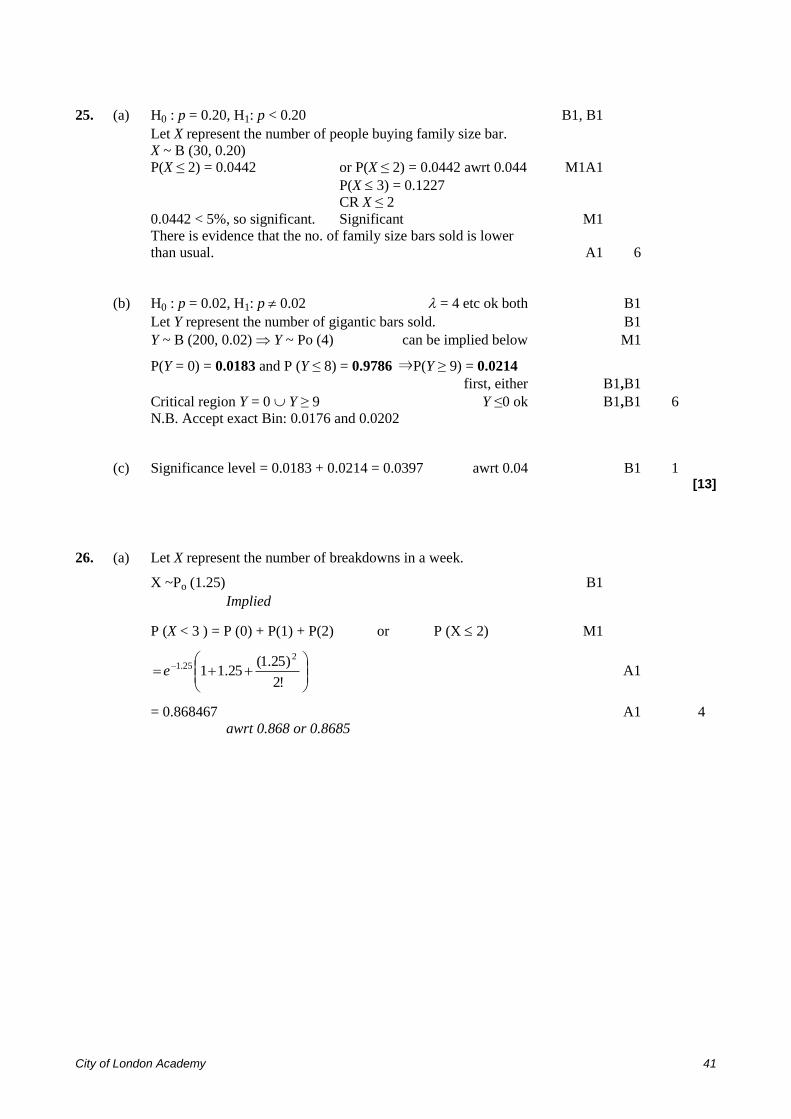
25. (a) H0 : p = 0.20, H1: p < 0.20 B1, B1
Let X represent the number of people buying family size bar.
X ~ B (30, 0.20)
P(X ≤ 2) = 0.0442 or P(X ≤ 2) = 0.0442 awrt 0.044 M1A1
P(X 3) = 0.1227
CR X ≤ 2
0.0442 < 5%, so significant. Significant M1
There is evidence that the no. of family size bars sold is lower
than usual. A1 6
(b) H0 : p = 0.02, H1: p 0.02 = 4 etc ok both B1
Let Y represent the number of gigantic bars sold. B1
Y ~ B (200, 0.02) Y ~ Po (4) can be implied below M1
P(Y = 0) = 0.0183 and P (Y ≤ 8) = 0.9786 ⇒P(Y ≥ 9) = 0.0214
first, either B1,B1
Critical region Y = 0 Y ≥ 9 Y ≤0 ok B1,B1 6
N.B. Accept exact Bin: 0.0176 and 0.0202
(c) Significance level = 0.0183 + 0.0214 = 0.0397 awrt 0.04 B1 1 [13]
26. (a) Let X represent the number of breakdowns in a week.
X ~Po (1.25) B1
Implied
P (X < 3 ) = P (0) + P(1) + P(2) or P (X 2) M1
!2
)25.1(25.11
225.1e A1
= 0.868467 A1 4
awrt 0.868 or 0.8685
City of London Academy 42
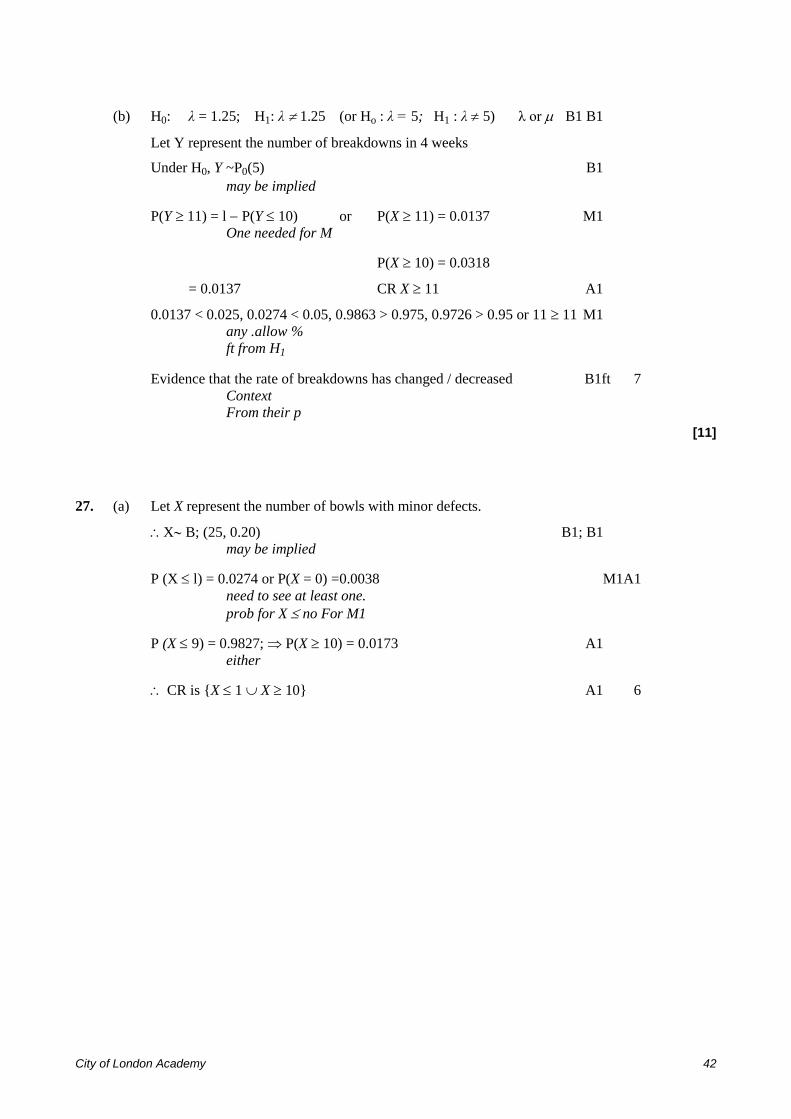
(b) H0: λ = 1.25; H1: λ 1.25 (or Ho : λ = 5; H1 : λ 5) λ or B1 B1
Let Y represent the number of breakdowns in 4 weeks
Under H0, Y ~P0(5) B1
may be implied
P(Y 11) = l P(Y 10) or P(X 11) = 0.0137 M1
One needed for M
P(X 10) = 0.0318
= 0.0137 CR X 11 A1
0.0137 < 0.025, 0.0274 < 0.05, 0.9863 > 0.975, 0.9726 > 0.95 or 11 11 M1
any .allow %
ft from H1
Evidence that the rate of breakdowns has changed / decreased B1ft 7
Context
From their p
[11]
27. (a) Let X represent the number of bowls with minor defects.
X B; (25, 0.20) B1; B1
may be implied
P (X l) = 0.0274 or P(X = 0) =0.0038 M1A1
need to see at least one.
prob for X no For M1
P (X 9) = 0.9827; P(X 10) = 0.0173 A1
either
CR is {X 1 X 10} A1 6
City of London Academy 43
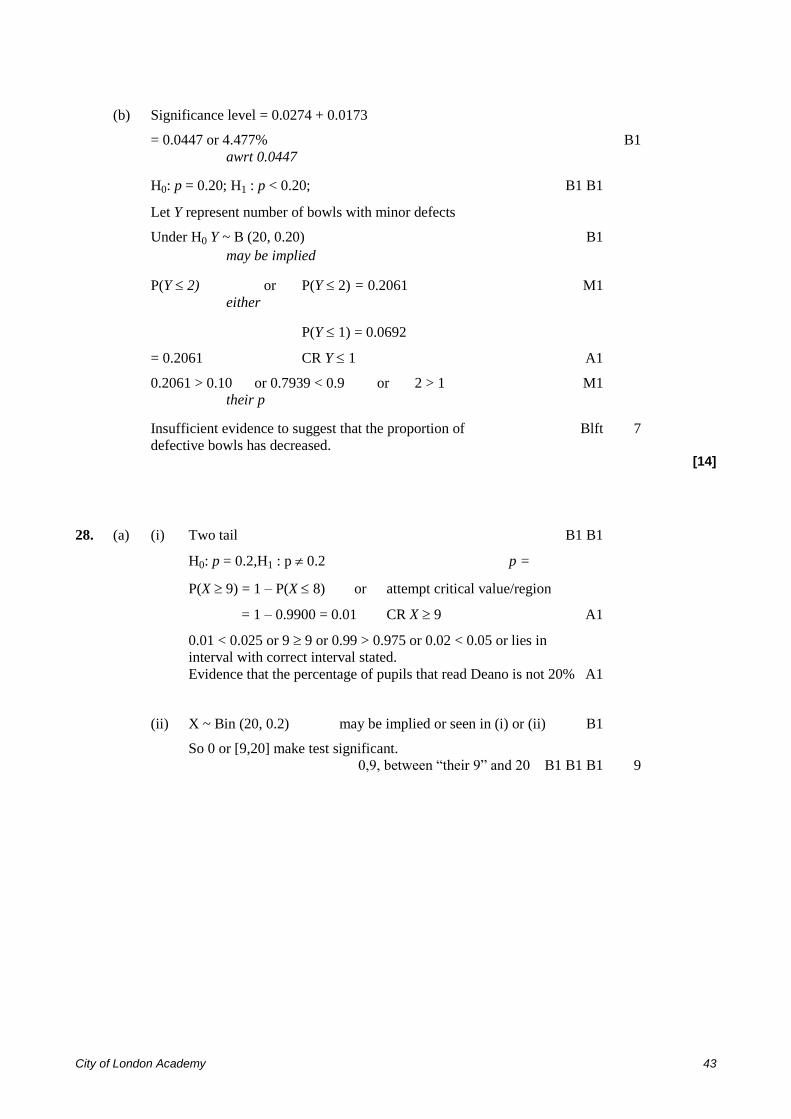
(b) Significance level = 0.0274 + 0.0173
= 0.0447 or 4.477% B1
awrt 0.0447
H0: p = 0.20; H1 : p < 0.20; B1 B1
Let Y represent number of bowls with minor defects
Under H0 Y ~ B (20, 0.20) B1
may be implied
P(Y 2) or P(Y 2) = 0.2061 M1
either
P(Y 1) = 0.0692
= 0.2061 CR Y 1 A1
0.2061 > 0.10 or 0.7939 < 0.9 or 2 > 1 M1
their p
Insufficient evidence to suggest that the proportion of Blft 7
defective bowls has decreased. [14]
28. (a) (i) Two tail B1 B1
H0: p = 0.2,H1 : p 0.2 p =
P(X 9) = 1 – P(X 8) or attempt critical value/region
= 1 – 0.9900 = 0.01 CR X 9 A1
0.01 < 0.025 or 9 9 or 0.99 > 0.975 or 0.02 < 0.05 or lies in
interval with correct interval stated.
Evidence that the percentage of pupils that read Deano is not 20% A1
(ii) X ~ Bin (20, 0.2) may be implied or seen in (i) or (ii) B1
So 0 or [9,20] make test significant.
0,9, between “their 9” and 20 B1 B1 B1 9
City of London Academy 44
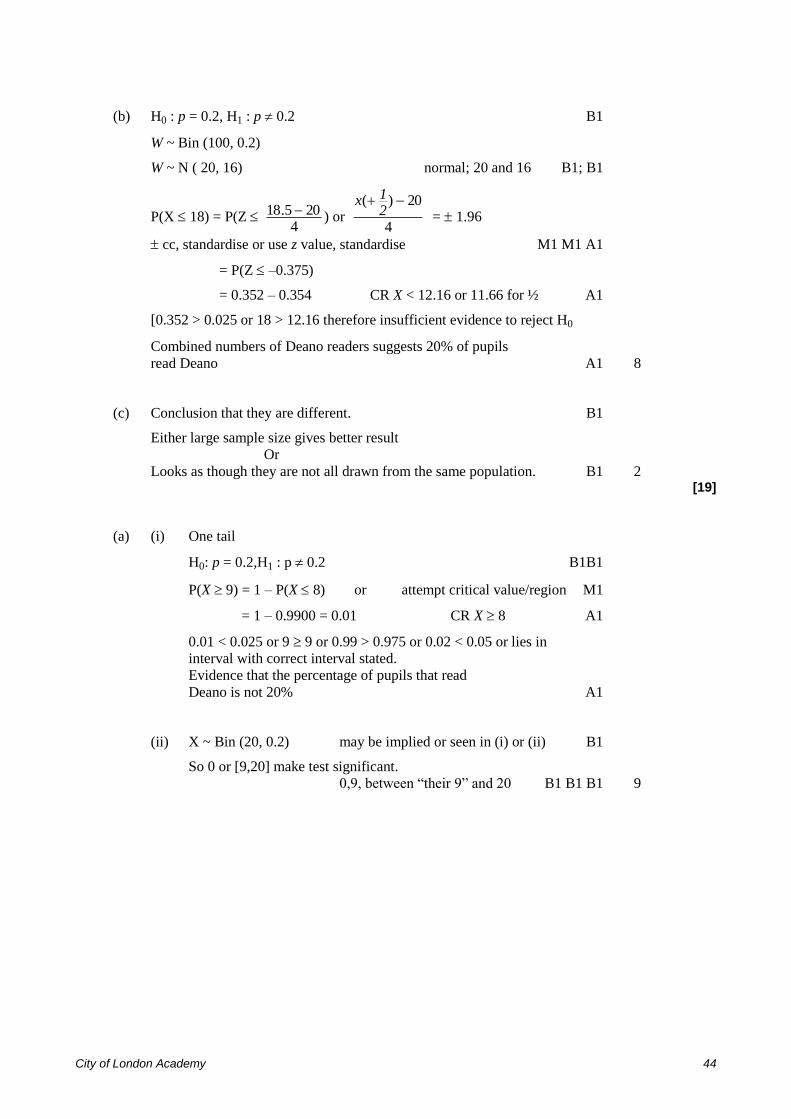
(b) H0 : p = 0.2, H1 : p 0.2 B1
W ~ Bin (100, 0.2)
W ~ N ( 20, 16) normal; 20 and 16 B1; B1
P(X 18) = P(Z 4
205.18 ) or 4
20)( 21x
= 1.96
cc, standardise or use z value, standardise M1 M1 A1
= P(Z –0.375)
= 0.352 – 0.354 CR X < 12.16 or 11.66 for ½ A1
[0.352 > 0.025 or 18 > 12.16 therefore insufficient evidence to reject H0
Combined numbers of Deano readers suggests 20% of pupils
read Deano A1 8
(c) Conclusion that they are different. B1
Either large sample size gives better result
Or
Looks as though they are not all drawn from the same population. B1 2 [19]
(a) (i) One tail
H0: p = 0.2,H1 : p 0.2 B1B1
P(X 9) = 1 – P(X 8) or attempt critical value/region M1
= 1 – 0.9900 = 0.01 CR X 8 A1
0.01 < 0.025 or 9 9 or 0.99 > 0.975 or 0.02 < 0.05 or lies in
interval with correct interval stated.
Evidence that the percentage of pupils that read
Deano is not 20% A1
(ii) X ~ Bin (20, 0.2) may be implied or seen in (i) or (ii) B1
So 0 or [9,20] make test significant.
0,9, between “their 9” and 20 B1 B1 B1 9
City of London Academy 45
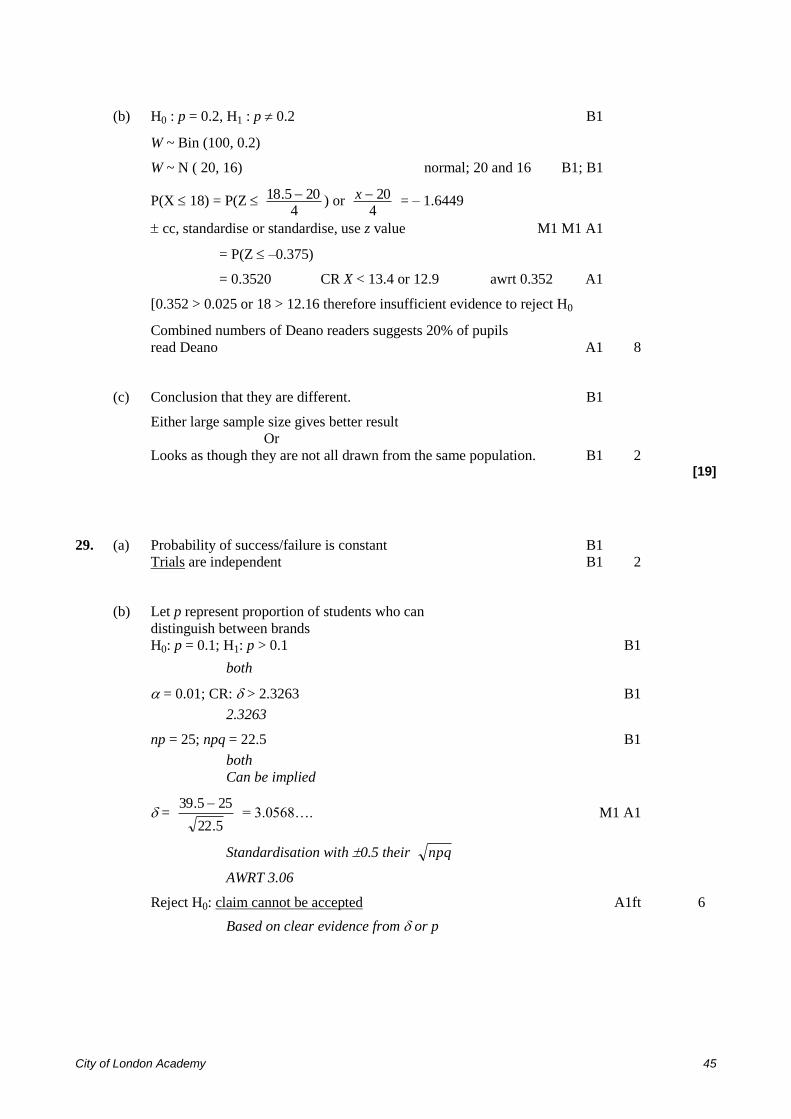
(b) H0 : p = 0.2, H1 : p 0.2 B1
W ~ Bin (100, 0.2)
W ~ N ( 20, 16) normal; 20 and 16 B1; B1
P(X 18) = P(Z 4
205.18 ) or 4
20x = – 1.6449
cc, standardise or standardise, use z value M1 M1 A1
= P(Z –0.375)
= 0.3520 CR X < 13.4 or 12.9 awrt 0.352 A1
[0.352 > 0.025 or 18 > 12.16 therefore insufficient evidence to reject H0
Combined numbers of Deano readers suggests 20% of pupils
read Deano A1 8
(c) Conclusion that they are different. B1
Either large sample size gives better result
Or
Looks as though they are not all drawn from the same population. B1 2 [19]
29. (a) Probability of success/failure is constant B1
Trials are independent B1 2
(b) Let p represent proportion of students who can
distinguish between brands
H0: p = 0.1; H1: p > 0.1 B1
both
= 0.01; CR: > 2.3263 B1
2.3263
np = 25; npq = 22.5 B1
both
Can be implied
= 5.22
255.39 = 3.0568…. M1 A1
Standardisation with 0.5 their npq
AWRT 3.06
Reject H0: claim cannot be accepted A1ft 6
Based on clear evidence from or p
City of London Academy 46
(c) eg:– np, nq both 75 – true or acceptable
p close tp 0.5 – not true, assumption not met B1
success/failure not clear cut necessarily B1 2
independence – one student influences another [10]
(b) Aliter = 3.06 p = 0.9989 > 0.99
or p 0.0011 < 0.01
B1 eqn to 2.3263
30. Let X represent number of accidents/month X ~ P0(3) B1
(a) P(X > 4) = 1 – P(X 4); = 1 – 0.8513 = 0.1847 M1; A1 3
(b) Let Y represent number of accidents in 3 months
Y ~ P0(3 × 3 = 9) B1
Can be implied
P(Y > 4) = 1 – 0.0550 = 0.9450 B1 2
(c) H0: = 3; H1: < 3 B1
both
= 0.05
P(X 1/ = 3) = 0.1991; > 0.05 B1 M1
detailed; allow B0B1M1 (0.025) A0
Insufficient evidence to support the claim that the mean
number of accidents has been reduced. A1ft 4
(NB: CR: X 0; X = 1 not in CR; same conclusion B1, M1, A1)
City of London Academy 47
(d) H0: 24 × 3 = 72; H1: < 72 B1
can be implied = 72
= 0.05 CR: < –1.6449 B1 B1
both H0 & H1
–1.6449
Using Normal approximation with = 2 = 72 B1
Can be implied
= 72
725.55 = –1.94454… M1 A1
Stand. with 0.5, =
AWRT –1.94/5
Since –1.944… is in the CR, H0 is rejected. A1ft 7
There is evidence that the restriction has reduced the number
of accidents
Context & clear evidence
Aliter (d)
p = 0.0262 < 0.05
AWRT 0.026 equn to –1.6449 [16]
31. H0: p = 0.25, H1 = p > 0.25 B1B1
1 tailed
Under H0, X ~ Bin(25, 0.25) B1
Implied by probability
P(X 10) = 1 – P(X 9) = 0.0713 > 0.05 M1A1
Correct inequality, 0.0713
Do not reject H0, there is insufficient evidence to support Brad’s claim. A1A1 7
DNR, context [7]
32. (a) A range of values of a test statistic such that if a value of the test statistic
obtained from a particular sample lies in the critical region,
then the null hypothesis is rejected (or equivalent). B1B1 2
City of London Academy 48
(b) P(X < 2) = P(X = 0) + P(X = 1) both M1
= 7
7
1
7
1e
e
both A1
= 0.990717599… = 0.9907 to 4 sf A1 3
awrt 0.991
X ~ P(14 × 7
1) = P(2) B1
P(X 4) = 0.9473 M1A1 3
Correct inequality, 0.9473
H0: = 4, H1 : < 4 B1B1
Accept μ & H0: = 7
1, H1: <
7
1
X ~ P(4) B1
Implied
P(X 1) = 0.0916 > 0.05, M1A1
Inequality 0.0916
So insufficient evidence to reject null hypothesis A1
Number of breakdowns has not significantly decreased A1 7 [15]
33. (a) Vehicles pass at random / one at a time / independently /
at a constant rate Any 2&context B1B1dep 2
(b) X is the number of vehicles passing in a 10 minute interval,
X ~ Po
10
60
51 = Po(8.5) B1
Implied Po(8.5)
P(X = 6) = !6
e5.8 –8.56
, = 0.1066 (or 0.2562 – 0.1496 = 0.1066) M1A1 3
Clear attempt using 6, 4dp
(c) P(X 9) = 1 – P(X 8) = 0.4769 M1A1 2
Require 1 minus and correct inequality
City of London Academy 49
(d) H0: = 8.5, H1: < 8.5 B1ft,B1ft
One tailed test only for alt hyp
P(X 4 = 8.5) = 0.0744, > 0.05 M1A1
X 4 for method, 0.0744
(Or P(X 3 = 8.5) = 0.0301, < 0.05 so CR X 3 correct CR M1,A1)
Insufficient evidence to reject H0, ‘Accept’ M1
so no evidence to suggest number of vehicles has decreased. Context A1ft 6 [13]
34. (a) Let X represent the number of plant pots with defects, X ~ B(25,0.20) B1
Implied
P(X 1) = 0.0274, P(X 10) = 0.0173 M1A1A1
Clear attempt at both tails required, 4dp
Critical region is X 1, X 10 A1 5
(b) Significance level = 0.0274 + 0.0173 = 0.0447 B1 cao 1
Accept % 4dp
(c) H0: = 10, H1: > 10 (or H0: = 60, H1: > 60) B1B1
Let Y represent the number sold in 6 weeks, under H0, Y ~ Po(60)
P(Y 74) P(W > 73.5) where W ~ N(60,60) M1A1
0.5 for cc, 73.5
P(Z 60
605.73 ) = P(Z > 1.74) =, 0.047 – 0.0409 <0.05 M1,A1
Standardise using 60 60
Evidence that rate of sales per week has increased. A1ft 7 [13]
35. (a) X Po(7) B1
P(X 2) = 0.0296 B1
P(X 13) = 1 – 0.9370 = 0.0270 M1 A1
Critical region is (X 2) (X 13) A1 5
(b) Significance level = 0.0296 + 0.0270 = 0.0566 B1 1
(c) x = 5 is not the critical region insufficient evidence to reject H0 M1 A1 2
[8]
City of London Academy 50
36. (a) X = no. of vases with defects X ~ B(20, 0.15) B1
P (X 0) = 0.0388
Use of tables to find each tail M1
P(X 6) = 0.9781 P(X 7) = 0.0219 M1
critical region is X 0, or X 7 A1 A1 5
Significance level = P(X 0) + P(X 7) = 0.0388 + 0.0219 = 0.0607 (B1) 1
H0: = 2.5, H1: > 2.5 [or H0: = 10, H1: > 10] B1, B1
Y = no. sold in 4 weeks. Under H0 Y ~ Po(10) M1
P(Y 15) = 1 – P(Y 14) =, 1 – 0.9165 = 0.0835 M1, A1
More than 5% so not significant. Insufficient evidence of an A1 6
increase in the rate of sales. [12]
1. This was poorly done with very few candidates scoring full marks. Those candidates who had learnt standard
definitions fared better than those who used their own understanding of the terms because they were less likely to
leave out vital elements of the definitions. Even those who answered parts (a) and (b) correctly were then unable to
apply these definitions in context.
In part (a) a large majority of candidates omitted to mention “all”, or its equivalent.
Part (b) was well answered because many candidates used a standard definition. The most common errors were using
“population” instead of “sample and omitting “no unknown parameters”.
In part (c) a substantial number of candidates were confused about “the population in this case”. Many thought it to
be the sample of 100 voters. Others were closer to the truth with “all the residents of the town”, but did not earn the
mark because they had failed to distinguish between registered voters and residents. The statistic was more easily
identified.
Part (d) was poorly answered with many candidates having no idea what a sampling distribution was and those that
did being unable to put it into context. The sampling distribution of a proportion is arguably one of the hardest to get
a grip on and articulate convincingly.
2. A high proportion of candidates attempted the first two parts of this question successfully, with the majority of
candidates getting at least one mark for part (b). Those less successful in part (a) either misread the question and
ended up with a denominator of 3 for the probabilities or confused formulae for calculating the mean and variance
and used, for example,
n
xxp for the mean or used E(X
2) for σ
2. The solution to part (c) proved beyond the
capability of a minority of candidates but, for the majority, many exemplary answers were evident, reflecting sound
preparation on this topic. Candidates who found all 8 cases in (b) usually gained four marks in part (c) for calculating
the probabilities. For a small percentage of those candidates, calculating the means was difficult and hence
completing the table correctly was not possible. A few candidates tried unsuccessfully to use the binomial to answer
part (c).
3. This question was either answered very well with some text book solutions, although it seemed that only a minority
of candidates earned all five marks, or badly with some strange descriptions. A reasonable number of candidates
responded with comments that were very close to those in the mark scheme: evidence possibly of deliberate
preparation and learning whilst others had internalised the concepts and provided responses in their own words.
Whilst these responses might not have matched the ‘official’ answers, they nevertheless captured the essence of the
concepts and were fully acceptable. There was confusion with the definition of statistics and parameters and part (b)
was often attempted badly with candidates not knowing the definition of a probability distribution. On the whole this
was one of the worst answered questions in the paper.
In part (a) candidates gave various definitions sometimes all muddled up. Not many candidates gave clear definitions
but a common error was candidates writing “any function” or “no other quantities”.
In part (b) again the candidates had mixed success. A significant minority scored marks by knowing that a sampling
distribution involved all possible values of the statistic and their associated probabilities.
In part (c) many could identify (ii) correctly and a variety of reasons were seen. This part seemed to be done well
City of London Academy 51
even by candidates who could not answer part (a). It was interesting to see that a relatively large proportion of
candidates who earned both marks for part (c), were unable to achieve either of the two marks in part (a). There was a
connection between parts (a) and (c) that many candidates failed to recognise. If those candidates who wrote “(ii) is
not a statistic because it has unknown parameters” had then reflected on their responses to parts (a) and (c), they
could then have gone back to modify their answer to (a) in order to earn more marks.
4. Nearly all candidates achieved at least one of the available marks but it was disappointing that there were not more
attaining full marks.
(a) Too many candidates referred to the national census rather than a general definition. Some felt an
enumeration was adequate and others failed to recognise that EVERY member had to be investigated.
(b) A failure to put the question in context and consider the consequences of testing every item meant that some
candidates scored 0 in this part of the question. A few candidates did not read the question carefully and used
cheap and quick as their reasons why a census should not be used when the question specifically said give a
reason “other than to save time and cost”.
(c) Many candidates mentioned a list; database or register and so attained the available mark. However, some did
not seem to differentiate between the population and the sampling frame.
(d) Most candidates were able to identify the sampling units correctly, although those who had not scored in part
(c) tended to say: “the sample of 5 cookers” in part (d).
5. Almost all candidates answered part (a) correctly, a minority failed to mention “census” or “asking all members”
when answers referred to long time/expensive/difficult. In part (b) many candidates failed to include the word “all” in
their answer. Quite a number did not know or understand the term sampling frame and wrote about sampling
methods. Most candidates answered part (c) correctly, but there were occasional references to golfers rather than
members or to those selected in the sample.
6. In part (a) many candidates were able to calculate the mean accurately, although some divided by random constants.
Few drew up a table and many were unable to cope with the 5p coins.
The most common error in calculating the variance was the failure to subtract E(X)².
Most candidates correctly identified 6 possible samples but some failed to realise that combinations such as (1,5) and
(5,1) were different and so missed the other 3 possibilities. Only a minority of candidates were able to attempt part (c)
of the question with any success, with many candidates having no idea what was meant by ‘the sampling distribution
of the mean value of the samples’. Most did not find the mean values and if they did, then they were unable to find
the probabilities (ninths were common).Very few candidates achieved full marks.
7. This question proved difficult to many candidates. Errors in this part (a) included the use of the word sample rather
than population. Many candidates also gave an ambiguous response to part (b), often omitting to mention all
sampling units or the whole population. Part (c) was done badly and whilst some candidates scored 1 mark very few
achieved both marks. It appeared that many candidates had attempted to memorise the definition, but it came out
garbled and confused with other concepts.
8. The bookwork required to answer this question was not remembered as well as it should have been. Many candidates
could not define a population or a sampling frame in detail or know why they might be different. In part (c) many
candidates were unable to give in sufficient detail a justified example of the use of a census and a sample.
9. Weaker students had difficulties with this question with a considerable number scoring 1 or 0 marks. In part (a) good
candidates answered this correctly but for many there was confusion between a population and a sample and that the
population must be in a list or equivalent. In part (b) those candidates who had learnt the basic definitions were able
to answer this successfully.
10. Only a very few candidates achieved full marks. Most scored 2 or 3 out of the 5 available. Common errors were in
part (c) where only a very small number could provide a valid disadvantage and in part (d) not all candidates realised
the problem of having an incomplete (or not up-to-date) sampling frame.
11. This question also allowed candidates to score highly; indeed some otherwise poor papers were redeemed by good
marks here. Most marks were lost in the opening parts where it is clear that candidates do not understand well enough
the need for a degree of precision in defining terms such as population and sampling frame. Similarly it is a cause for
concern that the majority of candidates talk about a census giving more accurate answers (even though this was
allowed) rather than understanding the real differences between a sample and a census. Part (e) received a very high
City of London Academy 52
number of correct answers, and part (f), although less well done, did receive an encouragingly high number of good
solutions, with context being well used. The most common mistakes were careless statements of the hypotheses and a
decision to find P(X = 6). Part (g) was very well answered with a large number of candidates gaining full marks.
Very few candidates used incorrect parameters in the normal approximation, but the most common cause of loss of
marks was in an error in the use of either 70.5 or 82.5 even if a correct probability statement had been given earlier.
12. No Report available for this question.
13. The majority of candidates were familiar with the technical terms in part (a), but failed to establish any context.
Part (b) was a useful source of marks for a large proportion of the candidates. The only problems were occasional
errors in detail. In part (i) a few did not spot the change in time scale and used Po(4) rather than Po(8). Some were
confused by the wording and calculated P(X = 8) rather than P(X = 0). The main source of error for (ii) was to find 1
– P(X 4) instead of
1 – P(X 3).
In part (c) the Normal distribution was a well-rehearsed routine for many candidates with many candidates
concluding the question with a clear statement in context.
The main errors were
• Some other letter (or none) in place of or
• Incorrect Normal distribution: e.g. N(60, 60)
• Omission of (or an incorrect) continuity correction
• Using 48 instead of 60
• Calculation errors
A minority of candidates who used the wrong distribution (usually Poisson) were still able to earn the final two marks
in the many cases when clear working was shown. This question was generally well done with many candidates
scoring full marks.
14. Part (a) was well answered as no context was required.
In part (b) candidates identified the correct distribution and with much of the working being correct. However
although the lower limit for the critical region was identified the upper limit was often incorrect. It is disappointing to
note that many candidates are still losing marks when they clearly understand the topic thoroughly and all their work
is correct except for the notation in the final answer. It cannot be overstressed that )6( XP is not acceptable
notation for a critical region. Others gave the critical region as 196 X .
In part (c) the majority of candidates knew what to do and just lost the accuracy mark because of errors from part (b)
carried forward.
Part (d) tested the understanding of what a critical region actually is, with candidates correctly noting that 8 was
outside the critical region but then failing to make the correct deduction from it. Some were clearly conditioned to
associate a claim with the alternative hypothesis rather than the null hypothesis. A substantial number of responses
where candidates were confident with the language of double-negatives wrote “8 is not in the critical region so there
is insufficient evidence to disprove the company’s claim”. Other candidates did not write this, but clearly understood
when they said, more simply “the company is correct”.
Part (e) was generally well done with correct deductions being made and the contextual statement being made. A few
worked out )5( XP rather than )5( XP .
15. Part (a) tested candidates’ understanding of the critical region of a test statistic and responses were very varied, with
many giving answers in terms of a ‘region’ or ‘area’ and making no reference to the null hypothesis or the test being
significant. Many candidates lost at least one mark in part (b), either through not showing the working to get the
probability for the upper critical value, i.e. 1 – P(X ≤ 15) = P(X ≥ 16) = 0.0064, or by not showing any results that
indicated that they had used B(30, 0.3) and just writing down the critical regions, often incorrectly. A minority of
candidates still write their critical regions in terms of probabilities and lose the final two marks. Responses in part (c)
were generally good with the majority of candidates making a comment about the observed value and their critical
City of London Academy 53
region. A small percentage of responses contained contradictory statements.
16. Candidates seemed better prepared for this type of question than in previous years. Marks were often lost for not
using λ or μ in the hypotheses and for not putting the conclusion into context. A significant minority of candidates
found P(X = 1) instead of P(X≤1) but only a few candidates chose the critical region route.
17. This was a very well answered question. Candidates were able to use binomial tables and gave the answer to the
required number of decimal places. As in previous years there were some candidates who confused the critical region
with the probability of the test statistic being in that region but this error has decreased. Candidates were able to
describe the acceptance of the hypothesis in context although sometimes it would be better if they just repeated the
wording from the question which would help them avoid some of the mistakes seen. There were still a few candidates
who did not give a reason in context at all.
In part (a) many candidates failed to read this question carefully assuming it was identical to similar ones set
previously. Most candidates correctly identified B(20,0.3) to earn the method mark and many had 0.0355 written
down to earn the first A mark, although in light of their subsequent work, this may often have been accidental. A
majority of candidates did not gain the second A mark as they failed to respond to the instruction “state the
probability of rejection in each case”. In the more serious cases, candidates had shown no probabilities from the
tables, doing all their work mentally, only writing their general strategy: “P(X≤c) < 0.05”. Whilst many candidates
were able to write down the critical region using the correct notation there are still some candidates who are losing
marks they should have earned, by writing P(X ≤ 2) for the critical region X ≤ 2
Part (b) was usually correct.
Part (c) provided yet more evidence of candidates who had failed to read the question: “in the light of your critical
region”. Some candidates chose not to mention the critical region and a number of those candidates who identified
that 11 was in the critical region did not refer to the manager’s question.
18. Part (a) of this question was poorly done. Candidates would appear unfamiliar with the standard mathematical
notation for a Critical Region. Thus 211 X made its usual appearances, along with c1 = 2 and P(X ≤ 2)
In part (b) candidates knew what was expected of them although many with incorrect critical regions were happy to
give a probability greater than 1 for the critical region.
Part (c) was well answered. A few candidates did contradict themselves by saying it was “significant” and “there is
no evidence to reject H0” so losing the first mark.
19. In Part (a) there are a sizeable number of candidates who are not using the correct symbols in defining their
hypotheses although the majority of candidates recognised Po(7).
For candidates who attempted a critical region there were still a number who struggled to define it correctly for a
number of reasons:
• Looking at the wrong tail and concluding X≤3.
• Incorrect use of > sign when concluding 11 - not appreciating that this means ≥12 for a discrete
variable.
• Not knowing how to use probabilities to define the region correctly and concluding 10 or 12 instead
of 11.
The candidates who opted to calculate the probability were generally more successful.
A minority still try to calculate a probability to compare with 0.9. This proved to be the most difficult route with the
majority of students unable to calculate the probability or critical region correctly. We must once again advise that
this is not the recommended way to do this question. There are still a significant number who failed to give an answer
in context although fewer than in previous sessions.
Giving the minimum number of visits needed to obtain a significant result proved challenging to some and it was
noticeable that many did not use their working from part (a) or see the connection between the answer for (i) and (ii)
and there were also number of candidates who did not recognise inconsistencies in their answers.
A number of candidates simply missed answering part (b) but those who did usually scored well.
There were many excellent responses in part (c) with a high proportion of candidates showing competence in using a
Normal approximation, finding the mean and variance and realising that a continuity correction was needed. Marks
were lost, however, for not including 20, and for not writing the conclusion in context in terms of the rate of visits
being greater. Some candidates attempted to find a critical value for X using methods from S3 but failing to use
1.2816. There were a number of candidates who calculated P(X = 20) in error.
City of London Academy 54
20. Whilst many candidates knew what they were doing in part (a) they lost marks because they left their answers as P(X
≤ 3) etc and did not define the critical regions. A few candidates were able to get the figures 0.0212 and 0.0220 but
then did not really understand what this meant in terms of the critical value. A critical region of X ≥ 15 was common.
Part (b) was poorly answered. The wording “incorrectly rejecting H0” confused many candidates. They often
managed to get to 0.432 but then they took this away from 0.5 or occasionally 1. It was not uncommon for this to be
followed by a long paragraph trying to describe what they had done.
21. The majority of candidates appeared to have coped with this question in a straightforward manner and made good
attempts at a conclusion in context, which was easily understood.
The hypotheses were stated correctly by most candidates – they seem more at ease with writing “p =” than in Q7
where λ is the parameter. Most used the correct distribution B(40, 0.3). Those who stated the correct inequality usually also found the correct probability/critical region and thus rejected H0. The main errors were to calculate 1 –
P(X ≤ 18) or P(X = 18). Some candidates used a critical region approach but the majority calculated a probability. A
minority of candidates still attempted to find a probability to compare with 0.95. This was only successful in a few
cases and it is recommended that this method is not used. Most candidates who took this route found P(X ≤ 18) rather
than P(X ≤ 17).There were difficulties for some in expressing an accurate contextualised statement. The candidates
who used a critical region method here found it harder to explain their reasoning and made many more mistakes.
22. This question appeared to be difficult for many candidates with a large proportion achieving less than half the
available marks.
(a) The majority of candidates were unable to give an accurate description of a hypothesis test as a method of deciding
between 2 hypotheses. There were more successful definitions of a critical region but many candidates achieved only
0 or 1 of the 3 available marks. Common errors included too much re-use of the word region without any expansion
on it. Even those who could complete the rest of the question with a great deal -of success could not describe
accurately what they were actually doing.
(b) Although most of those attempting this part of the question realised that a Poisson distribution was
appropriate there was a sizeable number who used a Binomial distribution. Again, the most common problem
was in expressing and interpreting inequalities in order to identify the critical regions. Many found the correct
significance level but struggled to express the critical region correctly. Answers with 15 were common and
some candidates even decided that 4 to 15 was the CR.
(c) Those candidates that identified the correct critical regions were almost always able to state the significance
level correctly, as were some who had made errors in stating these regions. Some still gave 5% even with part
(b) correct.
(d) Candidates who had used a Binomial distribution in part (b), and many of those who had not, used p instead
of λ in stating the hypotheses and went on to obtain a Binomial probability in this part of the question. In
obtaining P(X ≤ 1) some used Po(9) from part (b) instead of Po(4.5). Most of those achieving the correct statement (failing to reject H0) were able to place this in a suitable contextualised statement. There were some
candidates who still tried to find P(X = 1) rather than P(X < 1).
23. The majority of candidates found this question straightforward. They were most successful if they used the
probability method and compared it with 0.05. Those who attempted to use 95% were less successful and this is not a
recommended route for these tests.
Most candidates knew how to specify the hypotheses with most candidates using 2.5 rather than 5. Some candidates
used p, or did not use a letter at all, in stating their hypotheses, but most of the time they used λ. A minority found
P(X = 7) and some worked with Po(5).
If using the critical region method, not all candidates showed clearly, either their working, or a comparison with the
value of 7 and the CR X 7.
A sizeable minority of candidates failed to put their conclusion back into the given context.
Reject H0 is not sufficient.
24. There was clear evidence that candidates had been well prepared for a question on hypothesis testing with many
candidates scoring full marks on this question. Candidates who used the probability method were generally more
successful than those who used critical regions. They were less familiar with writing hypotheses for p than for the
mean and so used λ or µ instead of p. A few candidates mistakenly used a B(5, 1/7) or B(7,1/7) distribution. In a
minority of cases the final mark was lost through not writing the conclusion in context using wording from the
question.
City of London Academy 55
25. Weaker candidates found this question difficult and even some otherwise very strong candidates failed to attain full
marks. Differentiating between hypothesis testing and finding critical regions and the statements required, working
with inequalities and placing answers in context all caused problems. In part (a) a large number of candidates were
able to state the hypotheses correctly but a sizeable minority made errors such as missing the p or using an alternative
(incorrect) symbol. Some found P(X = 2) instead of P(X ≤ 2) and not all were able to place their solution in the
correct context. Not all candidates stated the hypotheses they were using to calculate the critical regions in part (b). In
a practical situation this makes these regions pointless. The lower critical region was identified correctly by many
candidates but many either failed to realise that P(X ≤ 8)=0.9786 would give them the correct critical region and/or
that this is X ≥ 9. The final part was often correct.
26. Most candidates answered Part (a) correctly. A small number of candidates calculated the probability for less than or
equal to 3 although a minority thought that dividing by 0! in P(X = 0) gave zero. In part (b) carrying out the
hypothesis test was more challenging though there was clear evidence that candidates had been prepared for this type
of question. However, using p instead of λ or µ, when stating the hypotheses, was often seen and incorrectly stating
H1 as λ > 1.25 or 5 also lost marks. Many candidates calculated P(X ≤ 11) instead of looking at P(X ≥ 11). A diagram
would have helped them or the use of the phrase “a result as or more extreme than that obtained”. Those who used the
critical region approach made more errors. Some candidates correctly calculated the probability and compared it with
0.025 but were then unsure of the implications for the hypotheses. A few candidates used a 2-tailed hypothesis but
then used 0.05 rather than 0.025 in their comparison. Most candidates gave their conclusions in context.
27. Part (a) was one of the poorest answered questions in the paper. Many candidates quoted the inequalities with little or
no understanding of how to apply them and too many merely stated the critical values with no figures to back them
up and without going on to give the critical region. It was unclear in some cases whether they knew that the critical
region was the two tails rather than the central section. A few candidates used diagrams and this almost always
enabled them to give a correct solution. Many misunderstood the wording of the question and thought that one of the
tails could be slightly larger than 2.5%. Those that got Part (a) correct usually got part (b) correct, although a minority
of weaker candidates did not understand what was meant by significance level. Part (c) was well answered. Those
candidates who used the critical region approach did less well, tending to get themselves muddled. A few did not
make the correct implication at the end and too many did not state that 0.2061 > 0.10 but merely said the result was
not significant. The context for accepting/rejecting the null hypothesis was not always given.
28. In part (a)(i) the null and alternative hypotheses were stated correctly by most candidates but then many had
difficulties in either calculating the probability or obtaining the correct critical region and then comparing it to the
significance level or given value. Most of those obtaining a result were able to place this in context but not always
accurately or fully. Candidates still do not seem to realise that just saying accept or reject the hypothesis is
inadequate.
In (a)(ii) although some candidates obtained the critical regions the list of values was not always given. Many
candidates got the 9 but forgot the 0 and a minority gave a value of ≥ 9 but did not give the upper limit.
In part (b) there was a wide variety of errors in the solutions provided including using the incorrect approximation,
failing to include the original sample in the calculations, not using a continuity correction and errors in using the
normal tables. Again in this part many candidates lost the interpretation mark.
Most candidates attempting part (c) of the question noted that the results for the two hypothesis tests were different
but few suggested that either the populations were possibly not the same for the samples or that larger samples are
likely to yield better results.
29. Most candidates wrote down two other conditions associated with the binomial experiment but too many did not use
‘trials’ when referring to independence. The alternative hypothesis was often wrongly defined and far too many of
those using the normal approximation ignored the need to use the continuity correction. The conclusion needed to be
in context but many did not do this. Few candidates made any sensible attempt to answer part (c).
30. For those candidates that could interpret ‘more than 4 accidents occurred’ correctly parts (a) and (b) were a good
source of marks. Part (b) was often well answered and many candidates gained full marks. In part (c) incorrect
hypotheses and ignoring the continuity correction were the common errors coupled with poor use of the appropriate
significance test. Candidates need to have a simple algorithm at their fingertips to deal with tests of significance.
31. Most candidates were able to state the correct distribution, Bin(25, 0.25), and the hypotheses correctly. However, a
sizeable minority were unable to identify the correct test statistic. The most common error was examining P(X=10)
instead of P(X≥10).
32. In part (a) many candidates struggled to explain the concept of a critical region, although some gave a correct
City of London Academy 56
definition as the range of values where the null hypothesis is rejected. Many correct solutions were seen for parts (b)
and (c). However the weaker candidates were not able to translate the concept ‘at most 4 breakdowns’ to the correct
inequality. In part (d), as with Q3, many candidates successfully performed the required hypothesis test using a
probability method. Again, there was a sizeable number of candidates who incorrectly found P(X=1) and compared
this probability with the significance level. Again, a minority of candidates decided to approach this question using
the critical region strategy. Marks were lost if candidates did not give evidence of their chosen critical region.
33. Candidates were able to express two conditions for a Poisson distribution in context with vehicles passing by a
particular point on the road. Many candidates then answered part (b) and (c) correctly. In part (d) a majority of
candidates was able to give a full solution by either using a probability or critical region approach to their hypothesis
test.
34. Many candidates found this question difficult. A few candidates failed to look for the two tails in part (a) and, of
those that did, many chose any value that was less than 2.5% rather than the closest value. Many identified the correct
probability for the upper region, but then failed to interpret this as a correct critical region. Marks were lost by those
who failed to show which values they had extracted from the tables to obtain their results. Nearly all of those who
achieved full marks in part (a) answered part (b) correctly.
In part (c) weaker candidates had difficulty in stating hypotheses correctly and then attempted to use a Poisson
distribution with a parameter obtained from dividing 74 by 6. However, the best candidates realised that a normal
approximation was appropriate, with the most common error being an incorrect application of the continuity
correction. Most solutions were placed in context.
35. Many good candidates lost marks carelessly by failing to show detailed working, even if they arrived at the correct
critical region, and the statement of the region was often missing or stated as a probability. Some centres had
candidates who were trying to follow the book method too closely and did not demonstrate a clear understanding of
the concept of significance.
36. No Report available for this question.