Embed Size (px)
Citation preview
Released for Public Use – 14 November 2019
Safespill Systems Ignitable Liquid Drainage Floor Assembly
Performance and Comparison to Existing Fire
Protection Schemes for Aircraft Hangars
November 2019
Prepared by:
Kyle Giubbini
R&D Test Engineer
Released for Public Use – 14 November 2019
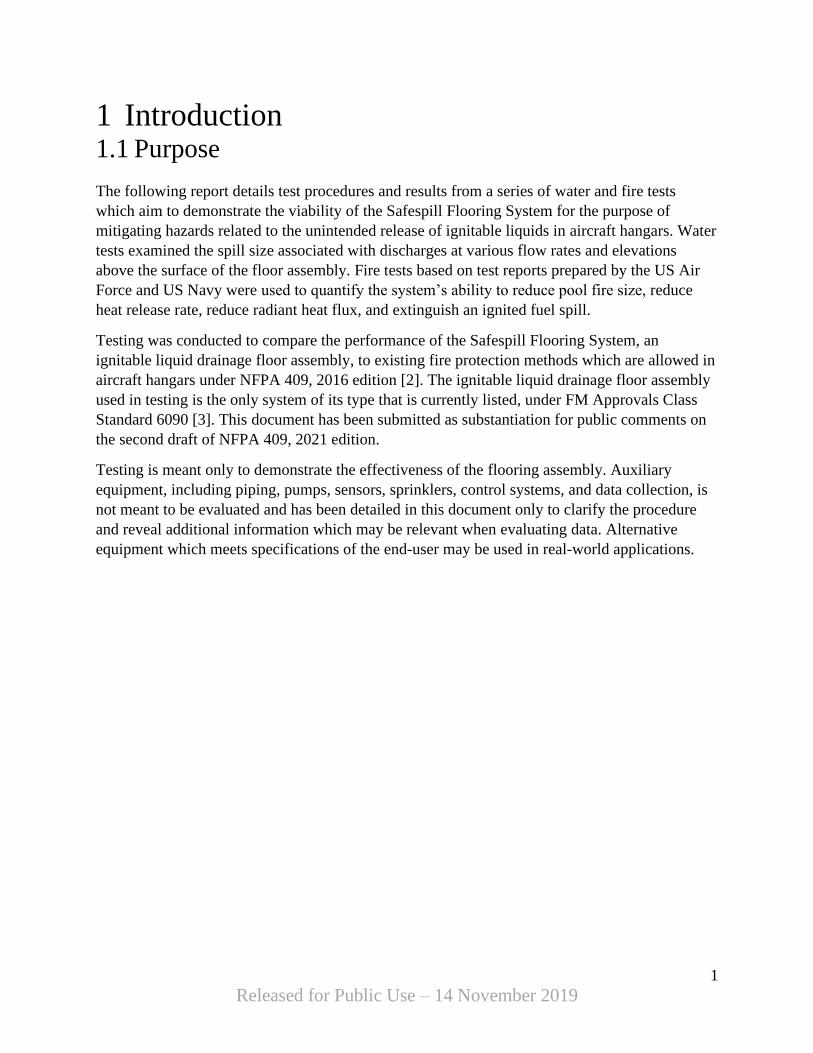
Table of Contents 1 Introduction ........................................................................................................................................................... 1
1.1 Purpose ......................................................................................................................................................... 1
1.2 Testing Floor Design .................................................................................................................................... 2
2 Spill Size Testing – Elevated Discharges .............................................................................................................. 4
2.1 Test Design and Procedure ........................................................................................................................... 4
2.2 Test Results .................................................................................................................................................. 7
3 Wing Tank Drop Fire Test .................................................................................................................................. 21
3.1 Test Design and Procedure ......................................................................................................................... 21
3.2 Test Results ................................................................................................................................................ 23
4 Kerosene Cascade Fire Test ................................................................................................................................ 45
4.1 Test Design and Procedure ......................................................................................................................... 45
4.2 Test Results ................................................................................................................................................ 50
5 Conclusion .......................................................................................................................................................... 60
5.1 Current Approved Fire Protection Schemes ............................................................................................... 60
5.2 Proposal for Alternative Fire Protection Scheme ....................................................................................... 61
6 References ........................................................................................................................................................... 62
Appendix A: P&ID for Flooring System and Test Equipment ....................................................................................................... 63
Appendix B: Design of High Flow Spill Device ............................................................................................................................. 64
Appendix C: Pump Curve for AMT 4”, 15 HP Centrifugal ............................................................................................................ 65
Appendix D: Pump Curve for ARO 2” Metallic Diaphragm Pump ................................................................................................ 66
Appendix E: Proposed General Requirements for Ignitable Liquid Drainage Floor Assemblies in Aircraft Hangars .................... 67
1
Released for Public Use – 14 November 2019
1 Introduction 1.1 Purpose
The following report details test procedures and results from a series of water and fire tests
which aim to demonstrate the viability of the Safespill Flooring System for the purpose of
mitigating hazards related to the unintended release of ignitable liquids in aircraft hangars. Water
tests examined the spill size associated with discharges at various flow rates and elevations
above the surface of the floor assembly. Fire tests based on test reports prepared by the US Air
Force and US Navy were used to quantify the system’s ability to reduce pool fire size, reduce
heat release rate, reduce radiant heat flux, and extinguish an ignited fuel spill.
Testing was conducted to compare the performance of the Safespill Flooring System, an
ignitable liquid drainage floor assembly, to existing fire protection methods which are allowed in
aircraft hangars under NFPA 409, 2016 edition [2]. The ignitable liquid drainage floor assembly
used in testing is the only system of its type that is currently listed, under FM Approvals Class
Standard 6090 [3]. This document has been submitted as substantiation for public comments on
the second draft of NFPA 409, 2021 edition.
Testing is meant only to demonstrate the effectiveness of the flooring assembly. Auxiliary
equipment, including piping, pumps, sensors, sprinklers, control systems, and data collection, is
not meant to be evaluated and has been detailed in this document only to clarify the procedure
and reveal additional information which may be relevant when evaluating data. Alternative
equipment which meets specifications of the end-user may be used in real-world applications.
2
Released for Public Use – 14 November 2019
1.2 Testing Floor Design
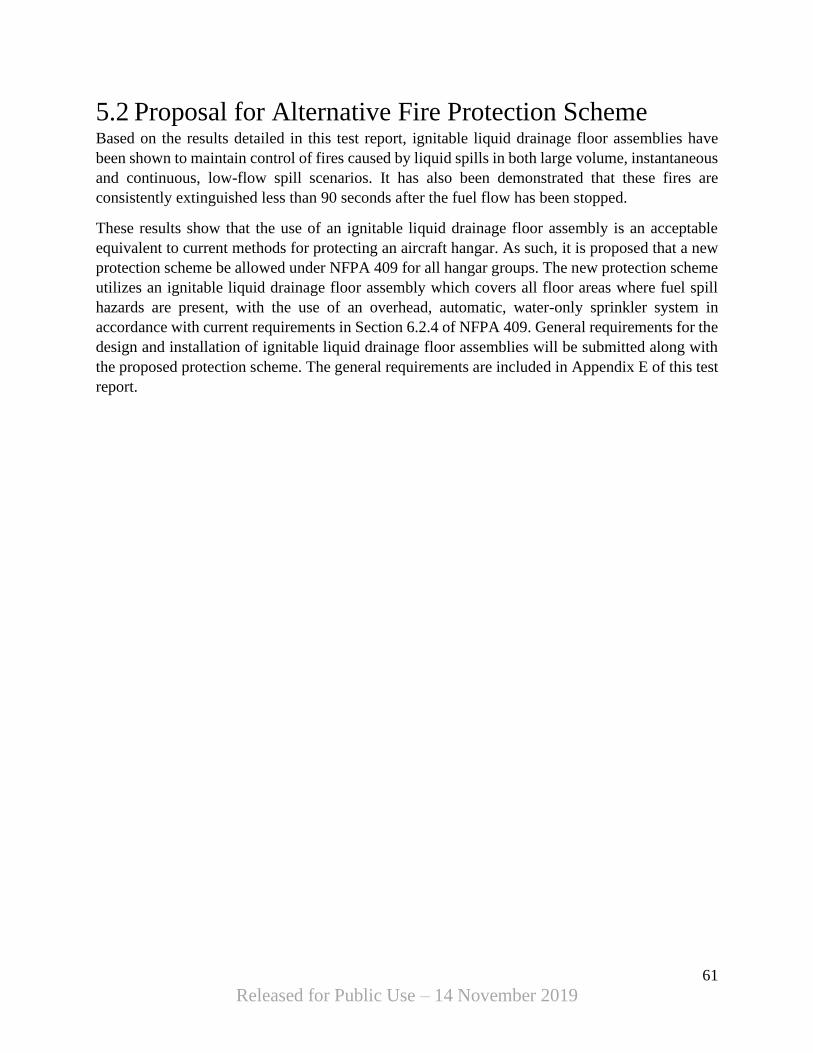
This section details the design and dimensions of the flooring system used for testing. A detailed
piping and instrumentation diagram for the flooring system used in testing is included in Appendix
A.
1.2.1 Test Floor Sizing
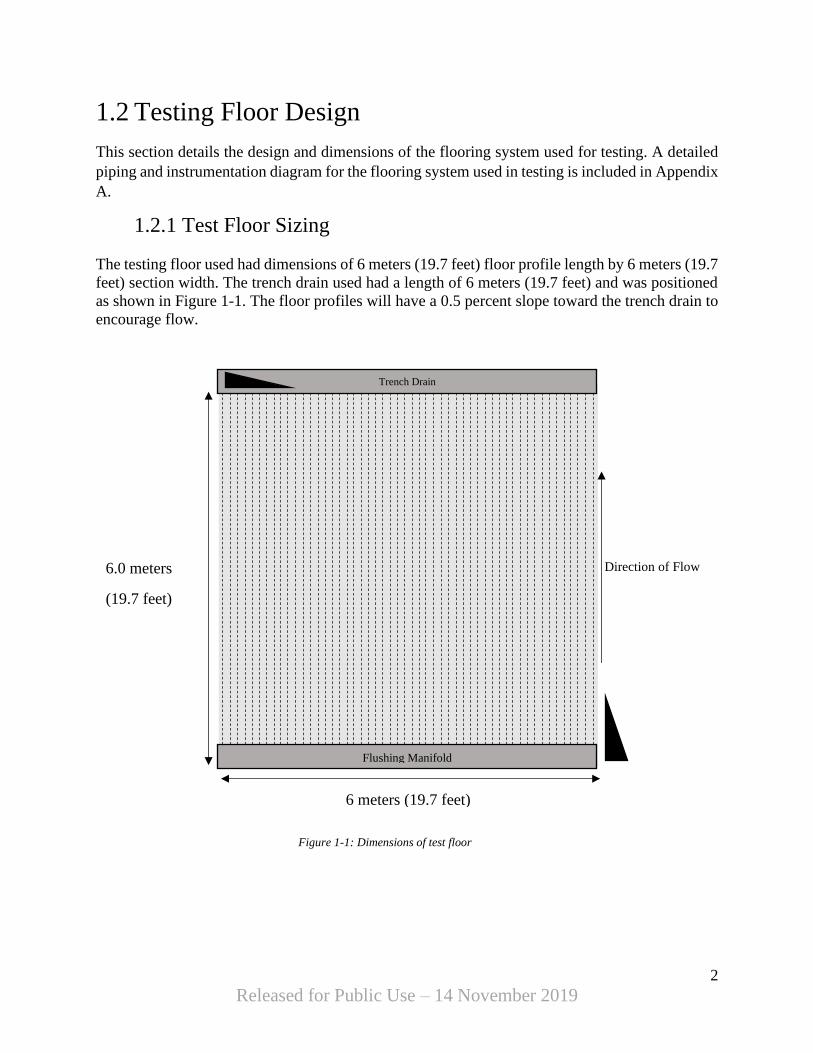
The testing floor used had dimensions of 6 meters (19.7 feet) floor profile length by 6 meters (19.7
feet) section width. The trench drain used had a length of 6 meters (19.7 feet) and was positioned
as shown in Figure 1-1. The floor profiles will have a 0.5 percent slope toward the trench drain to
encourage flow.
Figure 1-1: Dimensions of test floor
6.0 meters
(19.7 feet)
Trench Drain
Flushing Manifold
Direction of Flow
6 meters (19.7 feet)
3
Released for Public Use – 14 November 2019
1.2.2 Trench Drain
Spilled fuel and water from the flushing manifold flows down the length of the profiles and into
the trench drain. The trench drain was made of stainless steel and had a width of 300 mm (12
inches) and depths of 410 mm (16 inches) at the deepest point and 380 mm (15 inches) at the
shallowest point. At the end of the trench drain, a sump with a square cross-sectional dimension
of 300 mm (12 inches) and a depth of 1 meter (3.1 feet) collects spilled liquids. Two suction inlets
located at the base of the sump are connected to two 4” centrifugal (or 2” diaphragm pumps) pumps
to remove liquid from the trench and pump it into a containment tank located outside of the hazard
area. The trench drain had a 0.5 percent slope toward the sump to encourage flow of liquid.
1.2.3 Pumps
For water testing (Chapter 2) and wing tank drop testing (Chapter 3), two 4” centrifugal pumps
connected to the base of the sump were used to evacuate liquids from the trench drain. Pump curves
and specifications for these pumps can be found in Appendix C. For both water and fire tests,
discharge lines on the pumps were composed of 4” rubber hose with a length of 50 feet discharging
into an atmospheric pressure tank.
For kerosene cascade fire testing, two 2” air operated diaphragm pumps connected to the base of
the sump were used to evacuate liquids from the trench drain. Pump curves and specifications for
these pumps can be found in Appendix D. Pumps were operated at approximately 100 psi and 50
SCFM. For both water and fire tests, discharge lines on the pumps were composed of 4” rubber
hose with a length of 50 feet discharging into an atmospheric pressure tank.
1.2.4 Flushing Manifold
The flushing system used in this flooring system consists of a 50.8 mm (2 inch) square tube with
a series of 1 mm (0.04 inch) diameter holes along its face. When pressurized with water, the
manifold sprays a stream of water down each channel of the flooring system, encouraging flow of
the spilled liquid toward the trench drain. The flow rate of the flushing manifold is 1.0 L/min (0.25
GPM) per channel.
1.2.5 Ramps
In a real-world application, ramps can be installed along all sides of the flooring system to allow
movement of aircraft on and off the floor. In some applications, the floor may be installed flush
with the hangar floor and ramps will not be needed. For testing purposes, ramps were not installed
as part of the flooring assembly.
4
Released for Public Use – 14 November 2019
2 Spill Size Testing – Elevated Discharges
2.1 Test Design and Procedure
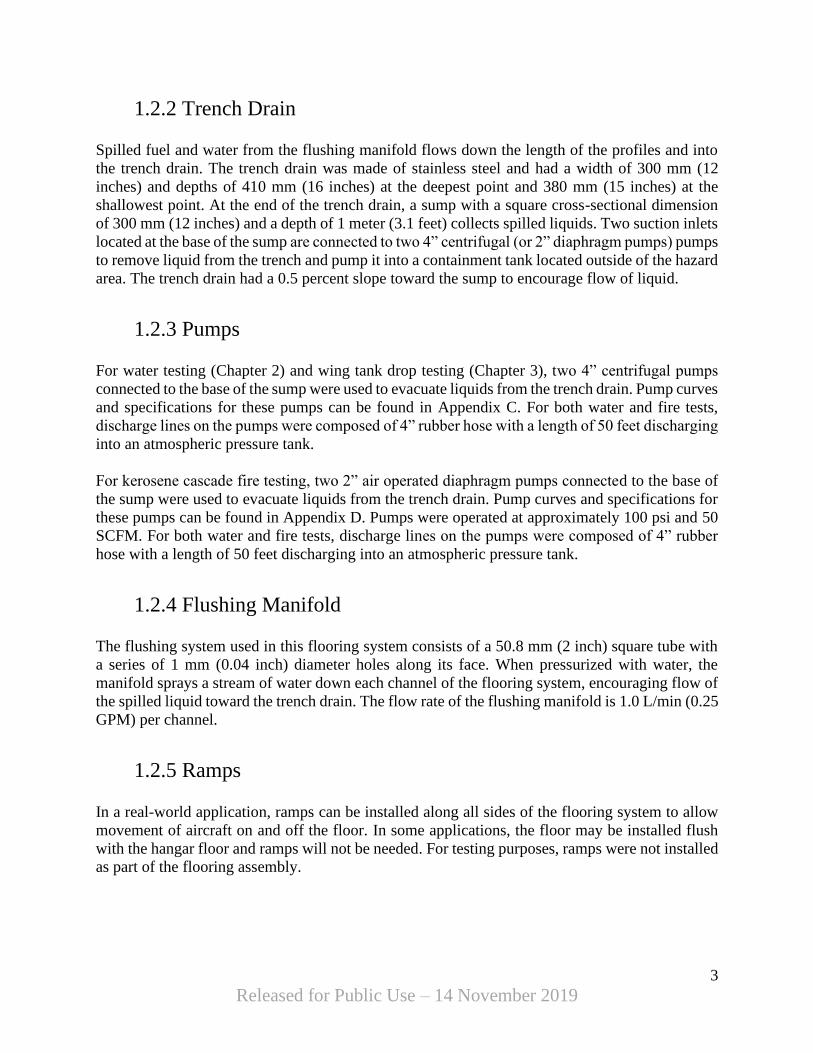
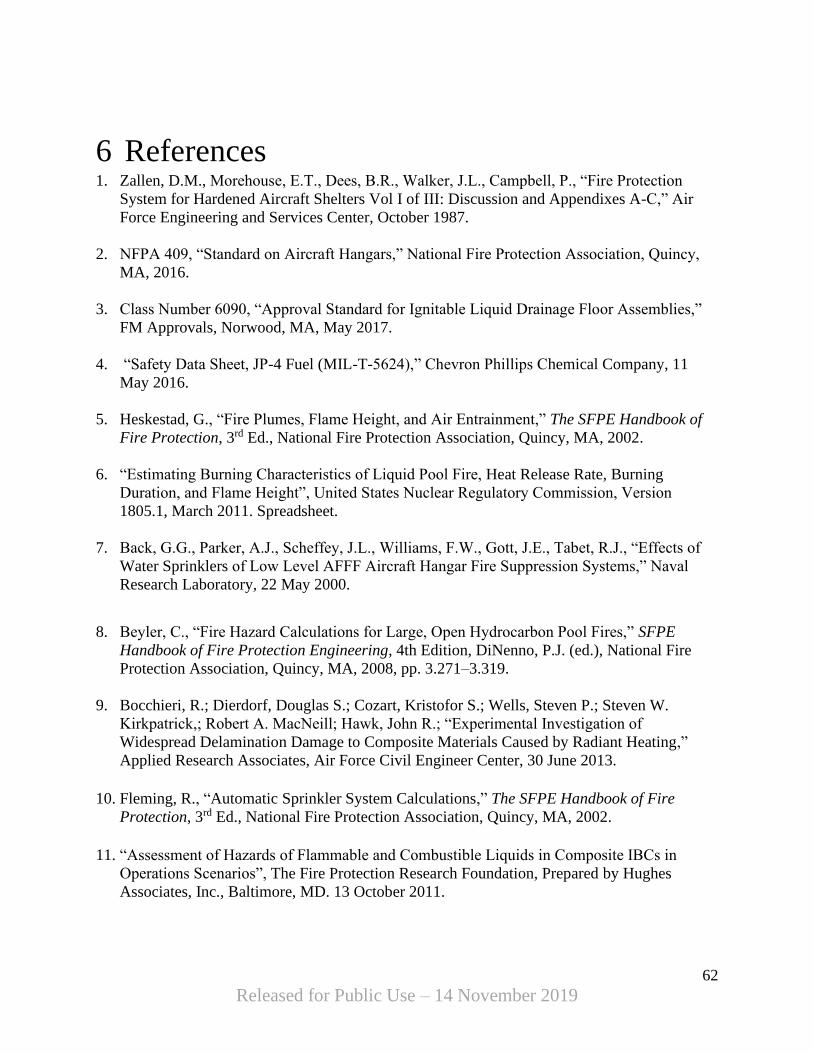
The high flow spill device (Appendix B) was placed above the flooring system in the position
shown in Figure 2-1.
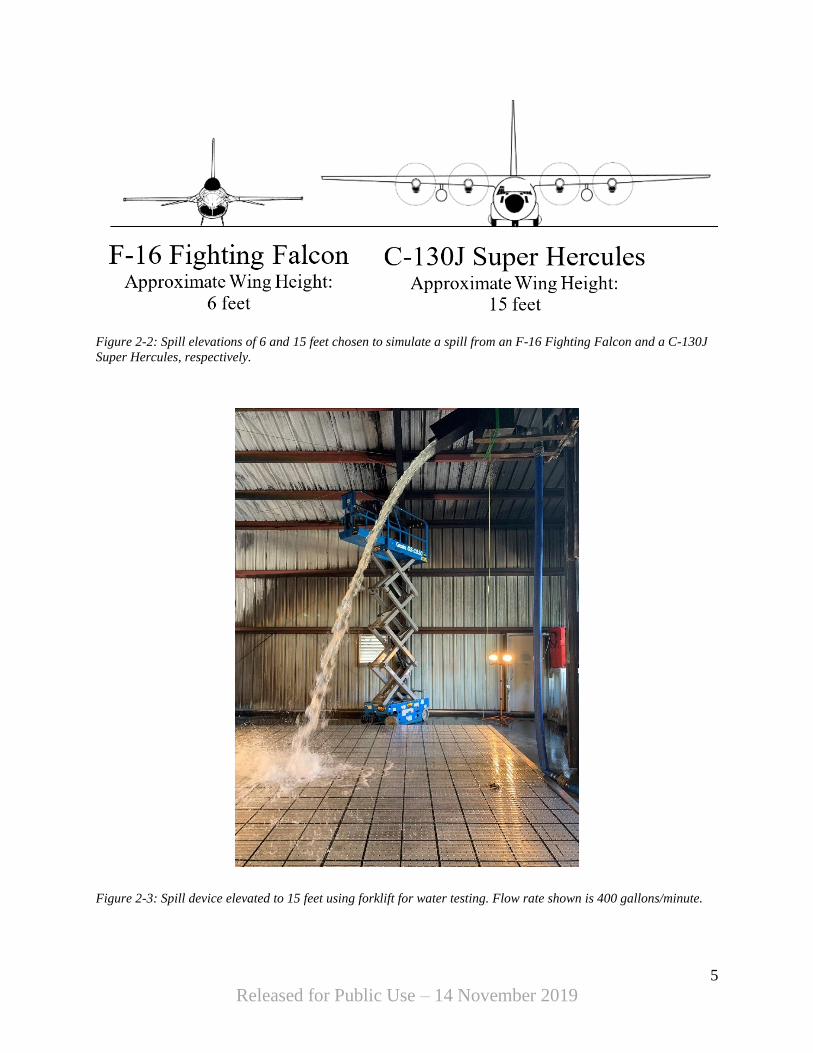
The spill device sat on top of the floor for testing at “0 ft” and was elevated to 6 and 15 feet using
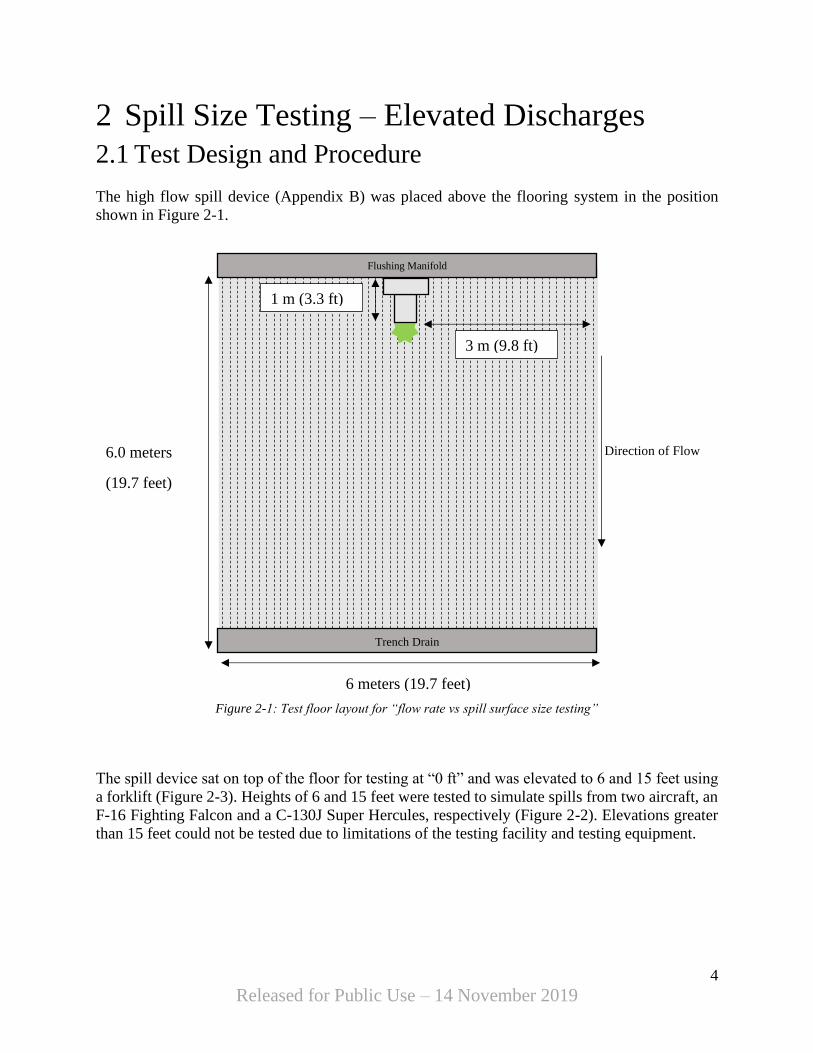
a forklift (Figure 2-3). Heights of 6 and 15 feet were tested to simulate spills from two aircraft, an
F-16 Fighting Falcon and a C-130J Super Hercules, respectively (Figure 2-2). Elevations greater
than 15 feet could not be tested due to limitations of the testing facility and testing equipment.
6.0 meters
(19.7 feet)
Flushing Manifold
Trench Drain
Direction of Flow
6 meters (19.7 feet)
1 m (3.3 ft)
3 m (9.8 ft)
Figure 2-1: Test floor layout for “flow rate vs spill surface size testing”
5
Released for Public Use – 14 November 2019
Figure 2-2: Spill elevations of 6 and 15 feet chosen to simulate a spill from an F-16 Fighting Falcon and a C-130J
Super Hercules, respectively.
Figure 2-3: Spill device elevated to 15 feet using forklift for water testing. Flow rate shown is 400 gallons/minute.
6
Released for Public Use – 14 November 2019
For spills at 0 feet, the spill area was recorded. For elevated spills, maximum splash distance and
area where 95% of spilled volume was contained were recorded, in addition to the area where the
floor was fully wetted.
Water was supplied to the spill device at the desired flow rate (± 5 gallons/minute) until a steady
state was reached. After adjusting the supply valve to obtain the desired flow rate, a minimum 2-
minute waiting period was observed to allow the floor to reach steady state. After 2-minutes, the
floor was monitored to ensure that the spill area did not change, and the floor did not overflow.
Once a steady state was observed, usually after 4-6 minutes, measurements were taken.
Measurement of spill areas required both observations during testing and review of video footage
recorded during testing. Reported spill areas are within 10% of actual spill area, as the
reflectiveness of the floor assembly and transparency of water makes observation deceiving at
times. Data is reported to the best abilities of the testing team, with respect to accuracy and
consistency.
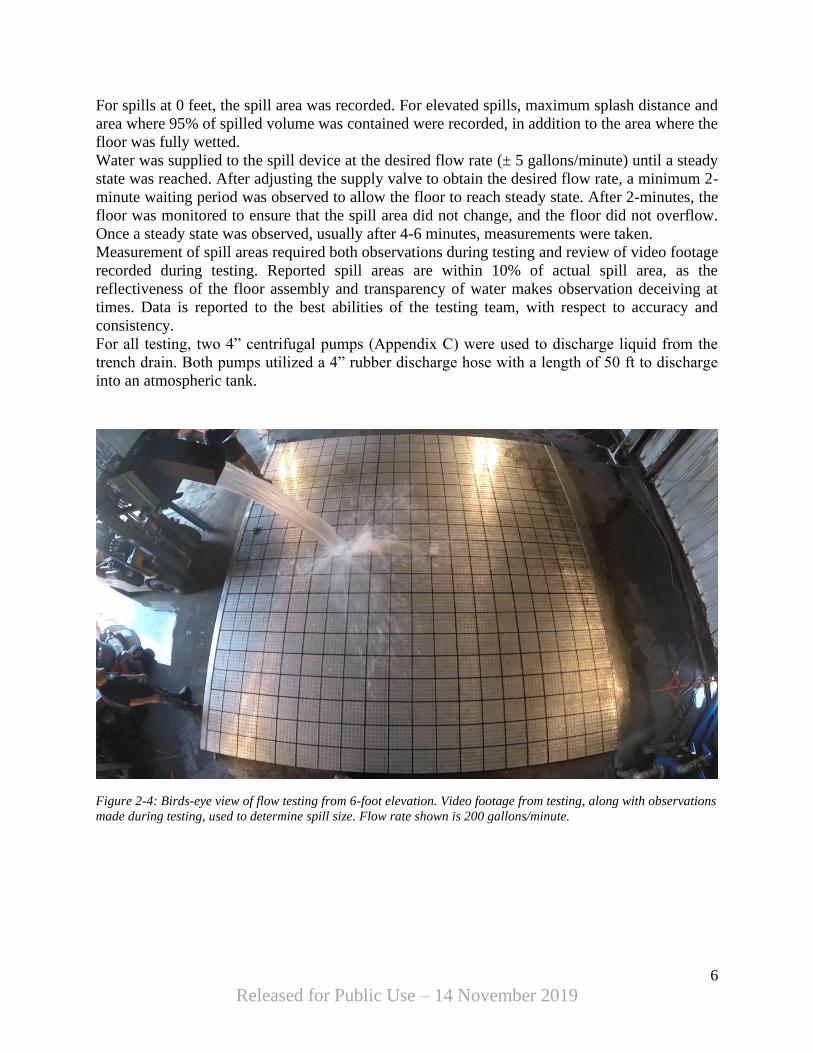
For all testing, two 4” centrifugal pumps (Appendix C) were used to discharge liquid from the
trench drain. Both pumps utilized a 4” rubber discharge hose with a length of 50 ft to discharge
into an atmospheric tank.
Figure 2-4: Birds-eye view of flow testing from 6-foot elevation. Video footage from testing, along with observations
made during testing, used to determine spill size. Flow rate shown is 200 gallons/minute.
7
Released for Public Use – 14 November 2019
2.2 Test Results
2.2.1 Measuring Maximum Splash Distance
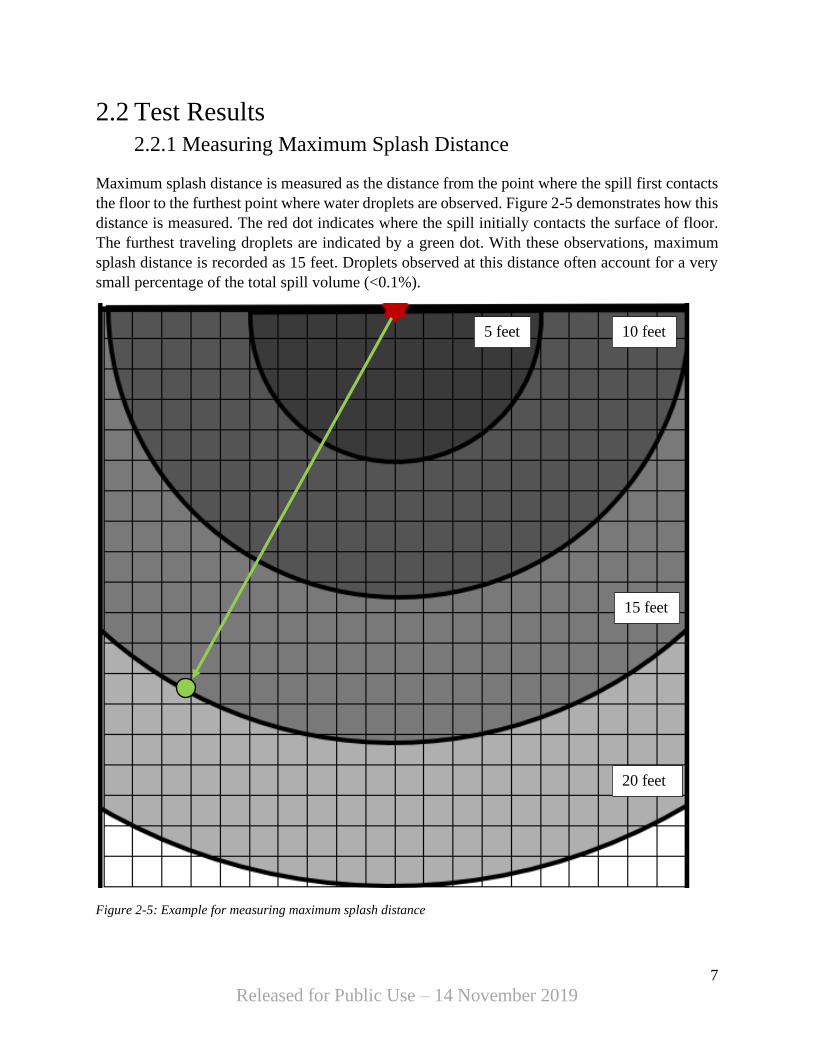
Maximum splash distance is measured as the distance from the point where the spill first contacts
the floor to the furthest point where water droplets are observed. Figure 2-5 demonstrates how this
distance is measured. The red dot indicates where the spill initially contacts the surface of floor.
The furthest traveling droplets are indicated by a green dot. With these observations, maximum
splash distance is recorded as 15 feet. Droplets observed at this distance often account for a very
small percentage of the total spill volume (<0.1%).
Figure 2-5: Example for measuring maximum splash distance
5 feet 10 feet
15 feet
20 feet
8
Released for Public Use – 14 November 2019
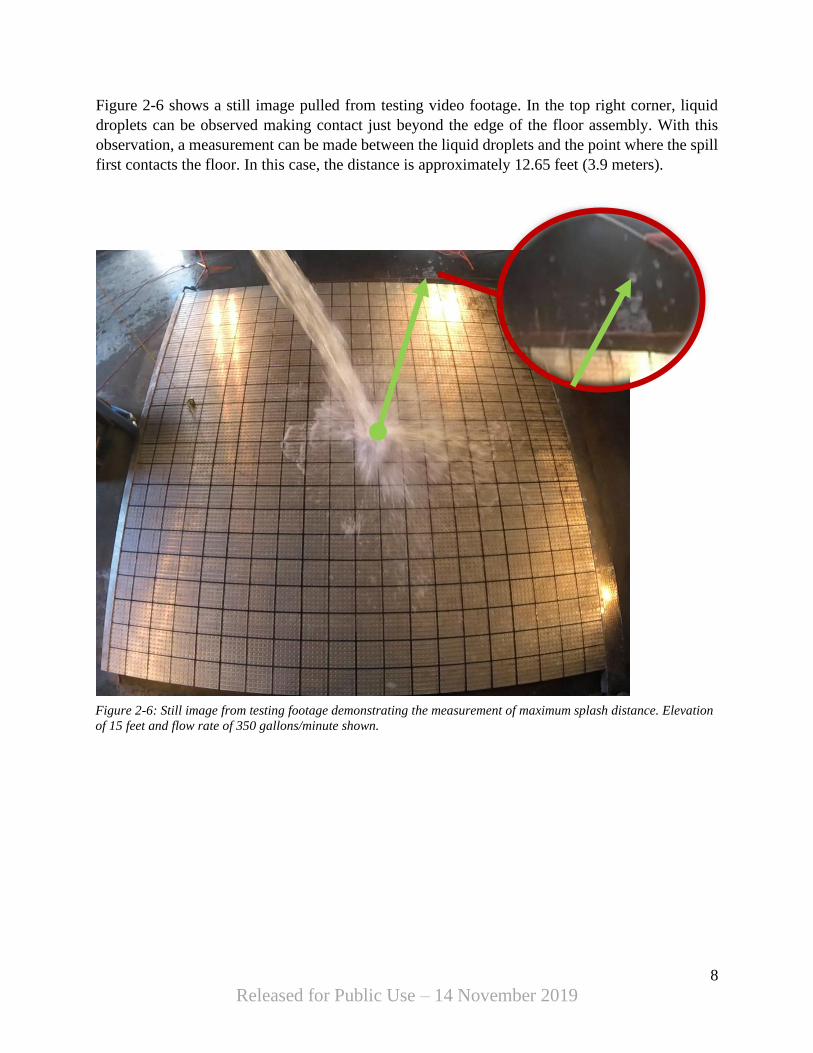
Figure 2-6 shows a still image pulled from testing video footage. In the top right corner, liquid
droplets can be observed making contact just beyond the edge of the floor assembly. With this
observation, a measurement can be made between the liquid droplets and the point where the spill
first contacts the floor. In this case, the distance is approximately 12.65 feet (3.9 meters).
Figure 2-6: Still image from testing footage demonstrating the measurement of maximum splash distance. Elevation
of 15 feet and flow rate of 350 gallons/minute shown.
9
Released for Public Use – 14 November 2019
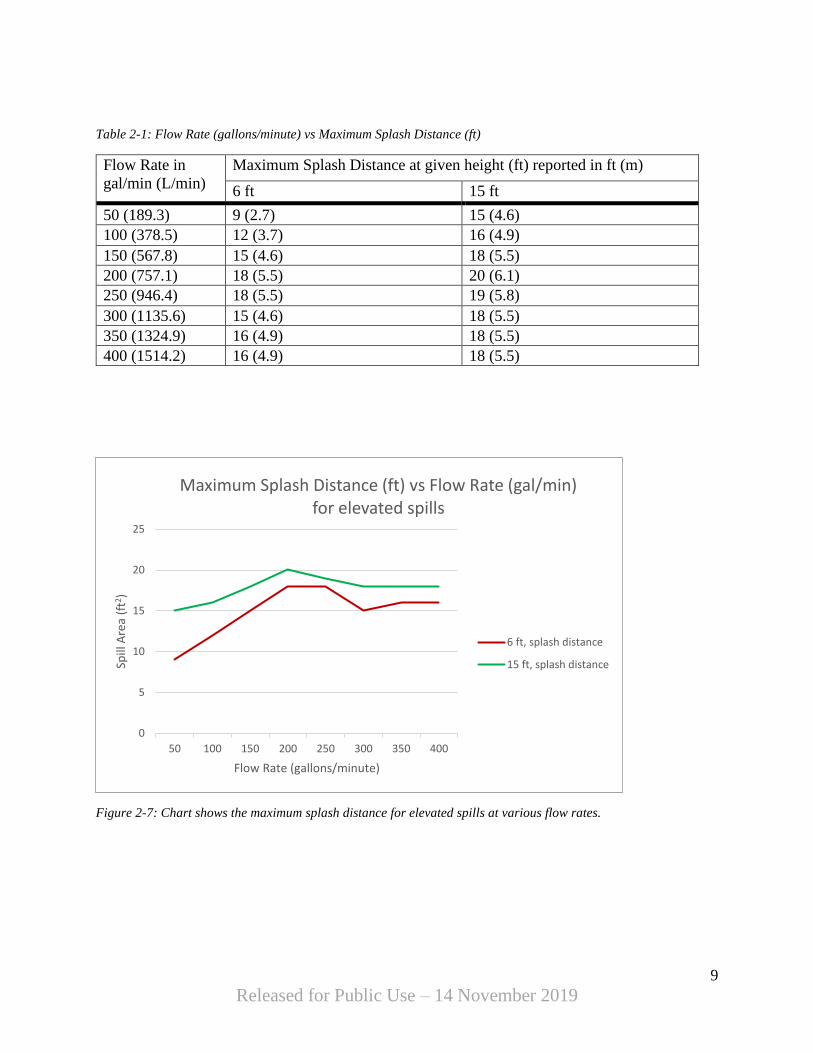
Table 2-1: Flow Rate (gallons/minute) vs Maximum Splash Distance (ft)
Figure 2-7: Chart shows the maximum splash distance for elevated spills at various flow rates.
0
5
10
15
20
25
50 100 150 200 250 300 350 400
Spill
Are
a (f
t2 )
Flow Rate (gallons/minute)
Maximum Splash Distance (ft) vs Flow Rate (gal/min) for elevated spills
6 ft, splash distance
15 ft, splash distance
Flow Rate in
gal/min (L/min)
Maximum Splash Distance at given height (ft) reported in ft (m)
6 ft 15 ft
50 (189.3) 9 (2.7) 15 (4.6)
100 (378.5) 12 (3.7) 16 (4.9)
150 (567.8) 15 (4.6) 18 (5.5)
200 (757.1) 18 (5.5) 20 (6.1)
250 (946.4) 18 (5.5) 19 (5.8)
300 (1135.6) 15 (4.6) 18 (5.5)
350 (1324.9) 16 (4.9) 18 (5.5)
400 (1514.2) 16 (4.9) 18 (5.5)
10
Released for Public Use – 14 November 2019
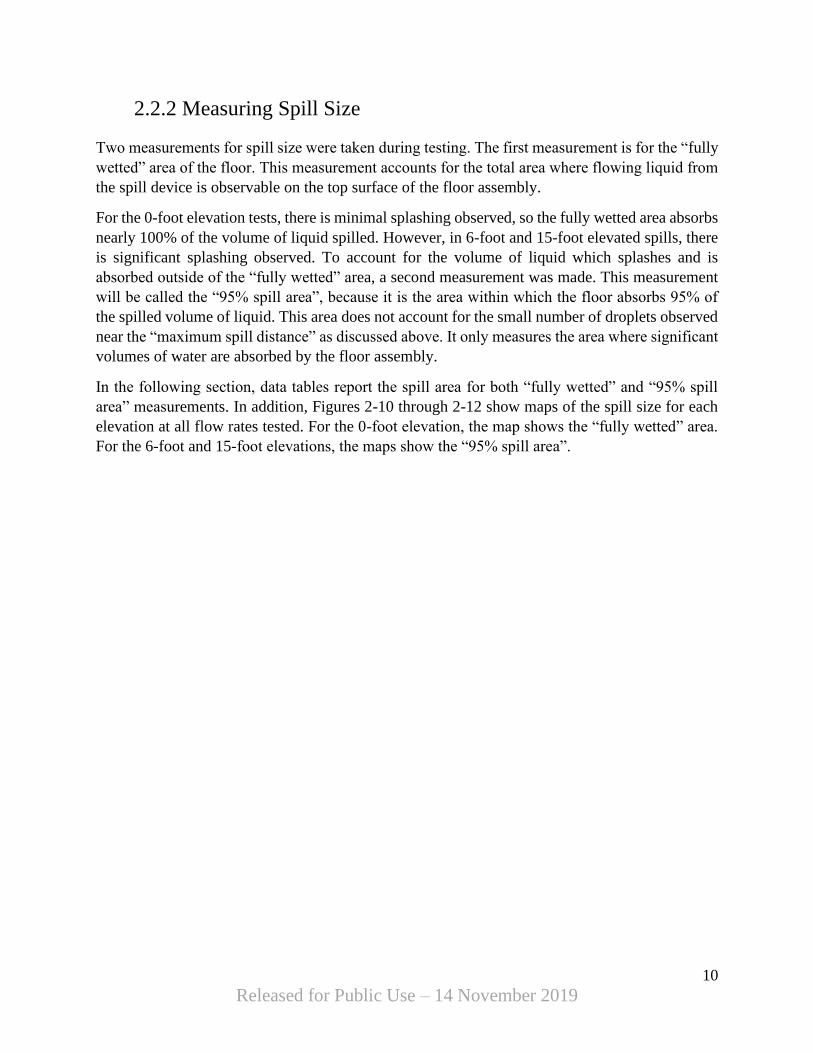
2.2.2 Measuring Spill Size
Two measurements for spill size were taken during testing. The first measurement is for the “fully
wetted” area of the floor. This measurement accounts for the total area where flowing liquid from
the spill device is observable on the top surface of the floor assembly.
For the 0-foot elevation tests, there is minimal splashing observed, so the fully wetted area absorbs
nearly 100% of the volume of liquid spilled. However, in 6-foot and 15-foot elevated spills, there
is significant splashing observed. To account for the volume of liquid which splashes and is
absorbed outside of the “fully wetted” area, a second measurement was made. This measurement
will be called the “95% spill area”, because it is the area within which the floor absorbs 95% of
the spilled volume of liquid. This area does not account for the small number of droplets observed
near the “maximum spill distance” as discussed above. It only measures the area where significant
volumes of water are absorbed by the floor assembly.
In the following section, data tables report the spill area for both “fully wetted” and “95% spill
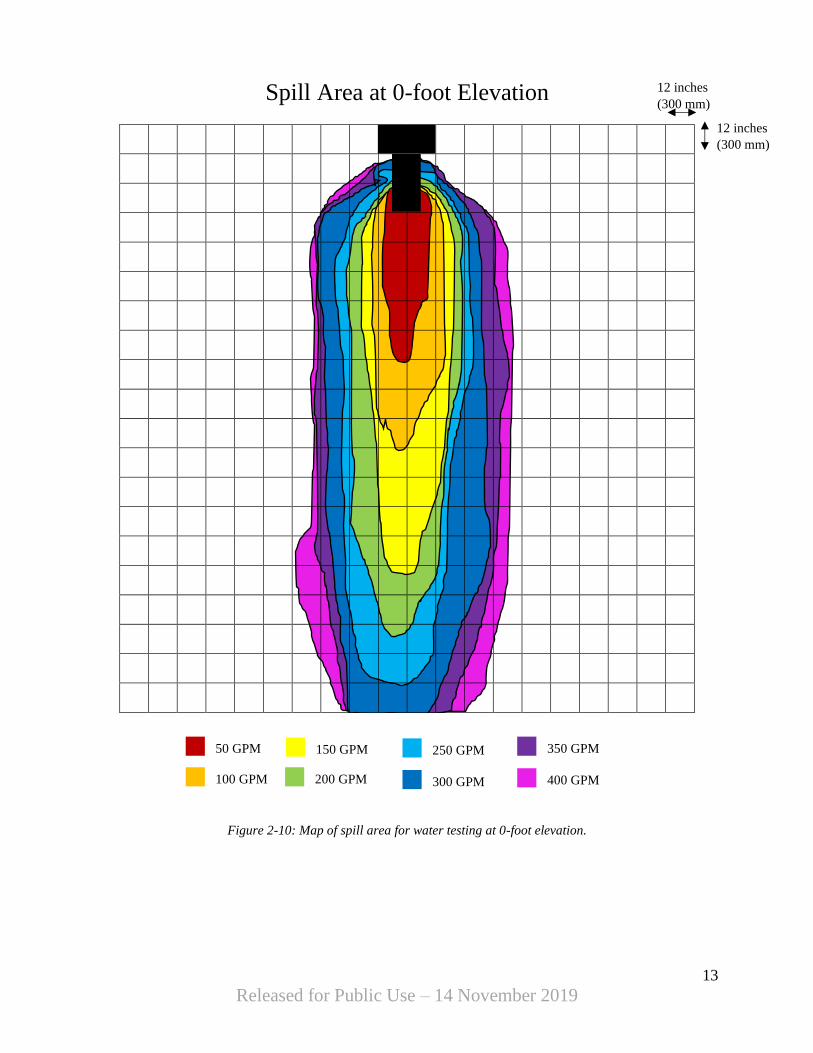
area” measurements. In addition, Figures 2-10 through 2-12 show maps of the spill size for each
elevation at all flow rates tested. For the 0-foot elevation, the map shows the “fully wetted” area.
For the 6-foot and 15-foot elevations, the maps show the “95% spill area”.
11
Released for Public Use – 14 November 2019
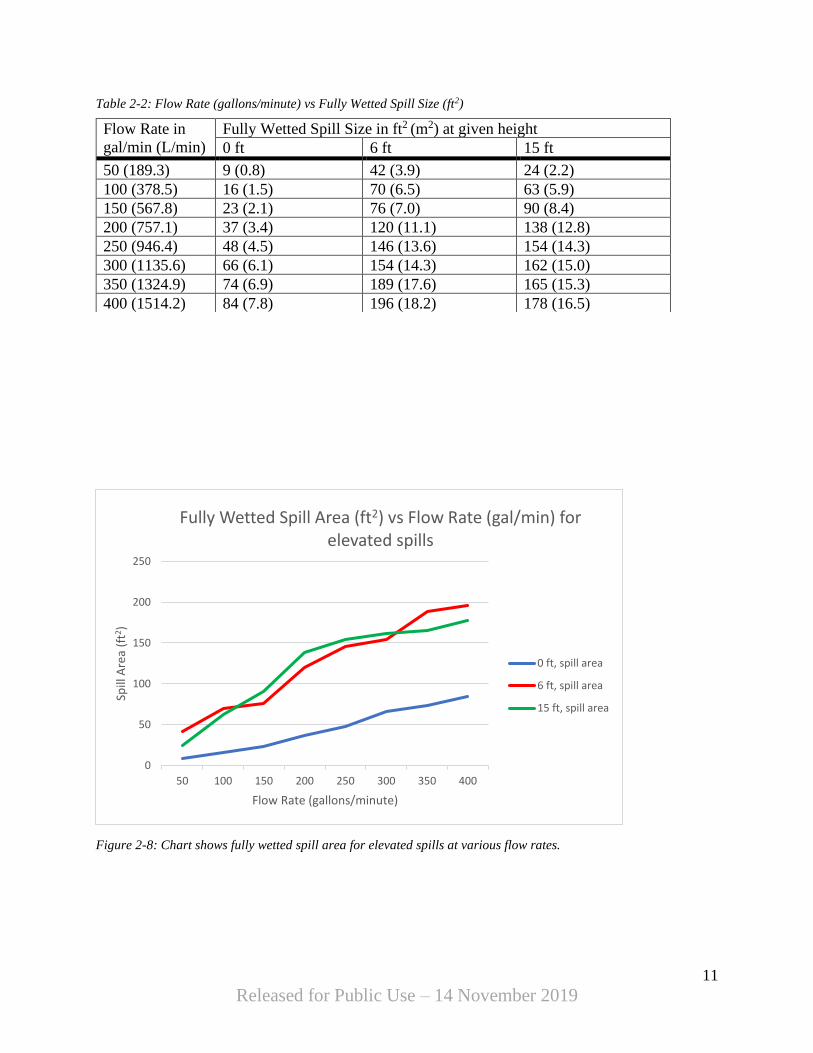
Table 2-2: Flow Rate (gallons/minute) vs Fully Wetted Spill Size (ft2)
Figure 2-8: Chart shows fully wetted spill area for elevated spills at various flow rates.
0
50
100
150
200
250
50 100 150 200 250 300 350 400
Spill
Are
a (f
t2 )
Flow Rate (gallons/minute)
Fully Wetted Spill Area (ft2) vs Flow Rate (gal/min) for elevated spills
0 ft, spill area
6 ft, spill area
15 ft, spill area
Flow Rate in
gal/min (L/min)
Fully Wetted Spill Size in ft2 (m2) at given height
0 ft 6 ft 15 ft
50 (189.3) 9 (0.8) 42 (3.9) 24 (2.2)
100 (378.5) 16 (1.5) 70 (6.5) 63 (5.9)
150 (567.8) 23 (2.1) 76 (7.0) 90 (8.4)
200 (757.1) 37 (3.4) 120 (11.1) 138 (12.8)
250 (946.4) 48 (4.5) 146 (13.6) 154 (14.3)
300 (1135.6) 66 (6.1) 154 (14.3) 162 (15.0)
350 (1324.9) 74 (6.9) 189 (17.6) 165 (15.3)
400 (1514.2) 84 (7.8) 196 (18.2) 178 (16.5)
12
Released for Public Use – 14 November 2019
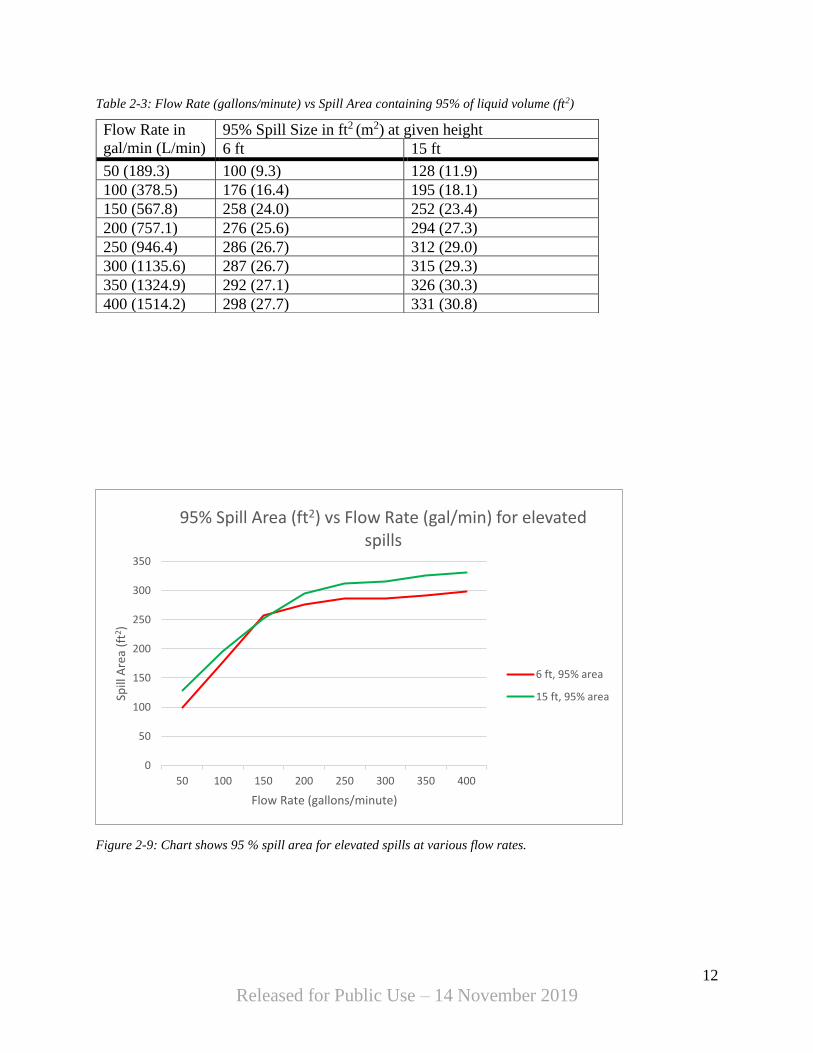
Table 2-3: Flow Rate (gallons/minute) vs Spill Area containing 95% of liquid volume (ft2)
Figure 2-9: Chart shows 95 % spill area for elevated spills at various flow rates.
0
50
100
150
200
250
300
350
50 100 150 200 250 300 350 400
Spill
Are
a (f
t2 )
Flow Rate (gallons/minute)
95% Spill Area (ft2) vs Flow Rate (gal/min) for elevated spills
6 ft, 95% area
15 ft, 95% area
Flow Rate in
gal/min (L/min)
95% Spill Size in ft2 (m2) at given height
6 ft 15 ft
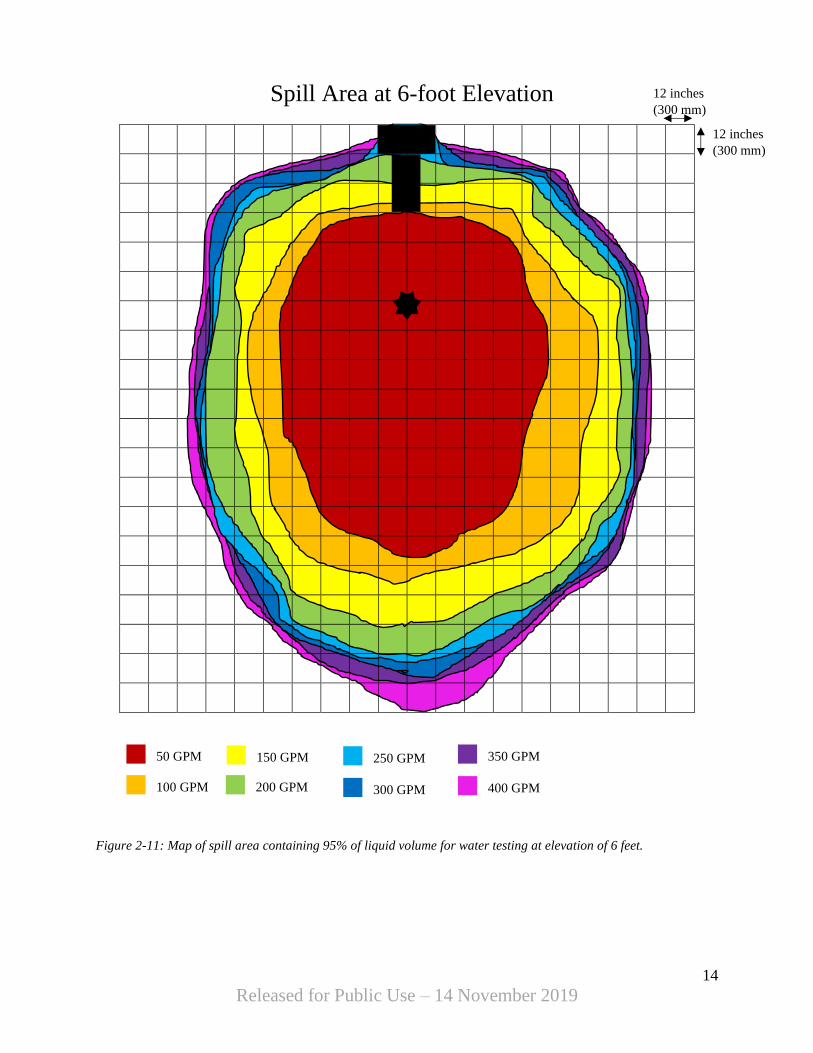
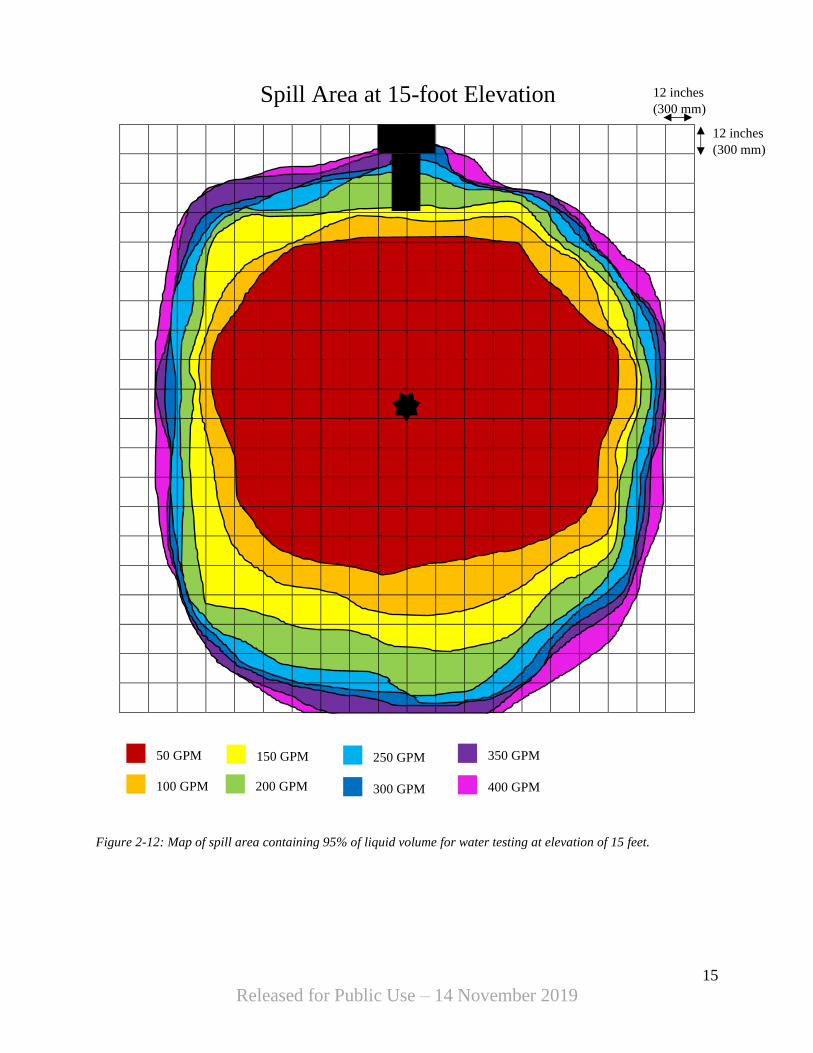
50 (189.3) 100 (9.3) 128 (11.9)
100 (378.5) 176 (16.4) 195 (18.1)
150 (567.8) 258 (24.0) 252 (23.4)
200 (757.1) 276 (25.6) 294 (27.3)
250 (946.4) 286 (26.7) 312 (29.0)
300 (1135.6) 287 (26.7) 315 (29.3)
350 (1324.9) 292 (27.1) 326 (30.3)
400 (1514.2) 298 (27.7) 331 (30.8)
13
Released for Public Use – 14 November 2019
Figure 2-10: Map of spill area for water testing at 0-foot elevation.
50 GPM
100 GPM
150 GPM
200 GPM
250 GPM
300 GPM
350 GPM
400 GPM
12 inches
(300 mm)
12 inches
(300 mm) Spill Area at 0-foot Elevation
14
Released for Public Use – 14 November 2019
Figure 2-11: Map of spill area containing 95% of liquid volume for water testing at elevation of 6 feet.
12 inches
(300 mm)
12 inches
(300 mm)
50 GPM
100 GPM
150 GPM
200 GPM
250 GPM
300 GPM
350 GPM
400 GPM
Spill Area at 6-foot Elevation
15
Released for Public Use – 14 November 2019
Figure 2-12: Map of spill area containing 95% of liquid volume for water testing at elevation of 15 feet.
12 inches
(300 mm)
12 inches
(300 mm)
50 GPM
100 GPM
150 GPM
200 GPM
250 GPM
300 GPM
350 GPM
400 GPM
Spill Area at 15-foot Elevation

16
Released for Public Use – 14 November 2019
2.2.3 Estimated Data Extrapolations
Based on the data collected, estimates can be made about spill sizes for higher flow rates and larger
floor assemblies. The floor assembly used for testing had dimensions of 19.7 feet (6.0 meters) by
19.7 feet (6.0 meters). In this section we will make estimates about spill sizes at higher flow rates
on a 30-foot (9.1 meters) by 30-foot (9.1 meters) floor assembly. In addition, estimates are made
for a scenario where the spill source is elevated to 24 ft (7.3 meters).
Table 2-4: Flow Rate (gallons/minute) vs Estimated Spill Area containing 95% of liquid volume (ft2) on 900 ft2 (83.6
m2) floor assembly.
Figure 2-13: Chart shows estimated 95% spill area for elevated spills on 900 ft2 floor assembly.
0
50
100
150
200
250
300
350
400
450
500
100 150 200 250 300 350 400 450 500 550 600 650 700 750
Spill
Are
a (f
t2)
Flow Rate (gallons/minute)
Estimated 95% Spill Area (ft2) vs Flow Rate (gal/min) for elevated spills
6 ft, 95% area
15 ft, 95% area
24 ft, 95% area
Flow Rate in
gal/min
(L/min)
95% Spill Size in ft2 (m2) at given height
6 ft 15 ft 24 ft
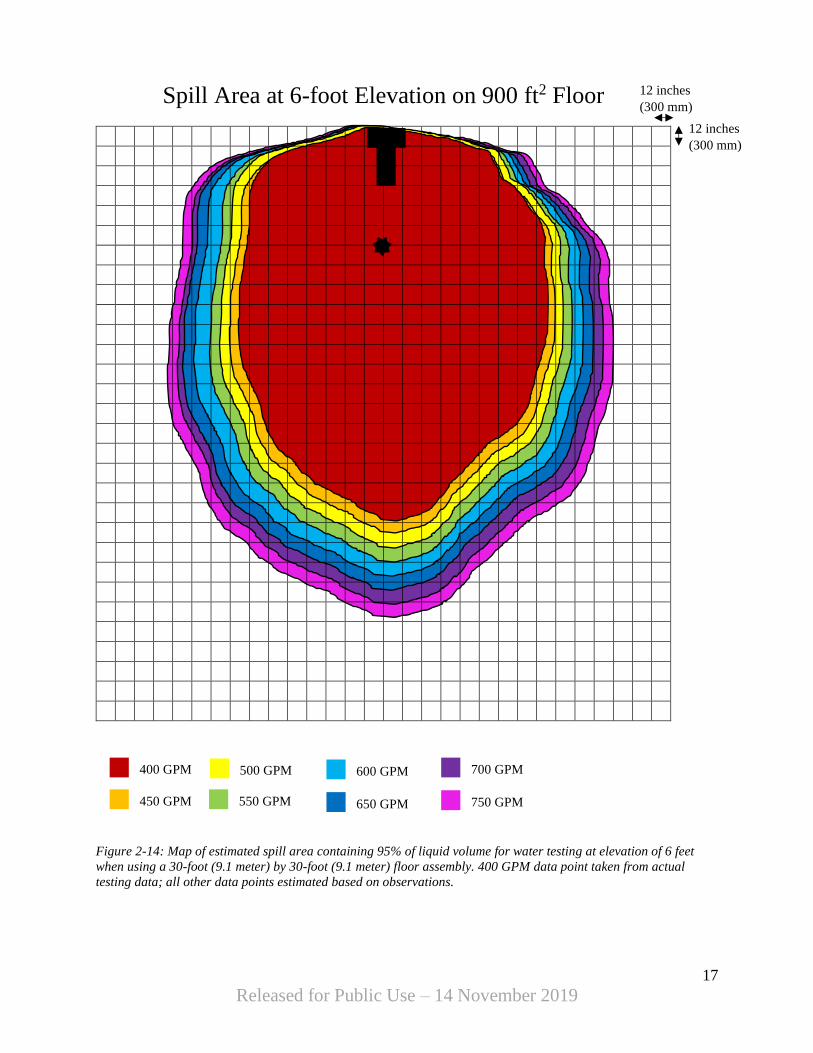
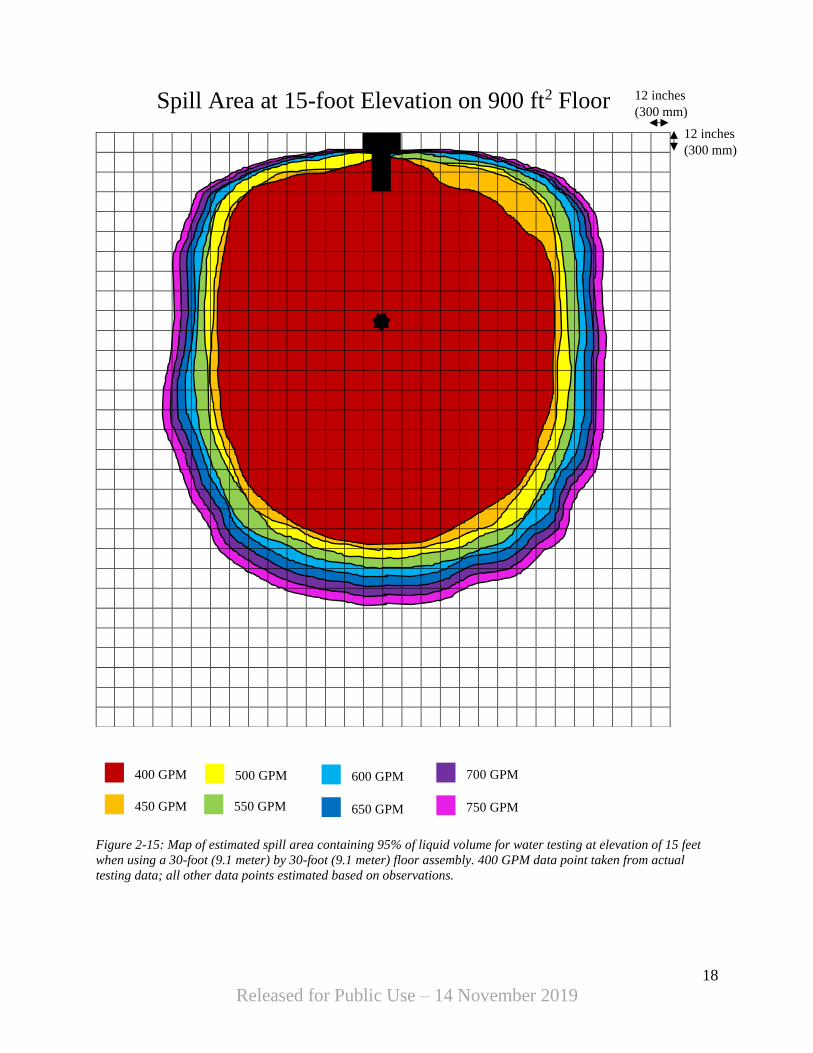
400 (1514.2) 298 (27.7) 331 (30.8) 360 (33.4)
450 (1703.4) 306 (28.4) 339 (31.5) 370 (34.4)
500 (1892.7) 315 (29.3) 351 (32.6) 382 (35.5)
550 (2082.0) 326 (30.3) 366 (34.0) 396 (36.8)
600 (2271.2) 338 (31.4) 379 (35.2) 410 (38.1)
650 (2460.5) 355 (33.0) 393 (36.5) 426 (39.6)
700 (2650.0) 372 (34.6) 411 (38.2) 444 (41.2)
750 (2839.1) 391 (36.3) 427 (39.7) 464 (43.1)
17
Released for Public Use – 14 November 2019
Figure 2-14: Map of estimated spill area containing 95% of liquid volume for water testing at elevation of 6 feet
when using a 30-foot (9.1 meter) by 30-foot (9.1 meter) floor assembly. 400 GPM data point taken from actual
testing data; all other data points estimated based on observations.
12 inches
(300 mm)
12 inches
(300 mm)
400 GPM
450 GPM
500 GPM
550 GPM
600 GPM
650 GPM
700 GPM
750 GPM
Spill Area at 6-foot Elevation on 900 ft2 Floor
18
Released for Public Use – 14 November 2019
Figure 2-15: Map of estimated spill area containing 95% of liquid volume for water testing at elevation of 15 feet
when using a 30-foot (9.1 meter) by 30-foot (9.1 meter) floor assembly. 400 GPM data point taken from actual
testing data; all other data points estimated based on observations.
12 inches
(300 mm)
12 inches
(300 mm)
400 GPM
450 GPM
500 GPM
550 GPM
600 GPM
650 GPM
700 GPM
750 GPM
Spill Area at 15-foot Elevation on 900 ft2 Floor
19
Released for Public Use – 14 November 2019
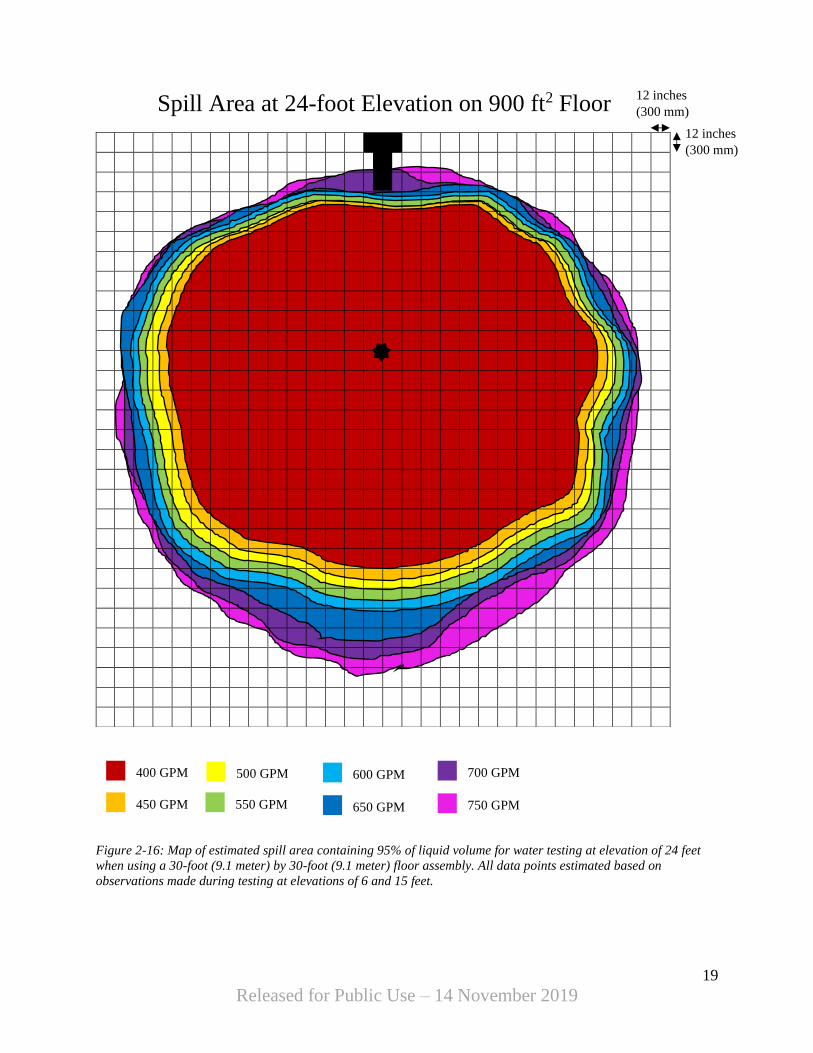
Figure 2-16: Map of estimated spill area containing 95% of liquid volume for water testing at elevation of 24 feet
when using a 30-foot (9.1 meter) by 30-foot (9.1 meter) floor assembly. All data points estimated based on
observations made during testing at elevations of 6 and 15 feet.
12 inches
(300 mm)
12 inches
(300 mm)
400 GPM
450 GPM
500 GPM
550 GPM
600 GPM
650 GPM
700 GPM
750 GPM
Spill Area at 24-foot Elevation on 900 ft2 Floor
20
Released for Public Use – 14 November 2019
2.2.4 Conclusions
• Maps in Figures 2-10 through 2-12 provide data showing spill area on a floor assembly.
Additional factors, such as maximum splash distance, are reported as well. Floor assemblies
must be designed with adequate standoff based on general requirements detailed in
Appendix E and submitted to NFPA 409 as public comment.
• Maximum flow rate in testing was 400 gallons/minute due to overflowing liquid at edges of
floor. However, system drainage capacity was never exceeded. As demonstrated in Section
2.2.3, larger floor assemblies are capable of handling higher flow rates and can be designed
to handle whatever the worst-case scenario is for flow rate.
• Maximum splash distance was very similar between 6 ft and 15 ft elevations. Maximum
recorded distance was 20 feet, which occurred at an elevation of 15 ft and flow rate of 200
gallons/minute. At flow rates exceeding 200 gallons/minute, splash distance appeared to
level off for both elevations. It is reasonable to conclude that regardless of increases in flow
rate or elevation, 20 feet is a good estimate of maximum splash distance.
• Test data does not exceed flow rates of 400 gallons/minute or elevations of 15 feet.
However, reasonable estimates for these conditions have been shown in Figures 2-13
through 2-16. If a potential application involves flow rates or elevations outside of testing
data, additional testing could be conducted to gather data for these scenarios.

21
Released for Public Use – 14 November 2019
3 Wing Tank Drop Fire Test
3.1 Test Design and Procedure The first test conducted simulates a fire scenario in which a wing tank drops from an
aircraft and splits, instantaneously releasing its contents. This fire scenario is based on a
1985 testing scenario created by the U.S. Air Force [1].
“Test 1” described above was recreated with slight modifications. JP-4 fuel has an
approximate composition of 70% kerosene and 30% gasoline [4], but it is not a readily
available fuel. Even the civilian equivalent, Jet B, is difficult to procure, particularly
outside of cold-weather regions.
In place of JP-4, a fuel mixture consisting of one part gasoline (33.3%) and two parts
kerosene (66.7%) was used for testing. 165 gallons of this fuel mixture was contained in a
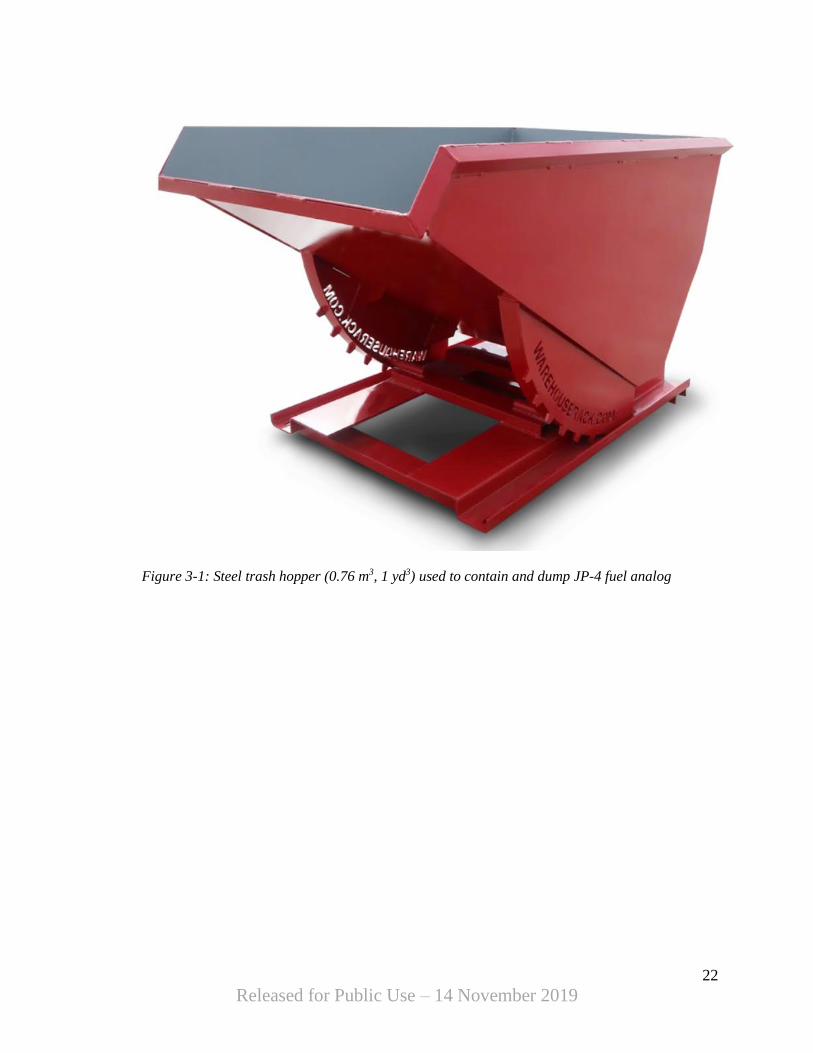
steel trash hopper with a volume of 0.76 m3 (1 cubic yard, 200 gallons) shown in Figure 3-
1. A stainless-steel lid was installed on top of the trash hopper to reduce expelled vapors in
the testing area.
Two methods were used to ignite the fuel spill:
1. A rolled cotton igniter was soaked in gasoline and placed on top of the flooring system
1 meter (3.1 feet) in front of the trash hopper. The igniter was ignited using a propane
torch, then the contents of the hopper were dumped.
2. The fuel was ignited inside of the trash hopper using a propane torch. The hopper was
then dumped after a 10 second pre-burn.
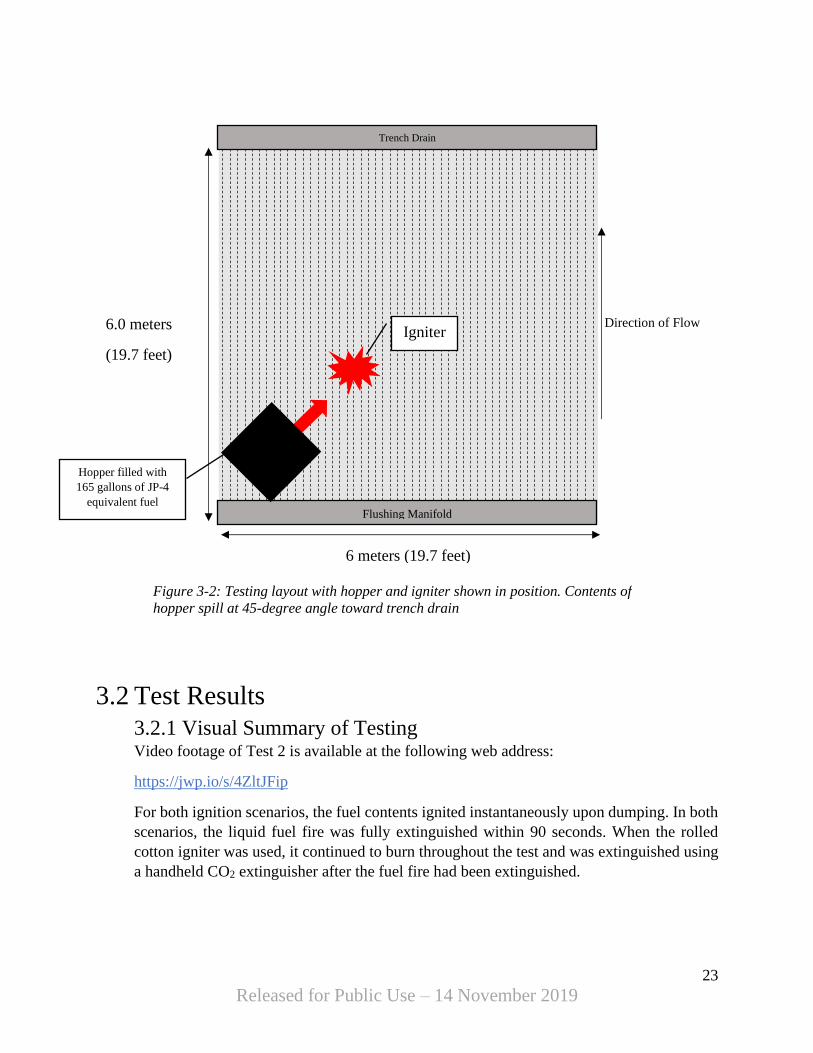
For all testing, a controlled tipping of the hopper was accomplished using a winch and
pulley system. The dumping motion was completed, and the entire fuel contents of the
hopper were expelled in 20 seconds. The layout of the flooring system and location of the
hopper and igniter is shown in Figure 3-2.
22
Released for Public Use – 14 November 2019
Figure 3-1: Steel trash hopper (0.76 m3, 1 yd3) used to contain and dump JP-4 fuel analog
23
Released for Public Use – 14 November 2019
3.2 Test Results
3.2.1 Visual Summary of Testing Video footage of Test 2 is available at the following web address:
https://jwp.io/s/4ZltJFip
For both ignition scenarios, the fuel contents ignited instantaneously upon dumping. In both
scenarios, the liquid fuel fire was fully extinguished within 90 seconds. When the rolled
cotton igniter was used, it continued to burn throughout the test and was extinguished using
a handheld CO2 extinguisher after the fuel fire had been extinguished.
6.0 meters
(19.7 feet)
Trench Drain
Flushing Manifold
Direction of Flow
6 meters (19.7 feet)
Figure 3-2: Testing layout with hopper and igniter shown in position. Contents of
hopper spill at 45-degree angle toward trench drain
Igniter
Hopper filled with
165 gallons of JP-4
equivalent fuel
24
Released for Public Use – 14 November 2019
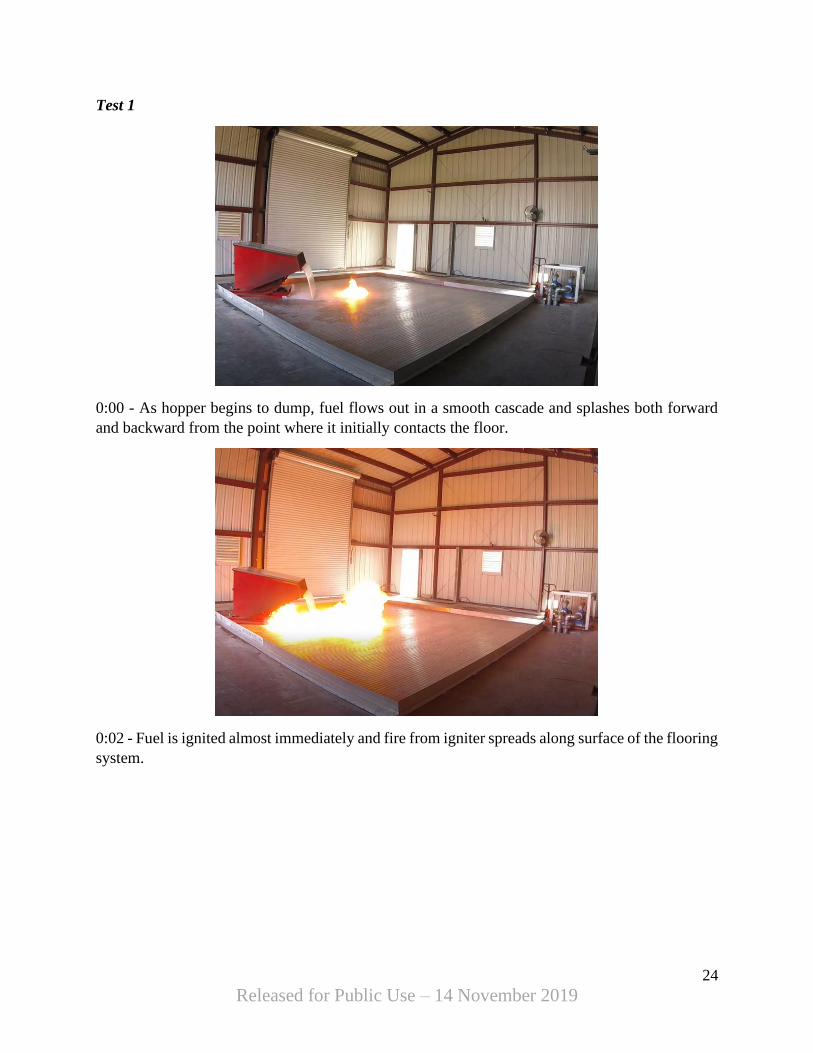
Test 1
0:00 - As hopper begins to dump, fuel flows out in a smooth cascade and splashes both forward
and backward from the point where it initially contacts the floor.
0:02 - Fuel is ignited almost immediately and fire from igniter spreads along surface of the flooring
system.
25
Released for Public Use – 14 November 2019
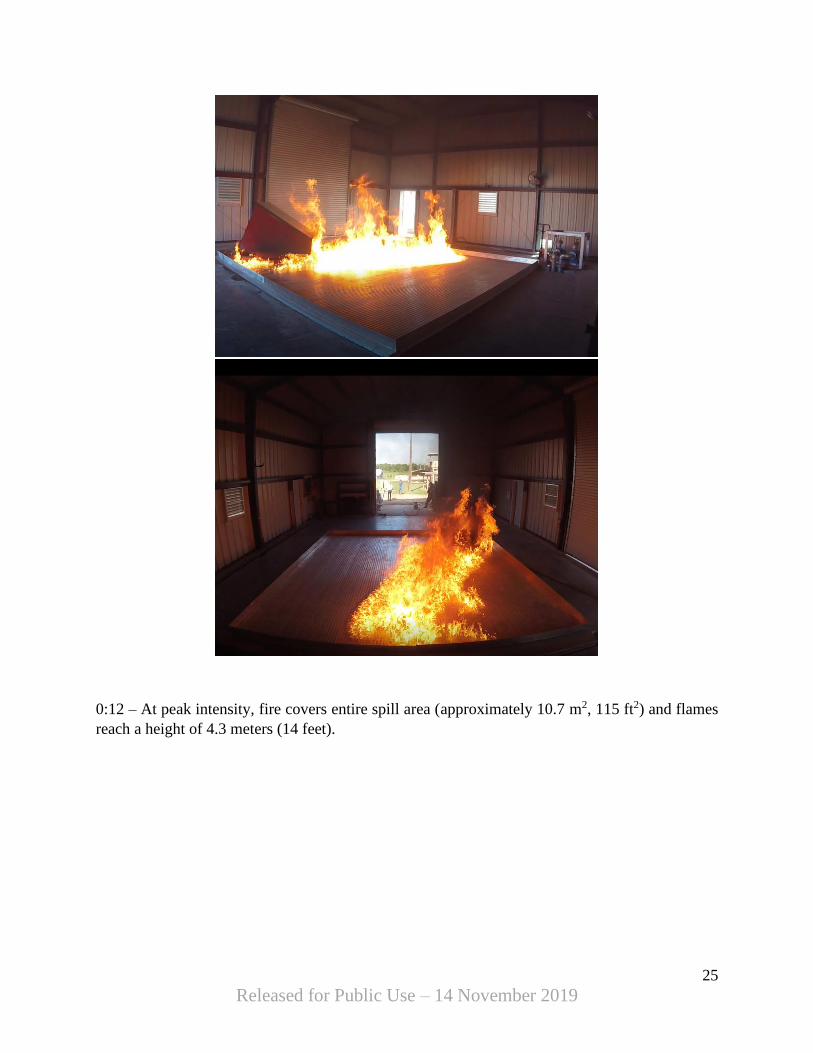
0:12 – At peak intensity, fire covers entire spill area (approximately 10.7 m2, 115 ft2) and flames
reach a height of 4.3 meters (14 feet).
26
Released for Public Use – 14 November 2019
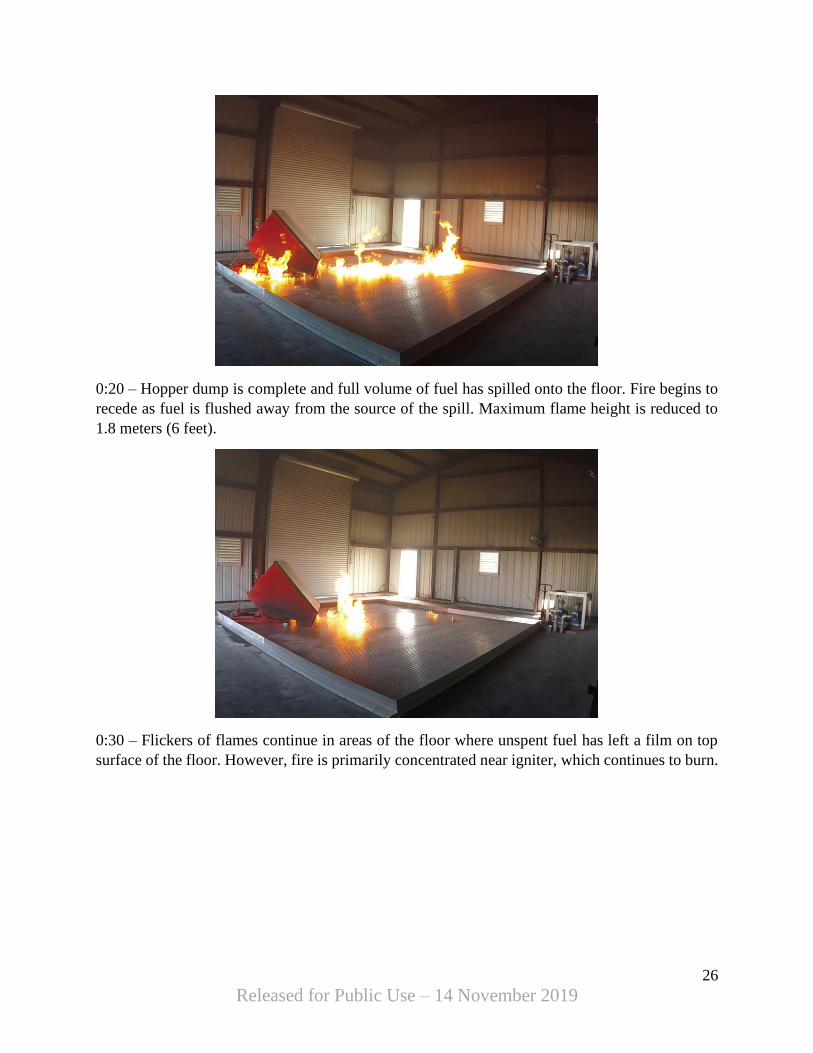
0:20 – Hopper dump is complete and full volume of fuel has spilled onto the floor. Fire begins to
recede as fuel is flushed away from the source of the spill. Maximum flame height is reduced to
1.8 meters (6 feet).
0:30 – Flickers of flames continue in areas of the floor where unspent fuel has left a film on top
surface of the floor. However, fire is primarily concentrated near igniter, which continues to burn.
27
Released for Public Use – 14 November 2019
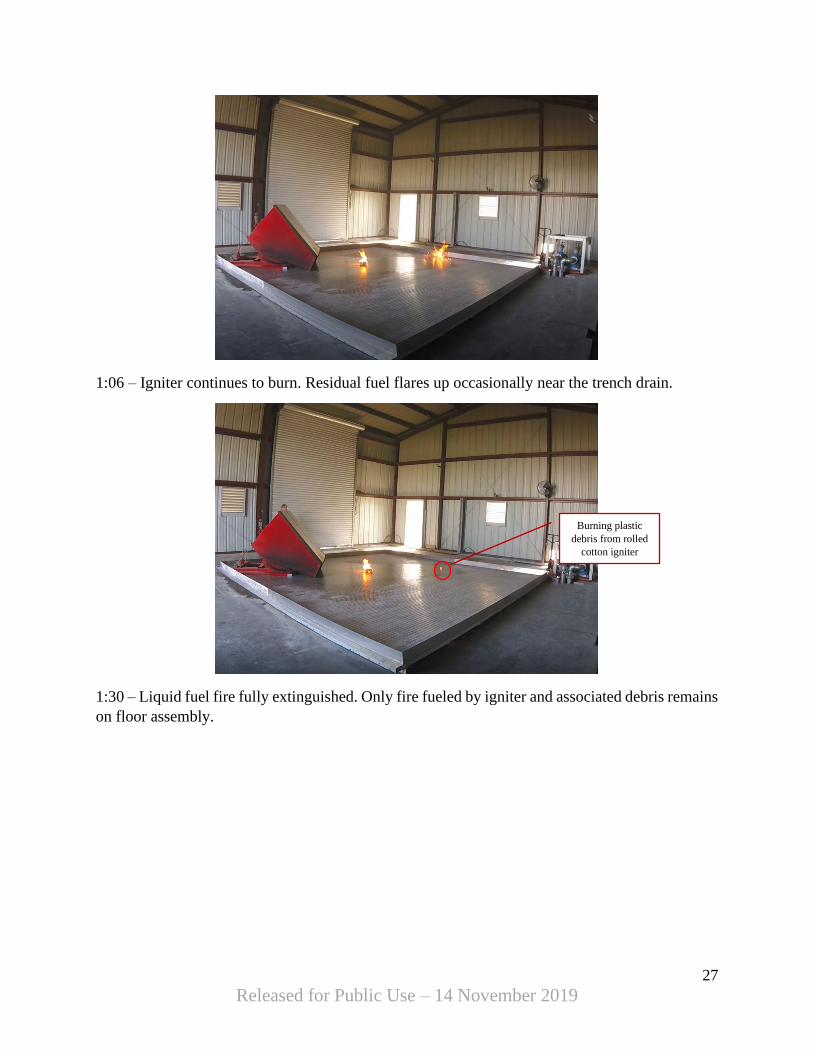
1:06 – Igniter continues to burn. Residual fuel flares up occasionally near the trench drain.
1:30 – Liquid fuel fire fully extinguished. Only fire fueled by igniter and associated debris remains
on floor assembly.
Burning plastic
debris from rolled
cotton igniter
28
Released for Public Use – 14 November 2019
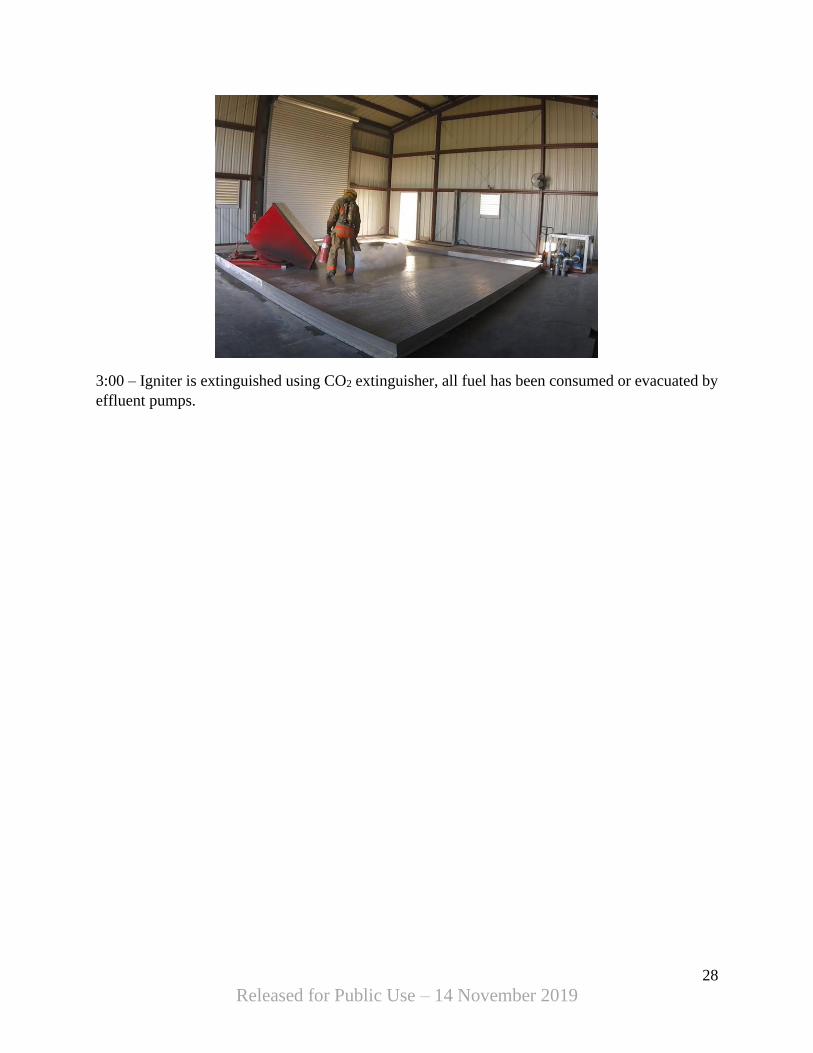
3:00 – Igniter is extinguished using CO2 extinguisher, all fuel has been consumed or evacuated by
effluent pumps.
29
Released for Public Use – 14 November 2019
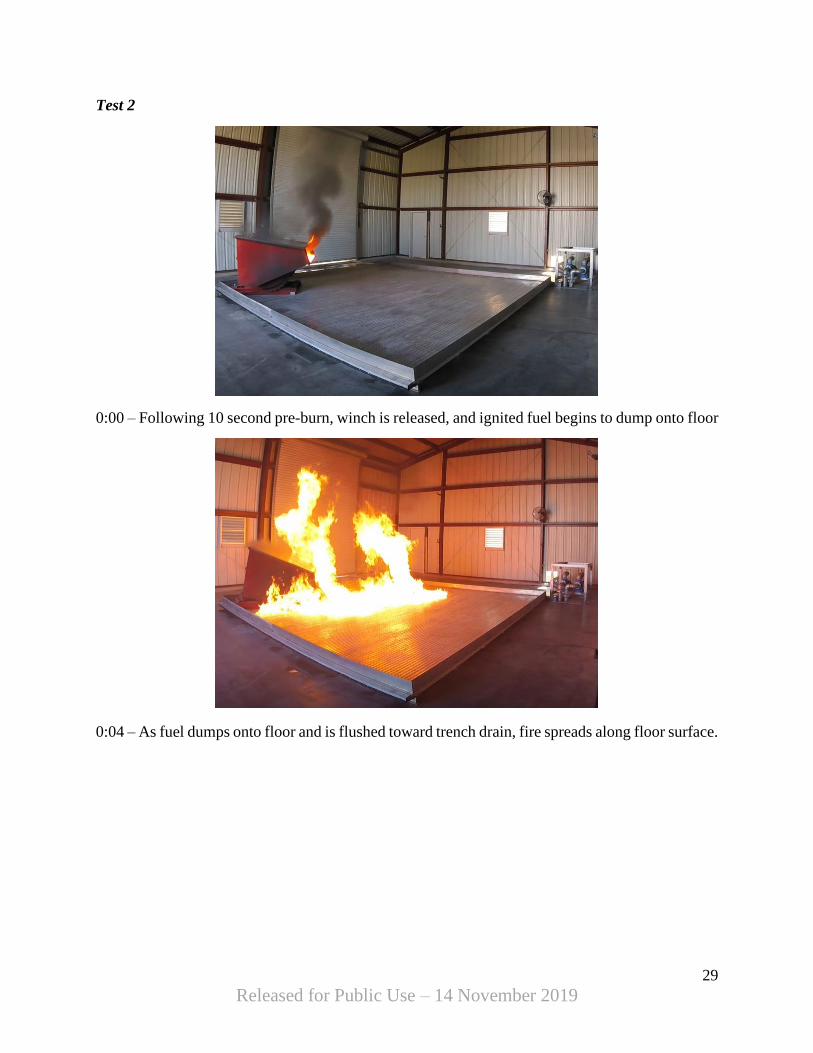
Test 2
0:00 – Following 10 second pre-burn, winch is released, and ignited fuel begins to dump onto floor
0:04 – As fuel dumps onto floor and is flushed toward trench drain, fire spreads along floor surface.
30
Released for Public Use – 14 November 2019
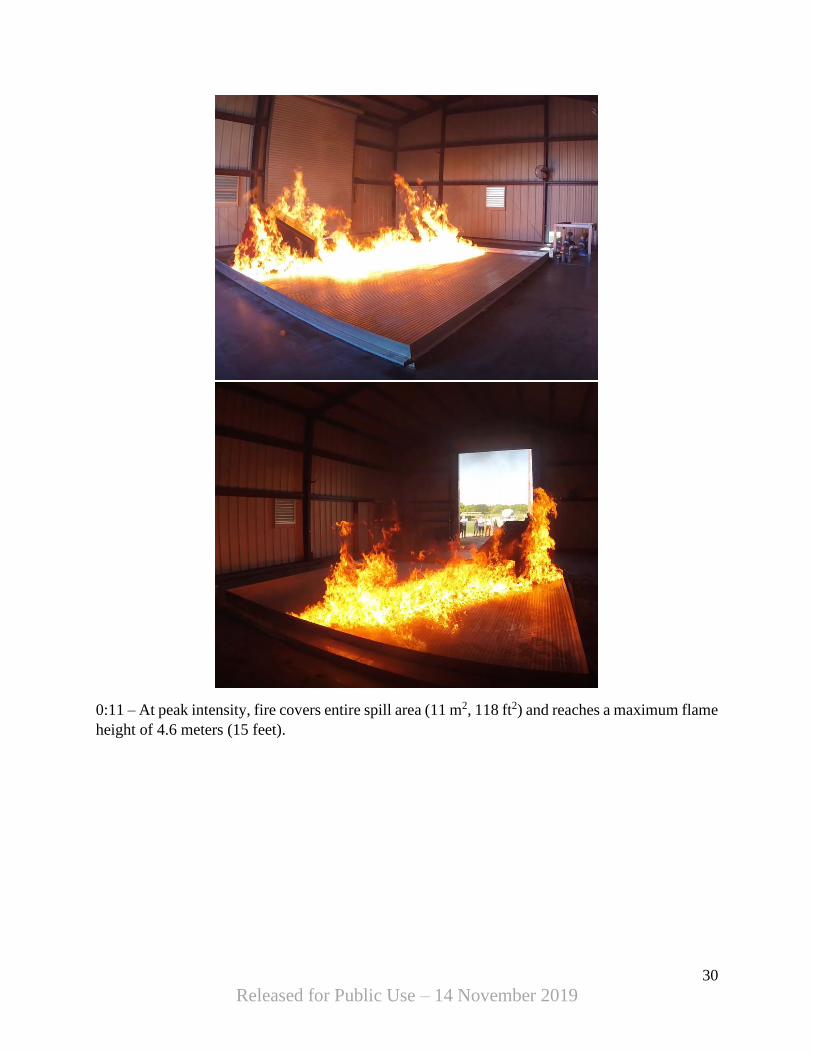
0:11 – At peak intensity, fire covers entire spill area (11 m2, 118 ft2) and reaches a maximum flame
height of 4.6 meters (15 feet).
31
Released for Public Use – 14 November 2019
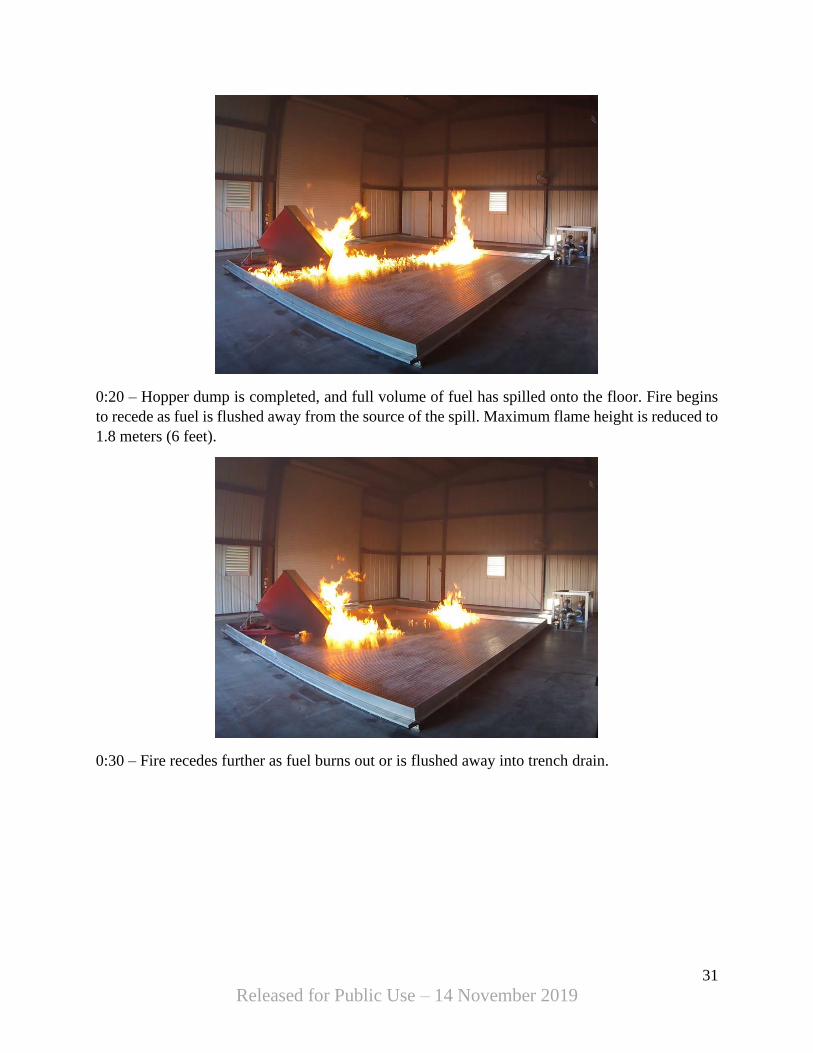
0:20 – Hopper dump is completed, and full volume of fuel has spilled onto the floor. Fire begins
to recede as fuel is flushed away from the source of the spill. Maximum flame height is reduced to
1.8 meters (6 feet).
0:30 – Fire recedes further as fuel burns out or is flushed away into trench drain.
32
Released for Public Use – 14 November 2019
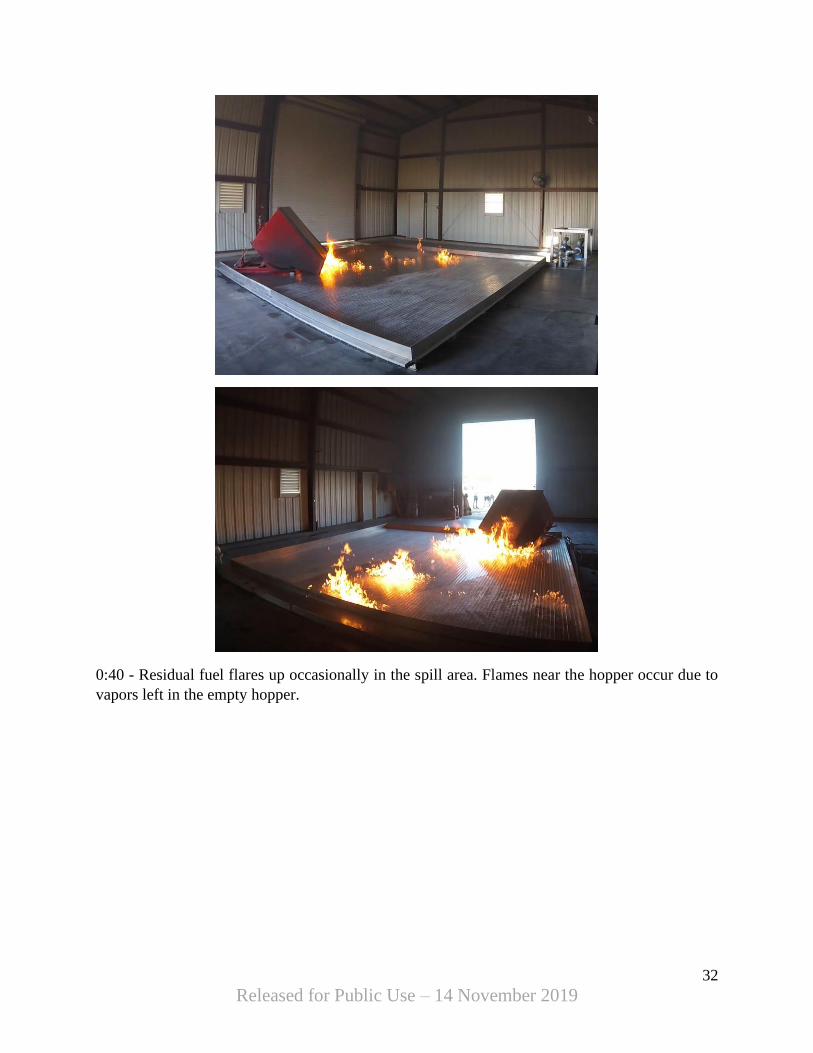
0:40 - Residual fuel flares up occasionally in the spill area. Flames near the hopper occur due to
vapors left in the empty hopper.

33
Released for Public Use – 14 November 2019
1:26 – Fire is completely extinguished. All fuel has been either consumed or evacuated by the
effluent pumps.
34
Released for Public Use – 14 November 2019
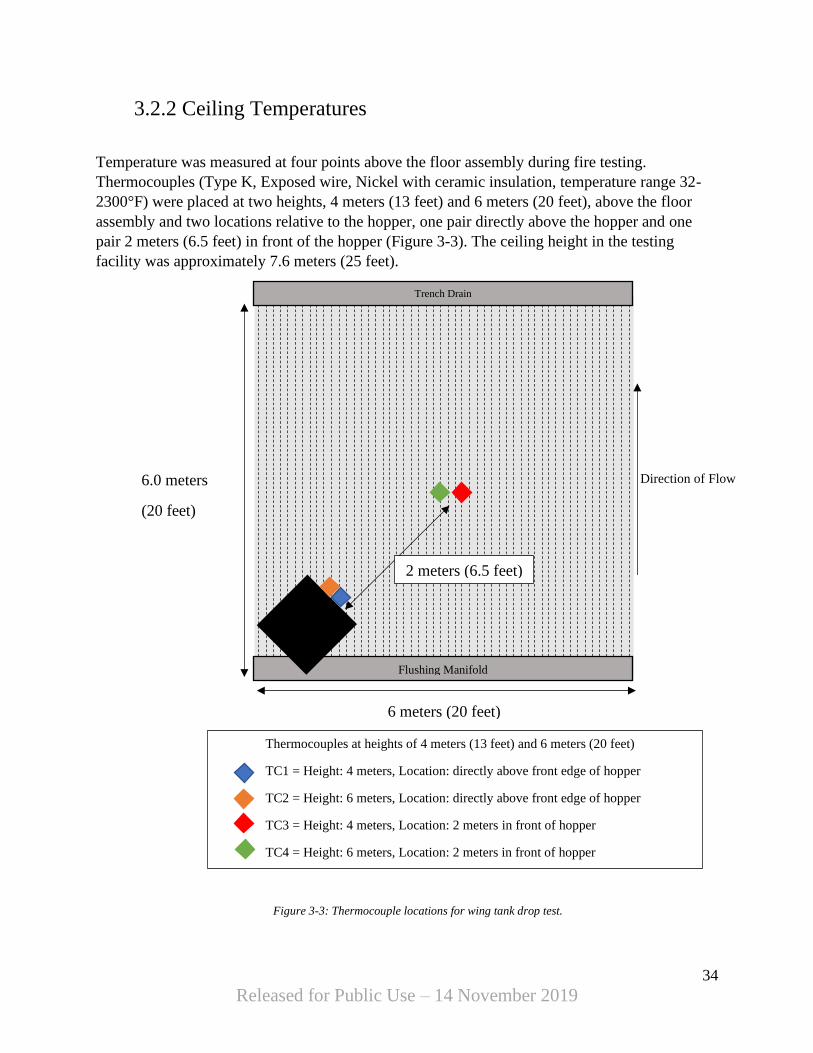
3.2.2 Ceiling Temperatures
Temperature was measured at four points above the floor assembly during fire testing.
Thermocouples (Type K, Exposed wire, Nickel with ceramic insulation, temperature range 32-
2300°F) were placed at two heights, 4 meters (13 feet) and 6 meters (20 feet), above the floor
assembly and two locations relative to the hopper, one pair directly above the hopper and one
pair 2 meters (6.5 feet) in front of the hopper (Figure 3-3). The ceiling height in the testing
facility was approximately 7.6 meters (25 feet).
6.0 meters
(20 feet)
Trench Drain
Flushing Manifold
Direction of Flow
6 meters (20 feet)
2 meters (6.5 feet)
Thermocouples at heights of 4 meters (13 feet) and 6 meters (20 feet)
TC1 = Height: 4 meters, Location: directly above front edge of hopper
TC2 = Height: 6 meters, Location: directly above front edge of hopper
TC3 = Height: 4 meters, Location: 2 meters in front of hopper
TC4 = Height: 6 meters, Location: 2 meters in front of hopper
Figure 3-3: Thermocouple locations for wing tank drop test.
35
Released for Public Use – 14 November 2019
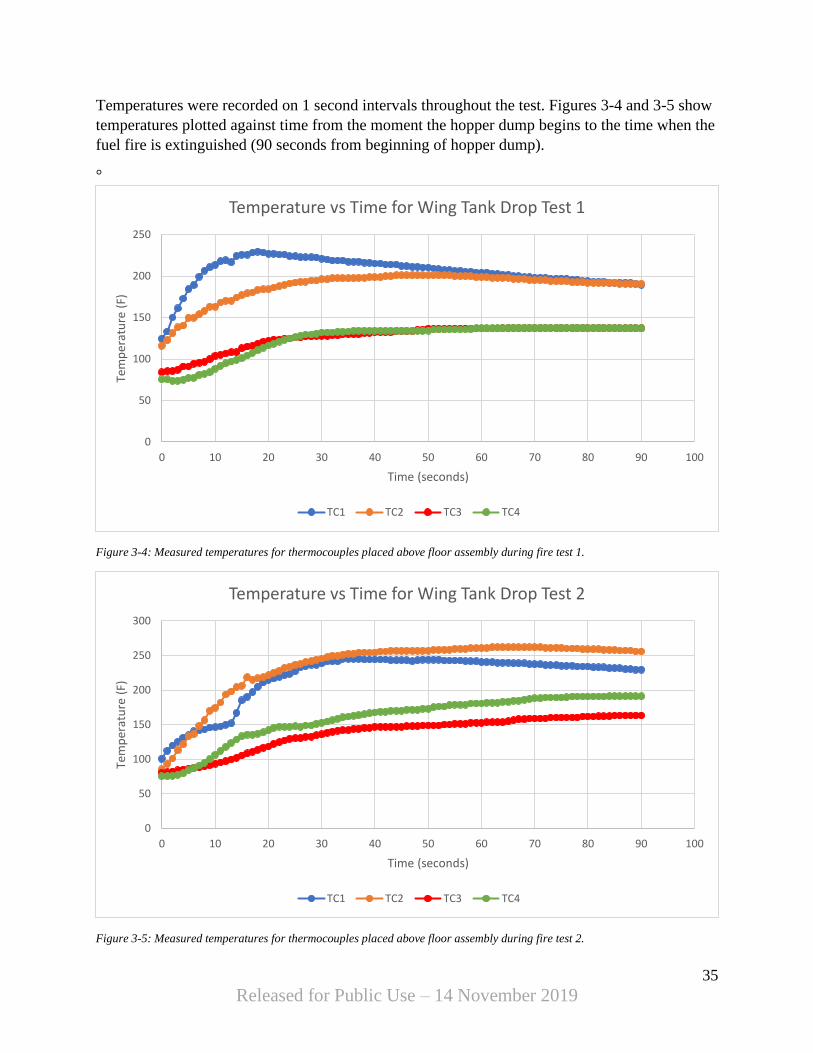
Temperatures were recorded on 1 second intervals throughout the test. Figures 3-4 and 3-5 show
temperatures plotted against time from the moment the hopper dump begins to the time when the
fuel fire is extinguished (90 seconds from beginning of hopper dump).
°
Figure 3-4: Measured temperatures for thermocouples placed above floor assembly during fire test 1.
Figure 3-5: Measured temperatures for thermocouples placed above floor assembly during fire test 2.
0
50
100
150
200
250
0 10 20 30 40 50 60 70 80 90 100
Tem
per
atu
re (
F)
Time (seconds)
Temperature vs Time for Wing Tank Drop Test 1
TC1 TC2 TC3 TC4
0
50
100
150
200
250
300
0 10 20 30 40 50 60 70 80 90 100
Tem
per
atu
re (
F)
Time (seconds)
Temperature vs Time for Wing Tank Drop Test 2
TC1 TC2 TC3 TC4

36
Released for Public Use – 14 November 2019
3.2.3 Potential Sprinkler Openings
When closed-head water sprinkler systems are used, NFPA 409 requires the use of quick-response
sprinklers with a temperature rating of 175°F for Group I hangars, with equivalent or higher
temperature sprinklers required for other hangar groups and areas with high ambient temperatures.
Although ceiling height may vary depending on the aircraft housed in the facility, typical hangar
ceilings are more than 12 meters (40 feet) high, which is much higher than the (7.5 meter) 25-foot
ceiling in the Safespill testing facility.
NFPA 409 requires a maximum sprinkler spacing of 3.7 meters (12 feet). During testing, adjacent
thermocouples were placed 2 meters (6.5 feet) from the origin of the fire and temperatures
observed, even at just 4 meters from the floor assembly surface, rarely exceeded 175°F.
Based on results from testing, it is reasonable to conclude the following:
(1) Only sprinklers installed in hangars with ceilings lower than 9 meters (30 feet) are
likely to activate
(2) In hangars that meet criteria (1), only sprinklers directly above the origin of the fire are
likely to activate. Adjacent sprinklers are unlikely to activate.
3.2.4 Heat Release Rate and Mean Flame Height In order to quantify the results of these two fire tests, video footage was reviewed and estimates
of ignited pool size and mean flame height were recorded at 5-second intervals from the time that
the spill was initiated to the time when the fuel fire is fully extinguished. Mean flame height was
measured as one-half of maximum flame height. Table 3-1 shows the recorded data for both tests.
Heat release rate was calculated based on pool fire area and mean flame height using Equation 1
[5].
Equation 1
𝑄 = [𝐿 + 1.02𝐷
0.230]
52
Where,
L = Mean Flame Height, m
D = Pool Fire Diameter, m
Q = Heat Release Rate, kW
37
Released for Public Use – 14 November 2019
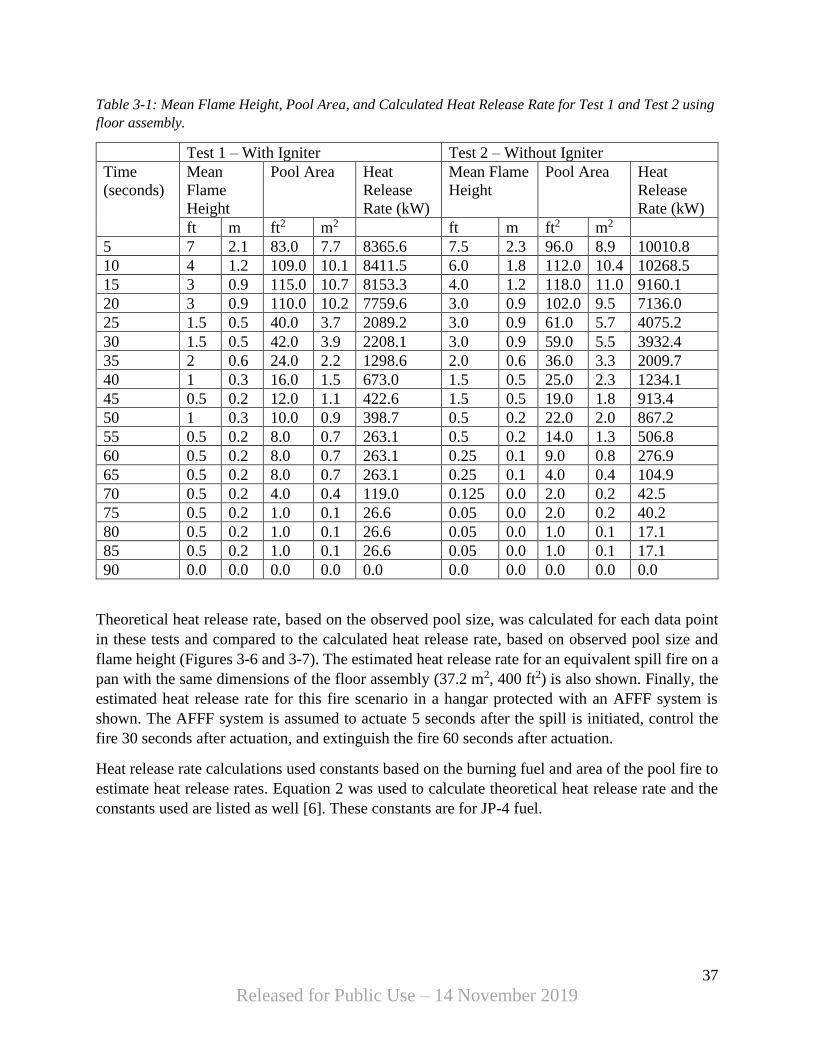
Table 3-1: Mean Flame Height, Pool Area, and Calculated Heat Release Rate for Test 1 and Test 2 using
floor assembly.
Test 1 – With Igniter Test 2 – Without Igniter
Time
(seconds)
Mean
Flame
Height
Pool Area Heat
Release
Rate (kW)
Mean Flame
Height
Pool Area Heat
Release
Rate (kW)
ft m ft2 m2 ft m ft2 m2
5 7 2.1 83.0 7.7 8365.6 7.5 2.3 96.0 8.9 10010.8
10 4 1.2 109.0 10.1 8411.5 6.0 1.8 112.0 10.4 10268.5
15 3 0.9 115.0 10.7 8153.3 4.0 1.2 118.0 11.0 9160.1
20 3 0.9 110.0 10.2 7759.6 3.0 0.9 102.0 9.5 7136.0
25 1.5 0.5 40.0 3.7 2089.2 3.0 0.9 61.0 5.7 4075.2
30 1.5 0.5 42.0 3.9 2208.1 3.0 0.9 59.0 5.5 3932.4
35 2 0.6 24.0 2.2 1298.6 2.0 0.6 36.0 3.3 2009.7
40 1 0.3 16.0 1.5 673.0 1.5 0.5 25.0 2.3 1234.1
45 0.5 0.2 12.0 1.1 422.6 1.5 0.5 19.0 1.8 913.4
50 1 0.3 10.0 0.9 398.7 0.5 0.2 22.0 2.0 867.2
55 0.5 0.2 8.0 0.7 263.1 0.5 0.2 14.0 1.3 506.8
60 0.5 0.2 8.0 0.7 263.1 0.25 0.1 9.0 0.8 276.9
65 0.5 0.2 8.0 0.7 263.1 0.25 0.1 4.0 0.4 104.9
70 0.5 0.2 4.0 0.4 119.0 0.125 0.0 2.0 0.2 42.5
75 0.5 0.2 1.0 0.1 26.6 0.05 0.0 2.0 0.2 40.2
80 0.5 0.2 1.0 0.1 26.6 0.05 0.0 1.0 0.1 17.1
85 0.5 0.2 1.0 0.1 26.6 0.05 0.0 1.0 0.1 17.1
90 0.0 0.0 0.0 0.0 0.0 0.0 0.0 0.0 0.0 0.0
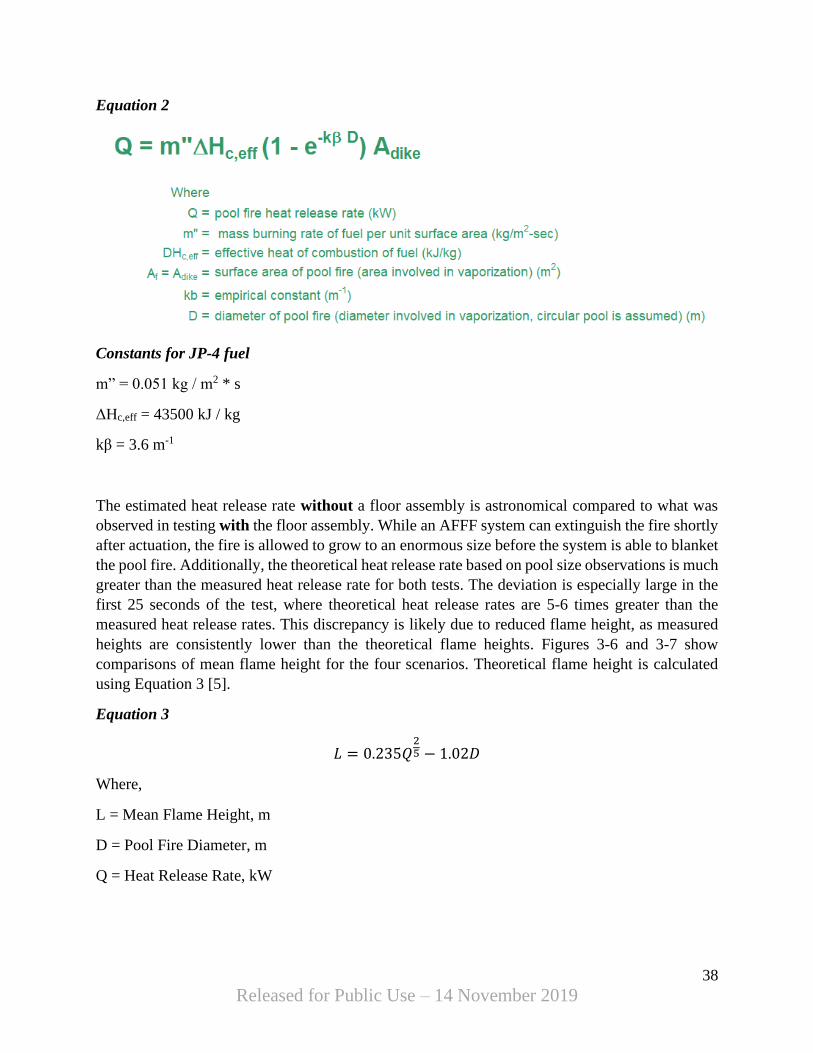
Theoretical heat release rate, based on the observed pool size, was calculated for each data point
in these tests and compared to the calculated heat release rate, based on observed pool size and
flame height (Figures 3-6 and 3-7). The estimated heat release rate for an equivalent spill fire on a
pan with the same dimensions of the floor assembly (37.2 m2, 400 ft2) is also shown. Finally, the
estimated heat release rate for this fire scenario in a hangar protected with an AFFF system is
shown. The AFFF system is assumed to actuate 5 seconds after the spill is initiated, control the
fire 30 seconds after actuation, and extinguish the fire 60 seconds after actuation.
Heat release rate calculations used constants based on the burning fuel and area of the pool fire to
estimate heat release rates. Equation 2 was used to calculate theoretical heat release rate and the
constants used are listed as well [6]. These constants are for JP-4 fuel.
38
Released for Public Use – 14 November 2019
Equation 2
Constants for JP-4 fuel
m” = 0.051 kg / m2 * s
ΔHc,eff = 43500 kJ / kg
kβ = 3.6 m-1
The estimated heat release rate without a floor assembly is astronomical compared to what was
observed in testing with the floor assembly. While an AFFF system can extinguish the fire shortly
after actuation, the fire is allowed to grow to an enormous size before the system is able to blanket
the pool fire. Additionally, the theoretical heat release rate based on pool size observations is much
greater than the measured heat release rate for both tests. The deviation is especially large in the
first 25 seconds of the test, where theoretical heat release rates are 5-6 times greater than the
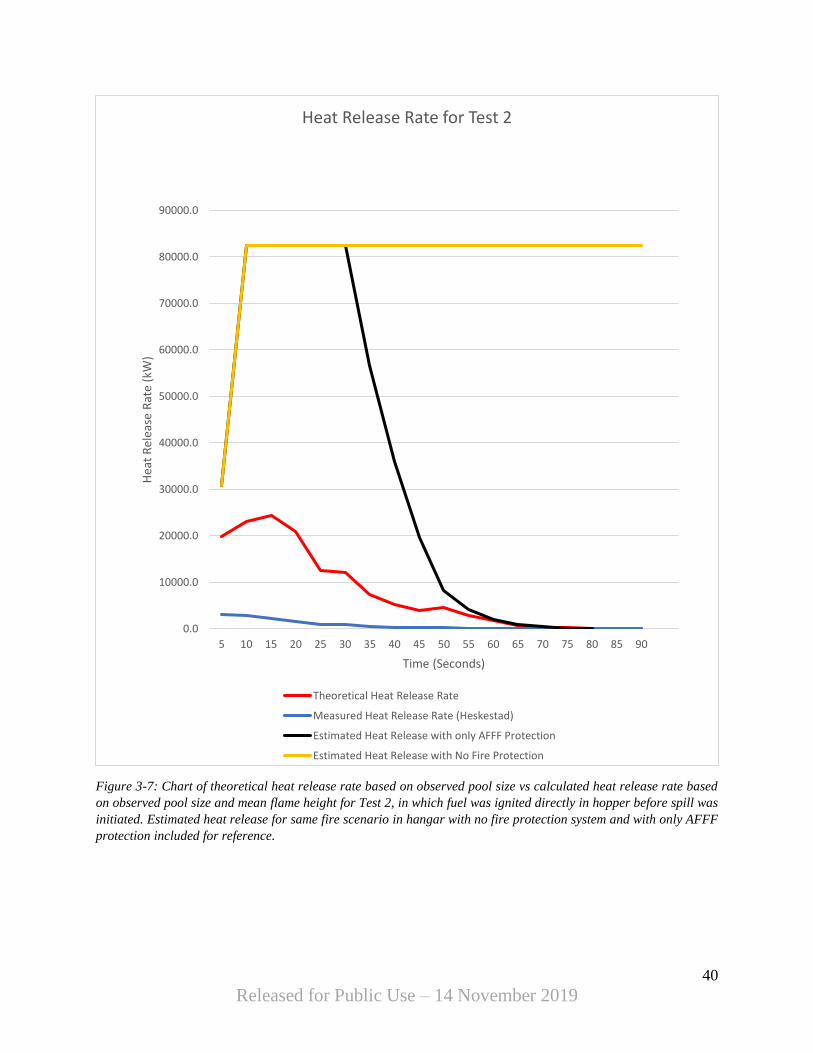
measured heat release rates. This discrepancy is likely due to reduced flame height, as measured
heights are consistently lower than the theoretical flame heights. Figures 3-6 and 3-7 show
comparisons of mean flame height for the four scenarios. Theoretical flame height is calculated
using Equation 3 [5].
Equation 3
𝐿 = 0.235𝑄25 − 1.02𝐷
Where,
L = Mean Flame Height, m
D = Pool Fire Diameter, m
Q = Heat Release Rate, kW
39
Released for Public Use – 14 November 2019
Figure 3-6: Chart of theoretical heat release rate based on observed pool size vs calculated heat release rate based
on observed pool size and mean flame height for Test 1, which used a rolled cotton igniter to ignite fuel spill. Estimated
heat release for same fire scenario in hangar with no fire protection system and with only AFFF protection included
for reference.
0
10000
20000
30000
40000
50000
60000
70000
80000
90000
5 10 15 20 25 30 35 40 45 50 55 60 65 70 75 80 85 90
Hea
t R
elea
se R
ate
(kW
)
Time (seconds)
Heat Release Rate for Test 1
Theoretical Heat Release Rate
Measured Heat Release Rate (Heskestad)
Estimated Heat Release with only AFFF Protection
Estimated Heat Release Rate with No Fire Protection
40
Released for Public Use – 14 November 2019
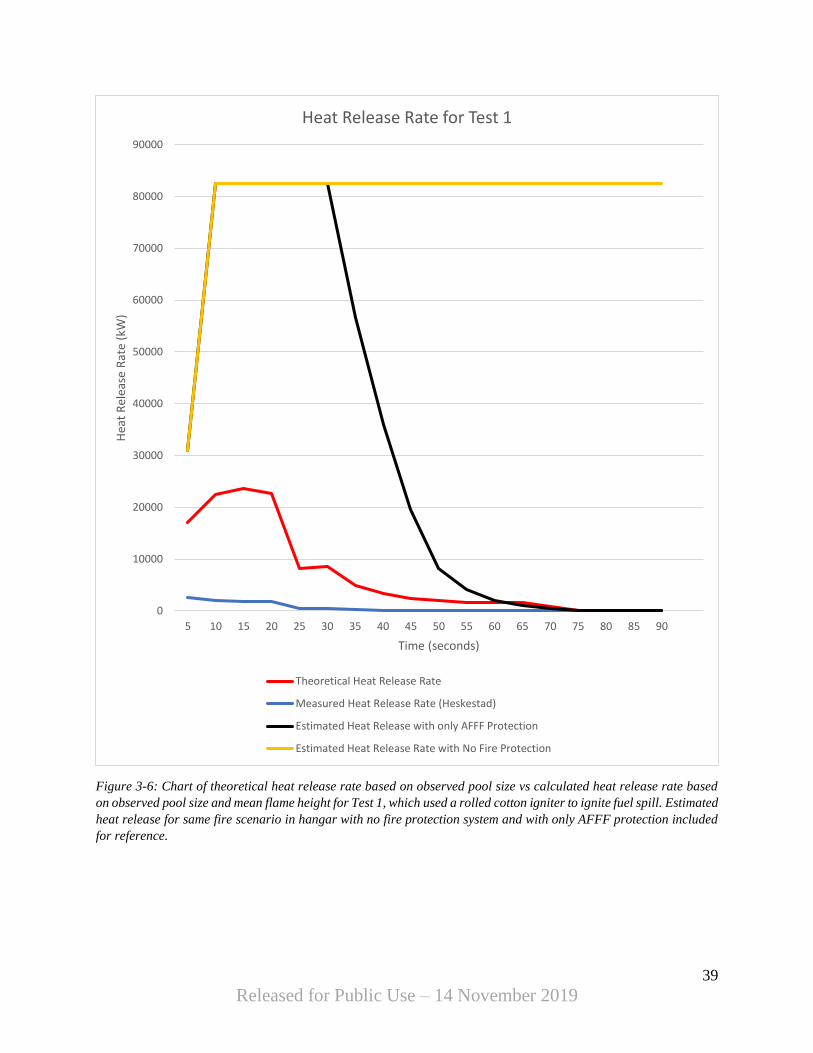
Figure 3-7: Chart of theoretical heat release rate based on observed pool size vs calculated heat release rate based
on observed pool size and mean flame height for Test 2, in which fuel was ignited directly in hopper before spill was
initiated. Estimated heat release for same fire scenario in hangar with no fire protection system and with only AFFF
protection included for reference.
0.0
10000.0
20000.0
30000.0
40000.0
50000.0
60000.0
70000.0
80000.0
90000.0
5 10 15 20 25 30 35 40 45 50 55 60 65 70 75 80 85 90
Hea
t R
elea
se R
ate
(kW
)
Time (Seconds)
Heat Release Rate for Test 2
Theoretical Heat Release Rate
Measured Heat Release Rate (Heskestad)
Estimated Heat Release with only AFFF Protection
Estimated Heat Release with No Fire Protection
41
Released for Public Use – 14 November 2019
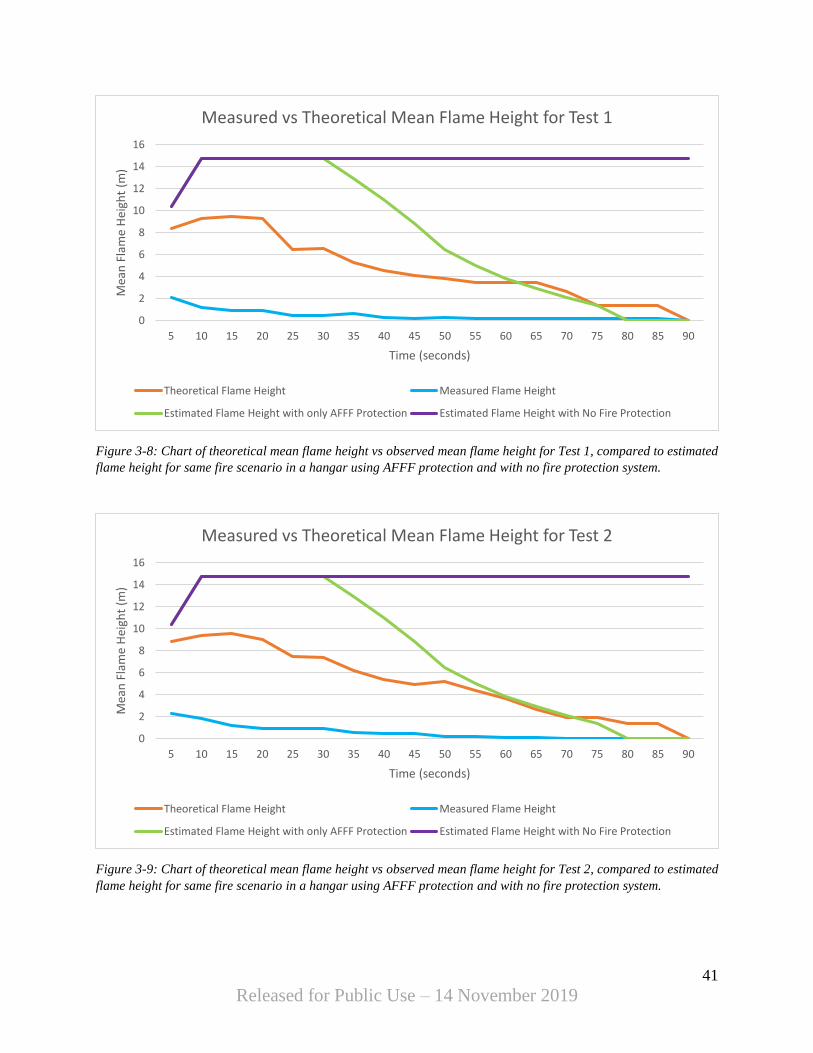
Figure 3-8: Chart of theoretical mean flame height vs observed mean flame height for Test 1, compared to estimated
flame height for same fire scenario in a hangar using AFFF protection and with no fire protection system.
Figure 3-9: Chart of theoretical mean flame height vs observed mean flame height for Test 2, compared to estimated
flame height for same fire scenario in a hangar using AFFF protection and with no fire protection system.
0
2
4
6
8
10
12
14
16
5 10 15 20 25 30 35 40 45 50 55 60 65 70 75 80 85 90
Mea
n F
lam
e H
eigh
t (m
)
Time (seconds)
Measured vs Theoretical Mean Flame Height for Test 1
Theoretical Flame Height Measured Flame Height
Estimated Flame Height with only AFFF Protection Estimated Flame Height with No Fire Protection
0
2
4
6
8
10
12
14
16
5 10 15 20 25 30 35 40 45 50 55 60 65 70 75 80 85 90
Mea
n F
lam
e H
eigh
t (m
)
Time (seconds)
Measured vs Theoretical Mean Flame Height for Test 2
Theoretical Flame Height Measured Flame Height
Estimated Flame Height with only AFFF Protection Estimated Flame Height with No Fire Protection
42
Released for Public Use – 14 November 2019
A large reduction in heat release rate and flame height may be caused by the floor assembly’s
ability to drain fuel away from the fire. Whereas Equation 2 only accounts for the dissipation of
fuel through burning, in this scenario additional fuel is dissipated through drainage. When fuel is
drained away rather than burning, the fire never grows to the expected theoretical size.
The floor assembly is also able to reduce pool size by distributing fuel into individual channels
and preventing lateral spread of fuel. Once within each channel, fuel mixes with flushing water
which helps to drain the fuel into the trench drain for removal, ultimately extinguishing the fire.
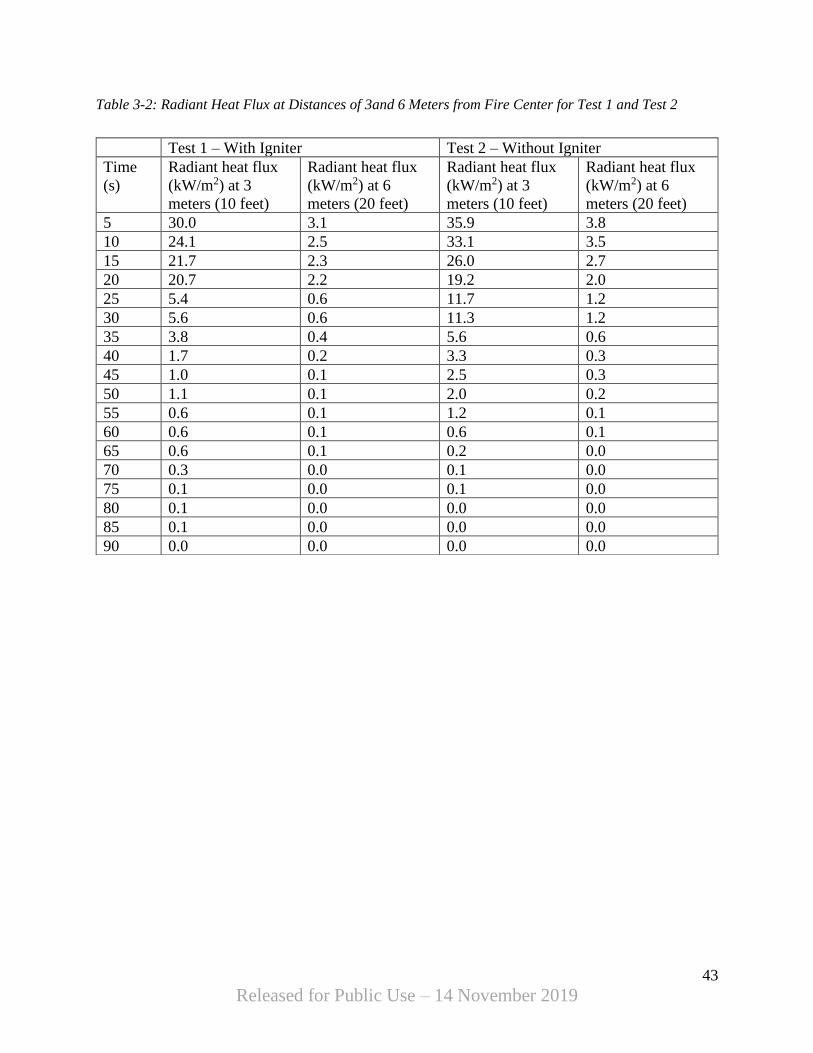
3.2.5 Radiant Heat Flux Radiant heat flux (kW/m2) was calculated for the two tests based on Equation 4. Distances of 3
meters (10 feet), 6 meters (20 feet), and 9 meters (30 feet) were used for calculations. A radiative
fraction of 0.3 was used for calculations [8].
Equation 4
𝑞" =𝑄 ∗ 𝜒𝑟4𝜋𝑅
Where,
Q = Total Heat Release Rate
χr = Radiative Fraction (0.3)
R = Distance from Center of Pool Fire to Edge of Target (m)
For context on values of radiant heat flux, the radiant heat flux required to delaminate composite
aerospace materials [9], is shown as a trendline in Figures 3-10 and 3-11. This trendline was
estimated based on data collected through experimental testing in the 2013 Bocchieri report.
Delamination data was collected for three composite materials chosen to represent a wide array
of composites used in military aircraft. The composite chosen for the trendline, Renegade
IM7/RM3002, is considered intermediate in terms of service temperature.
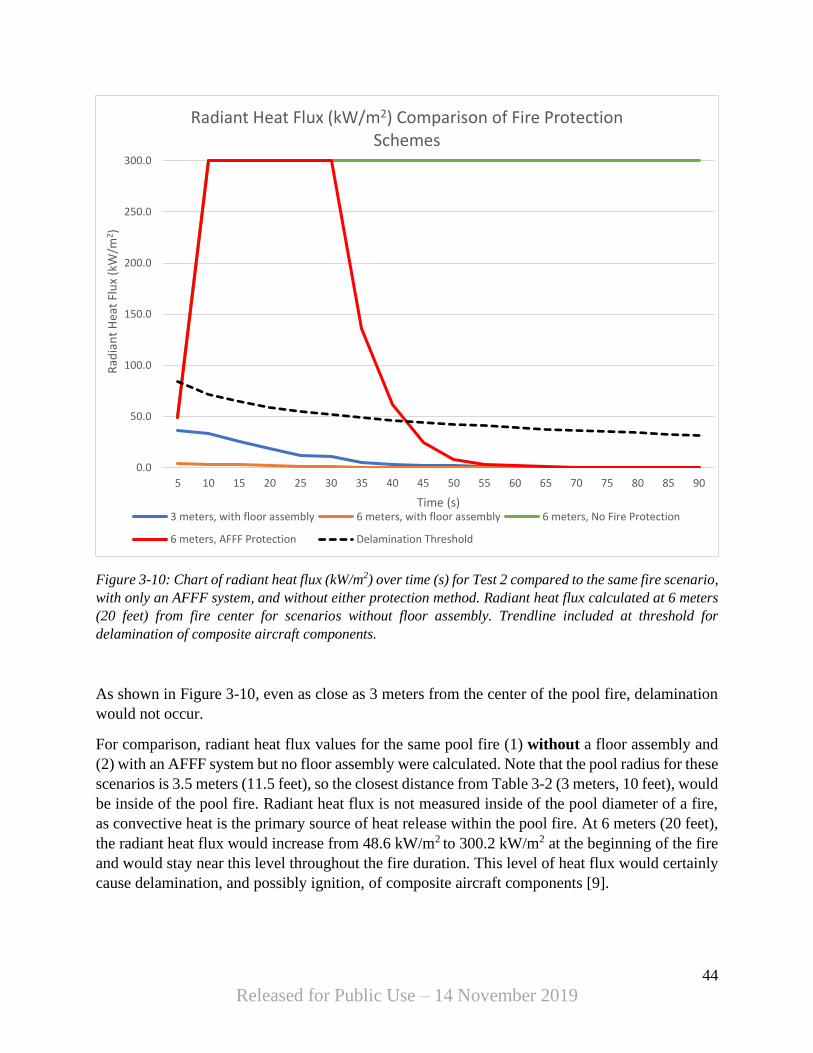
Test 2 has greater radiant heat flux values than Test 1, so the Test 2 data set was used for Figure
3-10. This figure shows radiant heat flux over time at distances of 3 meters (10 feet) and 6 meters
(20 feet).
43
Released for Public Use – 14 November 2019
Table 3-2: Radiant Heat Flux at Distances of 3and 6 Meters from Fire Center for Test 1 and Test 2
Test 1 – With Igniter Test 2 – Without Igniter
Time
(s)
Radiant heat flux
(kW/m2) at 3
meters (10 feet)
Radiant heat flux
(kW/m2) at 6
meters (20 feet)
Radiant heat flux
(kW/m2) at 3
meters (10 feet)
Radiant heat flux
(kW/m2) at 6
meters (20 feet)
5 30.0 3.1 35.9 3.8
10 24.1 2.5 33.1 3.5
15 21.7 2.3 26.0 2.7
20 20.7 2.2 19.2 2.0
25 5.4 0.6 11.7 1.2
30 5.6 0.6 11.3 1.2
35 3.8 0.4 5.6 0.6
40 1.7 0.2 3.3 0.3
45 1.0 0.1 2.5 0.3
50 1.1 0.1 2.0 0.2
55 0.6 0.1 1.2 0.1
60 0.6 0.1 0.6 0.1
65 0.6 0.1 0.2 0.0
70 0.3 0.0 0.1 0.0
75 0.1 0.0 0.1 0.0
80 0.1 0.0 0.0 0.0
85 0.1 0.0 0.0 0.0
90 0.0 0.0 0.0 0.0
44
Released for Public Use – 14 November 2019
Figure 3-10: Chart of radiant heat flux (kW/m2) over time (s) for Test 2 compared to the same fire scenario,
with only an AFFF system, and without either protection method. Radiant heat flux calculated at 6 meters
(20 feet) from fire center for scenarios without floor assembly. Trendline included at threshold for
delamination of composite aircraft components.
As shown in Figure 3-10, even as close as 3 meters from the center of the pool fire, delamination
would not occur.
For comparison, radiant heat flux values for the same pool fire (1) without a floor assembly and
(2) with an AFFF system but no floor assembly were calculated. Note that the pool radius for these
scenarios is 3.5 meters (11.5 feet), so the closest distance from Table 3-2 (3 meters, 10 feet), would
be inside of the pool fire. Radiant heat flux is not measured inside of the pool diameter of a fire,
as convective heat is the primary source of heat release within the pool fire. At 6 meters (20 feet),
the radiant heat flux would increase from 48.6 kW/m2 to 300.2 kW/m2 at the beginning of the fire
and would stay near this level throughout the fire duration. This level of heat flux would certainly
cause delamination, and possibly ignition, of composite aircraft components [9].
0.0
50.0
100.0
150.0
200.0
250.0
300.0
5 10 15 20 25 30 35 40 45 50 55 60 65 70 75 80 85 90
Rad
ian
t H
eat
Flu
x (k
W/m
2 )
Time (s)
Radiant Heat Flux (kW/m2) Comparison of Fire Protection Schemes
3 meters, with floor assembly 6 meters, with floor assembly 6 meters, No Fire Protection
6 meters, AFFF Protection Delamination Threshold
45
Released for Public Use – 14 November 2019
4 Kerosene Cascade Fire Test Video footage of the Kerosene Cascade test is available at the following web address:
https://jwp.io/s/kLQ16fF0
4.1 Test Design and Procedure
4.1.1 Background The fire test described in this chapter is based on a series of tests conducted by the Naval
Research Laboratory and published in May 2000 [7]. In these tests, a fire apparatus with a
fuel cascade was constructed to create a fire scenario in which fuels heated above their flash
point would spill onto a concrete deck forming a pool fire. Various scenarios were tested
with variations in fuel used and severity of fire based on time in cascade. Both JP-5 and JP-
8 fuels were used and temperatures of fuel spilling onto the deck were measured at either
400°F and 200°F. According to the study, it was determined that heating of the fuel to 400°F
was “unrealistically severe due to the heating of the fuel to its boiling point prior to spilling
on the deck” and the heating of the fuel to this level caused the majority of the fuel to burn
inside of the fire apparatus before the fuel could reach the deck.
Due to the conclusions made from this report, the following fire scenario was determined as
the most comparable scenario to study:
• Fuel: Kerosene
• Temperature of fuel spilling onto deck: 200°F
• Flow rate of fuel: 18.5 gallons/min into fire apparatus, 15 gallons/min onto floor
assembly
Kerosene was chosen as the fuel of choice because it is a readily available civilian analog to
the fuels used in the study, JP-5 and JP-8. A fuel temperature of 200°F was observed during
the “half cascade” scenario from the report. A fuel flow rate of 57 L/min (15 gallons/min)
into the fire apparatus was used for the half cascade which led to 49.4 L/min (13 gallons/min)
of burning fuel flowing onto the deck.
After preliminary testing, the Safespill fire apparatus required a 3-minute pre-burn and a fuel
flow rate of 70 L/min (18.5 gallons/min), to achieve a fuel temperature of 200°F with an
observable fire on top of floor assembly. It is estimated that the fuel flow rate onto the floor
assembly was approximately 57 L/min (15 gallons/min), based on calculations in Section
4.2.2.
Positioning of the fire apparatus in relation to floor assembly components is shown in Figure
4-1.

46
Released for Public Use – 14 November 2019
6.0 meters
(20 feet)
Trench Drain
Flushing Manifold
Direction of Flow
6 meters (20 feet)
Figure 4-1: Layout of floor assembly and fire apparatus for kerosene cascade test
Fire
Apparatus
47
Released for Public Use – 14 November 2019
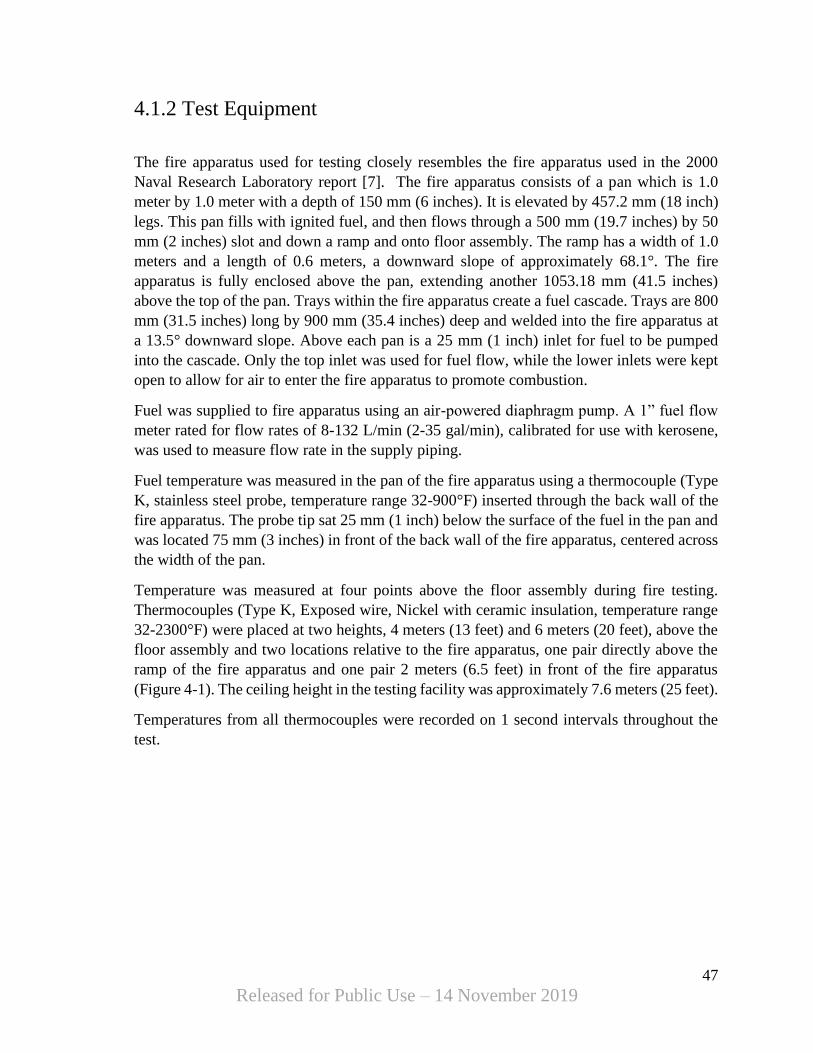
4.1.2 Test Equipment
The fire apparatus used for testing closely resembles the fire apparatus used in the 2000
Naval Research Laboratory report [7]. The fire apparatus consists of a pan which is 1.0
meter by 1.0 meter with a depth of 150 mm (6 inches). It is elevated by 457.2 mm (18 inch)
legs. This pan fills with ignited fuel, and then flows through a 500 mm (19.7 inches) by 50
mm (2 inches) slot and down a ramp and onto floor assembly. The ramp has a width of 1.0
meters and a length of 0.6 meters, a downward slope of approximately 68.1°. The fire
apparatus is fully enclosed above the pan, extending another 1053.18 mm (41.5 inches)
above the top of the pan. Trays within the fire apparatus create a fuel cascade. Trays are 800
mm (31.5 inches) long by 900 mm (35.4 inches) deep and welded into the fire apparatus at
a 13.5° downward slope. Above each pan is a 25 mm (1 inch) inlet for fuel to be pumped
into the cascade. Only the top inlet was used for fuel flow, while the lower inlets were kept
open to allow for air to enter the fire apparatus to promote combustion.
Fuel was supplied to fire apparatus using an air-powered diaphragm pump. A 1” fuel flow
meter rated for flow rates of 8-132 L/min (2-35 gal/min), calibrated for use with kerosene,
was used to measure flow rate in the supply piping.
Fuel temperature was measured in the pan of the fire apparatus using a thermocouple (Type
K, stainless steel probe, temperature range 32-900°F) inserted through the back wall of the
fire apparatus. The probe tip sat 25 mm (1 inch) below the surface of the fuel in the pan and
was located 75 mm (3 inches) in front of the back wall of the fire apparatus, centered across
the width of the pan.
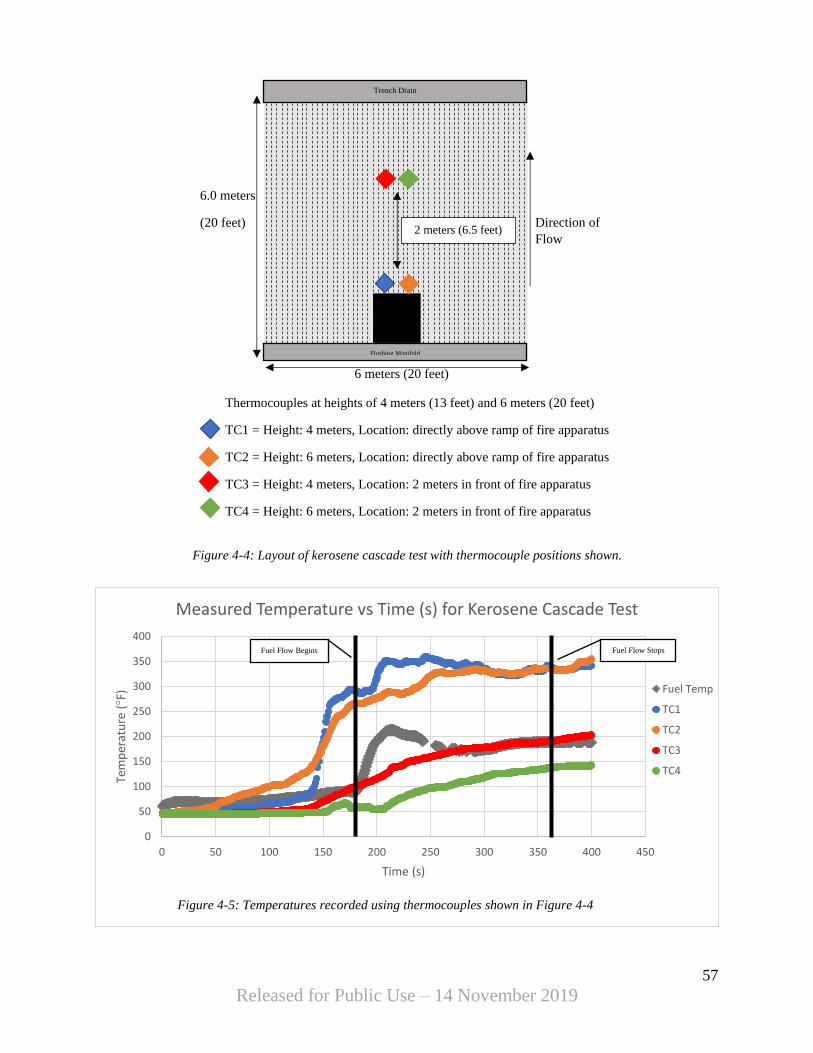
Temperature was measured at four points above the floor assembly during fire testing.
Thermocouples (Type K, Exposed wire, Nickel with ceramic insulation, temperature range
32-2300°F) were placed at two heights, 4 meters (13 feet) and 6 meters (20 feet), above the
floor assembly and two locations relative to the fire apparatus, one pair directly above the
ramp of the fire apparatus and one pair 2 meters (6.5 feet) in front of the fire apparatus
(Figure 4-1). The ceiling height in the testing facility was approximately 7.6 meters (25 feet).
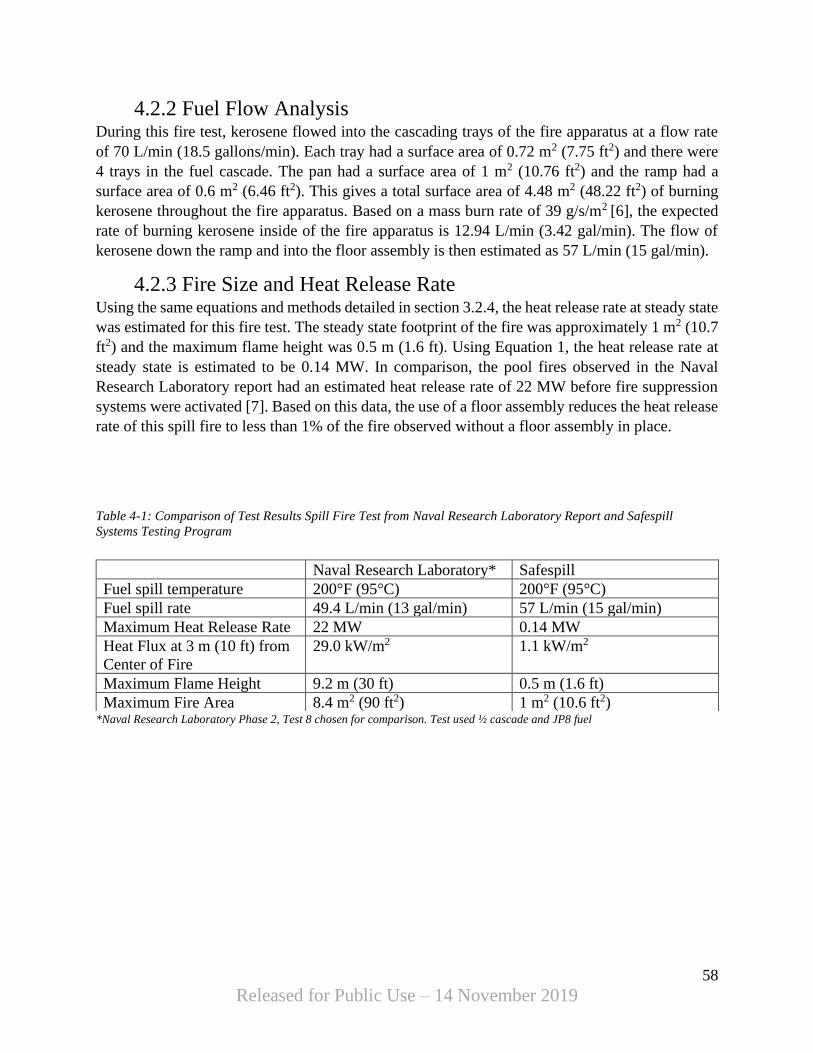
Temperatures from all thermocouples were recorded on 1 second intervals throughout the
test.
48
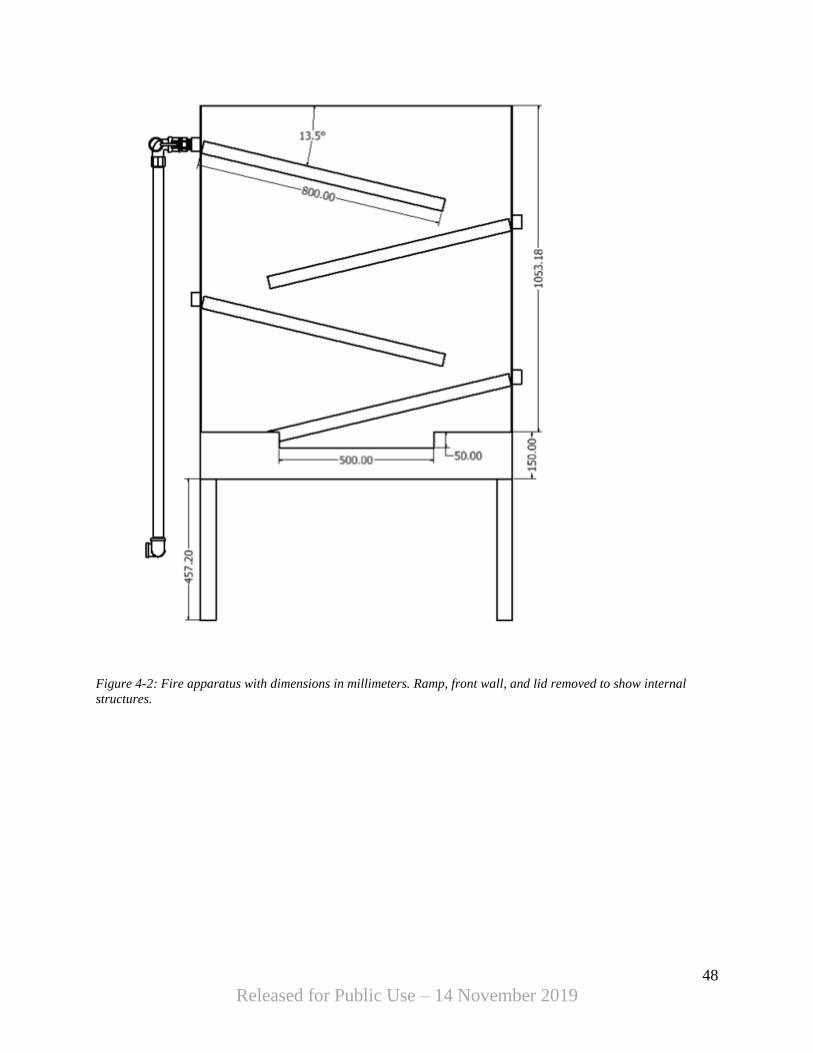
Released for Public Use – 14 November 2019
Figure 4-2: Fire apparatus with dimensions in millimeters. Ramp, front wall, and lid removed to show internal
structures.

49
Released for Public Use – 14 November 2019
Figure 4-3: Fire apparatus in isometric view. Front wall and lid removed to show internal structures.
50
Released for Public Use – 14 November 2019
4.2 Test Results
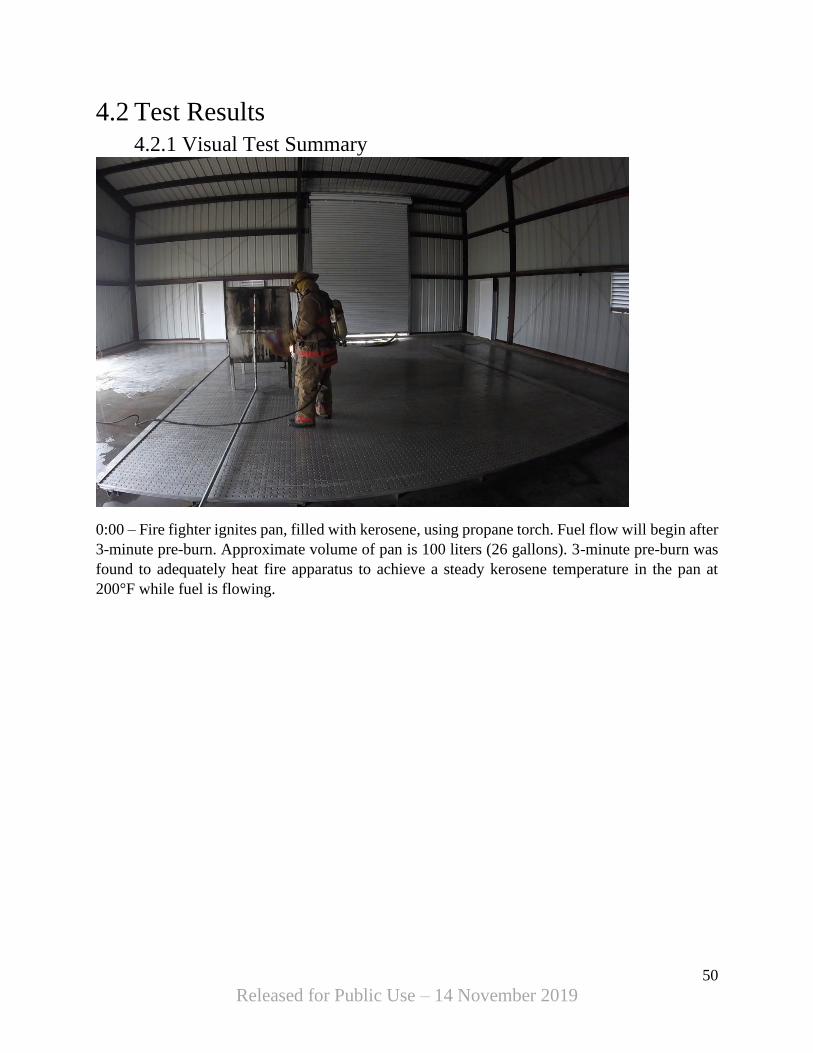
4.2.1 Visual Test Summary
0:00 – Fire fighter ignites pan, filled with kerosene, using propane torch. Fuel flow will begin after
3-minute pre-burn. Approximate volume of pan is 100 liters (26 gallons). 3-minute pre-burn was
found to adequately heat fire apparatus to achieve a steady kerosene temperature in the pan at
200°F while fuel is flowing.
51
Released for Public Use – 14 November 2019
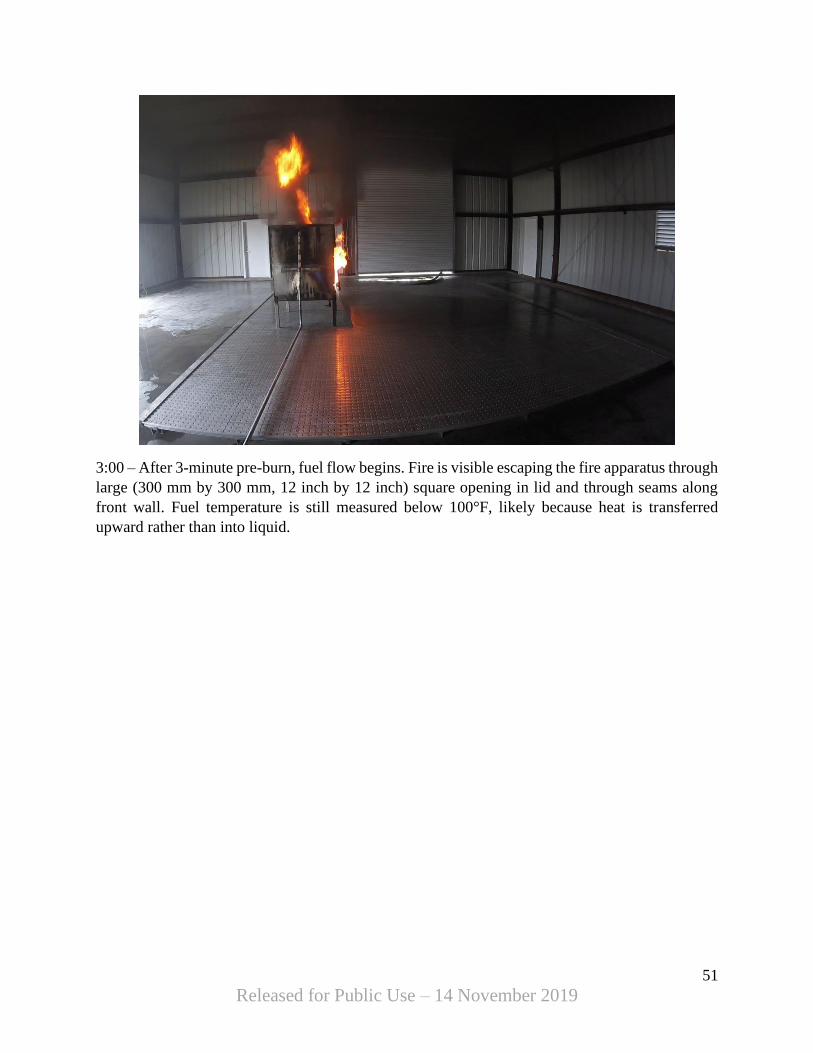
3:00 – After 3-minute pre-burn, fuel flow begins. Fire is visible escaping the fire apparatus through
large (300 mm by 300 mm, 12 inch by 12 inch) square opening in lid and through seams along
front wall. Fuel temperature is still measured below 100°F, likely because heat is transferred
upward rather than into liquid.
52
Released for Public Use – 14 November 2019
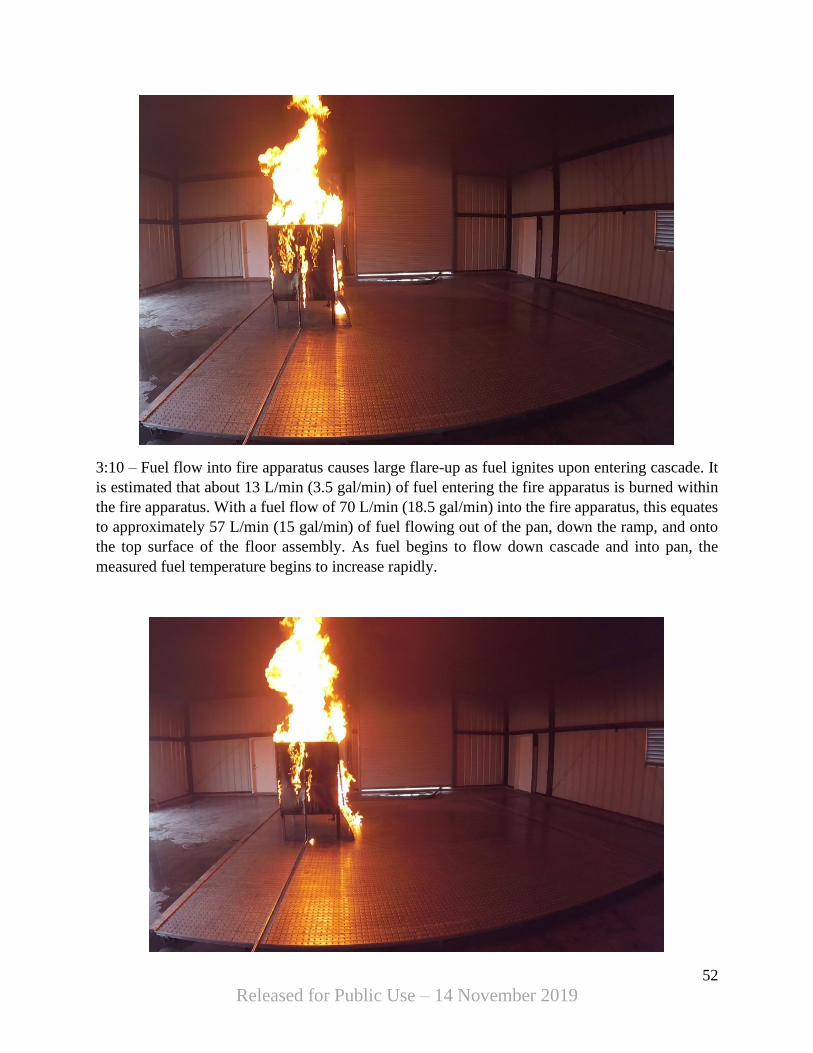
3:10 – Fuel flow into fire apparatus causes large flare-up as fuel ignites upon entering cascade. It
is estimated that about 13 L/min (3.5 gal/min) of fuel entering the fire apparatus is burned within
the fire apparatus. With a fuel flow of 70 L/min (18.5 gal/min) into the fire apparatus, this equates
to approximately 57 L/min (15 gal/min) of fuel flowing out of the pan, down the ramp, and onto
the top surface of the floor assembly. As fuel begins to flow down cascade and into pan, the
measured fuel temperature begins to increase rapidly.
53
Released for Public Use – 14 November 2019
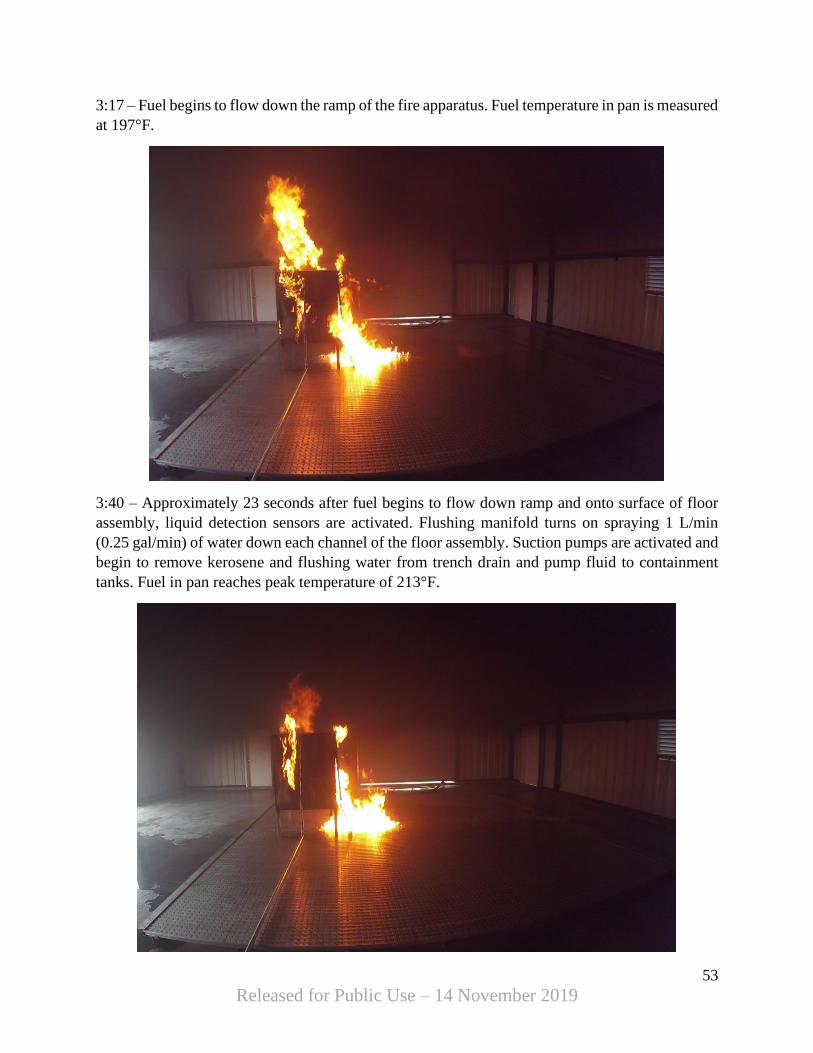
3:17 – Fuel begins to flow down the ramp of the fire apparatus. Fuel temperature in pan is measured
at 197°F.
3:40 – Approximately 23 seconds after fuel begins to flow down ramp and onto surface of floor
assembly, liquid detection sensors are activated. Flushing manifold turns on spraying 1 L/min
(0.25 gal/min) of water down each channel of the floor assembly. Suction pumps are activated and
begin to remove kerosene and flushing water from trench drain and pump fluid to containment
tanks. Fuel in pan reaches peak temperature of 213°F.

54
Released for Public Use – 14 November 2019
4:27 – Fuel flow continues and fuel temperature in pan fluctuates between 200°F and 170°F. Fire
on floor assembly is primarily contained to an area of 1 m2 (10.7 ft2) at the base of the ramp. Small
flare-ups occur in profile channels between the fire apparatus and the trench drain. Maximum
flame height from fuel in the floor assembly is observed at approximately 0.5 meters (1.6 feet).
Much larger flames rise out of the fire apparatus, producing much of the heat that causes ceiling
temperatures to rise.
55
Released for Public Use – 14 November 2019
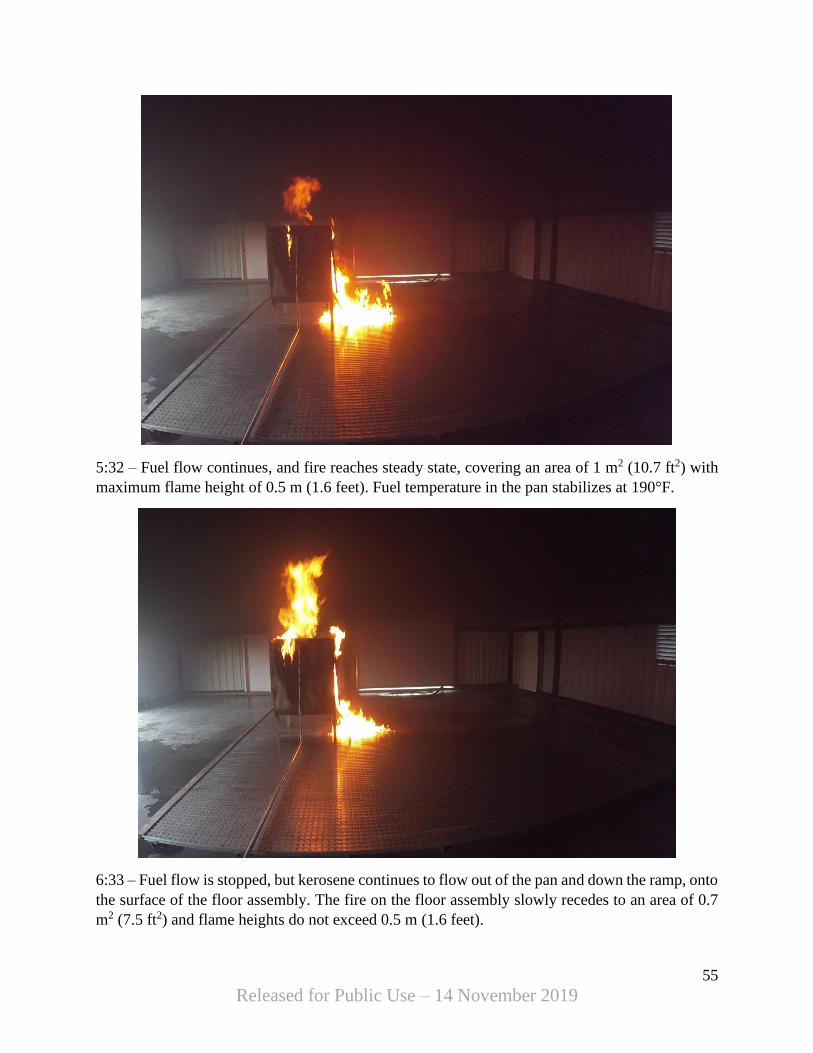
5:32 – Fuel flow continues, and fire reaches steady state, covering an area of 1 m2 (10.7 ft2) with
maximum flame height of 0.5 m (1.6 feet). Fuel temperature in the pan stabilizes at 190°F.
6:33 – Fuel flow is stopped, but kerosene continues to flow out of the pan and down the ramp, onto
the surface of the floor assembly. The fire on the floor assembly slowly recedes to an area of 0.7
m2 (7.5 ft2) and flame heights do not exceed 0.5 m (1.6 feet).
56
Released for Public Use – 14 November 2019
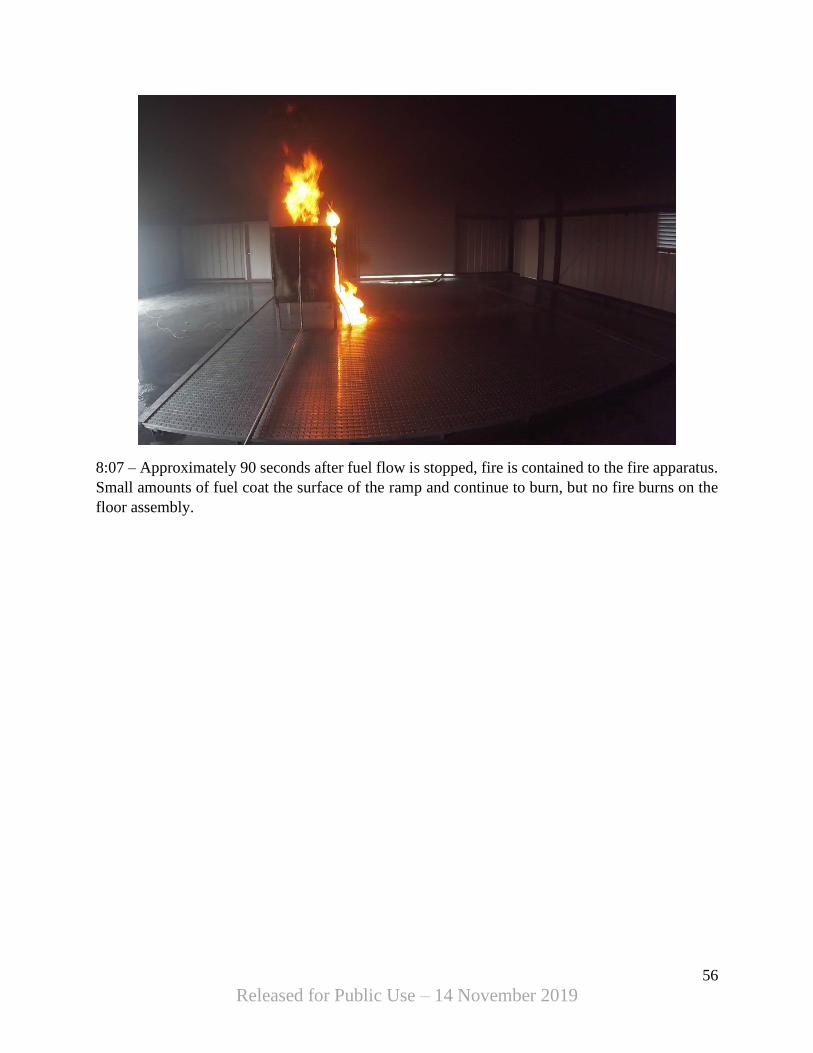
8:07 – Approximately 90 seconds after fuel flow is stopped, fire is contained to the fire apparatus.
Small amounts of fuel coat the surface of the ramp and continue to burn, but no fire burns on the
floor assembly.
57
Released for Public Use – 14 November 2019
0
50
100
150
200
250
300
350
400
0 50 100 150 200 250 300 350 400 450
Tem
per
atu
re (
°F)
Time (s)
Measured Temperature vs Time (s) for Kerosene Cascade Test
Fuel Temp
TC1
TC2
TC3
TC4
6.0 meters
(20 feet)
Trench Drain
Flushing Manifold
Direction of
Flow
6 meters (20 feet)
Fuel Flow Begins Fuel Flow Stops
Thermocouples at heights of 4 meters (13 feet) and 6 meters (20 feet)
TC1 = Height: 4 meters, Location: directly above ramp of fire apparatus
TC2 = Height: 6 meters, Location: directly above ramp of fire apparatus
TC3 = Height: 4 meters, Location: 2 meters in front of fire apparatus
TC4 = Height: 6 meters, Location: 2 meters in front of fire apparatus
Figure 4-4: Layout of kerosene cascade test with thermocouple positions shown.
2 meters (6.5 feet)
Figure 4-5: Temperatures recorded using thermocouples shown in Figure 4-4
58
Released for Public Use – 14 November 2019
4.2.2 Fuel Flow Analysis During this fire test, kerosene flowed into the cascading trays of the fire apparatus at a flow rate
of 70 L/min (18.5 gallons/min). Each tray had a surface area of 0.72 m2 (7.75 ft2) and there were
4 trays in the fuel cascade. The pan had a surface area of 1 m2 (10.76 ft2) and the ramp had a
surface area of 0.6 m2 (6.46 ft2). This gives a total surface area of 4.48 m2 (48.22 ft2) of burning
kerosene throughout the fire apparatus. Based on a mass burn rate of 39 g/s/m2 [6], the expected
rate of burning kerosene inside of the fire apparatus is 12.94 L/min (3.42 gal/min). The flow of
kerosene down the ramp and into the floor assembly is then estimated as 57 L/min (15 gal/min).
4.2.3 Fire Size and Heat Release Rate Using the same equations and methods detailed in section 3.2.4, the heat release rate at steady state
was estimated for this fire test. The steady state footprint of the fire was approximately 1 m2 (10.7
ft2) and the maximum flame height was 0.5 m (1.6 ft). Using Equation 1, the heat release rate at
steady state is estimated to be 0.14 MW. In comparison, the pool fires observed in the Naval
Research Laboratory report had an estimated heat release rate of 22 MW before fire suppression
systems were activated [7]. Based on this data, the use of a floor assembly reduces the heat release
rate of this spill fire to less than 1% of the fire observed without a floor assembly in place.
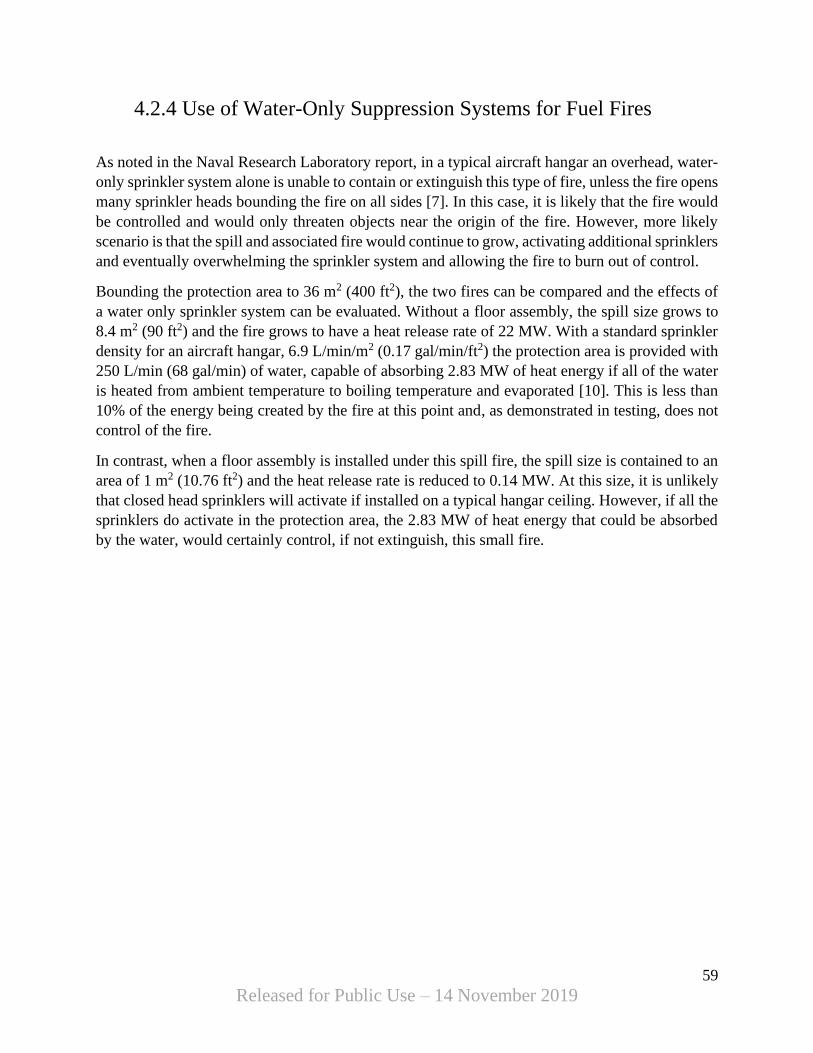
Table 4-1: Comparison of Test Results Spill Fire Test from Naval Research Laboratory Report and Safespill
Systems Testing Program
*Naval Research Laboratory Phase 2, Test 8 chosen for comparison. Test used ½ cascade and JP8 fuel
Naval Research Laboratory* Safespill
Fuel spill temperature 200°F (95°C) 200°F (95°C)
Fuel spill rate 49.4 L/min (13 gal/min) 57 L/min (15 gal/min)
Maximum Heat Release Rate 22 MW 0.14 MW
Heat Flux at 3 m (10 ft) from
Center of Fire
29.0 kW/m2 1.1 kW/m2
Maximum Flame Height 9.2 m (30 ft) 0.5 m (1.6 ft)
Maximum Fire Area 8.4 m2 (90 ft2) 1 m2 (10.6 ft2)
59
Released for Public Use – 14 November 2019
4.2.4 Use of Water-Only Suppression Systems for Fuel Fires
As noted in the Naval Research Laboratory report, in a typical aircraft hangar an overhead, water-
only sprinkler system alone is unable to contain or extinguish this type of fire, unless the fire opens
many sprinkler heads bounding the fire on all sides [7]. In this case, it is likely that the fire would
be controlled and would only threaten objects near the origin of the fire. However, more likely
scenario is that the spill and associated fire would continue to grow, activating additional sprinklers
and eventually overwhelming the sprinkler system and allowing the fire to burn out of control.
Bounding the protection area to 36 m2 (400 ft2), the two fires can be compared and the effects of
a water only sprinkler system can be evaluated. Without a floor assembly, the spill size grows to
8.4 m2 (90 ft2) and the fire grows to have a heat release rate of 22 MW. With a standard sprinkler
density for an aircraft hangar, 6.9 L/min/m2 (0.17 gal/min/ft2) the protection area is provided with
250 L/min (68 gal/min) of water, capable of absorbing 2.83 MW of heat energy if all of the water
is heated from ambient temperature to boiling temperature and evaporated [10]. This is less than
10% of the energy being created by the fire at this point and, as demonstrated in testing, does not
control of the fire.
In contrast, when a floor assembly is installed under this spill fire, the spill size is contained to an
area of 1 m2 (10.76 ft2) and the heat release rate is reduced to 0.14 MW. At this size, it is unlikely
that closed head sprinklers will activate if installed on a typical hangar ceiling. However, if all the
sprinklers do activate in the protection area, the 2.83 MW of heat energy that could be absorbed
by the water, would certainly control, if not extinguish, this small fire.
60
Released for Public Use – 14 November 2019
5 Conclusion Based on data included in this test report, supporting reference documents, and widely accepted
fire protection analysis methods, current NFPA 409 protection schemes are compared to the
proposed alternative using an ignitable liquid drainage floor assembly in the following sections.
Video footage showing a comparison of this fire scenario using an ignitable liquid drainage floor
assembly versus a high-expansion foam system is available at the following web address:
https://jwp.io/s/SYv797rQ
5.1 Current Approved Fire Protection Schemes NFPA 409 currently requires one of the following protection schemes for use in all aircraft
hangars, with variations in coverage densities for foam systems and different temperature ratings
for closed head sprinklers.
(1) A foam-water deluge system and a supplementary low-level foam system. (Sections 6.1.1,
7.1.1, and 8.1.6)
(2) A combination of automatic water-only sprinkler protection and an automatic low-level
low-expansion foam system. (Sections 6.1.1, 7.1.1, and 8.1.6)
(3) A combination of automatic water-only sprinkler protection and an automatic low-level
low-expansion foam system. (Sections 6.1.1, 7.1.1, and 8.1.6)
(4) A closed-head foam-water sprinkler system. (Sections 7.1.1 and 8.1.6)
(5) A low-level low-expansion foam system. (Section 9.14.1)
(6) A low-level high-expansion foam system. (Section 9.14.1)
(7) If the hangar houses only defueled aircraft, water-only automatic sprinkler protection is
allowed. (Section 9.14.2)
For deluge foam-water systems, NFPA 409 does not provide a maximum time to control or
extinguish a fire.
For supplementary protection systems (low expansion or high expansion), NFPA 409 states that
the design objective should be to achieve control of the fire within 30 seconds of system actuation
and extinguish the fire within 60 seconds of system actuation.
For low-level foam protection systems, NFPA 409 states that systems shall be designed to achieve
coverage of the entire aircraft hangar within 3 minutes of system actuation, if all foam discharge
device are activated.
System actuation is defined as actuation of the automatic water control valve.
61
Released for Public Use – 14 November 2019
5.2 Proposal for Alternative Fire Protection Scheme Based on the results detailed in this test report, ignitable liquid drainage floor assemblies have
been shown to maintain control of fires caused by liquid spills in both large volume, instantaneous
and continuous, low-flow spill scenarios. It has also been demonstrated that these fires are
consistently extinguished less than 90 seconds after the fuel flow has been stopped.
These results show that the use of an ignitable liquid drainage floor assembly is an acceptable
equivalent to current methods for protecting an aircraft hangar. As such, it is proposed that a new
protection scheme be allowed under NFPA 409 for all hangar groups. The new protection scheme
utilizes an ignitable liquid drainage floor assembly which covers all floor areas where fuel spill
hazards are present, with the use of an overhead, automatic, water-only sprinkler system in
accordance with current requirements in Section 6.2.4 of NFPA 409. General requirements for the
design and installation of ignitable liquid drainage floor assemblies will be submitted along with
the proposed protection scheme. The general requirements are included in Appendix E of this test
report.
62
Released for Public Use – 14 November 2019
6 References 1. Zallen, D.M., Morehouse, E.T., Dees, B.R., Walker, J.L., Campbell, P., “Fire Protection
System for Hardened Aircraft Shelters Vol I of III: Discussion and Appendixes A-C,” Air
Force Engineering and Services Center, October 1987.
2. NFPA 409, “Standard on Aircraft Hangars,” National Fire Protection Association, Quincy,
MA, 2016.
3. Class Number 6090, “Approval Standard for Ignitable Liquid Drainage Floor Assemblies,”
FM Approvals, Norwood, MA, May 2017.
4. “Safety Data Sheet, JP-4 Fuel (MIL-T-5624),” Chevron Phillips Chemical Company, 11
May 2016.
5. Heskestad, G., “Fire Plumes, Flame Height, and Air Entrainment,” The SFPE Handbook of
Fire Protection, 3rd Ed., National Fire Protection Association, Quincy, MA, 2002.
6. “Estimating Burning Characteristics of Liquid Pool Fire, Heat Release Rate, Burning
Duration, and Flame Height”, United States Nuclear Regulatory Commission, Version
1805.1, March 2011. Spreadsheet.
7. Back, G.G., Parker, A.J., Scheffey, J.L., Williams, F.W., Gott, J.E., Tabet, R.J., “Effects of
Water Sprinklers of Low Level AFFF Aircraft Hangar Fire Suppression Systems,” Naval
Research Laboratory, 22 May 2000.
8. Beyler, C., “Fire Hazard Calculations for Large, Open Hydrocarbon Pool Fires,” SFPE
Handbook of Fire Protection Engineering, 4th Edition, DiNenno, P.J. (ed.), National Fire
Protection Association, Quincy, MA, 2008, pp. 3.271–3.319.
9. Bocchieri, R.; Dierdorf, Douglas S.; Cozart, Kristofor S.; Wells, Steven P.; Steven W.
Kirkpatrick,; Robert A. MacNeill; Hawk, John R.; “Experimental Investigation of
Widespread Delamination Damage to Composite Materials Caused by Radiant Heating,”
Applied Research Associates, Air Force Civil Engineer Center, 30 June 2013.
10. Fleming, R., “Automatic Sprinkler System Calculations,” The SFPE Handbook of Fire
Protection, 3rd Ed., National Fire Protection Association, Quincy, MA, 2002.
11. “Assessment of Hazards of Flammable and Combustible Liquids in Composite IBCs in
Operations Scenarios”, The Fire Protection Research Foundation, Prepared by Hughes
Associates, Inc., Baltimore, MD. 13 October 2011.
63
Released for Public Use – 14 November 2019
Appendix A: P&ID for Flooring System and Test Equipment
64
Released for Public Use – 14 November 2019
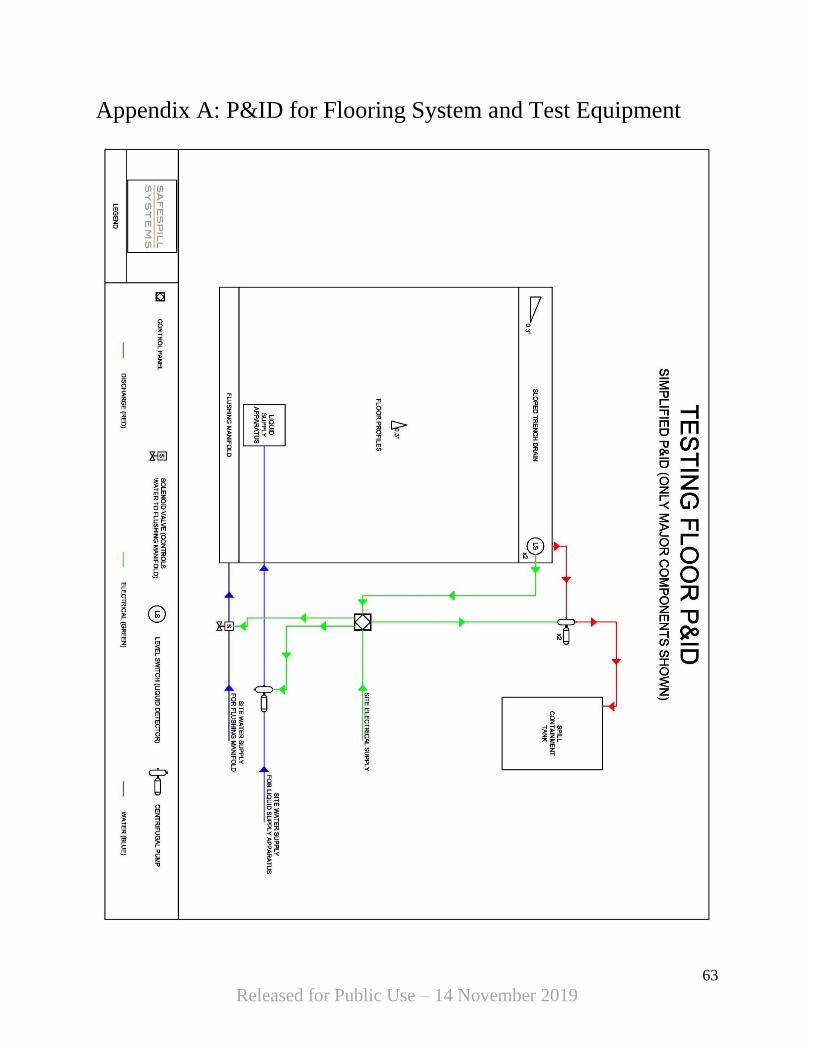
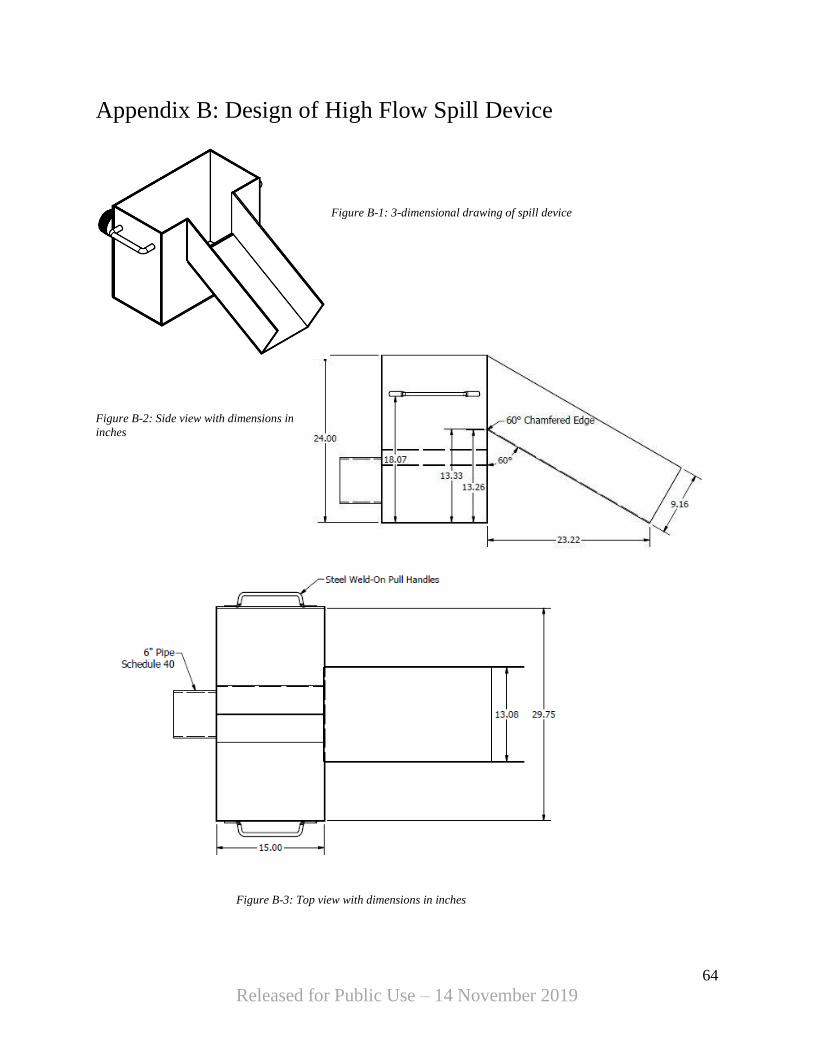
Figure B-3: Top view with dimensions in inches
Figure B-2: Side view with dimensions in
inches
Appendix B: Design of High Flow Spill Device
Figure B-1: 3-dimensional drawing of spill device
65
Released for Public Use – 14 November 2019
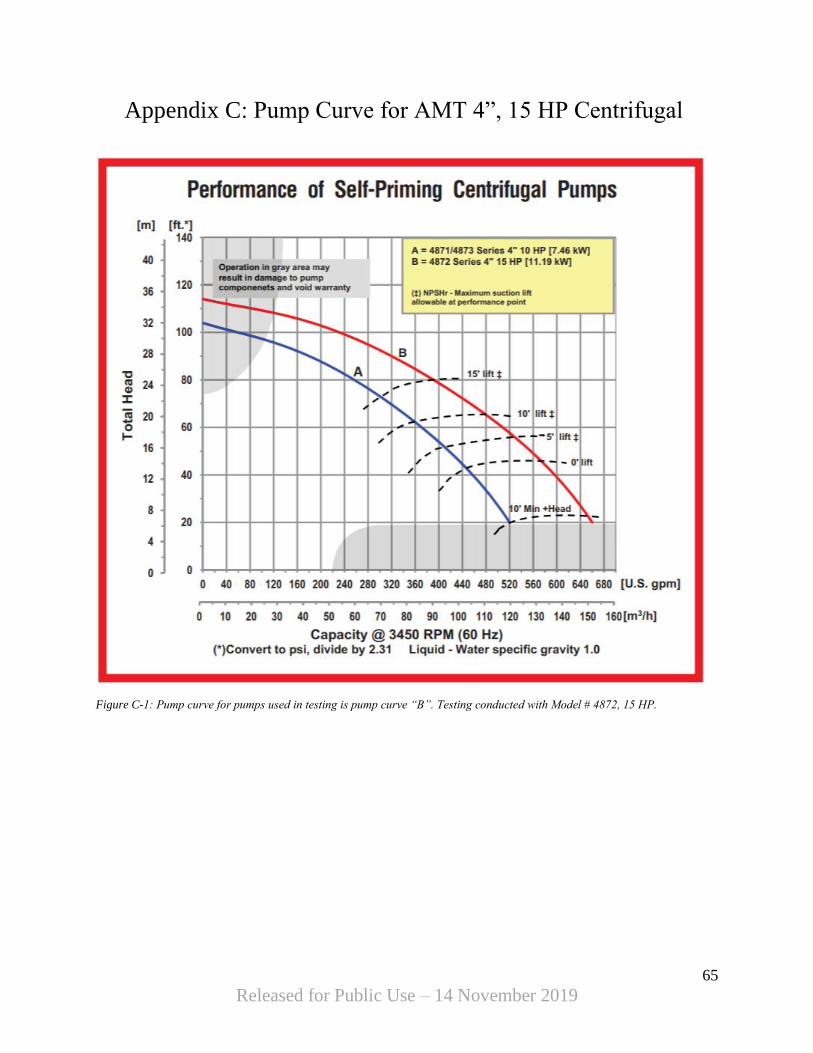
Appendix C: Pump Curve for AMT 4”, 15 HP Centrifugal
Figure C-1: Pump curve for pumps used in testing is pump curve “B”. Testing conducted with Model # 4872, 15 HP.
66
Released for Public Use – 14 November 2019
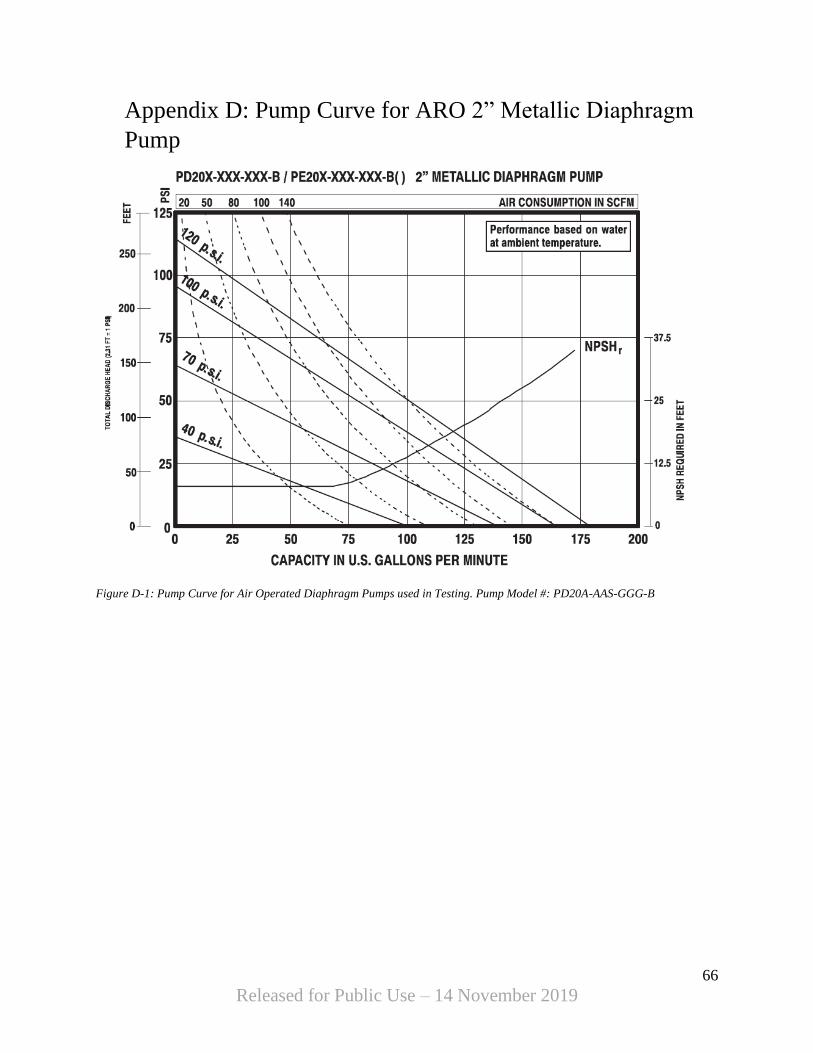
Appendix D: Pump Curve for ARO 2” Metallic Diaphragm
Pump
Figure D-1: Pump Curve for Air Operated Diaphragm Pumps used in Testing. Pump Model #: PD20A-AAS-GGG-B
67
Released for Public Use – 14 November 2019
Appendix E: Proposed General Requirements for Ignitable
Liquid Drainage Floor Assemblies in Aircraft Hangars
1 Ignitable Liquid Drainage Floor Assemblies
1.1 General Requirements. When an ignitable liquid drainage floor assembly is installed in an
aircraft hangar, the following requirements must be met.
1.1.1 Design of the drainage system should limit exposure of burning fuel to adjacent aircraft
1.1.2 * Individual channel length within the floor assembly should not exceed 40 feet (12
meters).
1.1.3 Floor assemblies shall be installed with a minimum pitch of 0.5 percent toward the trench
drain.
1.1.3.1 Floor assemblies with slope toward the trench drain encourage gravity driven flow of
spilled liquids, preventing standing liquid from becoming trapped inside of the channels of
the floor assembly.
1.1.3.2 If the pitch of the existing substrate is inadequate to achieve the necessary pitch, a girder
support frame can be installed under the flooring system to create the required pitch.
1.1.4 * Floor dimensions and standoff distance must be adequate to capture all spilled fuel
which could cause a pooling fire. The floor assembly must have a drainage rate which is
greater than 110% of the total anticipated liquid discharge rate for the flooring area.
1.1.4.1 The total anticipated liquid discharge rate should be calculated as the sum of the
maximum expected fuel flow rate from the aircraft plus the flushing manifold flow rate
plus the expected sprinkler system discharge rate. An additional 10% safety factor is
added to this total. For example, a 6 meter by 6 meter (20 foot by 20 foot) flooring
assembly will have following anticipated discharge rates:
(1) Aircraft Dump Valve (example of one failure on an aircraft, other failure modes
could occur) – 750 L/min (200 gallons/min)
(2) Flushing Manifold – 1 L/min (0.25 gal/min) per channel * 120 channels = 120
L/min (30 gal/min)
(3) Water sprinkler protection – 6.9 L/min/m2 (0.17 gal/min/ft2) * 36 m2 (387 ft2) =
250 L/min (66 gal/min)
(4) Total: 1,120 L/min (300 gal/min)
(5) Total with 10% Safety Factor: 1,230 L/min (330 gal/min)
1.1.4.2 * The floor assembly may use existing trench drainage in the facility, or a trench drain
installed as part of the floor assembly.
1.1.4.3 The maximum fuel flow rate should be determined based on the flow rate from the dump
valve drainage rate of the aircraft.
68
Released for Public Use – 14 November 2019
1.1.4.4 If the drainage system is dependent upon discharge pumps, these pumps must be
redundant.
1.1.4.5 Discharge piping must be of sufficient size to allow for unrestricted flow from pump to
containment tank
1.1.4.6 Discharge pumps shall have a solids handling capacity of no less than 3/8” (9.5 mm).
1.1.5 All floor assemblies must be installed with a flushing manifold which provides a flushing
water flow rate of at least 0.25 gallons/minute per channel across the entire floor assembly.
1.1.5.1 More than one flushing manifold assembly may be needed for large or non-rectangular
floor assemblies.
1.1.5.2 A single flushing manifold should not exceed an overall length of 25 feet (8 meters).
1.1.5.3 Water pressure at the inlet of the flushing manifold must be at least 60 psi
1.1.5.4 Piping to flushing manifold should be wet-pipe and pressurized at all times.
1.1.5.5 Flushing manifold activation should be initiated by listed fail-open solenoid valves.
1.1.6 System activation should be initiated by a listed releasing control panel.
1.1.6.1 * Control panel should be programmable for three operation modes
(1) System fully automated for operations
(2) System fully disabled
(3) System in manual/cleaning mode
1.1.6.2 Control panel should be programmed so that when system is put into cleaning mode, the
system reverts to automated mode after a period of inactivity. The duration of inactivity
before reset should be reasonably short (suggested 3-15 minutes) to prevent accidentally
disabling the system for long periods of time, but is ultimately subject to the discretion of
the designer of the control system or the authority having jurisdiction.
1.1.6.3 When system is in “fully automated” mode, activation of a liquid detection device or a
manual start button shall activate flushing manifold by opening solenoid valve(s) and start
discharge pumps if they are used in the system.
1.1.6.4 Liquid detection sensors which are listed, and approved for use in Class 1, Division 1
locations should be installed in the floor assembly to detect a spill and send signal to the
control panel
1.1.6.5 At least two liquid sensors must be used, and sensors must be positioned to ensure
detection of a 10-gallon/min spill at any location on the floor assembly in less than 1
minute.
1.1.6.6 At least two manual start buttons shall be located near the floor assembly. Quantity and
positioning should account for size of floor assembly, accessibility, and evacuation routes.

69
Released for Public Use – 14 November 2019
1.1.7 * When an ignitable liquid drainage floor assembly is installed in lieu of a foam
suppression system, either a wet-pipe or preaction, closed head sprinkler system shall be
installed to protect the area.
1.1.7.1 The sprinkler system should be designed according to existing NFPA 13 and NFPA 409
requirements. This includes varying requirements based on hangar group.
1.1.7.2 The design area of the sprinkler system shall be no less than the footprint of the floor
assembly.

70
Released for Public Use – 14 November 2019
Appendix A
A.1.1.2 Longer channel lengths may be used if test data qualified by a third-party agency
supports the use of a longer channel length and additional factors such as flushing manifold
pressure, floor dimensions, and drainage rate are considered in design.
71
Released for Public Use – 14 November 2019
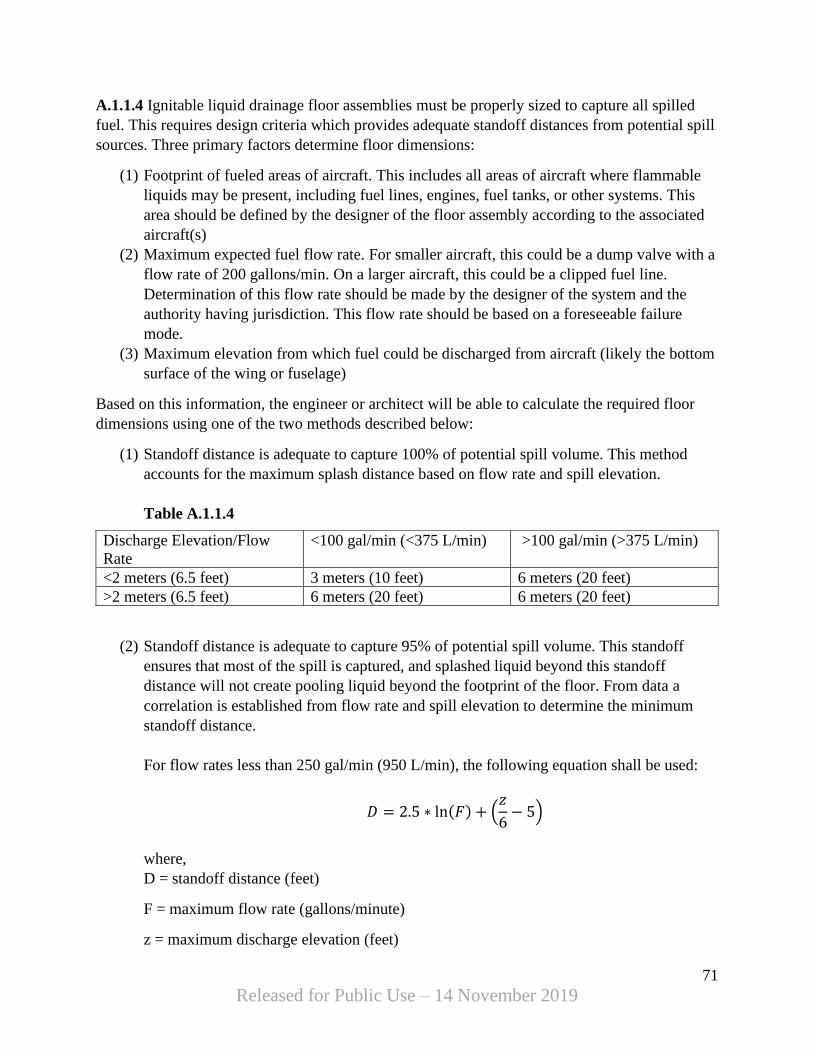
A.1.1.4 Ignitable liquid drainage floor assemblies must be properly sized to capture all spilled
fuel. This requires design criteria which provides adequate standoff distances from potential spill
sources. Three primary factors determine floor dimensions:
(1) Footprint of fueled areas of aircraft. This includes all areas of aircraft where flammable
liquids may be present, including fuel lines, engines, fuel tanks, or other systems. This
area should be defined by the designer of the floor assembly according to the associated
aircraft(s)
(2) Maximum expected fuel flow rate. For smaller aircraft, this could be a dump valve with a
flow rate of 200 gallons/min. On a larger aircraft, this could be a clipped fuel line.
Determination of this flow rate should be made by the designer of the system and the
authority having jurisdiction. This flow rate should be based on a foreseeable failure
mode.
(3) Maximum elevation from which fuel could be discharged from aircraft (likely the bottom
surface of the wing or fuselage)
Based on this information, the engineer or architect will be able to calculate the required floor
dimensions using one of the two methods described below:
(1) Standoff distance is adequate to capture 100% of potential spill volume. This method
accounts for the maximum splash distance based on flow rate and spill elevation.
Table A.1.1.4
(2) Standoff distance is adequate to capture 95% of potential spill volume. This standoff
ensures that most of the spill is captured, and splashed liquid beyond this standoff
distance will not create pooling liquid beyond the footprint of the floor. From data a
correlation is established from flow rate and spill elevation to determine the minimum
standoff distance.
For flow rates less than 250 gal/min (950 L/min), the following equation shall be used:
𝐷 = 2.5 ∗ ln(𝐹) + (𝑧
6− 5)
where,
D = standoff distance (feet)
F = maximum flow rate (gallons/minute)
z = maximum discharge elevation (feet)
Discharge Elevation/Flow
Rate
<100 gal/min (<375 L/min) >100 gal/min (>375 L/min)
<2 meters (6.5 feet) 3 meters (10 feet) 6 meters (20 feet)
>2 meters (6.5 feet) 6 meters (20 feet) 6 meters (20 feet)

72
Released for Public Use – 14 November 2019
Using this equation, a scenario with an expected maximum flow rate of 100 gal/min (375
L/min) from a maximum discharge elevation of 12 feet (3.7 meters) would require a
flooring system with a minimum standoff distance of 8.5 feet (2.6 meters).
73
Released for Public Use – 14 November 2019
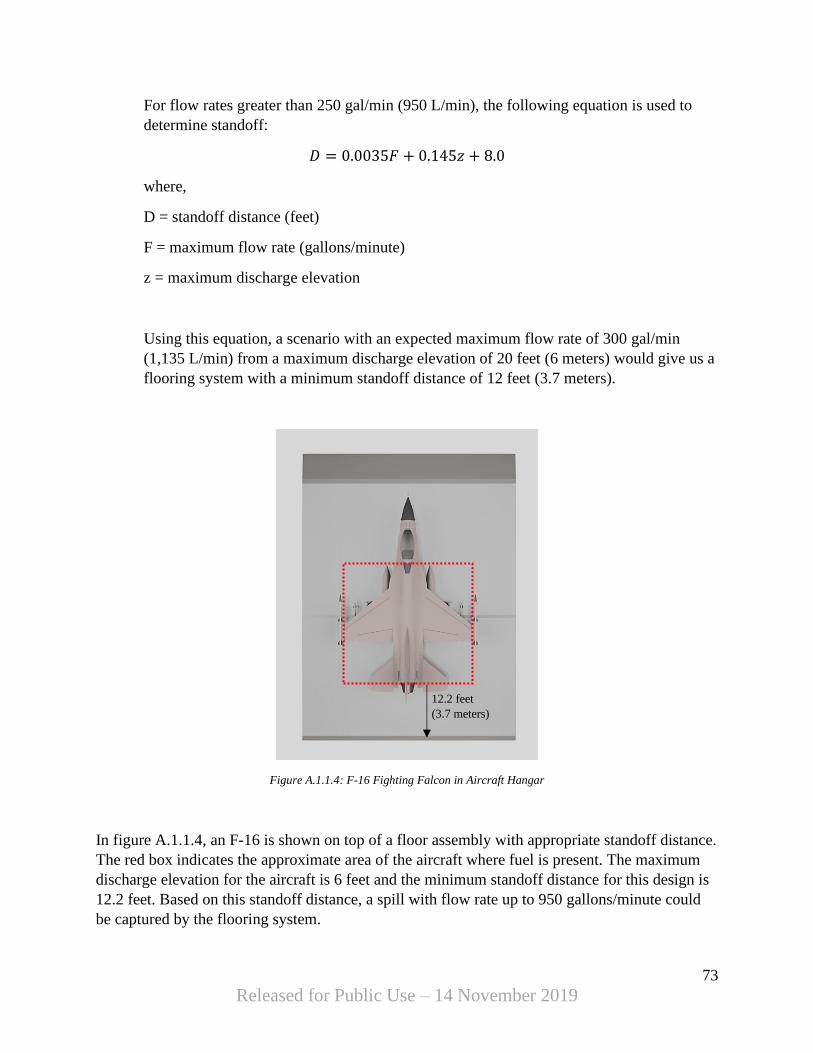
For flow rates greater than 250 gal/min (950 L/min), the following equation is used to
determine standoff:
𝐷 = 0.0035𝐹 + 0.145𝑧 + 8.0
where,
D = standoff distance (feet)
F = maximum flow rate (gallons/minute)
z = maximum discharge elevation
Using this equation, a scenario with an expected maximum flow rate of 300 gal/min
(1,135 L/min) from a maximum discharge elevation of 20 feet (6 meters) would give us a
flooring system with a minimum standoff distance of 12 feet (3.7 meters).
Figure A.1.1.4: F-16 Fighting Falcon in Aircraft Hangar
In figure A.1.1.4, an F-16 is shown on top of a floor assembly with appropriate standoff distance.
The red box indicates the approximate area of the aircraft where fuel is present. The maximum
discharge elevation for the aircraft is 6 feet and the minimum standoff distance for this design is
12.2 feet. Based on this standoff distance, a spill with flow rate up to 950 gallons/minute could
be captured by the flooring system.
12.2 feet
(3.7 meters)
74
Released for Public Use – 14 November 2019
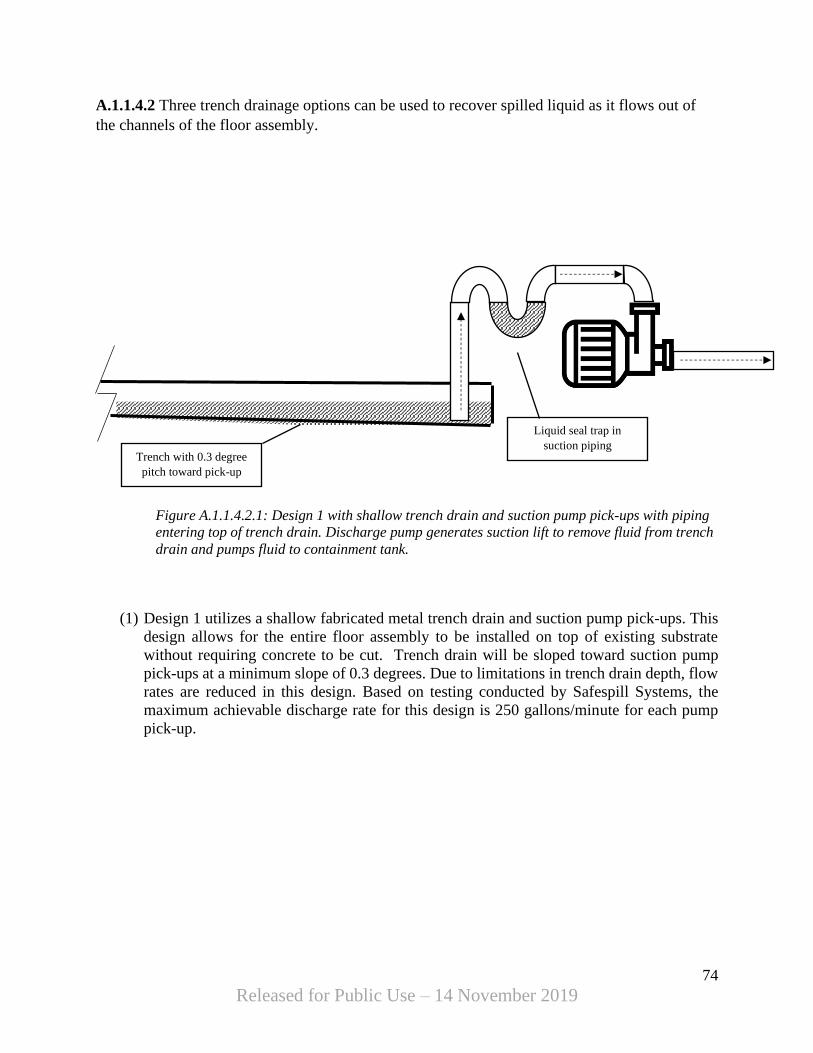
A.1.1.4.2 Three trench drainage options can be used to recover spilled liquid as it flows out of
the channels of the floor assembly.
(1) Design 1 utilizes a shallow fabricated metal trench drain and suction pump pick-ups. This
design allows for the entire floor assembly to be installed on top of existing substrate
without requiring concrete to be cut. Trench drain will be sloped toward suction pump
pick-ups at a minimum slope of 0.3 degrees. Due to limitations in trench drain depth, flow
rates are reduced in this design. Based on testing conducted by Safespill Systems, the
maximum achievable discharge rate for this design is 250 gallons/minute for each pump
pick-up.
Figure A.1.1.4.2.1: Design 1 with shallow trench drain and suction pump pick-ups with piping
entering top of trench drain. Discharge pump generates suction lift to remove fluid from trench
drain and pumps fluid to containment tank.
Trench with 0.3 degree
pitch toward pick-up
Liquid seal trap in
suction piping
75
Released for Public Use – 14 November 2019
(2) Design 2 utilizes a fabricated metal trench drain which can be installed inside of an existing
trench drain or a newly cut concrete trench. The design utilizes a deeper trench which
allows for much larger flow rates. At the end of the trench, a sump with pump inlets in the
base is used to collect and discharge spilled liquids. Piping enters the underside of the box,
creating a liquid seal trap. Trench drain will be sloped toward sump at a minimum slope of
0.3 degrees. Greater flow rates can be achieved by adding additional width or depth to
trench drain or sump. Drainage rates should be confirmed by verifiable testing agencies.
(3) Design 3 utilizes existing trench drainage in the facility. A stainless-steel insert is not
needed, and additional pumps are not needed. Design must be verified by engineer or
architect using hydraulic calculations and pump specifications to ensure that existing
trenches and underground piping can handle maximum anticipated spill rate.
Figure A.1.1.4.2.2: Design 2 with detailed view of swan neck piping entering bottom of sump. Swan
necked piping creates liquid seal trap. Backflow prevention will be placed on outlet side of pumps.
Trench with 0.3 degree
pitch toward sump
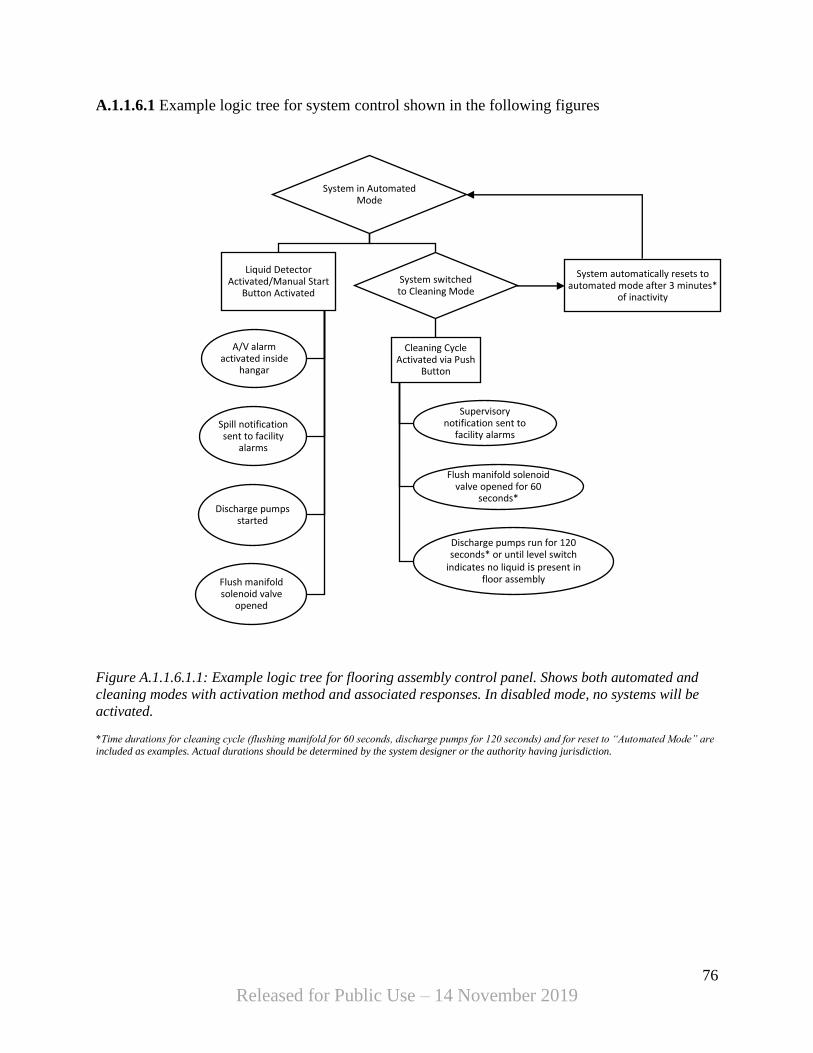
76
Released for Public Use – 14 November 2019
A.1.1.6.1 Example logic tree for system control shown in the following figures
Figure A.1.1.6.1.1: Example logic tree for flooring assembly control panel. Shows both automated and
cleaning modes with activation method and associated responses. In disabled mode, no systems will be
activated.
*Time durations for cleaning cycle (flushing manifold for 60 seconds, discharge pumps for 120 seconds) and for reset to “Automated Mode” are
included as examples. Actual durations should be determined by the system designer or the authority having jurisdiction.
System in Automated Mode
Liquid Detector Activated/Manual Start
Button Activated
A/V alarm activated inside
hangar
Spill notification sent to facility
alarms
Discharge pumps started
Flush manifold solenoid valve
opened
System switched to Cleaning Mode
Cleaning Cycle Activated via Push
Button
Supervisory notification sent to
facility alarms
Flush manifold solenoid valve opened for 60
seconds*
Discharge pumps run for 120 seconds* or until level switch
indicates no liquid is present in floor assembly
System automatically resets to automated mode after 3 minutes*
of inactivity

77
Released for Public Use – 14 November 2019
A.1.1.7 Consistent with guidance in A.6.2.4.1, a preaction standard sprinkler system should be
used only if there is a possibility of freezing in an unheated hang